1. Introduction
Global food demand necessitates a substantial expansion of agricultural land [
1]. This is expected to increase by 35% to 56% between 2010 and 2050 [
2]. Simultaneously, the transition towards carbon neutrality requires massive deployment of renewable energy infrastructure. Solar photovoltaic (PV) energy is central to this transition [
3], yet its land requirements create spatial competition with agriculture [
4]. This “land use conflict” means that the struggle for land is becoming increasingly pronounced [
5].
This has given rise to a promising application of photovoltaic technology which seems to offer an alternative solution: the dual use of land for both energy and agricultural purposes. Agrivoltaic (APV) systems show the potential to mitigate this competition through dual use [
6], first conceptualized by Goetzberger and Zastrow in 1981 [
7], and later formalized with the term “agrivoltaic” by Dupraz et al. in 2011 [
8].
APV systems are broadly categorized based on their integration method, ranging from open-field arrays (inter-row or elevated) to protected cultivation structures, such as PV-integrated greenhouses [
9,
10,
11,
12]. While open-field configurations are often associated with arable crops or pasture, greenhouse-based agrivoltaics represents a highly technical frontier, where balancing light transmission (PAR) for photosynthesis with electricity generation is essential.
Historically, most experimental APV studies have relied on opaque crystalline silicon modules arranged in checkerboard patterns to allow for light penetration [
13]. While functional and offering high electrical power conversion efficiencies of roughly 18–23%, this approach often reduces internal PAR by 40% to 60% and creates non-uniform shading. The agronomic response to this heterogeneous shading varies significantly depending on the shade ratio. For instance, for tomato, studies with opaque modules with 30% and 50% shading zones resulted in 15% and 26% crop yield reductions, respectively [
14]. In leafy greens like lettuce, medium-density systems blocking ~30% of radiation have been shown to maintain or even slightly increase fresh weight (by ~3.6%) as plants adapt by increasing their specific leaf area [
15]. However, when shading increases to 50% under opaque c-Si modules, biomass accumulation suffers severe drops, reaching only 47% to 67% of the yields obtained under full sun [
16].
A more promising alternative lies in Semi-Transparent Photovoltaic (STPV) technologies, which allow for a more homogeneous distribution of solar radiation [
17,
18]. Unlike c-Si, these modules provide continuous ambient filtering. However, this uniform low-intensity lighting can limit maximum photosynthetic activity. Previous studies assessing homogeneous shading on greenhouse lettuce revealed that CdTe modules with 50% transparency caused a 13% reduction in biomass, while dropping the transparency to 40% resulted in a severe 59% yield penalty [
15]. To overcome these light-transmission limits, current trends are shifting towards the spectral engineering of semi-transparent solar cells. New technologies, such as Luminescent Solar Concentrators (LSCs) and spectrally tunable organic or perovskite cells, are being developed to selectively transmit precise PAR wavelengths while harvesting UV and NIR bands [
19]. However, pending the commercial maturity and long-term stability of these emerging materials, commercial inorganic thin-film technologies, such as a-Si and CdTe, which typically offer conversion efficiencies between 5% and 15% depending on their transparency, offer durability and cost-effectiveness, acting as a realistic bridge for the current greenhouse industry.
Yet the utility of these commercial modules is entirely redefined when evaluated under extreme climatic conditions. During hot summer periods, when temperatures exceed optimal crop thresholds, plants exposed to full sun suffer severe photoinhibition, metabolic stress, and UV damage. Under these heat-stressed conditions, APV shading becomes a crucial protective asset. Recent studies indicate that during high-temperature stress, APV treatments can increase lettuce fresh weight by over 400% compared to unshaded control plants. Notably, configurations utilizing 60% transparent coloured thin-film modules and 44% transparent c-Si modules have delivered the highest productivity gains [
20].
While the current APV literature frequently reports these empirical agronomic benefits, it remains largely descriptive. Critical mechanisms, such as the quantification of the Daily Light Integral (DLI) and the VPD, are often under-investigated. Most research focuses on end-of-season yields, rarely unravelling the underlying physical and mathematical mechanisms that drive plant survival.
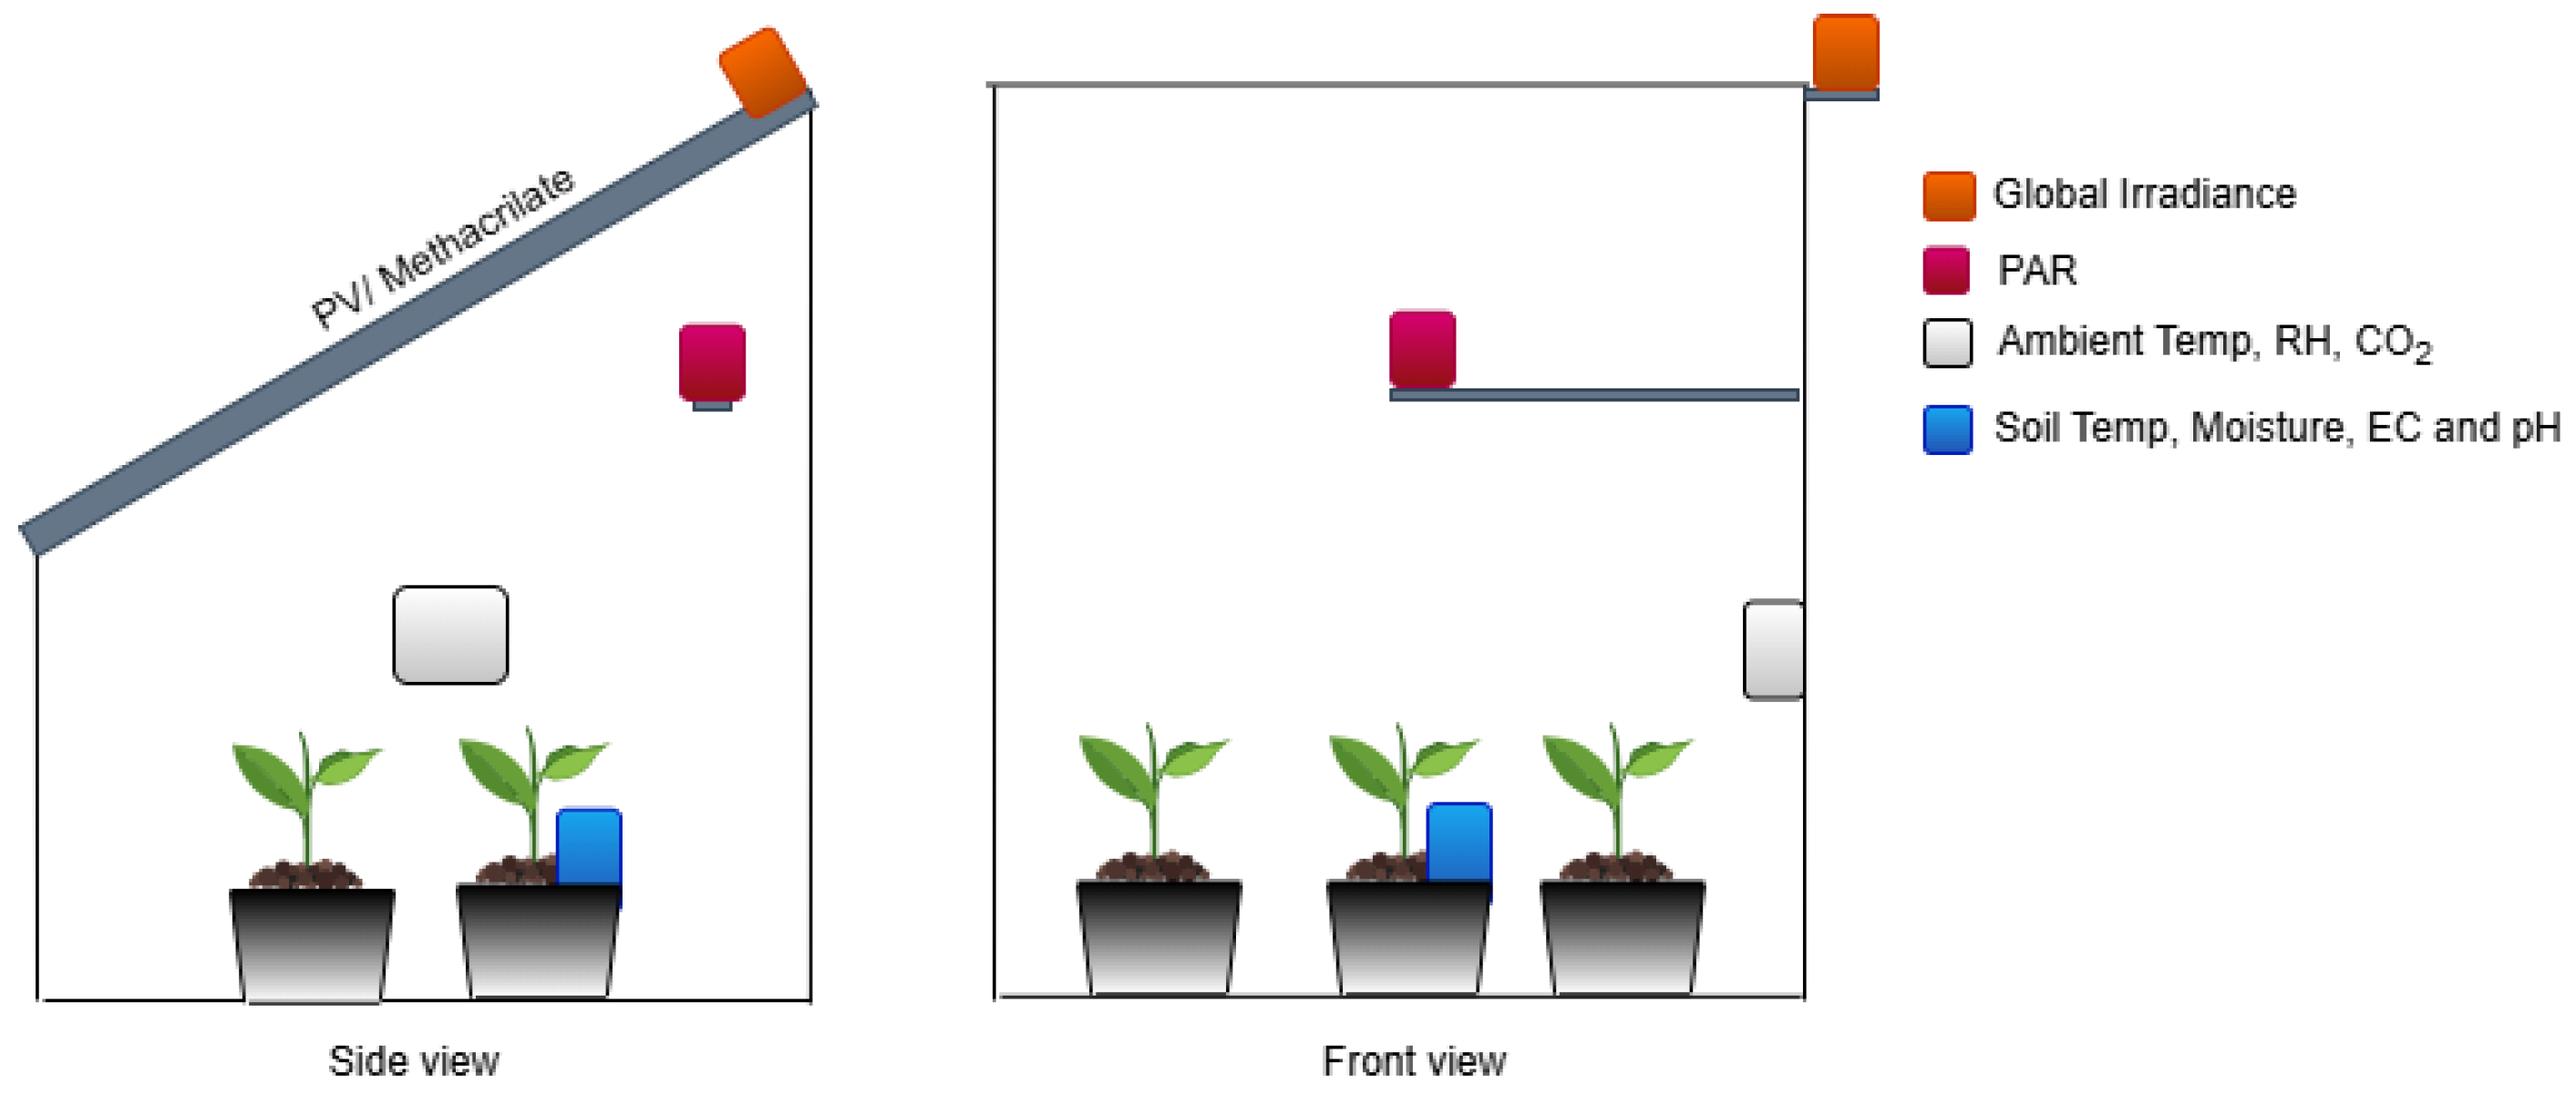
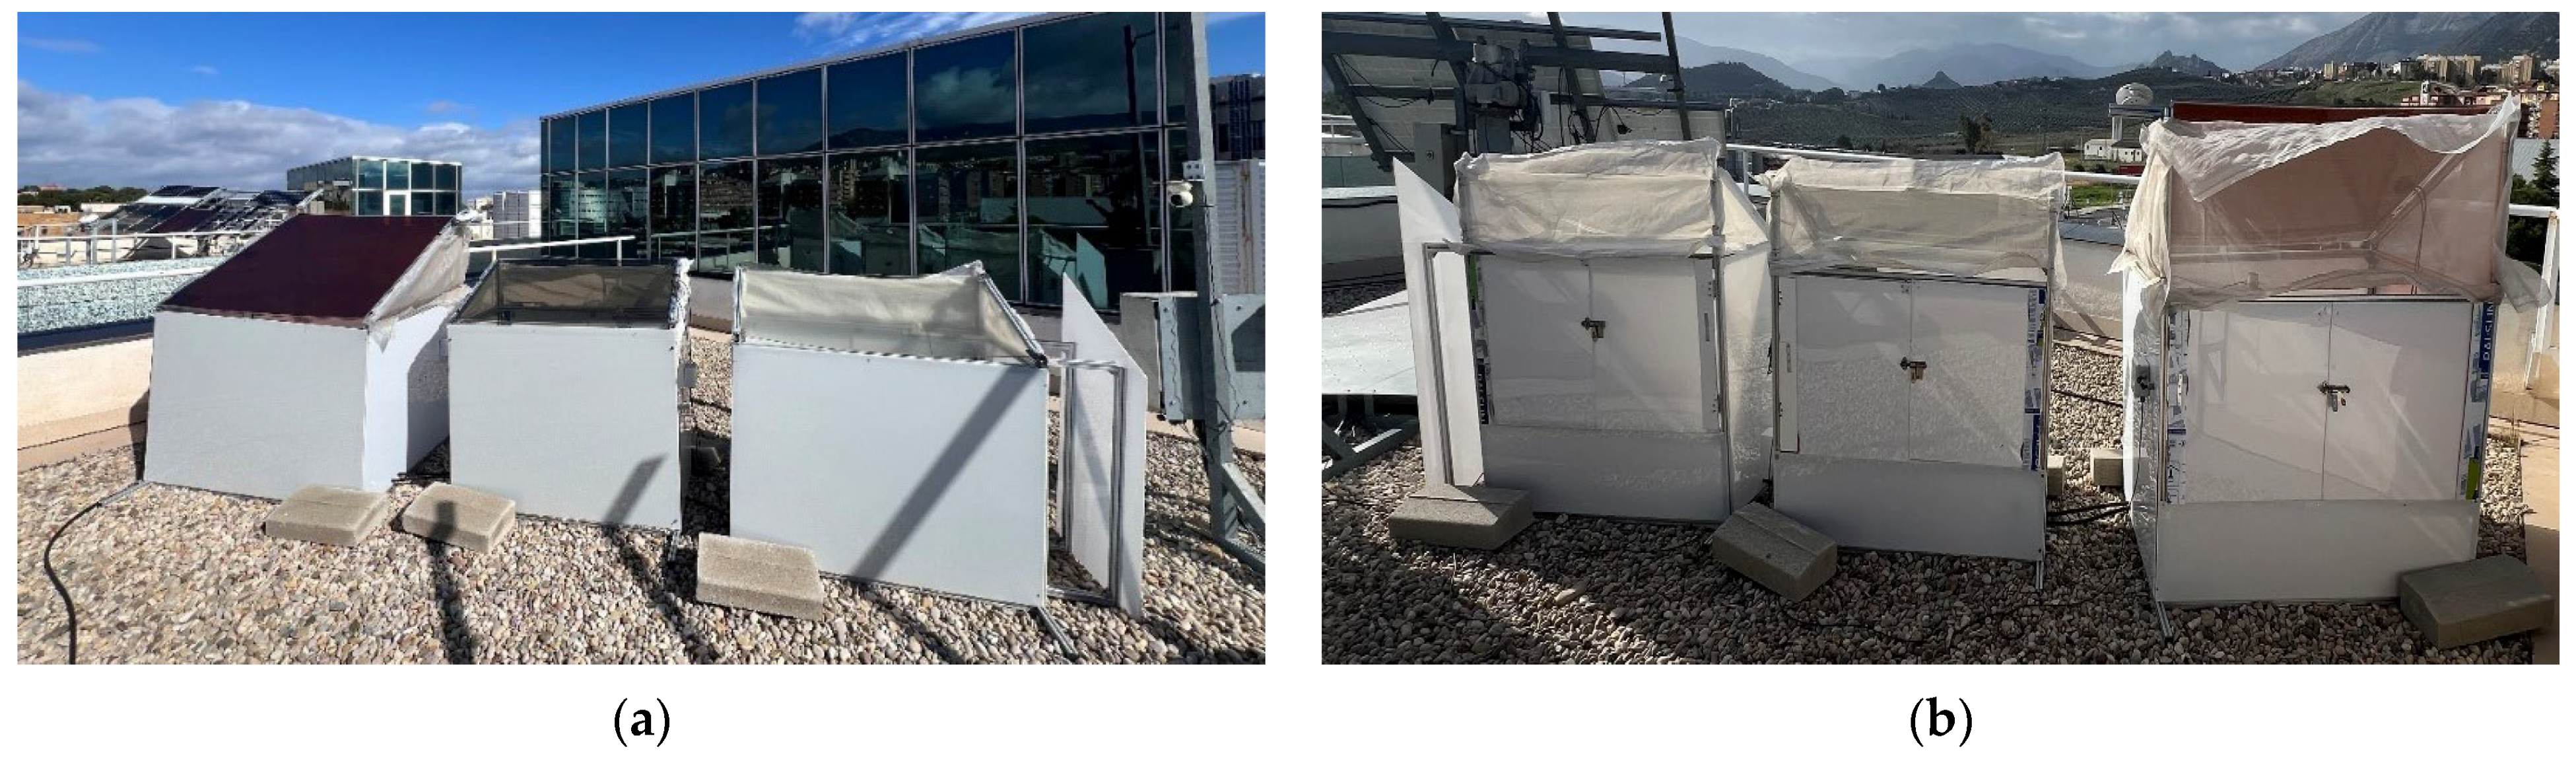
To address this analytical gap, this study presents a comprehensive experimental assessment of two inorganic STPV technologies (a-Si and CdTe) applied to controlled greenhouse prototypes. The experiment was conducted in Jaén, a semi-arid region in southern Spain near, and climatically similar, to Almería, one of the world’s primary hubs for greenhouse agriculture. Unlike previous works limited to yield assessment, this research employs a holistic monitoring approach to disentangle the technology-dependent effects on the crop–environment system. The specific objectives are to characterize the radiative and spectral environment created by each technology; to evaluate the microclimatic modifications, monitoring ambient parameters (T, RH, CO2) alongside soil conditions; and to analytically demonstrate how STPV covers act as thermodynamic buffers that decouple internal water consumption from severe atmospheric demand.
3. Results
3.1. PAR
During the study period, significant differences were observed in the PAR transmitted inside the APV prototypes compared to the control.
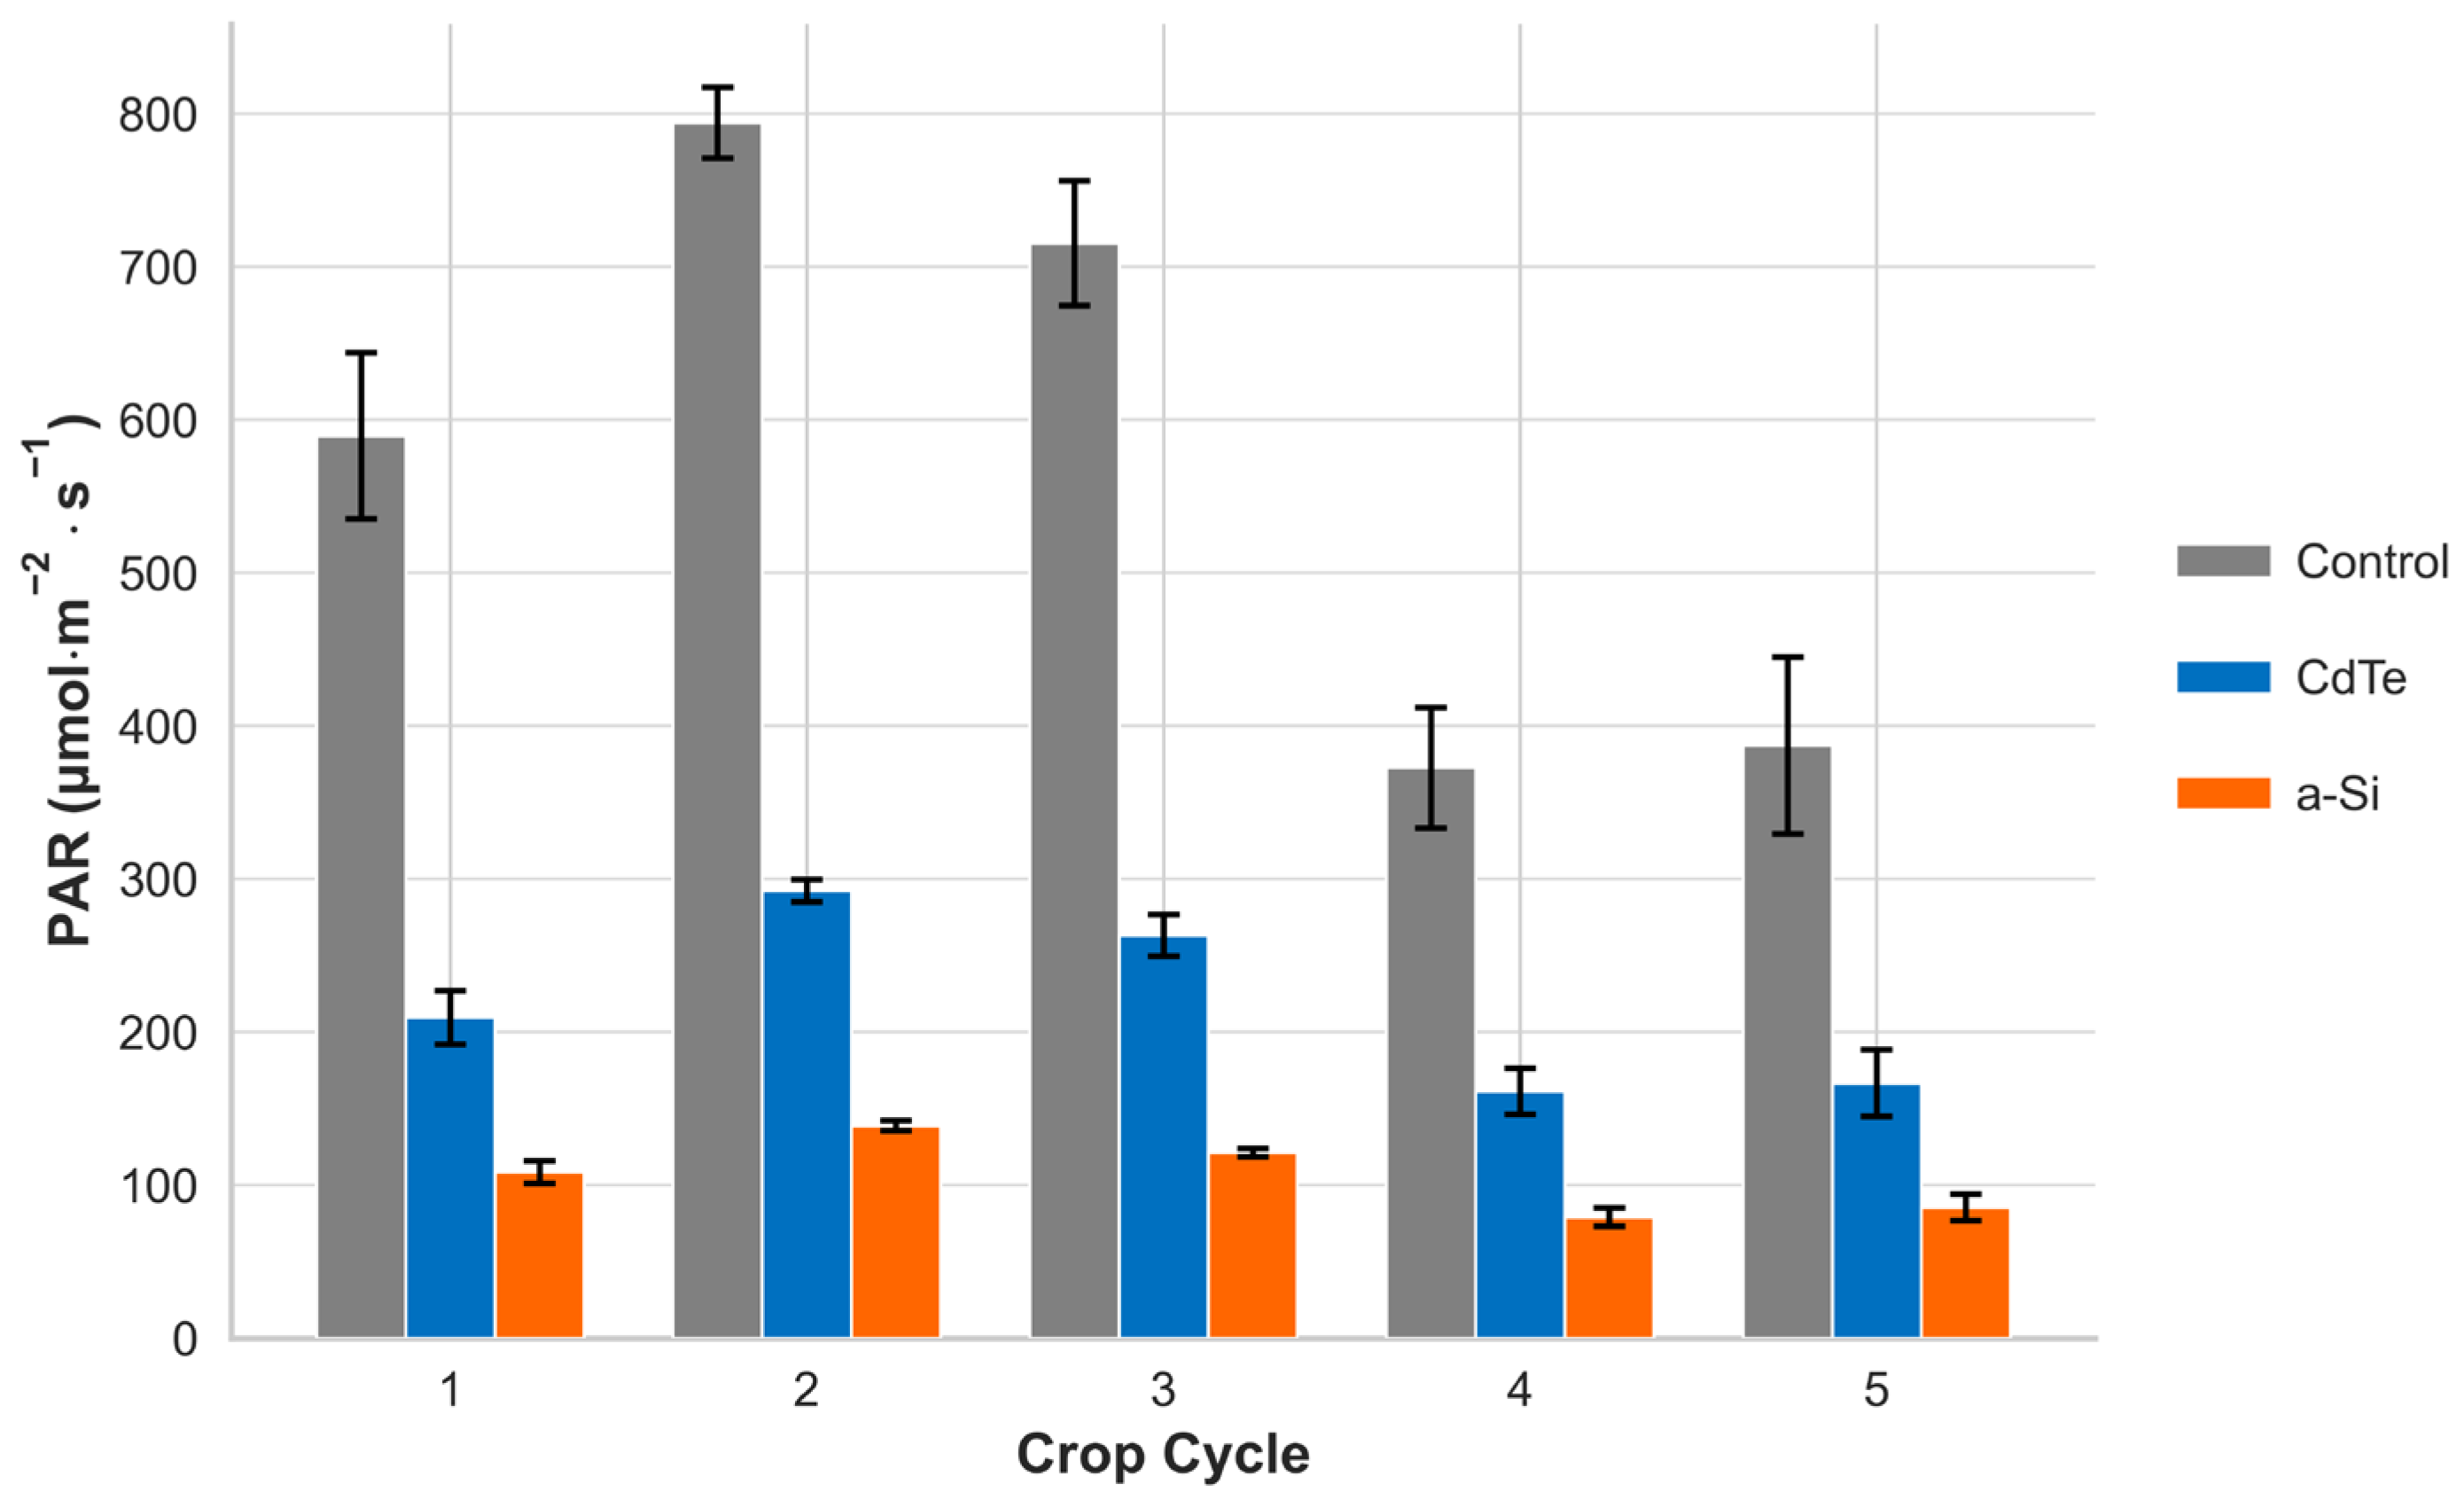
Figure 3 shows mean PAR values in the three prototypes for each crop cycle. Prototypes equipped with PV modules show a PAR reduction compared with the control, with the a-Si prototype showing the greater reduction.
For all prototypes, the highest PAR values were reached in the second cycle (May–June 2024) while the lowest ones were in the fourth cycle (November–December 2024). Particularly, in the control prototype, the PAR values were in the range from 793.30 µmol·m−2·s−1 to 380.21 µmol·m−2·s−1. In the prototype equipped with a CdTe module (50% nominal transparency), the PAR ranged from 291.99 µmol·m−2·s−1 to 164.17 µmol·m−2·s−1, which indicates a reduction between 63.20% to 56.86% with respect to the control. Regarding the a-Si prototype (20% nominal transparency), the PAR varied from 138.68 µmol·m−2·s−1 to 80.33 µmol·m−2·s−1, which indicates a reduction between 82.5% and 78.9% with respect to the control.
The reductions observed for both PV prototypes remained relatively stable throughout the year, with an annual average PAR reduction around 62.8% and 82.2% for CdTe and a-Si, respectively. These reductions are at the upper end, or even beyond, the range commonly reported in the scientific literature for agrivoltaic systems. Previous studies, such as [
28], have typically reported PAR reductions between 20% and 60%, depending on system geometry, panel density, and photovoltaic technology. While such severe shading levels might be restrictive in temperate climates, they were deliberately selected in this study to evaluate a ‘worst-case optical scenario’ using dense, commercially available Building-Integrated Photovoltaic (BIPV) modules, and help us determine if this extreme PAR penalty could act as a necessary thermodynamic buffer (reducing VPD and thermal stress) to ensure crop survival during the harsh, semi-arid Mediterranean summers of southern Spain, while simultaneously maximizing the electrical yield per square metre.
The stronger attenuation observed in this experiment, particularly under the a-Si configuration, suggests that the nominal transparency of the module does not directly correspond to the effective PAR transmission reaching the crop. Factors such as spectral selectivity, angle of incidence, structural configuration and conversion/reflection on the module surface also play a decisive role. Recent studies [
29] show that semi-transparent panels can selectively filter bands (e.g., blocking UV or far-red) and that the photosynthetic response depends on both the quantity and spectral quality of the transmitted light.
From an agronomic perspective, these differences in light transmission are highly relevant. For tomato, several studies have shown that moderate shading levels (30–50%) can be compatible with acceptable yields, though often with slight reductions in fruit quality or total production (e.g., in soluble solids or colour) [
30,
31], although some studies even registered a better yield and higher biomass through an elevated shade level of 50% in arid conditions [
32]. However, excessive shading generally leads to substantial decreases in biomass and productivity [
28,
30].
In contrast, lettuce, a crop more tolerant to low-light environments, may benefit from moderate shading, which can improve their size and certain quality traits [
33]. Although, the season of planting and shading could affect the results [
34]. In this context, the CdTe prototype could represent a potentially favourable configuration for leaf crops grown in warm climates, while the a-Si system would likely generate excessive shading that limits productivity even for tolerant species.
3.2. Daily Light Integral (DLI)
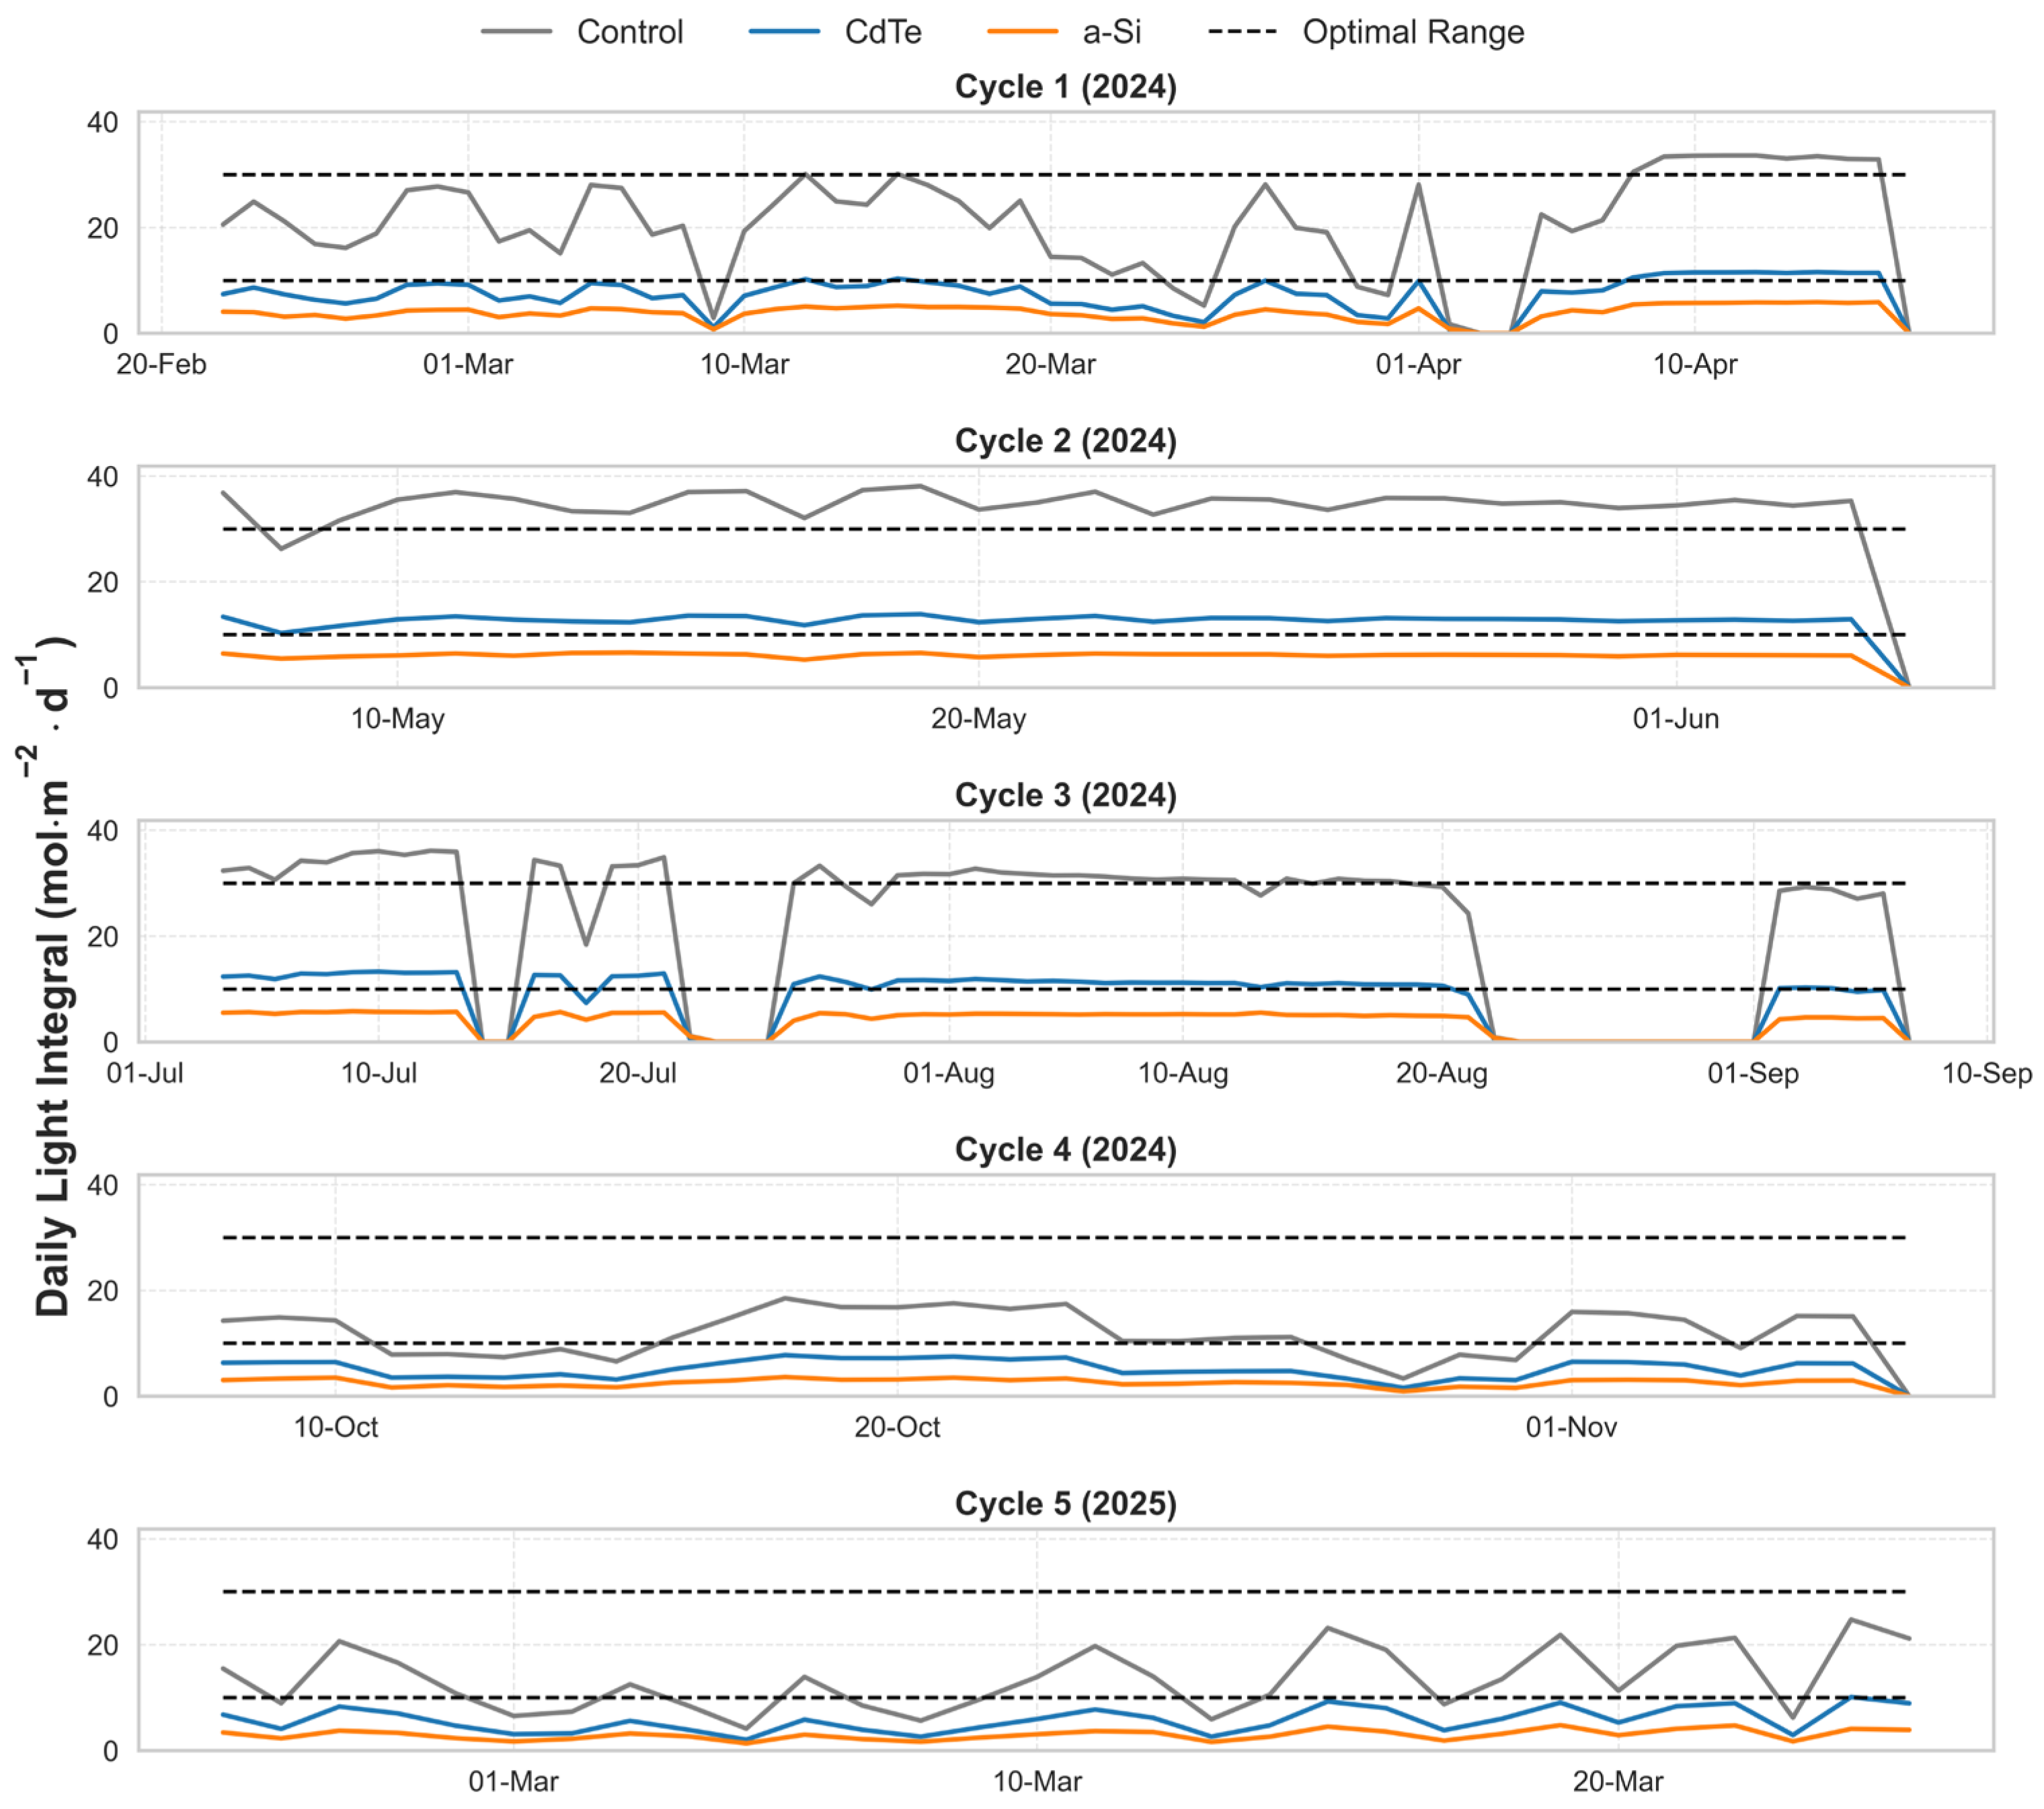
The DLI acted as the limiting factor for agronomic viability in this study (
Figure 4). Tomatoes are classified as highly light-demanding crops, requiring an optimal DLI between 30 mol m
−2 day
−1 and 12 mol m
−2 day
−1 for sufficient crop growth according to Cossu et al. [
35]. These values are represented in
Figure 4, defining the appropriated interval for DLI. In the control structure, daily DLI values consistently exceeded 30 mol m
−2 day
−1 between April and September, which correspond to cycles 2 and 3 and the last days of cycle 1, representing levels typically considered optimal or even supra-optimal for high-light crops such as tomato. During cycle 4 and the first half of cycle 5, (October to early March), DLI values dropped to between 10 and 20 mol m
−2 day
−1, with mean values slightly above 10 mol m
−2 day
−1, before recovering to between 10 and 25 mol m
−2 day
−1 by the middle of cycle 5.
In the prototype with CdTe module, DLI values during the second and third cycles, corresponding to spring and summer, remained above 12 mol m−2 day−1, indicating a reduction of more than 60% compared with the control. This is consistent with the PAR attenuation previously described. From cycle 4 through the first half of cycle 5 (October to early March), DLI values fell further, ranging between 6 and 8 mol m−2 day−1, before finally increasing modestly to a maximum of around 10 mol m−2 day−1.
Finally, the lowest DLI levels were recorded in the prototype equipped with an aSi module. Even during the cycles with the highest (cycles 1–3, April–September), DLI values generally remained below 10 mol m−2 day−1, dropping to between 3 and 6 mol m−2 day−1 in the fourth and fifth cycles, thus approaching the lower physiological limit for photosynthetically demanding crops.
These results confirm that the type of photovoltaic material has a strong influence on the amount of light available to crops, with both STPV technologies under study producing a substantial reduction in cumulative daily photon flux. The DLI patterns observed align closely with the reductions in PAR reported in the previous section, showing that the CdTe prototype provides roughly one-third of the total daily light received under the transparent reference cover, while the a-Si prototype transmits less than one-fifth of the available light.
When compared to agronomic thresholds reported in the literature, the implications for crop performance are evident. For tomato, optimal growth typically requires DLI levels above 25 mol m
−2 day
−1, [
35]. Consequently, the conditions within the CdTe prototype (12–15 mol m
−2 day
−1 during summer) likely impose light-limited photosynthesis, while those in the a-Si prototype (below 10 mol m
−2 day
−1) would strongly restrict carbon assimilation and fruit development.
In contrast, lettuce exhibits a wider tolerance range, maintaining acceptable growth at DLI levels between 12 and 17 mol m
−2 day
−1. Previous studies show that increasing DLI has notable effects on lettuce biomass. In particular, when increasing from 6.9 to 15.6 mol·m
−2·d
−1, linear increases in fresh and dry mass were observed [
36]. Thus, the CdTe prototype could potentially sustain lettuce cultivation during spring and summer, albeit with slower growth rates, while the a-Si prototype would likely fall below the physiological compensation point for much of the year, particularly during winter months when DLI drops below 6 mol m
−2 day
−1.
3.3. Spectral Response
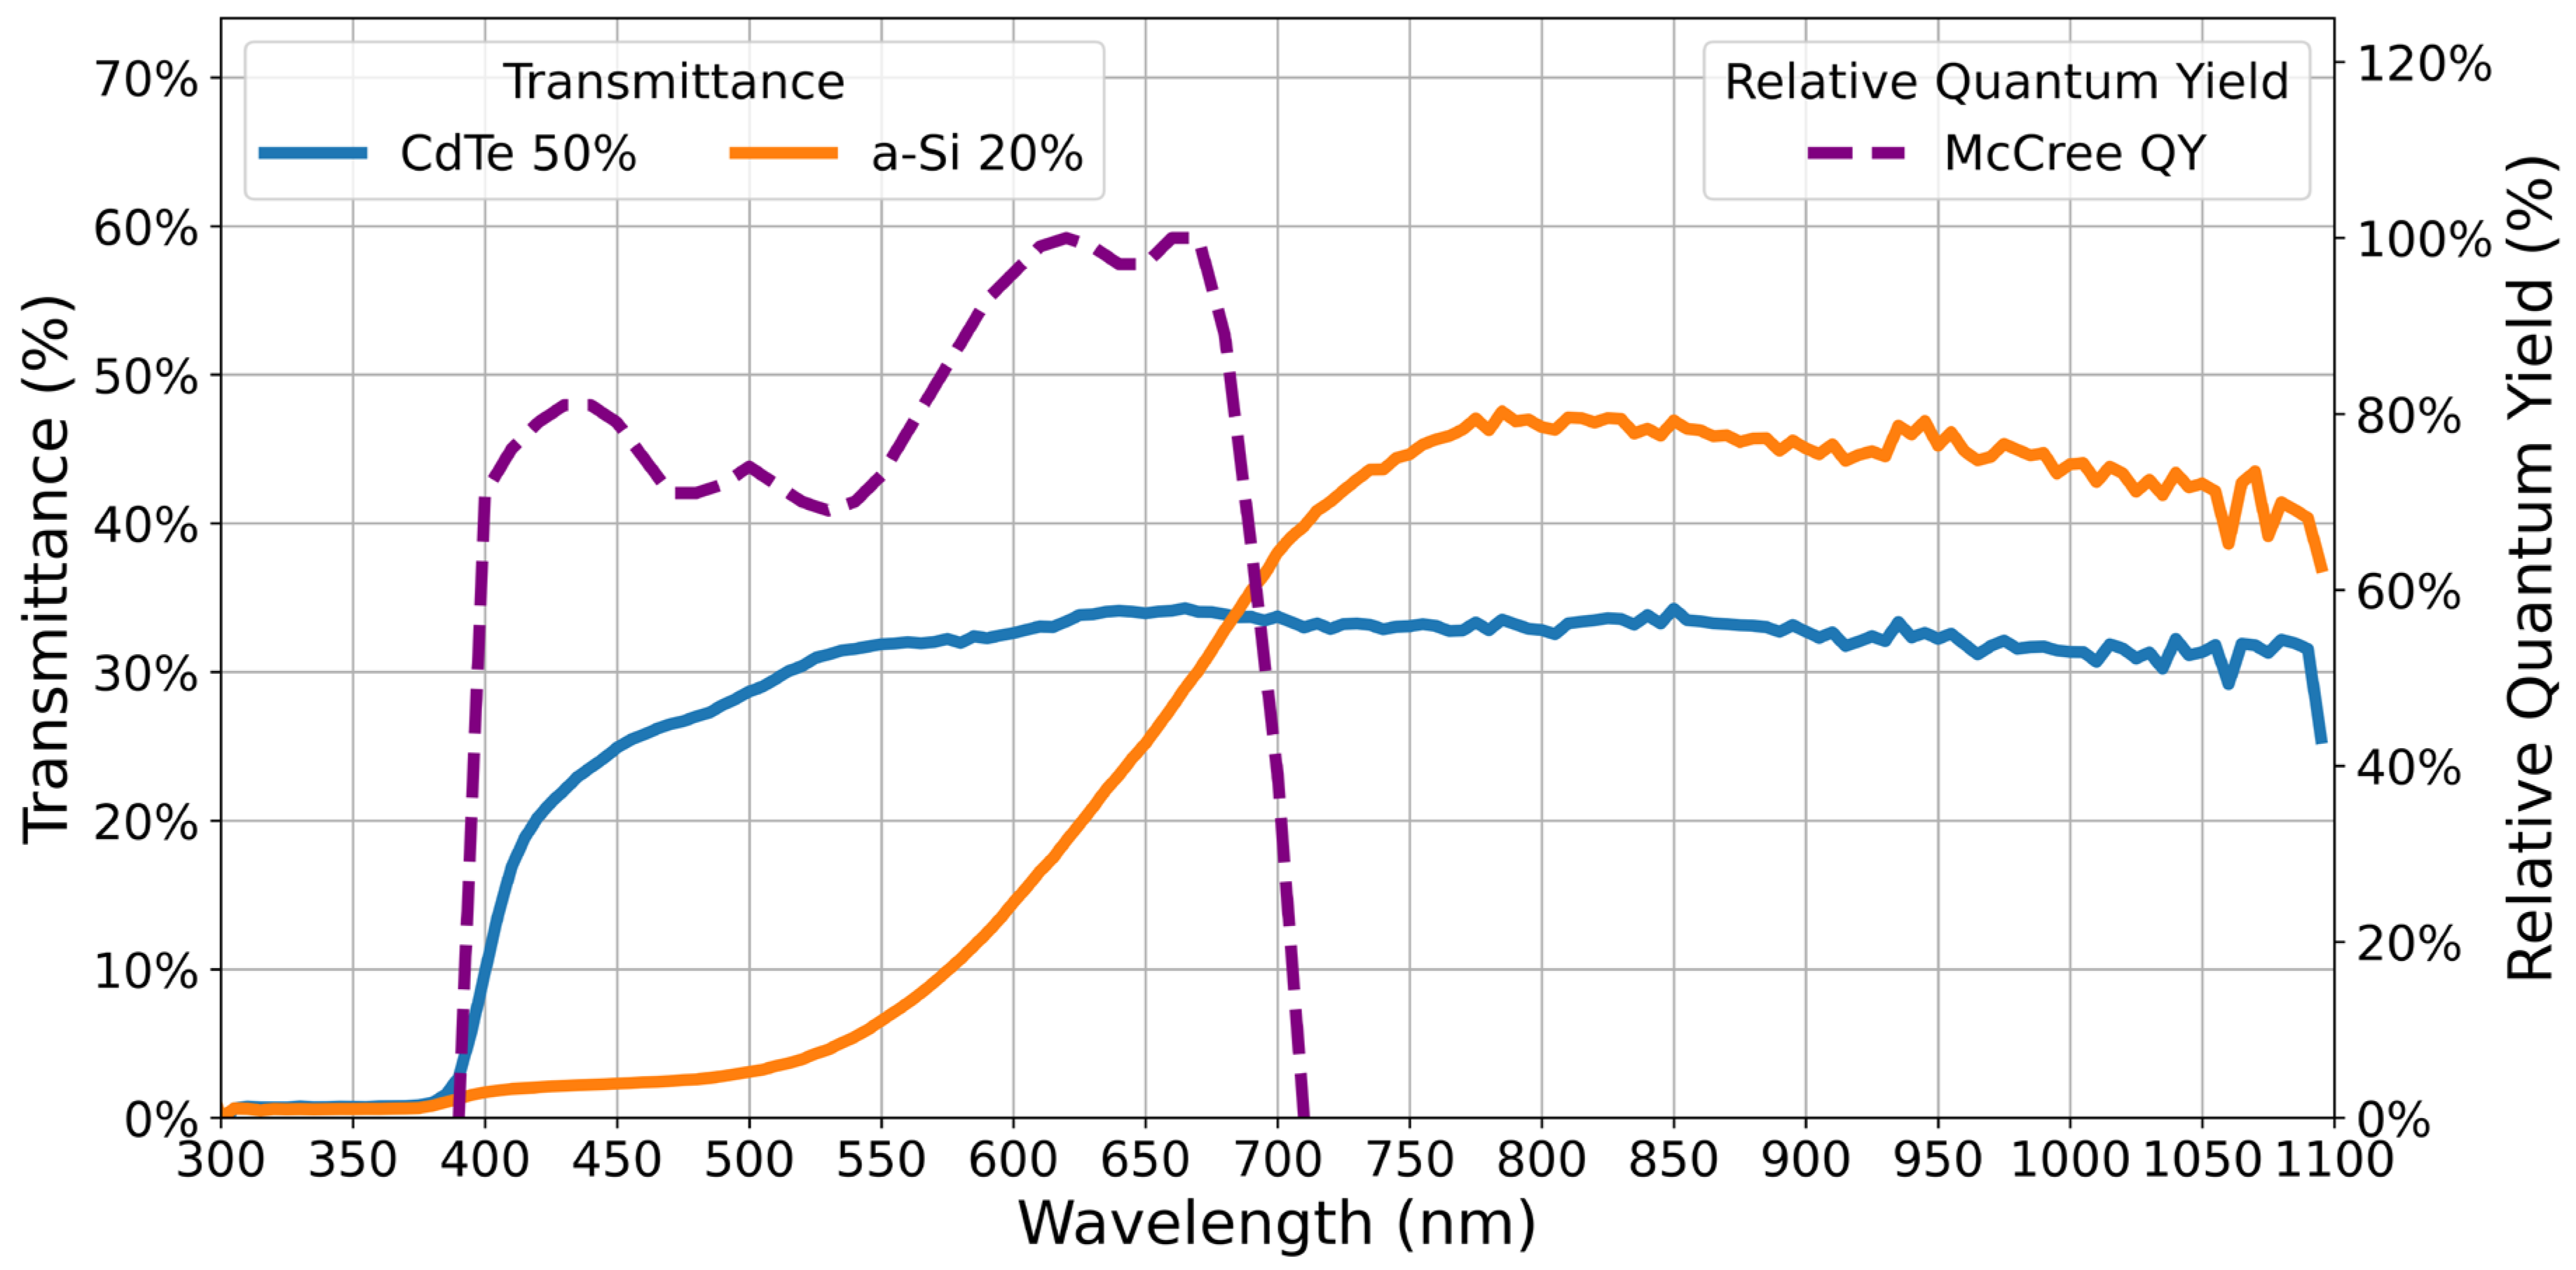
The photovoltaic modules do not exhibit uniform transmittance across the solar spectrum. Due to this, in this study their spectral transmittance was characterized using an EKO MS711 spectroradiometer (EKO Instruments, Tokyo, Japan) through discrete measurements in order to better understand the impact of different STPV technologies with different spectral response on the crops. The solar spectrum was recorded both on the upper surface of the module and beneath it, allowing for the determination of the transmitted component. The transparency factor was calculated as the ratio of the spectral irradiance measured below the module to that measured above and their transmittance spectra are compared with the relative quantum yield (RQY) proposed by McCree [
37] (
Figure 5).
This representing the efficiency with which a plant uses each wavelength to perform photosynthesis, measured as moles of CO2 fixed or O2 released per mole of photons absorbed, a clear relationship is observed between the optical behaviour of the modules and the spectral sensitivity of photosynthesis. McCree’s work established that maximum photosynthetic efficiency occurs around wavelengths of 440 nm (blue region) and 620 nm (red region), corresponding to the main absorption peaks of chlorophyll pigments.
The CdTe module exhibits higher transmittance within these key spectral regions, maintaining a consistent transparency window across both peaks. In contrast, the a-Si module presents negligible transmittance in the blue band, severely limiting photon availability at the first critical McCree peak. Quantitatively, the CdTe module achieves a weighted effective transmittance of 28.4%, significantly outperforming the 17.1% observed for the a-Si module. This difference in spectral alignment results in a calculated 66% relative improvement in useful radiation availability for the crop under the CdTe module compared to the a-Si technology.
3.4. Ambient Temperature and Humidity Inside the Prototypes
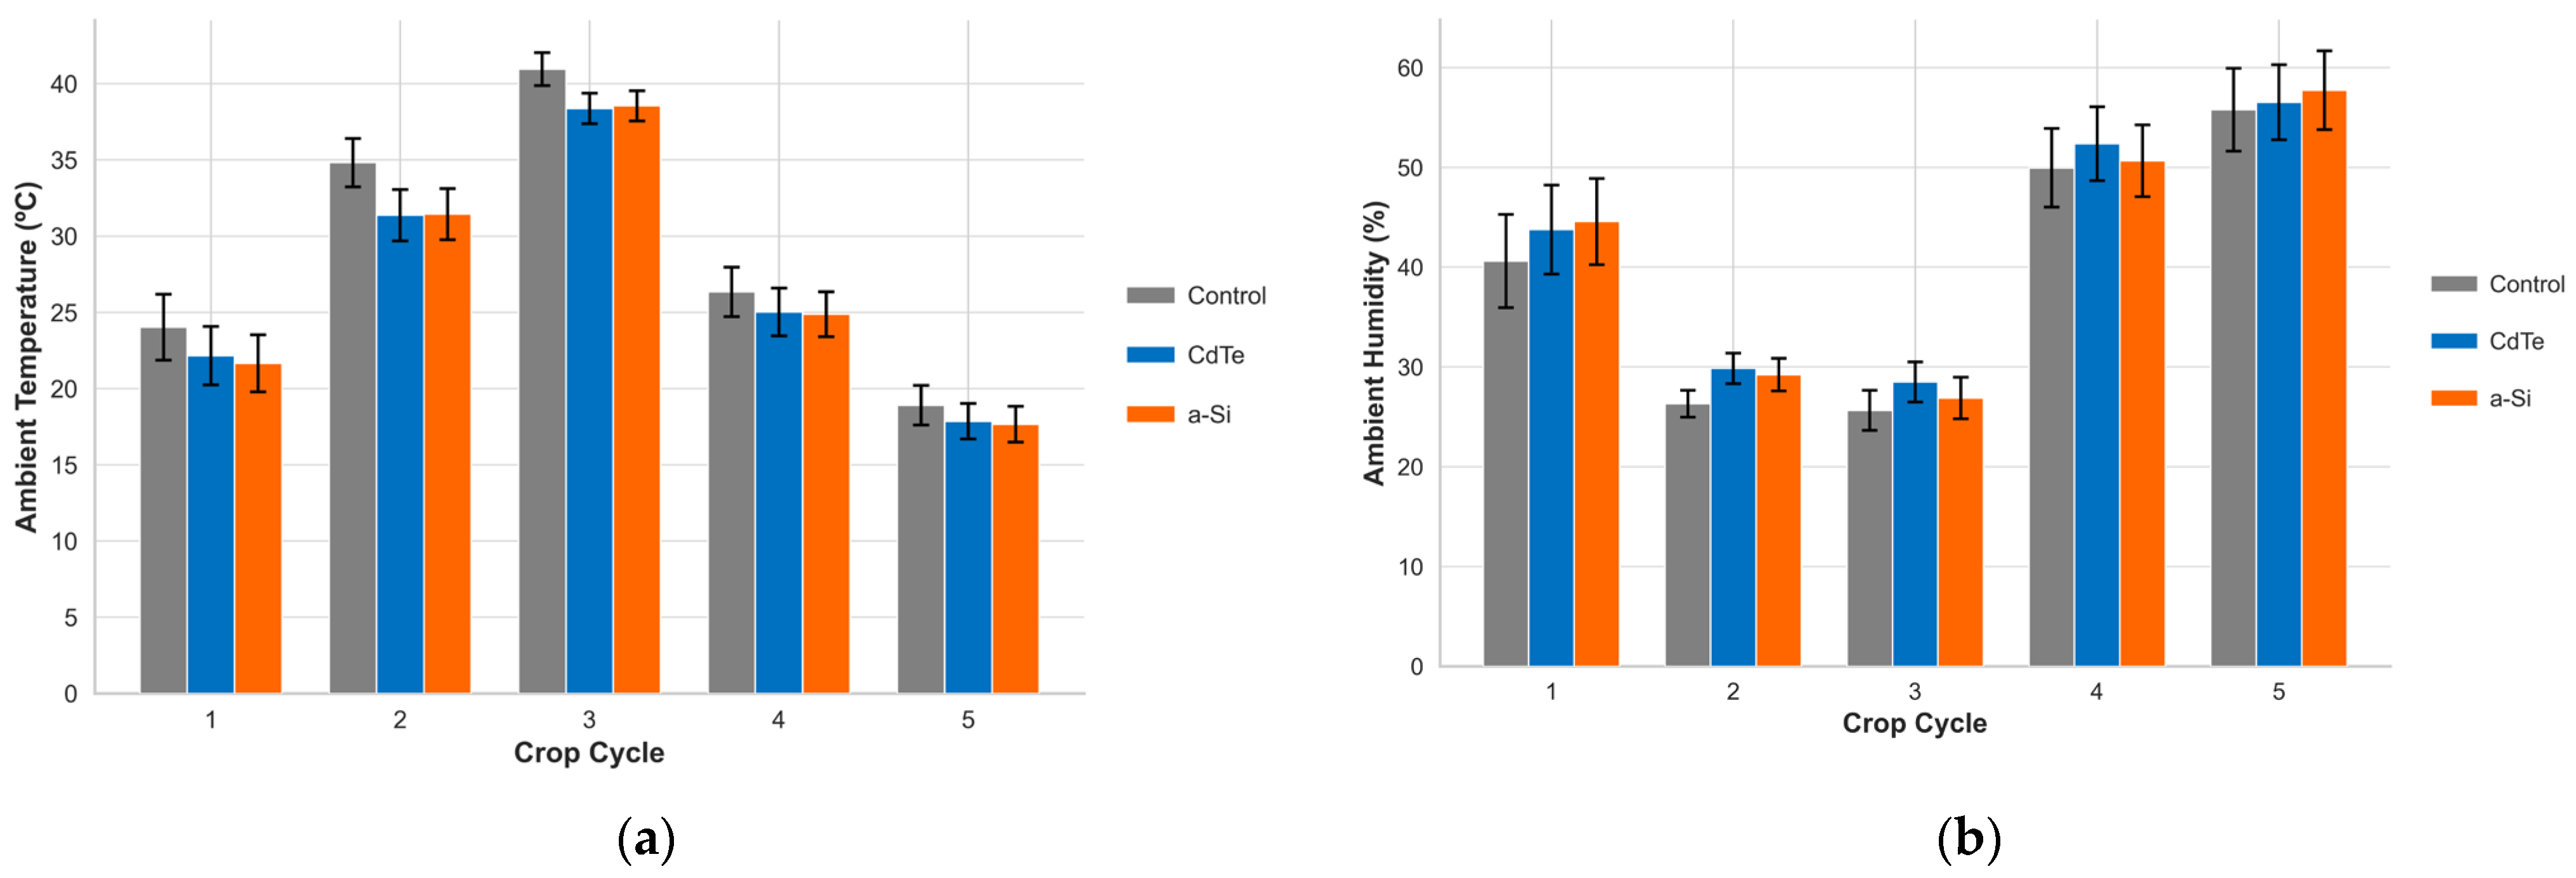
The analysis of air temperature inside the experimental prototypes revealed a consistent cooling effect associated with the photovoltaic covers compared to the control. The thermal amplitude followed a seasonal pattern, with maximum and minimum averages occurring in cycle 3 (summer) and cycle 5 (winter), respectively. While the control varied between 41 °C and 19 °C during these periods, the PV prototypes maintained consistently lower values. On average, the CdTe prototype exhibited temperatures 6.4% lower (−1.93 °C) than the control, while the a-Si prototype showed a slightly stronger cooling effect of 7.3% (−2.17 °C), as can be seen in
Figure 6a.
This cooling was not uniform, becoming most pronounced during the high-irradiance spring period (cycle 2). During this cycle, mean temperature differences reached −9.9% (3.44 °C) for CdTe and −9.7% (3.36 °C) for a-Si, indicating a stronger thermal mitigation effect under higher solar loads.
These results are consistent with previous findings in APV systems, where the partial shading provided by photovoltaic panels reduces both direct solar heating and convective warming of the air within the cultivation area [
22,
38]. The magnitude of temperature reduction observed here (1.9–2.2 °C annually and up to 3.4 °C during spring) aligns closely with values reported for similar greenhouse-based APV configurations, where decreases in mean air temperature between 1 and 4 °C have been observed depending on the coverage ratio and PV technology [
39,
40,
41].
This temperature attenuation may benefit crop performance under warm climates by mitigating heat stress as when temperatures surpass physiological limits of >40 °C, photosynthesis and metabolic processes are inhibited [
42]. Particularly for species such as tomato, which exhibit reduced photosynthetic efficiency and fruit set failure when daytime temperatures exceed 30 °C [
43]. For lettuce, moderate cooling is also advantageous, as it can delay maturity and bolting, preserving leaf quality during the warmer months [
44]. However, in winter, this cooling may slow vegetative growth absent supplemental heating. The slightly superior cooling of the a-Si system is attributed to its lower transparency. This highlights the inherent APV trade-off: while thermal mitigation protects against overheating and reduces irrigation needs, it simultaneously limits the radiative energy available for photosynthesis, as evidenced by the PAR and DLI results.
In contrast to thermal trends, the analysis of RH revealed a systematic increase under the agrivoltaic covers, represented in
Figure 6b. While seasonal evolution remained consistent across treatments, the PV prototypes maintained superior moisture levels throughout every crop cycle. On an annual aggregate basis, this translated to a mean RH increase of 7.5% for the CdTe prototype and 6.2% for a-Si relative to the control. During cycle 5, for instance, the control recorded a daily average of 55%, compared to 55.7% (CdTe) and 57.0% (a-Si).
This humidity retention was significantly more pronounced during the second growing cycle (Spring), a period characterized by high solar irradiance. During this interval, RH levels within the CdTe and a-Si prototypes exceeded the control by 13.4% and 11.0%, respectively. Crucially, this differential was most evident during daylight hours, effectively mitigating the natural diurnal depression typically driven by atmospheric evaporative demand.
These results corroborate previous findings in the agrivoltaic literature, where STPV arrays engender milder, more humid microclimates [
22,
38]. The observed increases align closely with the 5–15% range documented for comparable shading configurations, confirming the capacity of the system to buffer atmospheric dryness. Agronomically, this humidity boost is critical as it directly acts to lower the VPD), thereby alleviating atmospheric water stress and potentially enhancing stomatal conductance during peak irradiance hours. However, it is pertinent to acknowledge the well-known agronomic trade-off: sustained periods of excessively high relative humidity (and consequently low VPD) can significantly elevate the risk of fungal disease development. While this humidity boost acts primarily as a beneficial corrective buffer during the exceedingly dry Mediterranean summer months, the lack of continuous phytopathological monitoring constitutes a limitation of this microclimatic study. Future long-term agronomic evaluations must track disease incidence to fully validate the safety of this environmental buffering.
The statistical significance of these thermal reductions, particularly the mitigation of maximum temperature extremes during summer cycles without altering the mean daily temperatures, is fully detailed in
Section 3.12.
3.5. CO2 Concentration
When examining CO2 dynamics within the prototypes, only measurements taken during daylight hours were considered, since from a physiological standpoint, the effective concentration during the photoperiod is most relevant for photosynthetic activity.
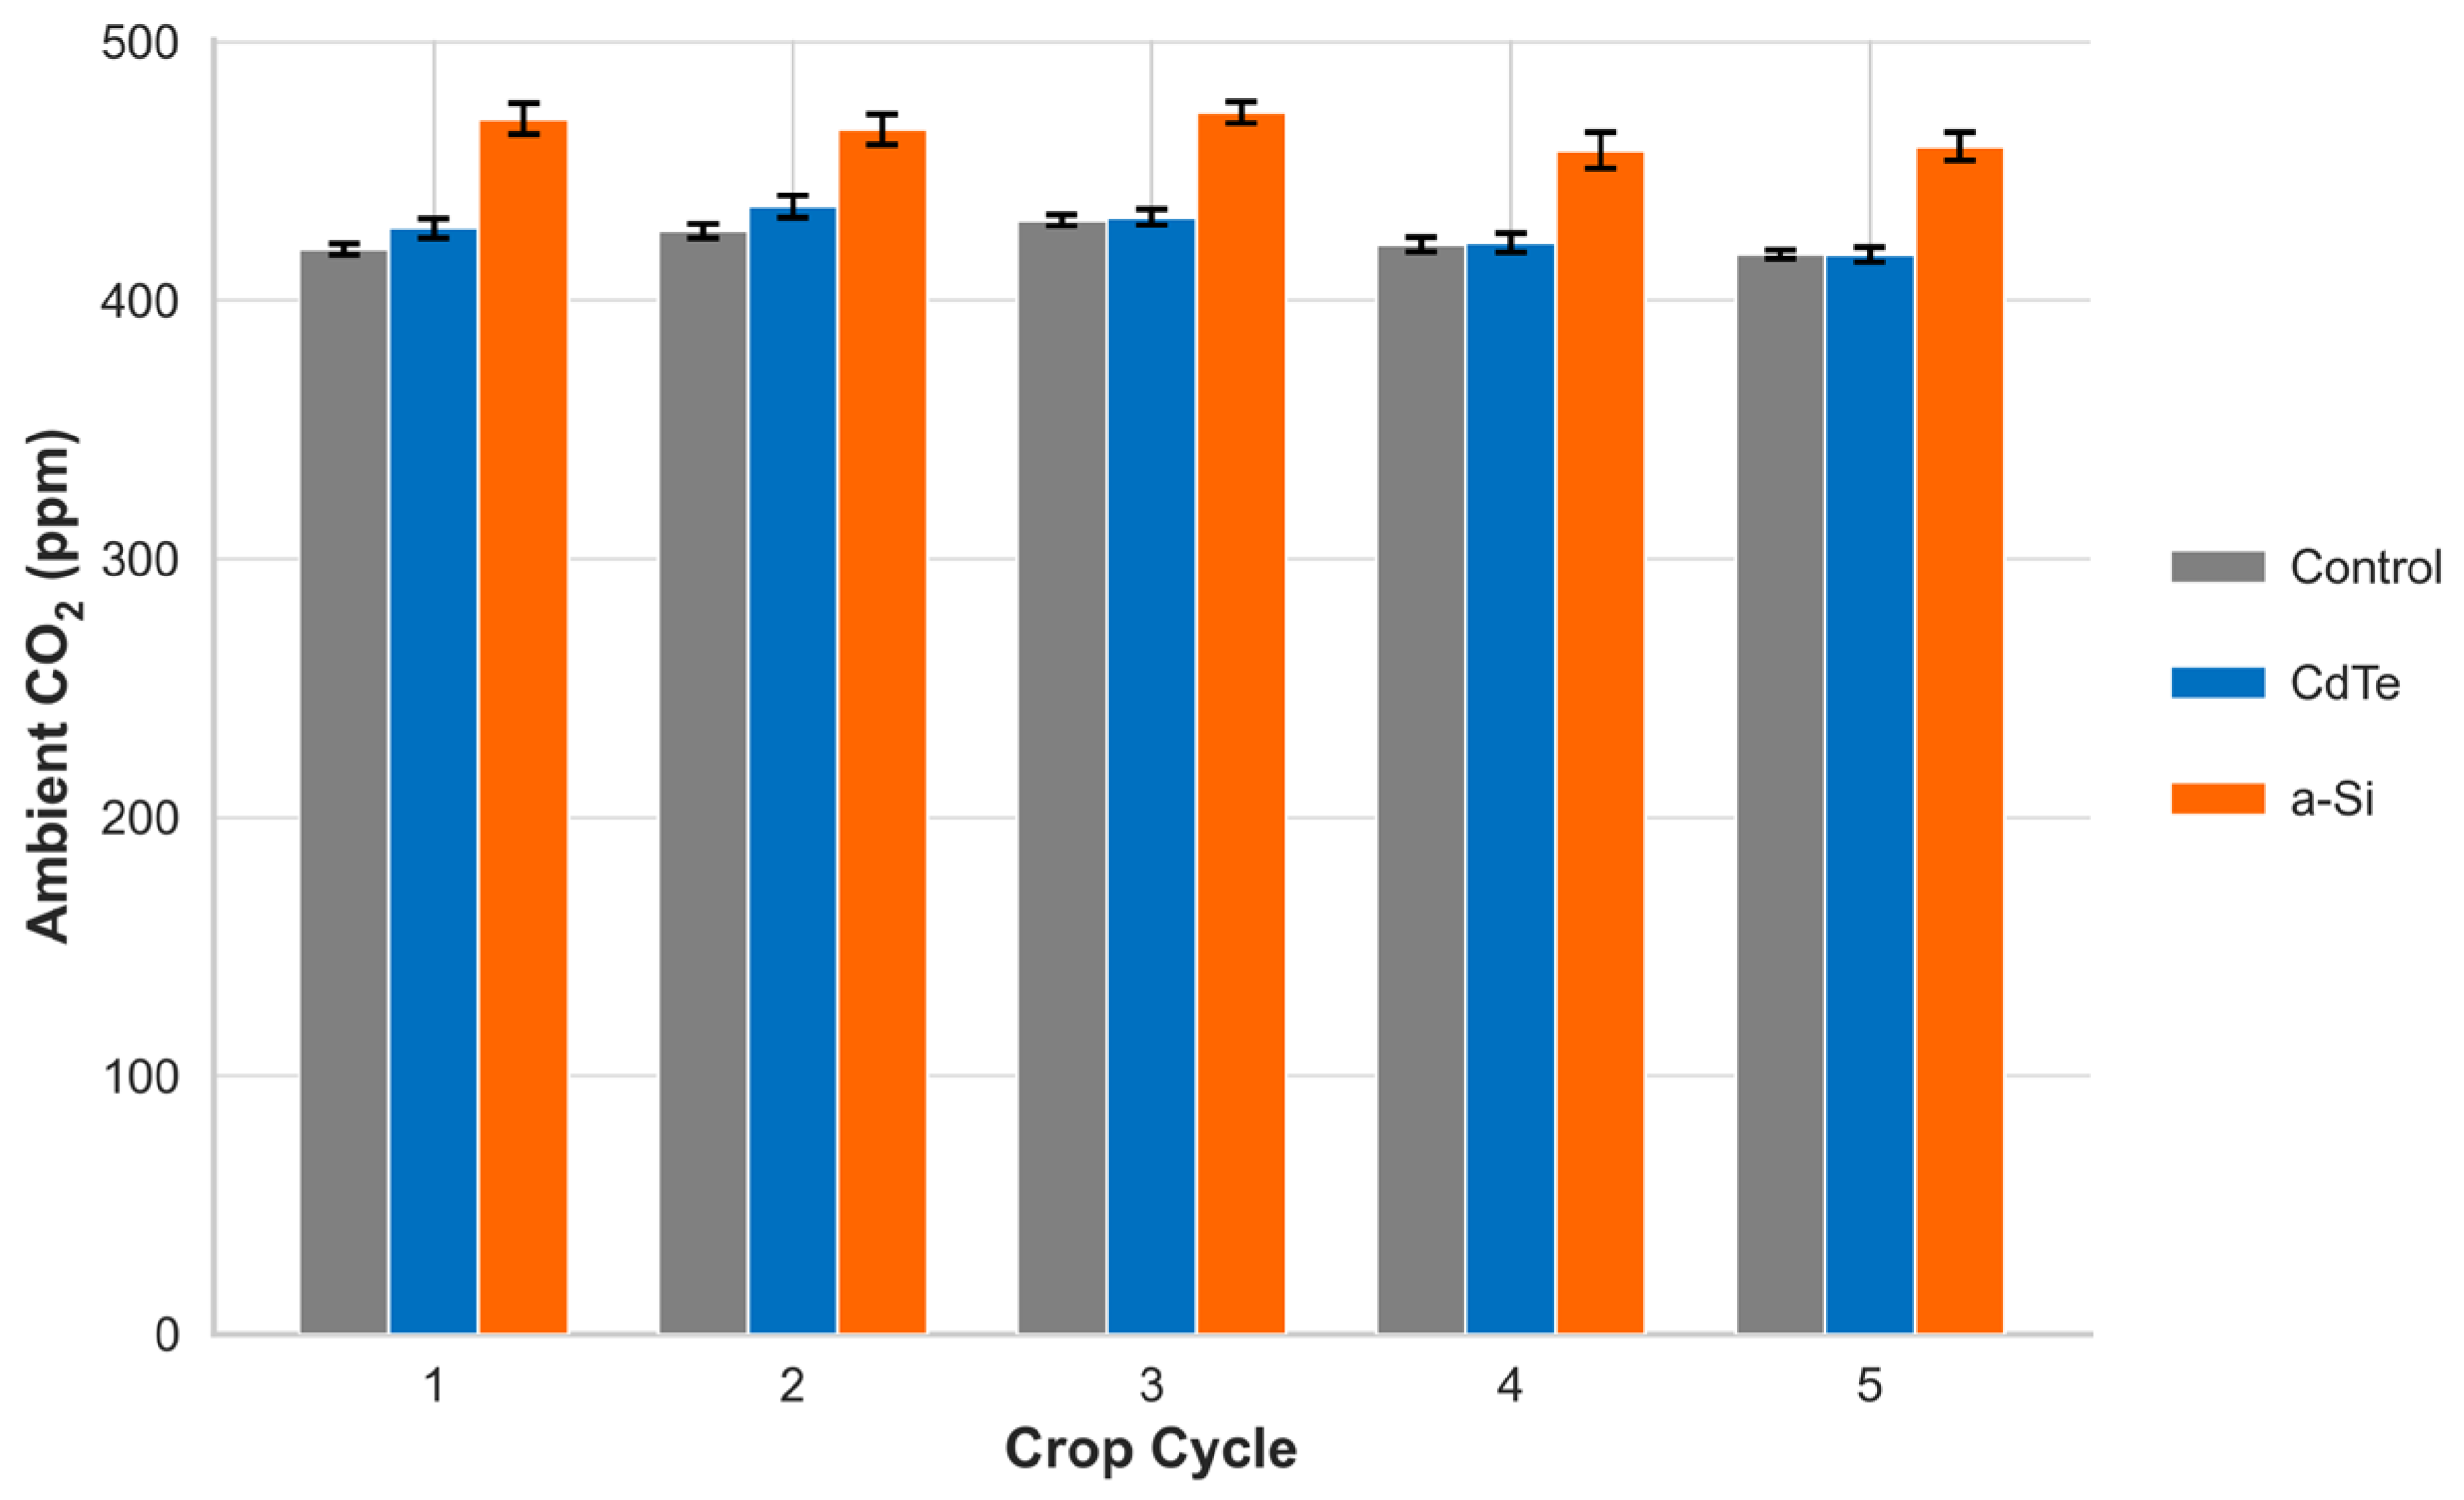
Average daily daytime CO
2 concentration values in the three prototypes for every crop cycle (
Figure 7) shows a consistent pattern emerged throughout the year: the prototype with a-Si exhibited a higher CO
2 concentration than the control, typically ranging between 30 and 80 ppm above ambient levels, with an annual average value of 448 ppm. In contrast, the CdTe prototype, maintained CO
2 concentrations comparable to, or occasionally slightly below, those of the control prototype, with annual average values of 419 and 424 ppm, respectively. On average, this represented an increase of approximately 11% in the a-Si prototype, while differences in the CdTe structure remained minimal (around 1–2%).
3.6. Soil Parameters: Temperature, Moisture and pH
Soil parameters were monitored to assess whether PV shading mitigates subsurface stress using a sterilized substrate mix of blond peat (80%) and perlite (20%).
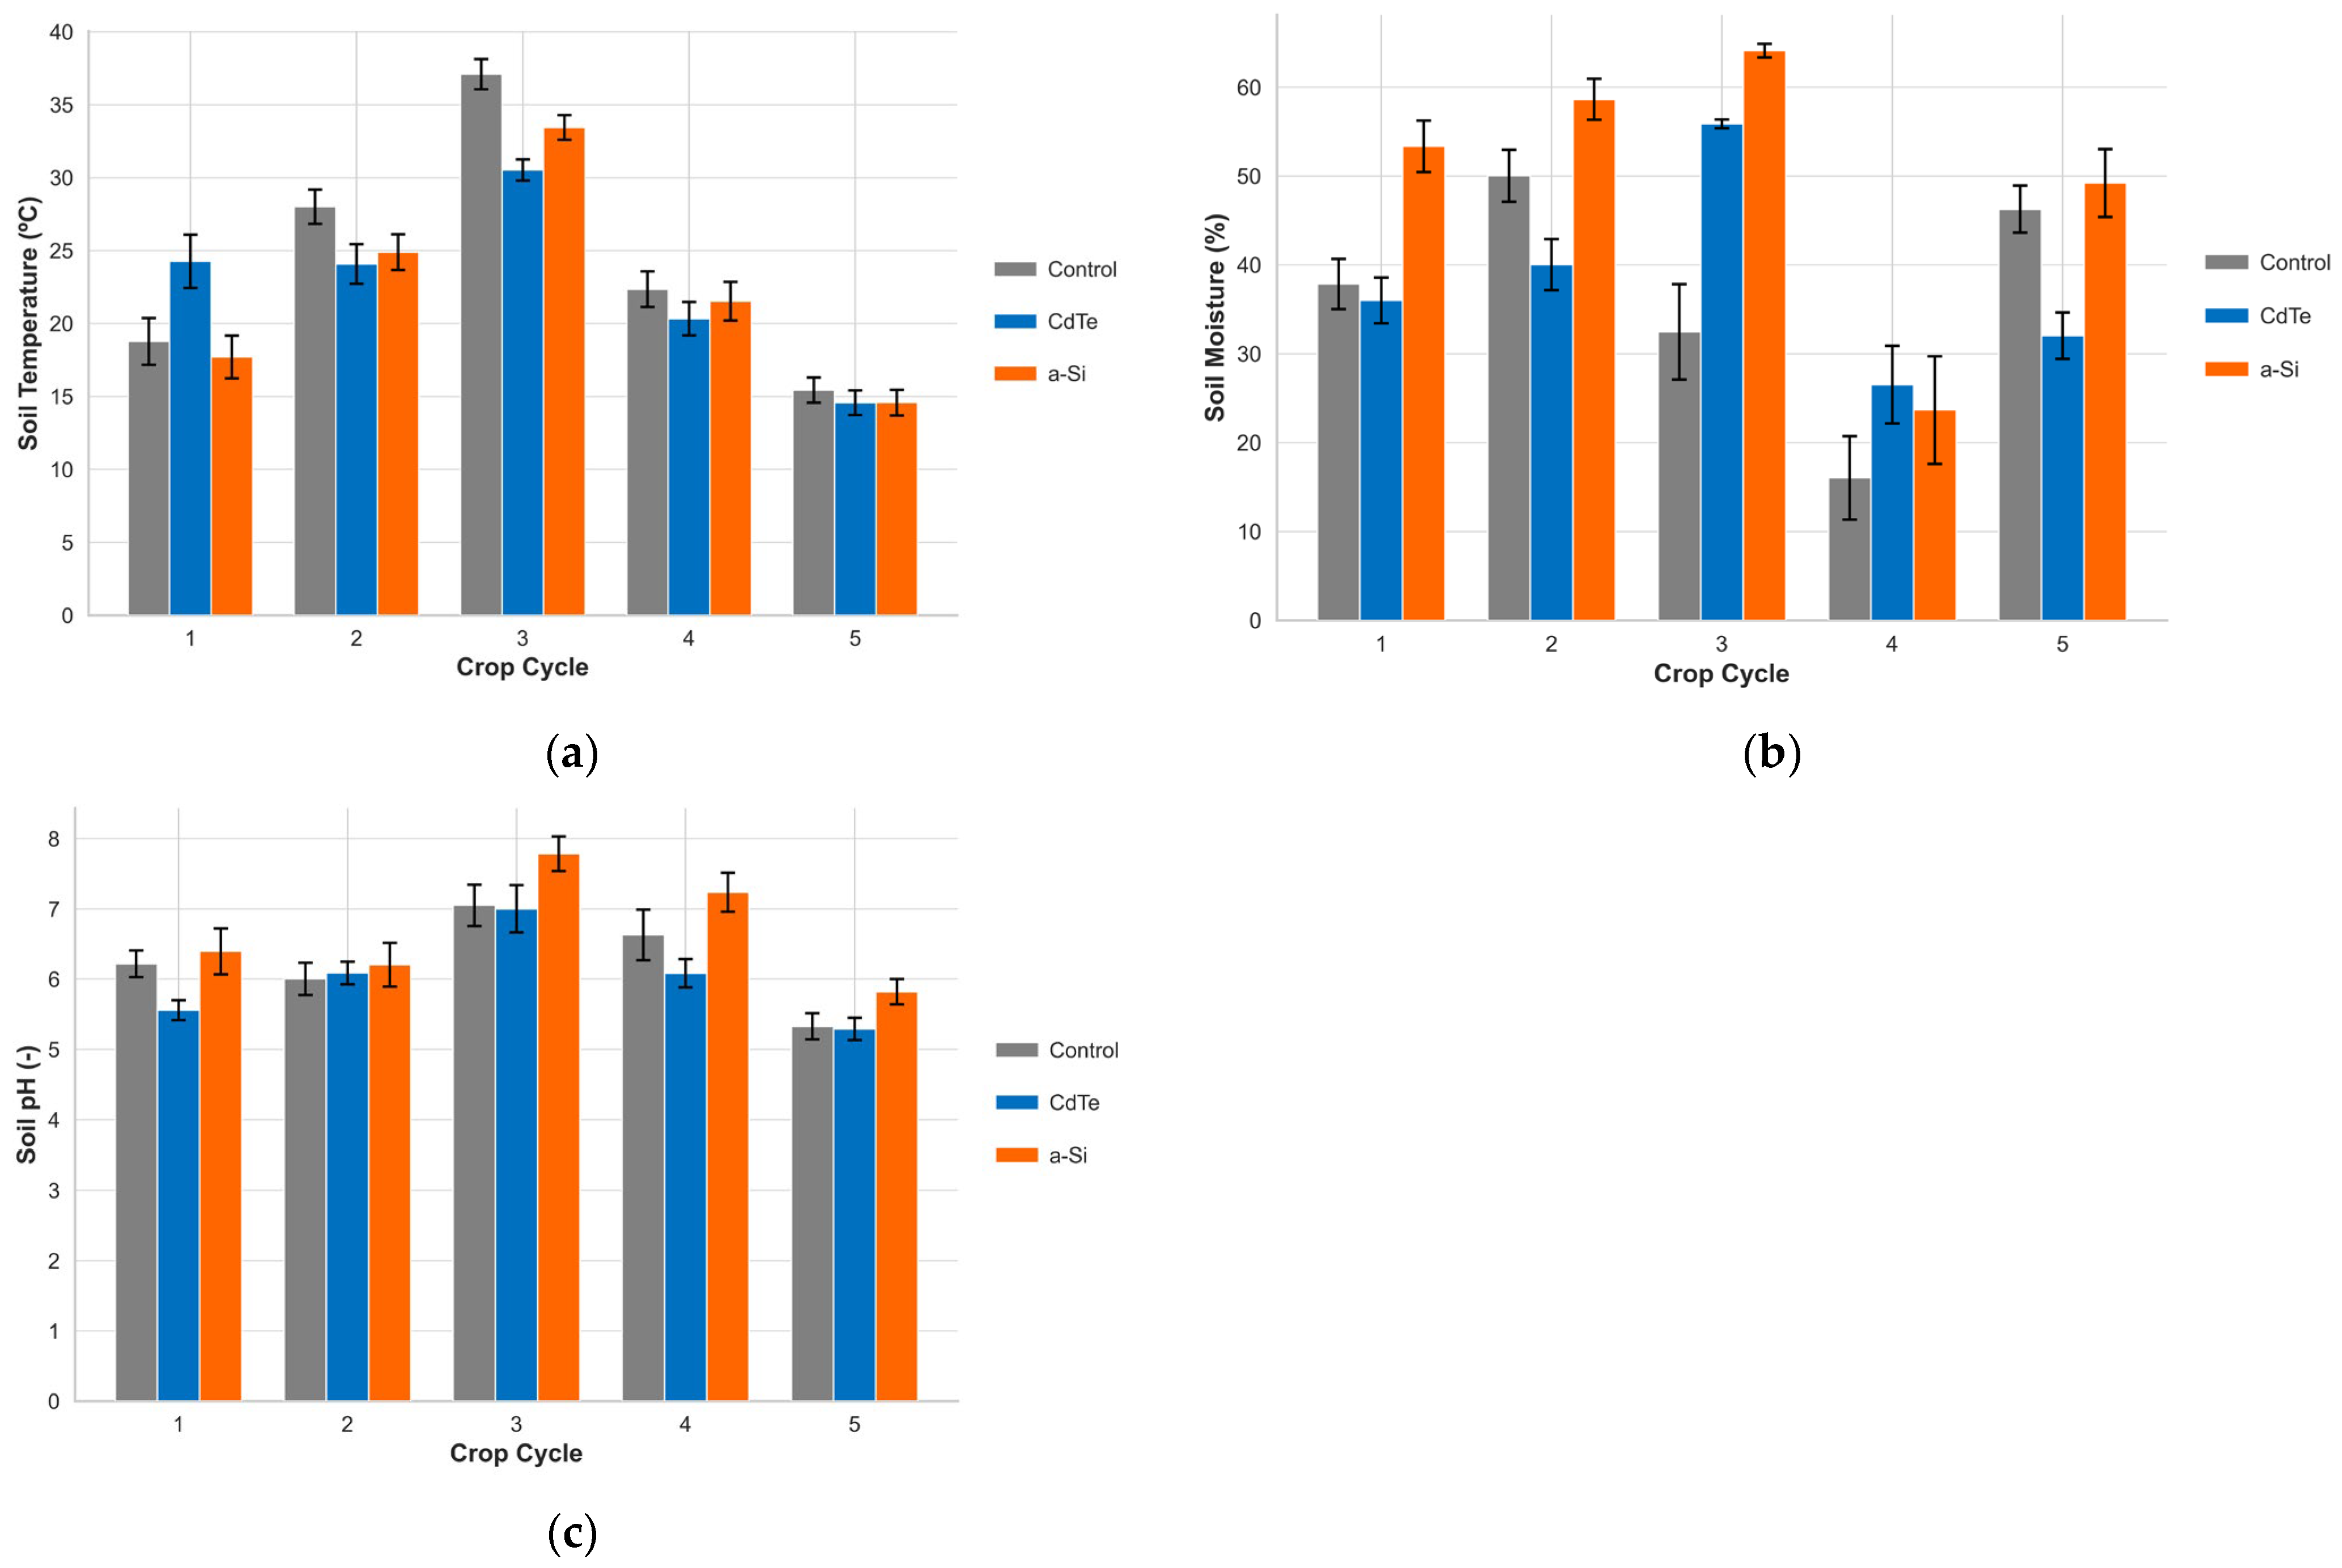
Soil Temperature,
Figure 8a and Moisture data,
Figure 8b, indicate a distinct inverse relationship between soil temperature and moisture retention under the APV structures. The CdTe system achieved the most significant thermal mitigation, particularly during the peak summer period (cycle 3), averaging 30.8 °C compared to 37.46 °C in the control (−17.8% difference). This substantial cooling effect suggests that the CdTe cover provides a critical shield against direct soil insolation, likely preventing root zone overheating. This trend persisted through autumn (cycle 4, −9.2%) and winter, where CdTe (14.7 °C) remained below the control (15.6 °C). An anomalous spike recorded for CdTe in cycle 1 was identified as sensor displacement and rectified.
The a-Si prototype provided a more moderate cooling profile (−3.6% to −11.1%), reaching its maximum deviation in cycle 2. By late winter, both APV systems converged to ~14.7 °C, consistently maintaining values below the control.
Regarding soil moisture, the a-Si prototype consistently maintained the highest water content, peaking at 64% in cycle 3 vs. 55.7% in CdTe and 33% in control. It should be noted that the sharp moisture drop in the control during cycle 3 (down to 33%) was exacerbated by an irrigation failure between 6 August and 6 September. In the final winter cycle, a-Si retained 49% moisture, whereas CdTe dropped to 31%, falling below the control (46.2%).
As can be seen in
Figure 8c the parameter of pH generally remained within the recommended agronomic range (pH 5.2–7.2), though technology-dependent trends emerged. The CdTe prototype induced slight acidification (−1% to −3%), dipping notably in cycle 4, while a-Si prototype tended to increase pH by up to 13%, especially in summer. These pH fluctuations likely reflect differences in microbial activity rates driven by the distinct thermal regimes described above.
3.7. Vapour Pressure Deficit (VPD)
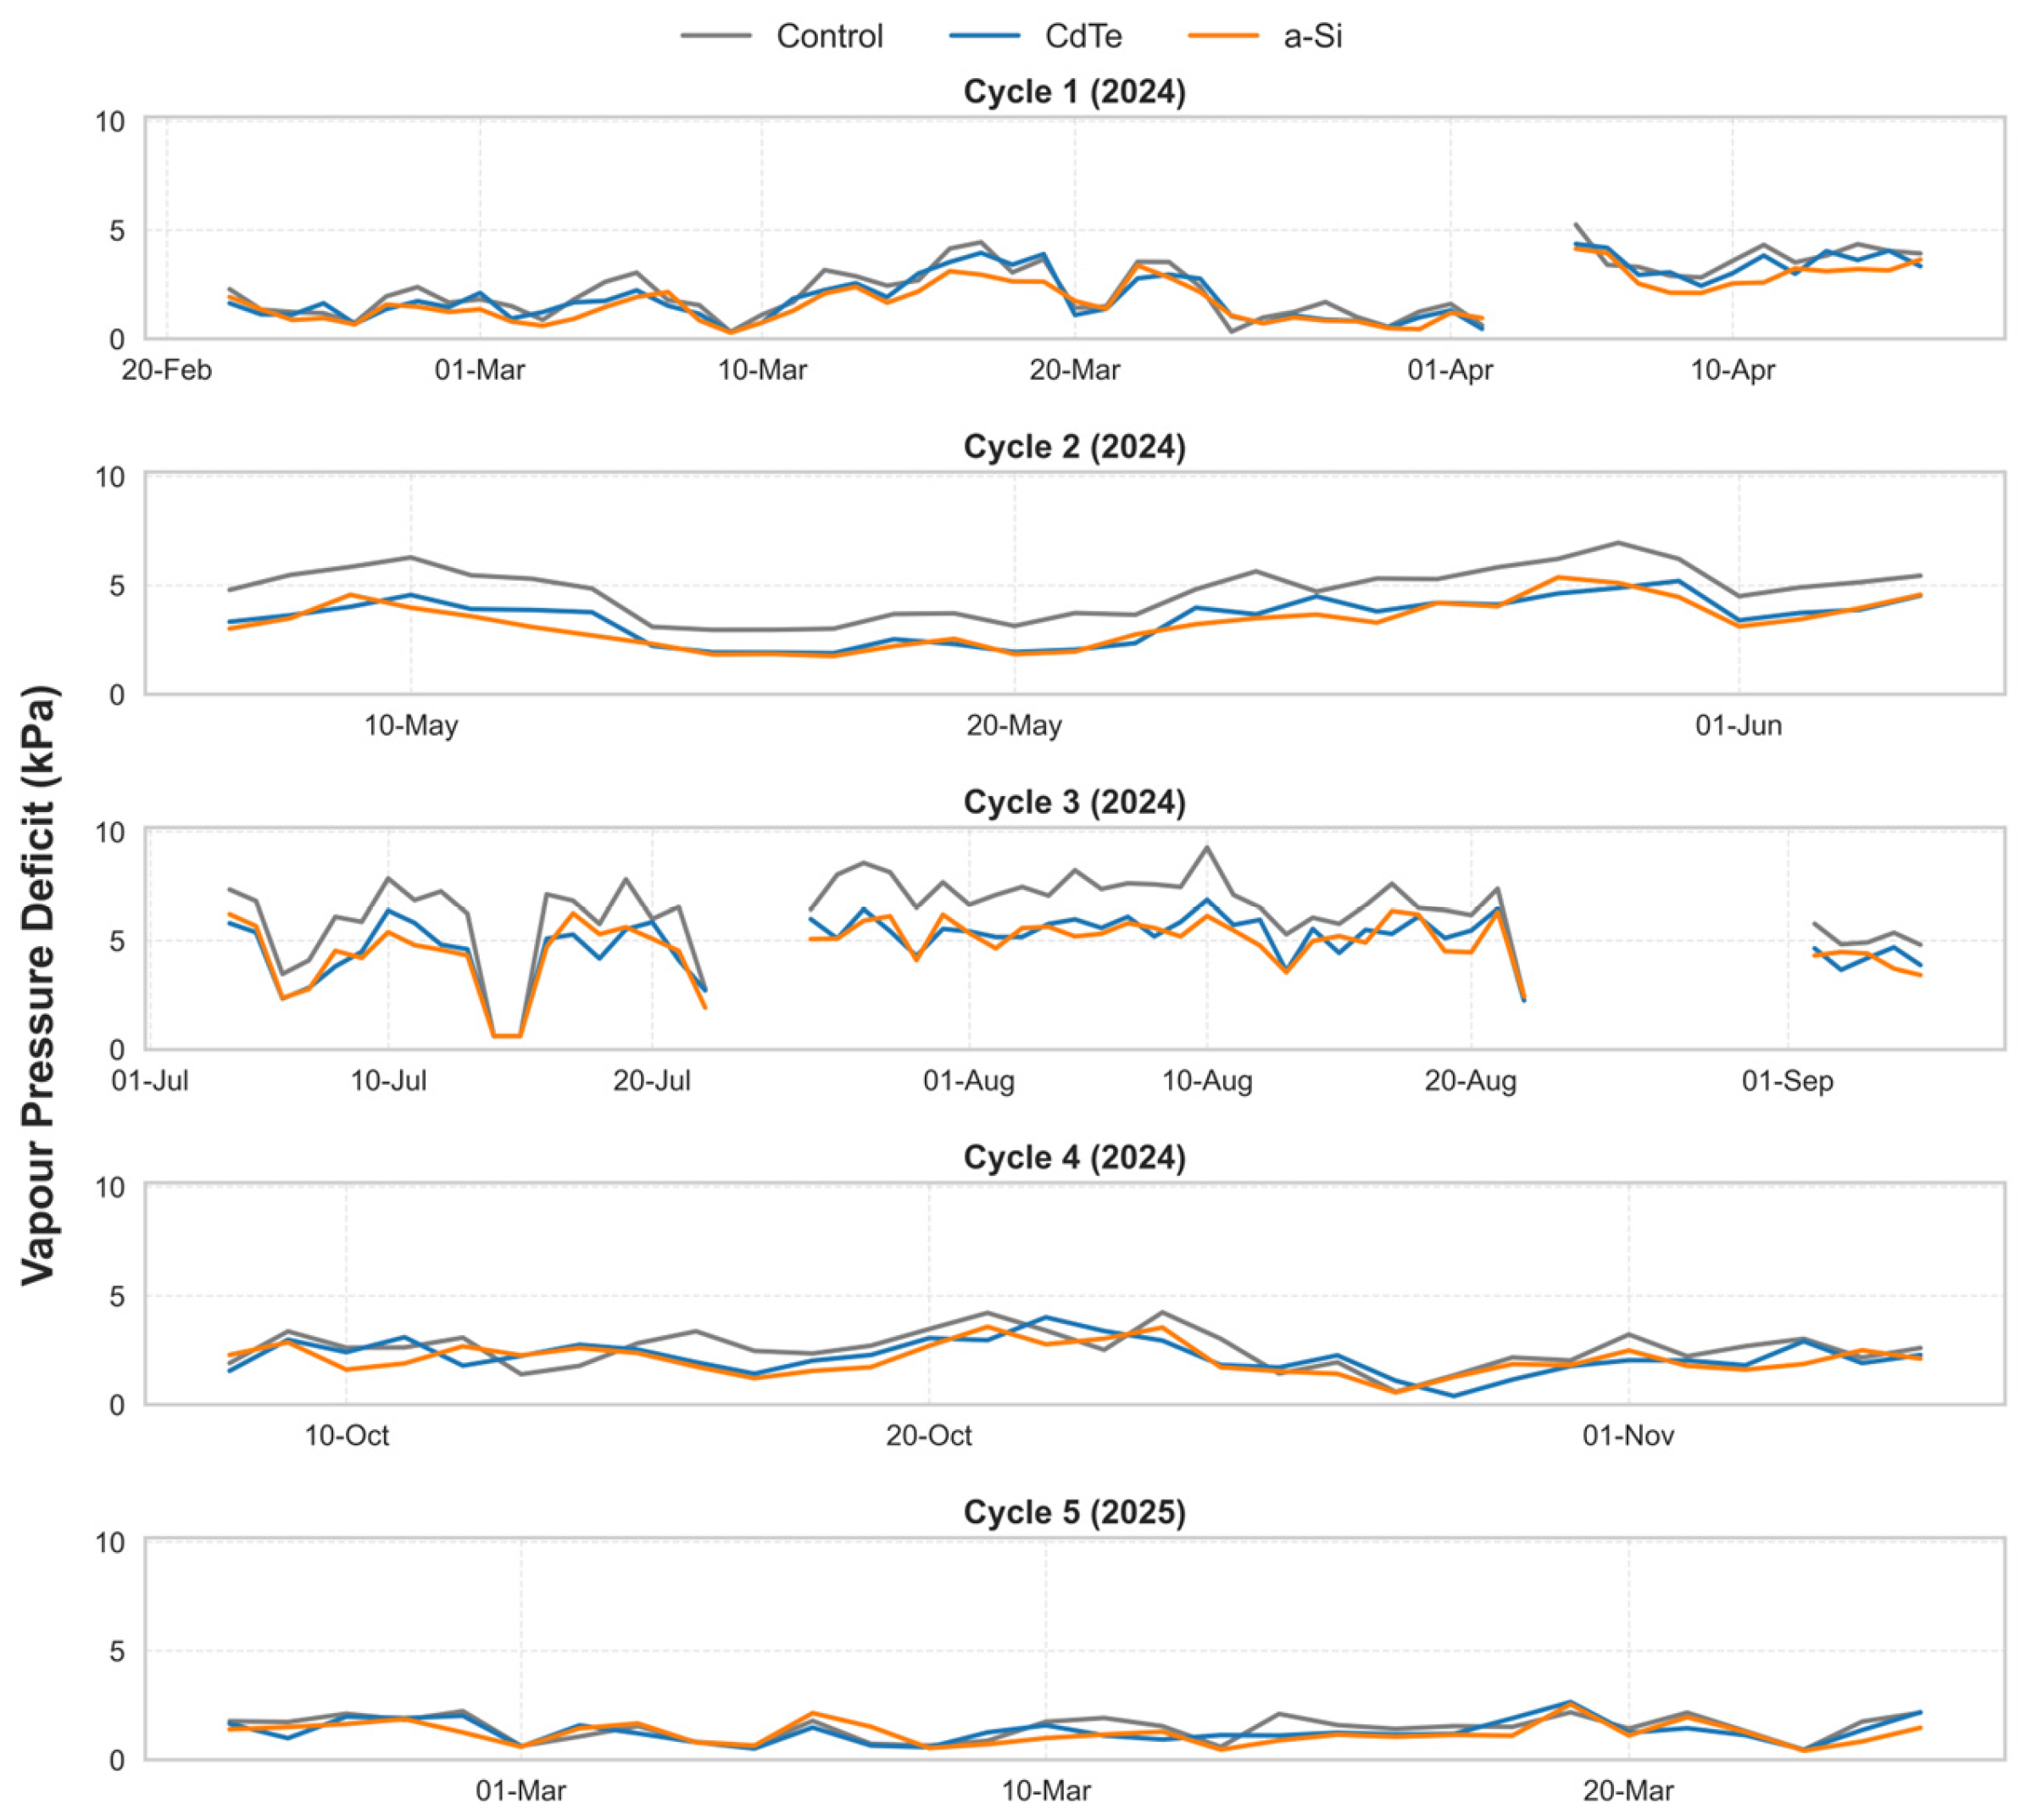
The calculation of this parameter is performed using the constants from the Tetens equation (FAO standard) for greater accuracy. The analysis of VPD dynamics inside the experimental prototypes revealed a consistent buffering effect associated with the photovoltaic covers compared to the control structure (
Figure 9). In general terms, in the three prototypes, the average maximum and minimum VPD values occurred in cycle 3 and cycles 1 and 5, respectively, which correspond to the peak summer and winter months.
The peak VPD in the control prototype varied drastically, reaching extreme values above 8.0–9.0 kPa (cycle 3) and dropping to nearly 0.2 kPa (cycles 1 and 5). The VPD trends in the PV prototypes are practically the same, but consistently lower than the control during the high-radiation cycles. In the aforementioned warmest cycle (cycle 3, July–August), while the control frequently exceeded 6.0–7.0 kPa, variations for CdTe and a-Si remained largely confined to the 4.0–6.5 kPa range. On average during this peak period, the CdTe prototype exhibited VPD values approximately 22.7% lower than the control, corresponding to an absolute difference of roughly 1.5–2.5 kPa during mid-day peaks, while the a-Si prototype showed a nearly identical mitigation pattern, with no significant statistical difference observed between the two photovoltaic technologies.
This mitigation effect was not uniform across the year but became significantly more pronounced during the summer, particularly in the third growing cycle (July–August). During this period, the drying capacity of the air was substantially reduced under the PV covers, indicating a stronger decoupling from the ambient atmosphere under higher solar irradiance conditions. Conversely, during the cooler cycles (cycles 1, 4, and 5), the differences were less pronounced, with all systems showed lower VPD values, generally remaining below 4.0 kPa, and dropping to mean daily values of 1.46 kPa (Control), 1.30 kPa (CdTe), and 1.21 kPa (a-Si) during the colder winter conditions of cycle 5.
3.8. Reference Evapotranspiration (ET0)
Evapotranspiration dynamics within the APV prototypes were characterized using the reference evapotranspiration (
ET0) derived from the FAO-56 Penman–Monteith methodology [
26].
ET0 values were computed from the high-resolution environmental dataset collected at five-minute intervals across the different prototype configurations. The required meteorological variables were aggregated to a daily temporal scale and used as inputs to the FAO-56 Penman–Monteith equation (Equation (1)). To ensure maximum computational rigour and reproducibility, the complex sequence of thermodynamic equations was executed using the open-source pyet (v1.3) Python package.
The resulting
ET0 time series provided a consistent atmospheric index for comparing the microclimatic “drying power” among prototypes. It must be emphasized that this metric strictly represents the reference atmospheric evaporative demand imposed by the STPV microclimate, not the absolute crop evapotranspiration (
ETc). Differences in
ET0 across prototypes reflect the combined effect of severe radiative attenuation.
where:
ET0 is the reference evapotranspiration [mm day−1];
Rn is the net radiation at the crop surface [MJ m−2 day−1];
G is the soil heat flux density [MJ m−2 day−1];
T is the mean daily air ambient temperature at 2 m height [°C];
u2 is the wind speed at 2 m height [m s−1];
es is the saturation vapour pressure [kPa];
ea is the actual vapour pressure [kPa];
es − ea is the saturation vapour pressure deficit [kPa];
is the slope vapour pressure curve [kPa °C−1];
is the psychrometric constant [kPa °C−1].
To effectively apply this model and ensure robust boundary conditioning, specific methodological adaptations were integrated to address the semi-enclosed nature of the prototypes. First, the aerodynamic term was adjusted by assigning a constant residual wind speed (
u2 = 0.2 m/s). This value was reported before in the literature [
45,
46] as representative for natural convective air movement in passive greenhouses. Secondly, the energy component (net radiation,
Rn) was not measured directly. The external global incident solar radiation (
Rs) was mathematically scaled by the nominal broadband optical transmittance coefficient of each cover (90% for the control, 50% for CdTe and 20% for a-Si) to accurately simulate the actual evaporative demand directly under each STPV technology. It is important to note that these broadband energy transmittances were used instead of the measured PAR transmittances, as the evaporative thermodynamic balance is driven by the entire solar spectrum (including near-infrared thermal energy), not just the photosynthetic band. From this effective shortwave radiation, the pyet library internally estimated
Rn following standard FAO-56 procedures for net longwave radiation balances based on location and temperature extremes. Finally, in strict accordance with FAO-56 guidelines for daily calculation time steps, the soil heat flux (
G) was assumed to be negligible (
G ≈ 0), as daytime soil heat absorption is usually balanced by night time heat release over a 24 h period. Maximum and minimum daily RH values were also integrated to compute actual vapour pressure, adhering strictly to FAO-56 protocols. Although these methodological adaptations rely on estimated baseline parameters, it is crucial to note that the primary objective of this analysis is strictly comparative. Because this calculation protocol was strictly identical for all three environments, the relative differences observed accurately isolate the specific thermodynamic impact of each STPV module compared to the control, providing an assessment of how these technologies alter the evaporative demand.
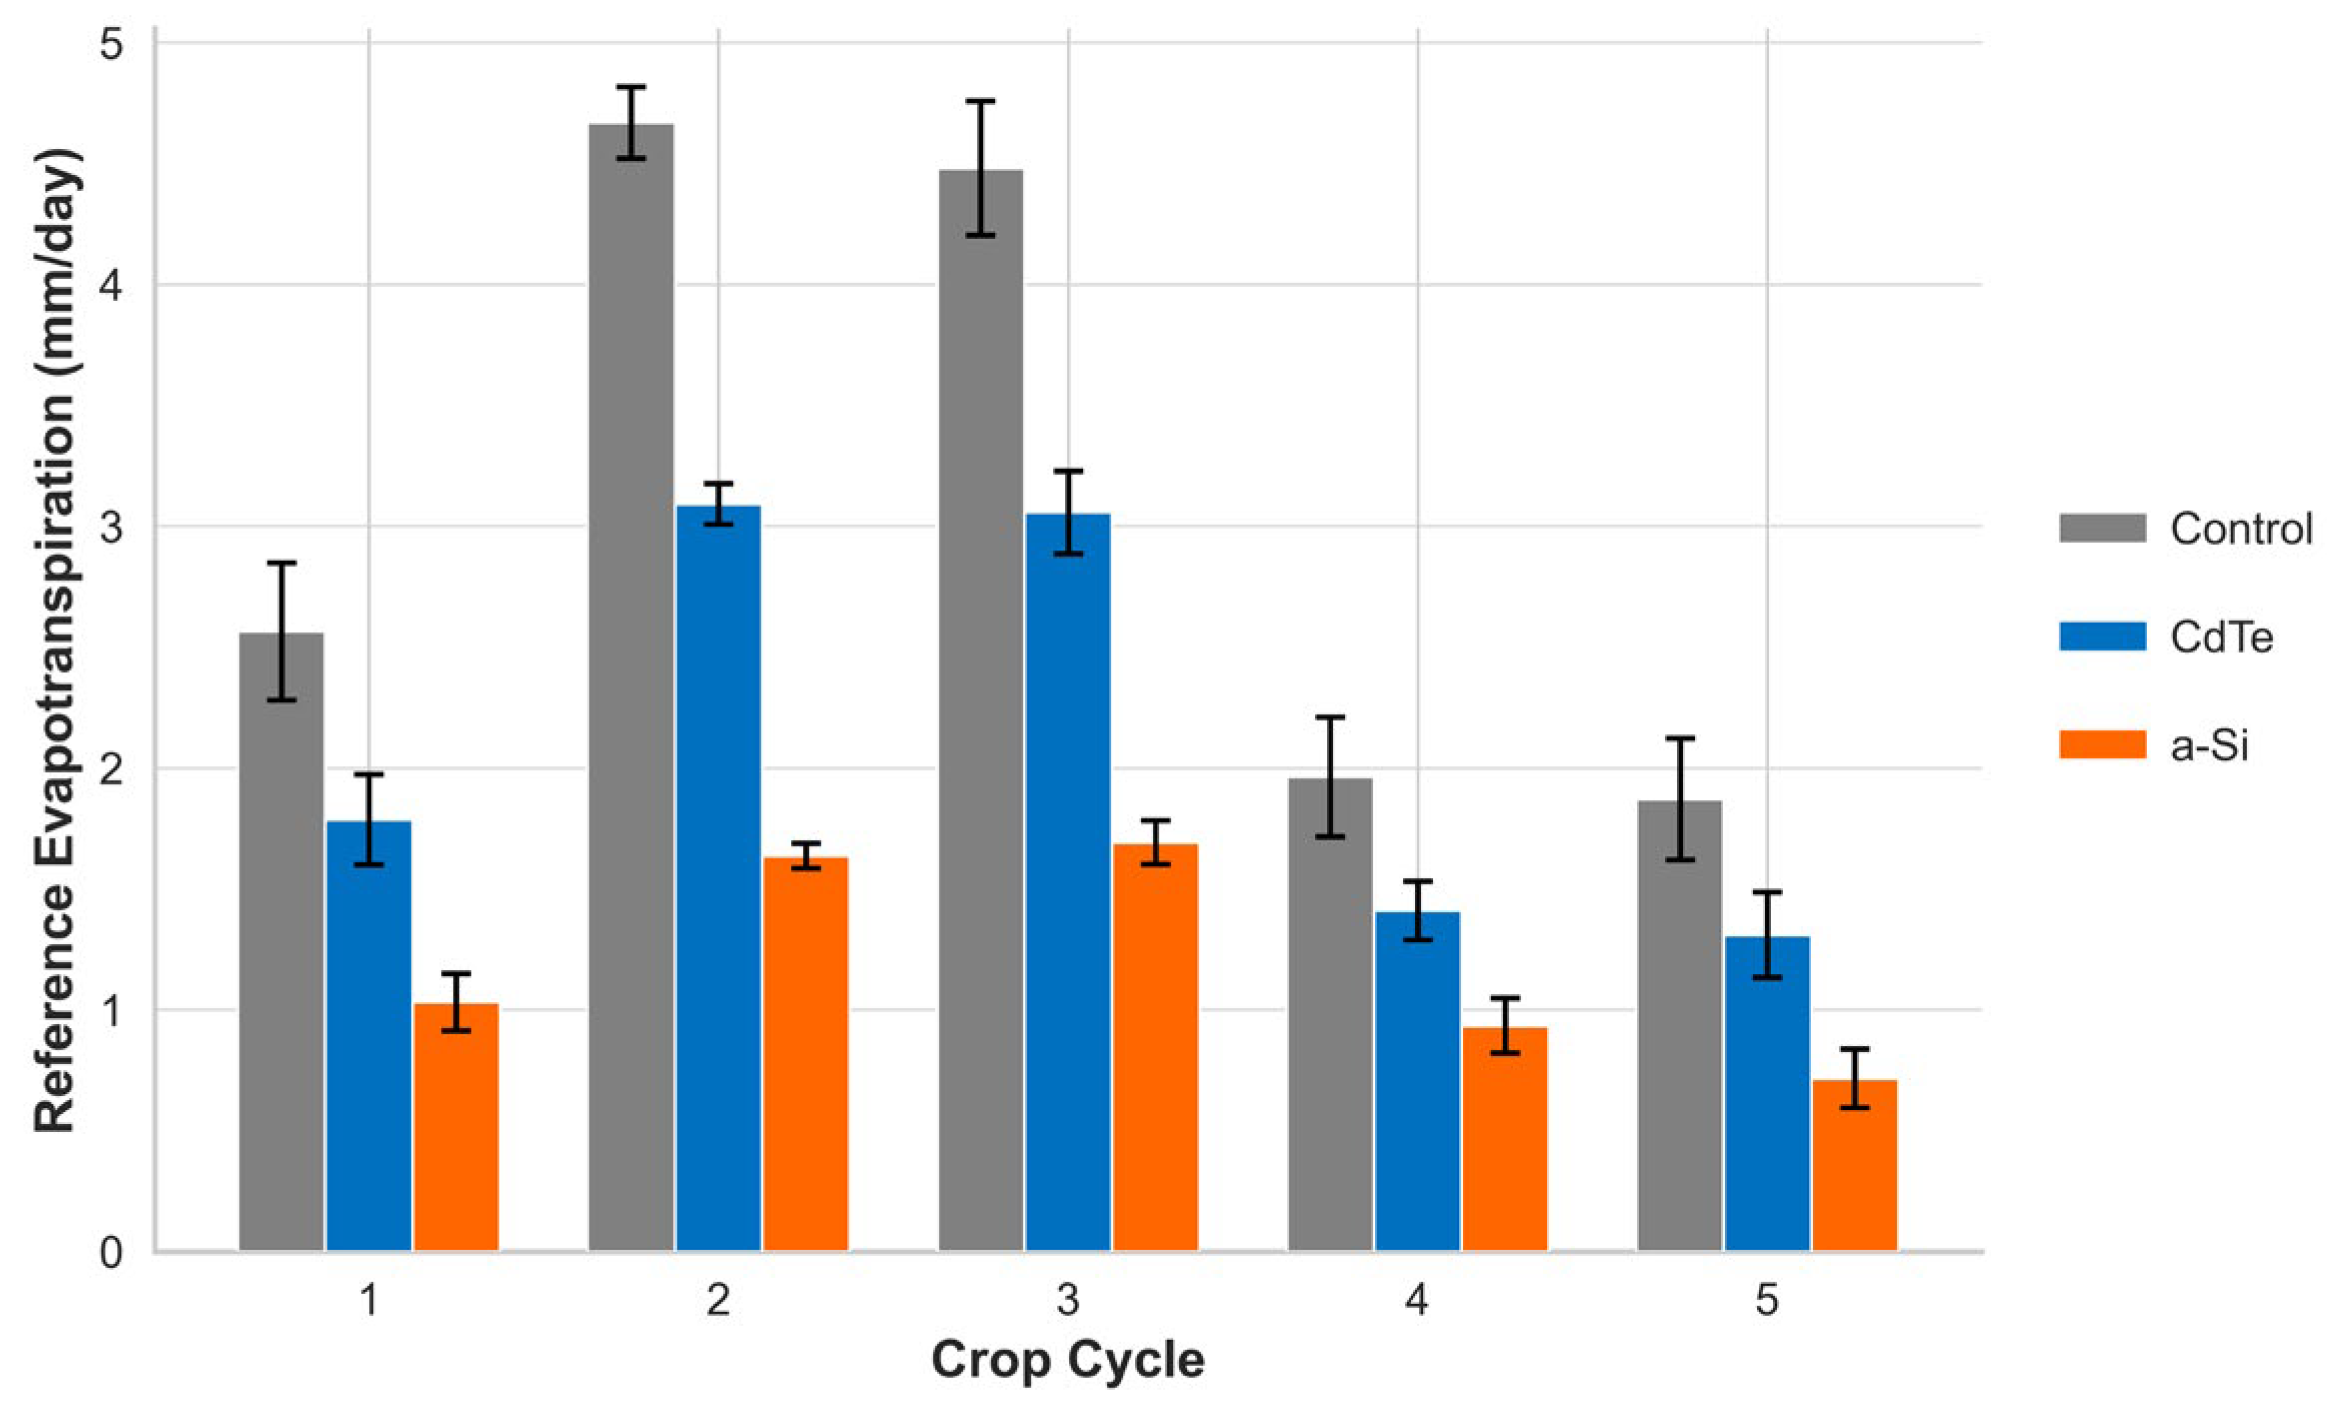
Figure 10 illustrates the mean evapotranspiration trends, revealing a consistent attenuation of water demand in the prototypes equipped with photovoltaic roofing compared to the control. The calculation demonstrated that the shading effect acts as the primary restrictive driver for water loss. This buffering capacity was particularly pronounced during the peak summer demand of cycle 2; while the unshaded control recorded a maximum
ET0 of 4.67 mm/day, the CdTe and a-Si prototypes significantly mitigated this extreme demand to 3.09 mm/day and 1.64 mm/day, respectively.
Across the entire 194-day evaluation period, these dynamics translated into substantial, statistically significant average reductions in atmospheric evaporative demand of 31.4% (CdTe) and 61.3% (a-Si) relative to the control. While these reductions substantially exceed the 10–30% evapotranspiration decreases typically reported in standard agrivoltaic literature [
44,
45], they perfectly align with the extreme optical constraints deliberately selected for this study, highlighting the exceptional capability of dense semi-transparent technologies to drastically conserve soil moisture under harsh Mediterranean conditions.
A comprehensive seasonal statistical validation of these
ET0 reductions across all five crop cycles is presented in
Section 3.12.
3.9. Coupling of Evapotranspiration to Atmospheric Demand
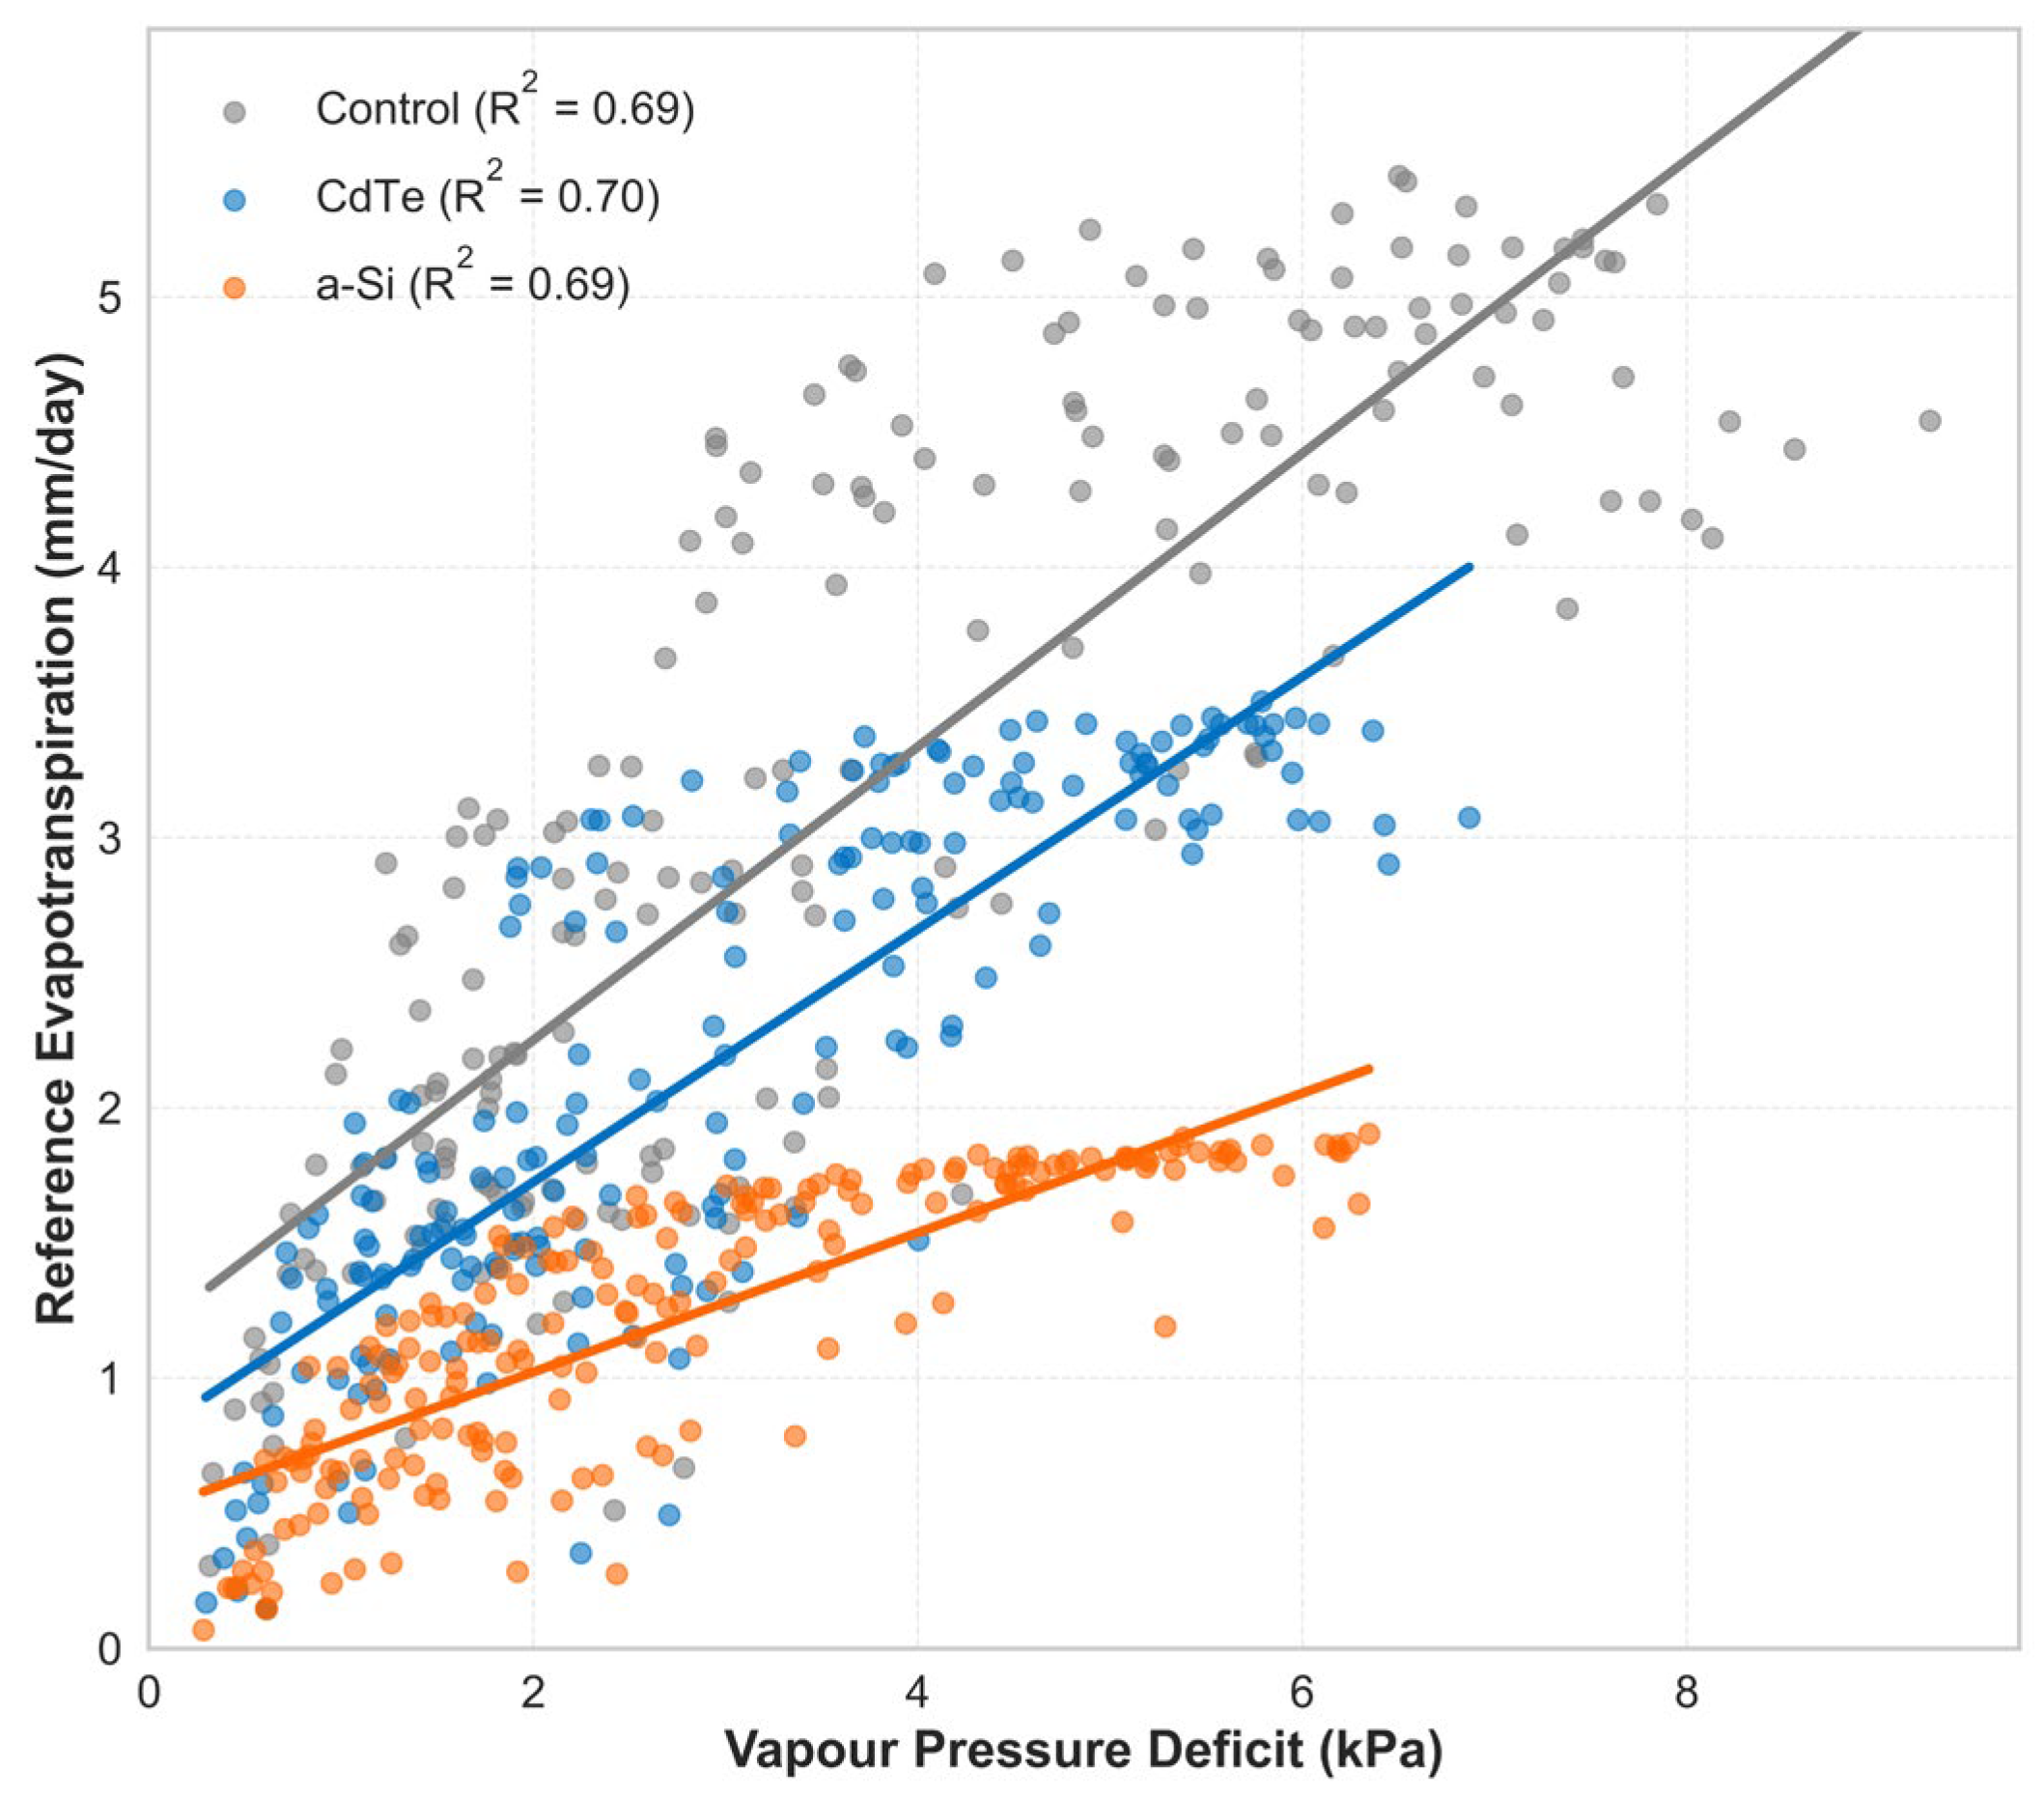
The aggregate analysis of daily reference evapotranspiration (
ET0) versus the VPD across the entire experimental period reveals distinct microclimatic dynamics between the control and STPV settings (
Figure 11). While all conditions show a positive correlation between atmospheric demand and water loss, the sensitivity and slope of the response differ significantly when considering the full dataset comprising all crop cycles.
The most critical observation lies in the flattening of the regression slopes under the photovoltaic modules, indicating a severe energetic decoupling between atmospheric dryness and water loss. Throughout the study, the control treatment was frequently exposed to severe atmospheric demand, corresponding to the cycle 3 period, with the highest temperatures, with VPD values extending beyond 6.0 kPa and reaching up to 9.5 kPa. Under these unrestricted radiative conditions, the control ET0 rose sharply, reaching absolute maximums exceeding 4.6 mm/day.
In contrast, while both APV configurations (CdTe and aSi) consistently capped the maximum VPD at approximately 5.5 kPa, still experienced considerable atmospheric dryness during peak summer (with maximum VPDs reaching up to 6.5–7.0 kPa), the resulting evaporative water loss was heavily restricted. This demonstrates that the PV array acts as a persistent thermodynamic buffer, for the CdTe prototype, ET0 was effectively capped near 3.0 mm/day, while the dense a-Si module limited ET0 to a maximum of approximately 1.64 mm/day, even at its highest VPD intervals. By severely attenuating the incident radiation fundamentally necessary to vaporize water, the covers prevent the soil and crop from experiencing the most extreme drying conditions, effectively disarming the atmospheric demand, regardless of the specific crop cycle or season.
Linear regression analysis revealed highly consistent coefficients of determination across all treatments (R2 ≈ 0.69–0.70). This consistency indicates that while the STPV systems significantly reduced the overall magnitude of reference evapotranspiration, the fundamental thermodynamic coupling between the VPD and ET0 remains unaltered under the photovoltaic modules.
3.10. Photovoltaic Generation
To contextualize the energetic viability of the STPV prototypes alongside their microclimatic buffering capacity, the specific electrical yield was monitored throughout the evaluated cycles. Cumulative energy generation (kWh/m
2) was determined through discrete numerical integration of the instantaneous power output logged at 5 min intervals. The total energy yielded was then summed over each crop cycle and normalized by the active area of the photovoltaic modules (
Table 4). Over the aggregated active periods, the cumulative energy generation reached 73.09 kWh/m
2 for the a-Si module and 56.48 kWh/m
2 for the CdTe module.
This difference in electrical yield aligns with the inherently lower conversion efficiencies of thin-film technologies, which is the necessary physical trade-off to maintain the structural semi-transparency (20% and 50%, respectively) required to transmit biologically useful PAR to the crop. A comprehensive techno-economic evaluation of this energy yield, coupled with plant morphology and land use efficiency metrics, falls outside the microclimatic scope of this manuscript and is the focus of ongoing dedicated research.
3.11. Overview of Crop Physiological Responses
While the primary scope of this study focuses on the microclimatic characterization of the STPV prototypes, preliminary physiological responses of the evaluated crops (lettuce and tomato) provide essential agronomic context. Overall, crop performance—evaluated as the yield ratio of the PV prototypes relative to the unshaded Control—demonstrated a strong dependence on the interplay between seasonal conditions and the optical transmittance of each cover.
For lettuce, the severe shading of the a-Si prototype combined with its microclimatic buffering proved highly advantageous during most of the evaluated periods. The crop yield ratio for a-Si remained above 1.0 in all cycles except the final spring cycle. This was particularly evident during cycle 1, where lettuce under a-Si achieved a significantly higher aerial fresh mass (~29.8 g/plant) compared to the Control (~20.2 g/plant). Conversely, the CdTe prototype exhibited greater seasonal disparity for lettuce, with two cycles showing ratios above 1.0 and three cycles falling below (0.63–0.87). However, from an agrivoltaic perspective, these partial yield reductions under CdTe are acceptable; when crop yield is mathematically coupled with the simultaneous PV generation (detailed in
Section 3.10), preliminary agronomic observations confirm that the resulting Land Equivalent Ratio (LER) [
13] successfully exceeds 1.0, ensuring the overall efficiency of the dual land use.
Regarding the tomato crops, shading primarily triggered morphological adaptations rather than severe biomass penalties during the evaluated early growth stages. Stem elongation was a prominent shade-avoidance response. For instance, during cycle 1, the CdTe module induced a significant +34.3% increase in stem length compared to the Control, while the a-Si prototype drove the maximum stem elongation during the heat-stressed conditions of cycle 2.
These preliminary trends indicate that while STPV covers structurally dictate the baseline evaporative demand, their shading levels drive specific seasonal and morphological crop adaptations. A comprehensive physiological evaluation—detailing absolute biomass accumulation, destructive metrics, and full LER calculations across all cycles—falls outside the micrometeorological scope of this manuscript and is the subject of ongoing research, which will be detailed in a future publication.
3.12. Comparative Statistical Assessment of Microclimatic Performance
The statistical validation confirms that STPV technologies function as significant microclimatic regulators across all seasonal variations (
Table 5). Over the monitored period, both CdTe and a-Si modules induced a highly significant reduction in T
max, VPD
max,
ET0, and DLI compared to the control (
p < 0.001). Notably, no significant differences were found for T
mean (
p > 0.05), indicating that while the systems successfully mitigate thermal peaks, the cumulative thermal integral remains stable across treatments.
The seasonal breakdown further disentangles this buffering capacity. As detailed in
Table 6, during peak summer cycles (cycles 2 and 3), the STPV modules significantly lowered maximum daily temperatures, successfully preventing the lethal thermal thresholds (>45 °C) recorded in the control prototype. Crucially, this extreme heat mitigation should not alter the baseline phenological environment, as the mean daily temperatures remained statistically equivalent across all treatments regardless of the season (
Table 7).
Furthermore, the thermodynamic decoupling between atmospheric aridity and internal water demand is strongly evidenced in
Table 8. The STPV covers consistently capped the reference evapotranspiration (
ET0) across all cycles, with the most drastic reductions occurring during the severe summer evaporative demand. While this microclimatic stability is achieved at the expense of significantly reduced radiative availability (
Table 9), the consistent reduction in water demand represents a critical agronomic advantage for securing crop resilience in Mediterranean greenhouse horticulture.
4. Discussion
The experimental results highlight a critical trade-off between radiative availability and microclimatic stability. While the observed PAR reductions (57–82%) exceed the typical ranges reported for open-field agrivoltaics, the spectral analysis suggests that the quality of the transmitted light is as decisive as its quantity. The CdTe technology demonstrated a superior ability to preserve the blue and red wavelengths essential for photosynthesis (McCree curve), achieving a 66% relative gain in biologically useful radiation compared to a-Si. However, the agronomic implications of the resulting DLI are profound and highly crop-dependent. The literature establishes that highly light-demanding crops, such as commercial tomatoes, require a minimum DLI of 12–22 mol m
−2 day
−1 for optimal fruit yield, with severe biomass and fruiting penalties observed when values drop below 12 mol m
−2 day
−1 [
35]. As reflected in our seasonal statistical analysis (
Section 3.12,
Table 9), the a-Si module never exceeded 6.15 mol m
−2 day
−1 even during the peak summer irradiance of Cycle 2. Consequently, the extreme shading of the a-Si prototype (consistently yielding DLI < 10 mol m
−2 day
−1) creates a restrictive optical environment likely unviable for fruit-bearing species. Conversely, the CdTe configuration offers a viable threshold for shade-tolerant species (e.g., leafy greens, herbs, or specific ornamentals), which typically thrive in DLI ranges of 10–14 mol m
−2 day
−1. Our empirical data confirm that during the highly irradiative Mediterranean summer (cycles 2 and 3), the CdTe module successfully maintained DLI levels between 10.55 and 12.80 mol m
−2 day
−1. In these specific cases, or during extreme Mediterranean summer cycles, the yield penalties associated with a lower DLI are agronomically offset by the avoidance of severe thermal stress, transforming a traditionally hostile summer greenhouse environment into a viable space for continuous cultivation.
From a microclimatic perspective, the thermodynamic decoupling of the crop from external aridity represents the most critical agronomic advantage of these systems. Unlike the control prototype, which followed the extreme atmospheric demand (reaching 9.0 kPa), the STPV covers acted as passive regulators, stabilizing the hygrometric environment. Agronomically, sustained VPD values above 3.0–4.0 kPa trigger severe stomatal closure, halting photosynthesis, inducing wilting, and leading to physiological disorders such as blossom-end rot due to restricted calcium transport [
47]. While the STPV systems could not entirely eliminate the high summer VPDs typical of the region, their radiative attenuation physically disarmed the evaporative power of the air. This mechanism explains the drastic 31.4% (CdTe) and 61.3% (a-Si) reductions in
ET0 observed, as the maximum
ET0 was strictly capped at ~3.0 mm/day and ~1.6 mm/day, respectively, despite the dry atmosphere.
While these reductions substantially exceed the 10–30% evapotranspiration decreases reported in other studies in the standard agrivoltaic literature [
48], they perfectly align with the optical constraints deliberately selected for this study, highlighting the capability of dense semi-transparent technologies to act as a thermodynamic buffer, conserving soil moisture under harsh, high-radiation Mediterranean conditions.
This buffering capacity aligns with observations in open-field APV systems, where PV shading consistently lowers canopy temperatures and increases RH, thereby reducing VPD and improving the microenvironment for crops such as grapevines [
49,
50]. Similar low-VPD patterns have been reported for APV systems in semi-arid climates [
38]. However, in closed or semi-closed environments like PV greenhouses, humidity responses are strongly coupled to ventilation rates, making VPD dynamics highly design-dependent [
9,
51,
52]. Therefore, the empirical demonstration of this VPD “capping” effect under specific STPV materials is particularly relevant. Furthermore, this atmospheric buffering extended to the edaphic level, where the significant soil cooling (up to 17.8% under CdTe) suggests a potential to mitigate root-zone heat stress, a common limiting factor in Mediterranean greenhouse horticulture.
It is important to acknowledge that the reduced volume of the experimental prototypes implies a lower thermal inertia compared to commercial-scale greenhouses. Consequently, the absolute temperature and humidity values presented here may exhibit faster fluctuations than those in large-volume structures. However, since the three prototypes shared identical dimensions (or similar for the a-Si prototype), orientation, and ventilation ratios, the relative differences observed between the STPV technologies and the control are physically representative of the optical and thermodynamic properties of the materials. Future validation in commercial-scale facilities is planned to quantify the impact of these technologies on crop yield and fruit quality parameters, which were beyond the scope of this microclimatic study.
5. Conclusions
This study comprehensively evaluated the optical and thermodynamic microclimates generated by commercial inorganic STPV technologies (CdTe and a-Si) in semi-arid greenhouse prototypes. The research demonstrates that these systems function fundamentally as passive climate resilience tools. While both modules heavily attenuated total PAR, spectral quality proved decisive. CdTe modules preserved transparency at critical chlorophyll absorption peaks, delivering a 66% relative gain in biologically useful radiation over the blue-blocking a-Si. Agronomically, this spectral selectivity allowed the CdTe configuration to sustain a viable DLI (12–15 mol m−2 day−1) suitable for shade-tolerant species, whereas the dense a-Si (<10 mol m−2 day−1) proved excessively restrictive for commercial horticulture.
Beyond these optical constraints, the most critical finding of this study is the severe physical decoupling of water loss from atmospheric aridity. During extreme summer cycles, the control prototype suffered lethal VPD (approaching 9.0 kPa) and peak reference evapotranspiration (ET0) exceeding 4.6 mm/day. In contrast, the STPV covers physically disarmed this evaporative demand by restricting the available radiative energy. Consequently, maximum ET0 was strictly capped at ~3.0 mm/day (CdTe) and ~1.64 mm/day (a-Si). This decoupling yielded significant reductions (p < 0.001) in atmospheric evaporative demand of 31.4% (CdTe) and 61.3% (a-Si). Furthermore, this atmospheric buffering prevented internal air from reaching metabolic inhibition thresholds (>40 °C) and mitigated maximum soil temperatures by up to 17.8%, effectively protecting the root zone and extending moisture retention during critical heatwaves.
Ultimately, STPV covers transcend their primary role as electricity generators, proving highly effective at converting vulnerable, high-stress Mediterranean summer periods into viable agricultural windows. Having established these strict microclimatic and thermodynamic boundaries, future research will empirically correlate these environments with the physiological responses and ultimate yields of specific crops cultivated within these systems.




 ,
,