Article

Removal of Triazine Herbicides Using Passion Fruit Waste-Derived Hydrochar
by
Alana Hellen Batista de Almeida
1,
Daniel Viana de Freitas
2,
Caio Alisson Diniz da Silva
3,
Valdívia Gomes de Sousa Bezerra
1,
Ana Candida Lobão da Costa
1,
Mateus Alencar Bezerra Silva
1,
Francisca Daniele da Silva
1,
Jesley Nogueira Bandeira
1,
Maria Carolina Ramirez Hernandez
1,
Lucrecia Pacheco Batista
1,
Matheus de Freitas Souza
4,
Frederico Ribeiro do Carmo
5,
Paulo Sergio Fernandes das Chagas
1,
Bruno Caio Chaves Fernandes
1 and
Daniel Valadão Silva
1,*
1
Department of Agricultural and Forestry Sciences, Federal Rural University of the Semi-Arid Region, Mossoró 59.625-900, Brazil
2
Department of Environmental Sciences and Engineering, Federal Rural University of the Semi-Arid Region, Mossoró 59.625-900, Brazil
3
Academic Unit of Belo Jardim, Federal Rural University of Pernambuco, Belo Jardim 55.154-015, Brazil
4
Department of Agronomy, University of Rio Verde, Rio Verde 75.901-970, Brazil
5
Low Carbon Economy Research Center (NPCO2), Engineering Center, Federal Rural University of the Semi-Arid Region, Mossoró 59625-900, Brazil
*
Author to whom correspondence should be addressed.
AgriEngineering 2026, 8(4), 135; https://doi.org/10.3390/agriengineering8040135
Submission received: 9 February 2026 / Revised: 25 March 2026 / Accepted: 31 March 2026 / Published: 2 April 2026

Abstract

Triazine herbicides are widely used for weed control in agricultural systems, and their occurrence in water bodies has been frequently reported worldwide. This study assessed the efficiency of a hydrochar derived from the epicarp and mesocarp of passion fruit residues for the removal of three triazine herbicides (atrazine, ametryn, and metribuzin), with the aim of developing a material suitable for application in water remediation programs. The adsorption capacity of biomass and hydrochar derived from passion fruit residues was evaluated with and without activation using 0.5 mol L−1 phosphoric acid. The adsorption of herbicides was not significantly affected by pH within the range of 4 to 8. The acid hydrochar, which exhibited the highest removal capacity among the evaluated adsorbents, presented adsorption capacities of 18.05, 10.83, and 5.05 µg g−1 for atrazine, ametryn, and metribuzin, respectively. These values correspond to removal efficiencies of approximately 62%, 72%, and 52% at initial concentrations of 0.33, 0.25, and 0.15 mg L−1. The adsorption equilibrium time varied among the herbicides, reaching 4 h for atrazine and ametryn and 5 h for metribuzin. The adsorption dynamics between the adsorbents and adsorbates were best described by the pseudo-second-order kinetic model for ametryn and metribuzin, while atrazine had a higher correlation with the Elovich equation. The Weber–Morris model did not adequately describe the adsorption process. Among the isotherms tested, the Freundlich model provided the best fit for all three herbicides. The desorption rates of the acid hydrochar were 51%, 13%, and 83% for atrazine, ametryn, and metribuzin, respectively. Therefore, hydrochar derived from passion fruit residues represents a promising alternative for the remediation of triazine herbicides.

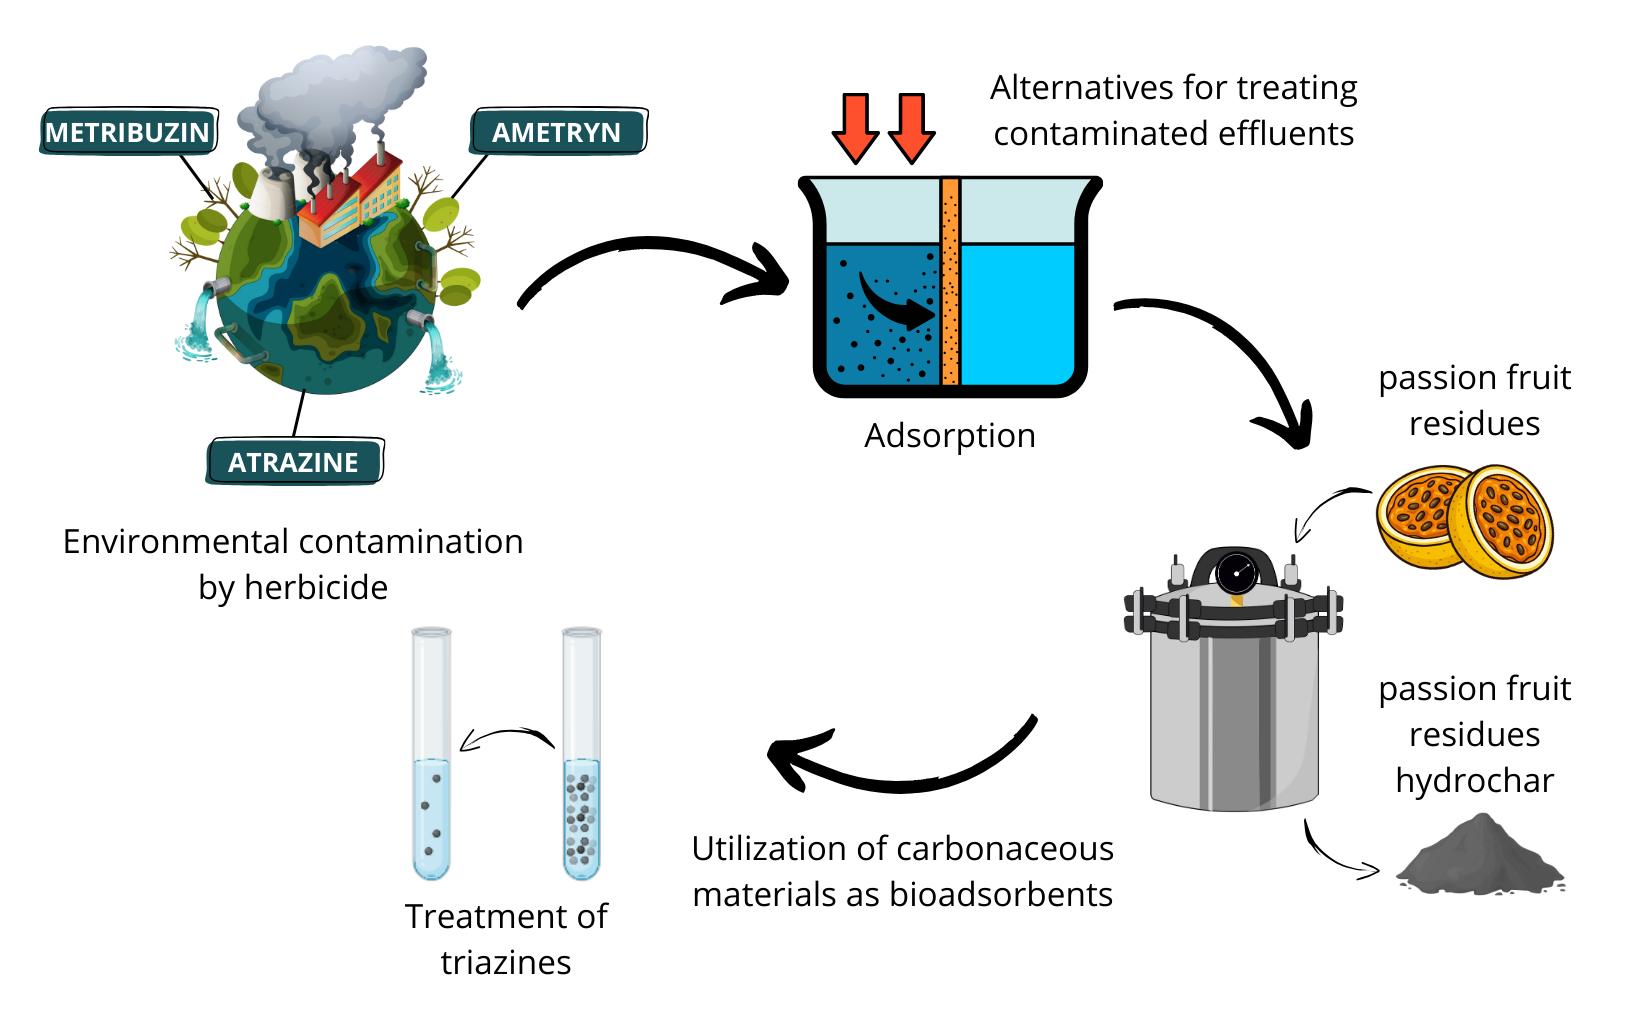
Graphical Abstract

1. Introduction

The application of agricultural pesticides, particularly herbicides, is essential for crop management, as it mitigates the adverse effects of weed infestation on agricultural productivity. Nevertheless, the intensive and widespread use of herbicides raises significant environmental concerns, given their persistence, mobility, and potential ecotoxicological impacts on non-target organisms and surrounding ecosystems [1,2]. After application, it is estimated that no more than 30% of the applied herbicides effectively reach the intended target, whereas approximately 70% are dispersed into the surrounding environment. Once released into the soil, these compounds undergo processes of retention, transport, and transformation, whose intensity and dynamics critically govern their mobility, bioavailability, and consequent potential for environmental contamination. The extent of the environmental impacts induced by herbicides is governed by the intrinsic physicochemical properties of the compounds, the pedological attributes of the soil, and the prevailing environmental conditions, which collectively dictate their persistence, mobility, and interaction with the surrounding matrix [3].
Triazines constitute a widely used class of pesticides, primarily applied for pre- and post-emergence weed control in major agricultural crops such as sorghum, maize, and sugarcane [4,5]. Triazines exert their herbicidal activity by inhibiting photosystem II, specifically disrupting the electron transport chain during the photochemical phase of photosynthesis, thereby impairing energy conversion and leading to growth suppression in susceptible weed species [6]. Herbicides within this class exhibit pronounced chemical stability due to the triazine ring structure, which underpins their environmental persistence, characterized by long residual activity, low volatility, and resistance to biodegradation [7]. As a result, triazine herbicides have been consistently detected across diverse environmental compartments, as well as in various non-target organisms, highlighting their persistence and potential for bioaccumulation.
Studies conducted in different regions of Brazil have demonstrated that agricultural practices are a major contributor to the contamination of both surface and groundwater bodies by triazine compounds residues of triazine herbicides, in addition to agricultural applications, triazine herbicides may enter the environment through urban weed control, infrastructure maintenance, improper disposal, industrial effluents, transport-related leaks, atmospheric drift, and leaching from historically contaminated sites. Residues of triazine have been detected in water samples from different Brazilian regions, with concentrations reported in Ceará (15 µg L−1), Rio Grande do Sul (0.42–0.82 µg L−1), Tocantins (0.286 µg L−1), and Mato Grosso do Sul (0.68–0.70 µg L−1) [8,9,10]. In addition to the reported occurrences in Brazilian freshwaters, triazine residues have been widely detected in other environmental compartments, including soils, sediments, and biota [11]. These findings are of significant concern and underscore the urgent need to develop effective remediation strategies, as the presence of triazine herbicides in aquatic environments can elicit both acute and chronic toxic effects on non-target organisms, potentially disrupting ecosystem functions and biodiversity [12,13].
Given the recurrent detection of triazine herbicides in water resources, there has been an increasing focus within the scientific community on developing efficient strategies for their removal. In this context, adsorption has emerged as a promising strategy for the removal of contaminants from water, owing to its high efficiency, operational simplicity, and favorable cost-effectiveness [14,15]. As a surface-driven phenomenon, the efficiency of the adsorption process is strongly influenced by the physicochemical properties of both the adsorbent and the adsorbate, including surface area, porosity, adsorbate size, functional groups, and chemical affinity. A wide range of materials, including naturally occurring minerals, agro-industrial residues, and synthetic compounds, has been investigated as potential adsorbents for the removal of environmental contaminants [16].
Activated carbons, including those derived from agricultural and industrial wastes, exhibit high adsorption capacities for phenoxyacetic herbicides (e.g., 2,4-D and MCPA), often comparable to or even exceeding those of commercial carbons, due to their well-developed surface area and suitable pore structure. Biochar, produced via biomass pyrolysis, has emerged as a sustainable alternative to activated carbon, frequently achieving pesticide and organic contaminant removal efficiencies above 90% under optimized conditions, while offering advantages such as lower energy demand and the valorization of agro-industrial residues [17,18].
Recent reviews also emphasize the potential of low-cost biosorbents, including lignocellulosic materials, animal-derived wastes, ash, and clays, which, after simple modifications, can achieve average removal efficiencies of 90–95% for organic contaminants, including pesticides. In addition to their performance, these materials contribute to circular economy strategies and reduce reliance on fossil-based adsorbents [19,20].
Furthermore, modified biochars—obtained through metal impregnation, acid or base activation, or incorporation into matrices such as alginate—can significantly enhance affinity toward herbicides and insecticides. These materials have demonstrated superior adsorption capacities for compounds such as imidacloprid, atrazine, carbendazim, linuron, and chlorpyrifos, with typical removal efficiencies ranging from 90 to 98% in both batch and column systems [20,21,22].
The application of carbonaceous materials has gained considerable attention for contaminant removal, owing to their high adsorption efficiency, cost-effectiveness, and potential to valorize agro-industrial or biomass residues. The production of carbonaceous materials can occur through two main processes: pyrolysis, using dry biomass, and hydrothermal processes, which employ wet biomass. The resulting products receive distinct nomenclature in the literature: materials obtained through hydrothermal routes are widely known as hydrochar, whereas those produced via pyrolysis are referred to as biochar [23,24,25,26].
Hydrochars are carbonaceous materials synthesized via hydrothermal carbonization of organic wastes originating from diverse sources, including agro-industrial residues, municipal solid waste, food scraps, and animal by-products, among others [27,28]. Hydrochars are rich in surface functional groups (e.g., –OH, –COOH), which enhance their affinity for contaminant adsorption. Their porosity can be tailored by adjusting production parameters such as residence time, temperature, and pH. Another relevant factor is the chemical activation of carbonaceous materials. Significant improvements in properties such as porosity and surface area are commonly observed when these materials are treated with activating agents such as KOH, H3PO4, NaOH, and other chemical solutions. Additionally, hydrochars exhibit high chemical stability, resistance to microbial degradation, and economic viability, as they can be produced from low-cost or otherwise undervalued organic wastes, aligning with principles of the circular economy [29,30].
In light of the pressing need to develop accessible and efficient technologies for the removal of specific water contaminants, thereby contributing to the attainment of the Sustainable Development Goals, this study aimed to evaluate the performance of a passion fruit peel-derived hydrochar for the adsorption of the herbicides atrazine, ametryn, and metribuzin from aqueous solutions.

2. Materials and Methods

2.1. Study Location and Reagents

The experiment was conducted at the Weed Management Laboratory within the Department of Agricultural and Forestry Sciences at the Federal Rural University of the Semi-Arid Region. Analytical-grade chemical reagents were employed, and high-performance liquid chromatography (HPLC) was used for herbicide quantification. Standards of atrazine, ametryn, and metribuzin (≥95% purity) were obtained from Sigma-Aldrich® (St. Louis, MO, USA). The phosphoric acid (85%), sodium hydroxide (98%), sodium chloride, and hydrochloric acid (37%) were sought from Dinâmica Química Contemporânea LTDA® (Indaiatuba, Brazil), while acetonitrile (≥99% purity) was obtained from Sigma-Aldrich®.
Stock solutions of atrazine, ametryn, and metribuzin (500 mg L−1) were prepared in acetonitrile and stored in amber glass bottles at −18 °C under refrigeration. The working solutions were subsequently prepared by successive dilutions of the stock solutions at room temperature (25 ± 2 °C), yielding final concentrations of 0.33, 0.25, and 0.15 mg L−1 for atrazine, ametryn, and metribuzin, respectively. These concentrations correspond to 100% of the field application dose recommended in the product label.

2.2. Chromatographic and Mass Spectrometry Conditions

Quantification of atrazine, ametryn, and metribuzin was carried out using ultra-high-performance liquid chromatography (UHPLC) coupled with a triple quadrupole mass spectrometer (LC–MS/MS), employing a Shimadzu UHPLC LCMS-8040 system (Tokyo, Japan). The UHPLC system was equipped with a Restek Pinnacle DB AQ C18 column (Tokyo, Japan) (50 × 2.1 mm, 1.9 μm particle size), two LC-30AD (Tokyo, Japan) pumps, a DGU-20A5R degasser (Tokyo, Japan), a SIL-30AC (Tokyo, Japan) autosampler, a CTO-30AC column (Tokyo, Japan) oven, and a CBM-20A controller (Tokyo, Japan).
The chromatographic system was operated in isocratic elution mode containing 70% B, with a flow rate of 0.15 mL min−1, an injection volume of 5 μL, and the autosampler temperature maintained at 15 °C. The mobile phase consisted of (A) UHPLC-grade water with 0.1% formic acid and (B) UHPLC-grade acetonitrile. The column oven temperature was maintained at 40 °C.
The electrospray ionization (ESI) source was operated in positive ion mode, and quantification was performed using multiple reaction monitoring (MRM). The optimized MRM transitions and corresponding instrumental parameters are summarized in Table 1. The interface voltage was set to 4.5 kV, with a desolvation line temperature of 250 °C and a block temperature of 400 °C. Nitrogen was used as both the nebulizing gas (3 L min−1) and the drying gas (15 L min−1). Argon was employed as the collision gas at a pressure of 230 kPa.

2.3. Preparation of Hydrochars

Passion fruit residues were collected at the Centro de Abastecimeto Prefeito Raimundo Soares, located in the municipality of Mossoró, Rio Grande do Norte, Brazil. The epicarp and mesocarp of passion fruit were dried in an air-circulating oven (Model TE-394/3, Tecnal, São Paulo, Brazil) at 65 °C for 24 h. After drying, the passion fruit residue biomass (CB) was ground using a knife mill (particle diameter of 200–250 µm) and subsequently homogenized. The biomass was added to a 0.5 mol L−1 phosphoric acid (H3PO4) solution at a ratio of 1:10 (g:mL). The choice of phosphoric acid at a concentration of 0.5 mol L−1 was based on previous studies as well as on values reported in the literature. The mixture was stirred for 5 h at a controlled temperature of 25 ± 2 °C. After the impregnation period, the acid-treated biomass (CBA) was filtered and carefully washed with distilled water until it reached approximately neutrality (pH ≈ 7 ± 0.2), followed by drying in an air-circulating oven at 105 °C for 24 h. After drying, the material was ground and homogenized once again.
To produce hydrochar, the biomass from passion fruit residue (CB) was mixed with a single liquid phase in a ratio of 1:10 (g:mL), where the liquid medium was phosphoric acid (H3PO4) 0.5 mol L−1 (based on previous studies as well as on values reported in the literature) and distilled water (H2O). The suspension (biomass and liquid phase) was subjected to hydrothermal treatment in a digital vertical autoclave (Model CS-A, Prismatec, São Paulo, Brazil) at 126 °C for 5 h, at a heating rate of 5 °C m−1. After the residence time, the suspensions were maintained in sealed Erlenmeyer flasks, allowed to cool to room temperature (25 ± 2 °C) in a ventilated system, and subsequently separated from the liquid phase by filtration, and washed with distilled water until it reached approximately neutrality (pH ≈ 7 ± 0.2), and dried in an air-circulating oven at 105 °C for 24 h. After drying, the hydrochar materials were ground and homogenized once more to ensure uniform particle size.
The materials produced and evaluated in this study included: passion fruit residue biomass (CB), biomass chemically pre-treated with phosphoric acid 0.5 mol L−1 (CBA), hydrochar derived from passion fruit residue in water (H), and hydrochar derived from passion fruit residue chemically activated with phosphoric acid 0.5 mol L−1 (HA).

2.4. Characterization of Adsorbents

2.4.1. Point of Zero Charge (PZC)

The point of zero charge (pHpzc) of the biomass and hydrochar materials was determined using a modified version of the methodology described by [31]. The experiment was conducted using a 1000 mL stock solution of 0.05 mol L−1 NaCl. Subsequently, 100 mL aliquots of the stock solution were transferred to beakers, and the pH of each solution was adjusted using NaOH and HCl, both at 0.1 mol L−1. The experiments were conducted over an initial pH (pHi) range of 2 to 10. Next, 30 mL of the 0.05 mol L−1 NaCl solution, adjusted to the desired pH, was added to Falcon tubes containing 200 mg of each adsorbent. The suspensions were maintained under continuous stirring for 48 h at 25 ± 2 °C, followed by centrifugation at 3600 rpm for 5 min. The final pH (pHf) of the supernatant was then measured using a pH meter (Mpa-210, Tecnopon, Piracicaba, São Paulo, Brazil). All analyses were performed in triplicate. The point of zero charge (pHpzc) was determined as the pHi value at which the ΔpH (pHf–pHi) versus pHi curve intersects the horizontal axis [32].

2.4.2. Thermogravimetric Analysis (TGA)

The thermal stability of the biomass and hydrochars was evaluated by thermogravimetric analysis (TGA) using a simultaneous thermal analyzer (NETZSCH, STA 449 F3 Jupiter®, Selb, Germany). Measurements were carried out under a continuous nitrogen flow of 60 mL min−1, with a heating rate of 10 °C min−1 over a temperature range of 30–800 °C. Derivative thermogravimetry (DTG) curves were also obtained from the TGA data.

2.4.3. Fourier Transform Attenuated Total Reflectance (FTIR-ATR)

Fourier transform infrared spectroscopy (FTIR) was employed to assess changes in the functional groups of the adsorbents before and after treatment with phosphoric acid 0.5 mol L−1. The FTIR spectra of the produced adsorbents were recorded using a Frontier FT-NIR/MIR spectrometer (PerkinElmer, Waltham, MA, USA) equipped with an attenuated total reflectance (ATR) accessory featuring a zinc selenide (ZnSe) crystal. The spectra were acquired by averaging four scans at a resolution of 4 cm−1, over a wavenumber range of 700–4000 cm−1.

2.4.4. Scanning Electron Microscopy (SEM)

Scanning electron microscopy (SEM) was employed to investigate the surface morphology of the passion fruit residue-based adsorbents. Scanning electron microscopy (SEM) analysis was performed using a TESCAN VEGA 3 instrument (Brno, Czech Republic), operated at an accelerating voltage of 20 kV and a magnification of 1000×. The bioadsorbents were mounted on aluminum stubs using conductive carbon adhesive tabs (PELCO Tabs™, Ted Pella, Inc., Redding, CA, USA) and sputter-coated with a 9 nm gold layer using a Q150R vacuum metalizer (Quorum Technologies Ltd., Laughton, East Sussex, UK) for 5 min at 20 mA.

2.4.5. Elementary Analysis

The percentage of carbon, hydrogen, and nitrogen in the passion fruit residue biomass (CB), biomass pre-treated with phosphoric acid 0.5 mol L−1 (CBA), hydrochar derived from passion fruit residue in water (H), and hydrochar derived from passion fruit residue pre-treated with phosphoric acid 0.5 mol L−1 (HA) was determined using an elemental analyzer (LECO, TruSpec® Micro model, St. Joseph, MI, USA).

2.5. Maximum Adsorption Capacity

Before evaluating the application of passion fruit residue biomass (CB), biomass chemically pre-treated with phosphoric acid 0.5 mol L−1 (CBA), hydrochar derived from passion fruit residue in water (H), and hydrochar derived from passion fruit residue pre-treated with phosphoric acid, preliminary tests were conducted to assess their performance against atrazine, ametryn, and metribuzin solutions, to select the most suitable materials for subsequent studies. Adsorption experiments were conducted in triplicate using the batch contact method.
For this experiment, 25, 50, 100, 150, and 200 mg of each bioadsorbent were weighed into 50 mL Falcon tubes and brought into contact with 10 mL of the working solutions described in Section 2.1. To determine the maximum adsorption capacity, the bioadsorbents were kept in contact with the solutions for 24 h in a vertical shaker (Tecnal®, Piracicaba, São Paulo, Brazil), allowing the system to reach equilibrium. After this period, the tubes were centrifuged at 3600 rpm for 5 min. Subsequently, a 1 mL aliquot of the supernatant was collected and filtered through a 0.22 µm nylon membrane into 1.5 mL vials. The residual concentrations of the herbicides in the solutions were quantified by mass spectrometry. The amount of herbicide adsorbed, corresponding to the percentage removal of atrazine, ametryn, and metribuzin by the adsorbents, was calculated using Equation (1). The experiment was conducted in triplicate.
q = C o C e V m
where q is the adsorption capacity of the adsorbent (mg g−1), Co is the initial concentration (mg L−1), Ce is the equilibrium concentration (mg L−1), V is the solution volume (L) e m is the mass of the adsorbent (g).

2.6. Kinetic Study

To elucidate the kinetic processes governing herbicide adsorption onto the adsorbent materials, the Pseudo-First-order (PFO), Pseudo-Second-order (PSO), Elovich, and Intraparticle Diffusion models were applied to identify the best fit for the experimental data and to estimate the adsorption rate. The equilibrium kinetic study of atrazine, ametryn, and metribuzin in aqueous solution was conducted in triplicate at 25 ± 2 °C. A 10 mL aliquot of each herbicide solution, at the concentrations specified in Section 2.1, was added to 50 mL Falcon tubes containing the optimal mass of the bioadsorbent that exhibited the highest performance in the maximum adsorption capacity tests. Ten time intervals were evaluated: 10, 20, 30, 60, 90, 120, 240, 360, 480, and 720 min. After each time interval, the samples were centrifuged at 3600 rpm for 5 min. Subsequently, a 1 mL aliquot of the supernatant was collected and filtered through a 0.22 µm nylon membrane into 1.5 mL vials. The residual concentrations of the herbicides in the solutions were quantified using mass spectrometry. The amount of herbicide adsorbed, corresponding to the removal of atrazine, ametryn, and metribuzin by the adsorbent, was calculated using Equation (1).
The experimental data were fitted to the Pseudo-First-order (Equation (2)), Pseudo-Second-order (Equation (3)), Elovich (Equation (4)), and Intraparticle Diffusion (Equation (5)) models, as summarized in Table 2.

2.7. Adsorption and Desorption Equilibrium

The interaction mechanism between the adsorbent system (biomass and hydrochar) and the adsorbates (triazines) at equilibrium was evaluated using two adsorption isotherm models, based on experiments conducted in aqueous solutions at 25 ± 2 °C. The Freundlich and Langmuir isotherm equations were applied to determine the best fit for the experimental data. The correlation coefficient (R2) and Akaike information criterion (AICc) values were used as criteria for model selection, indicating that the models with the highest predictive accuracy are those with the highest R2 and lowest AICc values.
The sorption study of triazines was conducted in triplicate using the adsorbents selected in the maximum adsorption capacity test (Section 2.5), with the optimal adsorbent mass determined in that experiment. The tests were conducted using five concentration levels of the working solutions (Section 2.1): 6.25, 12.5, 25, 50, and 100%. The adsorbents were placed in 50 mL Falcon tubes containing 10 mL of the atrazine, ametryn, and metribuzin solutions at their respective concentrations (0.33, 0.25, and 0.15 mg L−1) and maintained for the contact times established in the adsorption kinetics test, at 25 ± 2 °C. Subsequently, the samples were centrifuged at 3600 rpm for 5 min, and a 1 mL aliquot of the supernatant was filtered through a 0.22 µm nylon membrane into 1.5 mL vials. The residual concentrations of herbicides in the solutions were quantified by mass spectrometry. The amount of herbicide adsorbed, corresponding to the removal of atrazine, ametryn, and metribuzin by the adsorbent, was calculated using Equation (1).
The experimental data were fitted to the Freundlich (Equation (6)) and Langmuir (Equation (7)) isotherm models, as summarized in Table 3.
The separation factor is as follows:
R L = 1 1 + K L C O
where RL is the separation factor (dimensionless); CO is the initial concentration (mg L−1) and KL is the Langmuir constant (L mg−1).
The desorption tests were conducted using the same experimental units as the sorption experiments. The liquid phase was removed from the Falcon tubes, and 10 mL of herbicide-free ultrapure water was added to assess the desorption of the compounds. The experiment was conducted in triplicate at 25 ± 2 °C, and the bioadsorbents were kept in contact with water for the contact times defined in the adsorption kinetics study. After the designated contact time, the samples were centrifuged at 3600 rpm for 5 min, and a 1 mL aliquot of the supernatant was collected and filtered through a 0.22 µm nylon membrane into 1.5 mL vials. The residual concentrations of herbicides in the solutions were quantified using mass spectrometry. The amount of herbicide adsorbed was calculated using Equation (9).
D e s o r p t i o n ( % ) = Q d Q p s × 100
where Qd is the amount desorbed (mg) and Qps is the amount remaining after desorption (mg).

2.8. Influence of pH on Adsorption

To investigate the adsorption of atrazine, ametryn, and metribuzin at different solution pH values, a standard solution was used as described in Section 2.1. The pH study of triazines in aqueous solutions was performed in triplicate, for each adsorbent, at a temperature of 25 ± 2 °C. Solutions with different pH values (4, 5, 6, 7, and 8) were prepared by adjusting with NaOH or HCl (0.1 mol L−1). A 10 mL volume of each pH-adjusted solution was placed in contact with the optimal adsorbent mass (Section 2.5) in 50 mL Falcon tubes. The suspensions were stirred for the durations established in the adsorption kinetics study. After the designated contact time, the samples were centrifuged at 3600 rpm for 5 min, and a 1 mL aliquot of the supernatant was collected and filtered through a 0.22 µm nylon membrane into 1.5 mL vials. The residual concentrations of herbicides in the solutions were quantified using mass spectrometry. The amount of herbicide adsorbed was calculated using Equation (1).

2.9. Statistical Analysis

The kinetic model and adsorption isotherm parameters were compared using the coefficient of determination (R2) and the corrected Akaike information criterion (AICc) [33]. The kinetic study results were fitted to the Pseudo-first-order, Pseudo-second-order, Elovich, and Intraparticle Diffusion models, while the adsorption data were fitted to the Freundlich and Langmuir isotherm models (OriginLab Corporation®, Northampton, MA, USA). Data on maximum adsorption capacity and the effect of pH on adsorption were subjected to analysis of variance (ANOVA) using Sisvar software (version 5.7). Measurements were compared using Tukey’s test at a significance level of p ≤ 0.05.
Characterization of bioadsorbents, using FTIR-ATR, SEM, TGA, and PCZ, was performed.

3. Results and Discussion

The yield of hydrochar obtained from passion fruit peel was approximately 30% under the experimental conditions employed.

3.1. Characterization of Adsorbents

3.1.1. Point of Zero Charge (pHpzc)

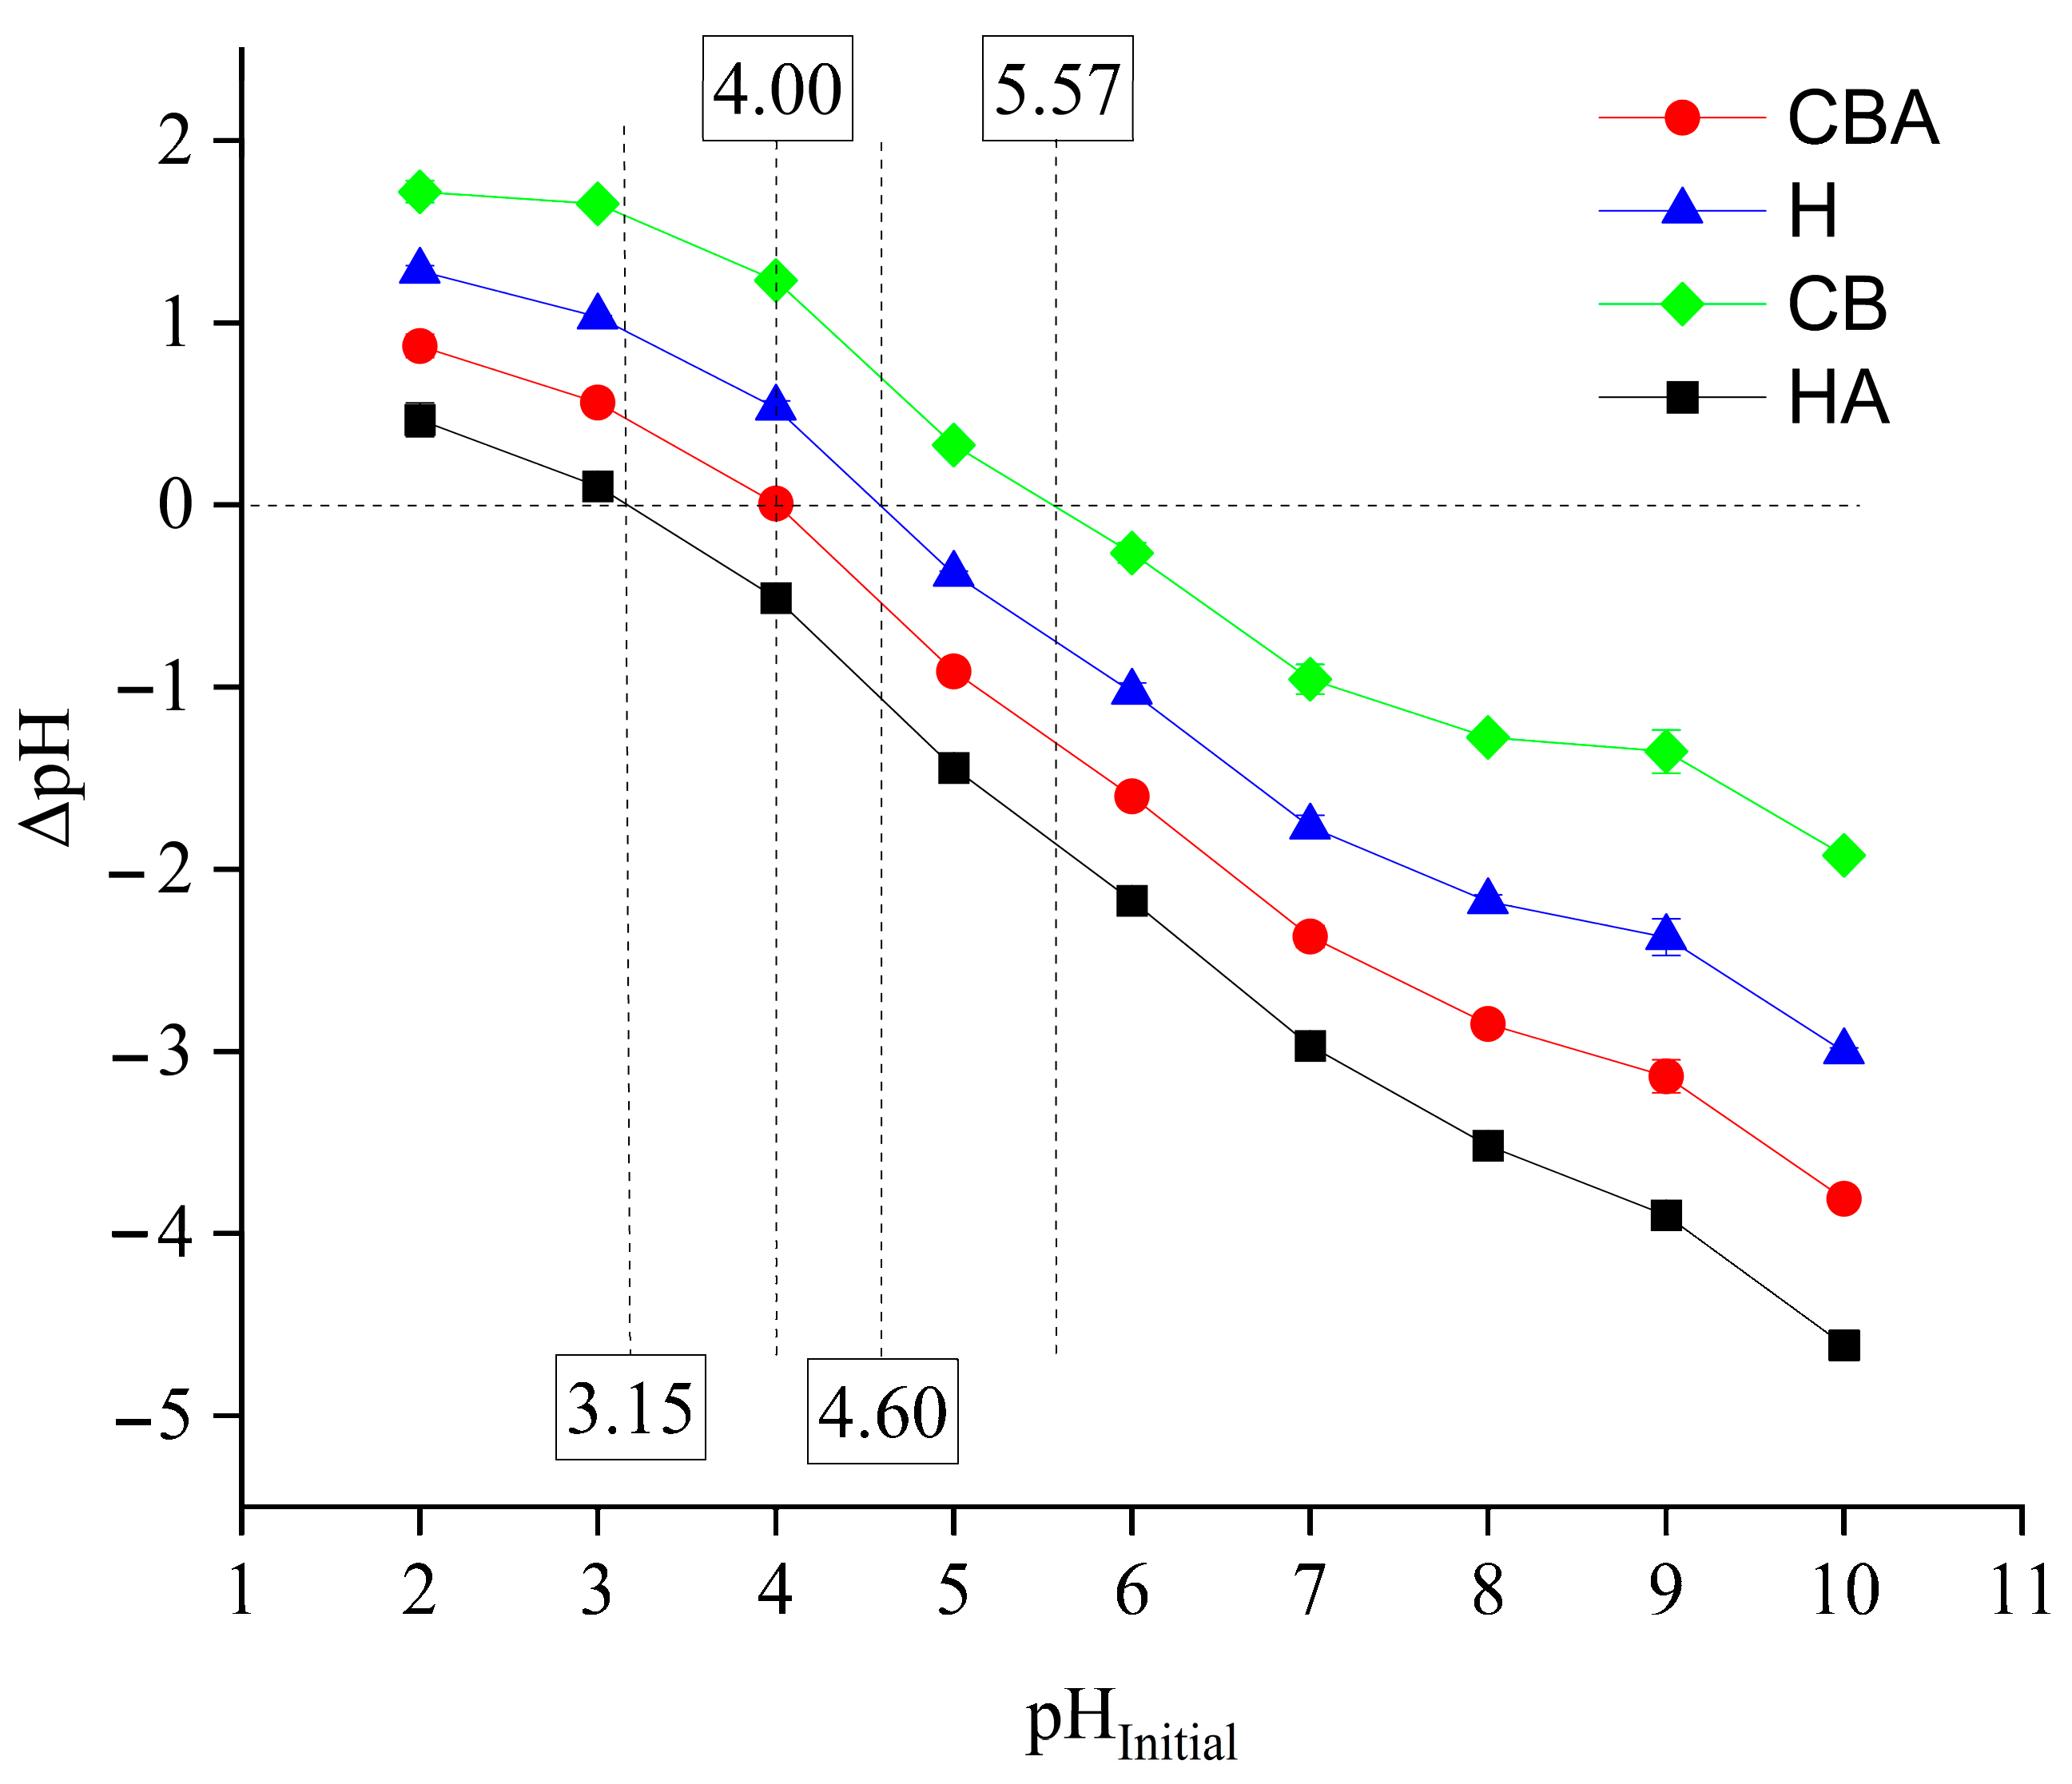
The determination of the point of zero charge (pHpzc) is a crucial parameter in adsorption studies, as it provides fundamental insights into the influence of surface electrical charges on the adsorbent and, consequently, clarifies the role of pH in governing the contaminant adsorption mechanism. Accordingly, the pHpzc was determined for the materials derived from passion fruit residues, namely: passion fruit residue biomass (CB), biomass chemically pre-treated with phosphoric acid 0.5 mol L−1 (CBA), hydrochar derived from passion fruit residue in water (H), and hydrochar derived from passion fruit residue chemically activated with phosphoric acid 0.5 mol L−1 (HA). The results of the pHpzc determination are presented in Figure 1.
The pHpzc of the acidic hydrochar was determined as 3.15. According to [34], the pHpzc reflects the net electrical charge of the material, which arises from both its surface functionalities and pore structure. At pH values below the pHpzc, the adsorbent surface is predominantly positively charged, whereas at pH values above the pHpzc, it acquires a net negative charge. The experiments were conducted at pH ≈ 6, under which the hydrochar surface exhibits a net negative charge, thereby promoting electrostatic interactions with cationic herbicide species. However, at this pH, atrazine and metribuzin predominantly exist in their neutral form, and their adsorption is therefore mainly driven by van der Waals forces and, in particular, by hydrogen bonding due to the presence of oxygen-containing functional groups on the material’s surface. Ametryn, however, remains partially in its cationic form under these conditions, which favors stronger electrostatic interactions with the adsorbent surface.

3.1.2. Thermogravimetric Analysis (TGA)

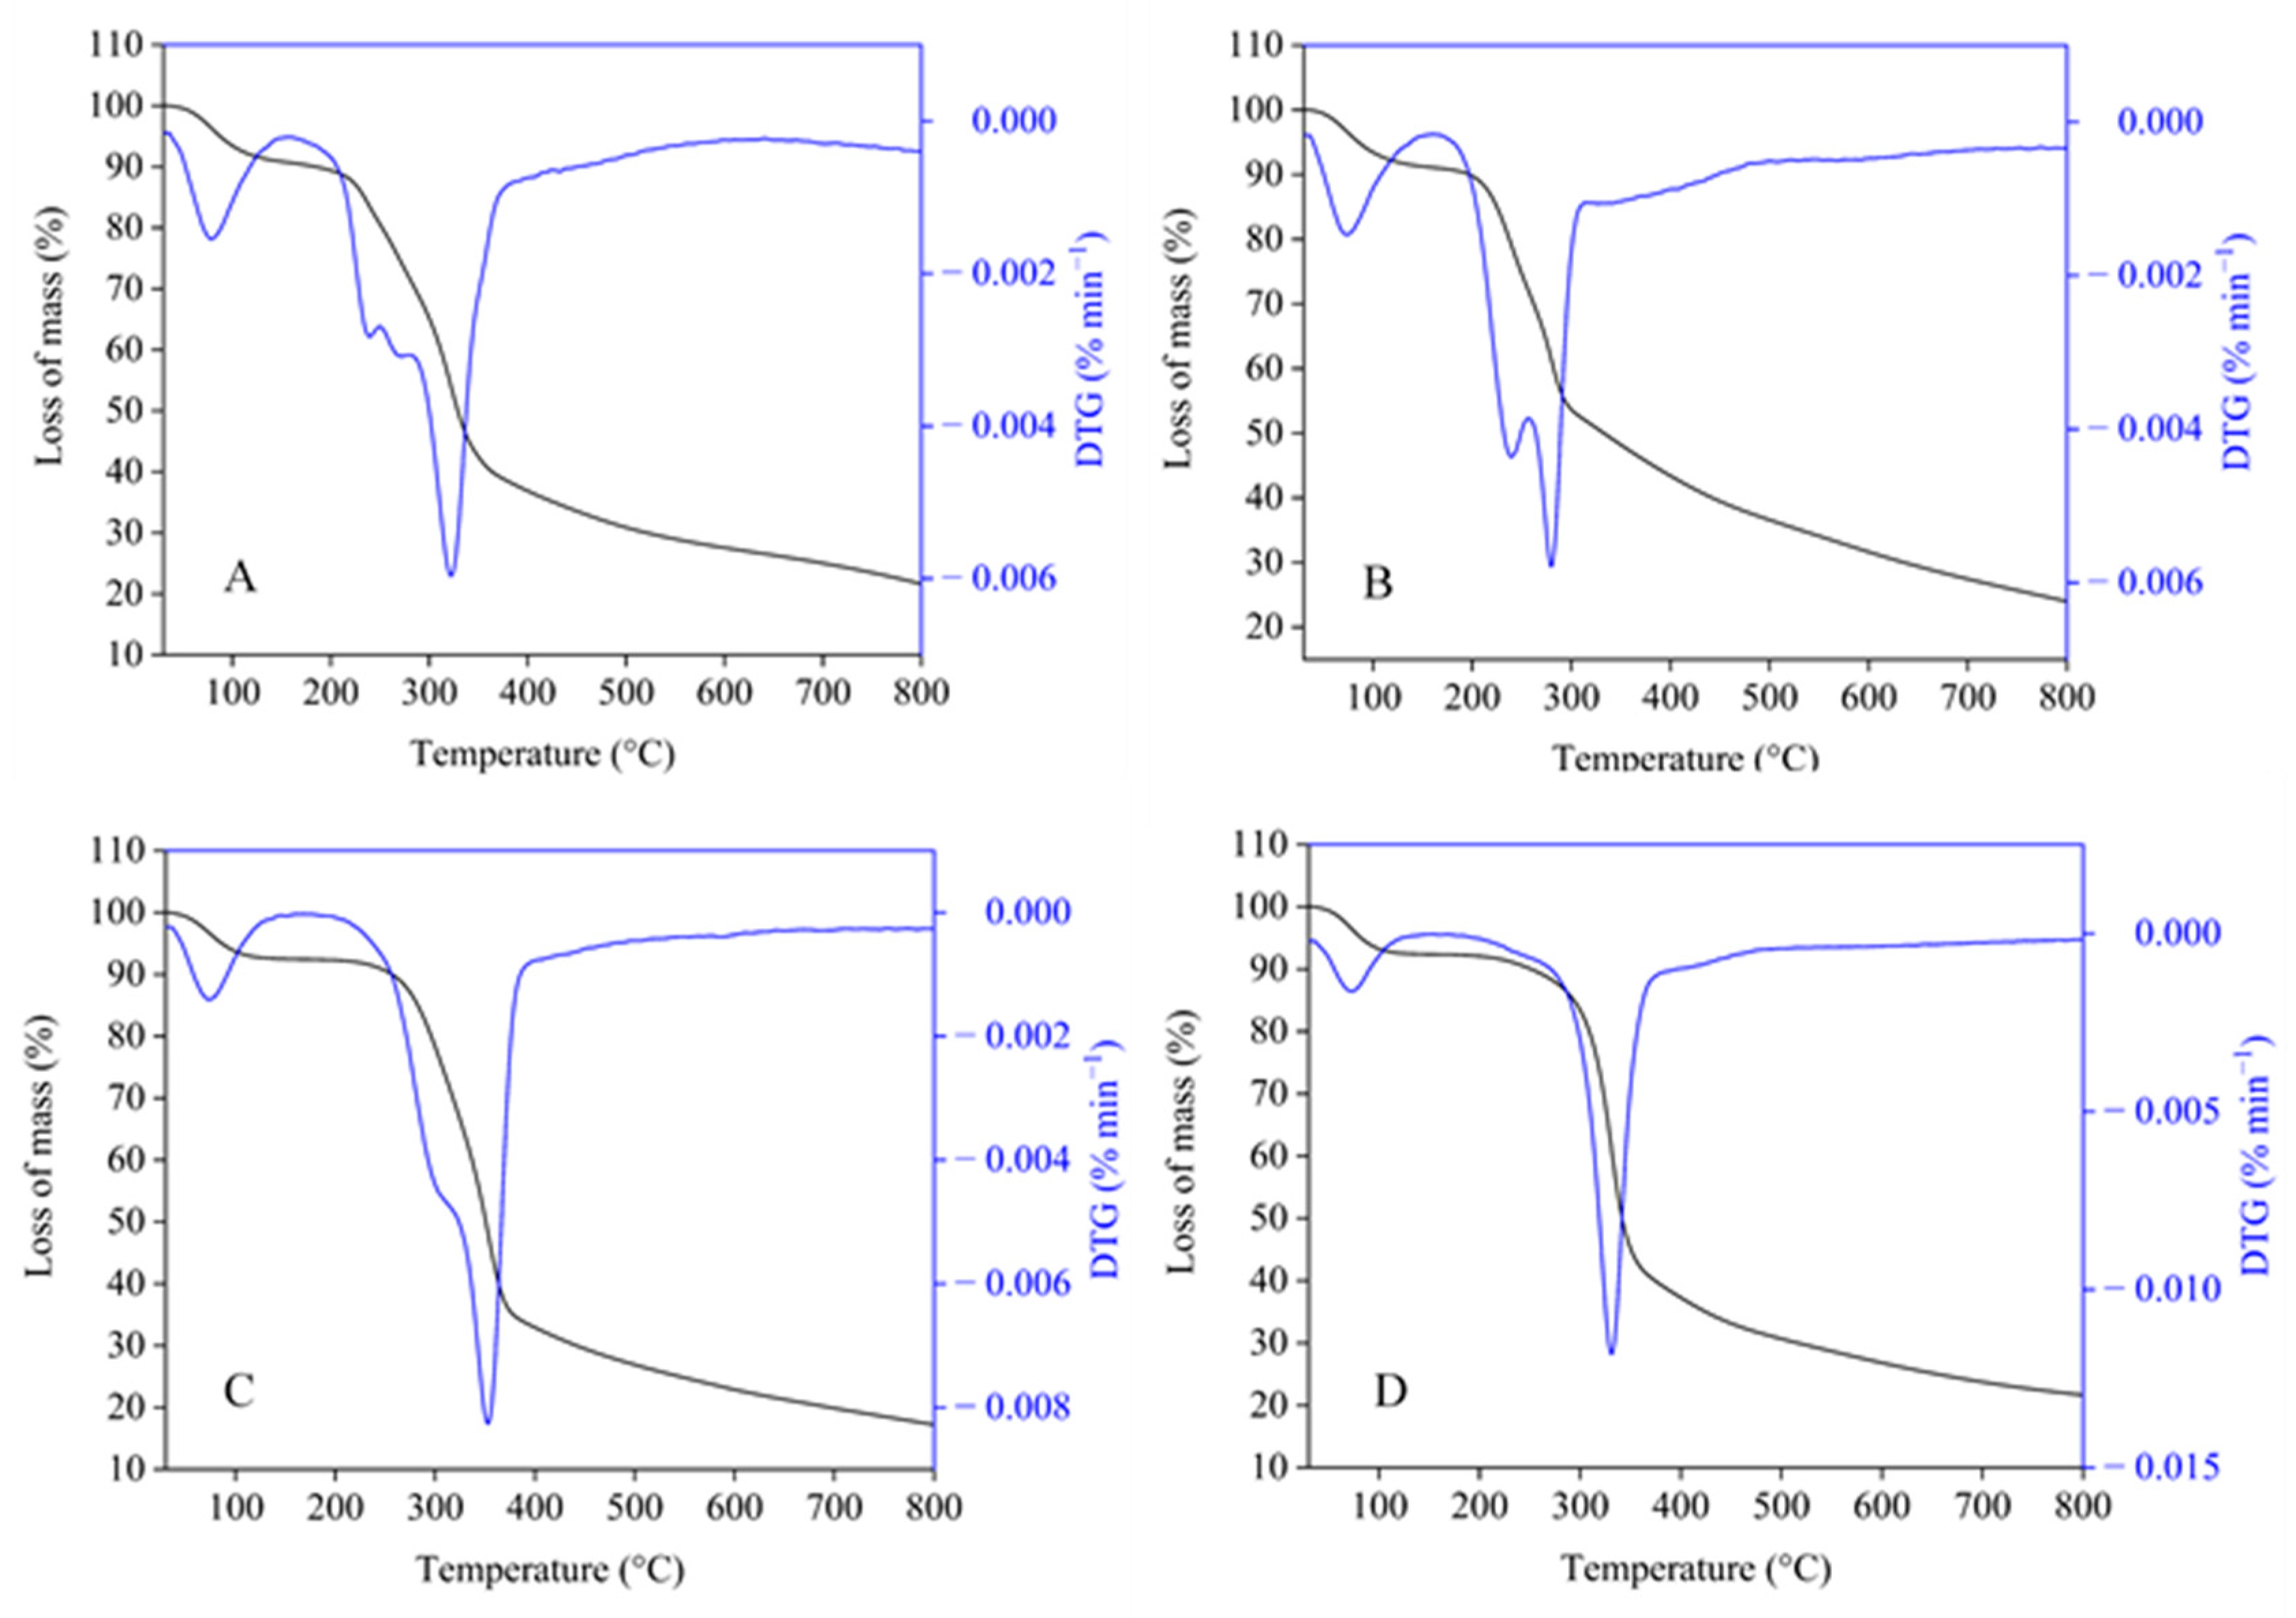
Thermogravimetric analysis (TGA) was conducted to assess the thermal stability of the adsorbents, and the results are presented in Figure 2. The results revealed that the adsorbents exhibited distinct thermal stabilities, characterized by multiple stages of decomposition. In the first degradation stage, mass loss was associated with the evaporation of physically adsorbed water, reaching a maximum of approximately 8% in all materials, at temperatures of 73.3 °C (biomass), 72.6 °C (biomass treated with phosphoric acid), 75.8 °C (hydrochar), and 71.8 °C (hydrochar treated with phosphoric acid).
The second stage, associated with the degradation of polymeric structures such as hemicellulose, lignin, and pectin, exhibited distinct thermal behaviors among the analyzed materials. For the acid-activated hydrochar, a slower degradation profile was observed, with the maximum decomposition occurring at 331 °C, leading to a gradual mass loss of approximately 40% (Figure 2D). Moreover, this material exhibited superior thermal stability relative to fresh biomass (322 °C) and pre-treated biomass (281 °C). The thermal stability of acid-activated hydrochar can be ascribed to structural modifications induced by the combined effects of phosphoric acid activation and hydrothermal treatment. These processes promote crosslinking within the carbonaceous matrix and the development of condensed aromatic structures, which confer greater resistance to thermal degradation [35,36].
In the other materials, the degradation of polysaccharide chains proceeded through successive reactions: two initial stages of slow degradation were followed by a more intense decomposition event (Figure 2A). Chemical modification by acid treatment and the autoclave processing time contributed to the partial removal of labile fractions, such as hemicellulose and pectin, while alterations in lignin during hydrothermal treatment reduced the occurrence of secondary reactions during pyrolysis and thermogravimetric analysis. Therefore, the combination of chemical activation with controlled reaction time and temperature yields a material with a more robust molecular structure and a more predictable thermal degradation profile [37].
The third stage represents the final phase of thermal decomposition, marked by a mass loss between 35% and 42%, depending on the material analyzed. This stage is primarily associated with the oxidation and decomposition of residual functional groups, such as hydroxyl and carbonyl groups, remaining in the aromatic lignin structures, occurring over a temperature range of 500–800 °C. The remaining mass fraction after this stage is attributed to the fixed carbon and ash content of the hydrochar, reflecting the formation of a more stable and refractory carbonaceous matrix [38].

3.1.3. Fourier Transform Attenuated Total Reflectance (FTIR-ATR)

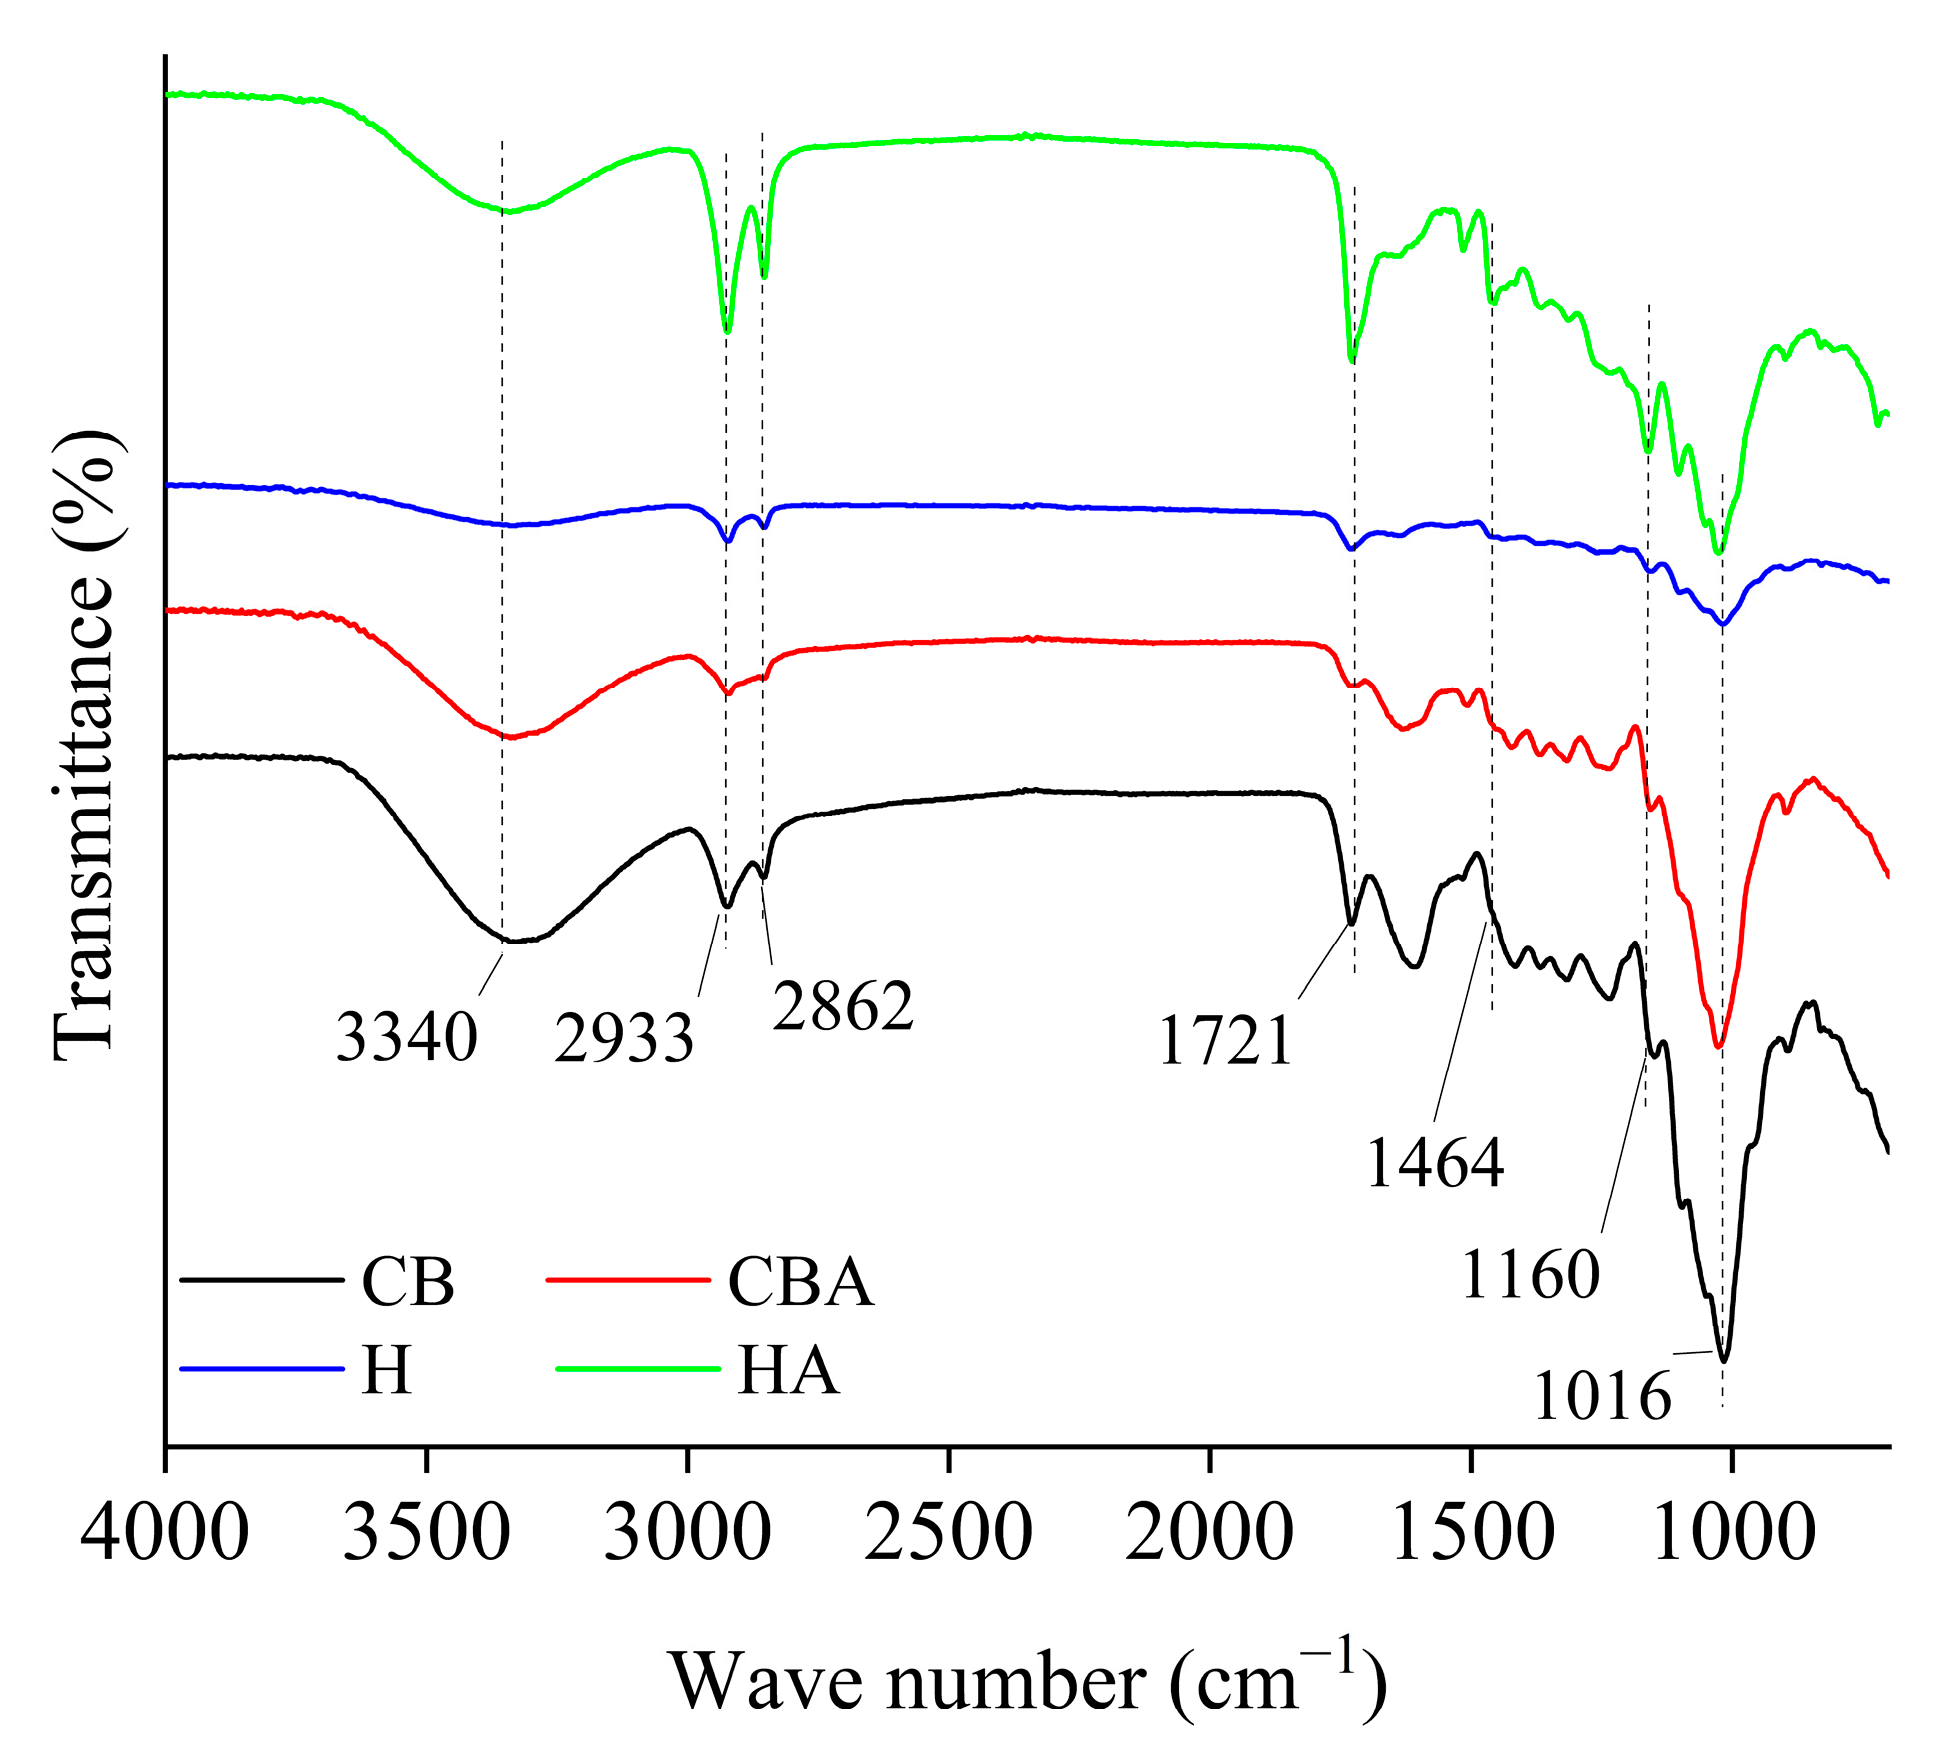
In the FTIR-ATR spectra of CB, CBA, H, and HA (Figure 3), a broad band around 3340 cm−1 was observed, corresponding to the stretching vibrations of hydroxyl groups (–OH), both free and hydrogen-bonded. These hydroxyl groups are present in cellulose, hemicellulose, and lignin, as well as in water adsorbed on the biomass surface. The intensity of this band decreases markedly in the carbonized materials (H and HA), indicating the loss of free and structural –OH groups due to thermal degradation and the formation of condensed aromatic structures promoted by hydrothermal treatment and chemical activation [39,40].
The bands at 2933 and 2862 cm−1 correspond to the asymmetric and symmetric stretching vibrations of methylene (–CH2) and methyl (–CH3) groups, characteristic of the aliphatic chains in cellulose, hemicellulose, and lignin. The progressive decrease in the intensity of these bands in the H and HA treated materials, approximately 5%, indicates the cleavage of aliphatic chains and the transformation of biomass into a less functionalized, aromatic carbonaceous matrix with enhanced thermal stability [41,42].
The peak at 1721 cm−1 corresponds to the C=O stretching vibrations of carbonyl groups, found in esters, ketones, aldehydes, and carboxylic acids. These carbonyl groups are abundant in the structural components of hemicellulose and lignin. The relative increases of 6.6% and 10.2% observed for H and HA, respectively, compared to CB, may indicate carboxylation and an increase in oxygenated functional groups. These changes could be associated with structural modifications in the hydrochar, potentially reflecting a greater degree of condensation and alterations in the surface chemical environment. Surface carbonyl groups enhance adsorption, particularly for atrazine and metribuzin, whose amino groups and heteroatoms can interact with the C=O functionalities [43,44].
The band at 1464 cm−1 corresponds to the bending vibrations of –CH2 and –CH3 groups, primarily associated with lignin side chains and the residual cellulose and hemicellulose fractions. The moderate persistence of this peak in the treated materials indicates that a portion of the aromatic lignin structure remains in the hydrochar, conferring residual structural complexity [40].
The bands at 1160 and 1016 cm−1 correspond to the stretching vibrations of C–O–C (glycosidic ether) and C–O bonds in primary and secondary alcohols, characteristic of cellulose and other polysaccharide structures. The pronounced reduction in these bands observed for H and HA, compared to CB (13.27% and 14.75%, respectively), suggests the cleavage of glycosidic bonds and the partial depolymerization of polysaccharide chains, which are consistent with carbonization and activation processes. These functional groups may contribute to adsorption through hydrogen bonding with polar moieties of herbicides, such as atrazine and metribuzin, as well as through interactions involving C–O functionalities and heteroatom-containing groups [39,43,44].
Spectral comparison among the materials indicates a progressive structural transformation from the native biomass (CB) to a more aromatic and thermally stable matrix in the carbonized materials (H and HA). The elimination of hydroxyl, carbonyl, and C–O groups reflects a substantial reduction in surface polarity and labile fractions, whereas the relative enrichment in aromatic structures imparts enhanced chemical stability to the hydrochar. Acid activation further amplifies these transformations, yielding a surface with increased porosity and tailored functionalities suitable for applications such as adsorption and contaminant removal.

3.1.4. Scanning Electron Microscopy (SEM)

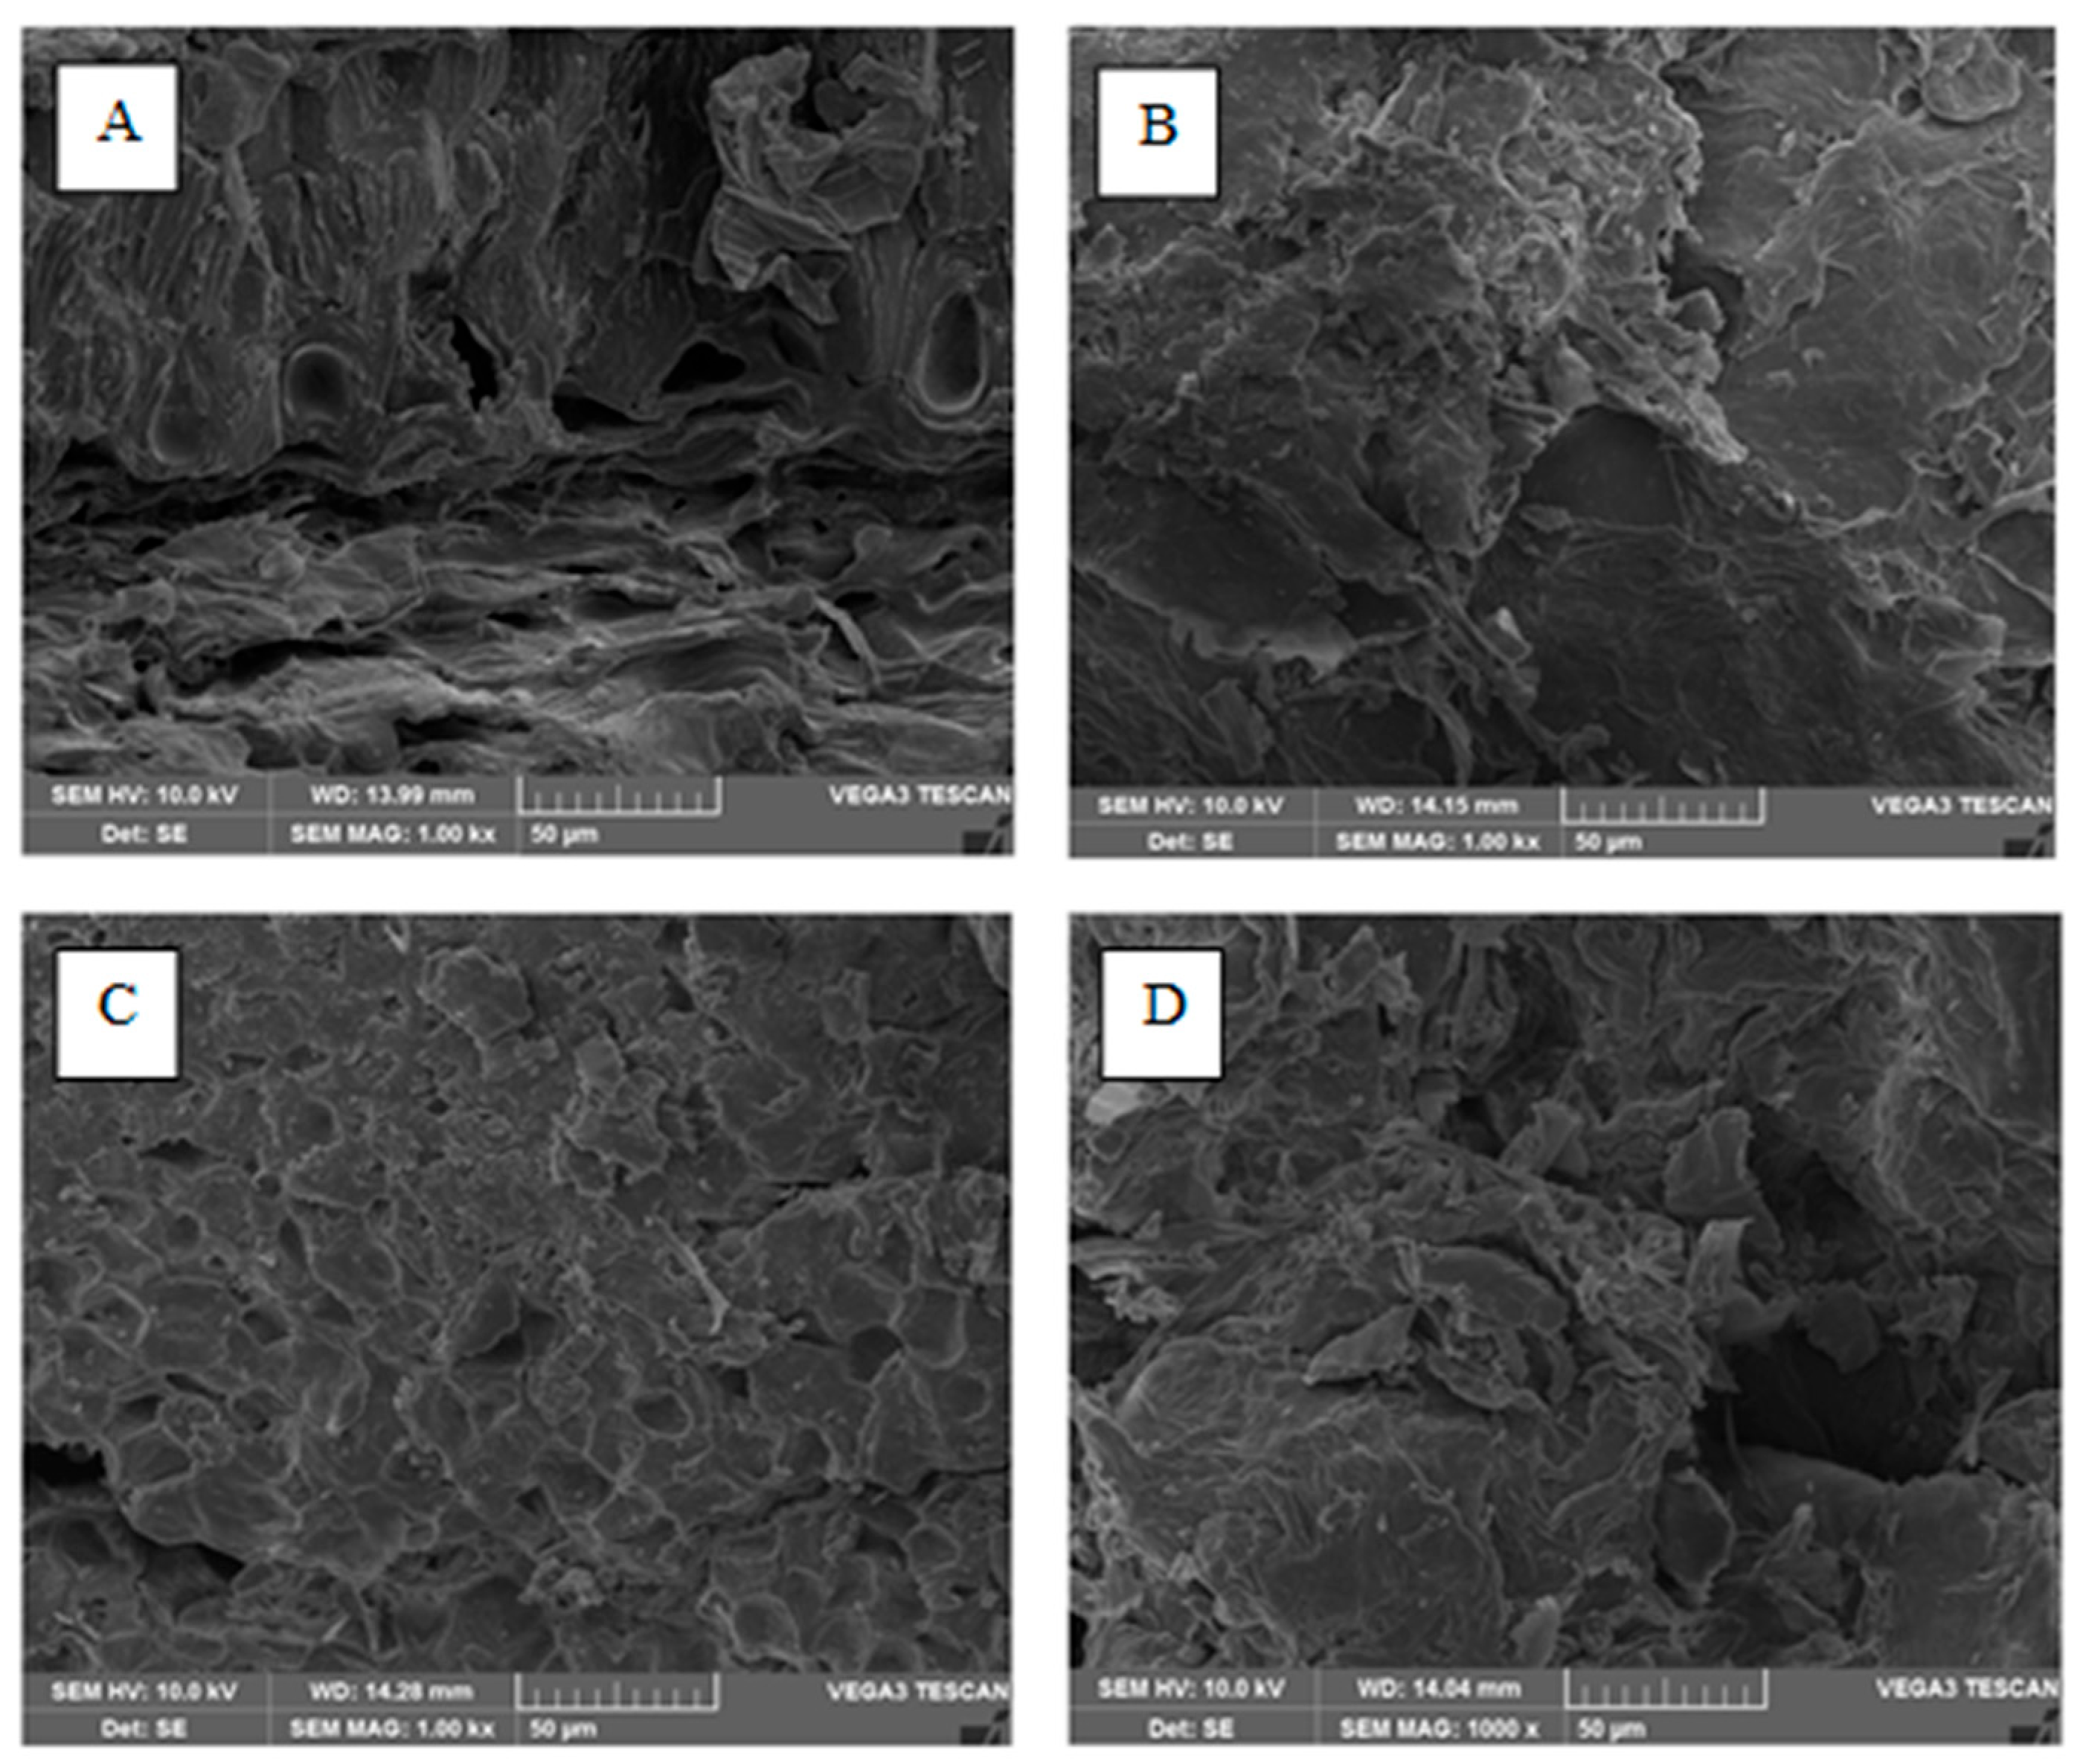
The morphology of the biomass and hydrochar materials, both pristine and phosphoric acid-activated, was examined using scanning electron microscopy (SEM). SEM analysis revealed that the smooth and compact surface of the biomass transformed into a rougher and more exfoliated structure following carbonization, particularly in the acid-activated hydrochar (Figure 4D). This morphological transformation is attributed to the decomposition of pectin and hemicellulose under high-temperature and high-pressure conditions, leading to the collapse of the cellular matrix and the formation of microcracks and irregular fragmentations [45,46].
Recent studies by [47] report that hydrochars derived from various organic residues develop rough and porous surfaces following hydrothermal carbonization, attributed to the breakdown of polymeric components. Similarly, Ref. [48] demonstrated that hydrothermal treatments induce the formation of microcracks and an increase in surface area, reflecting cellular disintegration and exfoliation of the original biomass structure. These findings support the observation that acid-mediated chemical activation, in combination with hydrothermal carbonization, generates a more disordered surface with increased heterogeneity, enhancing porosity and the availability of active sites for adsorption.

3.1.5. Elemental Analysis (CHN)

Elemental analysis (Table 4) revealed an 8.5% increase in carbon content, a 0.12% increase in nitrogen content, and a 1.65% decrease in hydrogen content when comparing the raw biomass to the H3PO4-activated hydrochar. This behavior is characteristic of prolonged hydrothermal carbonization in an autoclave, during which deoxygenation, dehydration, and decarboxylation reactions occur, leading to the release of light volatiles and enrichment in fixed carbon [48,49,50]. The presence of H3PO4 as a fortifying agent further accentuates these transformations, promoting aromatic condensation reactions—although not entirely complete, as indicated by residual hydrogen retention—and enhancing the formation of stable carbonaceous domains [46,47].

3.2. Selection of Adsorbent

The adsorption capacity of the bioadsorbents derived from passion fruit residues exhibited differences among the materials (Table 5). Activation of hydrochar with 0.5 mol L−1 phosphoric acid enhanced the adsorption of the herbicides atrazine, metribuzin, and ametryn by up to 11.17, 24.7, and 20.98 µg g−1, respectively, compared to the least efficient adsorbent. These results indicate that chemical activation improves the efficiency of active sites on the hydrochar surface, thereby enhancing interactions with contaminant molecules.
Therefore, hydrochar activated with 0.5 mol L−1 H3PO4 was selected for the adsorption studies of triazines, as it exhibited the best performance in removing all three evaluated herbicides. According to [51], phosphoric acid promotes the development of micro- and mesopores and introduces oxygen-containing functional groups, such as phosphates, which enhance the hydrophilicity and adsorption capacity of activated carbon.

3.3. Selection of Adsorbent Mass

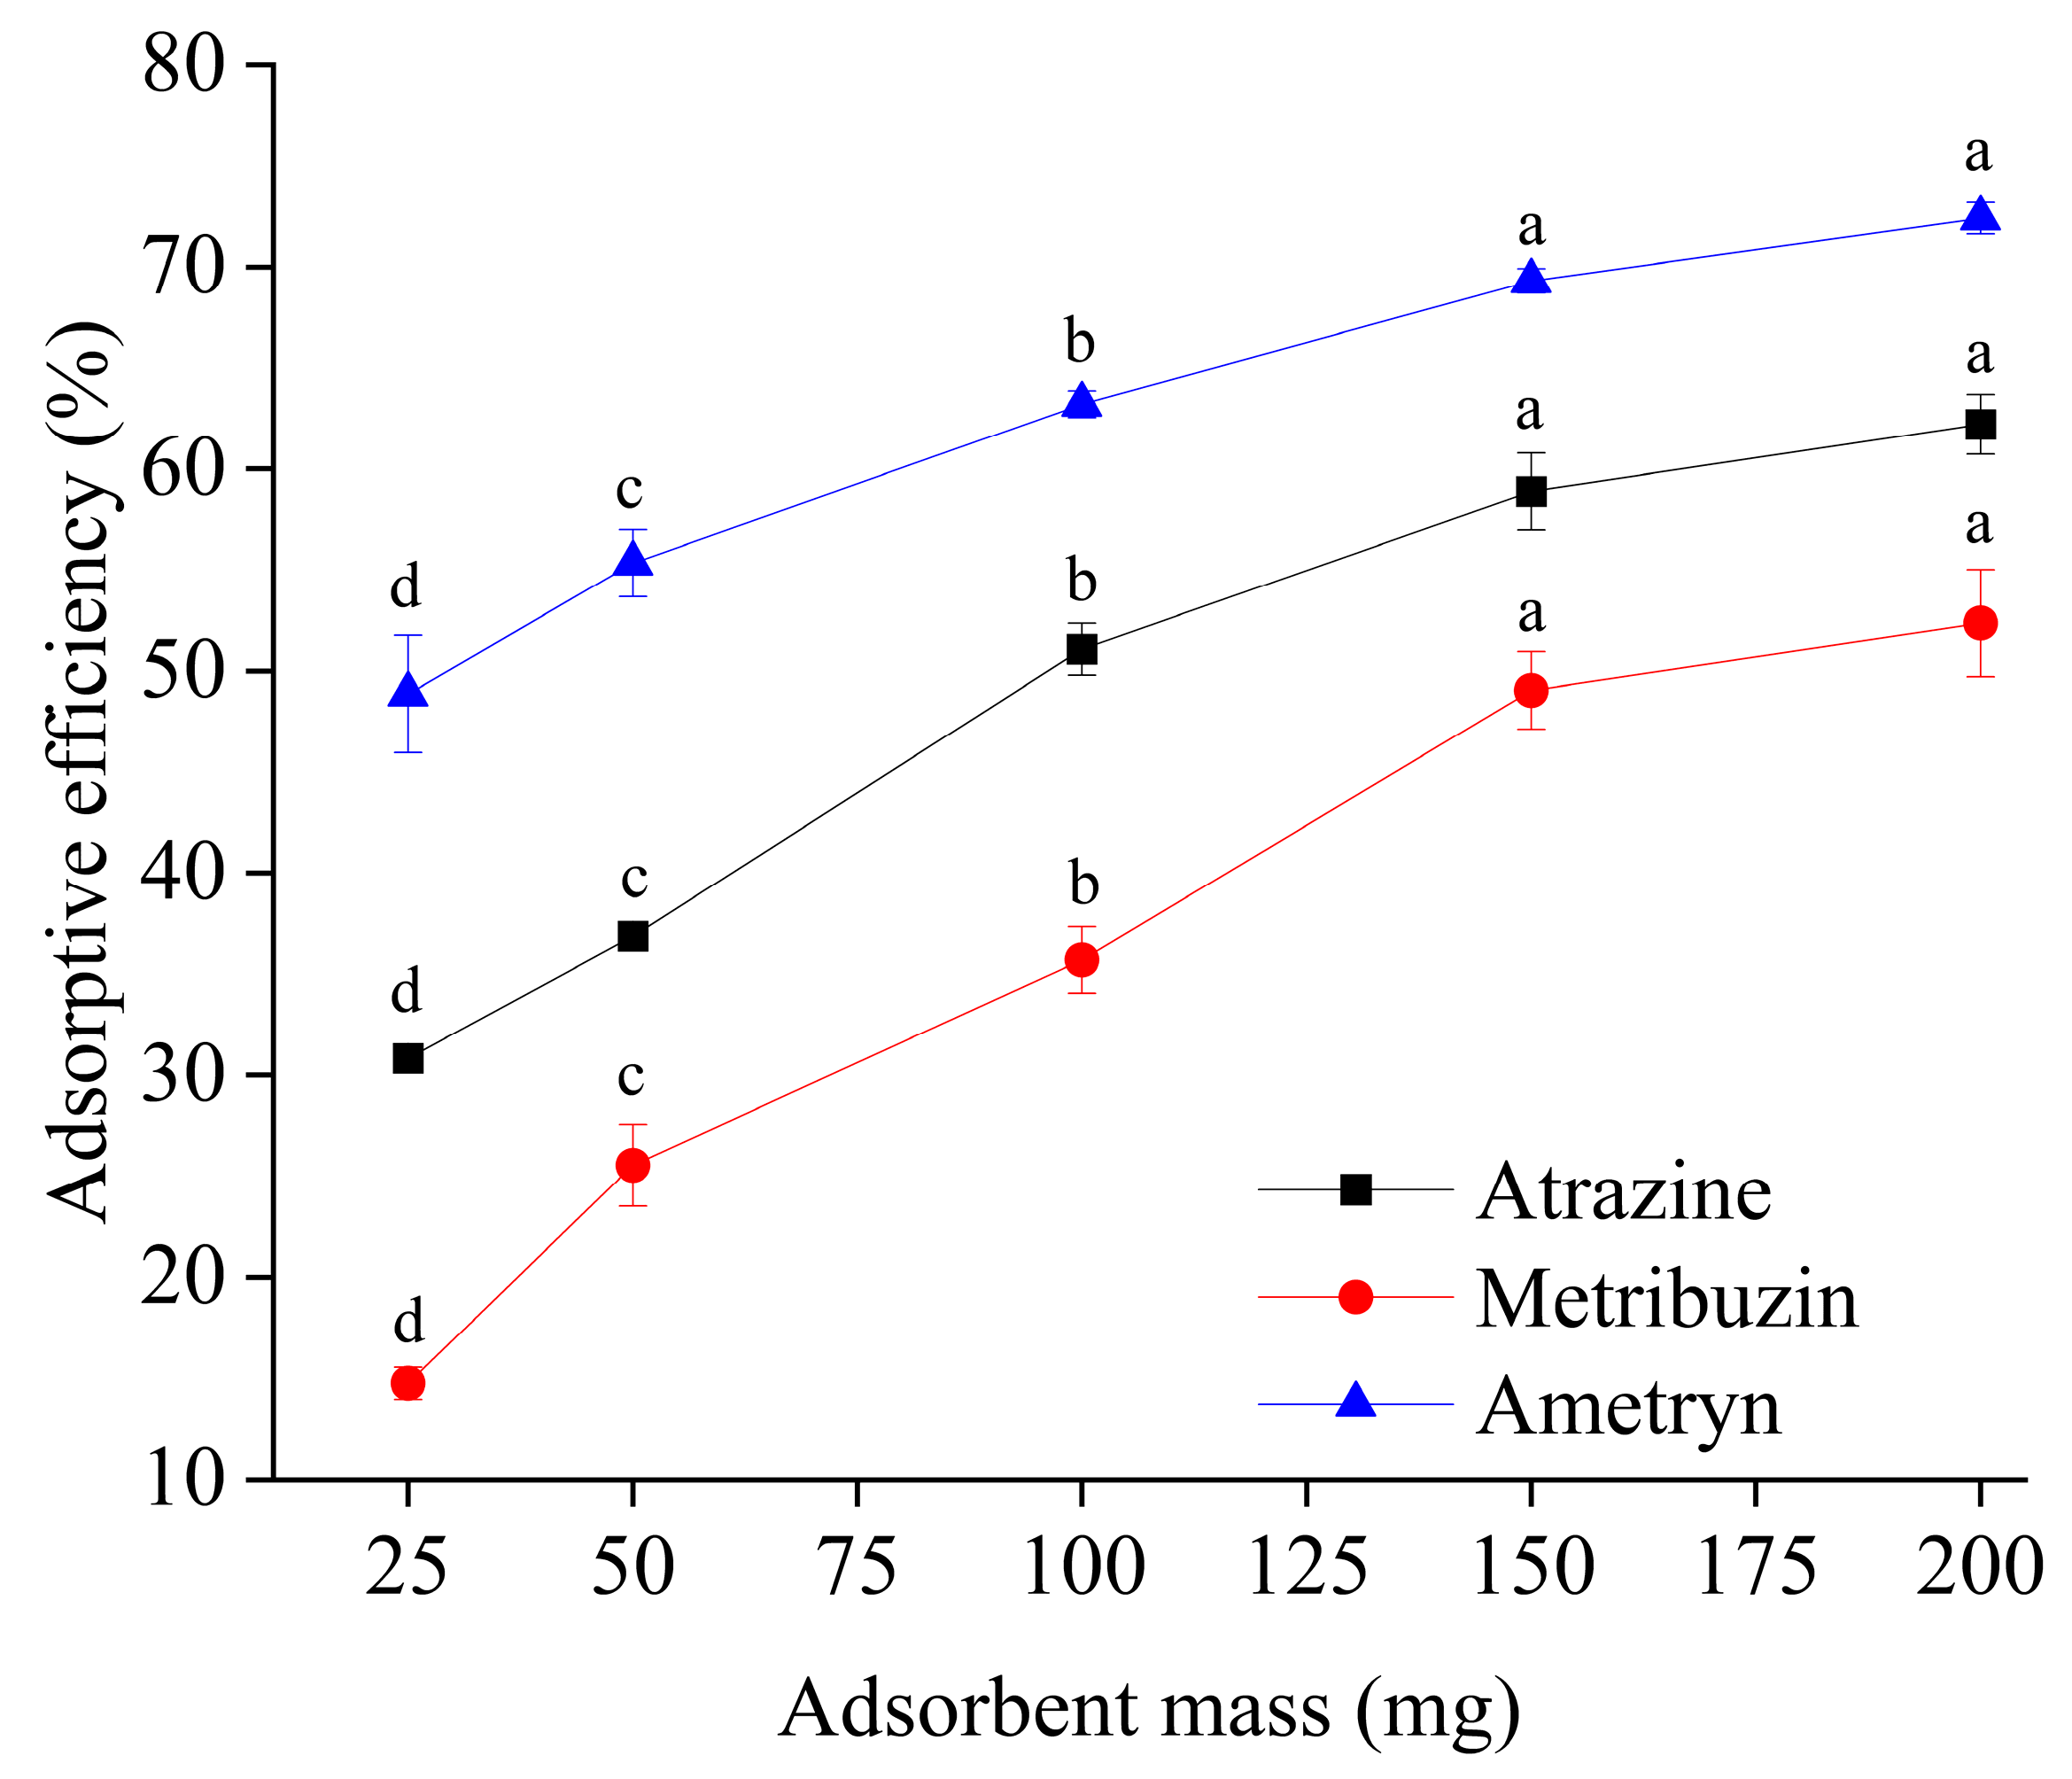
Preliminary analyses were conducted to determine the optimal adsorbent mass for each herbicide, aiming to assess the feasibility of employing hydrochar as a decontaminant in aqueous solutions. Five adsorbent mass values were tested (25, 50, 100, 150, and 200 mg). Figure 5 shows a consistent adsorption trend across the different adsorbent masses evaluated, indicating that increasing the adsorbent dosage in the medium generally enhances the amount adsorbed. This behavior can be attributed to the larger surface area available with higher adsorbent dosages, which facilitates more interactions between adsorbate molecules and the adsorbent surface [52,53].
Considering the performance of the different masses evaluated, the dosages of 150 and 200 mg of hydrochar exhibited statistically equivalent adsorption capacities for all three herbicides. Using 150 mg of hydrochar, the maximum removal efficiencies for atrazine, metribuzin, and ametryn were 22.28, 6.31, and 13.82 µg g−1, respectively. For 200 mg, the corresponding removal efficiencies were 17.65, 5.05, and 10.83 µg g−1. The dosage of 150 mg was selected for subsequent assays because it achieved removal efficiencies comparable to those obtained with 200 mg while requiring less material, thereby offering greater operational feasibility for future applications. The authors of [54] investigated the treatment of triazines using a carbonaceous material derived from cedar residues and reported an increase in contaminant removal from 25% to 77% as the biochar dosage increased from 0.5 to 2.5 g L−1. This behavior was attributed to the greater availability of active sites for adsorption resulting from the increased amount of adsorbent [54].

3.4. Effect of pH on Adsorption

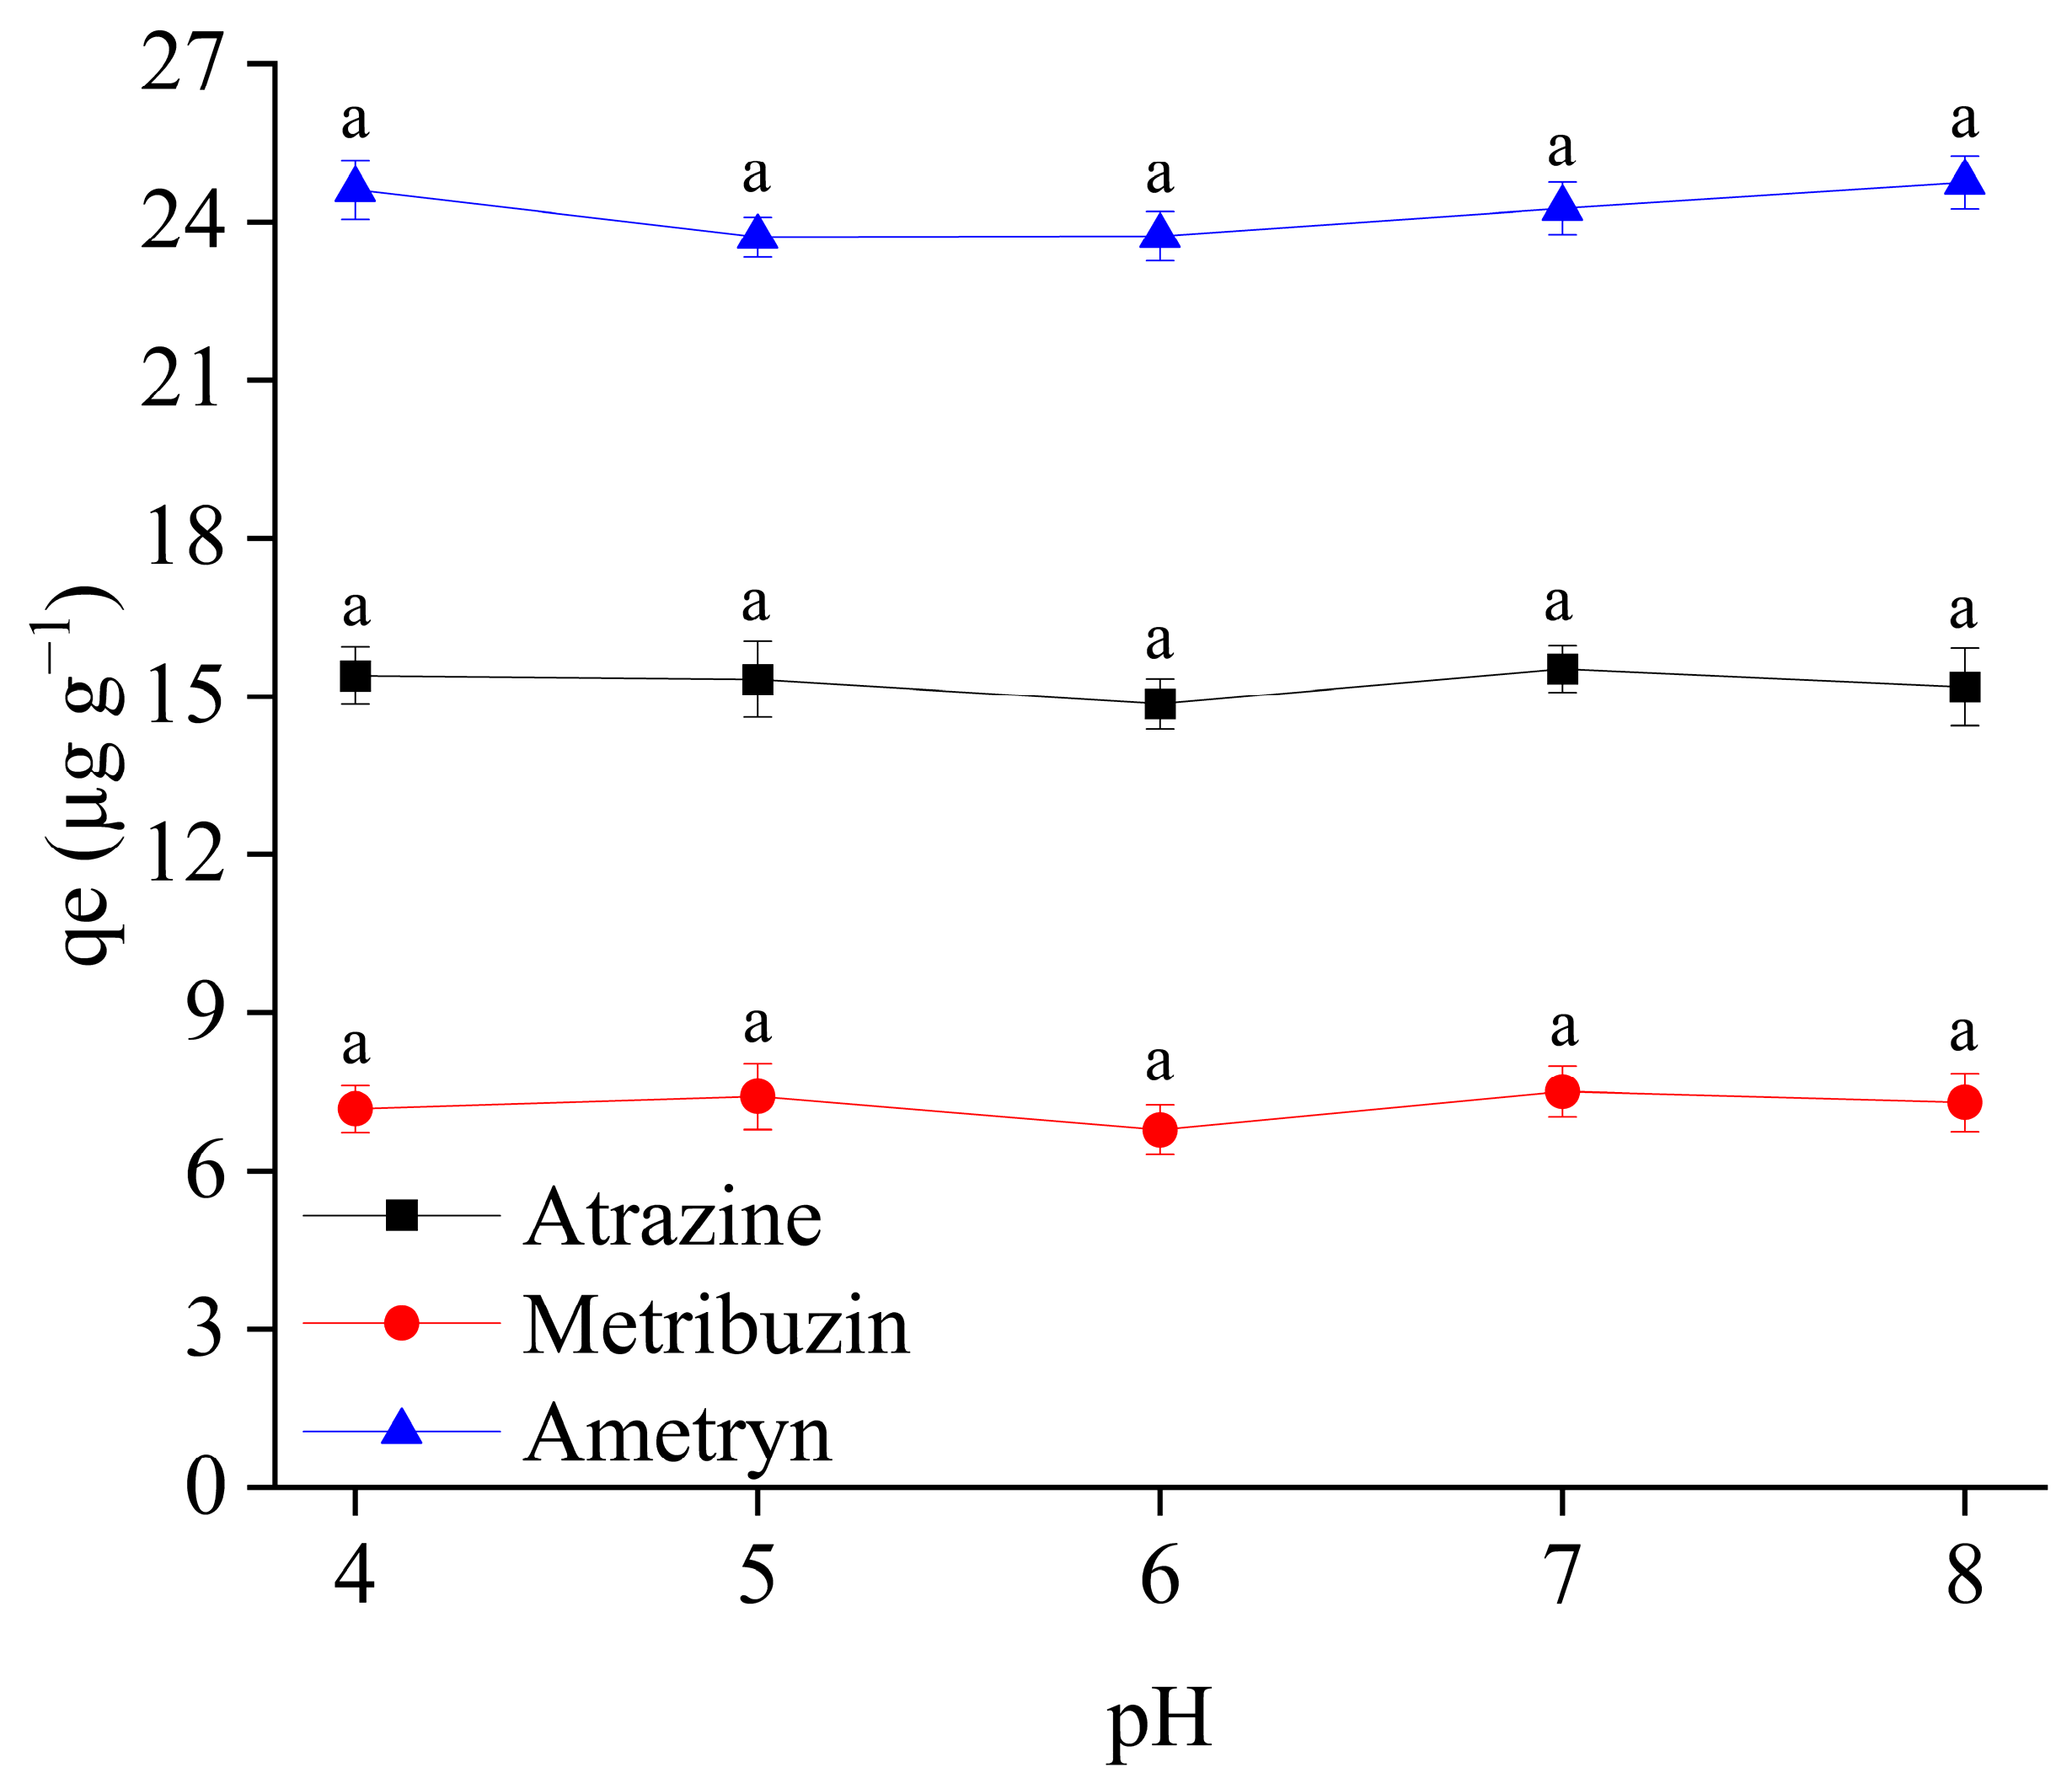
As shown in Figure 6, the ability of hydrochar to adsorb triazines exhibited significant independence from pH levels. According to the Point of Zero Charge (pHPZC) analysis, the hydrochar surface becomes negatively charged in media with pH values above 3.15. This behavior can be attributed to the simultaneous occurrence of interactions favored by surface complexation mechanisms and ion exchange reactions, which become more effective at pH values above the pHPZC. In addition to the electrostatic interactions between the negatively charged adsorbent surface, predominantly associated with the carboxylate functional group (COO), it is important to note that carboxylic acids typically exhibit pKa values between 3.8 and 5.0. Thus, under more acidic pH conditions, protonation of the COO groups may occur, reducing the negative charge density on the adsorbent surface and consequently influencing the adsorption mechanisms.
The point of zero charge (pHPZC) of acid hydrochar, determined as 3.15, corroborates the stability of its adsorption behavior across the entire pH range evaluated. At pH values below the pHPCZ, the hydrochar surface carries a positive charge, which hinders the electrostatic attraction of cationic herbicides such as atrazine, metribuzin, and ametryn. Conversely, at pH values above 3.15, the hydrochar surface acquires a negative charge, promoting the adsorption of these triazines through electrostatic interactions.
Since these are basic compounds, with acid dissociation constants (pKa) of 1.7 for atrazine and 1.0 for metribuzin, no significant electrostatic or acid–base interactions are expected under these conditions. The authors of [55] reported a similar limitation when evaluating atrazine adsorption in water using polyaniline-derived carbons, concluding that at pH values above the pesticide’s pKa, such electrostatic or acid–base interactions are not significant. Therefore, Van der Waals interactions, which are strongly influenced by the adsorbent’s porosity, are likely the predominant mechanism governing the adsorption of atrazine and metribuzin [56].

3.5. Adsorption Kinetics

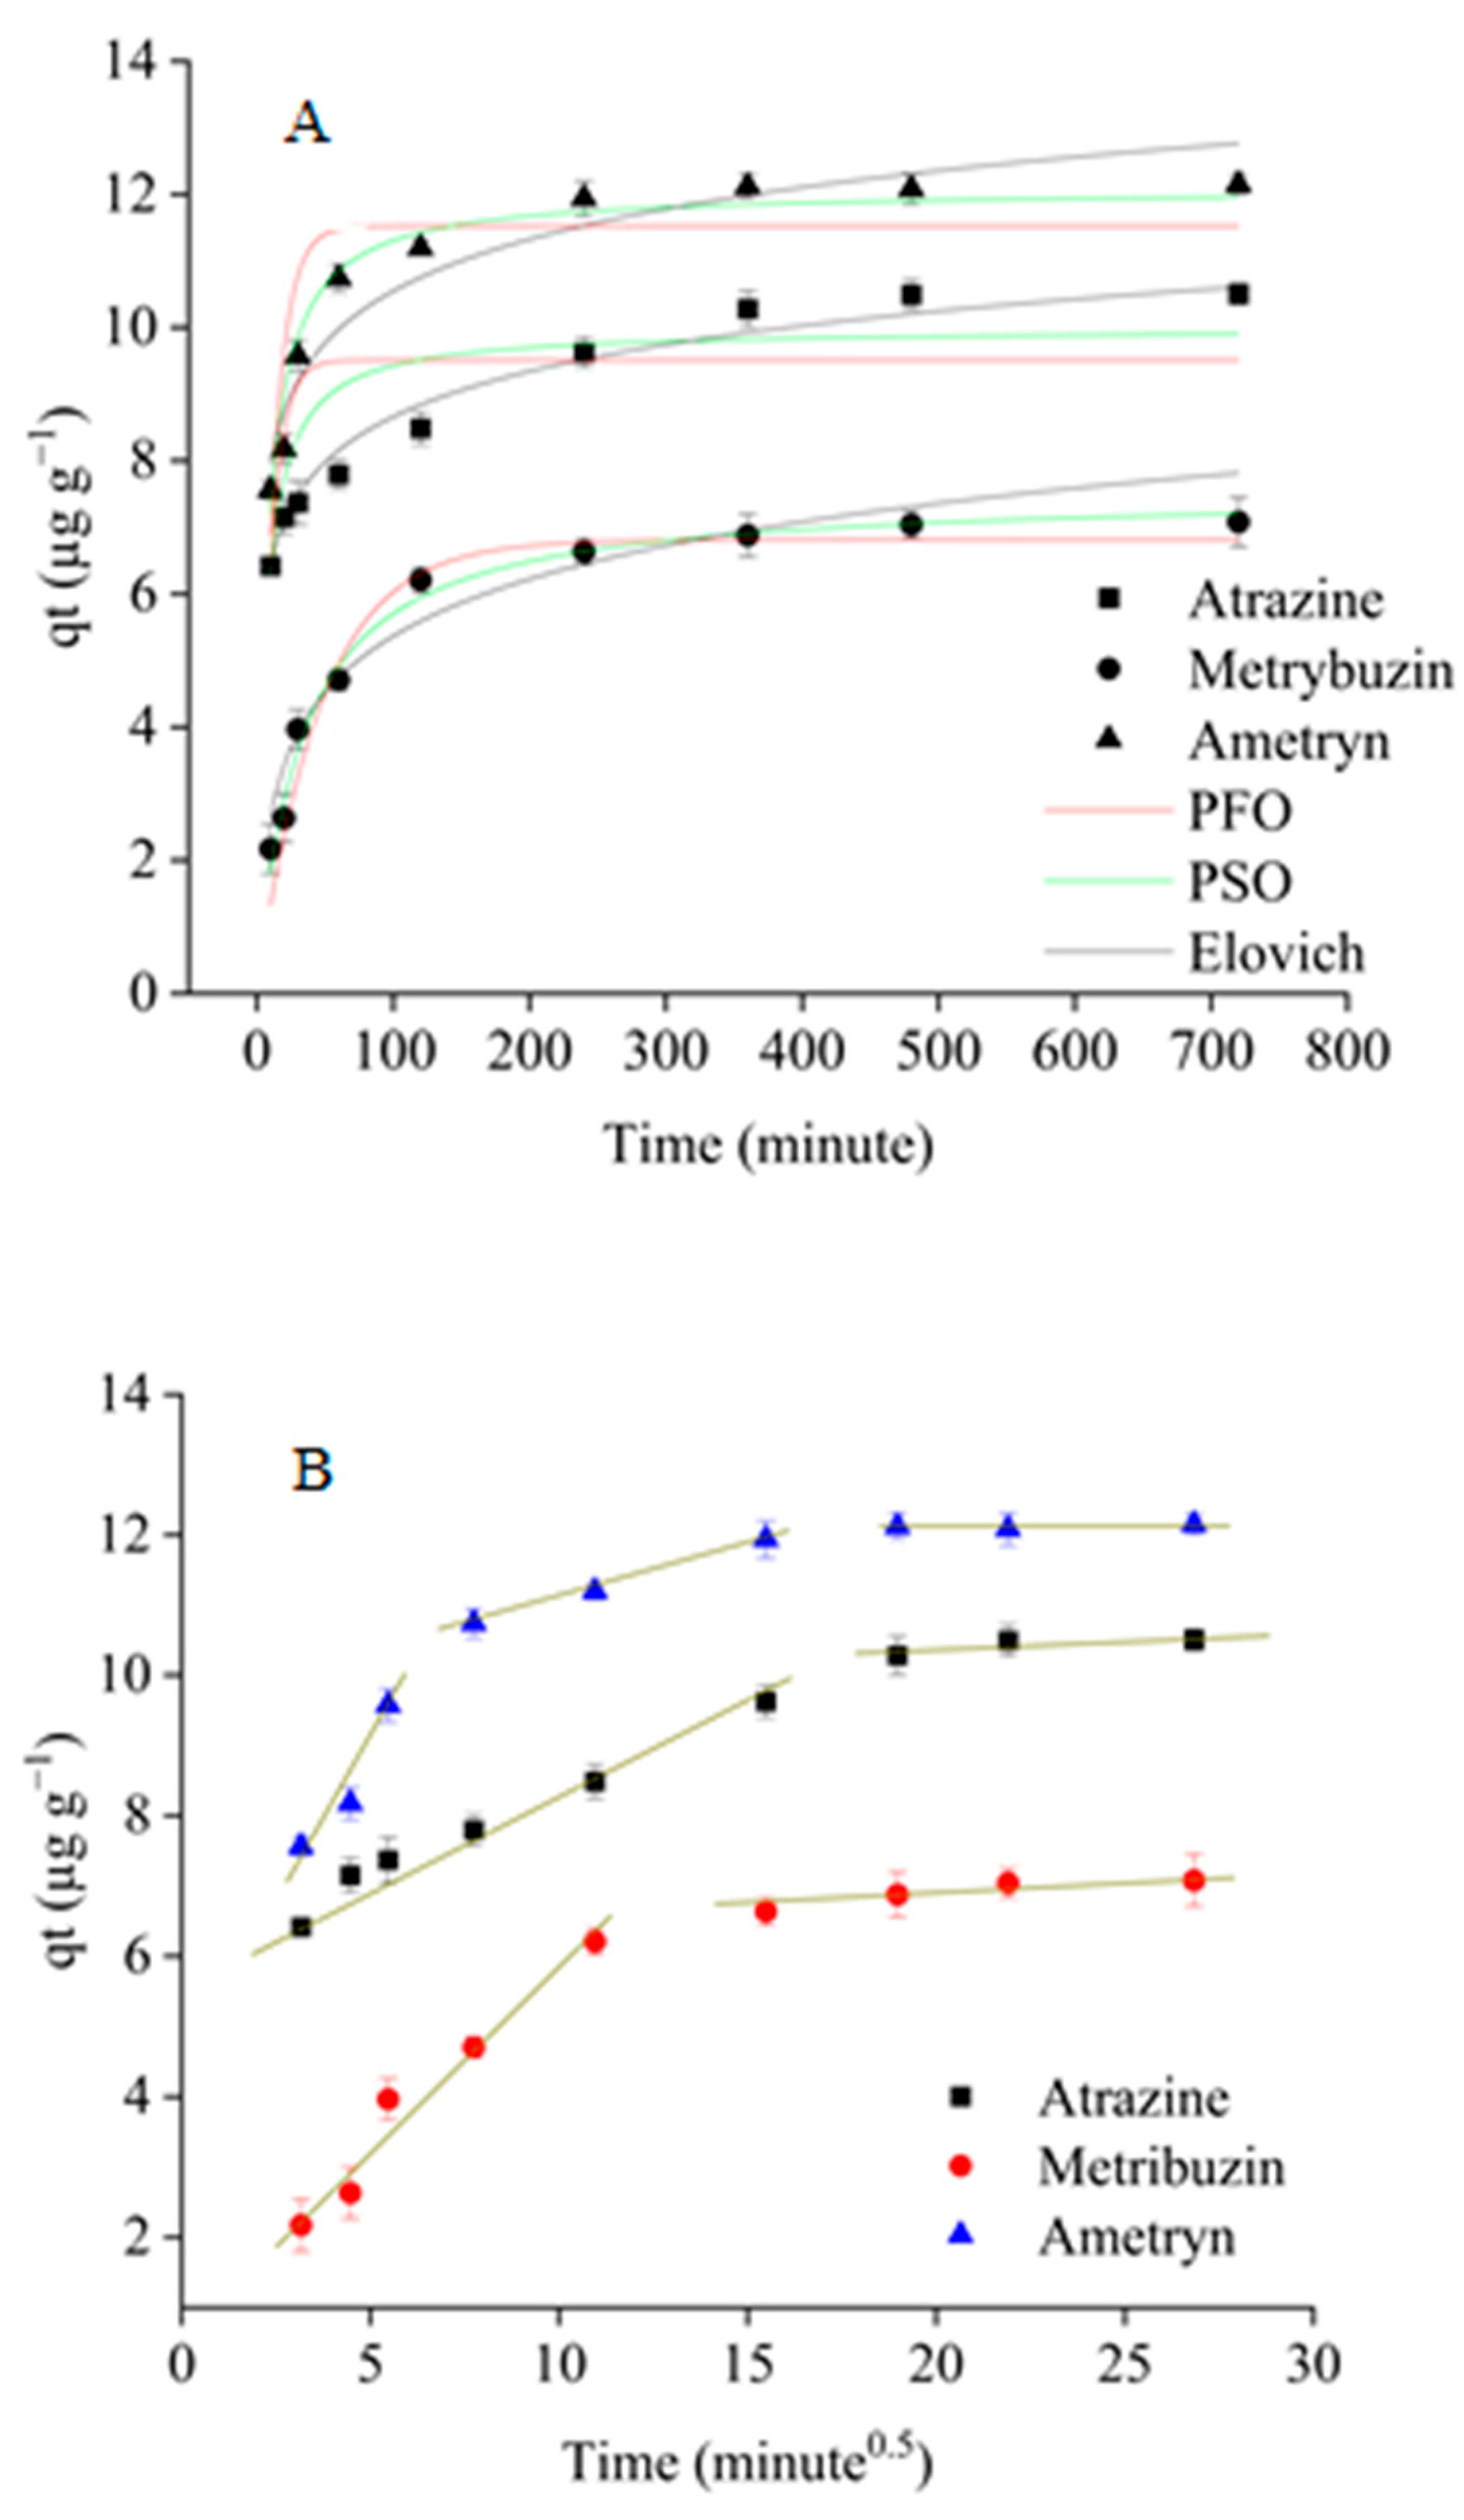
Adsorption kinetics tests are employed to elucidate the mechanisms governing the adsorption process, including chemical reactions, diffusion control, and mass transfer phenomena [57]. The adsorption of triazines by the bioadsorbent exhibited variations in the kinetic model that best described the experimental data. The results indicated that the PSO model provided the best fit for ametryn and metribuzin, whereas the Elovich model showed greater suitability in describing atrazine adsorption (Table 6). For all contaminants evaluated, a rapid initial adsorption phase was observed, particularly within the first 60 min of contact. After this period, the adsorption rate decreased, approaching equilibrium at approximately 240 min for metribuzin and around 360 min for atrazine and ametryn. This behavior can be attributed to the progressive saturation of active sites on the adsorbent surface. This behavior is related to the progressive occupation of active sites on the adsorbent surface by contaminant molecules. As the active sites become progressively occupied, the availability of free sites decreases, reducing the adsorption rate and slowing the process until equilibrium is reached [58].
Table 6 shows the results of the fittings of the PFO, PSO, Elovich and intraparticle diffusion models. The correlation coefficients (R2) and corrected Akaike Information Criterion (AICc) values indicated that the Elovich model provided the best fit for atrazine adsorption, with a higher R2 (0.99) and a lower AICc (−17.99) compared to the PFO model (R2 = 0.79, AICc = 7.91) and PSO model (R2 = 0.90, AICc = −0.56). For ametryn and metribuzin, the PSO model provided the best fit, with R2 values of 0.96 and 0.98, and AICc values of −16.32 and −21.64, respectively. These results indicate that the Elovich and Pseudo-Second-order (PSO) models best describe the adsorption dynamics of atrazine, ametryn, and metribuzin on acid-activated hydrochar at the studied concentrations, as evidenced by the strong correlation between the experimental data and the model parameters [59].
The good agreement of the experimental data with the Pseudo-Second-order (PSO) model suggests that the adsorption process may be influenced by interactions between the adsorbate and the active sites of the adsorbent. The PSO model is often associated with adsorption processes in which the rate may depend on the availability of active sites and possible interactions at the adsorbent surface [60]. In this study, the strong correlation between the experimental data and the PSO model (R2 values close to 1) indicates that the adsorption process is likely controlled by surface-related mechanisms rather than by simple mass transfer alone. However, the model fitting should be interpreted primarily as a mathematical description of the kinetic behavior rather than as direct evidence of a specific adsorption mechanism [61,62,63].
The strong agreement with the Elovich kinetic model suggests that adsorption occurs on a heterogeneous surface, where the adsorption sites possess varying activation energy levels. The Elovich model is typically applied to systems in which the adsorption rate decreases exponentially over time, reflecting the diminishing availability of high-energy active sites and the increasing repulsion among adsorbed molecules as surface coverage progresses [64]. The fit of the experimental data for atrazine adsorption to the Elovich model suggests a complex adsorption process that may involve multiple simultaneous mechanisms, including chemisorption on heterogeneous surfaces, surface diffusion, and reactions with variable activation energies. Thus, the affinity with this model reinforces that the adsorbent surface is energetically heterogeneous, and adsorption occurs in a non-ideal manner, progressively slowing over time [65,66].
The Weber and Morris model, illustrated in Figure 7B, depicts the sequential steps involved in the adsorption of the three triazines onto the surface of acid-activated hydrochar from passion fruit residues (HA). It can be observed that adsorption occurs in two stages for atrazine and metribuzin, and in three stages for ametryn. The first linear segment provides insight into the primary mechanism controlling adsorption, distinguishing between intraparticle diffusion (when the intercept is zero) and film diffusion (intrafilmic transport) [67]. In the first segment (I), the linear coefficients were 5.9102, 0.6247, and 4.230 µg g−1, while the corresponding intraparticle diffusion coefficients (Kd) were 0.2408, 0.5208, and 0.8497 µg g−1 min−0.5 for atrazine, metribuzin, and ametryn, respectively. Since the linear coefficients are nonzero in all cases, the lines do not pass through the origin, indicating that intraparticle diffusion is not the predominant mechanism controlling the adsorption process. In stage II, the Kd values decrease to 0.0281, 0.0388, and 0.1555 µg g−1 min−0.5 for atrazine, metribuzin, and ametryn, respectively, reflecting a reduction in the diffusion rate, likely due to the progressive saturation of active sites on the adsorbent surface or increased resistance to mass transfer in later stages.

3.6. Adsorption Equilibrium

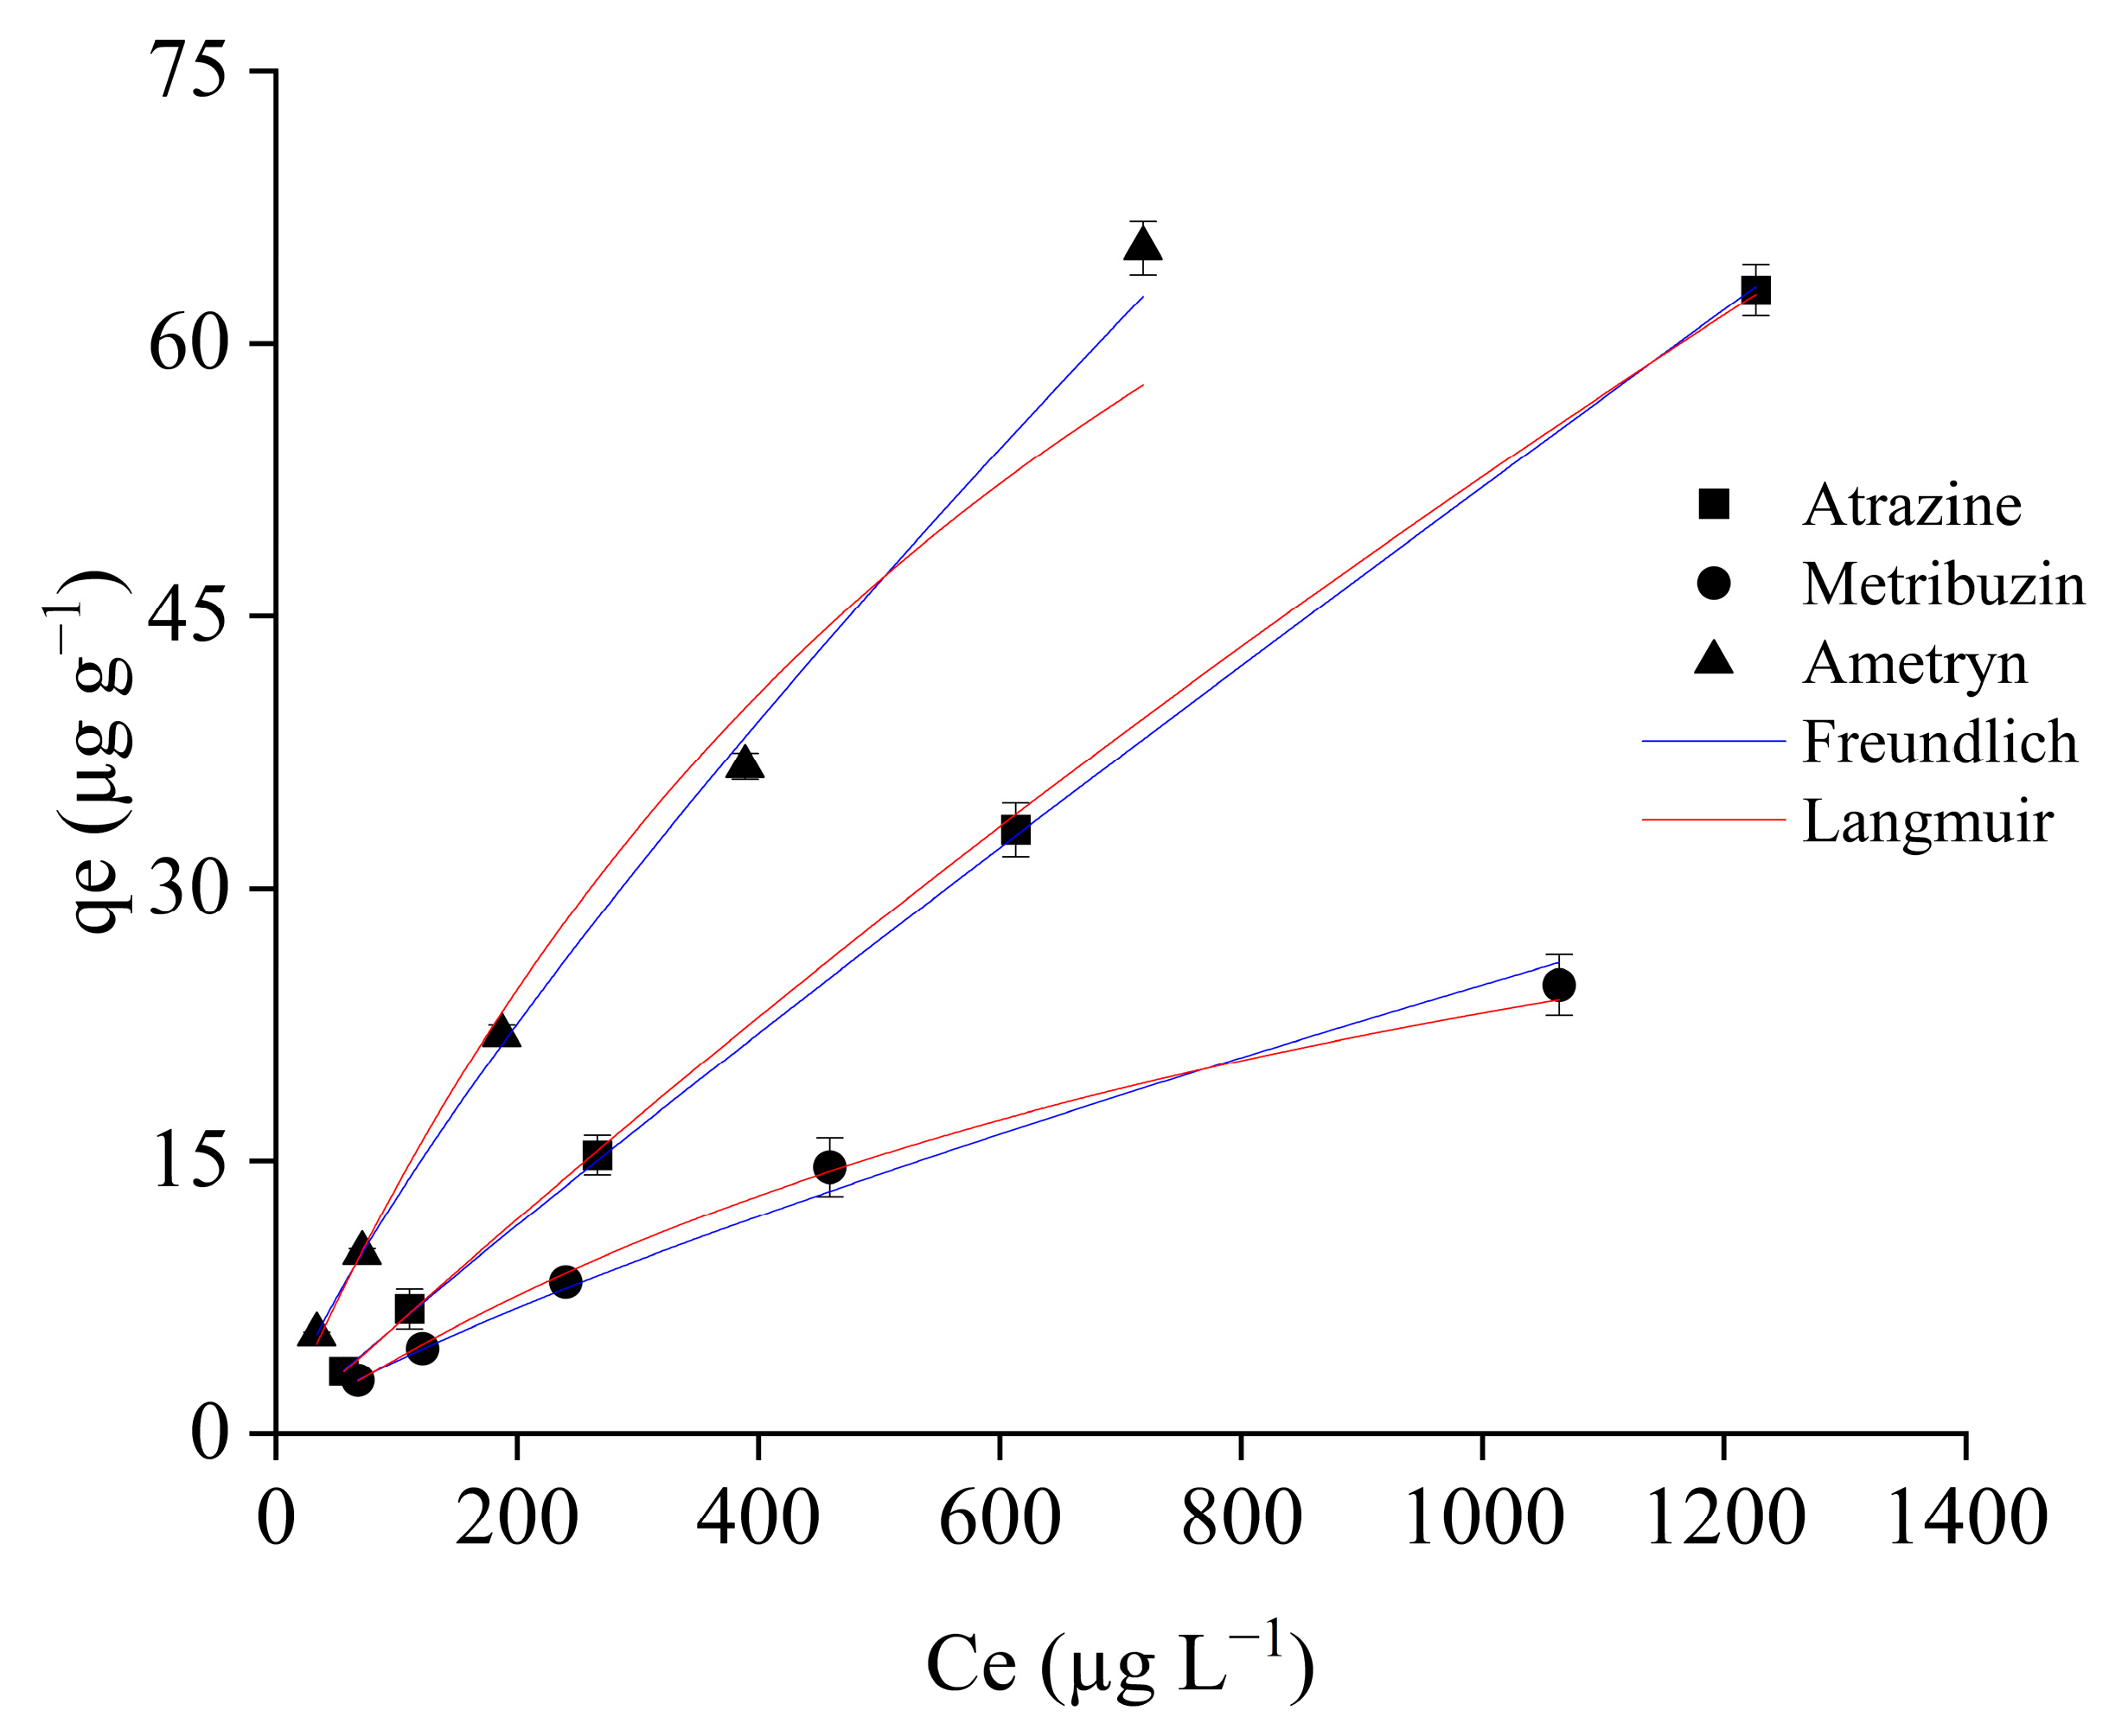
An adsorption equilibrium study was conducted to evaluate the effect of herbicide concentration (atrazine, ametryn, and metribuzin) on the adsorption performance of acidic hydrochar. The experimental data were fitted to the non-linear Langmuir and Freundlich isotherm models (Figure 8), and the corresponding adsorption parameters are presented in Table 7. The study of the initial adsorbate concentration is particularly relevant, as the adsorption of herbicides is limited by the maximum capacity of the adsorbent for a given mass. The results showed that increasing the initial concentration of herbicides led to a marked increase in the amount of contaminant adsorbed by the biosorbent. Nevertheless, the analysis of the isotherms shows that the adsorbent did not reach its saturation point with respect to the contaminant. For atrazine, within the concentration range of 32 to 1063 µg g−1, the adsorbed amount increased from 4.64 to 71.13 µg g−1. For ametryn, within the concentration range of 34 to 719 µg g−1, the adsorbed amount increased from 5.47 to 65.25 µg g−1. For metribuzin, with concentrations of 68 to 1063 µg g−1, the adsorbed mass was between 2.92 and 24.70 µg g−1.
Analysis of the adsorption isotherm profiles, according to the classification proposed by [68], indicates that the obtained curves correspond to type L, subgroup 1, which reflects the finite availability of adsorption sites on the hydrochar surface. Although a well-defined plateau was not observed, the results suggest that the adsorbents undergo progressive site occupation, approaching saturation but without reaching their maximum capacity within the concentration range evaluated [1,69,70]. Thus, although the concentrations employed were based on the recommended application doses for each herbicide, higher initial concentrations would be required to clearly define the plateau region of the isotherm and, consequently, determine the maximum adsorption capacity of the adsorbent.
Similar behavior was reported by [71], who evaluated atrazine adsorption onto biochar derived from biogas residues modified with citric acid. This result suggests that atrazine adsorption onto the material surface occurs predominantly through chemical interactions, favoring the formation of a monolayer. Initially, adsorption occurs homogeneously; however, at higher concentrations, heterogeneous adsorption processes take place concomitantly. The study indicates that the adsorption capacity is strongly influenced by the fraction of contaminant already bound to the adsorbent surface. This behavior indicates that the system maintains persistent and effective adsorption even at higher atrazine concentrations, suggesting that the adsorbent possesses a substantial number of available active sites and that saturation occurs gradually, thereby sustaining the continuity of the adsorption process [72,73].
The experimental data for atrazine (R2 = 0.99, AICc = −3.91) and ametryn (R2 = 0.99, AICc = 13.44) were well described by the Freundlich isotherm for the bioadsorbent, as indicated by the Akaike criterion and the high similarity of the coefficients of determination. Analysis of the Freundlich model parameters revealed n values of 1.06 for atrazine and 1.25 for ametryn, corresponding to 1/n values of 0.94 and 0.79, respectively. According to the Freundlich isotherm, 1/n values between 0 and 1 indicate a favorable adsorption process, while 1/n values greater than 1 suggest that increasing the herbicide concentration in the solution indicates non-saturation of the adsorbent’s active sites [74,75]. For atrazine, these results suggest slightly favorable adsorption, possibly reflecting a lower affinity for higher-energy sites or increased competition among molecules for these sites. In contrast, ametryn exhibited more favorable adsorption, indicating a more heterogeneous surface, higher physicochemical compatibility, and stronger interactions with the adsorbent [67,76,77,78].
For the herbicide metribuzin, the Langmuir isotherm showed the best fit, with R2 = 0.99 and AICC = 3.90, indicating the highest affinity of the adsorptive process with the isothermal model. The Langmuir model allows for the estimation of the theoretical maximum adsorption capacity, assuming the formation of a monolayer of the adsorbate on a homogeneous surface with a finite number of identical active sites. It is important to note that the Langmuir model tends to overestimate the Qmax values when the experimental data do not exhibit a clearly defined plateau [53,73]. For metribuzin, the Qmax value was 47.51 ± 6.14 µg g−1, indicating a lower adsorption capacity of metribuzin by hydrochar compared to the other herbicides evaluated. This value suggests that, although the hydrochar exhibits affinity for metribuzin, the number of specific adsorption sites or the chemical compatibility with this herbicide is lower compared to atrazine or ametryn. Metribuzin is a relatively small and chemically unreactive molecule with weakly basic behavior, which may limit its specific interactions with functional groups on the adsorbent surface, such as carboxyl and hydroxyl groups. Furthermore, the relatively low Qmax value may be associated with the limited contribution of electrostatic or chemisorption interactions, with the adsorption process relying more on Van der Waals forces and the accessibility of the pores [79,80,81].

3.7. Desorption Equilibrium

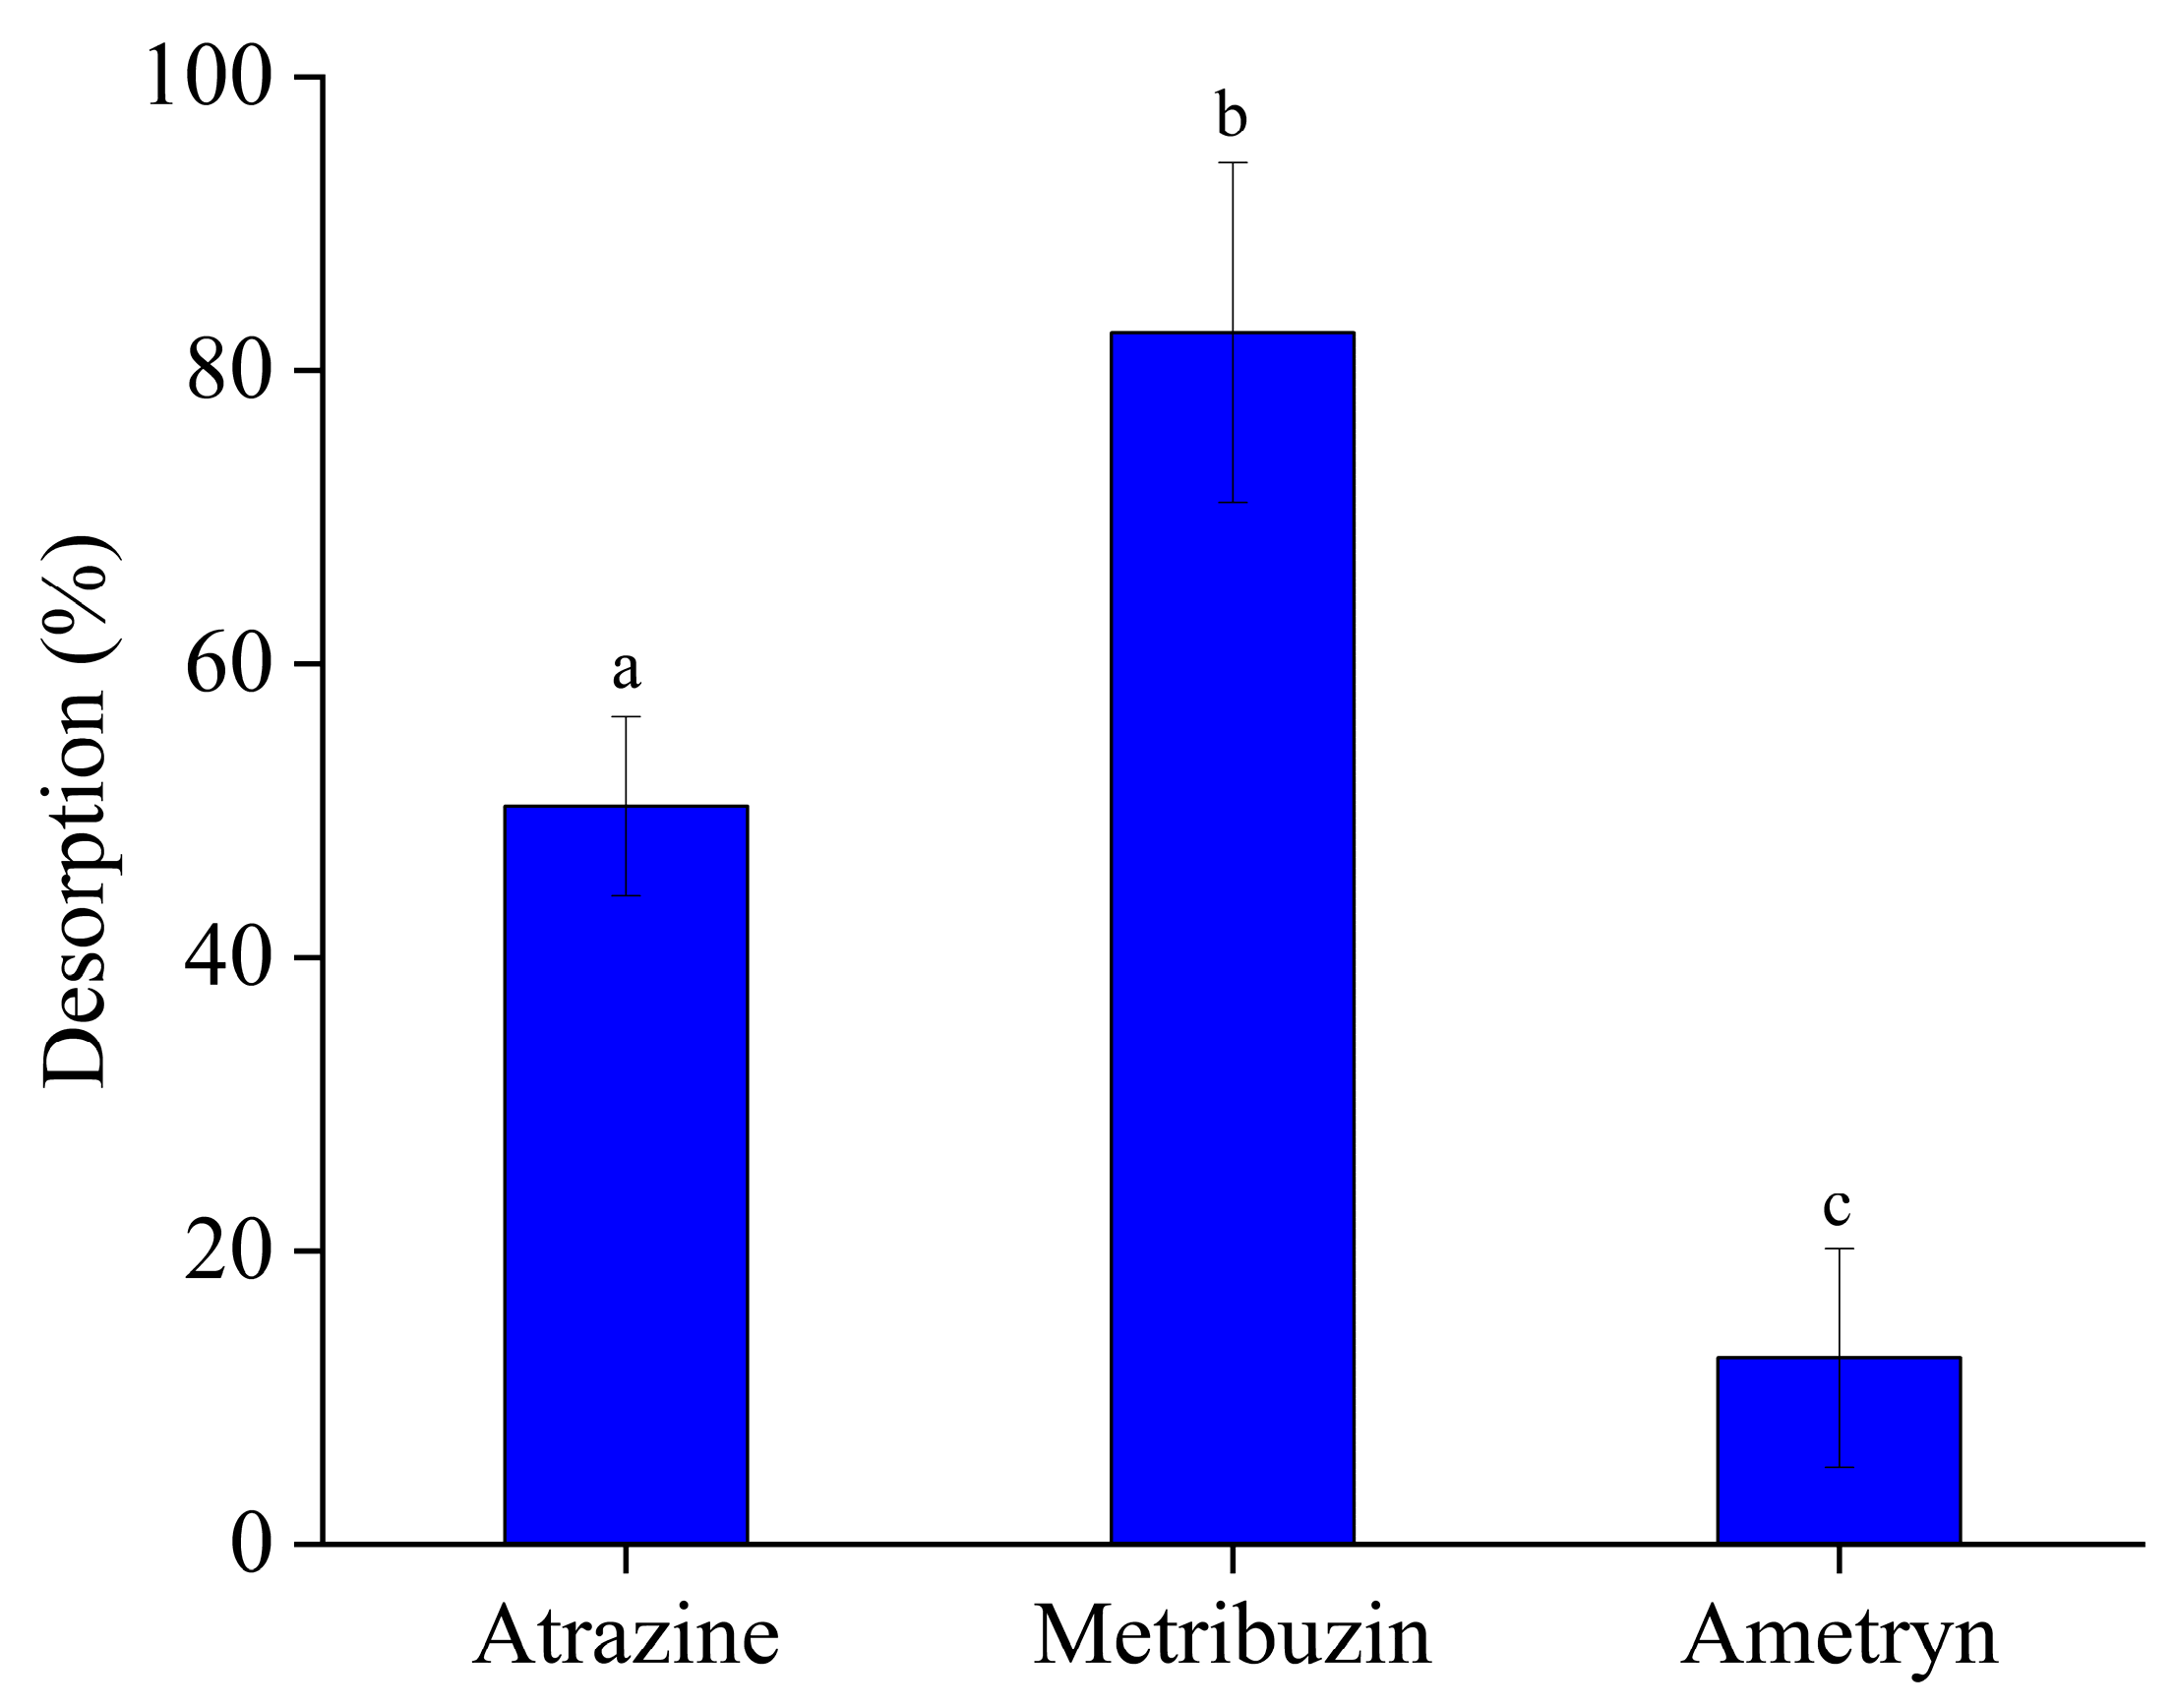
Desorption tests were conducted to assess the release of atrazine, metribuzin, and ametryn, previously adsorbed onto hydrochar, back into a contaminant-free aqueous solution (Figure 9). The results revealed distinct desorption profiles for the three herbicides. Approximately 13% of ametryn was released back into the aqueous medium, indicating stronger or partially irreversible interactions with the active sites of the adsorbent. In contrast, atrazine exhibited a desorption rate of 51%, while metribuzin showed the highest reversibility, with 83% of the herbicide returning to the aqueous phase.
These findings suggest that the interaction strength between the herbicides and the hydrochar surface is influenced by the molecular structure and functional groups of each compound. The low desorption of ametryn may be attributed to its higher hydrophobicity and stronger interactions, via π–π stacking or hydrogen bonding, with surface functional groups such as –COOH and –OH, promoting a more stable chemisorption process [82]. In contrast, metribuzin, due to its lower log Kow and higher aqueous solubility, interacts mainly through physical forces such as Van der Waals interactions, resulting in weaker and highly reversible adsorption [83]. Atrazine, exhibiting intermediate properties, shows partially reversible adsorption, likely due to the coexistence of both weak and moderate interactions with the hydrochar surface [74].

4. Conclusions

Phosphoric acid-modified hydrochar derived from passion fruit residues demonstrated significant potential as an adsorbent for the removal of triazine herbicides (atrazine, ametryn, and metribuzin) from aqueous solutions. The chemical activation with H3PO4 promoted modifications in the surface chemistry of the material, enhancing the availability of functional groups and improving its interaction with the target contaminants. As a result, the acid-modified hydrochar (HA) exhibited rapid adsorption kinetics and satisfactory removal efficiencies for compounds frequently detected in aquatic environments.
In addition to its performance, the material presents important advantages from a sustainability perspective, as it is derived from agro-industrial waste, involves relatively mild processing conditions, and contributes to waste valorization. These characteristics reinforce its potential as a low-cost and environmentally friendly alternative to conventional adsorbents, aligning with the principles of the circular economy and the development of sustainable water treatment technologies.
Despite these promising results, the adsorption process did not reach a clear saturation plateau within the concentration range evaluated, indicating that the maximum adsorption capacity of the material was not fully achieved. Therefore, future studies should explore higher initial concentrations of the target contaminants to better define the adsorption limits and provide a more comprehensive understanding of the system behavior under conditions closer to practical applications.
Furthermore, although the kinetic and equilibrium models provided valuable insights into the adsorption process, additional characterization is necessary to deepen the understanding of the material properties. In particular, nitrogen adsorption–desorption analyses are recommended to obtain detailed information on surface area, pore size distribution, and pore volume.
Finally, further investigations into alternative activation strategies and process conditions, including variations in activating agent concentration and synthesis parameters, are encouraged. These efforts may contribute to optimizing the structural and surface properties of the hydrochar, ultimately enhancing its adsorption capacity and broadening its applicability in water treatment systems.

Author Contributions

Data curation, D.V.d.F.; Investigation, A.H.B.d.A.; Methodology, P.S.F.d.C. and B.C.C.F.; Project Administration, D.V.S. and F.R.d.C.; Resources, D.V.S.; Supervision, F.R.d.C., P.S.F.d.C., B.C.C.F. and D.V.S.; Visualization, C.A.D.d.S., V.G.d.S.B., A.C.L.d.C., M.A.B.S., F.D.d.S., J.N.B., M.C.R.H. and L.P.B.; Writing—Original Draft, A.H.B.d.A.; Writing—Review and Editing, D.V.d.F., C.A.D.d.S., V.G.d.S.B., A.C.L.d.C., F.D.d.S., F.R.d.C., J.N.B., M.C.R.H., L.P.B. and M.d.F.S. All authors have read and agreed to the published version of the manuscript.

Funding

This research was funded by Coordenação de Aperfeiçoamento de Pessoal de Nível Superior—Brasil (CAPES)—Finance Code 001, Conselho Nacional de Desenvolvimento Científico e Tecnológico—Brasil (CNPq) and Fundação de Amparo e Promoção da Ciência, Tecnologia e Inovação do Rio Grande do Norte—Brasil (FAPERN).

Institutional Review Board Statement

Not applicable.

Informed Consent Statement

Not applicable.

Data Availability Statement

The original contributions presented in this study are included in the article. Further inquiries can be directed to the corresponding author.

Acknowledgments

This work was supported by the Coordenação de Aperfeiçoamento de Pessoal de Nível Superior (CAPES), Conselho Nacional de Desenvolvimento Científico e Tecnológico (CNPq) and Fundação de Amparo e Promoção da Ciência, Tecnologia e Inovação do Rio Grande do Norte (FAPERN).

Conflicts of Interest

The authors declare no conflicts of interest.

References

  1. Andrunik, M.; Skalny, M.; Gajewska, M.; Marzec, M.; Bajda, T. Comparison of pesticide adsorption efficiencies of zeolites and zeolite-carbon composites and their regeneration possibilities. Heliyon 2023, 9, e20572. [Google Scholar] [CrossRef] [Scilit]
  2. Ma, J.; Ren, W.; Wang, H.; Song, J.; Jia, J.; Chen, H.; Tan, C.; Teng, Y. Legacy of herbicides in water from Hailun City, Northeast China: Occurrence, source, and ecological risk assessment. J. Environ. Sci. 2024, 145, 50–63. [Google Scholar] [CrossRef] [Scilit] [PubMed]
  3. Li, L.; Wang, Y.; Liu, L.; Gao, C.; Ru, S.; Yang, L. Occurrence, ecological risk, and advanced removal methods of herbicides in waters: A timely review. Environ. Sci. Pollut. Res. 2024, 31, 3297–3319. [Google Scholar] [CrossRef] [Scilit]
  4. Smith, P.N.; Armbrust, K.L.; Brain, R.A.; Chen, W.; Galic, N.; Ghebremichael, L.; Giddings, J.M.; Hanson, M.L.; Maul, J.; Van Der Kraak, G.; et al. Assessment of risks to listed species from the use of atrazine in the USA: A perspective. J. Toxicol. Environ. Health—Part B Crit. Rev. 2021, 24, 223–306. [Google Scholar] [CrossRef] [Scilit]
  5. Shi, D.; Ma, Y.; Zhu, J.; Zhang, L.; Cai, M. Occurrence, sources and transport of triazine herbicides in the Antarctic marginal seas. Mar. Pollut. Bull. 2024, 207, 116820. [Google Scholar] [CrossRef] [Scilit]
  6. Carlier, M.P.; Cenijn, P.H.; Baygildiev, T.; Irwan, J.; Escher, S.E.; van Duursen, M.B.M.; Hamers, T. Profiling the endocrine-disrupting properties of triazines, triazoles, and short-chain PFAS. Toxicol. Sci. 2024, 202, 250–264. [Google Scholar] [CrossRef] [Scilit]
  7. Jiang, W.; Zhai, W.; Liu, D.; Wang, P. Coexisting antibiotic changes the persistence and metabolic profile of atrazine in the environment. Chemosphere 2021, 269, 129333. [Google Scholar] [CrossRef] [Scilit] [PubMed]
  8. Nogueira, E.N.; Dores, E.F.G.C.; Pinto, A.A.; Amorim, R.S.S.; Ribeiro, M.L.; Lourencetti, C. Currently used pesticides in water matrices in Central-Western Brazil. J. Braz. Chem. Soc. 2012, 23, 1476–1487. [Google Scholar] [CrossRef] [Scilit]
  9. Sousa, A.S.; Duaví, W.C.; Cavalcante, R.M.; Milhome, M.A.L.; Nascimento, R.F.D. Estimated Levels of Environmental Contamination and Health Risk Assessment for Herbicides and Insecticides in Surface Water of Ceará, Brazil. Bull. Environ. Contam. Toxicol. 2016, 96, 90–95. [Google Scholar] [CrossRef] [Scilit]
  10. Guarda, P.M.; Gualberto, L.D.S.; Mendes, D.B.; Guarda, E.A.; da Silva, J.E.C. Analysis of triazines, triazoles, and benzimidazoles used as pesticides in different environmental compartments of the Formoso River and their in-fluence on biodiversity in Tocantins. J. Environ. Sci. Health 2020, 55, 783–793. [Google Scholar] [CrossRef] [Scilit]
  11. Brovini, E.M.; Quadra, G.R.; Paranaíba, J.R.; Carvalho, L.; Pereira, R.d.O.; de Aquino, S.F. Occurrence and environmental risk assessment of 22 pesticides in Brazilian freshwaters. Aquat. Toxicol. 2023, 260, 106566. [Google Scholar] [CrossRef] [Scilit]
  12. Fisch, K.; Brockmeyer, B.; Gerwinski, W.; Schulz-Bull, D.E.; Theobald, N. Seasonal variability, long-term distribution (2001–2014), and risk assessment of polar organic micropollutants in the Baltic Sea. Environ. Sci. Pollut. Res. 2021, 28, 39296–39309. [Google Scholar] [CrossRef] [Scilit]
  13. Min, N.; Park, H.; Hong, T.; An, G.; Song, G.; Lim, W. Developmental toxicity of prometryn induces mitochondrial dysfunction, oxidative stress, and failure of organogenesis in zebrafish (Danio rerio). J. Hazard. Mater. 2023, 443, 130202. [Google Scholar] [CrossRef] [Scilit]
  14. Yuan, X.; Yuan, Y.; Gao, X.; Xiong, Z.; Zhao, L. Magnetic dummy-template molecularly imprinted polymers based on multi-walled carbon nanotubes for simultaneous selective extraction and analysis of phenoxy carboxylic acid herbicides in cereals. Food Chem. 2020, 333, 127540. [Google Scholar] [CrossRef] [Scilit]
  15. Bergamasco, R.; Mantovani, D.; Diório, A.; Bezerra, C.d.O.; Quesada, H.B.; Wernke, G.; Fagundes-Klen, M.R.; Cusioli, L.F. Adsorption of Atrazine from Synthetic Contaminated Water Using a Packed-Bed Column with a Low-Cost Adsorbent (Moringa oleifera Lam.). Water 2023, 15, 1260. [Google Scholar] [CrossRef] [Scilit]
  16. Mojiri, A.; Zhou, J.L.; Robinson, B.; Ohashi, A.; Ozaki, N.; Kindaichi, T.; Farraji, H.; Vakili, M. Pesticides in aquatic environments and their removal by adsorption methods. Chemosphere 2020, 253, 126646. [Google Scholar] [CrossRef] [Scilit]
  17. Blachnio, M.; Kusmierek, K.; Swiatkowski, A.; Derylo-Marczewska, A. Adsorption of Phenoxyacetic Herbicides from Water on Carbonaceous and Non-Carbonaceous Adsorbents. Molecules 2023, 28, 5404. [Google Scholar] [CrossRef] [Scilit]
  18. Ho, S. Low-Cost Adsorbents for the Removal of Phenol/Phenolics, Pesticides, and Dyes from Wastewater Systems: A Review. Water 2022, 14, 3203. [Google Scholar] [CrossRef] [Scilit]
  19. Jacob, M.M.; Ponnuchamy, M.; Kapoor, A.; Sivaraman, P. Achieving up to 95% removal efficiency of chlorpyrifos pesticide using sugarcane bagasse-based biochar alginate beads in a continuous fixed-bed adsorption column. Environ. Res. 2025, 269, e120902. [Google Scholar] [CrossRef] [Scilit]
  20. Chen, Y.; Hassan, M.; Nuruzzaman, M.; Zhang, H.; Naidu, R.; Liu, Y.; Wang, L. Iron-modified biochar derived from sugarcane bagasse for adequate removal of aqueous imidacloprid: Sorption mechanism study. Environ. Sci. Pollut. Res. 2022, 30, e47544768. [Google Scholar] [CrossRef] [Scilit]
  21. Qiu, B.; Shao, Q.; Shi, J.; Yang, C.; Chu, H. Application of biochar for the adsorption of organic pollutants from wastewater: Modification strategies, mechanisms and challenges. Sep. Purif. Technol. 2022, 300, e121925. [Google Scholar] [CrossRef] [Scilit]
  22. Cheng, N.; Wang, B.; Wu, P.; Lee, X.; Xing, Y.; Chen, M.; Gao, B. Adsorption of emerging contaminants from water and wastewater by modified biochar: A review. Environ. Pollut. 2021, 273, e116448. [Google Scholar] [CrossRef] [Scilit]
  23. Shi, Y.; Zhang, T.; Ren, H.; Kruse, A.; Cui, R. Polyethylene imine modified hydrochar adsorption for chromium (VI) and nickel (II) removal from aqueous solution. Bioresour. Technol. 2018, 247, 370–379. [Google Scholar] [CrossRef] [Scilit]
  24. Xia, Y.; Yang, T.; Zhu, N.; Li, D.; Chen, Z.; Lang, Q.; Liu, Z.; Jiao, W. Enhanced adsorption of Pb (II) onto modified hydrochar: Modeling and mechanism analysis. Bioresour. Technol. 2019, 288, 121593. [Google Scholar] [CrossRef] [Scilit]
  25. Masoumi, S.; Borugadda, V.B.; Nanda, S.; Dalai, A.K. Hydrochar: A Review on Its Production Technologies and Applications. Catalysts 2021, 11, 939. [Google Scholar] [CrossRef] [Scilit]
  26. Ighalo, J.O.; Rangabhashiyam, S.; Dulta, K.; Umeh, C.T.; Iwuozor, K.O.; Aniagor, C.O.; Eshiemogie, S.O.; Iwuchukwu, F.U.; Igwegbe, C.A. Recent advances in hydrochar application for the adsorptive removal of wastewater pollutants. Chem. Eng. Res. Des. 2022, 184, 419–456. [Google Scholar] [CrossRef] [Scilit]
  27. Belete, Y.Z.; Ziemann, E.; Gross, A.; Bernstein, R. Facile activation of sludge-based hydrochar by Fenton oxidation for ammonium adsorption in aqueous media. Chemosphere 2021, 273, 128526. [Google Scholar] [CrossRef] [Scilit]
  28. Wang, P.; Stenrød, M.; Wang, L.; Yuan, S.; Mao, L.; Zhu, L.; Zhang, L.; Zhang, Y.; Jiang, H.; Zheng, Y.; et al. Characterization of Montmorillonite–Biochar Composite and Its Application in the Removal of Atrazine in Aqueous Solution and Soil. Front. Environ. Sci. 2022, 10, 888252. [Google Scholar] [CrossRef] [Scilit]
  29. Micheletti, D.H.; Andrade, J.G.d.S.; Porto, C.E.; Alves, B.H.M.; de Carvalho, F.R.; Sakai, O.A.; Batistela, V.R. A review of adsorbents for removal of yellow tartrazine dye from water and wastewater. Bioresour. Technol. Rep. 2023, 24, 101598. [Google Scholar] [CrossRef] [Scilit]
  30. Izydorczyk, G.; Skrzypczak, D.; Mironiuk, M.; Mikula, K.; Samoraj, M.; Gil, F.; Taf, R.; Moustakas, K.; Chojnacka, K. Lignocellulosic biomass fertilizers: Production, characterization, and agri-applications. Sci. Total Environ. 2024, 923, 171343. [Google Scholar] [CrossRef] [Scilit]
  31. Calvete, T.; Lima, E.C.; Cardoso, N.F.; Dias, S.L.; Pavan, F.A. Application of carbon adsorbents prepared from the Brazilian pine-fruit-shell for the removal of Procion Red MX 3B from aqueous solution—Kinetic, equilibrium, and thermodynamic studies. Chem. Eng. J. 2009, 155, 627–636. [Google Scholar] [CrossRef] [Scilit]
  32. Ofomaja, A.; Ho, Y. Equilibrium sorption of anionic dye from aqueous solution by palm kernel fibre as sorbent. Dye. Pigment. 2007, 74, 60–66. [Google Scholar] [CrossRef] [Scilit]
  33. El-Khaiary, M.; Malash, G. Common data analysis errors in batch adsorption studies. Hydrometallurgy 2011, 105, 314–320. [Google Scholar] [CrossRef] [Scilit]
  34. Abdu, M.; Babaee, S.; Worku, A.; Msagati, T.A.M.; Nure, J.F. The development of Giant reed biochar for adsorption of Basic Blue 41 and Eriochrome Black T. azo dyes from wastewater. Sci. Rep. 2024, 14, 18320. [Google Scholar] [CrossRef] [Scilit]
  35. Egbosiuba, T.C. Biochar and bio-oil fuel properties from nickel nanoparticles assisted pyrolysis of cassava peel. Heliyon 2022, 8, e10114. [Google Scholar] [CrossRef] [Scilit]
  36. Pambudi, S.; Saechua, W.; Jongyingcharoen, J.S. A thermogravimetric assessment of eco-friendly biochar from oxidative torrefaction of spent coffee grounds: Combustion behavior, kinetic parameters, and potential emissions. Environ. Technol. Innov. 2024, 33, 103472. [Google Scholar] [CrossRef] [Scilit]
  37. Wakudkar, H.; Sahu, P. Insight of biopolymeric degradation and kinetic triplets of corn cob and its biochar using thermogravimetric analysis. Thermochim. Acta 2025, 748, 179990. [Google Scholar] [CrossRef] [Scilit]
  38. Dong, H.; Leung, A.K.; Liu, J.; Chen, R.; Lui, W. Microstructural investigation of the unsaturated hydraulic properties of hydrochar-amended soils. Acta Geotech. 2024, 19, 833–853. [Google Scholar] [CrossRef] [Scilit]
  39. Liang, Y.; Zhao, B.; Yuan, C. Adsorption of Atrazine by Fe-Mn-Modified Biochar: The Dominant Mechanism of π–π Interaction and Pore Structure. Agronomy 2022, 12, 3097. [Google Scholar] [CrossRef] [Scilit]
  40. Apolloni, F.; Menegazzo, F.; Bittencourt, C.; Signoretto, M. Hazelnut shells and rice husks activated biochars for the adsorption of atrazine and terbuthylazine. Next Energy 2025, 7, 100291. [Google Scholar] [CrossRef] [Scilit]
  41. Nascimento, C.T.D.; Vieira, M.G.A.; Scheufele, F.B.; Palú, F.; da Silva, E.A.; Borba, C.E. Adsorption of atrazine from aqueous systems on chemically activated biochar produced from corn straw. J. Environ. Chem. Eng. 2022, 10, 107039. [Google Scholar] [CrossRef] [Scilit]
  42. George, L.-Y.; Ma, L.; Zhang, W.; Yao, G. Parametric modelling and analysis to optimize adsorption of Atrazine by MgO/Fe3O4-synthesized porous carbons in water environment. Environ. Sci. Eur. 2023, 35, 21. [Google Scholar] [CrossRef] [Scilit]
  43. Souza, T.F.; Dias Ferreira, G.M. Biochars as Adsorbents of Pesticides: Laboratory-Scale Performances and Real-World Contexts, Challenges, and Prospects. ACS ES&T Water 2024, 4, 4264–4282. [Google Scholar]
  44. Gao, Y.; Sun, Y.; Song, W.; Jia, Y.; Li, A.; Wang, S. Intrinsic properties of biochar for electron transfer. Chem. Eng. J. 2023, 475, 146356. [Google Scholar] [CrossRef] [Scilit]
  45. Abdeldayem, O.M.; Dupont, C.; Ferras, D.; Ndiaye, L.G.; Kennedy, M. Reconsidering lab procedures for hydrothermal carbonization of biomass: The impact of pre-drying and stirring. J. Anal. Appl. Pyrolysis 2024, 179, 106459. [Google Scholar] [CrossRef] [Scilit]
  46. Danso-Boateng, E.; Ross, A.B.; Mariner, T.; Hammerton, J.; Fitzsimmons, M. Hydrochars produced by hydrothermal carbonisation of seaweed, coconut shell and oak: Effect of processing temperature on physicochemical adsorbent characteristics. SN Appl. Sci. 2022, 4, 203. [Google Scholar] [CrossRef] [Scilit]
  47. Silva, J.; Granja, H.; dos Santos, J.; Freitas, L.; Sussuchi, E. Biochar and Hydrochar in the Development and Application of Electrochemical Devices in the Sensing and Degradation of Target Compounds: A Mini-Review of the Recent Contributions of 2020–2023. J. Braz. Chem. Soc. 2024, 35, e-20230143. [Google Scholar] [CrossRef] [Scilit]
  48. Ojewumi, M.E.; Chen, G. Hydrochar Production by Hydrothermal Carbonization: Microwave versus Supercritical Water Treatment. Biomass 2024, 4, 574–598. [Google Scholar] [CrossRef] [Scilit]
  49. Rabichi, I.; Ezzahi, K.; Yaacoubi, F.E.; Izghri, Z.; Ennaciri, K.; Ounas, A.; Yaacoubi, A.; Baçaoui, A.; Hafidi, M.; El Fels, L. Evaluating the fixed-bed column adsorption capacity of olive pomace biochar activated with KOH and H3PO4 for olive mill wastewater treatment: Insights from TOC and HPLC analysis. Chemosphere 2025, 377, 144356. [Google Scholar] [CrossRef] [Scilit]
  50. Admas, B.F.E.; De Araújo Silva Moura, L.; Christina, T.; Temesgen, G.; Silva, D.V.; Melo, R.L.F.; Do Carmo, F.R. Life Cycle Assessment of Biochar: A Bibliometric Analysis of Trends and Future Perspectives. Bioenergy Res. 2026, 19, 1. [Google Scholar] [CrossRef] [Scilit]
  51. Benaoune, S.; Merzougui, A.; Remmani, R.; Bouzidi, N.; Ruiz-Canales, A.; Akacha, I.; Djellouli, A. Dual-Activated Tamarix Gallica-Derived Carbons for Enhanced Glyphosate Adsorption: A Comparative Study of Phosphoric and Sulfuric Acid Activation. Materials 2025, 18, 511. [Google Scholar] [CrossRef] [Scilit]
  52. Ang, T.N.; Young, B.R.; Taylor, M.; Burrell, R.; Aroua, M.K.; Baroutian, S. Breakthrough analysis of continuous fixed-bed adsorption of sevoflurane using activated carbons. Chemosphere 2020, 239, 124839. [Google Scholar] [CrossRef] [Scilit]
  53. Saleh, A.M.; Mahdi, H.H.; Alias, A.B.; Hadi, N.K.A.; Qarizada, D.; Jawad, A.H.; Saleh, N.M. Equilibrium and kinetic studies in adsorption of H2S using coconut shell activated carbon xerogel: Effect of mass adsorbent and temperature. Desalination Water Treat. 2024, 317, 100149. [Google Scholar] [CrossRef] [Scilit]
  54. Hernandes, P.T.; Franco, D.S.; Georgin, J.; Salau, N.P.; Dotto, G.L. Investigation of biochar from Cedrella fissilis applied to the adsorption of atrazine herbicide from an aqueous medium. J. Environ. Chem. Eng. 2022, 10, 107408. [Google Scholar] [CrossRef] [Scilit]
  55. Park, J.M.; Jhung, S.H. Polyaniline-derived carbons: Remarkable adsorbents to remove atrazine and diuron herbicides from water. J. Hazard. Mater. 2020, 396, 122624. [Google Scholar] [CrossRef] [Scilit] [PubMed]
  56. Yanan, C.; Ali, J.; Sellaoui, L.; Dhaoudi, F.; Franco, D.S.; Georgin, J.; Erto, A.; Vieillard, J.; Badawi, M. Elucidating the adsorption mechanism of herbicide Diuron onto activated carbons via steric, energetic and thermodynamic investigations. J. Water Process Eng. 2023, 53, 103910. [Google Scholar] [CrossRef] [Scilit]
  57. González-Rodríguez, L.; Yáñez, O.; Ulecia, K.M.; Hidalgo-Rosa, Y.; Carmona, X.G.; Tesser, C.U. Exploring the adsorption of five emerging pollutants on activated carbon: A theoretical approach. J. Environ. Chem. Eng. 2024, 12, 112911. [Google Scholar] [CrossRef] [Scilit]
  58. Shen, R.; Lu, J.; Yao, Z.; Zhao, L.; Wu, Y. The hydrochar activation and biocrude upgrading from hydrothermal treatment of lignocellulosic biomass. Bioresour. Technol. 2021, 342, 125914. [Google Scholar] [CrossRef] [Scilit]
  59. Zahoor, M.; Ullah, A.; Ullah, Z.; Abbas, M.; Shan, A.; Ullah, R.; Umar, M.N.; Khan, S.W. Remediation of metribuzin (herbicide) from aqueous solution using turnip peel biomass-based zinc oxide nanocomposite. Desalination Water Treat. 2023, 306, 208–219. [Google Scholar] [CrossRef] [Scilit]
  60. Li, X.; Shen, H.; Pan, X.; Zou, Z.; Zhang, H.; Wang, Y. Kinetic study of the fluoride removal by gypsum using revised pseudo-second-order model: Insights on the surface adsorption and precipitation. Surf. Interfaces 2025, 62, 106304. [Google Scholar] [CrossRef] [Scilit]
  61. Bullen, J.C.; Saleesongsom, S.; Gallagher, K.; Weiss, D.J. A Revised Pseudo-Second-Order Kinetic Model for Adsorption, Sensitive to Changes in Adsorbate and Adsorbent Concentrations. Langmuir 2021, 37, 3189–3201. [Google Scholar] [CrossRef] [Scilit]
  62. Cortés, J.-C.; Navarro-Quiles, A.; Santonja, F.-J.; Sferle, S.-M. Statistical analysis of randomized pseudo-first/second order kinetic models. Application to study the adsorption on cadmium ions onto tree fern. Chemom. Intell. Lab. Syst. 2023, 240, 104910. [Google Scholar] [CrossRef] [Scilit]
  63. Vareda, J.P. On validity, physical meaning, mechanism insights and regression of adsorption kinetic models. J. Mol. Liq. 2023, 376, 121416. [Google Scholar] [CrossRef] [Scilit]
  64. Al-Harby, N.F.; Albahly, E.F.; Mohamed, N.A. Kinetics, Isotherm and Thermodynamic Studies for Efficient Adsorption of Congo Red Dye from Aqueous Solution onto Novel Cyanoguanidine-Modified Chitosan Adsorbent. Polymers 2021, 13, 4446. [Google Scholar] [CrossRef] [Scilit] [PubMed]
  65. Debord, J.; Harel, M.; Bollinger, J.C.; Chu, K.H. The Elovich isotherm equation: Back to the roots and new developments. Chem. Eng. Sci. 2022, 262, 118012. [Google Scholar] [CrossRef] [Scilit]
  66. Saleh, T.A. Kinetic models and thermodynamics of adsorption processes: Classification. Interface Sci. Technol. 2022, 34, 65–97. [Google Scholar]
  67. de Oliveira, C.; Renda, C.G.; Moreira, A.J.; Pereira, O.A.; Pereira, E.C.; Freschi, G.P.; Bertholdo, R. Evaluation of a graphitic porous carbon modified with iron oxides for atrazine environmental remediation in water by adsorption. Environ. Res. 2023, 219, 115054. [Google Scholar] [CrossRef] [Scilit]
  68. Giles, C.H.; D’Silva, A.P.; Easton, I.A. A general treatment and classification of the solute adsorption isotherm part. II. Experimental interpretation. J. Colloid Interface Sci. 1974, 47, 766–778. [Google Scholar] [CrossRef] [Scilit]
  69. Jiang, J.; Wang, L.; Zhang, C.; Zhao, X. Health risks of sulfentrazone exposure during zebrafish embryo-larvae development at environmental concentration. Chemosphere 2022, 288, 132632. [Google Scholar] [CrossRef] [Scilit]
  70. Limousin, G.; Gaudet, J.-P.; Charlet, L.; Szenknect, S.; Barthès, V.; Krimissa, M. Sorption isotherms: A review on physical bases, modeling and measurement. Appl. Geochem. 2007, 22, 249–275. [Google Scholar] [CrossRef] [Scilit]
  71. Cao, B.; Li, M.; Zhang, T.; Gong, T.; Yang, T.; Xi, B.; Lu, H.; Wang, Z. Dynamics and mechanisms of atrazine adsorption on biogas-residue biochar with citric acid modification. Sep. Purif. Technol. 2024, 337, 126151. [Google Scholar] [CrossRef] [Scilit]
  72. Shi, Y.; Wang, S.; Xu, M.; Yan, X.; Huang, J.; Wang, H.-W. Removal of neonicotinoid pesticides by adsorption on modified Tenebrio molitor frass biochar: Kinetics and mechanism. Sep. Purif. Technol. 2022, 297, 121506. [Google Scholar] [CrossRef] [Scilit]
  73. Wang, Q.; Wu, S.; Cui, D.; Zhou, H.; Wu, D.; Pan, S.; Xu, F.; Wang, Z. Co-hydrothermal carbonization of organic solid wastes to hydrochar as potential fuel: A review. Sci. Total Environ. 2022, 850, 158034. [Google Scholar] [CrossRef] [Scilit] [PubMed]
  74. Abumelha, H.M.; Sallam, S.; Alourfi, N.M.; Jawhari, A.H.; Pashameah, R.; Al-Ahmed, Z.A.; Al-Bonayan, A.M.; El-Metwaly, N.M. Araucaria gum embedded kaolinite/ferric xanthan composite for enhanced adsorption of atrazine: Kinetic, thermodynamic, and column studies. Int. J. Biol. Macromol. 2025, 308, 142661. [Google Scholar] [PubMed]
  75. Wang, Y.; Chen, Y.; Wang, L.; Mo, Y.; Lin, X.; Gao, S.; Chen, M. Efficient removal of atrazine in wastewater by washed peanut shells biochar: Adsorption behavior and biodegradation. Process Biochem. 2025, 154, 22–34. [Google Scholar] [CrossRef] [Scilit]
  76. Huang, Z.; Li, Y.; Mei, J.; Ding, Y.; Wang, X. Preparation of poly(divinylbenzene-co-methyl acrylate) adsorbent with tunable surface hydrophilicity for atrazine removal. Surf. Interfaces 2024, 49, 104371. [Google Scholar] [CrossRef] [Scilit]
  77. Tang, Y.; Liu, D.; He, H.; Zou, J.; Wang, D.; Yang, X.; Zhang, L.; Yang, C. Immobilization of zirconium-modified activated carbon in an alginate matrix for the removal of atrazine: Preparation, performances and mechanisms. Environ. Technol. Innov. 2024, 35, 103699. [Google Scholar] [CrossRef] [Scilit]
  78. Phan, K.A.; Phihusut, D.; Tuntiwiwattanapun, N. Preparation of rice husk hydrochar as an atrazine adsorbent: Optimization, characterization, and adsorption mechanisms. J. Environ. Chem. Eng. 2022, 10, 107575. [Google Scholar] [CrossRef] [Scilit]
  79. Xiao, Y.; Zheng, L.; Wang, S.; Dong, M.; Gao, A.; Han, Z.; Liang, S.; Zhang, H. Bioremediation of metribuzin-contaminated soil by corn straw biochar-immobilized Bacillus cereus N1. Process Biochem. 2023, 130, 520–533. [Google Scholar] [CrossRef] [Scilit]
  80. Mohanty, S.S.; Singh, P.; Nistala, S.; Mohanty, K. Understanding the environmental fate and removal strategies of phenylurea herbicides: A comprehensive review. J. Hazard. Mater. Adv. 2024, 16, 100496. [Google Scholar] [CrossRef] [Scilit]
  81. Zeng, Z.; Jia, B.; Liu, X.; Chen, L.; Zhang, P.; Qing, T.; Feng, B. Adsorption behavior of triazine pesticides on polystyrene microplastics aging with different processes in natural environment. Environ. Pollut. 2024, 356, 124319. [Google Scholar] [CrossRef] [Scilit] [PubMed]
  82. Akinnawo, S.O. Adsorptive removal of pesticides from wastewater using conventional and framework materials. Desalination Water Treat. 2025, 321, 100905. [Google Scholar] [CrossRef] [Scilit]
  83. Wang, Q.; Ren, X.; Tang, S.-F. Three-dimensional hierarchical porous biochar as an efficient adsorbent for simultaneous extraction of ametryn and benzo[a]pyrene from tea beverages. J. Mol. Struct. 2024, 1318, 139415. [Google Scholar] [CrossRef] [Scilit]
Figure 1. Point of zero charge (pHpzc) of passion fruit waste-derived bioadsorbents (CB, CBA, H, and HA).
Agriengineering 08 00135 g001
Figure 2. TGA and DTG curves of (A) passion fruit residue biomass, (B) hydrochar derived from passion fruit residue in water, (C) biomass chemically activated with phosphoric acid 0.5 mol L−1, and (D) hydrochar derived from passion fruit residue chemically activated with phosphoric acid 0.5 mol L−1. TGA: thermogravimetric analysis (black line); DTG: derivative thermogravimetric analysis (blue line).
Agriengineering 08 00135 g002
Figure 3. FTIR-ATR spectra of passion fruit residue biomass (CB), biomass chemically activated with phosphoric acid 0.5 mol L−1 (CBA), hydrochar derived from passion fruit residue in water (H), and hydrochar derived from passion fruit residue chemically activated with phosphoric acid 0.5 mol L−1 (HA).
Agriengineering 08 00135 g003
Figure 4. SEM images of the surface morphology at 1 kx magnification: (A) passion fruit residue biomass, (B) biomass chemically activated with phosphoric acid 0.5 mol L−1, (C) hydrochar derived from passion fruit residue in water, and (D) hydrochar derived from passion fruit residue chemically activated.
Agriengineering 08 00135 g004
Figure 5. Maximum adsorption capacity of the herbicides atrazine, metribuzin, and ametyn on passion fruit residue hydrochar. Equal letters indicate no statistical difference by Tukey’s test (p ≤ 0.05). Vertical bars indicate the standard deviation of the mean.
Agriengineering 08 00135 g005
Figure 6. Adsorptive capacity of hydrochar in solutions with different pH. Equal letters indicate no statistical difference by Tukey’s test (p < 0.05). Vertical bars indicate the standard deviation of the mean.
Agriengineering 08 00135 g006
Figure 7. Kinetic study (A) and adsorption mechanism (B) of atrazine, ametryn, and metribuzin on acid-activated hydrochar derived from passion fruit residues. Vertical bars indicate the standard deviation of the mean.
Agriengineering 08 00135 g007
Figure 8. Adsorption equilibrium isotherms for the herbicides atrazine, ametryn, and metribuzin, using Langmuir and Freundlich models. Vertical bars indicate the standard deviation of the mean.
Agriengineering 08 00135 g008
Figure 9. Percent desorption of atrazine, metribuzin, and ametryn from aqueous solutions. Equal letters indicate no statistical difference by Tukey’s test (p < 0.05). Vertical bars represent the standard deviation of the mean.
Agriengineering 08 00135 g009
Table 1. Optimized parameters for analysis of triazines.
HerbicideRetention Time (min)QuantificationConfirmation
MRM
Transition m/z
DP (V)EC (V)MRM
Transition m/z
DP (V)EC (V)
Atrazine2.852216.1 > 174.1−18−16216.1 > 96.1−18−25
Ametryn2.818228.0 > 186.0−19−17228.0 > 96.1−18−25
Metribuzin2.964215.1 > 187.2−19−17215.1 > 49.2−18−25
MRM: multiple reaction monitoring, mass by charge (m/z); DP: decomposition potential, in volts (V); EC: collision energy, in volts (V).
Table 2. Kinetic sorption model equations, including Pseudo-First-order (PFO), Pseudo-Second-order (PSO), Elovich, and Intraparticle Diffusion models.
Kinetic ModelEquation
PFO l n q e q t = l n q e k 1 t Equation (2)
PSO d q t d t = k 2 q e q t 2 Equation (3)
Elovich q t = 1 β l n 1 + α β t Equation (4)
Intraparticle Diffusion q t = K d t 0.5 + C Equation (5)
qe is the adsorption capacity at equilibrium (mg g−1); qt is the adsorption capacity at the evaluated time (mg g−1), k1 is the pseudo-first-order adsorption rate constant (min−1); k2 is the pseudo-second-order rate constant (g mg min−1); α is the initial adsorption rate (mg g−1 min−1); β is the desorption constant (mg g−1); kd is the intraparticle diffusion coefficient (mg g−1 min−0.5); C is the constant related to the resistance to diffusion (mg g−1); t is the reaction time (min).
Table 3. Isothermal sorption models.
Isotherm ModelEquation
Freundlich l n q e = l n k f + 1 n l n C e Equation (6)
Langmuir q e = q m a x K L C e 1 + K L C e Equation (7)
qe is the amount adsorbed at equilibrium (mg g−1), Ce is the equilibrium concentration in solution (mg L−1), kf is the Freundlich adsorption capacity constant (mg1−1/n L1/n g−1), and 1/n is a constant related to the heterogeneity of the surface. kL is the Langmuir constant (L mg−1); qmax is the maximum adsorption capacity (mg g−1).
Table 4. Elemental composition of bioadsorbents used in adsorption tests.
AdsorbentElemental Analysis
C (%)H (%)N (%)
CB48.76.400.77
CBA49.36.770.59
H51.77.410.39
HA57.24.750.89
Passion fruit residue biomass (CB); biomass chemically activated with phosphoric acid 0.5 mol L−1 (CBA); hydrochar derived from passion fruit residue in water (H); hydrochar derived from passion fruit residue chemically activated with phosphoric acid 0.5 mol L−1 (HA); elemental carbon (C); elemental hydrogen (H); elemental nitrogen (N).
Table 5. Adsorptive capacity of various materials produced from passion fruit residues for the removal of atrazine, metribuzin, and ametryn.
AdsorbentAdsorption(µg g−1)
AtrazineMetribuzinAmetryn
CB44.662.9234.86
CBA39.231.7916.02
H40.197.0427.22
HA50.4026.4937.00
Passion fruit residue biomass (CB); biomass chemically activated with phosphoric acid 0.5 mol L−1 (CBA); hydrochar derived from passion fruit residue in water (H); hydrochar derived from passion fruit residue chemically activated with phosphoric acid 0.5 mol L−1 (HA).
Table 6. Kinetic model parameters for the herbicides atrazine, ametryn, and metribuzin.
Kinetic
Model
ParameterAtrazineMetribuzinAmetryn
Values
PFOqe (µg g−1)9.5107 ± 0.4606.8128 ± 0.18511.5224 ± 0.319
k1 (1 min−1)0.1087 ± 0.0150.0216 ± 0.0020.0912 ± 0.013
R20.790.950.83
AICc7.91−11.931.03
PSOqe (µg g−1)9.9823 ± 0.3557.5213 ± 0.16612.0713 ± 0.173
k1 (g µg−1 min−1)9.0171 ± 0.0030.0042 ± 4.87 × 10−40.0122 ± 0.001
R20.900.980.96
AICc−0.56−21.64−16.32
Elovichαe (g µg−1 min−1)64.806 ± 16.8690.9085 ± 0.391135.0729 ± 124.466
βe (g µg−1)1.015 ± 0.0370.8015 ± 0.0930.8907 ± 0.096
R20.990.930.92
AIC−17.990.58−0.87
Weber and MorrisSegment IKd (µg g−1 min0.5)0.24080.52080.8497
C (µg g−1)5.91020.62474.7230
R20.980.960.91
Segment IIKd (µg g−1 min0.5)0.02810.03880.1555
C (µg g−1)9.75856.10109.5186
R20.980.850.99
Segment IIIKd (µg g−1 min0.5) 0.0042
C (µg g−1) 12.0350
R2 0.9816
R2: coefficient of determination; qe: amount of herbicide adsorbed at equilibrium; k1 and k2: rate constants for the pseudo-first-order and pseudo-second-order kinetic models, respectively; AICc: corrected Akaike criterion; Kd: intraparticle diffusion coefficient (µg g−1 min−0.5); and C: constant related to the resistance to diffusion (µg g−1).
Table 7. Parameters of adsorption isotherms of atrazine, ametryn and metribuzin on acidic hydrochar.
IsothermParameterHerbicides
AtrazineMetribuzinAmetryn
FreundlichKF (µg−1−1/n L1/n g−1)0.08 ± 0.0020.10 ± 0.0080.33 ± 0.028
n1.06 ± 0.0051.25 ± 0.0291.25 ± 0.026
1/n0.940.800.79
R20.990.990.99
AICc−3.9198.05313.44
LangmuirQmax (µg g−1)390.91 ± 45.9947.51 ± 6.14121.35 ± 30.36
KL (10−4 L µg−1)1.56 ± 0.219.51 ± 1.3912.60 ± 4.06
RL0.72–0.970.46–0.930.28–0.86
R20.990.990.98
AICC1.313.9023.17
R2: coefficient of determination; AICc = corrected Akaike criterion; KF and n: Freundlich constants related to adsorption capacity and intensity, respectively; 1/n: constant related to surface heterogeneity; KL: Langmuir constant; Qmax: maximum adsorption capacity; and RL: separation factor.
Disclaimer/Publisher’s Note: The statements, opinions and data contained in all publications are solely those of the individual author(s) and contributor(s) and not of MDPI and/or the editor(s). MDPI and/or the editor(s) disclaim responsibility for any injury to people or property resulting from any ideas, methods, instructions or products referred to in the content.