


Abstract
Biochar and poultry litter have been proposed as soil amendments to improve soil health in coarse-textured agricultural soils, yet their field performance under southeastern U.S. conditions remains inconclusive. This two-year field study evaluated five biochar application rates (0–44.8 Mg ha−1) combined with inorganic fertilizer or poultry litter on selected soil health indicators in a sandy loam Ultisol under sweet corn production in the Georgia Coastal Plain. Treatments were arranged in a randomized complete block design with four replications and analyzed using linear mixed-effects models. Biochar application did not significantly affect aggregate stability, pH, cation exchange capacity, soluble salts, organic matter, active carbon, or estimated nitrogen mineralization, with only a marginal three-way interaction observed for microbial respiration. Poultry litter significantly increased microbial respiration relative to inorganic fertilizer, whereas responses for the remaining soil health indicators were broadly similar between fertilizer sources. Year was the dominant source of variation, with extreme rainfall in 2024 reducing aggregate stability, soluble salts, microbial respiration, and nitrogen mineralization while increasing organic matter and active carbon. These findings indicate that short-term soil health responses were driven primarily by environmental conditions rather than management practices. Under the conditions of this study, either fertilizer source can be used successfully, whereas longer-term studies are needed to determine whether biochar aging enhances soil function in sandy loam Ultisols.
1. Introduction
Sustainable agricultural practices are increasingly crucial for improving soil health and crop productivity while mitigating environmental impacts [1]. Sweet corn (Zea mays var. saccharata) is a major economic driver in Georgia’s vegetable industry. According to the 2023 Georgia Farm Gate Value Report, sweet corn ranked third among the top vegetables in the state, with 25,074 acres (10,147 ha) planted, contributing $175 million in production value and representing 13.11% of Georgia’s total vegetable value [2]. Given this economic importance, optimizing soil resilience is essential for ensuring the profitability and long-term sustainability of the state’s vegetable industry.
Agricultural production in the southeastern U.S., particularly in the Coastal Plain region of southern Georgia, is constrained by the predominance of Ultisols [3]. These soils are characterized by low organic matter, natural acidity, poor water retention, limited infiltration, and high liming requirements [4,5,6]. To address these constraints, biochar—a carbon-rich byproduct derived from the pyrolysis of organic materials—has gained significant attention for its potential to improve soil structure, water retention, and nutrient dynamics [7,8]. In addition, poultry litter—a readily available organic fertilizer in Georgia, one of the leading poultry-producing states in the United States—provides a cost-effective source of nitrogen (N), phosphorus (P), and potassium (K) [2,9]. However, the land application of poultry litter is not without challenges. If not managed properly, it can lead to nitrogen losses through volatilization or leaching, reducing its agronomic efficiency and posing environmental risks [10,11]. Furthermore, it can harbor pathogens, presenting potential health concerns [12].
Field studies have demonstrated that soil management practices, including biochar and organic amendments, can improve soil health and crop productivity [13]. A comprehensive review reported that biochar generally reduced soil bulk density by 3–16%, increased water-holding capacity by 30–50%, and enhanced cation exchange capacity by 20–60%, with responses influenced by biochar feedstock, production conditions, application rate, and soil characteristics [14]. Supporting these findings, hardwood biochar increased soil pH from 5.8 to 6.7 while improving the availability of phosphorus, calcium, magnesium, and potassium, although excessive application rates reduced sweet corn yield, highlighting the importance of optimizing biochar application rates [15]. Poultry litter has likewise been shown to improve soil fertility through sustained increases in soil carbon, nutrient availability, cation exchange capacity, and soil pH compared with commercial fertilizers, as demonstrated by a meta-analysis of 134 studies [16]. Supporting these findings, long-term studies in southeastern U.S. Ultisols showed that poultry litter increased corn grain yield by 18%, with even greater improvements when combined with conservation tillage, demonstrating the long-term agronomic benefits of improved soil management [17]. When applied together, biochar and poultry litter further improved soil water-holding capacity and reduced nutrient leaching compared with poultry litter alone, suggesting complementary benefits for soil quality [18]. Despite these documented benefits, few field-scale studies have evaluated how biochar application rate interacts with fertilizer source, particularly inorganic fertilizer and poultry litter, to influence physical, chemical, and biological soil health indicators in sweet corn production systems on the highly weathered, low-organic-matter Ultisols of the Georgia Coastal Plain.
Furthermore, these soil management strategies have become increasingly important in Georgia, where rising temperatures and shifting precipitation patterns over the past century have increased the need for practices that enhance soil water retention, nutrient availability, and resilience to environmental stress [19]. To address these gaps, this study evaluates the effects of biochar application rates (0, 11.2, 22.4, 33.6, and 44.8 Mg ha−1) combined with inorganic (granular) and poultry litter fertilizers on specific soil health indicators in a bareground system in southern Georgia. While the corresponding crop yield and agronomic performance data from this field trial are reported separately in a companion study [20], the present work focuses strictly on the physical, chemical, and biological dynamics of the soil profile. This research was conducted over two consecutive growing seasons (2023–2024) to capture inter-annual climate variability. Specifically, the study investigates biochar’s influence on (1) physical properties (aggregate stability), (2) chemical properties (pH, cation exchange capacity [CEC], and soluble salts), and (3) biological and nutrient-cycling indicators (organic matter, active carbon, CO2 burst, and nitrogen mineralization). We hypothesized that biochar application would enhance these soil health indicators, with the magnitude of improvement depending on fertilizer type.
2. Materials and Methods
2.1. Experimental Site
Field trials took place during the spring seasons of 2023 and 2024 at the University of Georgia (UGA) Hort Hill Farm in Tifton, Georgia (31°28′14.96″ N, 83°31′53.11″ W). The soil texture at the research site is composed of 86% sand, 12% silt, and 2% clay. Prior to starting the research, 50 composite soil samples (0–15 cm depth) were collected from the field and analyzed for nutrient content using the Mehlich 1 extraction method at Waters Agricultural Laboratory (Camilla, GA, USA). The results showed phosphorus (P) at 212.9 mg kg−1, potassium (K) at 51.3 mg kg−1, magnesium (Mg) at 23.2 mg kg−1, and calcium (Ca) at 376.8 mg kg−1. Additionally, soil analysis revealed an organic matter content of 0.47%, a pH of 5.8, and a cation exchange capacity (CEC) of 3.55 cmol kg−1.
2.2. Experimental Design and Treatments
The experiment consisted of 10 treatments, combining five biochar application rates (0, 11.2, 22.4, 33.6, and 44.8 Mg ha−1) with two fertilizer types: inorganic (granular) and poultry litter. These application rates were selected to represent a broad range commonly evaluated in previous meta-analyses investigating the effects of biochar on soil properties and crop productivity [21,22]. These treatments were confined to the same field plots for two consecutive years. The trial was designed using a randomized complete block design (RCBD) with four replications per treatment. Each replication consisted of a block containing all ten treatments, which were randomly assigned to individual plots within each block. Blocks were delineated based on visible soil texture gradients and historical management zones to account for spatial variability. A 2 m alley was maintained between blocks, and 1.5 m buffer zones separated plots within each block to prevent cross-contamination and facilitate field operations. Each plot measured 16.7 m2 (1.83 m × 9.14 m), with the total experimental area covering approximately 0.8 ha.
2.2.1. Biochar Characteristics
The biochar used in this study was supplied by Wakefield Biochar (Valdosta, GA, USA) and was produced from wood chips and plant residues via pyrolysis at 600 °C. Comprehensive characterization was conducted by the International Biochar Initiative (IBI) Laboratory (Columbia, MO, USA) following IBI-approved methods. The biochar had a moisture content of 38.6% (wet weight), a bulk density of 10.6 lb ft−3 (170 kg m−3), a pH of 8.84, and an electrical conductivity (EC) of 0.152 dS m−1. Total organic carbon content was 21.1% (total dry mass), with a hydrogen-to-carbon (H:C) molar ratio of 0.18 (well below the 0.7 IBI stability threshold), total nitrogen of 0.12%, and total ash content of 57.0% of total dry mass. The liming value, measured as calcium carbonate equivalence, was 5.5%, with carbonates contributing 3.9% as CaCO3. The biochar exhibited a surface area of 205 m2 g−1 (correlated from butane activity of 2.3 g 100 g−1). Particle size distribution was dominated by the <0.5 mm (41.2%) and 2–4 mm (29.1%) fractions, with smaller contributions from the 0.5–1 mm (8.6%), 1–2 mm (19.7%), and 4–8 mm (1.5%) fractions; no particles exceeded 8 mm; volatile matter content was 13.8% dry weight. On 20 February 2023, the biochar was manually broadcast evenly over the soil surface of each plot at the predetermined application rates (0, 11.2, 22.4, 33.6, and 44.8 Mg ha−1). To ensure thorough incorporation and uniform distribution within the active root zone, the biochar was immediately mixed into the upper 15 cm of the soil profile during raised-bed formation.
2.2.2. Fertilizer Applications
In both trial years, the target nitrogen application rate was 252 kg N ha−1, following UGA Extension recommendations for sweet corn production [23].
The inorganic fertilizer regime began with a pre-plant application of 56 kg N ha−1 using a granular fertilizer (10.0N–4.3P–8.3K; Rainbow Fertilizer LLC, Americus, GA, USA), applied on 27 February 2023 and 4 March 2024. Immediately following this application, raised beds were formed to prepare the planting area. The remaining 196 kg N ha−1 was divided into two supplemental applications timed to key growth stages. The first occurred at the V4 growth stage (four-leaf vegetative stage), with 112 kg N ha−1 applied using the same granular fertilizer (10.0N–4.3P–8.3K; Rainbow Fertilizer LLC) on 25 April 2023 and 26 April 2024. The second application took place at the VT growth stage (tasseling vegetative stage), with 84 kg N ha−1 applied using granular urea (46.0N–0P–0K; Rainbow Fertilizer LLC) on 10 May 2023 and 9 May 2024.
The uncomposted poultry litter was sourced from a local broiler farm in Berrien County, GA (31°18′45.51″ N, 83°23′2.53″ W). Prior to application, litter samples were analyzed at Waters Agricultural Laboratory (Camilla, GA, USA) to determine nitrogen concentration. Total nitrogen content was measured via high-temperature combustion with a LECO Combustion Analyzer (LECO Corp., St. Joseph, MI, USA). On a wet-weight (as-received) basis, the litter contained 31.1 g N kg−1 in 2023 and 33.9 g N kg−1 in 2024. To achieve the target rate of 252 kg N ha−1, poultry litter was applied at rates of 8.1 Mg ha−1 in 2023 and 7.4 Mg ha−1 in 2024. In both years, the poultry litter was applied 32 days prior to planting and immediately incorporated into the soil. This incorporation timing adhered to the USDA National Organic Program’s 90-day interval requirement between manure application and harvest for crops grown in contact with soil, thereby mitigating the risk of pathogen contamination [24].
2.3. Crop Management
The sweet corn cultivar selected for this study was ‘Obsession’ (Seedway, Hall, NY, USA). Planting took place on 31 March 2023 and 2 April 2024 using a tractor-mounted vacuum seed planter (Monosem 2-Row Planter; Edwardsville, KS, USA) to ensure accurate seed placement and uniform spacing. Each plot contained two rows, with rows spaced 0.91 m apart and plants within rows spaced 15 cm apart, resulting in a target population density of approximately 74,100 plants ha−1. Herbicide and insecticide applications adhered to the University of Georgia (UGA) Extension’s standard recommendations [25].
2.4. Data Collection
Soil sampling was conducted in accordance with the guidelines and recommendations of Robertson et al. [26]. Baseline samples were taken before raised-bed formation and prior to planting. Subsequent soil samples were collected at approximately 30-day intervals throughout the growing season. In 2023, sampling events occurred on 27 February, 29 March, 28 April, and 28 May. In 2024, sampling followed a parallel timeline on 4 March, 3 April, 3 May, and 2 June. During each sampling event, eight soil cores per plot were extracted using a soil probe at a depth of 0–15 cm, specifically targeting the center of the plot near the root zone to ensure representative sampling. The collected samples were placed into labeled paper bags corresponding to their respective plots. To reduce moisture content, soil samples were air-dried at room temperature for one week. Once dried, they were sieved through a 2 mm mesh to eliminate unwanted materials such as rocks, roots, and debris, ensuring only fine soil particles were retained for analysis. The cleaned samples were then transferred to new, labeled paper bags to prevent cross-contamination and maintain sample integrity until further processing. Environmental data, including temperature and precipitation, were collected for the duration of the experiment in both years from the Georgia Automated Environmental Monitoring Network (AEMN) Tifton station [27].
2.5. Laboratory Analysis
The prepared soil samples were sent to Waters Laboratory (Camilla, GA, USA) for soil health tests, conducted according to standardized protocols. Soil health refers to the capacity of soil to function within ecosystem boundaries, sustaining plant productivity, maintaining environmental quality, and promoting plant health [28]. Soil health encompasses soil’s physical, chemical, and biological properties, as all these components work together to support its functions [29].
2.5.1. Physical Properties
Soil aggregate stability was measured using the Solvita VAST (Volumetric Aggregate Stability Test) method [30]. A 1 cm3 soil sample was placed on a 30-mesh stainless steel sieve (0.5 mm opening) and gently dipped 20–30 times into a 600 mL beaker of water over 20–30 s. After blotting excess water, the sieve was placed on a VAST Card, and the remaining soil was measured to the nearest 0.25 unit. A second cycle involved rubbing the soil gently to break down remaining aggregates, followed by 5–10 dips. Results were recorded on the lab’s internal Volumetric Aggregate Stability Worksheet.
2.5.2. Chemical Properties
Soil pH was measured in a 1:1 soil-to-water suspension [31] using a LabFit pH Analyzer (Labfit, Perth, Australia) equipped with Orion 815600 ROSS electrodes (Thermo Scientific Orion, Chelsea, MA, USA). Briefly, 20 g of air-dried, sieved soil was equilibrated with 20 mL of deionized water for 10 min following a 5 s stir prior to measurement. Cation exchange capacity (CEC) was calculated as the sum of exchangeable H+, K+, Mg2+, and Ca2+ ions (cmol kg−1) following extraction with neutral 1 M ammonium acetate (NH4OAc) and quantification via atomic absorption spectroscopy (AAS) or inductively coupled plasma [32]. Soluble salts were determined by measuring electrical conductivity (EC) in a 1:2 soil-to-water extract [33]. For this, 50 g of air-dried soil was shaken with 100 mL of deionized water for 5 min and equilibrated for 1 h; the resulting supernatant was measured using a calibrated ROSS conductivity probe according to manufacturer protocols.
2.5.3. Biological and Nutrient-Cycling Indicators
Soil organic matter (SOM) was estimated by loss on ignition (LOI) at 350 °C [34]. Briefly, a 2.5 g soil sample was oven-dried at 80 °C for 2 h, followed by ignition in a muffle furnace at 350 °C for 1.25 h. Organic matter content was calculated from mass loss on a dry weight basis. Active carbon was evaluated as permanganate oxidizable carbon (POXC) following Weil et al. [35]. A 2.5 g soil sample was reacted with 20 mL of 0.2 M KMnO4 solution, shaken for 2 min, and allowed to settle for 10 min before dilution and spectrophotometric analysis at 550 nm. Microbial activity was quantified using the Solvita CO2-Burst method [36]. Thirty grams of air-dried soil was rewetted with 9 mL of deionized water and incubated in a sealed 475 mL jar at 20 °C for 24 h with a Solvita low-level CO2 probe. Carbon dioxide (CO2) evolution was measured using a Solvita Digital Color Reader, and biological nitrogen mineralization was estimated using the equation described by Haney and Haney [37], with modifications:
This calculation is based on the 24 h aerobic incubation at 20 °C and relates microbial respiration (CO2 evolution) to nitrogen mineralization potential.
N Mineralization (kg ha−1) = [(30.5 × Log(CO2B) − 53) × 0.60] × 1.12085
2.6. Data Analysis
All statistical analyses were conducted in R (Version 4.5.1) [38]. Soil response variables were analyzed using linear mixed-effects models (LME) fitted by restricted maximum-likelihood (REML) with the nlme package (Version 3.1-168) [39]. Biochar application rate, fertilizer type, year, and their interactions were treated as fixed effects. The randomized complete block design was incorporated by including block (replication) as a random intercept, with plots nested within blocks (~1|Rep/Plot) to account for spatial variability and the correlation among repeated measurements taken from the same experimental plots over the two-year period. The significance of fixed effects and their interactions was evaluated using analysis of variance (ANOVA) on the fitted models. When significant interactions were detected, simple effects were evaluated using estimated marginal means (EM means) with the emmeans package (Version 1.11.1) [40], and pairwise comparisons were adjusted using Tukey’s honestly significant difference (HSD) method to control the family-wise error rate. Compact letter displays were generated using the multcomp (Version 1.4-28) and multcompView (Version 0.1-10) packages [41,42] to denote statistically homogeneous groups. Treatment means were visualized using ggplot2 (Version 4.0.3) [43]. Model assumptions were evaluated using normalized residuals, including Shapiro–Wilk tests for normality and Levene’s tests for homogeneity of variance. Statistical significance was declared at α = 0.05.
3. Results
3.1. Environmental Conditions
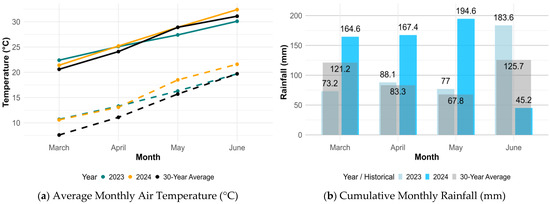
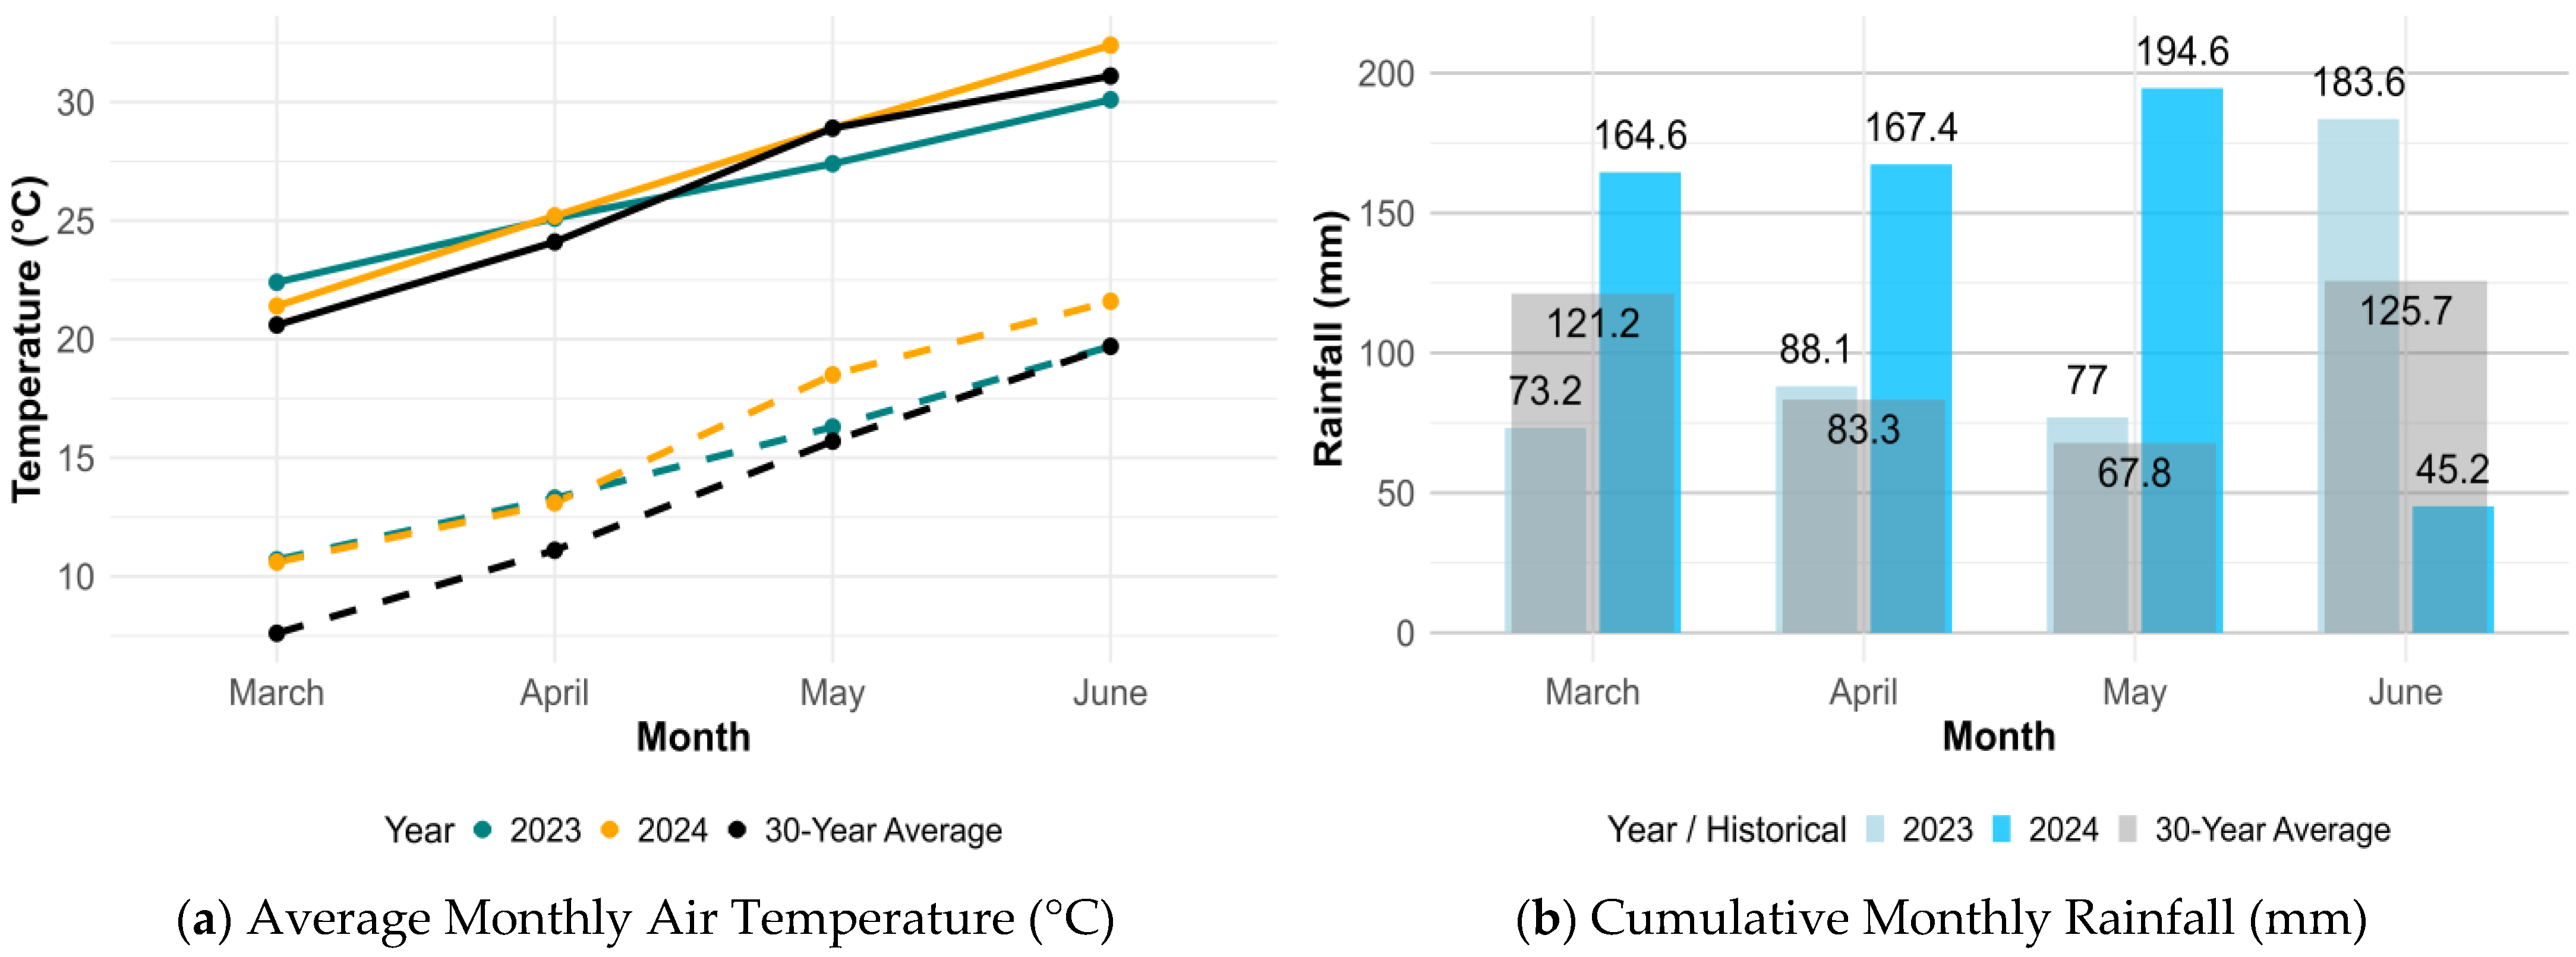
Weather conditions varied considerably between the two trial years and relative to the 30-year climate normal (1991–2020) during the primary growing months of March to June (Figure 1). Average monthly temperatures followed a similar seasonal warming trend in both years, though 2024 was consistently warmer, with seasonal averages ranging from 15.9 °C to 27.0 °C compared to 14.9 °C to 25.7 °C in 2023 (Figure 1a). When compared to the 30-year normal daily maximum and minimum temperatures, early-season temperatures in both years were generally near or above normal. However, late-season deviations emerged: June maximum temperatures in 2023 (30.1 °C) fell slightly below the normal maximum of 31.1 °C, whereas June 2024 (32.4 °C) markedly exceeded it, reflecting the warmer conditions that characterized the latter half of that season. Rainfall distribution and totals also deviated appreciably from the long-term average (Figure 1b). The 30-year normal total precipitation for the March–June period is 398 mm. The 2023 growing season accumulated 422 mm of rainfall, marginally exceeding the historical average by 24 mm. In contrast, 2024 experienced substantially more frequent and intense precipitation events, accumulating a total of 572 mm—150 mm more than the 2023 total and nearly 175 mm above the 30-year normal. This marked shift in rainfall regime, coupled with the warmer temperatures in 2024, contributed to the contrasting environmental conditions observed between the two growing seasons.
Figure 1.
Environmental conditions at the Georgia AEMN Tifton station during the 2023 and 2024 growing seasons: (a) average monthly maximum (solid lines) and minimum (dashed lines) air temperatures (°C) for 2023 (teal) and 2024 (orange), together with the corresponding 30-year climate normals (1991–2020) shown as solid black (maximum) and dashed black (minimum) lines; (b) cumulative monthly rainfall (mm) for 2023 and 2024, with the 30-year historical average shown as gray semi-transparent bars (values shown above bars). Climate normals were obtained from NOAA NCEI (station USC00098703) and represent the official 30-year baseline (1991–2020).
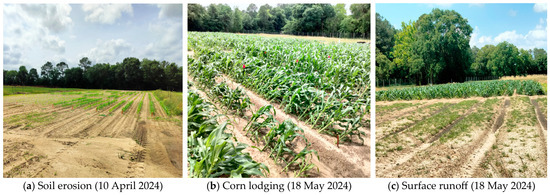
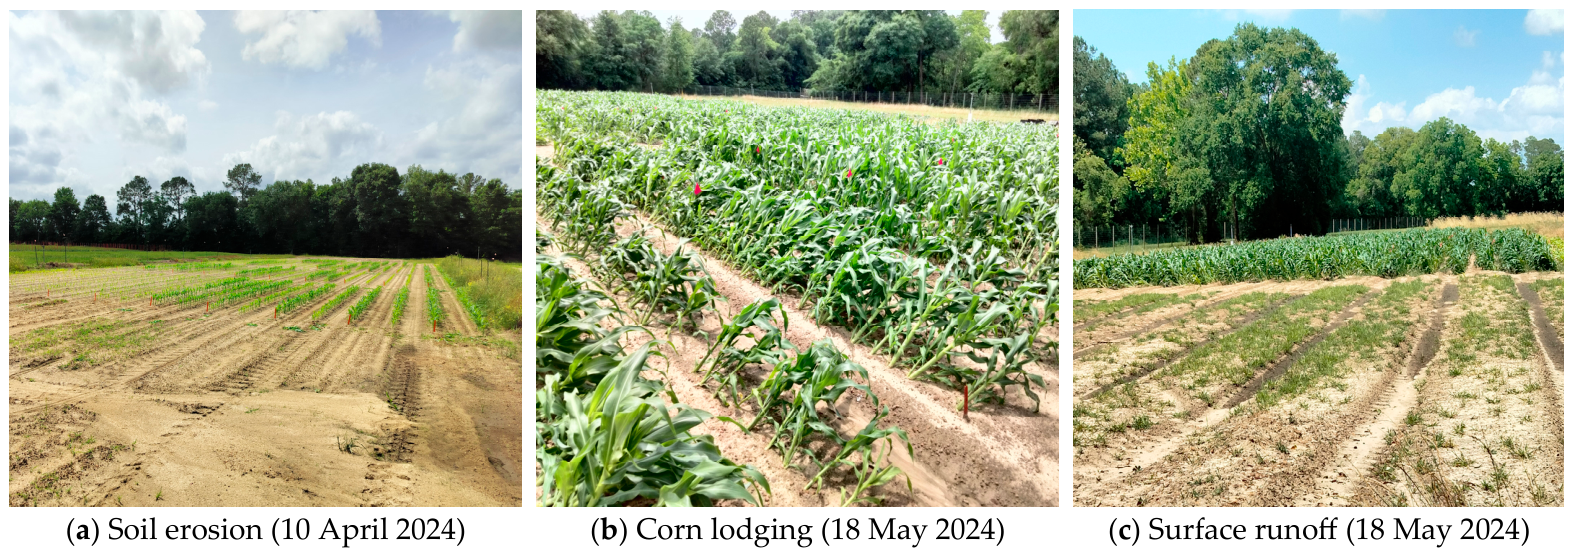
To preserve experimental integrity under these localized environmental stressors, the trial was established within the most topographically uniform area of the field. Precise GPS coordinates were recorded to ensure the exact continuity and alignment of the plots across both years, thereby reducing confounding effects associated with variable drainage patterns and edge influences. Despite these rigorous spatial controls, the 2024 growing season presented substantial management challenges due to extreme weather events (Figure 2). Intense rainfall contributed to visible topsoil displacement and surface erosion, particularly following a 64 mm event on 10 April 2024 (Figure 2a). Furthermore, the combination of high-velocity winds and heavy precipitation on 18 May 2024 resulted in severe lodging of the sweet corn crop (Figure 2b) and additional soil disturbance following a 38 mm rainfall event on the same day (Figure 2c). These extreme conditions in 2024 likely affected overall soil physical stability and nutrient dynamics, potentially increasing the risk of solute leaching and surface runoff relative to the milder 2023 season.
Figure 2.
Environmental damage and crop lodging due to extreme rainfall events during the 2024 growing season.
3.2. Soil Aggregate Stability
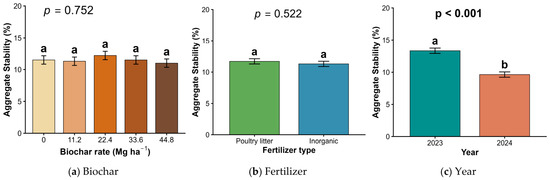
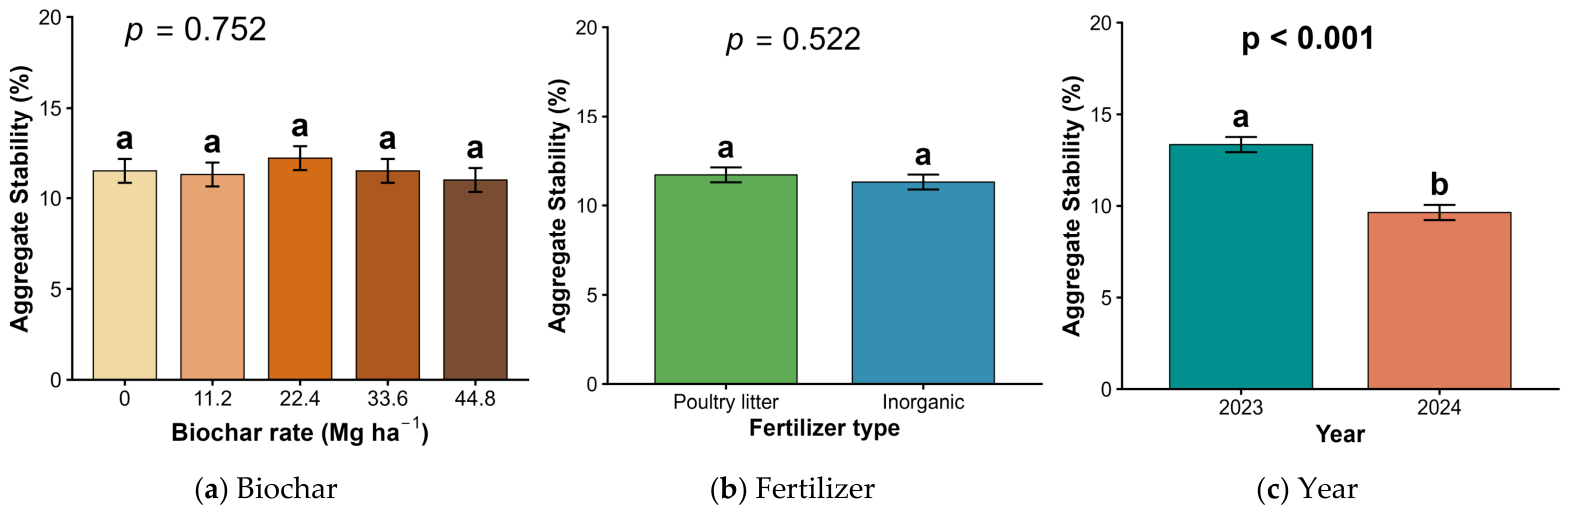
Soil aggregate stability was not influenced by biochar application rates (Figure 3a, p = 0.752) or fertilizer type (Figure 3b, p = 0.522). However, year (Figure 3c) had a highly significant effect (p < 0.001), with soil aggregate stability decreasing significantly by 27.8% from 2023 (13.35%) to 2024 (9.64%). No interactions were detected between biochar, fertilizer, or year.
Figure 3.
Soil aggregate stability as affected by (a) biochar rate, (b) fertilizer type, and (c) year. Bars represent estimated marginal means ± standard error (SE). Different letters indicate significant differences according to Tukey’s honestly significant difference (HSD) test (α = 0.05).
3.3. Soil Chemical Property Responses
Table 1 presents the effects of biochar application rates, fertilizer type, and year on soil chemical properties (pH, CEC, and soluble salts).
Table 1.
Effects of biochar rate, fertilizer type, and year on soil chemical properties.
3.3.1. Soil pH
Soil pH was not significantly influenced by biochar application rates (p = 0.1437) or fertilizer type (p = 0.0579), while year and all interactions were also non-significant (p ≥ 0.146 for all). Although the fertilizer effect approached significance, Tukey-adjusted post hoc comparisons showed no difference between poultry litter (6.19) and inorganic fertilizer (5.94). Among biochar rates, estimated means ranged from 5.78 (11.2 Mg ha−1) to 6.29 (33.6 Mg ha−1), but all rates shared the same grouping letter, indicating no significant differences. Year had virtually no effect, with nearly identical values of 6.08 (2023) and 6.05 (2024).
3.3.2. Cation Exchange Capacity (CEC)
Cation exchange capacity (CEC) was not significantly affected by biochar application (p = 0.3397), fertilizer type (p = 0.3368), or year (p = 0.2956), with estimated means ranging from 4.22 to 4.83 cmol kg−1 across biochar treatments. Although the 33.6 Mg ha−1 rate yielded the highest numerical CEC (4.83 cmol kg−1) and the 11.2 Mg ha−1 the lowest (4.22 cmol kg−1), Tukey’s post hoc test revealed no significant differences among any of the biochar rates, as all treatments shared the same grouping letter. Similarly, no significant difference was detected between fertilizer types, with poultry litter (4.62 cmol kg−1) and inorganic fertilizer (4.42 cmol kg−1) being statistically equivalent. Year also had no effect, with CEC values of 4.47 cmol kg−1 (2023) and 4.57 cmol kg−1 (2024) showing no significant difference. Furthermore, none of the two-way or three-way interactions approached significance (all p ≥ 0.257).
3.3.3. Soluble Salts
Soluble salt concentrations were not significantly affected by biochar rates (p = 0.6110) or fertilizer type (p = 0.4240). However, the year had a highly significant impact (p < 0.0001). Soluble salts in 2023 (0.299 dS m−1) were approximately four times higher than in 2024 (0.074 dS m−1), indicating a substantial decline in soil salinity levels during the second year of the trial. Although numerical differences were observed among biochar rates, with values ranging from 0.164 dS m−1 (11.2 Mg ha−1) to 0.217 dS m−1 (33.6 Mg ha−1), Tukey’s post hoc test confirmed no significant differences among any of the rates. Likewise, poultry litter (0.195 dS m−1) and inorganic fertilizer (0.178 dS m−1) were statistically equivalent. No interactions between biochar, fertilizer, or year were detected for this variable (all p ≥ 0.705).
3.4. Soil Biological and Nutrient-Cycling Responses
Table 2 presents the effects of biochar application rate, fertilizer type, and year on soil biological and nutrient-cycling indicators (organic matter, active carbon, CO2 burst, and N mineralization).
Table 2.
Effects of biochar rate, fertilizer type, and year on soil biological properties.
3.4.1. Soil Organic Matter (OM)
Soil organic matter was not significantly affected by biochar application rate (p = 0.6009) or fertilizer type (p = 0.2417). However, year had a highly significant effect (p < 0.0001), with OM being significantly higher in 2024 (0.57%) than in 2023 (0.49%), representing a 16% increase across growing seasons. Although numerical differences were observed among biochar rates, ranging from 0.51% (11.2 Mg ha−1) to 0.55% (0 Mg ha−1), Tukey’s post hoc test confirmed no significant differences among any of the rates. Likewise, poultry litter (0.54%) and inorganic fertilizer (0.52%) were statistically equivalent. No interactions were detected between biochar, fertilizer, or year (all p ≥ 0.732).
3.4.2. Active Carbon (POXC)
Active carbon was not significantly affected by biochar application rate (p = 0.7479) or fertilizer type (p = 0.1916). However, year had a highly significant effect (p < 0.0001), with active carbon being substantially higher in 2024 (304 mg kg−1) than in 2023 (259 mg kg−1), representing a 17% increase. Although numerical differences were observed among biochar rates, ranging from 262 mg kg−1 (11.2 Mg ha−1) to 289 mg kg−1 (control and 22.4 Mg ha−1), Tukey’s post hoc test confirmed no significant differences among any of the rates. Likewise, poultry litter (291 mg kg−1) and inorganic fertilizer (272 mg kg−1) were statistically equivalent. No interactions were detected between biochar, fertilizer, or year (all p ≥ 0.220).
3.4.3. Microbial Respiration (CO2 Burst)
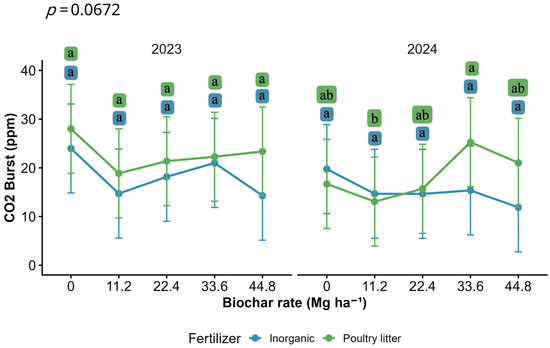
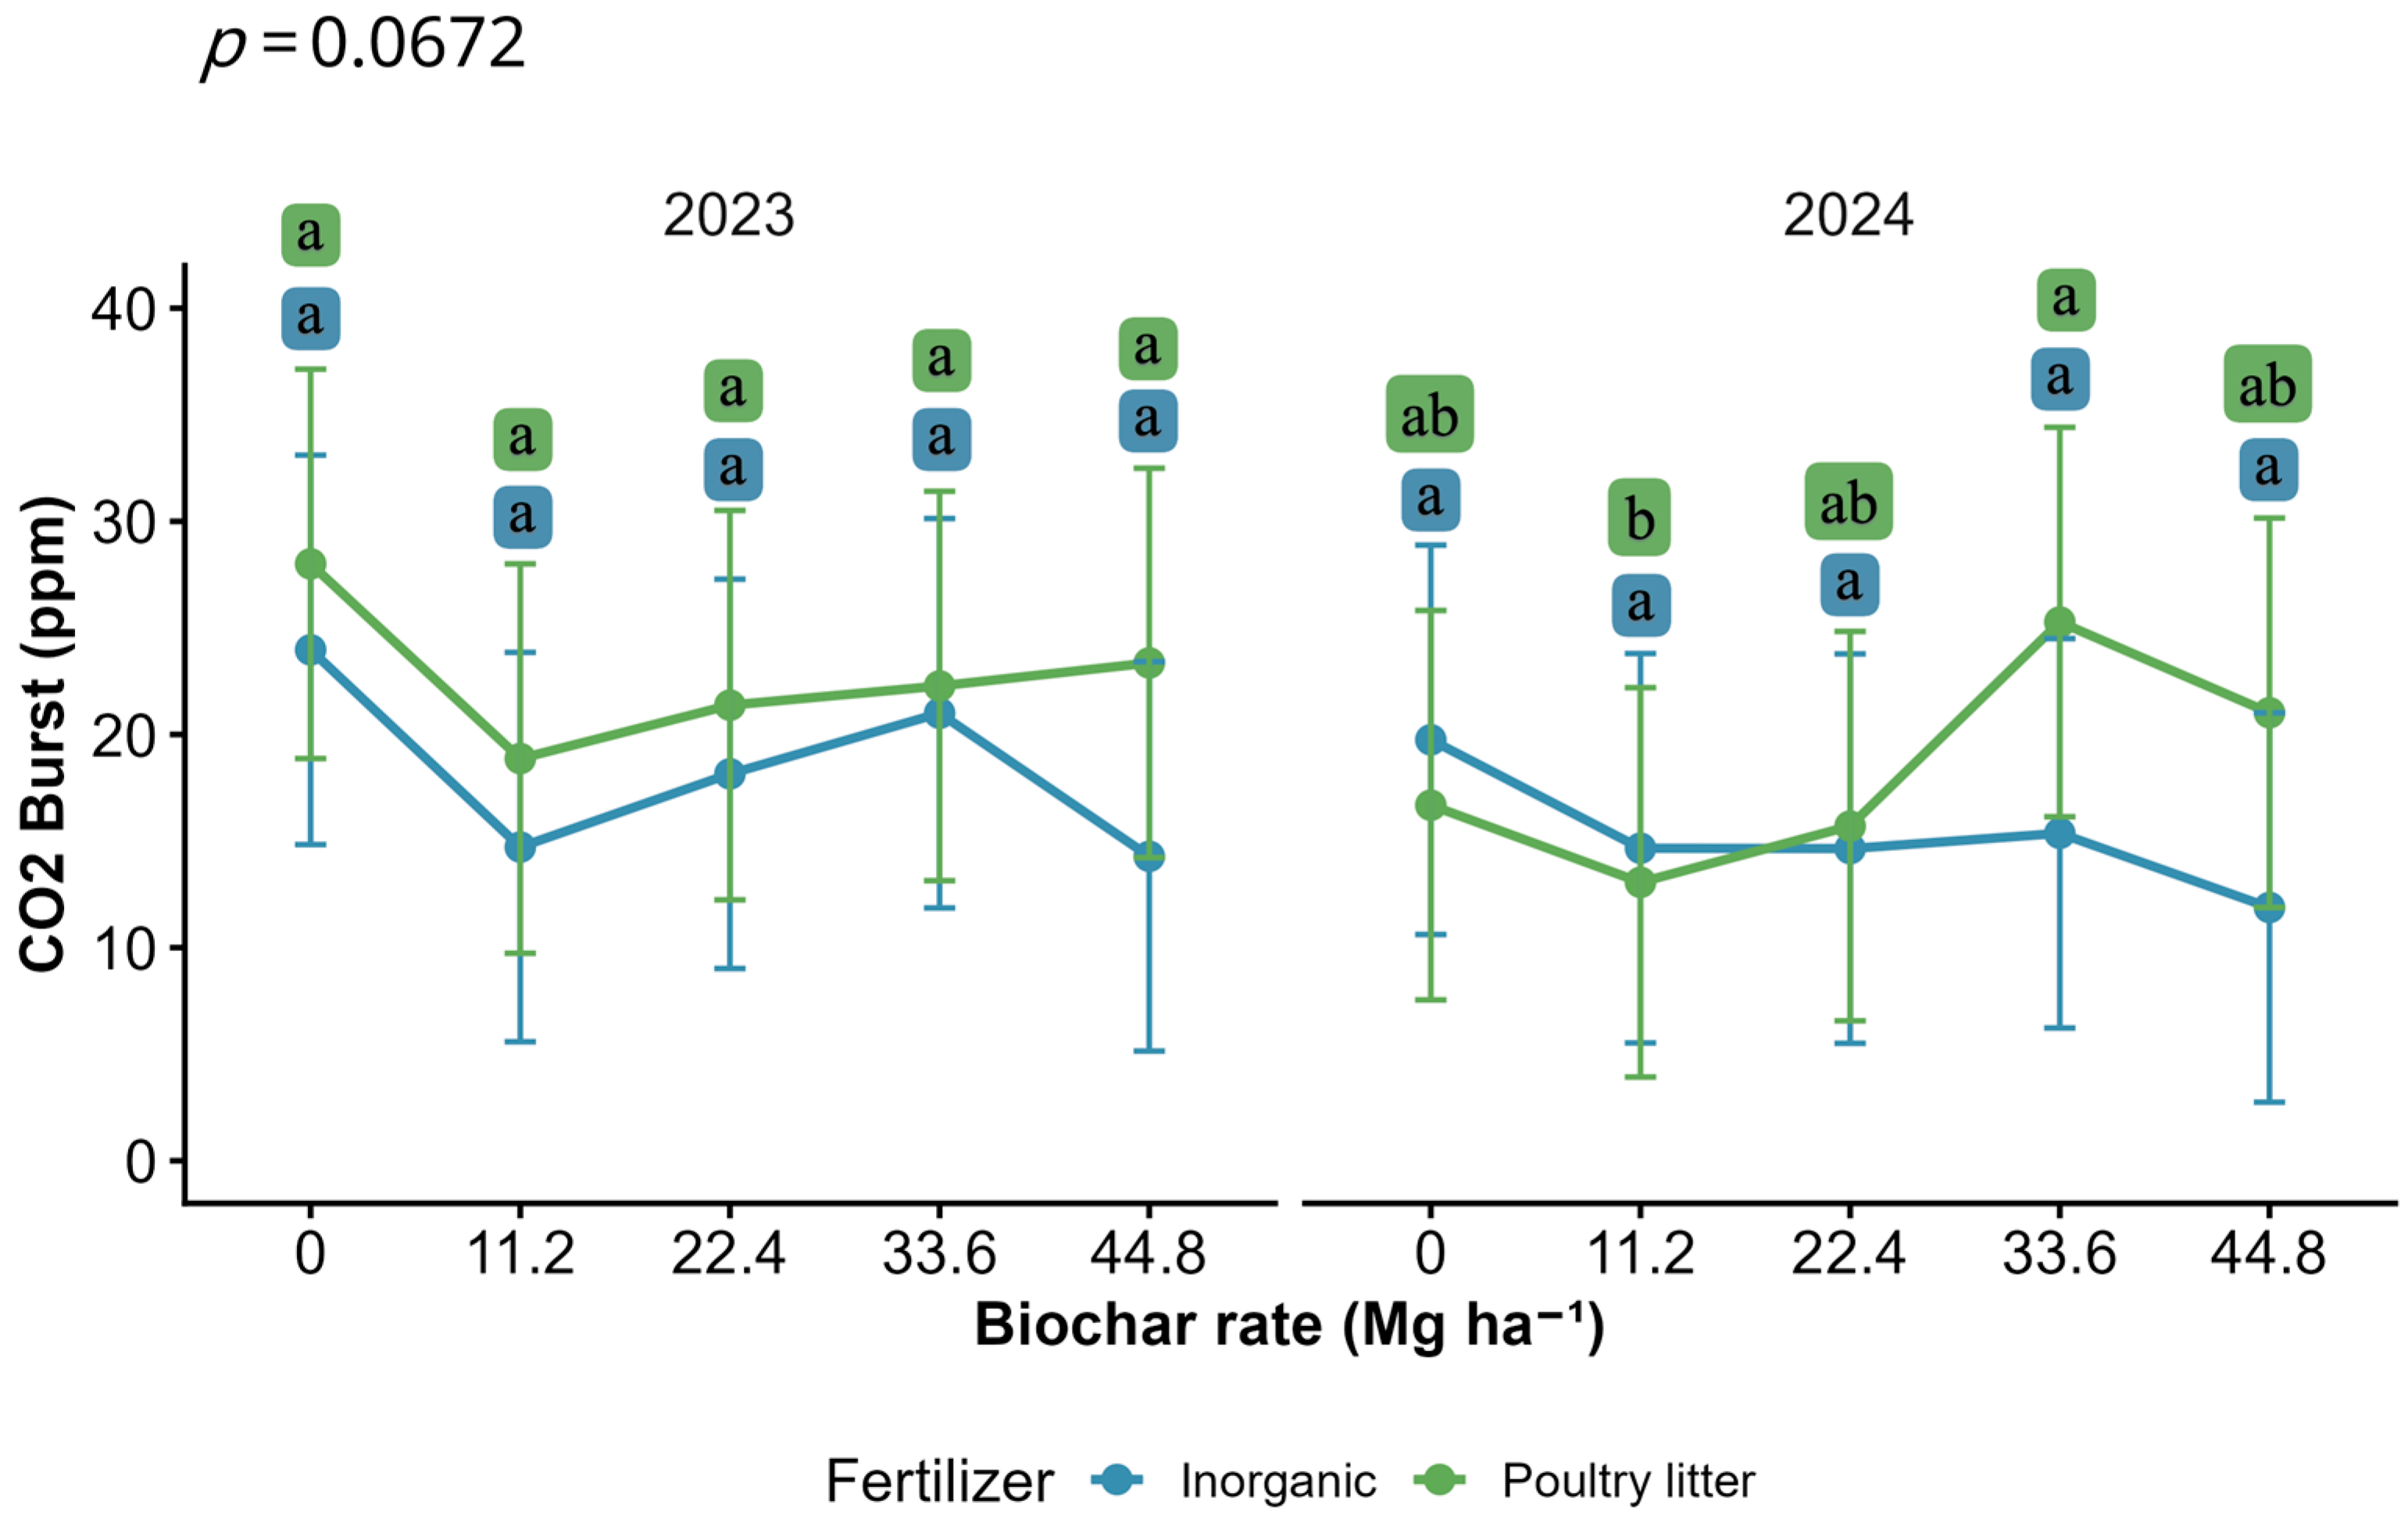
Microbial respiration, measured as CO2 burst, was significantly influenced by fertilizer type (p = 0.0210) and year (p = 0.0001), with a marginally significant effect of biochar rate (p = 0.0536). Poultry litter increased CO2 bursts by 3.8 ppm (20.6 ppm) compared to inorganic fertilization (16.8 ppm). Across years, CO2 burst was significantly higher in 2023 (20.6 ppm) than in 2024 (16.8 ppm), representing an 18.4% decrease from the first to the second year. The three-way interaction between biochar, fertilizer, and year approached significance (p = 0.0672), suggesting that the response of microbial respiration to biochar and fertilizer varied somewhat between years, though this effect did not reach conventional significance levels. No significant two-way interactions were detected (all p ≥ 0.216).
3.4.4. Three-Way Interaction Microbial Respiration (CO2 Burst)
To further investigate the marginal three-way interaction noted above, a sliced partition analysis was conducted (Figure 4). The three-way interaction between biochar rate, fertilizer type, and year for microbial respiration (CO2 burst) approached significance (p = 0.0672). Significant differences among biochar rates were limited to the 2024 poultry litter treatment, where the 33.6 Mg ha−1 rate produced a significantly higher CO2 burst (25.3 ppm) than the 11.2 Mg ha−1 rate (13.1 ppm; p = 0.0363). No significant differences among biochar rates were detected in 2023 (regardless of fertilizer type) or in 2024 under inorganic fertilization. Additionally, poultry litter significantly increased the CO2 burst compared to inorganic fertilizer at the 44.8 Mg ha−1 rate in 2023 (p = 0.0309) and at the 33.6 and 44.8 Mg ha−1 rates in 2024 (p = 0.0194 and p = 0.0299, respectively). Given the marginal nature of the three-way interaction, these findings should be interpreted with caution.
Figure 4.
Three-way interaction between biochar rate, fertilizer type, and year on microbial respiration (CO2 burst). Points represent estimated marginal means ± standard error (SE). Means with different letters are significantly different according to Tukey’s honestly significant difference (HSD) test (α = 0.05).
3.4.5. Estimated Biological N Mineralization
Estimated nitrogen mineralization was not significantly affected by biochar application rate (p = 0.0579) or fertilizer type (p = 0.0562), though both approached significance. However, year had a significant effect (p = 0.0017), with N mineralization being significantly higher in 2023 (10.45 kg ha−1) than in 2024 (8.99 kg ha−1), representing a 14.0% decrease from the first to the second year. Although numerical differences were observed among biochar rates, ranging from 8.29 kg ha−1 (11.2 Mg ha−1) to 11.05 kg ha−1 (33.6 Mg ha−1), Tukey’s post hoc test confirmed no significant differences among any of the rates. Likewise, poultry litter (10.41 kg ha−1) and inorganic fertilizer (9.03 kg ha−1) were statistically equivalent. No interactions were detected between biochar, fertilizer, or year (all p ≥ 0.214).
4. Discussion
4.1. Environmental Context and Temporal Variability
The variability in climatic conditions across growing seasons critically shaped the efficacy of soil amendments, underscoring the vulnerability of biochar and fertilizers to environmental extremes [44,45]. The decline in aggregate stability during the wetter 2024 season reflects a saturation-driven destabilization typical of coarse-textured soils under high-intensity precipitation [46]. Prolonged saturation during the wet 2024 season—analogous to a “waterlogged sponge”—likely challenged biochar’s ability to modulate soil hydrology, as its effects on water retention and hydraulic conductivity are highly context-dependent [47]. Similarly, the sharp reduction in soluble salts during the wetter year reflects enhanced leaching through the sandy profile, which offers minimal resistance to vertical water movement [48,49].
The contrasting responses of biological indicators in 2024 present an intriguing pattern. While organic matter and active carbon increased, CO2 burst and N mineralization decreased. This divergence suggests that the incorporation of sweet corn biomass from the previous season provided an input of organic residues that contributed to soil organic carbon accumulation, while wetter conditions promoted further organic matter accrual through suppressed decomposition under anaerobic conditions, which limits microbial respiration due to oxygen constraints and simultaneously reduces nitrogen mineralization via inhibition of nitrification processes [50,51,52].
4.2. Limited Effects of Soil Amendments
While biochar is widely recognized as a potential amendment to increase soil pH and cation exchange capacity [53], the responses observed in this two-year study were inconsistent. For soil pH, this pattern suggests that the biochar’s alkalinity—derived primarily from soluble ash constituents such as carbonates and exchangeable base cations rather than from stable buffering mechanisms—was insufficient to offset the inherent acidity and low buffering capacity of this sandy loam Ultisol [54,55]. The marginal increase in pH under poultry litter, while not significant, is consistent with the well-documented liming effect of organic manures arising from base cation inputs and their capacity to neutralize protons generated during nitrogen transformation processes [56,57]. For CEC, the lack of meaningful improvement stems from both biochar properties and soil mineralogy. High-temperature pyrolysis produces a condensed aromatic structure with low surface reactivity, and the surface oxidation required to generate CEC-contributing functional groups proceeds slowly, typically over multi-year timescales [58]. Thus, within a two-year window, significant CEC gains were unlikely from the outset, and longer-term studies are required to determine whether aging effects eventually emerge [59]. The absence of biochar × fertilizer interactions suggests that the sources acted independently rather than synergistically.
4.3. Experimental Limitations
Several constraints temper the interpretation of these findings. The small plot size provided a limited buffer against the lateral movement of biochar particles and dissolved nutrients during intense rainfall, potentially allowing cross-contamination between adjacent treatments [60]. High within-plot spatial variability in sandy loam soils likely increased residual error, reducing statistical power to detect subtle treatment differences [61,62]. The two-year experimental window is also too short for meaningful surface oxidation and CEC development in a recalcitrant, high-temperature biochar, processes that typically unfold over several years [63]. Finally, the bare-ground system lacks living root exudates and mycorrhizal networks that may be necessary to fully activate biochar’s biological benefits under field conditions [64].
4.4. Implications and Future Directions
Under the conditions tested, the biochar used in this study did not consistently improve the selected soil health indicators. The lack of significant dose–response relationships across most measured properties, combined with the dominance of year effects, suggests that a single surface application of this high-temperature biochar in sandy loam Ultisols may not provide immediate agronomic benefits. The only context in which biochar showed any effect was the marginal three-way interaction for CO2 burst under specific conditions, which, given its marginal significance, should not be overinterpreted.
These results do not rule out biochar’s long-term potential in this environment. The two-year timeframe may have been insufficient for biochar to integrate with the soil matrix and express its full range of effects. Future research should (1) extend evaluation periods to capture biochar aging and surface oxidation dynamics; (2) use larger plots with buffer zones to minimize cross-contamination under high-intensity rainfall; (3) test biochars with higher organic carbon content and lower pyrolysis temperatures better suited to sandy-loam, low-CEC Ultisols; and (4) examine how repeated extreme precipitation events affect biochar particle redistribution and long-term retention in coarse-textured profiles.
5. Conclusions
This two-year field study evaluated the effects of biochar application rates (0–44.8 Mg ha−1) and fertilizer type (inorganic or poultry litter) on a selection of soil health indicators in a sandy loam Ultisol of the Georgia Coastal Plain under sweet corn production. The study’s most important finding was that environmental conditions—specifically, extreme rainfall in 2024—were the dominant driver of changes in soil properties, overwhelming any management interventions. Aggregate stability declined, soluble salts decreased substantially due to leaching, and biological indicators exhibited contrasting responses: organic matter and active carbon increased, while microbial respiration and N mineralization decreased under waterlogged conditions.
Biochar application did not improve the measured soil health indicators during the two-year study. No significant effects were observed for any measured property, with the exception of a marginal three-way interaction for microbial respiration that should be interpreted with caution. The limited response was likely associated with the properties of the high-temperature biochar, which has relatively low surface reactivity and typically requires longer periods for surface oxidation and the development of additional functional groups. In contrast, fertilizer source produced broadly similar responses across the measured soil health indicators. Poultry litter significantly increased microbial respiration relative to inorganic fertilizer, whereas differences in soil pH and N mineralization were only marginal. These findings suggest that either inorganic fertilizer or poultry litter can be used successfully in these production systems, allowing growers to base fertilizer selection on factors such as cost, availability, and management objectives rather than expecting substantial short-term differences across the soil health indicators evaluated in this study.
In practice, the biochar tested here did not consistently deliver short-term improvements. The lack of positive dose–response relationships suggests that a single surface application may not provide measurable short-term soil health benefits within a two-year timeframe. Longer-term studies are required to determine whether biochar aging ultimately improves the soil’s chemical and biological functions and whether its effects become more apparent under less extreme environmental conditions. Given the increasing frequency of intense rainfall events in the southeastern U.S., soil management strategies that build resilience—such as cover cropping, reduced tillage, and organic matter management—should be prioritized alongside biochar applications, particularly in environments prone to intense rainfall.
Author Contributions
Conceptualization, T.M. and E.S.; methodology, T.M., E.S. and H.Y.S.; software, E.S.; validation, T.M., J.C.D.P., K.C.-D. and H.Y.S.; formal analysis, E.S.; investigation, E.S. and H.M.; resources, T.M.; data curation, E.S.; writing—original draft preparation, E.S.; writing—review and editing, T.M., J.C.D.P., K.C.-D. and H.Y.S.; visualization, E.S.; supervision, T.M.; project administration, T.M.; funding acquisition, T.M. All authors have read and agreed to the published version of the manuscript.
Funding
This research received no external funding.
Institutional Review Board Statement
Not applicable.
Informed Consent Statement
Not applicable.
Data Availability Statement
The data presented in this study are available upon request from the corresponding author.
Acknowledgments
The authors gratefully acknowledge Wakefield Biochar for the generous donation of biochar used in this study. We extend our sincere appreciation to University of Georgia research technician Bob Brooke, student workers Justin Cook and Jack Quayle, and graduate students Elvis Pulici and Nirmala Acharya for their valuable assistance in field and laboratory activities. We also thank Xuelin Luo for statistical support and intern Anthony LaMarr for his dedicated contributions to fieldwork. During the preparation of this manuscript, the authors used Grammarly (Version v1.2.277.1921) for grammar and style checking. The authors have reviewed and edited the output and take full responsibility for the content of this publication.
Conflicts of Interest
The authors declare no conflicts of interest.
References
- Dönmez, D.; Isak, M.; İzgü, T.; Şimşek, Ö. Green horizons: Navigating the future of agriculture through sustainable practices. Sustainability 2024, 16, 3505. [Google Scholar] [CrossRef] [Scilit]
- US Department of Agriculture, National Agricultural Statistics Service. Georgia. Available online: https://www.nass.usda.gov/Publications/AgCensus/2022/Full_Report/Volume_1,_Chapter_2_County_Level/Georgia/gav1a.pdf (accessed on 10 March 2025).
- Dell, C.J.; Novak, J.M. Cropland management in the Eastern United States for improved soil organic carbon sequestration. In Managing Agricultural Greenhouse Gases, 1st ed.; Liebig, M.A., Franzluebbers, A.J., Follett, R.F., Eds.; Academic Press: San Diego, CA, USA, 2012; pp. 23–40. [Google Scholar] [CrossRef] [Scilit]
- Allmon, W.D. Fossils of the Southeastern US. In The Teacher-Friendly Guide to the Earth Science of the Southeastern US, 2nd ed.; Swaby, A.N., Lucas, M.D., Ross, R.M., Eds.; Paleontological Research Institution: Ithaca, NY, USA, 2016; pp. 87–146. [Google Scholar]
- Gascho, G.J.; Parker, M.B. Long-term liming effects on Coastal Plain soils and crops. Agron. J. 2001, 93, 1305–1315. [Google Scholar] [CrossRef] [Scilit]
- Weyers, S.; Das, K.; Gaskin, J.; Liesch, A. Pine chip and poultry litter derived biochars affect C and N dynamics in two Georgia, USA, ultisols. Agronomy 2023, 13, 531. [Google Scholar] [CrossRef] [Scilit]
- Allohverdi, T.; Mohanty, A.K.; Roy, P.; Misra, M. A review on current status of biochar uses in agriculture. Molecules 2021, 26, 5584. [Google Scholar] [CrossRef] [Scilit] [PubMed]
- Laird, D.; Fleming, P.; Davis, D.; Horton, R.; Wang, B.; Karlen, D. Impact of biochar amendments on the quality of a typical Midwestern agricultural soil. Geoderma 2010, 158, 443–449. [Google Scholar] [CrossRef] [Scilit]
- Bolan, N.S.; Szogi, A.A.; Chuasavathi, T.; Seshadri, B.; Rothrock, M.J.; Panneerselvam, P. Uses and management of poultry litter. World’s Poult. Sci. J. 2010, 66, 673–698. [Google Scholar] [CrossRef] [Scilit]
- Shepherd, M.; Bhogal, A. Regular applications of poultry litter to a sandy arable soil: Effects on nitrate leaching and nitrogen balance. J. Sci. Food Agric. 1998, 78, 19–29. [Google Scholar] [CrossRef]
- Doydora, S.; Cabrera, M.; Das, K.; Gaskin, J.; Sonon, L.; Miller, W. Release of nitrogen and phosphorus from poultry litter amended with acidified biochar. Int. J. Environ. Res. Public Health 2011, 8, 1491–1502. [Google Scholar] [CrossRef] [Scilit] [PubMed]
- Kyakuwaire, M.; Olupot, G.; Amoding, A.; Nkedi-Kizza, P.; Basamba, T. How safe is chicken litter for land application as an organic fertilizer?: A review. Int. J. Environ. Res. Public Health 2019, 16, 3521. [Google Scholar] [CrossRef] [Scilit] [PubMed]
- Thapa, B.; Awal, R.; Fares, A.; Veettil, A.; Elhassan, A.; Rahman, A.; Melaku, N.; Woldesenbet, S. Positive sweet corn response with selected climate-smart agricultural practices. Agrosyst. Geosci. Environ. 2024, 7, e70011. [Google Scholar] [CrossRef] [Scilit]
- Mensah, S.A.; Simpson, A.R.; Sabi, E.B.; Amoatey, P.K.; Ofori, P.A.; Owusu-Nketia, S.; Dwomoh, F.A.; Asenso, E. Impact of biochar application on soil physical and biogeochemical characteristics: A review. Appl. Environ. Soil Sci. 2025, 2025, 3734167. [Google Scholar] [CrossRef] [Scilit]
- Cole, E.; Zandvakili, O.; Xing, B.; Hashemi, M.; Barker, A.; Herbert, S. Effects of Hardwood Biochar on Soil Acidity, Nutrient Dynamics, and Sweet Corn Productivity. Commun. Soil Sci. Plant Anal. 2019, 50, 1732–1742. [Google Scholar] [CrossRef] [Scilit]
- Lin, Y.; Watts, D.; Runion, G. Influence of poultry litter on nutrient availability and fate in plant–soil systems: A meta-analysis. J. Soil Water Conserv. 2022, 77, 230–239. [Google Scholar] [CrossRef] [Scilit]
- Endale, D.M.; Schomberg, H.H.; Fisher, D.S.; Jenkins, M.B.; Sharpe, R.R.; Cabrera, M.L. No-till corn productivity in a southeastern United States Ultisol amended with poultry litter. Agron. J. 2008, 100, 1401–1408. [Google Scholar] [CrossRef] [Scilit]
- Bohara, H.; Dodla, S.; Wang, J.J.; Darapuneni, M.; Acharya, B.S.; Magdi, S.; Pavuluri, K. Influence of poultry litter and biochar on soil water dynamics and nutrient leaching from a very fine sandy loam soil. Soil Tillage Res. 2019, 189, 44–51. [Google Scholar] [CrossRef] [Scilit]
- Alexandrov, V.A.; Hoogenboom, G. Climate variation and crop production in Georgia, USA, during the twentieth century. Clim. Res. 2001, 17, 33–43. [Google Scholar] [CrossRef] [Scilit]
- Suarez, E.; Diaz-Perez, J.C.; Cassity-Duffey, K.; Sintim, H.Y.; McAvoy, T. Effects of biochar and fertilizer source on sweet corn production: Nitrogen uptake, biomass, yield, and quality across two contrasting years—Part I. HortTechnology 2025, 35, 445–454. [Google Scholar] [CrossRef] [Scilit]
- Sun, Z.; Hu, Y.; Shi, L.; Li, G.; Han, J.; Pang, Z.; Liu, S.; Chen, Y.; Jia, B. Effects of biochar on soil chemical properties: A global meta-analysis of agricultural soil. Plant Soil Environ. 2022, 68, 128–135. [Google Scholar] [CrossRef] [Scilit]
- Farhangi-Abriz, S.; Torabian, S.; Qin, R.; Noulas, C.; Lu, Y.; Gao, S. Biochar effects on yield of cereal and legume crops using meta-analysis. Sci. Total Environ. 2021, 775, 145869. [Google Scholar] [CrossRef] [Scilit]
- Kissel, D.E.; Sonon, L.S. Soil Test Handbook for Georgia; University of Georgia: Athens, GA, USA, 2008. [Google Scholar]
- US Department of Agriculture. Soil Fertility and Crop Nutrient Management Practice Standard (§ 205.203). Code of Federal Regulations, Title 7, Part 205. Available online: https://www.ecfr.gov/current/title-7/subtitle-B/chapter-I/subchapter-M/part-205/subpart-C/section-205.203 (accessed on 10 March 2025).
- University of Georgia Cooperative Extension. Vegetables; Special Bulletin SB 28-34; University of Georgia: Athens, GA, USA, 2025; Available online: https://fieldreport.caes.uga.edu/publications/SB28-34/vegetables/ (accessed on 10 March 2025).
- Robertson, G.P.; Coleman, D.C.; Bledsoe, C.S.; Sollins, P. (Eds.) Standard Soil Methods for Long-Term Ecological Research; Oxford University Press: New York, NY, USA, 1999. [Google Scholar]
- Georgia Automated Environmental Monitoring Network (AEMN). Georgia Automated Environmental Monitoring Network; Coastal Plain Experiment Station: Tifton, GA, USA, 2025; Available online: http://www.georgiaweather.net/?variable=HI&site=TIFTON (accessed on 10 March 2025).
- Lehmann, J.; Bossio, D.; Kögel-Knabner, I.; Rillig, M. The concept and future prospects of soil health. Nat. Rev. Earth Environ. 2020, 1, 544–553. [Google Scholar] [CrossRef] [Scilit] [PubMed]
- Tully, K.; McAskill, C. Promoting soil health in organically managed systems: A review. Org. Agric. 2019, 10, 339–358. [Google Scholar] [CrossRef] [Scilit]
- Brinton, W. Solvita Volumetric Aggregate Stability Test (VAST); Woods End Laboratories: Augusta, ME, USA, 2017. [Google Scholar]
- Thomas, G.W. Soil pH and Soil Acidity. In Methods of Soil Analysis; Sparks, D.L., Page, A.L., Helmke, P.A., Loeppert, R.H., Soltanpour, P.N., Tabatabai, M.A., Johnston, C.T., Sumner, M.E., Eds.; Soil Science Society of America: Madison, WI, USA, 1996; pp. 475–490. [Google Scholar]
- Sumner, M.E.; Miller, W.P. Cation Exchange Capacity and Exchange Coefficients. In Methods of Soil Analysis; Sparks, D.L., Page, A.L., Helmke, P.A., Loeppert, R.H., Soltanpour, P.N., Tabatabai, M.A., Johnston, C.T., Sumner, M.E., Eds.; Soil Science Society of America: Madison, WI, USA, 1996; pp. 1201–1229. [Google Scholar]
- Rhoades, J.D. Salinity: Electrical Conductivity and Total Dissolved Solids. In Methods of Soil Analysis; Sparks, D.L., Page, A.L., Helmke, P.A., Loeppert, R.H., Soltanpour, P.N., Tabatabai, M.A., Johnston, C.T., Sumner, M.E., Eds.; Soil Science Society of America: Madison, WI, USA, 1996; pp. 417–435. [Google Scholar]
- Schulte, E.E.; Hopkins, B.G. Estimation of Soil Organic Matter by Weight Loss-On-Ignition. In Soil Organic Matter: Analysis and Interpretation; Magdoff, F.R., Tabatabai, M.A., Hanlon, E.A., Eds.; Soil Science Society of America: Madison, WI, USA, 1996; pp. 21–31. [Google Scholar]
- Weil, R.R.; Islam, K.R.; Stine, M.A.; Gruver, J.B.; Samson-Liebig, S.E. Estimating active carbon for soil quality assessment: A simplified method for laboratory and field use. Am. J. Altern. Agric. 2003, 18, 3–17. [Google Scholar] [CrossRef] [Scilit]
- Haney, R.L.; Brinton, W.F.; Evans, E. Soil CO2 respiration: Comparison of chemical titration, CO2 IRGA analysis and the Solvita gel system. Renew. Agric. Food Syst. 2008, 23, 171–176. [Google Scholar] [CrossRef] [Scilit]
- Haney, R.; Haney, E. Estimating potential nitrogen mineralisation using the Solvita soil respiration system. J. Soil Sci. 2015, 5, 319–323. [Google Scholar] [CrossRef]
- R Core Team. R: A Language and Environment for Statistical Computing; R Foundation for Statistical Computing: Vienna, Austria, 2025. [Google Scholar]
- Pinheiro, J.; Bates, D.; R Core Team. Nlme: Linear and Nonlinear Mixed Effects Models, R Package Version 3.1-168; R Core Team: Vienna, Austria, 2025. Available online: https://CRAN.R-project.org/package=nlme (accessed on 10 March 2025).
- Lenth, R.; Piaskowski, J. Emmeans: Estimated Marginal Means, Aka Least-Squares Means, R Package Version 2.0.2; R Core Team: Vienna, Austria, 2026. Available online: https://rvlenth.github.io/emmeans/ (accessed on 10 March 2025).
- Hothorn, T.; Bretz, F.; Westfall, P. Simultaneous inference in general parametric models. Biom. J. 2008, 50, 346–363. [Google Scholar] [CrossRef] [Scilit] [PubMed]
- Graves, S.; Piepho, H.P.; Selzer, L. Multcompview: Visualizations of Paired Comparisons, R Package Version 0.1-11; R Core Team: Vienna, Austria, 2026. Available online: https://github.com/lselzer/multcompview (accessed on 10 March 2025).
- Wickham, H. ggplot2: Elegant Graphics for Data Analysis; Springer: New York, NY, USA, 2016. [Google Scholar]
- Li, Y.; Yang, J.; Yang, M.; Zhang, F. Exploring biochar addition impacts on soil erosion under natural rainfall: A study based on four years of field observations on the Loess Plateau. Soil Tillage Res. 2024, 230, 105935. [Google Scholar] [CrossRef] [Scilit]
- Matisic, M.; Dugan, I.; Bogunovic, I. Challenges in sustainable agriculture—The role of organic amendments. Agriculture 2024, 14, 643. [Google Scholar] [CrossRef] [Scilit]
- De-Campos, A.B.; Mamedov, A.I.; Huang, C. Short-term reducing conditions decrease soil aggregation. Soil Sci. Soc. Am. J. 2009, 73, 550–559. [Google Scholar] [CrossRef] [Scilit]
- Edeh, I.; Mašek, O.; Buss, W. A meta-analysis on biochar’s effects on soil water properties: New insights and future research challenges. Sci. Total Environ. 2020, 714, 136857. [Google Scholar] [CrossRef] [Scilit] [PubMed]
- Liu, B.; Wang, S.; Liu, X.; Sun, H. Evaluating soil water and salt transport in response to varied rainfall events and hydrological years under brackish water irrigation in the North China Plain. Geoderma 2022, 426, 115954. [Google Scholar] [CrossRef] [Scilit]
- Mastrocicco, M.; Colombani, N.; Soana, E.; Vincenzi, F.; Castaldelli, G. Intense rainfalls trigger nitrite leaching in agricultural soils depleted in organic matter. Sci. Total Environ. 2019, 665, 80–90. [Google Scholar] [CrossRef] [Scilit] [PubMed]
- Keiluweit, M.; Wanzek, T.; Kleber, M.; Nico, P.; Fendorf, S. Anaerobic microsites have an unaccounted role in soil carbon stabilization. Nat. Commun. 2017, 8, 1771. [Google Scholar] [CrossRef] [Scilit] [PubMed]
- Nguyen, L.T.T.; Osanai, Y.; Anderson, I.C.; Bange, M.P.; Braunack, M.V.; Tissue, D.T.; Singh, B.K. Impacts of waterlogging on soil nitrification and ammonia-oxidizing communities in farming system. Plant Soil 2018, 426, 299–311. [Google Scholar] [CrossRef] [Scilit]
- Wang, Y.; Liang, A.; Xu, Y.; Zhang, W.; Li, M.; Wang, J. Maize residue types and soil fertility levels influence sequestration of newly associated carbon in aggregates with in situ experiments. Soil Tillage Res. 2023, 234, 105783. [Google Scholar] [CrossRef] [Scilit]
- Singh, H.; Northup, B.; Rice, C.; Prasad, P. Biochar applications influence soil physical and chemical properties, microbial diversity, and crop productivity: A meta-analysis. Biochar 2022, 4, 8. [Google Scholar] [CrossRef] [Scilit]
- Shi, R.; Hong, Z.; Li, J.; Jiang, J.; Baquy, M.; Xu, R.; Qian, W. Mechanisms for increasing the pH buffering capacity of an acidic Ultisol by crop residue-derived biochars. J. Agric. Food Chem. 2017, 65, 8111–8119. [Google Scholar] [CrossRef] [Scilit] [PubMed]
- Zong, Y.; Xiao, Q.; Lu, S. Acidity, water retention, and mechanical physical quality of a strongly acidic Ultisol amended with biochars derived from different feedstocks. J. Soils Sediments 2016, 16, 177–190. [Google Scholar] [CrossRef] [Scilit]
- Lima, J.; Da Conceição Cavalcanti De Goes, M.; Hammecker, C.; Antonino, A.; Medeiros, É.; Sampaio, E.; De Barros Silva Leite, M.; Silva, V.; De Souza, E.; Souza, R. Effects of poultry manure and biochar on Acrisol soil properties and yield of common bean: A short-term field experiment. Agriculture 2021, 11, 290. [Google Scholar] [CrossRef] [Scilit]
- Iticha, B.; Mosley, L.M.; Marschner, P. Combining lime and organic amendments based on titratable alkalinity for efficient amelioration of acidic soils. Soil 2024, 10, 33–47. [Google Scholar] [CrossRef] [Scilit]
- Mao, T.; Wang, Y.; Ning, S.; Mao, J.; Sheng, J.; Jiang, P. Assessment of the effects of biochar on the physicochemical properties of saline–alkali soil based on meta-analysis. Agronomy 2024, 14, 2431. [Google Scholar] [CrossRef] [Scilit]
- Nelissen, V.; Rütting, T.; Huygens, D.; Ruysschaert, G.; Boeckx, P. Temporal evolution of biochar’s impact on soil nitrogen processes: A 15N tracing study. GCB Bioenergy 2015, 7, 635–645. [Google Scholar] [CrossRef] [Scilit]
- Obia, A.; Lyu, J.; Mulder, J.; Martinsen, V.; Cornelissen, G.; Smebye, A.; Zimmerman, A. Biochar dispersion in a tropical soil and its effects on native soil organic carbon. PLoS ONE 2024, 19, e0300387. [Google Scholar] [CrossRef] [Scilit] [PubMed]
- Duffera, M.; White, J.; Weisz, R. Spatial variability of southeastern U.S. Coastal Plain soil physical properties: Implications for site-specific management. Geoderma 2007, 137, 327–339. [Google Scholar] [CrossRef] [Scilit]
- Klironomos, J.N.; Rillig, M.C.; Allen, M.F. Designing belowground field experiments with the help of semi-variance and power analyses. Appl. Soil Ecol. 1999, 12, 227–238. [Google Scholar] [CrossRef] [Scilit]
- Mukherjee, A.; Zimmerman, A.; Hamdan, R.; Cooper, W. Physicochemical changes in pyrogenic organic matter (biochar) after 15 months of field aging. Solid Earth 2014, 5, 693–704. [Google Scholar] [CrossRef] [Scilit]
- Kocsis, T.; Ringer, M.; Biró, B. Characteristics and applications of biochar in soil–plant systems: A short review of benefits and potential drawbacks. Appl. Sci. 2022, 12, 4051. [Google Scholar] [CrossRef] [Scilit]

Disclaimer/Publisher’s Note: The statements, opinions and data contained in all publications are solely those of the individual author(s) and contributor(s) and not of MDPI and/or the editor(s). MDPI and/or the editor(s) disclaim responsibility for any injury to people or property resulting from any ideas, methods, instructions or products referred to in the content. |
© 2026 by the authors. Licensee MDPI, Basel, Switzerland. This article is an open access article distributed under the terms and conditions of the Creative Commons Attribution (CC BY) license.