Abstract
The early and accurate detection of plant diseases is essential for crop management and agricultural loss control, especially under resource limitations. We propose an optimized YOLO11n architecture, designated as YOLO11_Opt, targeting real-time inference on low-cost embedded systems. The model is computationally efficient through the selective narrowing of its width and depth, while performing competitively in two-class object recognition tasks. Pepper leaves were chosen as the materials for study. Three methods of quantization (FP32, FP16, and INT8) were investigated. After running the experiments, the results showed that YOLO11_Opt greatly reduces the computational complexity: the complexity decreased from 6.3 GFLOPS and 2.58 million parameters in the typical YOLO11n model to a very small 0.5 GFLOPS and 0.33 million parameters, while maintaining competitive detection capabilities. The improved FP32 model has a mAP (0.5:0.95) of 0.913 and a precision of 0.991, while the old version has 0.961 mAP and 0.996 precision. Lastly, implementations on embedded hardware prove that the method is feasible: the detection accuracy of the system in live classification is around 92% with Raspberry Pi 4 and 94% with NVIDIA Jetson Nano, with inference times of as little as 1.9 ms on NVIDIA Jetson Nano and 8.3 ms on Raspberry Pi 4. Thus, YOLO11_Opt demonstrates significant potential as a reliable, high-performance, low-cost solution to identifying plant diseases on devices in precision agriculture.
1. Introduction
Over the last decade, artificial intelligence (AI) and deep learning have transformed pest diagnosis [1]. Disease symptoms such as leaf spots, necrosis, and discoloration are identified by object detection models and convolutional neural networks (CNNs) based on digital images [2,3]. Among these, the You Only Look Once (YOLO) family of models has progressed, representing a way to achieve faster and more accurate real-time detection. Currently, YOLO11 offers improvements by demonstrating enhanced inference, small model sizes, and high fidelity on embedded platforms. Optimized backbone models and more flexible feature fusion techniques can also realize superior performance [4,5]. These performance characteristics render YOLO11 suitable for precision agriculture tasks such as automatic disease sensing. However, implementing a detection model in the agricultural context requires embedded mechanisms capable of real-time inference, in accordance with stringent requirements for power use, bandwidth, and cost [6,7]. The deployment scale of these models is increasing, mainly through optimization techniques (compression, quantization, pruning) [2,8] specifically targeted towards hardware platforms ranging from Raspberry Pi to Jetson Nano and high-performance microcontrollers. Edge computing thus plays a decisive role in improving plant disease detection in this case. Instead of sending an image to a remote server, a connected device runs the machine learning model directly on-site. This reduces latency, network dependence, and energy consumption and protects agricultural data [9]. Implementing models in the field also allows swift decision-making, which is essential to prevent the spread of diseases. In recent studies, YOLO11 combined with edge computing was observed to achieve detection rates above 90% with latencies of 150 ms or less on Jetson Nano and Raspberry Pi 4 [10,11]. Furthermore, introducing edge processing in agricultural IoT networks helps to achieve an autonomous service model capable of collecting, processing, and transmitting relevant data. This hybrid model enables the creation of smart agriculture ecosystems—for example, in the field of phytosanitary monitoring—to which every edge point contributes, while transmitting only key information to the cloud for large-scale predictive analysis. Edge computing is not merely a technological solution but also a key example of the concept of decentralized intelligence, which is a significant prerequisite for sustainable and accessible digital farming and agriculture. However, implementing YOLO11 in embedded platforms poses many technical challenges. The optimal approach requires a trade-off between model accuracy and computational cost. A decrease in performance for diseases that display visually similar signs occurs when the network size is reduced or when quantization is aggressively applied. Moreover, augmentation and regularization-based approaches for the visual aspects of the agricultural environment (e.g., lighting, type of background, classes of pathogens) represented in the model are required to maximize its performance [2,6]. The recently released YOLO11 offers a new path towards object detection with high accuracy and superior feature extraction. While the earlier YOLOv5 and YOLOv8 models are widely used for plant disease detection, the application of YOLO11 in leaf disease detection remains nascent. Recent breakthroughs in this line of research show that although state-of-the-art YOLO architectures with near-perfect classification algorithms can work well with sophisticated GPUs, a major shortcoming remains, namely, standard models are prohibitively expensive for real-time deployment on the low-cost, resource-limited edge devices commonly used in smart agriculture applications. Therefore, the gap between YOLO11’s robust detection accuracy and the stringent memory and operational constraints of edge AI applications is a crucial unsolved problem in current precision agricultural studies. The target deployment constraints are specifically set in this work: inference latency below 100 ms, memory usage <1 GB RAM, and power usage <10 W; the main contributions are reported as follows:
- A hardware-aware scaled YOLO11n architecture that is optimized for edge AI deployment on limited resource systems.
- An analysis with a systematic depth–width ablation study with embedded restriction for architectural purposes.
- Research on Raspberry Pi 4 and Jetson Nano.
- The effects of INT8 quantization on accuracy and latency.
- Comparison of full pipeline inference performance with regards to latency, CPU consumption, and power.
To test the efficacy of the proposed edge AI framework, bell pepper (Capsicum annuum) and its associated bacterial spot pathology are used as a primary benchmark. This case study provides a perfect example of the rigorous model for evaluating YOLO11_Opt architecture’s ability to accurately sense complex, small-scale morphological lesions in a restricted computational bandwidth of extreme edge devices. The goal is to create and optimize an ultra-lightweight YOLO11 called YOLO11_Opt and ensure its efficiency on low-cost, low-energy embedded platforms. This would then provide small and medium-sized farms with a rapid, smart, and economical tool for plant health diagnostics and move the field of precision agriculture towards truly state-of-the-art decentralized agriculture.
2. Related Works
Over the past few years, numerous studies have examined the practical applications of the YOLO algorithm for identifying plant diseases. Consequently, several iterations of the YOLO model have been developed, incorporating various improvement methods to strike an optimal balance between detection accuracy and processing speed.
- Optimization of Earlier YOLO Versions (v5, v7, v8)
Early discussions looked to improve the performance of YOLOv5 and YOLOv8 to help balance speed and accuracy. A small YOLOv5 has been suggested using pruning and architectural simplification [12], but hardware verification was relatively scarce. ALAD-YOLO [13] and MGA-YOLO [14] similarly made structural changes, introducing “ghost modules” and attention mechanisms for apple leaf identification. Although these models have some promise, their validations were mainly limited to cloud-based systems [13] or were not adequately comparable with heterogeneous embedded hardware [14]. Using methodological analysis, for example, Nadozie et al. [15] demonstrated the significance of preprocessing and accelerator conversion (ONNX/TensorRT) for NVIDIA Jetson platforms. Backbone-level optimizations have also been extensively investigated; Xie et al. [16] used a MobileNet backbone and a C3-BiPC neck for eggplant lesions, while Ye et al. [17] introduced TG-YOLOv5 for rice diseases in heterogeneous field conditions. But these works were either validated on high-end devices such as the Jetson Orin [16] or only partially tested on entry-level embedded CPUs [17]. Though comparable works such as [18] have successfully implemented YOLOv8 on Raspberry Pi 4, a review of micro-scale scaling at ultra-light weight under severe CPU limitations lacks systematic investigation.
- Multi-Class and Edge-Oriented Performance
Beyond simple binary classification, complex models such as YOLO-JD [19] have achieved a high mAP (96.63%) for 10-class jute disease detection, but without reporting embedded latency or power consumption. Conversely, some studies have prioritized the user experience on low-cost hardware; SSE-YOLOv5s [20] was deployed on Raspberry Pi to evaluate peanut pod quality, focusing on video smoothness. To enhance performance on mid-range edge devices, Xu and Wang [21] optimized YOLOv8n with TensorRT for aphid detection on Jetson Xavier NX. While effective, the Xavier NX platform is relatively expensive and power-intensive compared with the entry-level devices required for small-scale decentralized farming.
- Recent Developments in YOLO11
With the emergence of YOLO11, several specialized studies have recently been published. YOLO11-AIU [22] introduced revised attention modules (C3k2_iAFF) and multi-branch downsampling for tomato blight, achieving 15.67 FPS on the Luban Cat5 platform. Simultaneously, TriPerceptNet and EDGE-MSE-YOLO11 [23] introduced lightweight spatial fusion mechanisms targeting low-power IoT sensors and microcontrollers.
YOLO11-RD [24] was deployed on Jetson Nano and Raspberry Pi 4B with TensorRT optimization, achieving 23.5 FPS. While other studies have applied YOLO11 to cotton [25] and tomato [26] diagnostics, they have primarily focused on software-level validation using datasets such as PlantVillage without comprehensive embedded benchmarking. Finally, RLDD-YOLO11n [27] embodied a “nano” approach for rice disease detection with optimized parameters, but the authors noted that more extensive embedded testing is still required to confirm its efficiency in real-world IoT scenarios.
- Summary of Existing Approaches
Table 1 synthesizes the performance and hardware validation of the most relevant state-of-the-art models compared with our proposed work.
Table 1.
Comparative analysis of the proposed YOLO11_Opt architecture and existing state-of-the-art models for agricultural disease detection.
- Research Gap
This review highlighted a persistent gap in the literature: while YOLO-based models achieve high accuracy, comprehensive hardware-aware optimization under strict low-cost CPU constraints remains limited. Many studies rely on high-performance GPUs (Xavier/Orin) or lack detailed reporting of latency and resource utilization on entry-level devices. Our work addresses this gap by proposing YOLO11_Opt, a hardware-aware scaled architecture validated on heterogeneous platforms. Our approach achieves high-speed inference on CPU-based hardware without specialized accelerators, providing a reproducible “blueprint” for decentralized agricultural AI.
3. Model Architectures
3.1. YOLO11 Architecture
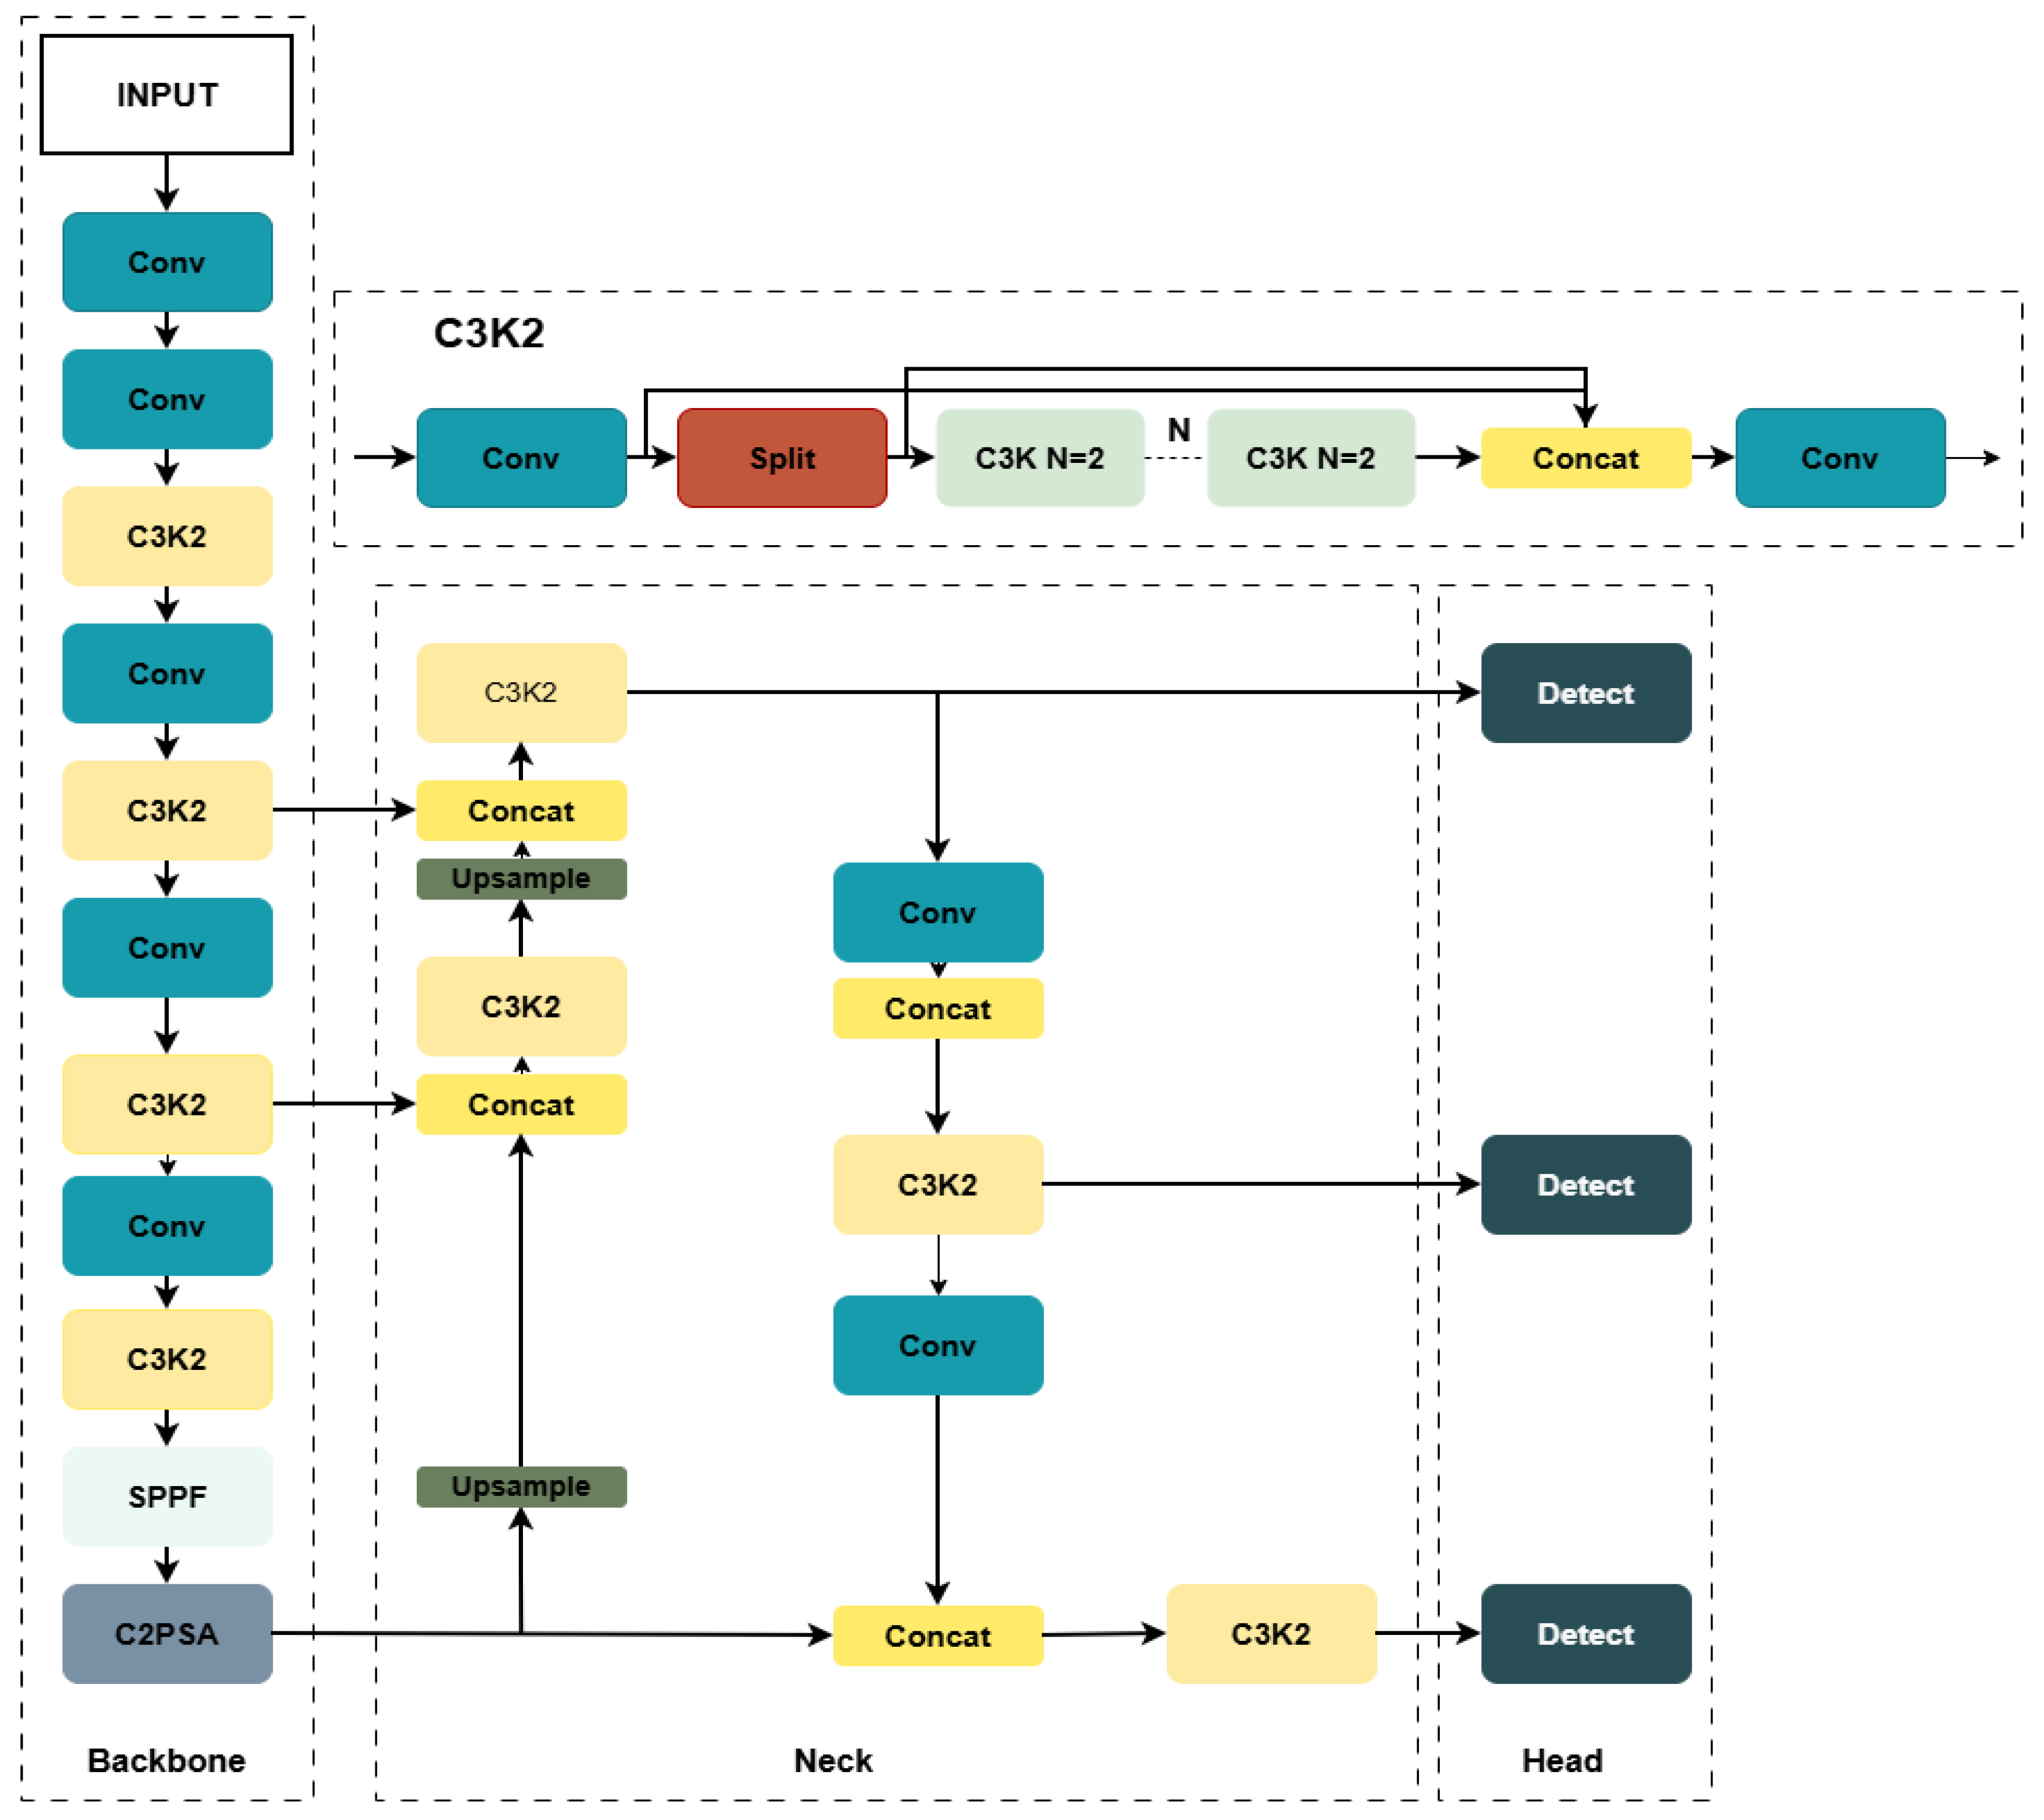
The YOLO11 model is depicted in Figure 1 and is the latest iteration of the You Only Look Once family that integrates certain notable architectural improvements to maximize speed, accuracy, and efficiency. Like its predecessors, YOLO11 has a backbone, neck, and head structure. Nonetheless, it has been redesigned to meet the stringent deployment demands of embedded devices and high-performance servers [28,29]. In the backbone, YOLO11 utilizes the C3k2 (Cross-Stage Partial with Kernel 2) module, which is an upgraded version of the C2f and C3 modules found in YOLOv8 and YOLOv10. This module helps in improving gradient flow and feature reuse while keeping the parameter count low [28]. For increased multi-scale feature extraction, the Spatial Pyramid Pooling-Fast (SPPF) block is retained. In addition, the C2PSA (Convolution with Parallel Spatial Attention) block is joined to it to consolidate multi-head parallel spatial attention to better detect small objects and partially occluded regions of the network [29,30]. The neck of YOLO11 incorporates a multi-scale feature aggregation algorithm based on the Path Aggregation Network (PAN). It employs a series of C3k2 blocks vertically connected to the backbone to support multi-dimensional stepwise information integration. A process for upsampling the backbone features [28] presents the optimal trading-off between speed and detection complexity [31]. Lastly, the head is an anchorless design inherited from modern YOLO versions. It further applies DWConv in its final layers to mitigate the computational demand without detrimental effects on the localization performance [29,30]. As a result, YOLO11 is especially adapted to edge platforms (e.g., Jetson Nano, Raspberry Pi, embedded FPGAs), achieving the same performance effects as in earlier systems [32]. Different versions of YOLO11 (n, s, m, l, x) are available for different scenarios comprising various network size, complexity, and generalization capabilities [28], where a specific deployment is required in terms of latency and resources. These modifications enhance YOLO11’s mAP compared with YOLOv10 and support a faster inference, making it a better fit for real-time computer vision, precision agriculture, and intelligent robotics [29,31,33].
Figure 1.
Detailed layer specification of the baseline YOLO11n.
The standard model architecture is designed for high-capacity feature extraction using a multi-branch Path Aggregation Network (PAN) as follows:
- Backbone (Layers 0–10): Processes an input of 640 × 640 × 3. It utilizes a depth factor of 0.50 and a width factor of 0.25. The spatial resolution is reduced through five stages: 320 × 320 (P1), 160 × 160 (P2), 80 × 80 (P3), 40 × 40 (P4), and 20 × 20 (P5).
- C3k2 blocks: Employs heavy repetitions of CSP-based kernels to maintain gradient flow.
- SPPF and C2PSA: These modules at the base provide spatial pyramid pooling and attention mechanisms to capture the global context before entering the neck.
- Neck (multi-branch): Uses a complex series of Upsample and Concat operations to fuse features across scales. This multi-path approach ensures high accuracy but increases memory synchronization overhead on embedded CPUs.
- Head: Three Detect modules process the fused features to predict bounding boxes and classes.
3.2. Proposed Architecture: YOLO11_Opt
In this article, we present a highly optimized architectural variant of YOLO11, called YOLO11_Opt, which was custom-designed for low-resource systems such as Raspberry Pi, Jetson Nano, and high-performance microcontrollers to achieve speed in detection, inference, energy-saving properties, and a low memory footprint. Because it remains anchorless like most proposed YOLO systems, a range of material structural modifications were made to the architecture, but only on a small scale, with insignificant performance penalties [28].
- Aggressive Model Scaling
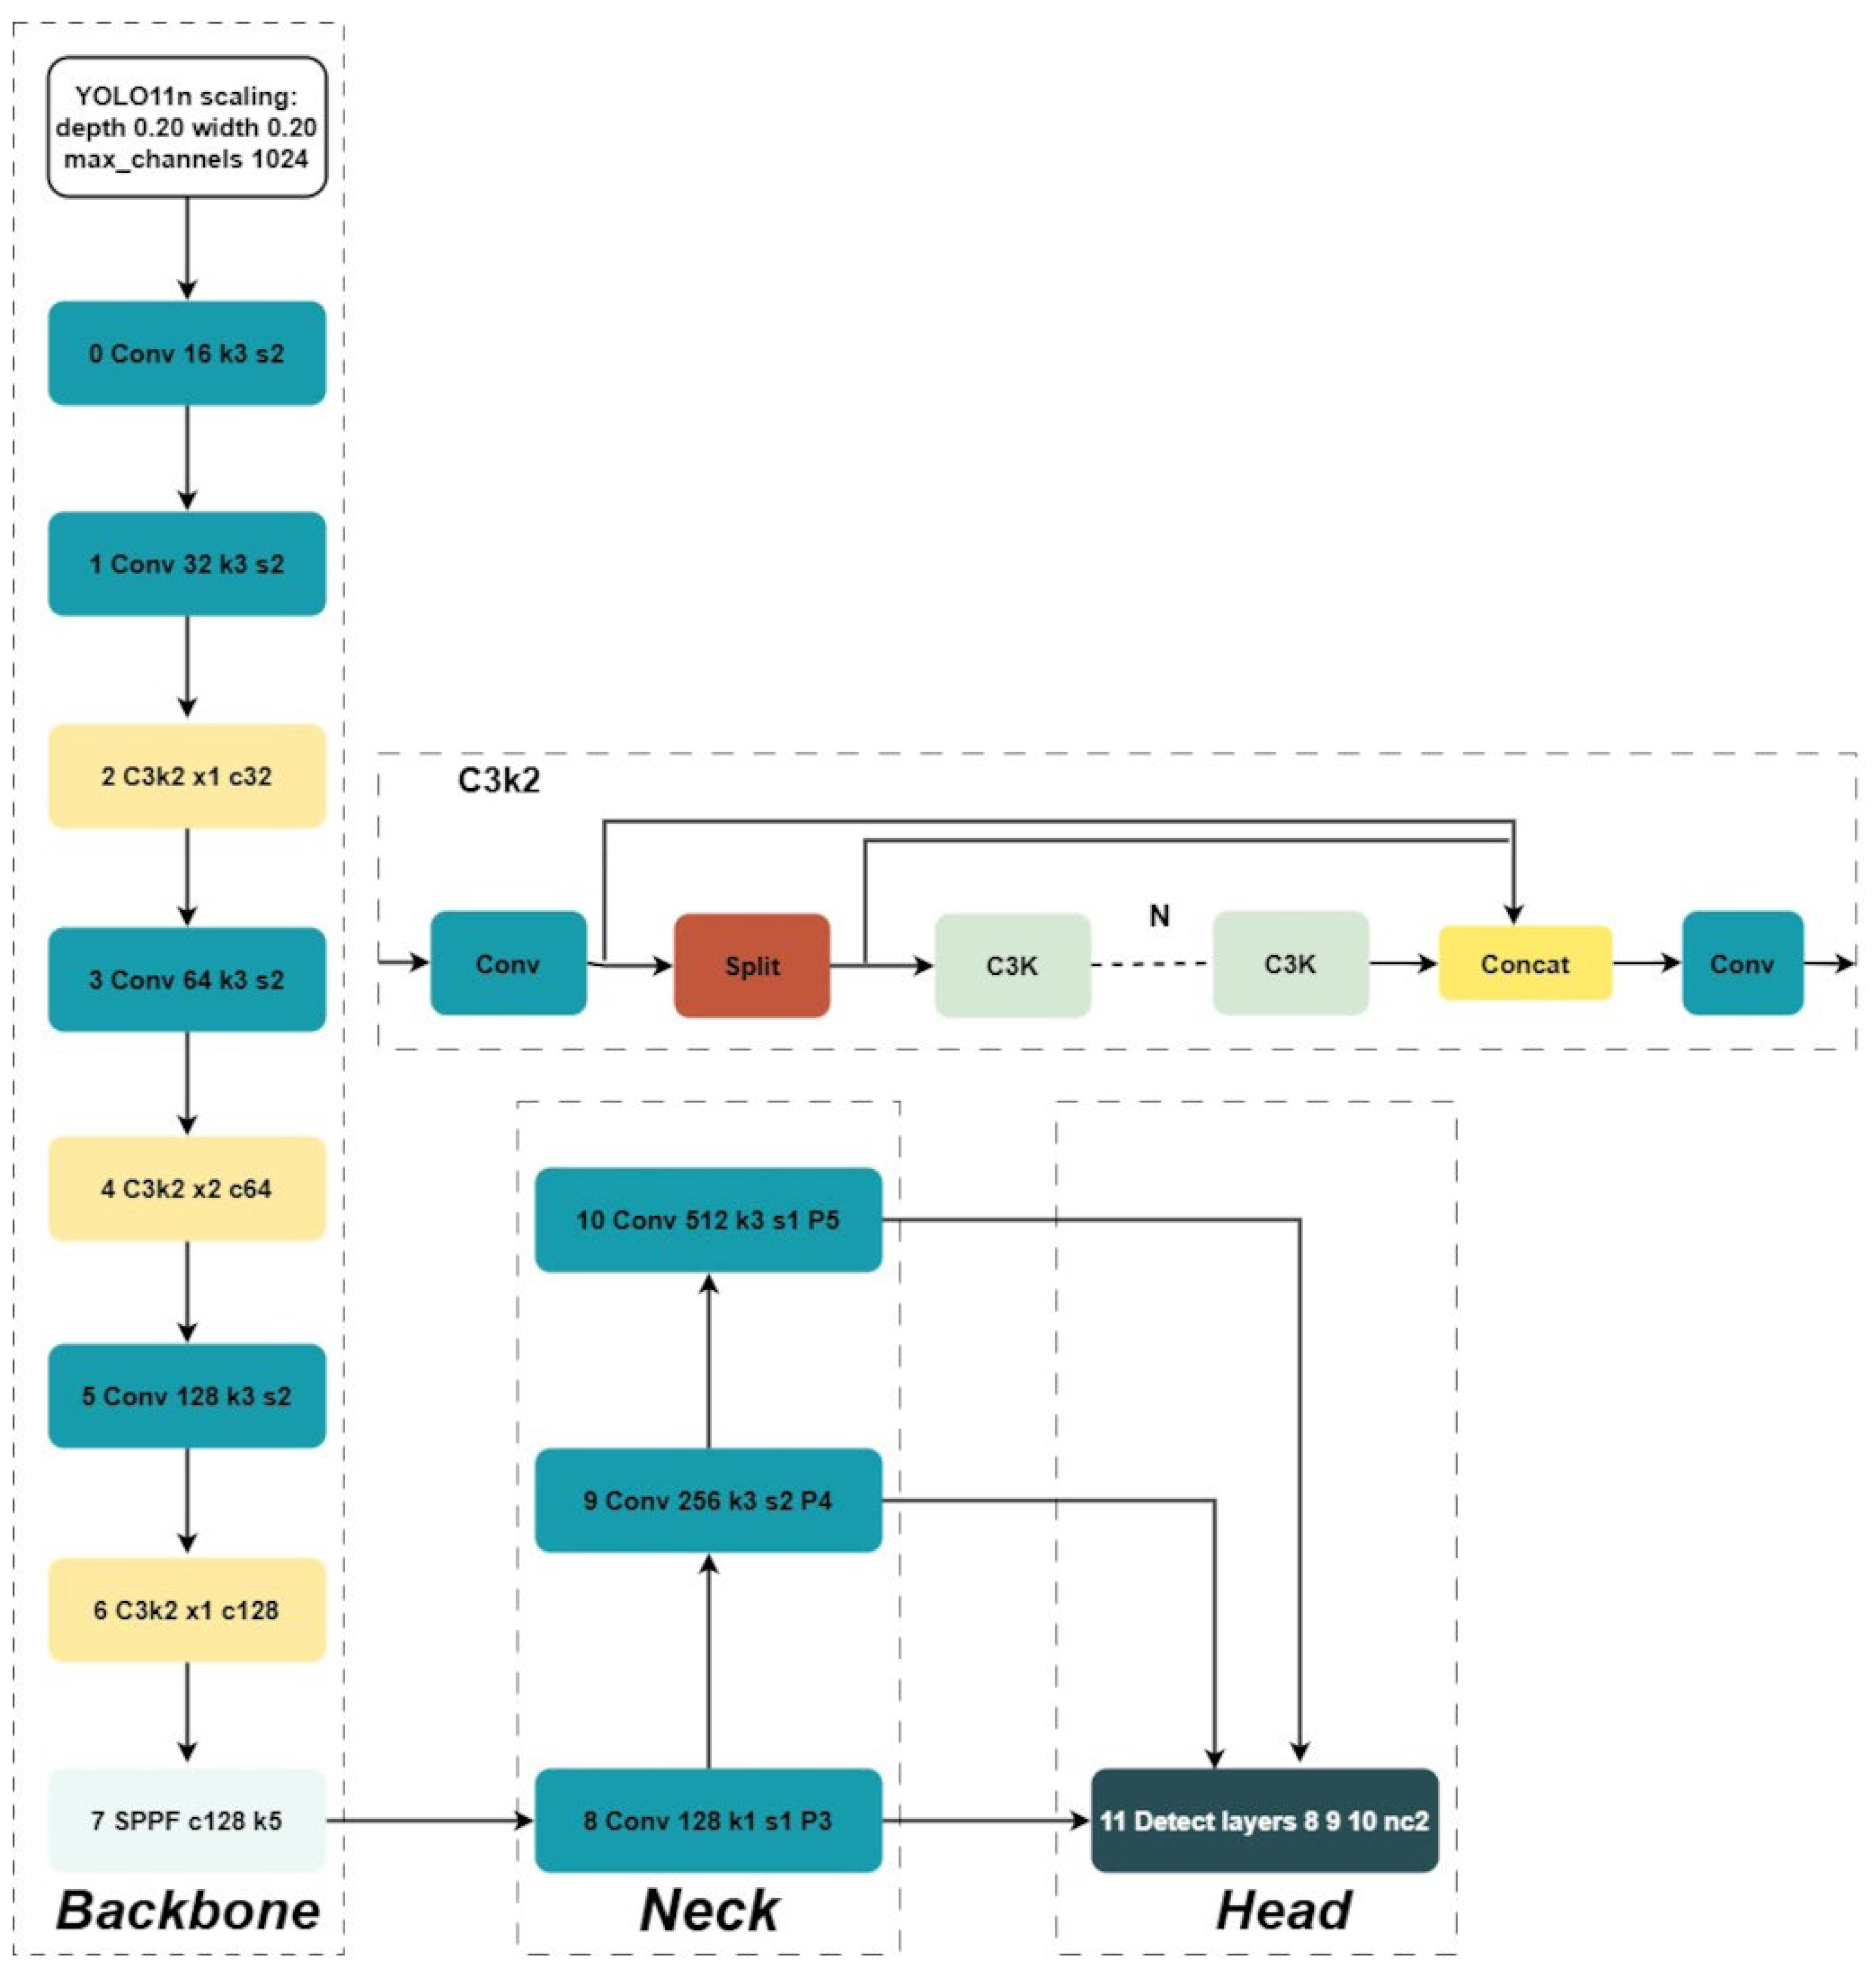
As seen in the input scenario (see Figure 2), a custom scaling technique was employed for a substantial model size trade-off. The depth and width of the network were defined at 0.20, which is far lower than the ordinary YOLO11n. The optimal scale factors of depth = 0.20 and width = 0.20 are aggressive, selected carefully to ensure a tight trade-off between detection performance and the extreme hardware constraints of the embedded platforms. In the YOLO architecture, model complexity (parameter count and memory size) scales roughly equal to the size of {depth} and {width} are represented by this equation {depth × width2}. When both parameters were fixed at 0.20, our YOLO11_Opt was further reduced to the same size (just 0.33 million parameters, 1.3 MB). Expanding these scaling factors to 0.25 or 0.30 would produce a large model footprint. For example, a scaling factor of 0.25 would lead to a model size of almost 2 MB (around 0.423 million parameters), whereas a factor of 0.30 would raise it to 2.5 MB. Such increases would require much more constrained memory and greater computational resources of the embedded platforms in question, while only generating an insignificant increase in the mAP.
Figure 2.
Structural architecture of the optimized YOLO11_Opt.
To quantitatively justify this selection, a sensitivity analysis was performed. Table 2 shows that the 0.20 scale offers the best precision with an optimal model size, Params, and GFLOPS, confirming 0.20 as the “sweet spot” for edge deployment.
Table 2.
Impact of depth and width scaling on model size.
Furthermore, to effectively implement this “depth = 0.20” architecture, specific structural modifications were applied: the number of C3k2 bottleneck blocks within the backbone stages was systematically reduced, and redundant expansion layers in the original network were bypassed to form the ultra-minimalist single-stream neck. This aggressive reduction is essentially responsible for the model’s very low parameter count and floating-point operations (FLOPs), hence being ultra-lightweight.
- Optimized Backbone
In the backbone, convolutional blocks and C3k2 (Cross-Stage Partial Kernel 2) are utilized to extract features efficiently, saving memory. By embedding the SPPF (Spatial Pyramid Pooling-Fast) module, multi-scale contextualization is improved drastically. In addition, this method is essentially designed to remove redundancy from the entire architecture [29]. This architectural choice provides the best combination of network flexibility and computational load; hence, it is well-suited to ARM-based processors and Internet of Things (IoT) applications.
- Streamlined Neck and Head
Instead of the typical architectures with elaborate feature pyramids, the neck of YOLO11_Opt employs an ultra-minimalist single-stream mode. As illustrated in Figure 2 (Layers 8, 9, and 10), features are processed sequentially to generate the three required levels: P3 (high-resolution features for detecting small objects), P4 (intermediate-level features for medium objects), and P5 (low-resolution features to capture the global context for large objects). These features are produced through compact convolutions and fed directly into the head. The Output Module (Detect) also alleviates some of this computational load, which is facilitated using the anchorless mode. This simplification is in accordance with recent works proposing more modular and deployment-friendly implementation of YOLO11 in embedded scenarios [30,31,32,33]. Figure 2 presents the whole model architecture of YOLO11_Opt. The overall detailed structural organization of all layers in the highly optimized architectural variant of YOLO11 called YOLO11_Opt is given in Table 3, including kernel sizes, strides, and output sizes.
Table 3.
Detailed layer-wise configuration of the proposed YOLO11_Opt architecture.
The specific structural modifications and scaling constants that make the proposed YOLO11_Opt architecture fully reproducible are detailed in Table 4. This “blueprint” outlines the specific parameters used to facilitate the switchover from the standard YOLO11n to our optimized version.
Table 4.
Architectural “blueprint” and scaling specification: YOLO11n vs. YOLO11_Opt.
Table 4 shows that the architectural simplification adheres to a strict hardware-aware design. Through a depth of d = 0.20 and 256 channels of width restrictions, we ensure that the feature maps remain efficient for budget CPUs such as the Broadcom BCM2711. This blueprint allows any researcher to reproduce the architecture accurately by implementing these constants in a standard YOLO YAML configuration.
This architecture is specifically tuned for edge deployment using a depth factor of 0.20 and a width factor of 0.20 as follows:
- Backbone (Layers 0–7):
- ○
- Layer 0–1 (Conv): Downsampling to 160 × 160 with filter counts of 16 and 32.
- ○
- Layer 2 (C3k2 x1): Minimalist block with 32 filters.
- ○
- Layer 3–4 (Conv and C3k2 x2): Processing at 80 × 80 with 64 filters (P3).
- ○
- Layer 5–6 (Conv and C3k2 x1): Processing at 40 × 40 with 128 filters (P4).
- ○
- Layer 7 (SPPF): Final context pooling at 20 × 20 with 128 filters.
- Neck (Single-Stream, Layers 8–10):
- ○
- Layer 8 (Conv): 1 × 1 convolution with 128 filters for P3 feature preparation.
- ○
- Layer 9 (Conv): 3 × 3 convolution, s2, increasing depth to 256 filters (P4).
- ○
- Layer 10 (Conv): 3 × 3 convolution, s1, reaching a maximum of 512 filters for deep semantic features (P5).
- Head (Layer 11):
- ○
- Detect: An anchorless module that integrates the streamlined outputs from Layers 8, 9, and 10 to perform real-time detection for two classes (healthy and bacterial spot).
4. Dataset Preparation
Experimental data were collected from the PlantVillage dataset [34]. This dataset is popularly used to benchmark machine learning algorithms in agriculture. The dataset consists of 54,306 images representing 14 crop species and 26 disease types that were visualized in a controlled environmental setting. Since the images come from various sources, the dataset provides plenty of variation to train reliable machine learning models. For this study, we focused on the bell pepper (Capsicum annuum) dataset. The selected dataset consists of 6475 images sorted into two classes:
- Healthy: 1478 images.
- Bacterial Spot: 4997 images.
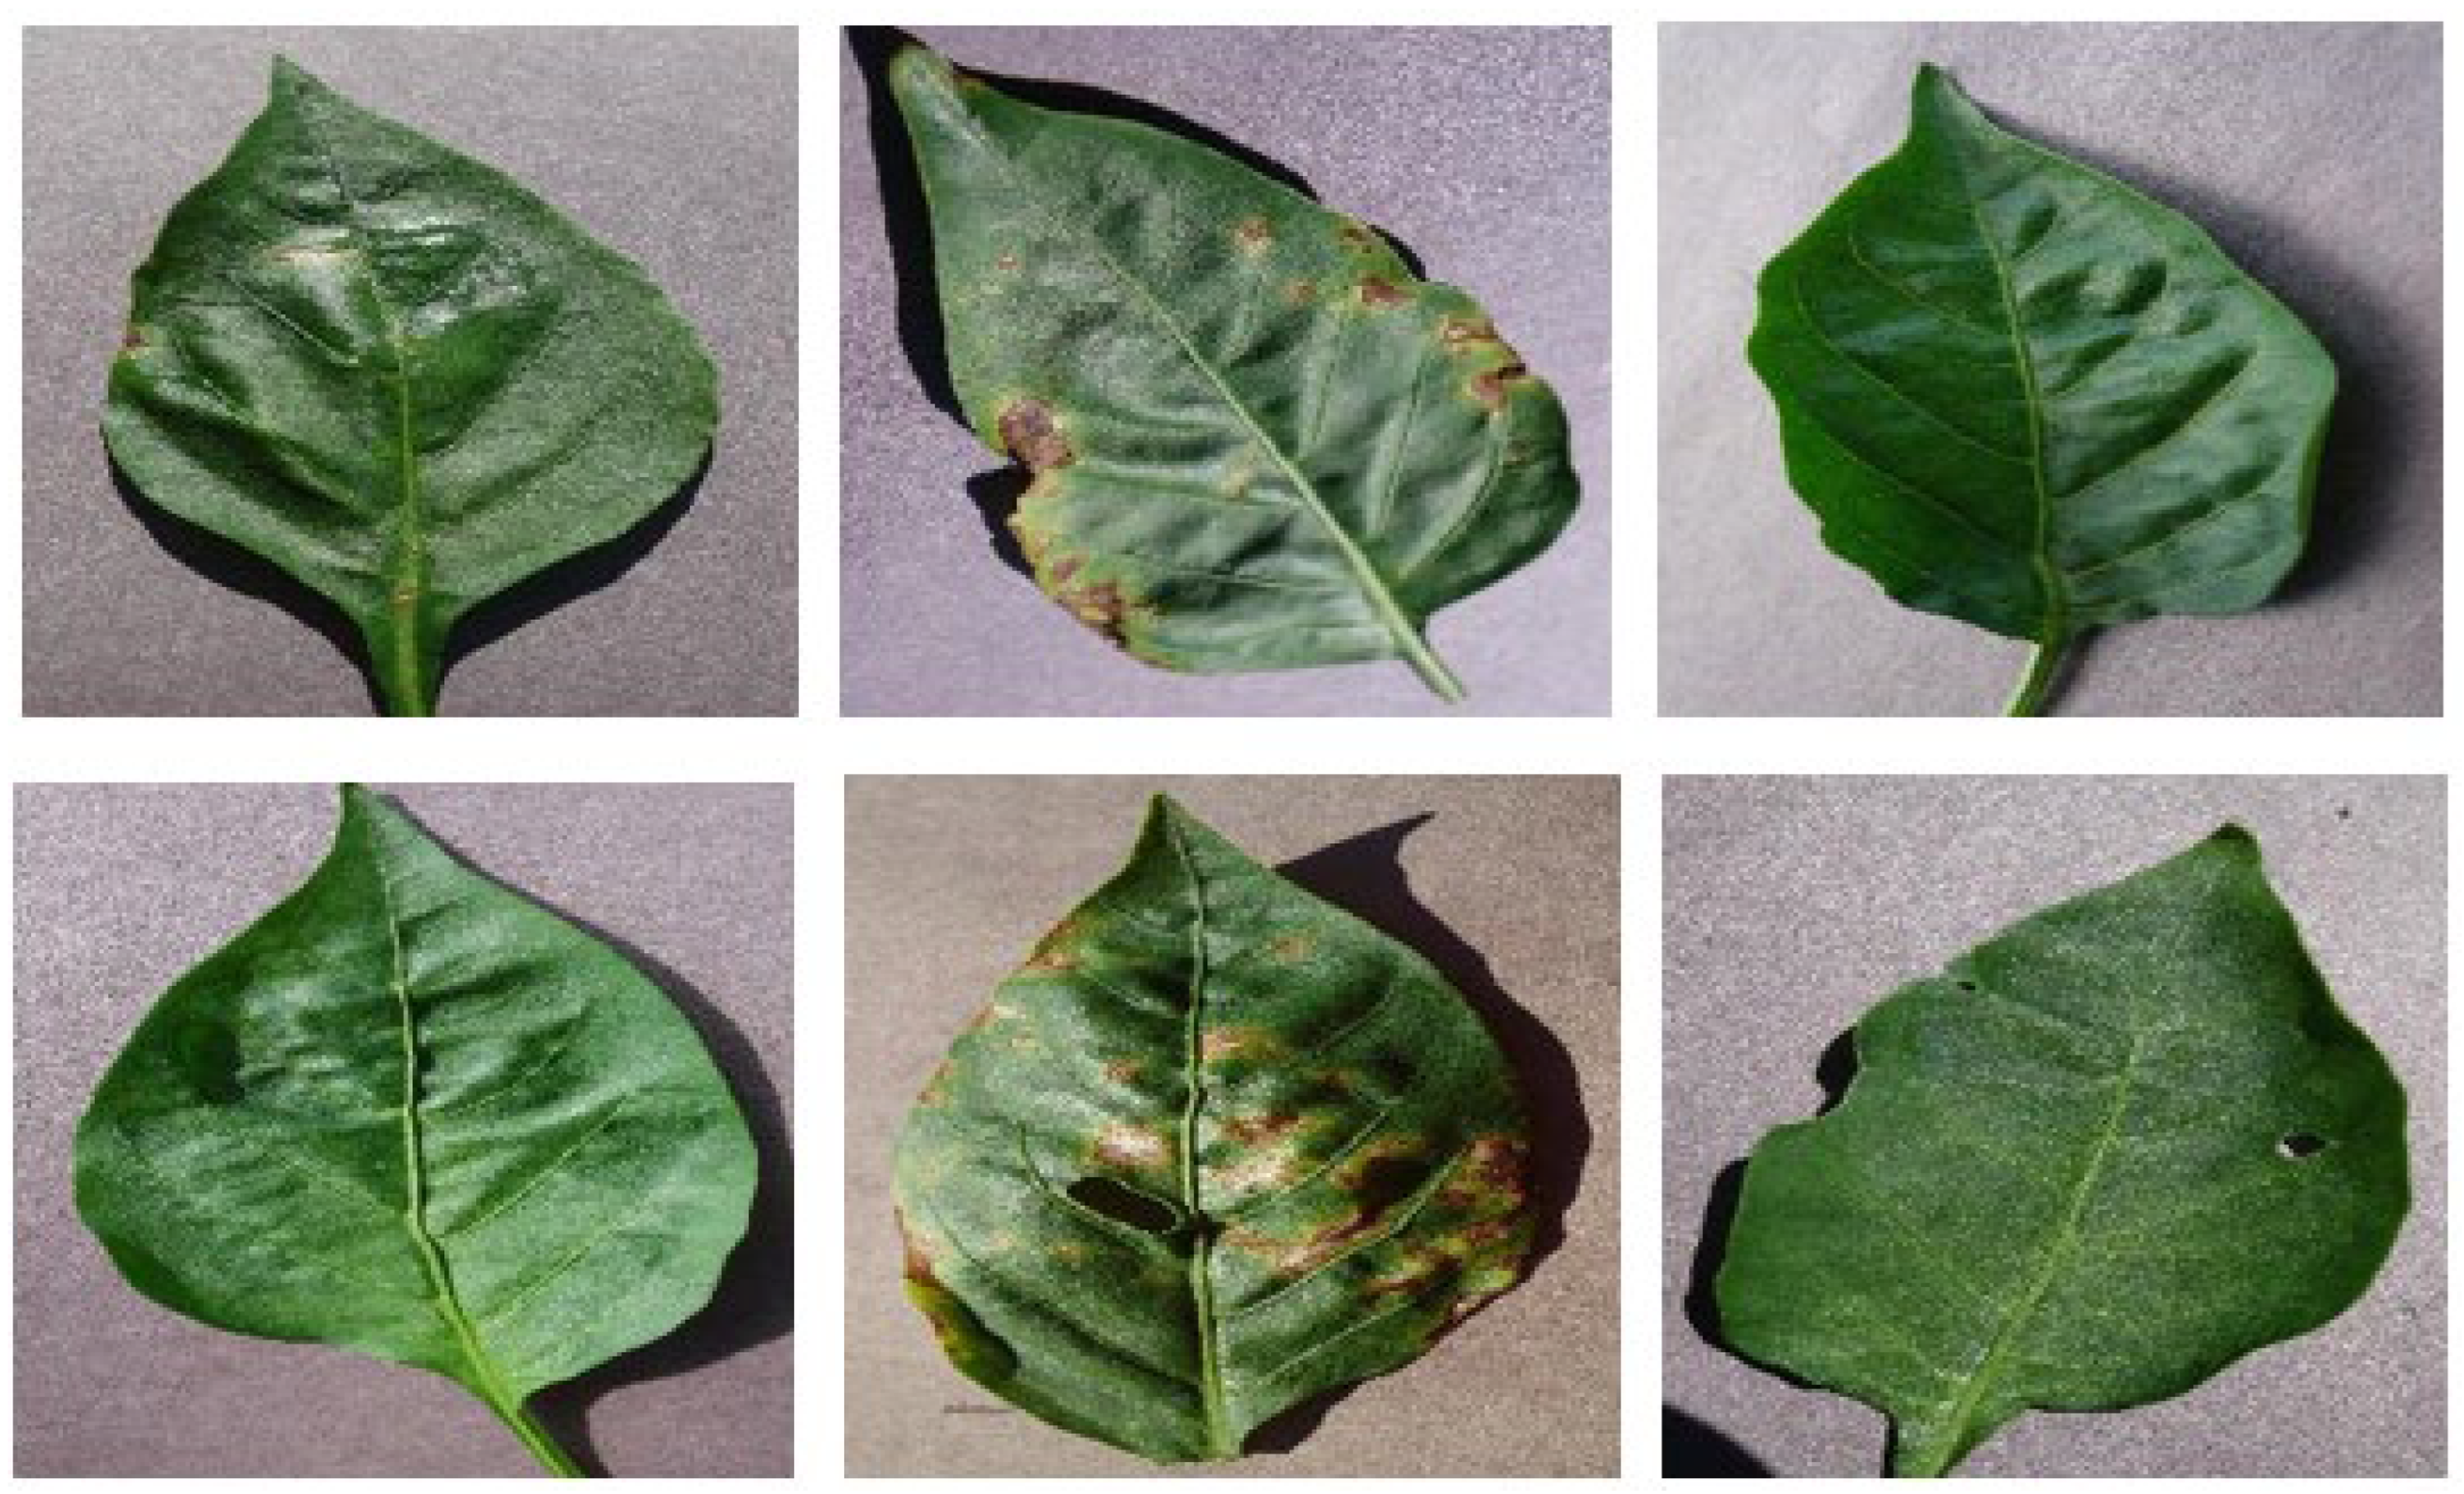
Figure 3 shows representative samples of healthy and diseased leaves from the collection. Images are in RGB format and 256 × 256 pixels. We divided the dataset into training, validation, and test partitions using a stratification technique, aiming to maintain the initial distribution of classes across all segments. Specifically, 80% of the images were allocated to training, 10% to validation, and 10% to testing. The application of stratification ensures the proportional representation of minority classes in each subset, thereby minimizing the risk of potential bias due to class imbalance. The validation set was used to adjust the hyperparameters and implement early stopping, while the test set remained completely out of sight during the training phase to ensure a neutral evaluation of model performance at the end. Due to the significant class imbalance (approximately 1:3.4) and the uniform nature of the background in the source images, multiple preprocessing steps were employed, including data augmentation, contrast correction, and background suppression. To mitigate the risk of bias specifically arising from this imbalance, we implemented a targeted minority-class oversampling strategy during the preprocessing phase. For the “healthy” class, we applied a series of synthetic augmentations, including random rotations (up to 30°), horizontal flips, and brightness jittering, to artificially equalize the representation of both classes in the training set. Furthermore, we utilized Mosaic Augmentation during training, combined with Binary Cross-Entropy (BCE) with Logits Loss, which is inherently robust to class imbalances. These techniques ensured that the reported high precision and recall values reflect the model’s genuine discriminative power rather than a bias toward the majority class.
Figure 3.
A brief overview of several randomly selected photographs of bell pepper leaves from the PlantVillage collection.
5. Results
To ensure a complete assessment of the efficiency of the models, all YOLO variants were trained, tested, and validated on the same dataset using the same hardware and hyperparameter conditions. We conducted experiments in a Google Colab environment with an NVIDIA Tesla T4 GPU (15.36 GB VRAM, Compute Capability 7.5). To ensure an impartial architecture comparison, all training hyperparameters were strictly defined as those used in the baseline YOLO11n and in the proposed YOLO11_Opt variant. Both models were trained with an initial learning rate of 0.01, batch size of 16, and weight decay of 0.0005 to keep the regularization consistent. A further warmup of three epochs for both models stabilized the gradients in the early phase of their training. Maintaining this uniform configuration meant that the performance trade-offs, namely, the drastic reduction in parameters and GFLOPS versus Mean Average Precision (mAP), were simply a by-product of structural scaling rather than a change in training dynamics.
5.1. Model Evaluation: Training Dynamics
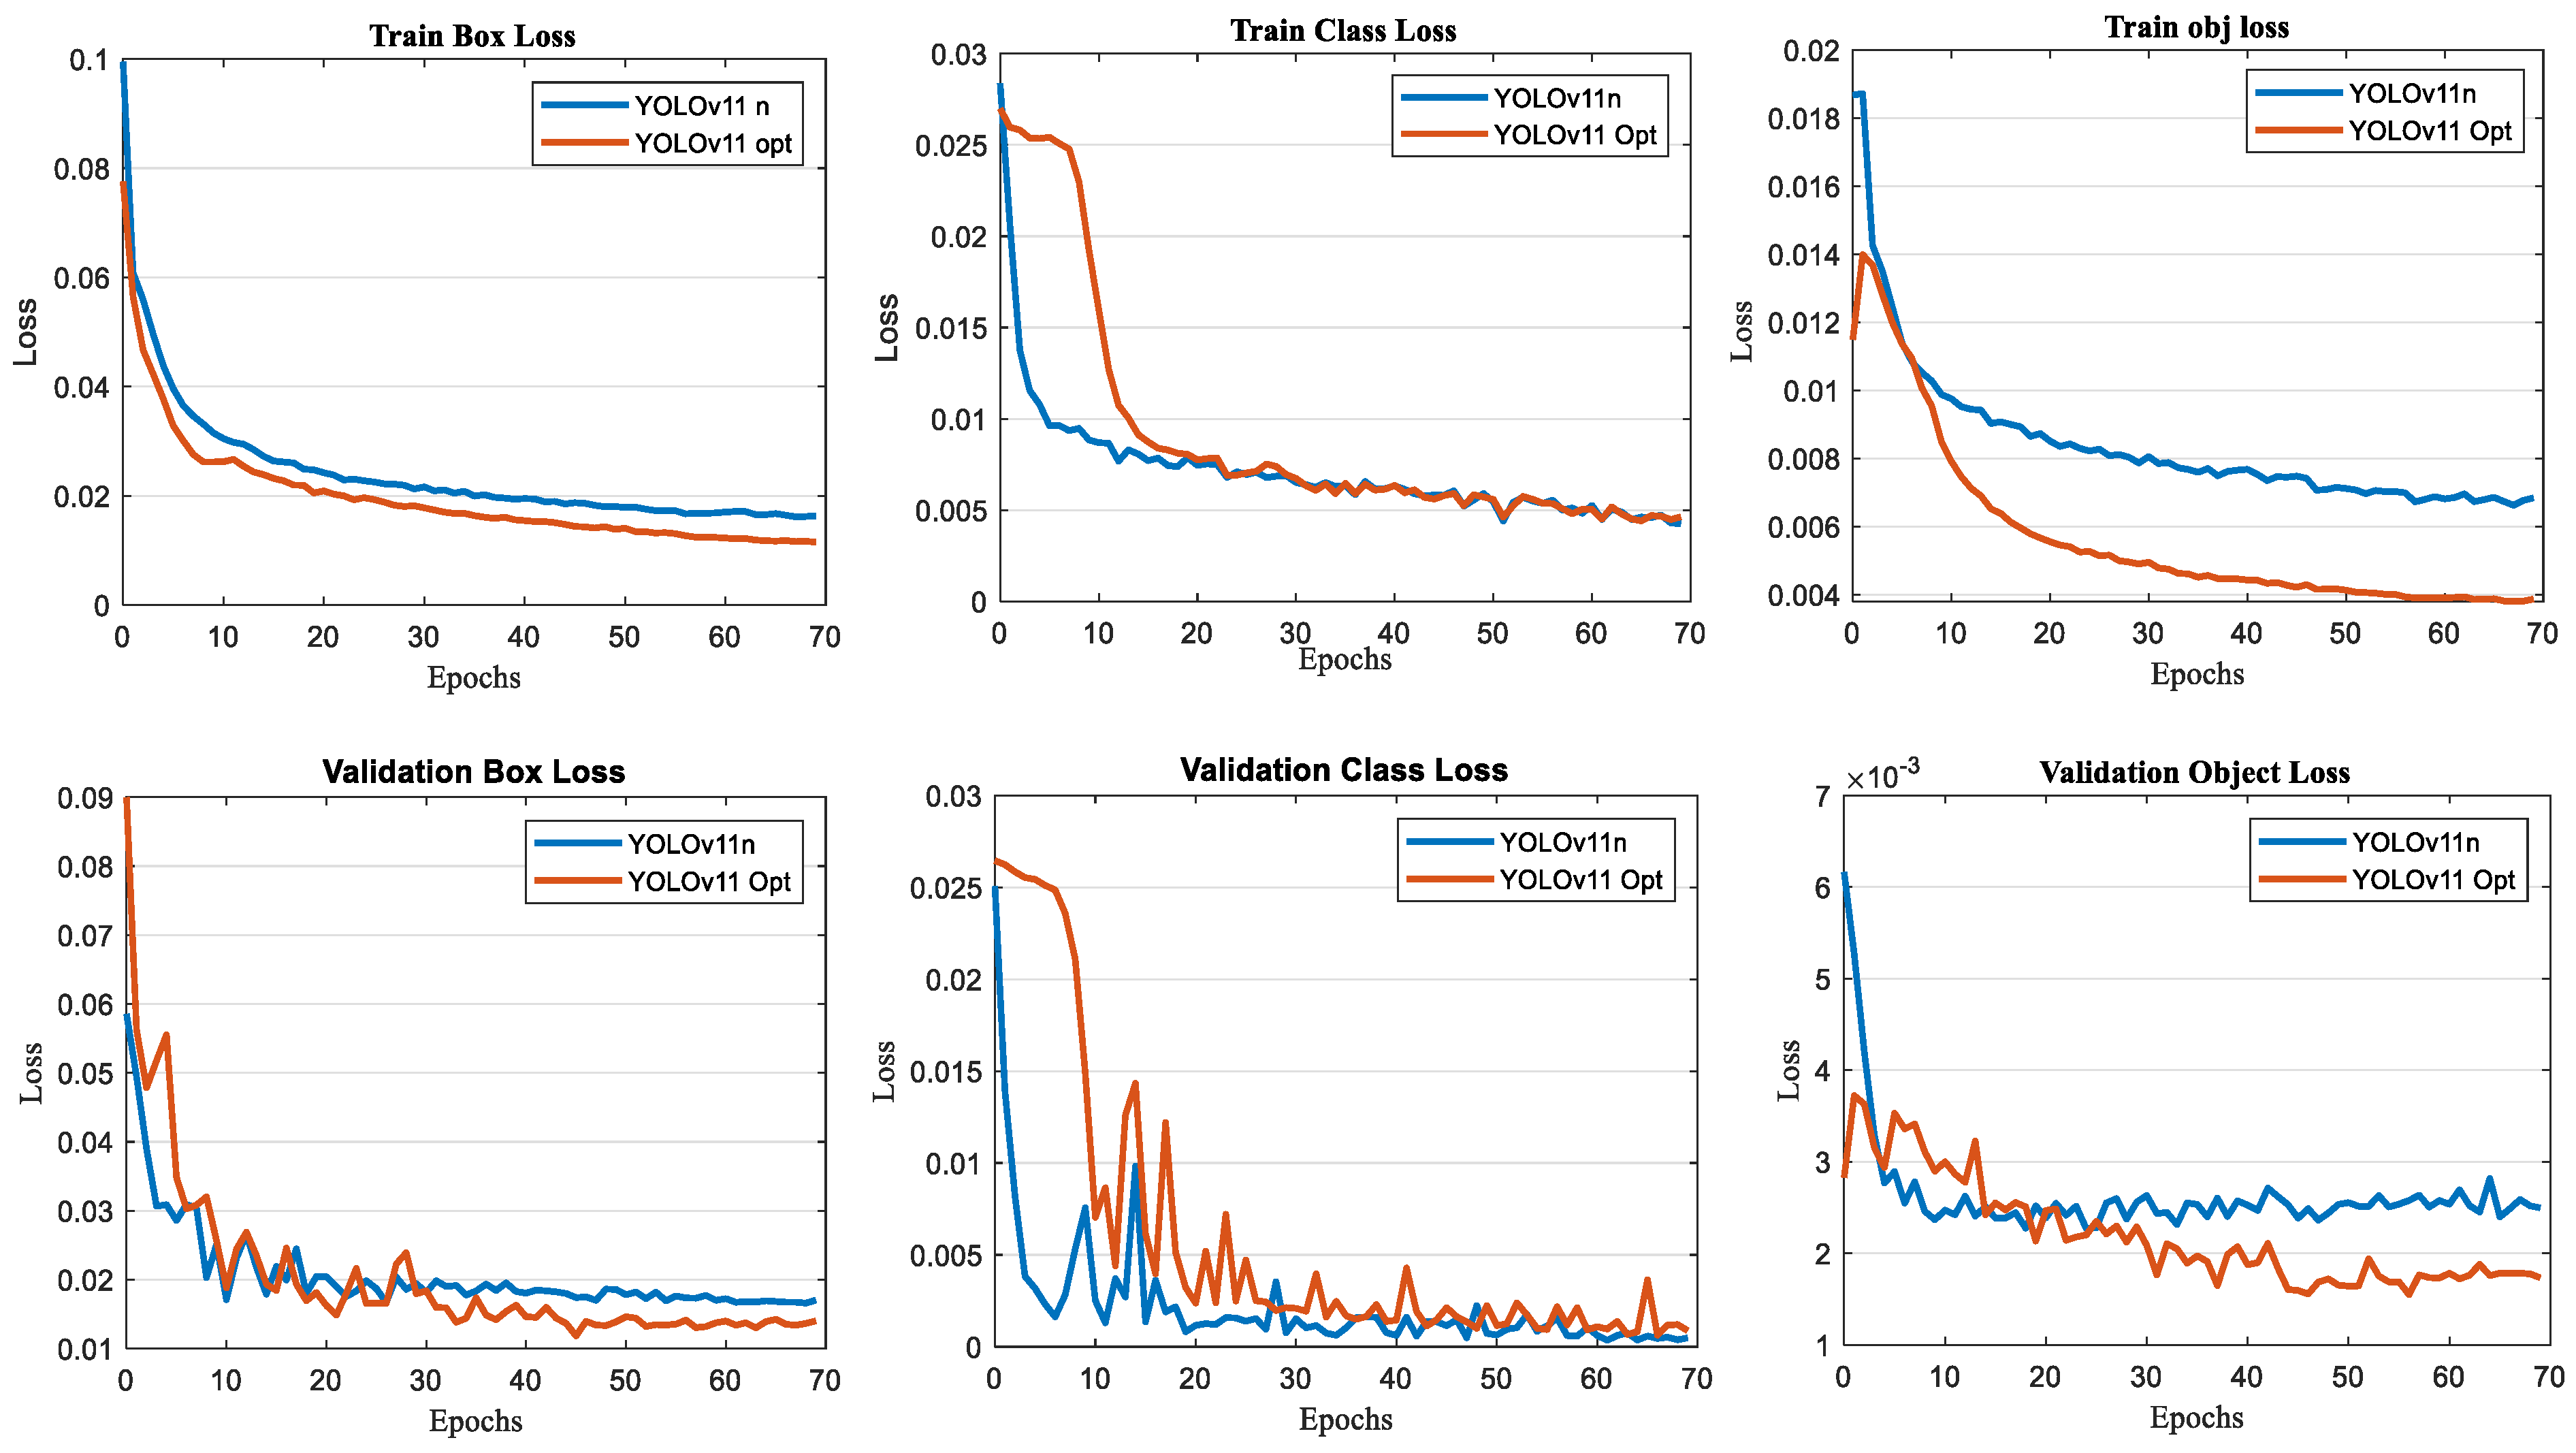
The training and validation loss curves for both the baseline YOLO11n and the proposed YOLO11_Opt are reported in Figure 4. Informed by these metrics, the convergence behavior and learning stability of the models were of crucial interest. As seen in the graphs, the baseline YOLO11n (blue curve) displayed a quick initial convergence, particularly in the first 10 epochs, as illustrated in Figure 4. This was expected due to its higher complexity and the large number of parameters. It can fit such behavior quickly. However, the proposed YOLO11_Opt (red curve) had a different learning profile. Some volatility was seen at the beginning of training (the Validation Class Loss around epoch 10–20), but the model became exceptionally stable in the later stages of training (after 30 epochs). Specifically, despite the far fewer parameters, YOLO11_Opt in the end had lower loss values than the baseline, especially in the Train Box Loss with 0.017 for YOLO11n and 0.011 for YOLO11_Opt, and the Train Object Loss with 0.0068 for YOLO11n and 0.0038 for YOLO11_Opt. This indicates that the aggressive structural optimization (scaling depth/width at 0.20) did not compromise the model’s capacity to learn essential features. Instead, it suggests that the optimized architecture effectively mitigates overfitting, leading to better generalization on the validation set. The consistency of the box and object losses in the final epochs pointed to a robust implementation of the gradient flow. Furthermore, an early stopping mechanism was implemented to monitor validation metrics and prevent overfitting. Although the validation loss stabilized significantly after 30 epochs, the training naturally progressed to the full 70 epochs because the model maintained this stability without exhibiting any signs of degradation.
Figure 4.
Training and validation loss curves of the YOLO11n and YOLO11_Opt models.
To sum up, YOLO11n converged a little faster, but YOLO11_Opt was a more efficient option. By compromising the initial convergence for a stable, high-quality final state, YOLO11_Opt is a much better candidate for embedded applications, where reliable long-term inference paired with energy-efficient implementations can outweigh the immediate training convergence.
5.2. Evaluation Metrics
We used multidimensional indicators to effectively evaluate the model performance. The terminology used throughout the manuscript is standardized: the term “accuracy” means standard classification accuracy and “precision” indicates positive predictive value, while “detection accuracy” refers explicitly to overall detection correctness. Their definitions and calculation procedures are described as follows:
- Precision measures the ratio of correctly identified positive detections among all positive predictions [35]. It is calculated using Equation (1):
- Recall (Sensitivity) [36] calculates the proportion of correctly predicted samples for each positive categorization. The equation is expressed as:
- Mean Average Precision (mAP): The Average Precision (AP) is determined as the area under the precision-recall curve. The mAP reflects the average of the AP values across all classes. Specifically, mAP@0.5 represents the average value when an Intersection over Union (IoU) threshold of 0.5 is set, while mAP@0.5:0.95 refers to the average value when IoU thresholds fluctuate between 0.5 and 0.95 with a step of 0.05. The calculation formula is established as follows [37]:
5.3. Quantitative Analysis
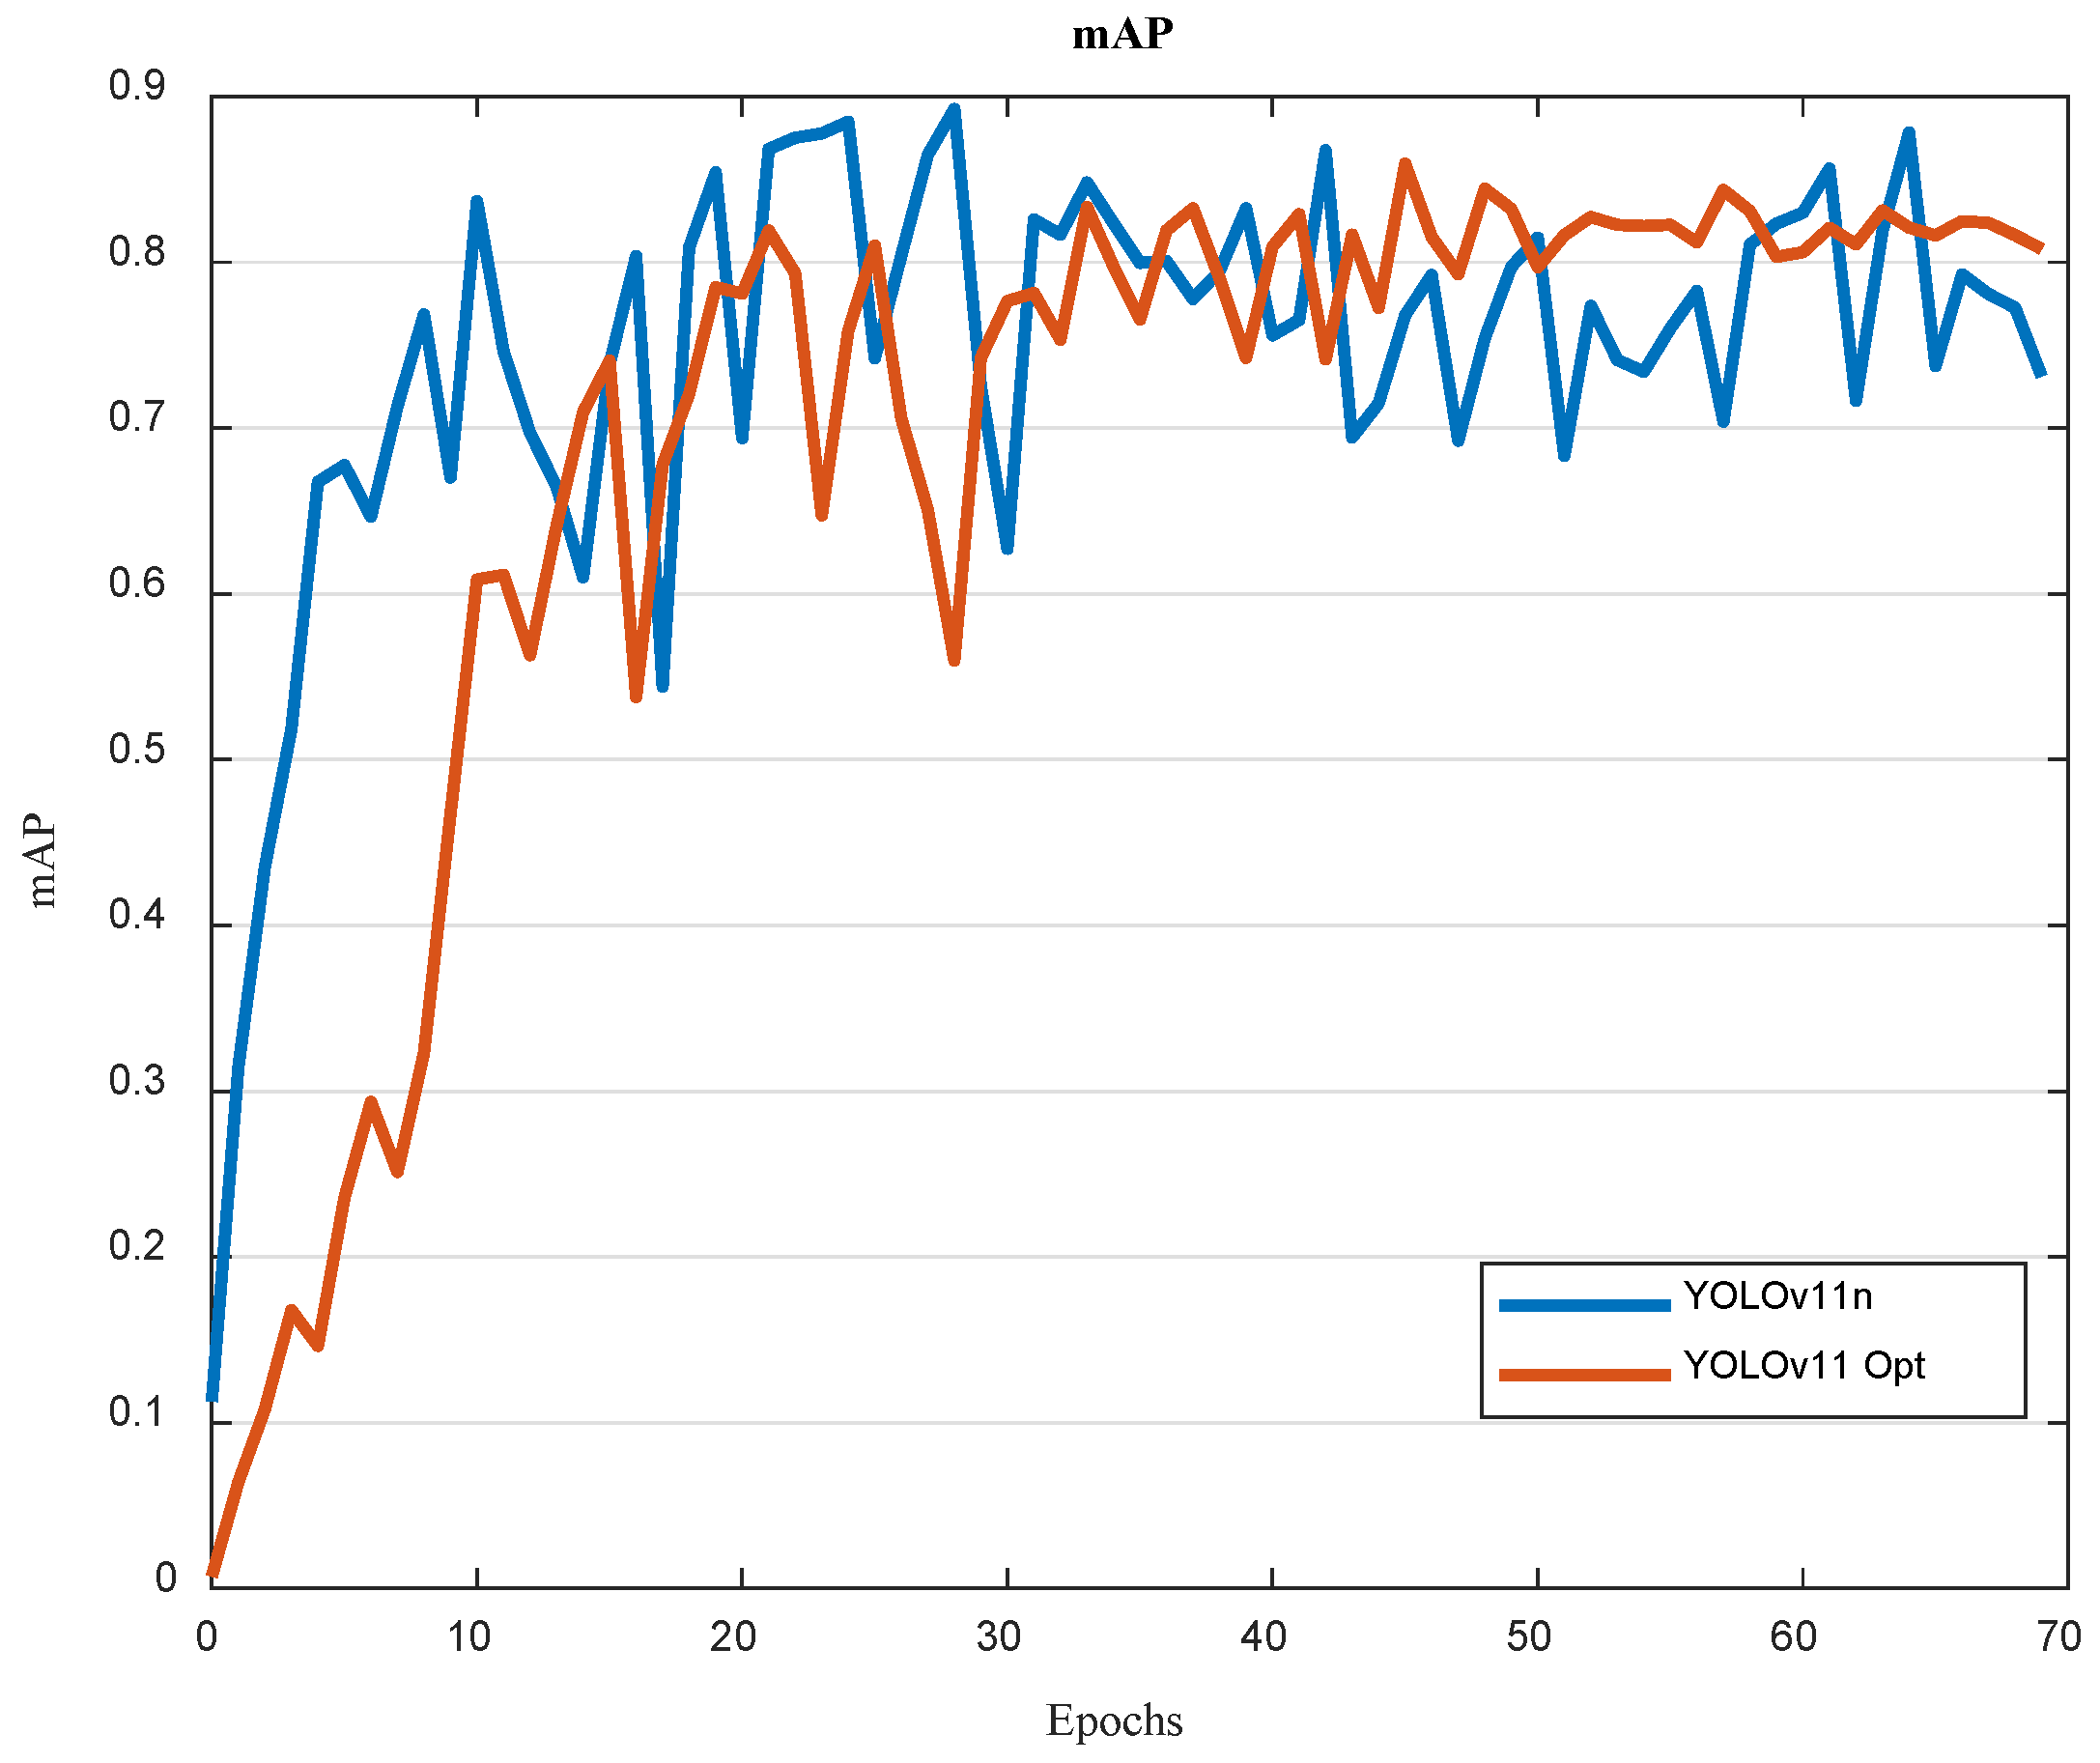
The mAP@0.5:0.95 growth at training is presented in Figure 5. The respective learning behaviors of YOLO11n and YOLO11_Opt were divergent. High performance (~0.95) occurred quickly for the baseline YOLO11n. In contrast, YOLO11_Opt had the best upward trajectory, progressively increasing over time. The mAP started lower but gradually increased to a more competitive value, at 0.91. The YOLO11_Opt was smaller, but its convergence over time was continuous, which is a significant part of the learning process and good for stable and generalizable applications.
Figure 5.
The mAP values of the YOLO11n and YOLO11_Opt models.
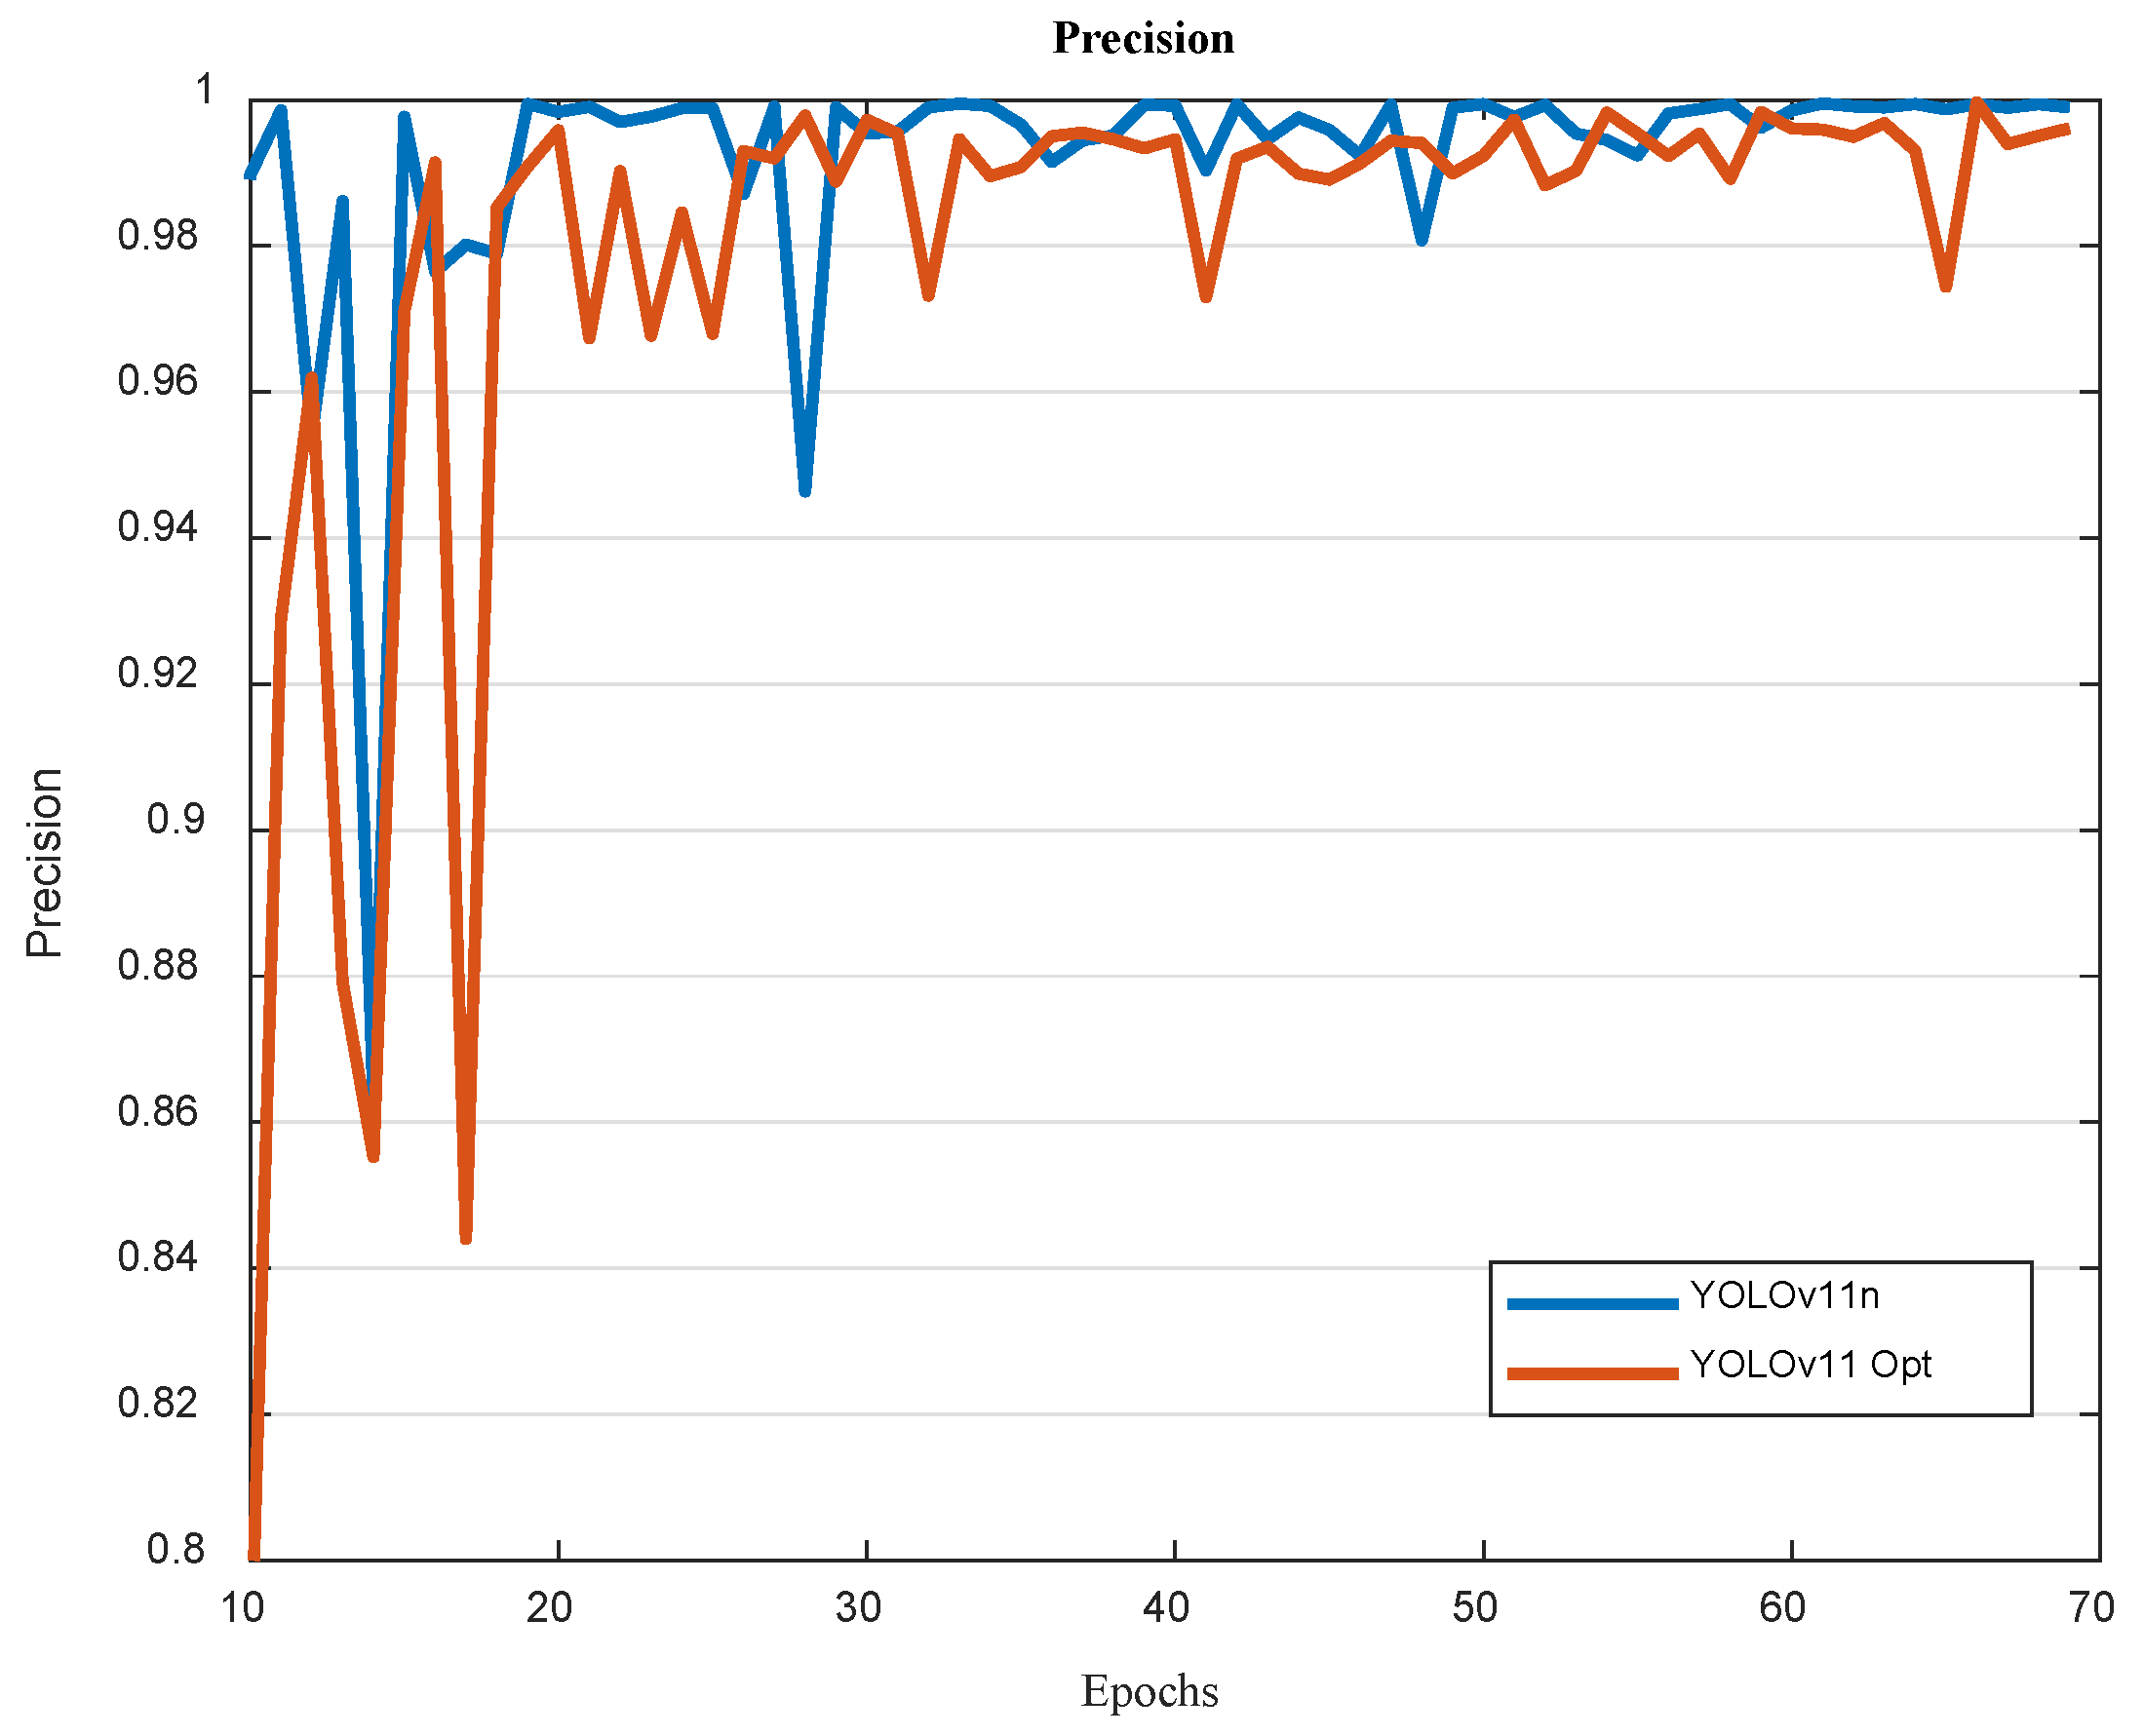
Variations within precision by training epochs are displayed for both models in Figure 6. In the first 0–20 steps, the instability of the YOLO11_Opt model was higher than the baseline, and sharp oscillations are reflected. This illustrates the slower convergence rate common to lightweight architectures. Nonetheless, after around 20 epochs, both models achieved a precision of around 0.94. At about 35 epochs, the optimized model achieved precision stabilization near optimal levels. As a result, the final precision of our optimized model was nearly the same as our reference model. This tells us that the aggressive structural optimizations hardly affected the final accuracy and allowed for much more adaptability on embedded systems.
Figure 6.
Precision of the YOLO11 and the YOLO11_Opt models.
We also analyzed the accuracy and performance of the models using computational complexity metrics, including GFLOPS (Giga Floating-Point Operations Per Second), number of parameters, and model size. These metrics correlate with the hardware resources needed to implement the model. Table 1 provides a comparison of YOLO11n and YOLO11_Opt in FP32, FP16, and integer quantization formats. The comparison shows a drastic reduction in computational cost for the optimized form.
- Performance baseline: YOLO11n (FP32) had excellent metrics of 0.961 mAP and 0.996 accuracy, but it demanded computational complexity: 6.3 GFLOPS, more than 2.58 million parameters, and a model size of 10 MB. The inference time of only 5 ms or less was notable.
- Optimized performance: On the other hand, YOLO11_Opt (FP32) had slightly lower 0.913 mAP and 0.991 accuracy rates, along with a significant reduction in resource consumption, using 0.5 GFLOPS complexity (~92% reduction) and only ~0.33 million parameters (~87% decrease). The model size was reduced to 1.3 MB, providing a significantly faster inference time of 1.4 ms.
This trend persisted with FP16 and integer versions. While quantization slightly affected the metrics, YOLOv11_Opt remained significantly lighter (0.7 vs. 5.1 MB for FP16) and faster. Hence, the results suggest that YOLOv11_Opt offers a solid compromise between accuracy and efficiency, which is particularly attractive for embedded systems that need to run quickly and have small memory footprints. In addition, inference latency was associated with hardware resource utilization to validate the embedded-system claims. Building on aggressive architectural scalability and the optimized 128 × 128 RGB input resolution, the INT8 quantized YOLOv11_Opt model achieved a surprisingly low CPU load of 15% to 20% on Raspberry Pi 4. Likewise, on NVIDIA Jetson Nano, the FP16 model utilized only 10–15% of the GPU via TensorRT and functioned well in its lowest 5 W power mode. These low utilization scores prove that the above optimizations not only realize high throughput and prohibit thermal throttling but also allow for substantial computing space in parallel edge workloads.
This performance profile was influenced by the constraints of general-purpose cloud environments versus specialized edge hardware. In the specific Colab setup with a T4 GPU, FP32 ran faster because it avoided the extra work of quantization and dequantization. While FP32 took a direct route, FP16 and INT8 added extra conversion steps that slowed calculations down in the TFLite and Pytorch runtime, which is primarily optimized for mobile devices, microcontrollers, and single-board computers such as the Raspberry Pi 4. It should be noted that Colab inference times are indicative and serve only for relative comparison; actual edge deployment performance times may differ depending on the target hardware.
Although it is possible to run NVIDIA TensorRT in Colab to achieve faster INT8/FP16 performance, this framework is typically reserved for final deployment on dedicated hardware to fully unlock the GPU’s acceleration. Actual edge deployment performance is detailed in Table 5.
Table 5.
Comparative validation performance and average inference time per object across the two evaluated models.
Table 5 details the performance metrics with standard deviations across multiple runs. While YOLO11_Opt showed a marginal numerical variation in precision (0.994 ± 0.001 vs. 0.996 ± 0.002), the overlapping standard deviations confirmed that this difference was statistically negligible. Importantly, the optimized architecture achieved an 87% reduction in parameters and a significant decrease in GFLOPS. Furthermore, the training phase demonstrated high stability across independent trials, with negligible variance in validation performance, confirming the robustness and consistency of the optimization process.
The integer (INT8) models were obtained through Post-Training Static Quantization (PTQ). To guarantee better fidelity during the bit-precision reduction, a representative calibration dataset of 100 images was randomly sampled from the training set. This allowed for the accurate estimation of scale and zero-point parameters for each layer using asymmetric quantization for activations. The TFLite backend was optimized for INT8 for the Raspberry Pi 4 (CPU) deployment according to ARM NEON SIMD instructions, which explains the large speedup we observed. In contrast, FP16 became prioritized for NVIDIA Jetson Nano, in conformity with TensorRT optimization for Maxwell GPU architectures, which are inherently efficient for half-precision floating-point operations.
5.4. Confusion Matrix Analysis and Failure Assessment
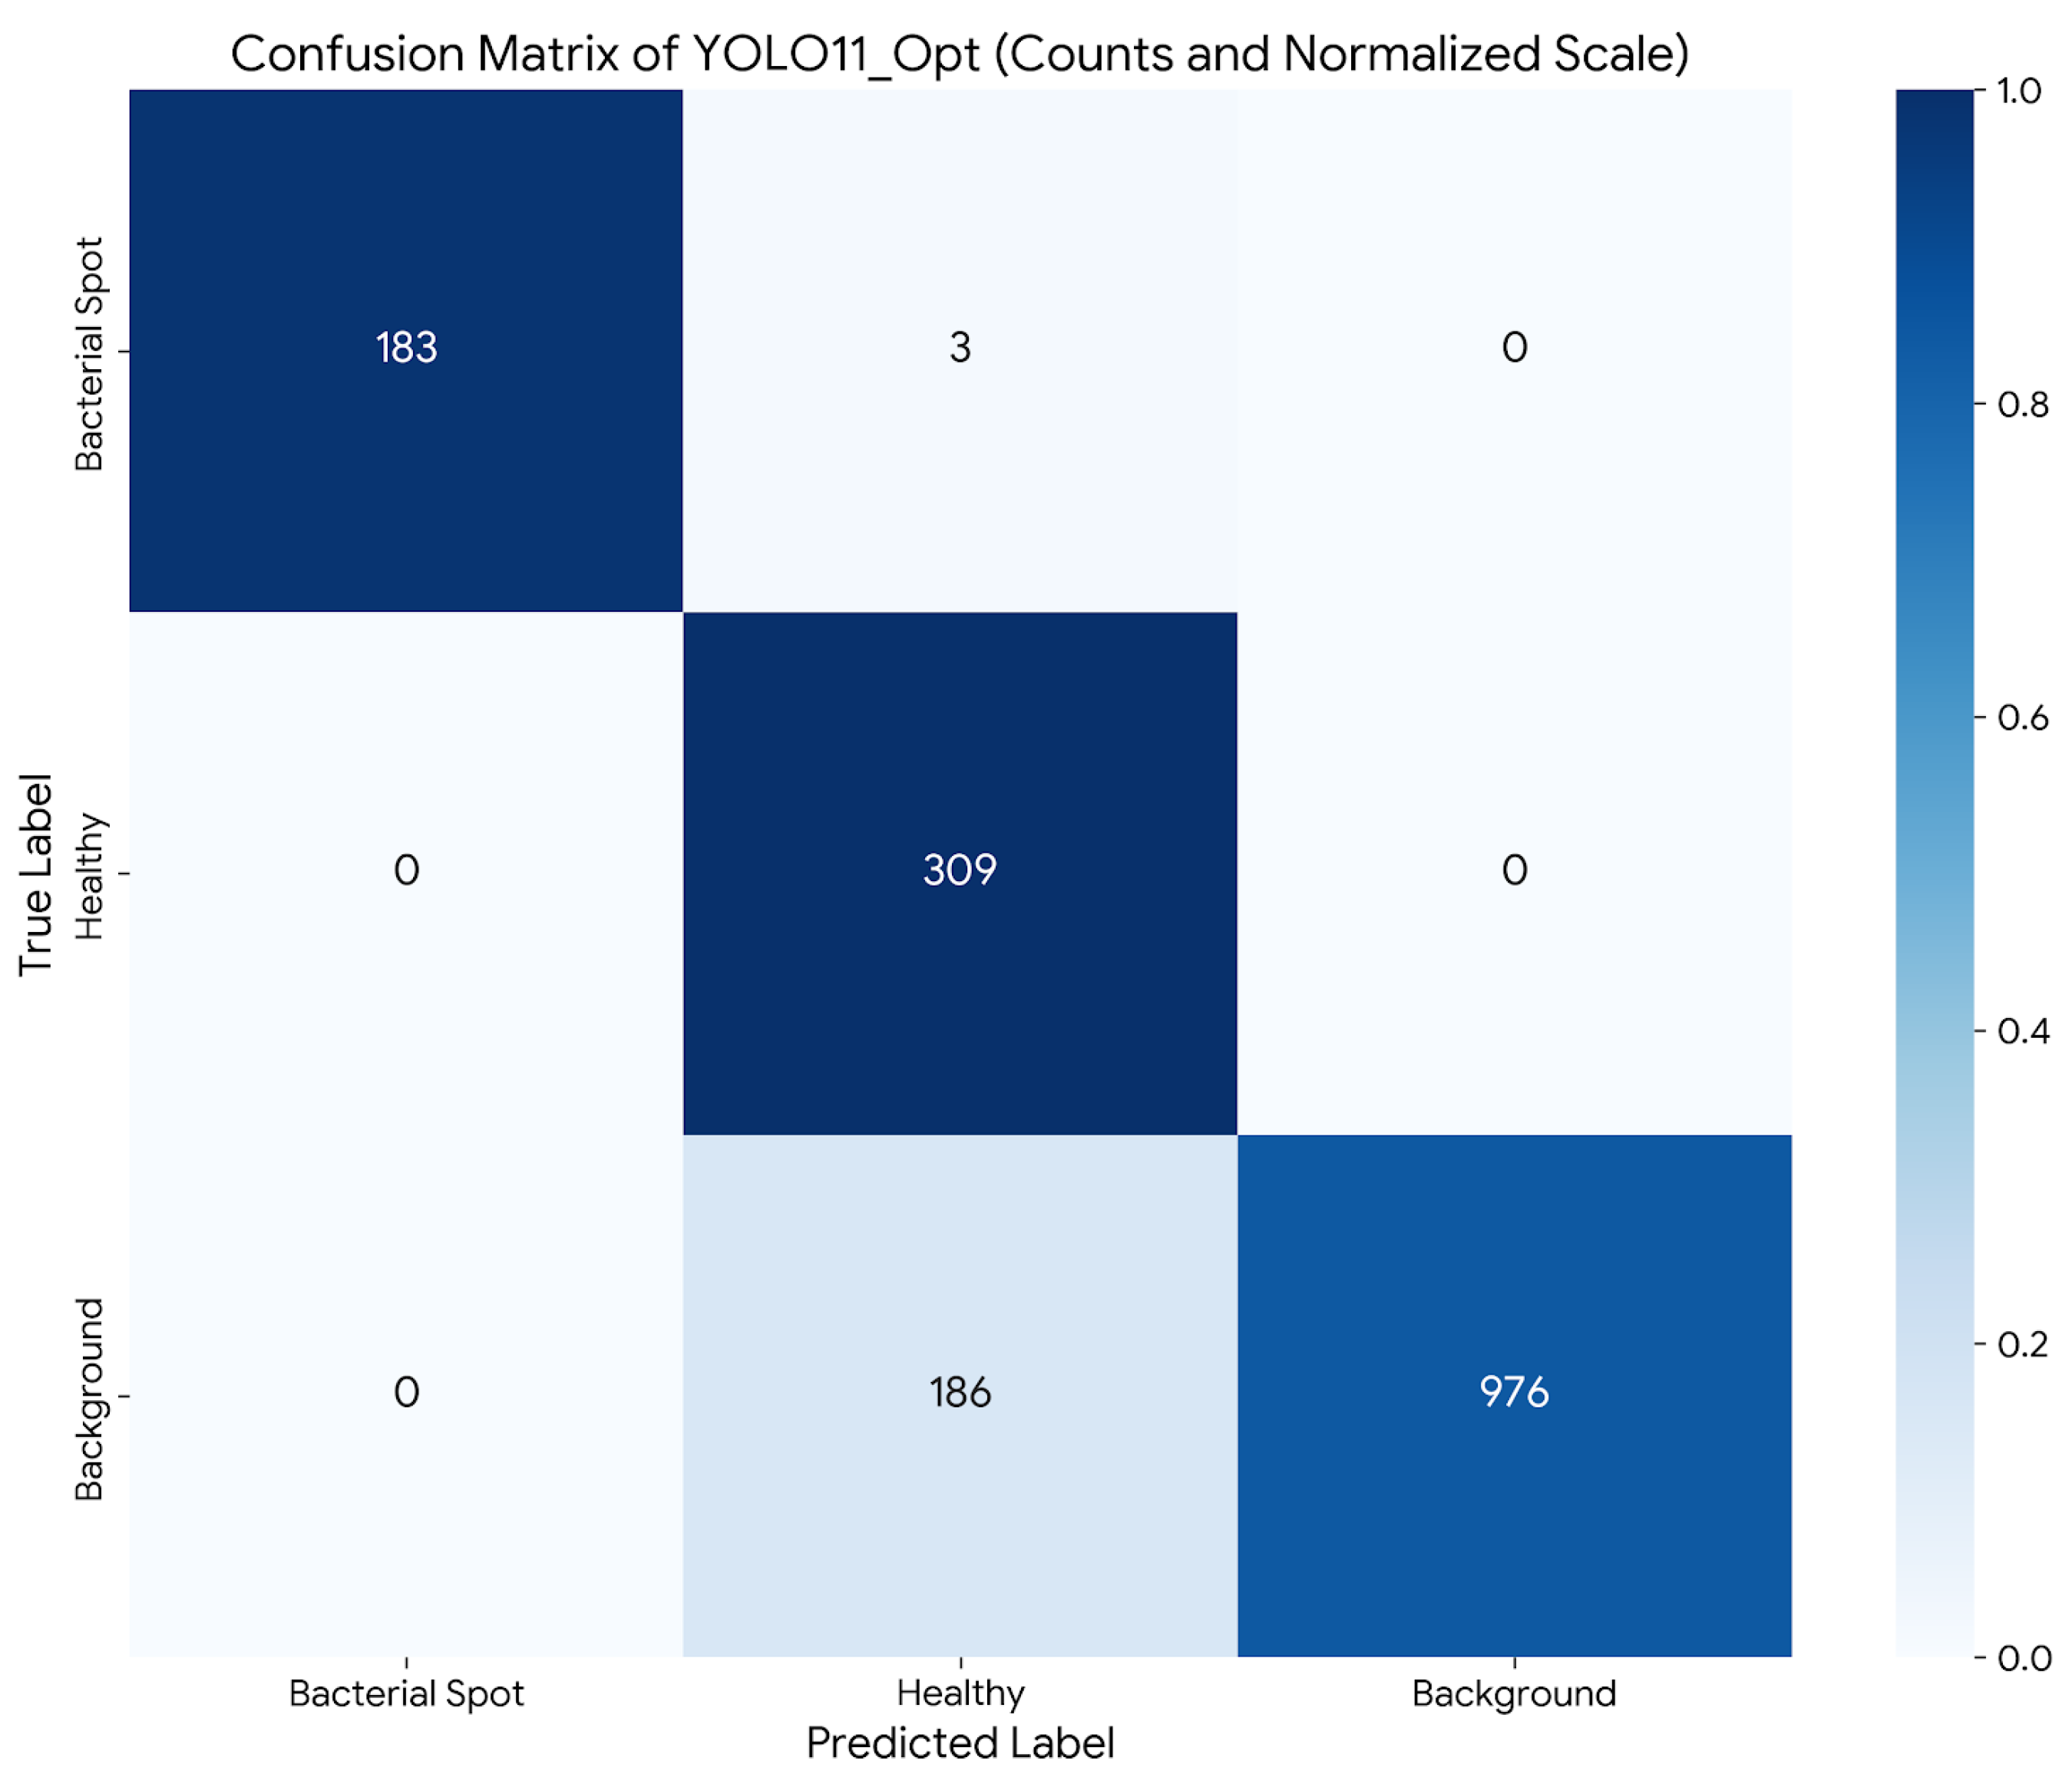
The confusion matrix is one of the most important diagnostic tools that distinguishes between the actual vs. predicted labels; it does this by determining explicitly which categories contain most of the class errors [38]. In Figure 7, the new confusion matrix contains explicit numerical counts with a high-contrast normalized scale to illustrate the model’s ability to differentiate the main classes of interest.
Figure 7.
Normalized confusion matrix of YOLO11_Opt.
- Class separation performance: The healthy class did well; 309 classifications were correctly identified, with negligible misclassification. This demonstrated the stability of both the models and the intraclass variability. The prediction rate of the bacterial spot class was high, with 183 correct predictions out of 186 genuine instances. Furthermore, there was very little confusion between the pathological (bacterial) and physiological (healthy) states, with only three misclassified events. This implies that the diseased leaves can be distinguished from the healthy leaves, which is a prerequisite condition for the automated diagnostic system.
- Ambiguity of background and false alarm rates: We observed from the analysis results that an issue existed regarding the background class, and 186 samples were misclassified as healthy. This pattern indicated that some background objects had similar surfaces to healthy leaves, resulting in false positives. Quantitatively, against this background, 5.4% of real-world cases would display false alarms. This is a well-known problem in unstructured feature environments; the specific lighting or background colors can confuse feature extraction layers.
- Analyzing failure and agricultural impact: Given the false negatives, it was established that missed infections will lead to delayed intervention and crop yield loss. This danger is mitigated by the high recall of YOLO11_Opt (0.984 for the bacterial class), which guarantees that almost all the diseased leaves are flagged. There is a 5.4% false alarm rate (background as healthy), which is “safe” because it does not activate false disease alarms or harmful chemical treatments.
- Conclusion of robustness: In conclusion, the confusion matrix confirmed that YOLO11_Opt performed effectively in distinguishing a healthy leaf from one with bacterial infections. While background ambiguity remains a challenge, it does not interfere with the system’s ability to detect disease presence when a leaf is present. These findings confirm that the model can be effectively integrated into automated systems for plant health monitoring.
6. System Implementation
6.1. Hardware Architecture
The proposed system was optimized for real-time edge inference in plant disease detection. To analyze all the recordings, the edge AI model ran on the core processing unit and detected the diagnosis immediately. The Raspberry Pi 4 Model B and NVIDIA Jetson Nano embedded platforms, which are CPU-based and GPU-based edge computing paradigms, respectively, assessed the scalability and extensibility of our solution.
- The Raspberry Pi 4 (RPi4): This single-board computer has a quad-core Broadcom BCM2711 (Cortex-A72) CPU running at 1.5 GHz. The model was chosen for its general availability, low price (~$70), and enough FP32 (about 32 GFLOPS) performance to support lightweight models [39]. Studies [40] have shown it can efficiently process advanced neural networks without support from cloud infrastructure. During long-duration inference on Raspberry Pi 4, throttling may occur due to thermal constraints. System monitoring was performed, and appropriate cooling or workload scheduling and low CPU load can mitigate this effect.
- NVIDIA Jetson Nano: Built specifically for edge AI, this module combines a quad-core ARM Cortex-A57 CPU with a 128-core Maxwell GPU. With low power consumption (5–10 W), it offers 472 GFLOPS of computing power, including parallel processing using CUDA cores and optimizing TensorRT [41,42]. The Jetson Nano Developer Kit can cost 250 USD. The price may vary depending on the country and distributor.
Both systems employ the Raspberry Pi Camera Module 3 with a 12 MP Sony IMX477R sensor for acquisition of images. This sensor was selected due to its high resolution and good low-light performance that guaranteed the quality of input data for the model [43]. The technical specifications of the experimental hardware are illustrated in Table 6.
Table 6.
Comparison of RPi4 and NVIDIA Jetson Nano.
While direct power measurements were not conducted, YOLO11_Opt’s energy efficiency was evidenced by its 92% reduction in GFLOPS, which drastically lowered the electrical draw. On the Raspberry Pi 4 (power envelope: 3 W idle to 6 W max), the model’s minimal 15–20% CPU utilization keeps power consumption remarkably close to the idle baseline. Similarly, it utilizes only 10–15% of the Jetson Nano’s GPU, operating comfortably within its strict 5 W mode. By requiring significantly fewer processing cycles per frame, the model avoids peak power limits and thermal throttling, confirming its viability for low-cost, low-energy agricultural systems.
6.2. Model Deployment and Performance Analysis
To evaluate the potential for actual deployment, some in-depth live inference experiments were carried out on two distinct edge devices, Raspberry Pi 4 (CPU) and NVIDIA Jetson Nano (GPU). To enable cross-device portability, the trained YOLO11_Opt model was first exported in the ONNX framework. It was then transformed to TensorFlow Lite (TFLite) for Raspberry Pi 4 and TensorRT for NVIDIA Jetson Nano, using the hardware-specific, accuracy-aware optimization. To facilitate a systematic assessment, the reported throughput (FPS) and latency statistics covered the complete processing pipeline from image pre-processing and model inference to post-processing. These metrics did not include hardware-dependent camera I/O latency as a sole measure of the architecture’s computational capacity. To validate these values, three different numerical precision formats (FP32, FP16, and INT8) were checked in a series of independent runs. The mean values along with their standard deviations are reported in Table 7, indicating consistency of performance.
Table 7.
Inference performance of YOLO11n and YOLO11_Opt on RPi4 and NVIDIA Jetson Nano.
- CPU-Based Inference (Raspberry Pi 4)
The YOLO11_Opt model was shown to achieve high efficiency on the Raspberry Pi 4 with ARM Cortex-A72. In the case of the FP32 format, the model received a peak throughput of 93.17 ± 13.53 FPS, along with a very low latency of 10.97 ± 1.68 ms, and the FP32 formatted result surpassed the INT8 quantized version (94.66 ± 11.26 FPS). This result was due to the optimization of NEON floating-point instructions in the Cortex-A72 and the computational burden associated with de-quantization in the absence of a dedicated Neural Processing Unit (NPU). Such hardware constraints notwithstanding, all inference times were markedly below 11 ms, and the negligible standard deviations visible here correspond to the stability achieved in the training phase, allowing the model to represent a practical, real-time solution for cost-effective, CPU-only devices.
- GPU-Based Inference (NVIDIA Jetson Nano)
Jetson Nano combined GPU acceleration and TensorRT optimization, which greatly increased the throughput. YOLO11_Opt peaked at 338.5 ± 92.7 FPS in FP16 and 325.7 ± 46.2 FPS in FP32, with only an average latency of 2.5 ± 0.7 ms, a noticeable performance improvement over the baseline YOLO11n, which achieved around 142 FPS. Moreover, the model remained very stable in the INT8 format with precision exceeding the competitive range (>88%). Close to zero jitter in inferencing on multiple tests demonstrated the deterministic potential of the optimized model with GPU hardware.
- Synthesis and Scalability
These performance verifications demonstrate YOLO11_Opt’s ability to scale quite well across different architectures. The small variance across many runs means that the observed trends in this area are statistically significant and not transitory figures. Deployed on a restricted CPU-based or fully leveraging edge GPU acceleration, this extensible approach offers a high-performance framework for smart agricultural monitoring in real-time contexts.
The FPS and latency metrics represent the peak computation throughput, i.e., pre-processing, model inference, and model post-processing (Non-Maximum Suppression/NMS), excluding hardware-dependent camera I/O latency. Although the precision and recall of “healthy” samples differed from those of “bacterial” samples due to differences within classes, the FPS stayed almost constant. This is because the basic inference takes a fixed and deterministic count of operations on each image. The modest changes in speed result only from the NMS process and vary slightly with the number of candidate detections. This performance overhead confirms the model’s capacity to handle multiple camera streams or operate with high energy efficiency in real-time deployment.
6.3. Live Classification Validation
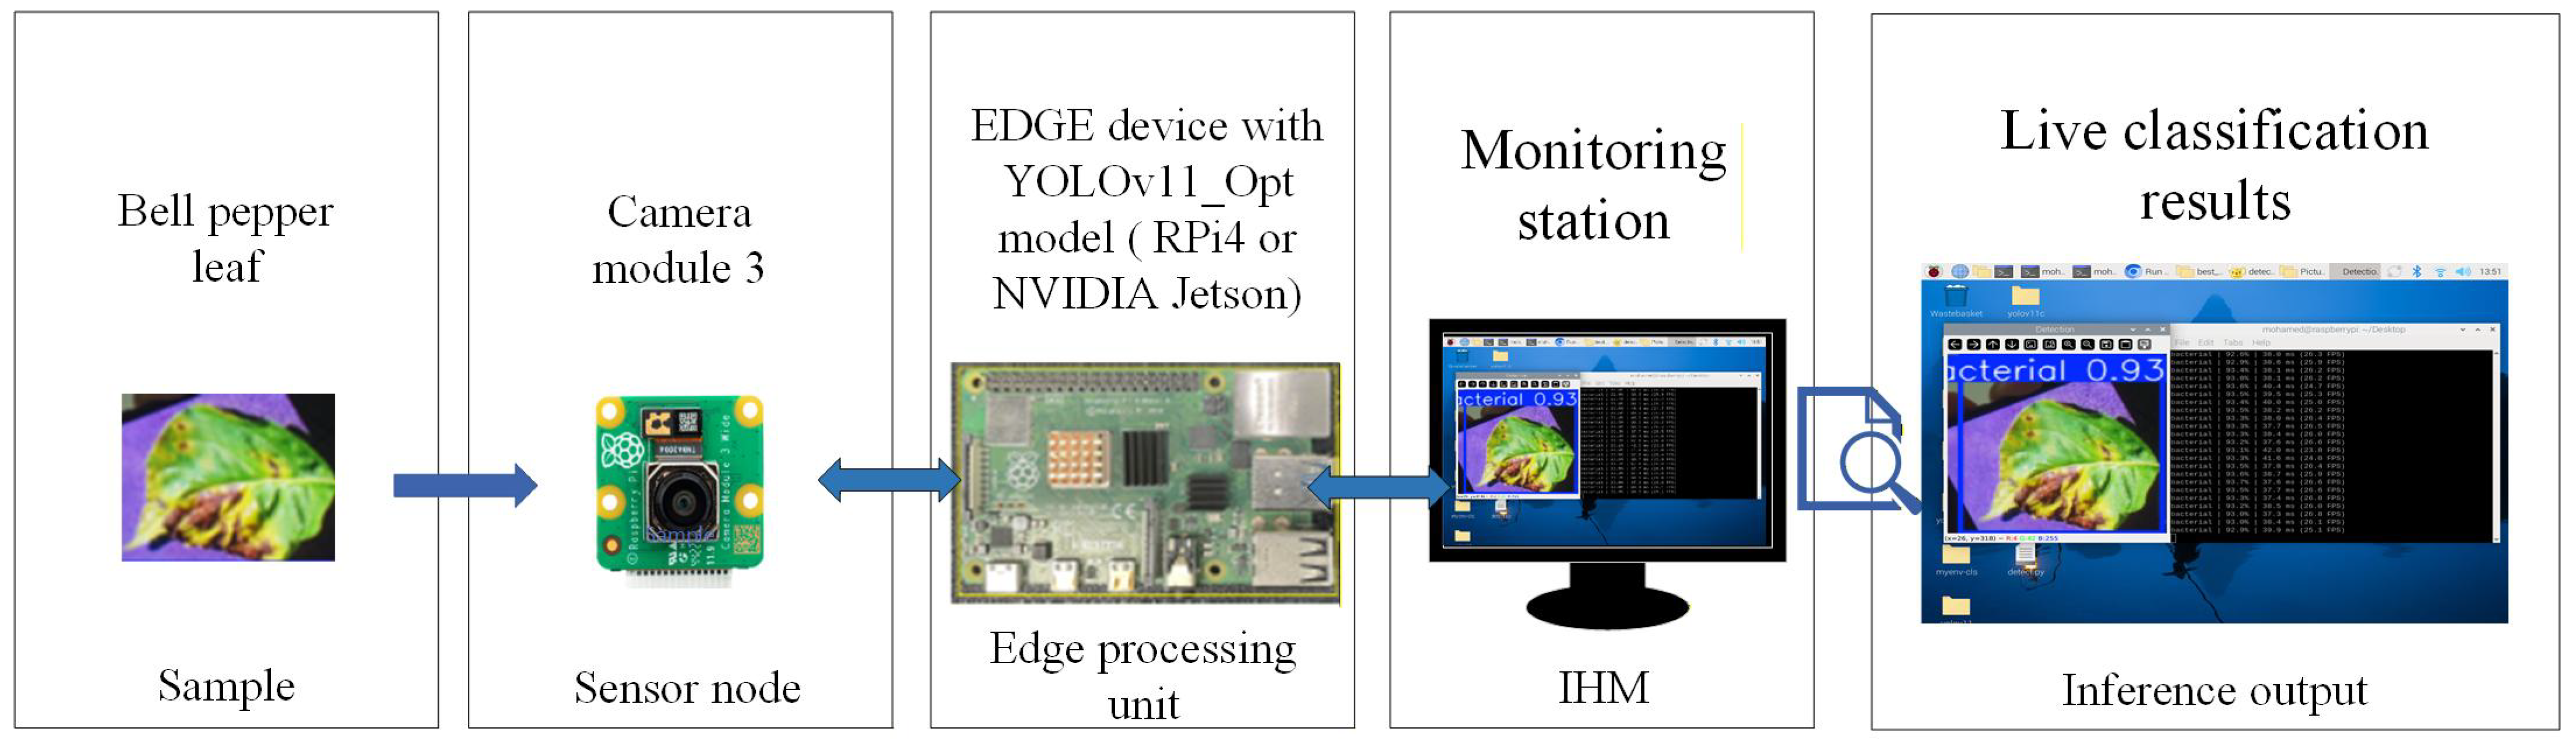
These live classification experiments test the model in real-time operational application, verify practical applicability, and ensure its robustness. This is critical to ensure that the theoretical work in the validation is relevant in real time to the actual area, correctly diagnosing the diseases, which is key to good crop management. System Workflow: The full end-to-end processing pipeline employed in this study is shown in Figure 8. The first step is the Sensor Node, in which the Raspberry Pi Camera Module 3 takes high-resolution pictures of the leaf samples. This raw data is fed into the Edge Processing Unit (either Raspberry Pi 4 or NVIDIA Jetson Nano) where the inference can be generated by the YOLO11_Opt model. After that, the captured data, such as bounding boxes, class labels, and confidence ratings, is displayed in the Monitoring Station (IHM), allowing the user immediate feedback.
Figure 8.
End-to-end processing pipeline of our experiments.
6.3.1. Raspberry Pi 4 Results (CPU Inference)
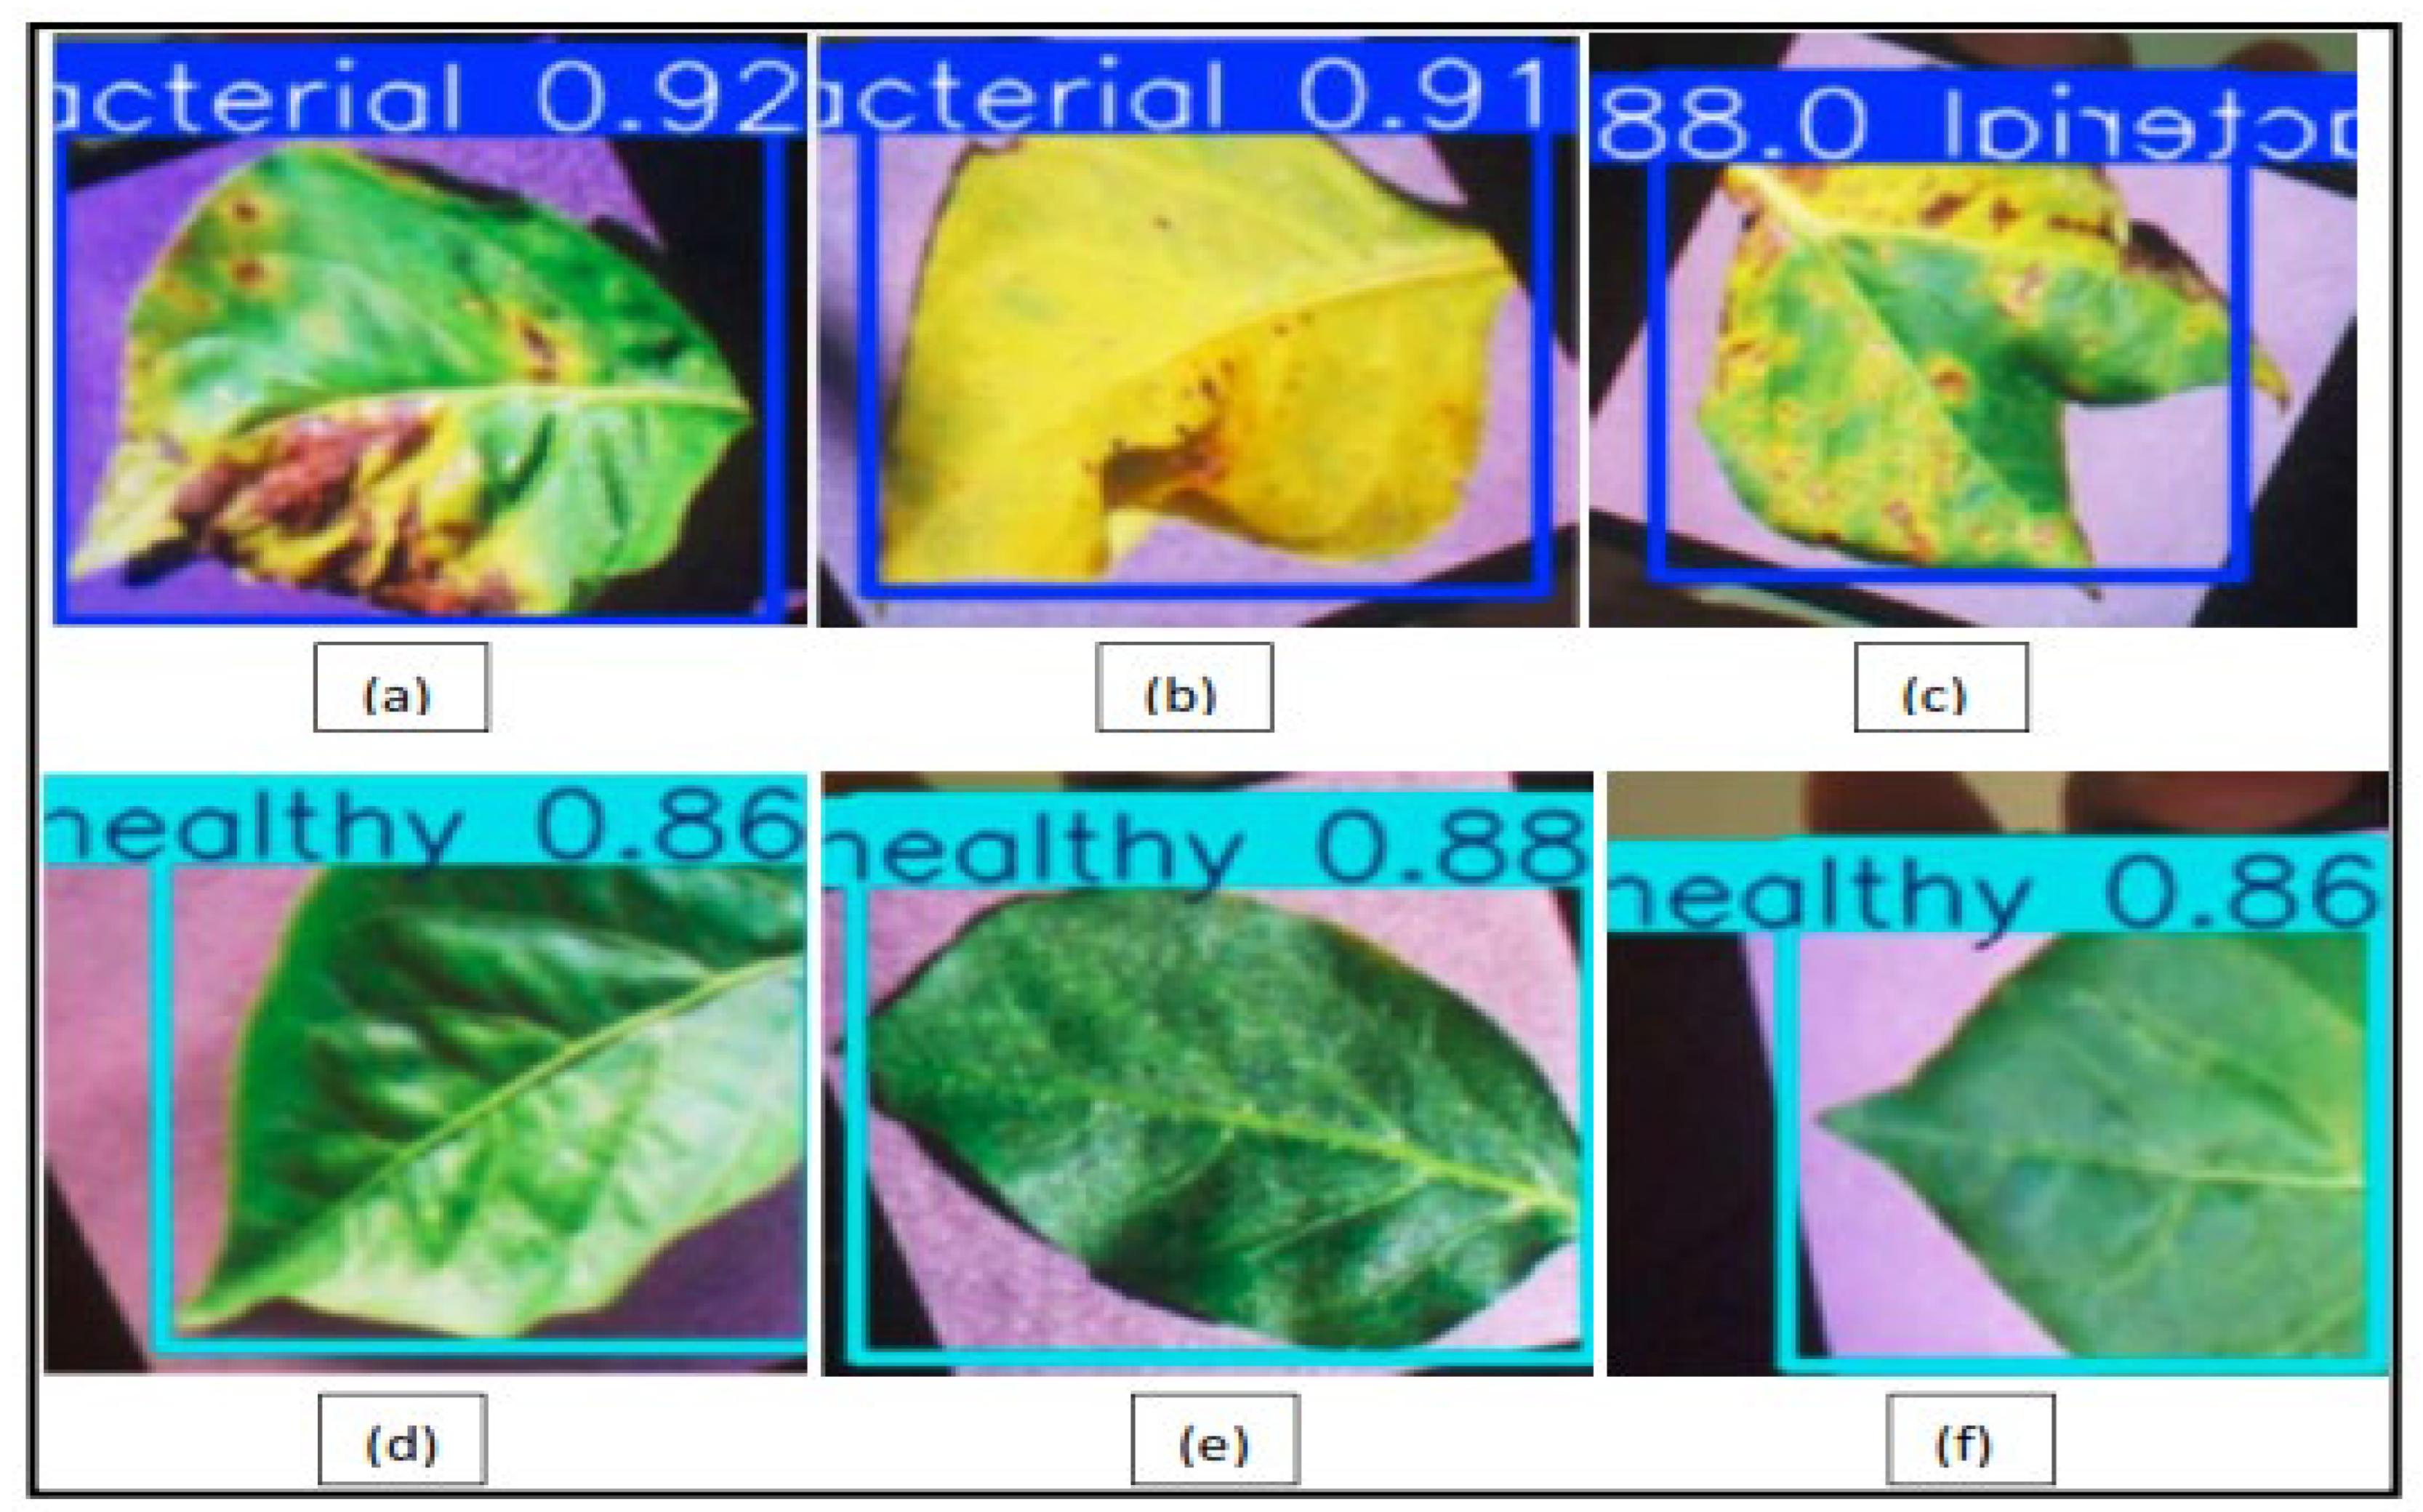
Figure 9 shows representative detection data on Raspberry Pi 4 for the three selected quantization methods, FP32, FP16, and INT8.
Figure 9.
Image classification using RPi4 (a) for bacterial FP32, (b) for bacterial FP16, (c) for bacterial INT8, (d) for healthy FP32, (e) for healthy FP16, and (f) for healthy INT8.
- FP32 (baseline): The model has a confidence score of 0.92 for “bacterial spot” and 0.86 for “healthy”.
- FP16: The detection is consistent with the confidence scores obtained for bacterial samples: 0.91, and healthy samples: 0.88.
- INT8: Similar to integer quantization, the model exhibits robust detection ability, delivering 0.88 (bacterial) and 0.86 (healthy) scores. Such results confirm that quantization on the CPU provides the lowest degradation of detection confidence scores and the best performance in memory usage.
6.3.2. NVIDIA Jetson Nano Results (GPU Inference)
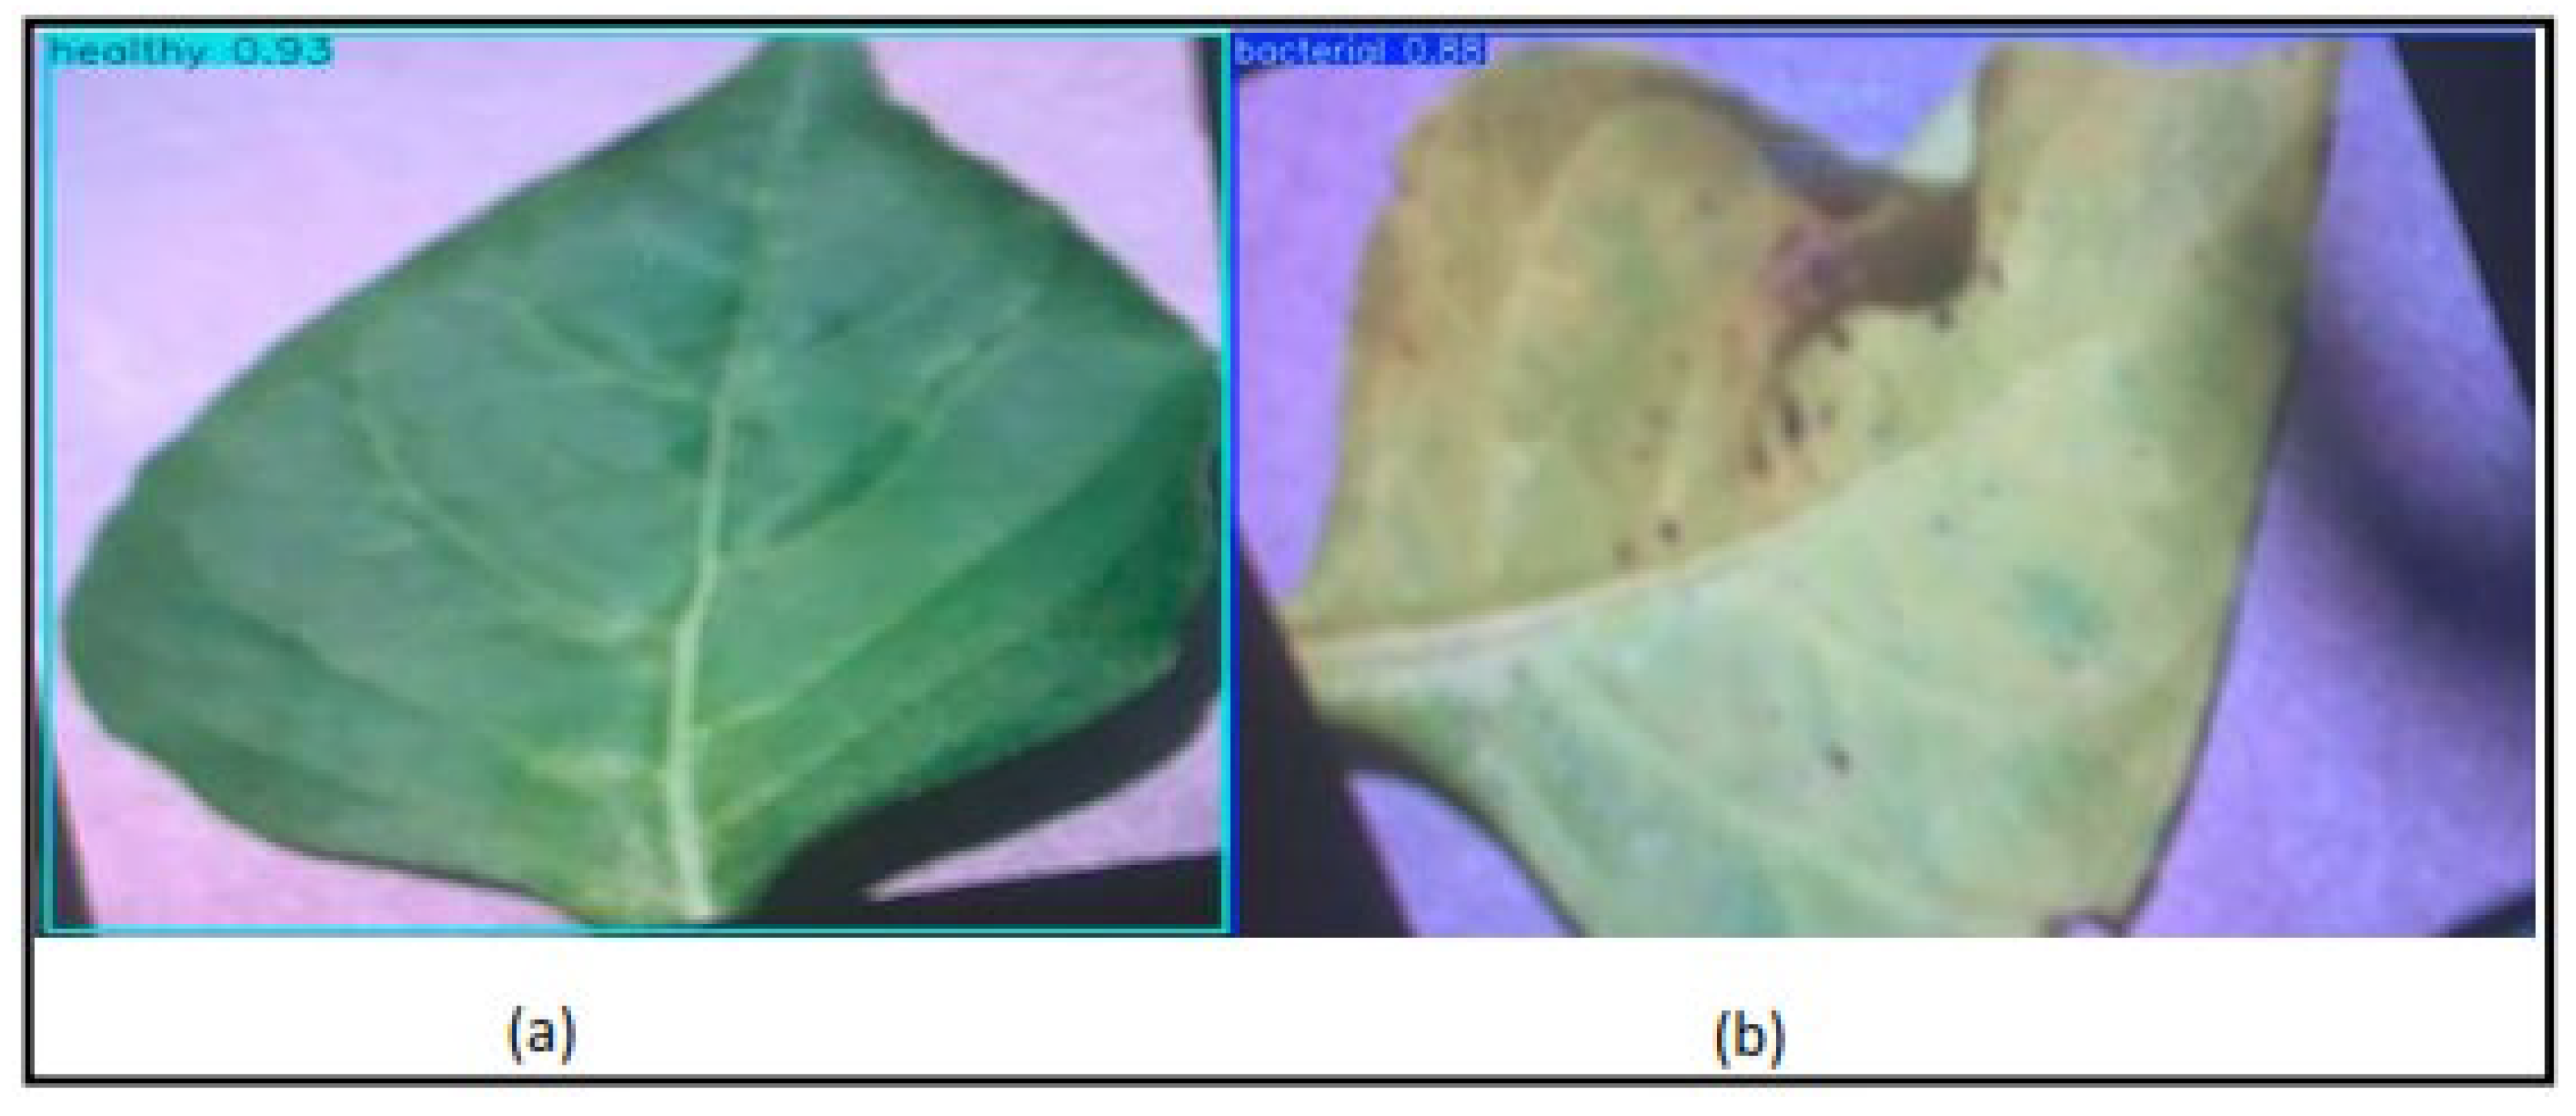
The assessment was solely of the INT8 format for NVIDIA Jetson Nano (Figure 10). This setup, of course, was selected for the high hardware acceleration of the Maxwell GPU through TensorRT. In edge AI deployment, INT8 is an industry standard resulting in the smallest latency and memory footprint while maximizing throughput. Despite its lower precision values, the YOLO11_Opt model managed to produce strong classification outcomes:
Figure 10.
Image classification using NVIDIA Jetson Nano. (a) Healthy 0.93, (b) Bacterial 0.88.
- Healthy class: Detected with a confidence score of 0.93.
- Bacterial class: Detected with a confidence score of 0.88.
These observations suggest that INT8 quantization offers a good trade-off between computational cost and accuracy. Indeed, the model’s predicted classes of pathological and physiological states were also recognized with high confidence scores, which proves YOLO11_Opt is a good value solution in resource-limited smart agriculture cases.
7. Conclusions
The main objective of this work was to develop and validate a cost-effective autonomous plant disease detection tool based on computer vision and embedded artificial intelligence. This system is expected to replace or strengthen conventional manual inspection methods for small- and medium-sized farms and empower small and medium farms with available crop protection tools. Consequently, we developed YOLO11_Opt, a novel, ultra-lightweight YOLO11-type architecture adapted for use on resource-constrained edge devices such as the Raspberry Pi 4 and NVIDIA Jetson Nano.
7.1. Overall Contributions and Results
Our analysis fully confirmed the technical and functional practicality of the solution. Extreme architectural scaling (0.20 minimum depth, 0.20 minimum width) and structural simplifying of the neck, which drastically reduce the computation cost of YOLO11_Opt, led to our conclusion. More specifically, the number of parameters decreased by 87% (reducing the parameter count from 2.58 million to 0.33 million) and the number of operations decreased by 92% (reducing the model complexity from 6.3 to 0.5 GFLOPS) versus the baseline YOLO11n. Despite this drastic compression, the model retained excellent detection capabilities, achieving a Mean Average Precision (mAP@0.5:0.95) of 0.913 and a precision of 0.991. Moreover, the real-time application deployment tests validated the appropriateness of the system: inference latencies as low as 8.3 ms (approx. 120 FPS) were observed on Raspberry Pi 4 and 1.9 ms (approx. +526 FPS), demonstrating that effective phytosanitary monitoring on low-end hardware is not dependent on cloud infrastructure.
7.2. Limitations
This study has some limitations. First, it was primarily based on a design validation using the PlantVillage dataset, although this dataset contains images acquired in controlled laboratories. Therefore, we expect some of the model’s robustness to decrease as we encounter the highly variable nature of open-field habitats (dynamic lighting, occlusions, and various backgrounds), which appear as the background confusion in our failure analysis. Second, although CPU inference on Raspberry Pi 4 is possible, it can be limited within the hardware for high-resolution streams and may be more complicated for the scalable application within multi-camera configurations.
7.3. Future Work
These challenges will be pursued in future research to increase the statistical robustness and generalizability of the solution. Key directions include the following:
- Expansion of training data: Encompassing “in-the-wild” field images to enhance the model’s generalized performance in the context of diverse images.
- Hardware acceleration: Exploring the possibility of adding dedicated Neural Processing Units (NPUs) or migrating to next-generation platforms such as Raspberry Pi 5 for additional efficiency and speed.
- Multi-crop generalization: The YOLO11_Opt architecture can be extended for the detection of diseases among a wider variety of crop species at once to move toward a universal diagnostic tool for smart farming.
- Real-world deployment: Future research will focus on evaluating the YOLO11_Opt architecture using diverse, field-captured datasets to assess its robustness under varying illumination and complex environmental backgrounds, building upon the optimization foundation established in this study.
Author Contributions
Conceptualization, Y.M.; methodology, Y.M., A.E. and A.K.; software, Y.M. and A.K.; validation, Y.M., A.K. and N.E.O.; formal analysis, Y.M. and M.E.M.; investigation, Y.M.; resources, Y.M. and A.K.; data curation, A.E., H.N.; writing—original draft preparation, Y.M. and A.K.; writing—review and editing, Y.M., A.K., A.E. and N.E.O.; visualization, Y.M., A.K. and N.E.O.; supervision, Y.M. and N.E.O.; project administration, Y.M.; funding acquisition, Y.M., A.K. and N.E.O. All authors have read and agreed to the published version of the manuscript.
Funding
This research received no external funding. The APC was not funded by any external source.
Institutional Review Board Statement
Not applicable.
Informed Consent Statement
Not applicable.
Data Availability Statement
Publicly available datasets were analyzed in this study. This data can be found here: https://github.com/spMohanty/PlantVillage-Dataset (accessed on 6 March 2026). The original contributions presented in the study are included in the article. Further inquiries can be directed to the corresponding authors.
Acknowledgments
During the preparation of this manuscript, the author used generative AI tools for language editing, including grammar, spelling, and sentence structure improvements. The author takes full responsibility for the content of the publication.
Conflicts of Interest
The authors declare no conflict of interest.
References
- Ye, K.; Hu, G.; Tong, Z.; Xu, Y.; Zheng, J. Key intelligent pesticide prescription spraying technologies for the control of pests, diseases, and weeds: A review. Agriculture 2025, 15, 81. [Google Scholar] [CrossRef] [Scilit]
- Mohanty, S.; Hughes, D.; Salathé, M. Using Deep Learning for Image-Based Plant Disease Detection. Front. Plant Sci. 2016, 10, 1419. [Google Scholar] [CrossRef] [Scilit] [PubMed]
- Singh, P.; Verma, A.; Sahaya Rani Alex, J. Disease and pest infection detection in coconut tree through deep learning techniques. Comput. Electron. Agric. 2021, 182, 105986. [Google Scholar] [CrossRef] [Scilit]
- Ultralytics. YOLO11 Release Notes. 2024. Available online: https://docs.ultralytics.com/ (accessed on 12 November 2025).
- Terven, A.D.; Cordova-Esparza, N.H.; Romero-González, J.-A. A Comprehensive Review of YOLO Architectures in Computer Vision: From YOLOv1 to YOLOv8 and YOLO-NAS. Mach. Learn. Knowl. Extr. 2023, 5, 1680–1716. [Google Scholar] [CrossRef] [Scilit]
- Kamilaris, A.; Prenafeta-Boldú, F.X. Deep learning in agriculture: A survey. Comput. Electron. Agric. 2018, 147, 70–90. [Google Scholar] [CrossRef] [Scilit]
- Too, E.C.; Yujian, L.; Njuki, S.; Yingchun, L. A comparative study of fine-tuning deep learning models for plant disease identification. Comput. Electron. Agric. 2019, 161, 272–279. [Google Scholar] [CrossRef] [Scilit]
- Mathew, M.P.; Mahesh, T.Y. Leaf-based disease detection in bell pepper plant using YOLO v5. Signal Image Video Process. 2022, 16, 841–847. [Google Scholar] [CrossRef] [Scilit]
- Chen, Z.; Wu, R.; Lin, Y.; Li, C.; Chen, S.; Yuan, Z.; Chen, S.; Zou, X. Plant Disease Recognition Model Based on Improved YOLOv5. Agronomy 2022, 12, 365. [Google Scholar] [CrossRef] [Scilit]
- O’Grady, M.J.; Langton, D.; O’Hare, G.M. Edge computing: A tractable model for smart agriculture? Artif. Intell. Agric. 2019, 3, 42–50. [Google Scholar] [CrossRef] [Scilit]
- Ji, W.; Pan, Y.; Xu, B.; Wang, J. A Real-Time Apple Targets Detection Method for Picking Robot Based on ShufflenetV2-YOLOX. Agriculture 2022, 12, 856. [Google Scholar] [CrossRef] [Scilit]
- Wang, H.; Shang, S.; Wang, D.; He, X.; Feng, K.; Zhu, H. Plant Disease Detection and Classification Method Based on the Optimized Lightweight YOLOv5 Model. Agriculture 2022, 12, 931. [Google Scholar] [CrossRef] [Scilit]
- Xu, W.; Wang, R. ALAD-YOLO: An lightweight and accurate detector for apple leaf disease. Front. Plant Sci. 2023, 14, 1204569. [Google Scholar]
- Wang, Y.; Wang, Y.; Zhao, J. MGA-YOLO: A lightweight one-stage network for apple leaf disease diagnosis. Front. Plant Sci. 2022, 13, 927424. [Google Scholar]
- Nnadozie, E.C.; Casaseca-De-La-Higuera, P.; Iloanusi, O.; Ani, O.; Alberola-López, C. Simplifying YOLOv5 for deployment in a real crop monitoring setting. Multimed. Tools Appl. 2023, 83, 50197–50223. [Google Scholar] [CrossRef] [Scilit]
- Xie, Z.; Li, C.; Yang, Z.; Zhang, Z.; Jiang, J.; Guo, H. YOLOv5s-BiPCNeXt, a Lightweight Model for Detecting Disease in Eggplant Leaves. Plants 2024, 13, 2303. [Google Scholar] [CrossRef] [Scilit] [PubMed]
- Ye, W.; Jiang, F.; Li, Z.; Zhao, L.; Wang, J.; Wang, H. A Study on Real-Time Detection of Rice Diseases in in Farmlands Based on Multidimensional Data Fusion. Plant Dis. 2025. [Google Scholar] [CrossRef] [Scilit]
- Ahmad, B.; Noon, S.K.; Ahmad, T.; Mannan, A.; Khan, N.I.; Ismail, M.; Awan, T. Efficient Real-Time Detection of Plant Leaf Diseases Using YOLOv8 and Raspberry Pi. VFAST Trans. Softw. Eng. 2024, 12, 250–259. [Google Scholar] [CrossRef] [Scilit]
- Li, D.; Ahmed, F.; Wu, N.; Sethi, A.I. YOLO-JD: A Deep Learning Network for Jute Diseases and Pests Detection from Images. Plants 2022, 11, 937. [Google Scholar] [CrossRef] [Scilit]
- Liu, Z.; Zhong, X.; Wang, C.; Wu, G.; He, F.; Wang, J.; Yang, D. Rapid and accurate detection of peanut pod appearance quality based on lightweight and improved YOLOv5_SSE model. Front. Plant Sci. 2025, 16, 1494688. [Google Scholar] [CrossRef] [Scilit]
- Zhang, Z.; Yang, Y.; Xu, X.; Liu, L.; Yue, J.; Ding, R.; Lu, Y.; Liu, J.; Qiao, H. GVC-YOLO: A Lightweight Real-Time Detection Method for Cotton Aphid-Damaged Leaves Based on Edge Computing. Remote Sens. 2024, 16, 3046. [Google Scholar] [CrossRef] [Scilit]
- Tang, X.; Sun, Z.; Yang, L.; Chen, Q.; Liu, Z.; Wang, P.; Zhang, Y. YOLO11-AIU: A lightweight detection model for the grading detection of early blight disease in tomatoes. Plant Methods 2025, 21, 1435. [Google Scholar] [CrossRef] [Scilit]
- Teng, H.; Wang, Y.; Li, W.; Chen, T.; Liu, Q. Advancing Rice Disease Detection in Farmland with YOLO11 RD. Sensors 2025, 25, 3056. [Google Scholar] [CrossRef] [Scilit]
- Zhang, X.; Wei, L.; Yang, R. TriPerceptNet and EDGE-MSE-YOLO11: Enhanced Multi-Scale Perception for Rice Leaf Disease Detection. Front. Plant Sci. 2025, 16, 1614929. [Google Scholar] [CrossRef] [Scilit]
- Hu, F.; Abula, M.; Wang, D.; Li, X.; Yan, N.; Xie, Q.; Zhang, X. ACURS-YOLO: Attention-Enhanced Cotton Leaf Disease Detection Model Based on YOLO11. Sensors 2025, 25, 4432. [Google Scholar] [CrossRef] [Scilit]
- Al Husaini, M.; Rachmat Raharja, A.; Cahaya Putra, V.H.; Lukmana, H. Enhanced Plant Disease Detection Using YOLO11: Pre-Trained Neural Network Application. J. Comput. Netw. Archit. High Perform. Comput. 2025, 7, 82–95. [Google Scholar] [CrossRef] [Scilit]
- Fang, K.; Zhou, R.; Deng, N.; Li, C.; Zhu, X. RLDD-YOLO11n: Lightweight Rice Leaf Disease Detection Based on YOLOv11. Agronomy 2025, 15, 1266. [Google Scholar] [CrossRef] [Scilit]
- Ali, M.L.; Zhang, Z. The YOLO Framework: A Comprehensive Review of Evolution, Applications, and Benchmarks in Object Detection. Computers 2024, 13, 336. [Google Scholar] [CrossRef] [Scilit]
- He, L.; Zhou, Y.; Liu, L.; Ma, J. Research and Application of YOLO11-Based Object Segmentation in Intelligent Recognition at Construction Sites. Buildings 2024, 14, 3777. [Google Scholar] [CrossRef] [Scilit]
- Wang, J.; Zhang, L.; Liu, H. YOLO-WAS: A Lightweight Apple Target Detection Method Based on Improved YOLO11. Agriculture 2025, 15, 1521. [Google Scholar] [CrossRef] [Scilit]
- Li, G. LCW-YOLO: A Lightweight Multi-Scale Object Detection Method Based on YOLOv11 and Its Performance Evaluation in Complex Natural Scenes. Sensors 2025, 25, 6209. [Google Scholar] [CrossRef] [Scilit] [PubMed]
- Li, B.; Yu, L.; Zhu, H.; Tan, Z. YOLO-FDLU: A Lightweight Improved YOLO11s-Based Algorithm for Accurate Maize Pest and Disease Detection. AgriEngineering 2025, 15, 323. [Google Scholar] [CrossRef] [Scilit]
- He, L.H.; Zhou, Y.Z.; Liu, L.; Cao, W.; Ma, J.H. Research on object detection and recognition in remote sensing images based on YOLO11. Sci. Rep. 2025, 15, 14032. [Google Scholar] [CrossRef] [Scilit]
- Faust, J.; Hanelt, P.H.P.; Bhat, S.A. PlantVillage Dataset: A Dataset of 5539 Training and Validation Images for 26 Crop Species. 2016. Available online: https://www.plantvillage.org/ (accessed on 20 October 2024).
- Okano, M.T.; Lopes, W.A.C.; Ruggero, S.M.; Vendrametto, O.; Fernandes, J.C.L. Edge AI for Industrial Visual Inspection: YOLOv8-Based Visual Conformity Detection Using Raspberry Pi. Algorithms 2025, 18, 510. [Google Scholar] [CrossRef] [Scilit]
- Powers, D.M. Evaluation: From precision, recall and F-measure to ROC, informedness, markedness and correlation. arXiv 2020, arXiv:2010.16061. [Google Scholar] [CrossRef] [Scilit]
- Wang, Y.; Yang, X.; Wang, H.; Wang, H.; Chen, Z.; Yun, L. RSWD-YOLO: A Walnut Detection Method Based on UAV Remote Sensing Images. Horticulturae 2025, 11, 419. [Google Scholar] [CrossRef] [Scilit]
- Mu, D.; Guou, Y.; Wang, W.; Peng, R.; Guo, C.; Marinello, F.; Xie, Y.; Huang, Q. URT-YOLO11: A Large Receptive Field Algorithm for Detecting Tomato Ripening Under Different Field Conditions. Agriculture 2025, 15, 1060. [Google Scholar] [CrossRef] [Scilit]
- Dey, A.; Srivastava, S.; Singh, G.; Pettit, R.G. Real-Time Performance Benchmarking of TinyML Models in Embedded Systems (PICO: Performance of Inference, CPU, and Operations). In Proceedings of the 2025 28th International Symposium on Real-Time Distributed Computing (ISORC), Toulouse, France, 26–28 May 2025; IEEE: New York, NY, USA, 2005. [Google Scholar]
- Piovesan, D.; Maciel, J.N.; Zalewski, W.; Ledesma, J.J.G.; Cavallari, M.R.; Junior, O.H.A. Edge Computing: Performance Assessment in the Hybrid Prediction Method on a Low-Cost Raspberry Pi Platform. Eng 2025, 6, 255. [Google Scholar] [CrossRef] [Scilit]
- NVIDIA. Jetson Nano—Technical Specifications and Edge AI Platform Overview; NVIDIA Corp.: St. Clara, CA, USA, 2019. [Google Scholar]
- Swaminathan, T.P.; Silver, C.; Akilan, T. Benchmarking Deep Learning Models on NVIDIA Jetson Nano for Real-Time Systems: An Empirical Investigation. Procedia Comput. Sci. 2025, 260, 906–913. [Google Scholar] [CrossRef] [Scilit]
- Sarıyer, R.M.; Edwards, A.D.; Needs, S.H. Open Hardware for Microfluidics: Exploiting Raspberry Pi Singleboard Computer and Camera Systems for Customisable Laboratory Instrumentation. Biosensors 2023, 13, 948. [Google Scholar] [CrossRef] [Scilit]
Disclaimer/Publisher’s Note: The statements, opinions and data contained in all publications are solely those of the individual author(s) and contributor(s) and not of MDPI and/or the editor(s). MDPI and/or the editor(s) disclaim responsibility for any injury to people or property resulting from any ideas, methods, instructions or products referred to in the content. |
© 2026 by the authors. Licensee MDPI, Basel, Switzerland. This article is an open access article distributed under the terms and conditions of the Creative Commons Attribution (CC BY) license.