Article

Automated IoT-Based Monitoring of Industrial Hemp in Greenhouses Using Open-Source Systems and Computer Vision

by
Carmen Rocamora-Osorio
1,2,*,
Fernando Aragon-Rodriguez
1,
Ana María Codes-Alcaraz
2 and
Francisco-Javier Ferrández-Pastor
3
1
Departamento de Ingeniería, Área Ingeniería Agroforestal, Escuela Politécnica Superior de Orihuela (EPSO), Universidad Miguel Hernández, Ctra. Beniel km. 3,2, 03312 Orihuela, Spain
2
Instituto de Investigación e Innovación Agroalimentaria y Agroambiental (CIAGRO), Universidad Miguel Hernández, Ctra. Beniel km. 3,2, 03312 Orihuela, Spain
3
Grupo de Investigación Informática Industrial y Redes de Computadores (I2RC), Universidad de Alicante, 03690 Alicante, Spain
*
Author to whom correspondence should be addressed.
AgriEngineering 2025, 7(9), 272; https://doi.org/10.3390/agriengineering7090272
Submission received: 2 June 2025 / Revised: 8 August 2025 / Accepted: 12 August 2025 / Published: 22 August 2025

Abstract

Monitoring the development of greenhouse crops is essential for optimising yield and ensuring the efficient use of resources. A system for monitoring hemp (Cannabis sativa L.) cultivation under greenhouse conditions using computer vision has been developed. This system is based on open-source automation software installed on a single-board computer. It integrates various temperature and humidity sensors and surveillance cameras, automating image capture. Hemp seeds of the Tiborszallasi variety were sown. After germination, plants were transplanted into pots. Five specimens were selected for growth monitoring by image analysis. A surveillance camera was placed in front of each plant. Different approaches were applied to analyse growth during the early stages: two traditional computer vision techniques and a deep learning algorithm. An average growth rate of 2.9 cm/day was determined, corresponding to 1.43 mm/°C day. A mean MAE value of 1.36 cm was obtained, and the results of the three approaches were very similar. After the first growth stage, the plants were subjected to water stress. An algorithm successfully identified healthy and stressed plants and also detected different stress levels, with an accuracy of 97%. These results demonstrate the system’s potential to provide objective and quantitative information on plant growth and physiological status.

1. Introduction

Crop control and monitoring are crucial for optimising farm management, ensuring food security, and adapting to environmental changes. Various technologies are available to monitor crop growth, divided into remote sensing and proximity sensing. Remote sensing is a technique that uses satellites and unmanned aerial vehicles (UAVs) to obtain information from a distance, which are widely used due to their ability to provide high-resolution maps and data on crop growth. These systems allow systematic and constant monitoring of crop phenological dynamics, facilitating the detection of growth anomalies and enabling timely interventions in agricultural practices, such as irrigation and fertilisation, in order to increase yields [1,2]. These systems generate large amounts of data that must be managed and processed efficiently using information access models that serve to extract relevant knowledge for decision-making in the field of precision agriculture [3]. In proximity sensing, fixed or mobile sensors can be used, and they can be either manual or automatic. Handheld portable devices are becoming more sophisticated and more widely used. Among others, handheld devices based on hyperspectral cameras have been developed for plant phenotyping and disease detection [4], fluorescence handheld devices have been used to determine photosynthetic activity and the amount of anthocyanins [5], and portable near-infrared (NIR)-based equipment has been developed to determine the ripening and quality of fruits, forages, and legumes [6,7,8]. Although the information provided by this equipment is valuable, the measurements are punctual and based on sampling, requiring human intervention. However, the use of automatic sensors, generally fixed, allows for massive and continuous sampling over time with little or no human intervention, increasing the amount of data available. This type of sensorisation is based on the Internet of Things (IoT), which facilitates the automation of data collection, sending, transformation, and analysis, being able to monitor different parameters such as air and soil temperature and humidity, radiation, rainfall, pest and disease detection, soil pH and nutrients, etc. [9,10,11].
Computer vision is a multidisciplinary field that allows machines to interpret and understand visual information, simulating human vision. It integrates concepts from artificial intelligence; image processing, such as filtering, enhancement, and transformation; and cognitive neuroscience with the aim of extracting relevant information from visual data [12]. Such technology is increasingly being integrated into agricultural practices, significantly improving data collection and management through the Internet of Things (IoT). When combined with the IoT, machine vision systems provide non-invasive and efficient solutions for plant health and growth monitoring, crop anomaly detection, irrigation management, and agricultural yield estimation [13,14]. This technology allows for the extraction of plant morphological variables such as height, leaf area, estimated volume, or greenness index, which facilitates a better understanding of the phenological development of the crop and its physiological state [13,15]. This integration facilitates the automation of various agricultural processes, from land preparation to harvesting, using algorithms based on traditional techniques and deep learning [13,15]. In recent years, machine vision combined with IoT sensors has established itself as a key tool in precision agriculture.
The use of commercial RGB (red, green, blue) cameras, such as IP surveillance cameras or those integrated into low-cost boards (Raspberry Pi, ESP32-CAM), has gained popularity thanks to their accessibility and ease of installation. These cameras allow images to be captured at regular intervals to be processed by classical algorithms (edge detection, clustering, morphometric analysis) or algorithms based on deep learning (convolutional networks, YOLO, U-Net) [14,16]. Several studies have validated this strategy in crops such as rice, tomato, lettuce, or grapevine, demonstrating that it is possible to detect water stress or nutritional deficiencies through morphological differences or changes in leaf colouring detectable by image [17,18,19]. In these cases, images are combined with environmental data (temperature, humidity, light, substrate conductivity) to improve model accuracy and generate early warning systems.
The use of IoT technologies has brought about a major change in greenhouse management. Abiotic stresses, such as drought and water deficit, generate significant alterations at various physiological, biochemical, and gene expression levels and in the proteomic profile of numerous plant species [20]. These alterations have a direct impact on plant development, leading to a decrease in both growth rate and final yield [21,22]. In arid and semi-arid regions, water deficit represents one of the most limiting environmental factors for agricultural productivity by restricting plant growth [23]. Furthermore, water limitation interferes with photosynthetic processes, reducing the synthesis of essential compounds and, consequently, preventing the plant from expressing its maximum productive potential [23]. Water limitation also increases internal competition for water between roots and aerial organs, decreasing the availability of photoassimilates to the stem, slowing its growth, thereby reducing the overall height of the plant [24]. In response to these challenges, IoT systems use sensors to continuously monitor environmental parameters such as temperature, humidity, light intensity, and CO2 levels. These data are crucial for maintaining optimal growing conditions and are often processed and stored in cloud platforms for easy access and analysis [25,26,27,28]. These systems can automate various greenhouse functions, such as irrigation, lighting, and climate control, based on collected data. This reduces the need for manual intervention and ensures constant growing conditions [27,29,30].
The integration of the IoT with computer vision enables the development of intelligent systems that can adapt to varying environmental conditions and optimise crop productivity, allowing for more autonomous and efficient greenhouse management [31,32]. Camera-based systems are integrated into greenhouses to automate plant monitoring. These systems can track growth rates, detect stress, and manage environmental conditions to optimise plant health and productivity [33,34,35]. Algorithms such as Otsu thresholding, watershed thresholding, and YOLO v4 are used for tasks such as leaf detection, plant extraction, and growth measurement [33,36]. These systems can operate in different lighting conditions, including day and night, to provide continuous monitoring [36]. The integration of computer vision with AI, including deep learning and neural networks, improves the ability to detect and classify plant stressors, providing real-time monitoring and decision support [37].
Despite its benefits, several challenges hinder the widespread adoption of the IoT in greenhouse management. These include the high cost and accuracy of sensors, limited adoption of smart technologies in commercial agriculture, and issues related to data security and privacy. Wider adoption requires improving sensor technology and developing more cost-effective solutions [38,39].
The IoT has led to the development of various communication and automation architectures. These architectures typically involve a combination of sensors, communication protocols, and data processing systems. Communication technologies such as Wi-Fi, LoRaWAN, mobile networks (2G, 3G, 4G), ZigBee, and Bluetooth are commonly employed to facilitate data transmission between devices and central control units [40], with the most commonly used protocols being Message Queuing Telemetry (MQTT) and the HyperText Transfer Protocol (HTTP) [41]. To manage storage, processing, and visualisation, tools or platforms are used that handle the integration of data from various devices and the automation of tasks. The proliferation of open-source platforms for automation and sensor integration, such as Home Assistant, Node-RED, OpenHAB, or ThingsBoard, has enabled researchers and technicians to build complete low-cost solutions for climate management and data acquisition. Open-source systems such as Home Assistant [42,43,44] have a large and active global community that shares knowledge and offers technical support. In addition, while configuration can be carried out through YAML files, a user-friendly visual interface is also offered, allowing automations to be set up without the need for advanced programming [42,44]. These platforms can be installed on single-board computers such as Raspberry Pi [45], which stands out for its compact size, low cost, and ease of collaborative source code development using GitHub [46], a web platform that simplifies project management with Git and encourages the participation of a large community of developers. These systems can easily integrate ArduCam- or Raspberry Pi-type cameras, with very good quality, or surveillance cameras, which do not require special technical knowledge for configuration and integration and have very affordable prices.
This combination of computer vision, environmental sensors, and embedded IoT represents an opportunity to improve the productivity and sustainability of the sector, democratising access to automated analysis technologies through replicable, modular, and low-cost solutions. The aim of this work is to implement a computer vision system, integrated into an open-source domotic platform for the detailed monitoring of the growth of Cannabis sativa plants in greenhouses. The system combines the capture of images through surveillance cameras with the monitoring of environmental variables through various sensors, allowing for a detailed analysis of the development of the crop. Our system prioritises ease of implementation, cost-effectiveness, flexibility, scalability, and interoperability, aiming for widespread adoption by growers regardless of their greenhouse’s technological sophistication or existing infrastructure and preventing technological dependence. This addresses the significant gap between high-tech greenhouses utilising complex, high-cost monitoring solutions and producers who currently lack any real-time crop monitoring capabilities. This study aims to demonstrate the system’s viability for automated, real-time crop monitoring, validating its performance as an effective tool for continuous crop tracking.

2. Materials and Methods

2.1. Experimental Setting and Plant Material

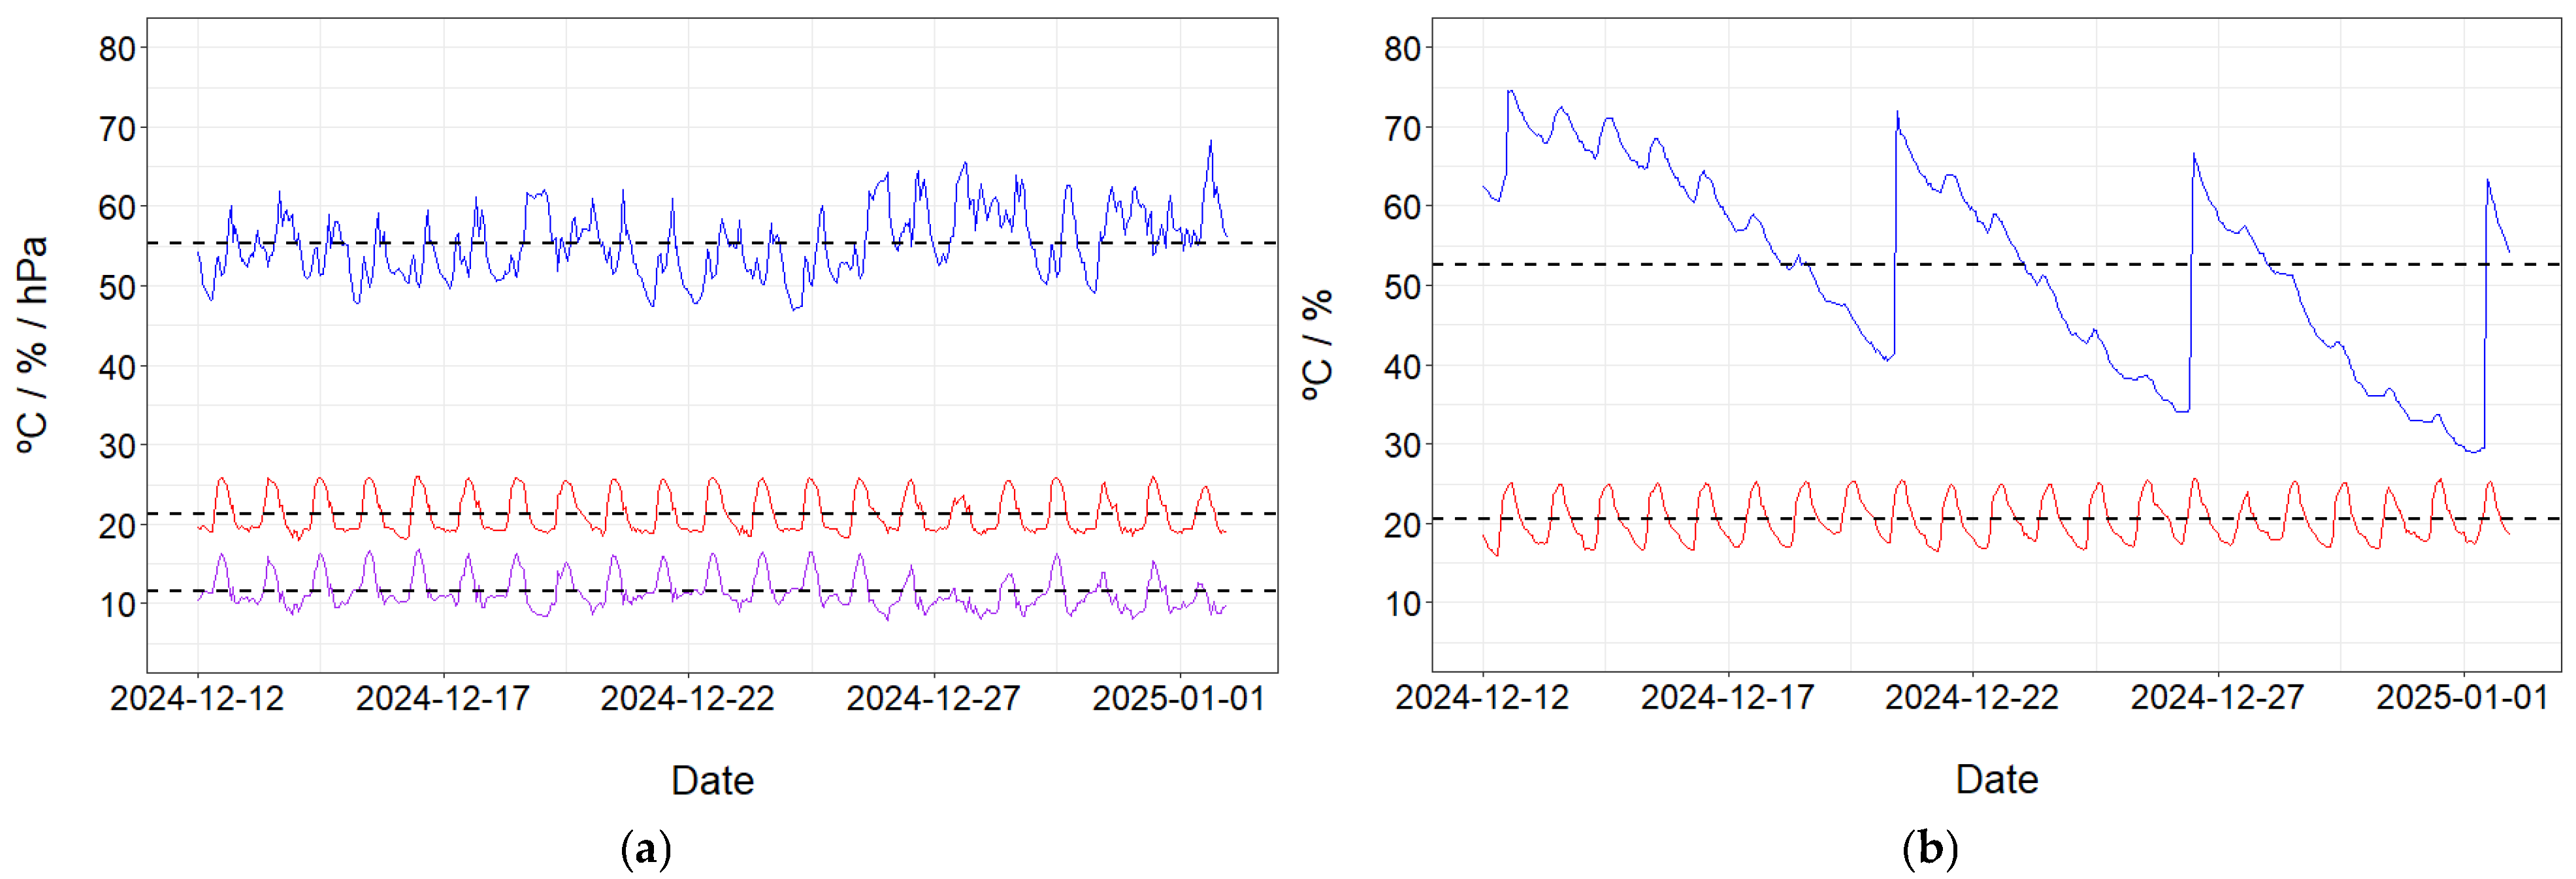
The trial was carried out in a greenhouse at the University of Alicante (38°22′47′ N 0°31′38′ W) (Figure 1). It is a glass greenhouse of 1000 m2, distributed in 8 independent modules of about 90 m2 each. It is a medium–high-tech greenhouse. The module has an automatic climate and irrigation control system. Figure 2a shows the temperature and relative humidity of the air and the vapour pressure deficit, and Figure 2b shows the average temperature and humidity of the substrate of the plants during the test. The mean values were 21.3 °C, 55.3%, and 11.5 hPa and 20.5 °C and 52.5%, respectively.
Seeds of Cannabis sativa L. cv Tiborszallasi were sown on 20 November 2024, after being submerged in water for 24 h in darkness. The process of germination was conducted within seed trays equipped with transparent lids under conditions of controlled humidity and LED lighting. The seedlings were placed inside a 2 m × 1.20 m × 1.20 m growth chamber, which was isolated from the greenhouse environment in order to maintain controlled conditions. Subsequent to the germination process, on 12 December 2024, the plants were transplanted into individual pots. The substrate was composed of a blend of blond peat, a mixture of plant material, coconut fibre, perlite, and vermiculite, and was enriched with nutrients. The irrigation dose was 2 L per week per plant, administered using the Hoagland nutrient solution. During the vegetative stage, a photoperiod of 18 h of light and 6 h of darkness was applied. The base temperature for calculating degree days was set at 1 °C, as determined by previous studies in similar conditions [47,48]. Five plants were selected for the experiment. Plant height measurements were conducted twice a week on all five plants. For each plant, height was consistently measured using a measuring tape with millimetre (mm) accuracy, from the stem’s insertion point to the highest discernible growth point of the plant’s canopy, ensuring minimal disturbance to the plant structure. The first growth phase of cannabis is crucial and has a major impact on the plant’s future development, yield, and quality [49]. Therefore, our growth study was limited to a 20-day period.

2.2. Architecture and Communications

In this study, Home Assistant (HA) version 2024.10.1 was used as a platform for sensor integration and camera automation. The HA operating system was installed on a Raspberry Pi 5 single-board computer by downloading the Raspberry Pi Imager and saving the installer on an SD card. The project’s source code was managed using GitHub. For the HA configuration, the Visual Studio Code version 5.18.4 development environment was used. HA automatically detected and configured the sensors present in the local network. InfluxDB version 5.0.1 was integrated to store the data collected by the sensors. The TP-Link® Tapo C200 and Tapo TC70 surveillance cameras described in the following section were integrated into the HA system, and the picture-taking was automated.

2.3. Image Acquisition

Plants selected for the experiment were arranged in a straight line on a cultivation table, positioned against white panels to minimise image noise. Cameras were placed directly in front of the plants (Figure 3). Cameras 1, 2, 4, and 5 were of the C200 model and camera 3 was of the TC70 model. The specifications were as follows: image sensor, 1/2.9′; lens, F/NO: 2.4; focal length, 4 mm; night vision, 850 nm IR LED (9 m); resolution, 1080p Full HD; swivel ranges, horizontal 340° and vertical 70°; horizontal coverage, 360°; and vertical coverage, 114° (TC200) and 110° (TC70).
White extruded polystyrene (XPS) panels were used for the background, with dimensions of 1000 mm × 500 mm × 10 mm. The distance from the camera lens to each of the panels was 1.3 m (Figure 3a). At this fixed position, the pixel/cm ratio was determined for each camera, after correction for lens deformation. The cameras were placed on 0.50 m high supports. The camera lenses, at 80 mm from the base, were 580 mm above the table surface (Figure 3b).
HA automation was configured to capture images of each plant at one-hour intervals. The captured images were automatically stored in a designated folder in the Raspberry Pi 5 storage system. A file naming system including date, time, and camera number was defined to facilitate the organisation and post-processing of the images.

2.4. Image Processing and Growth Assessment

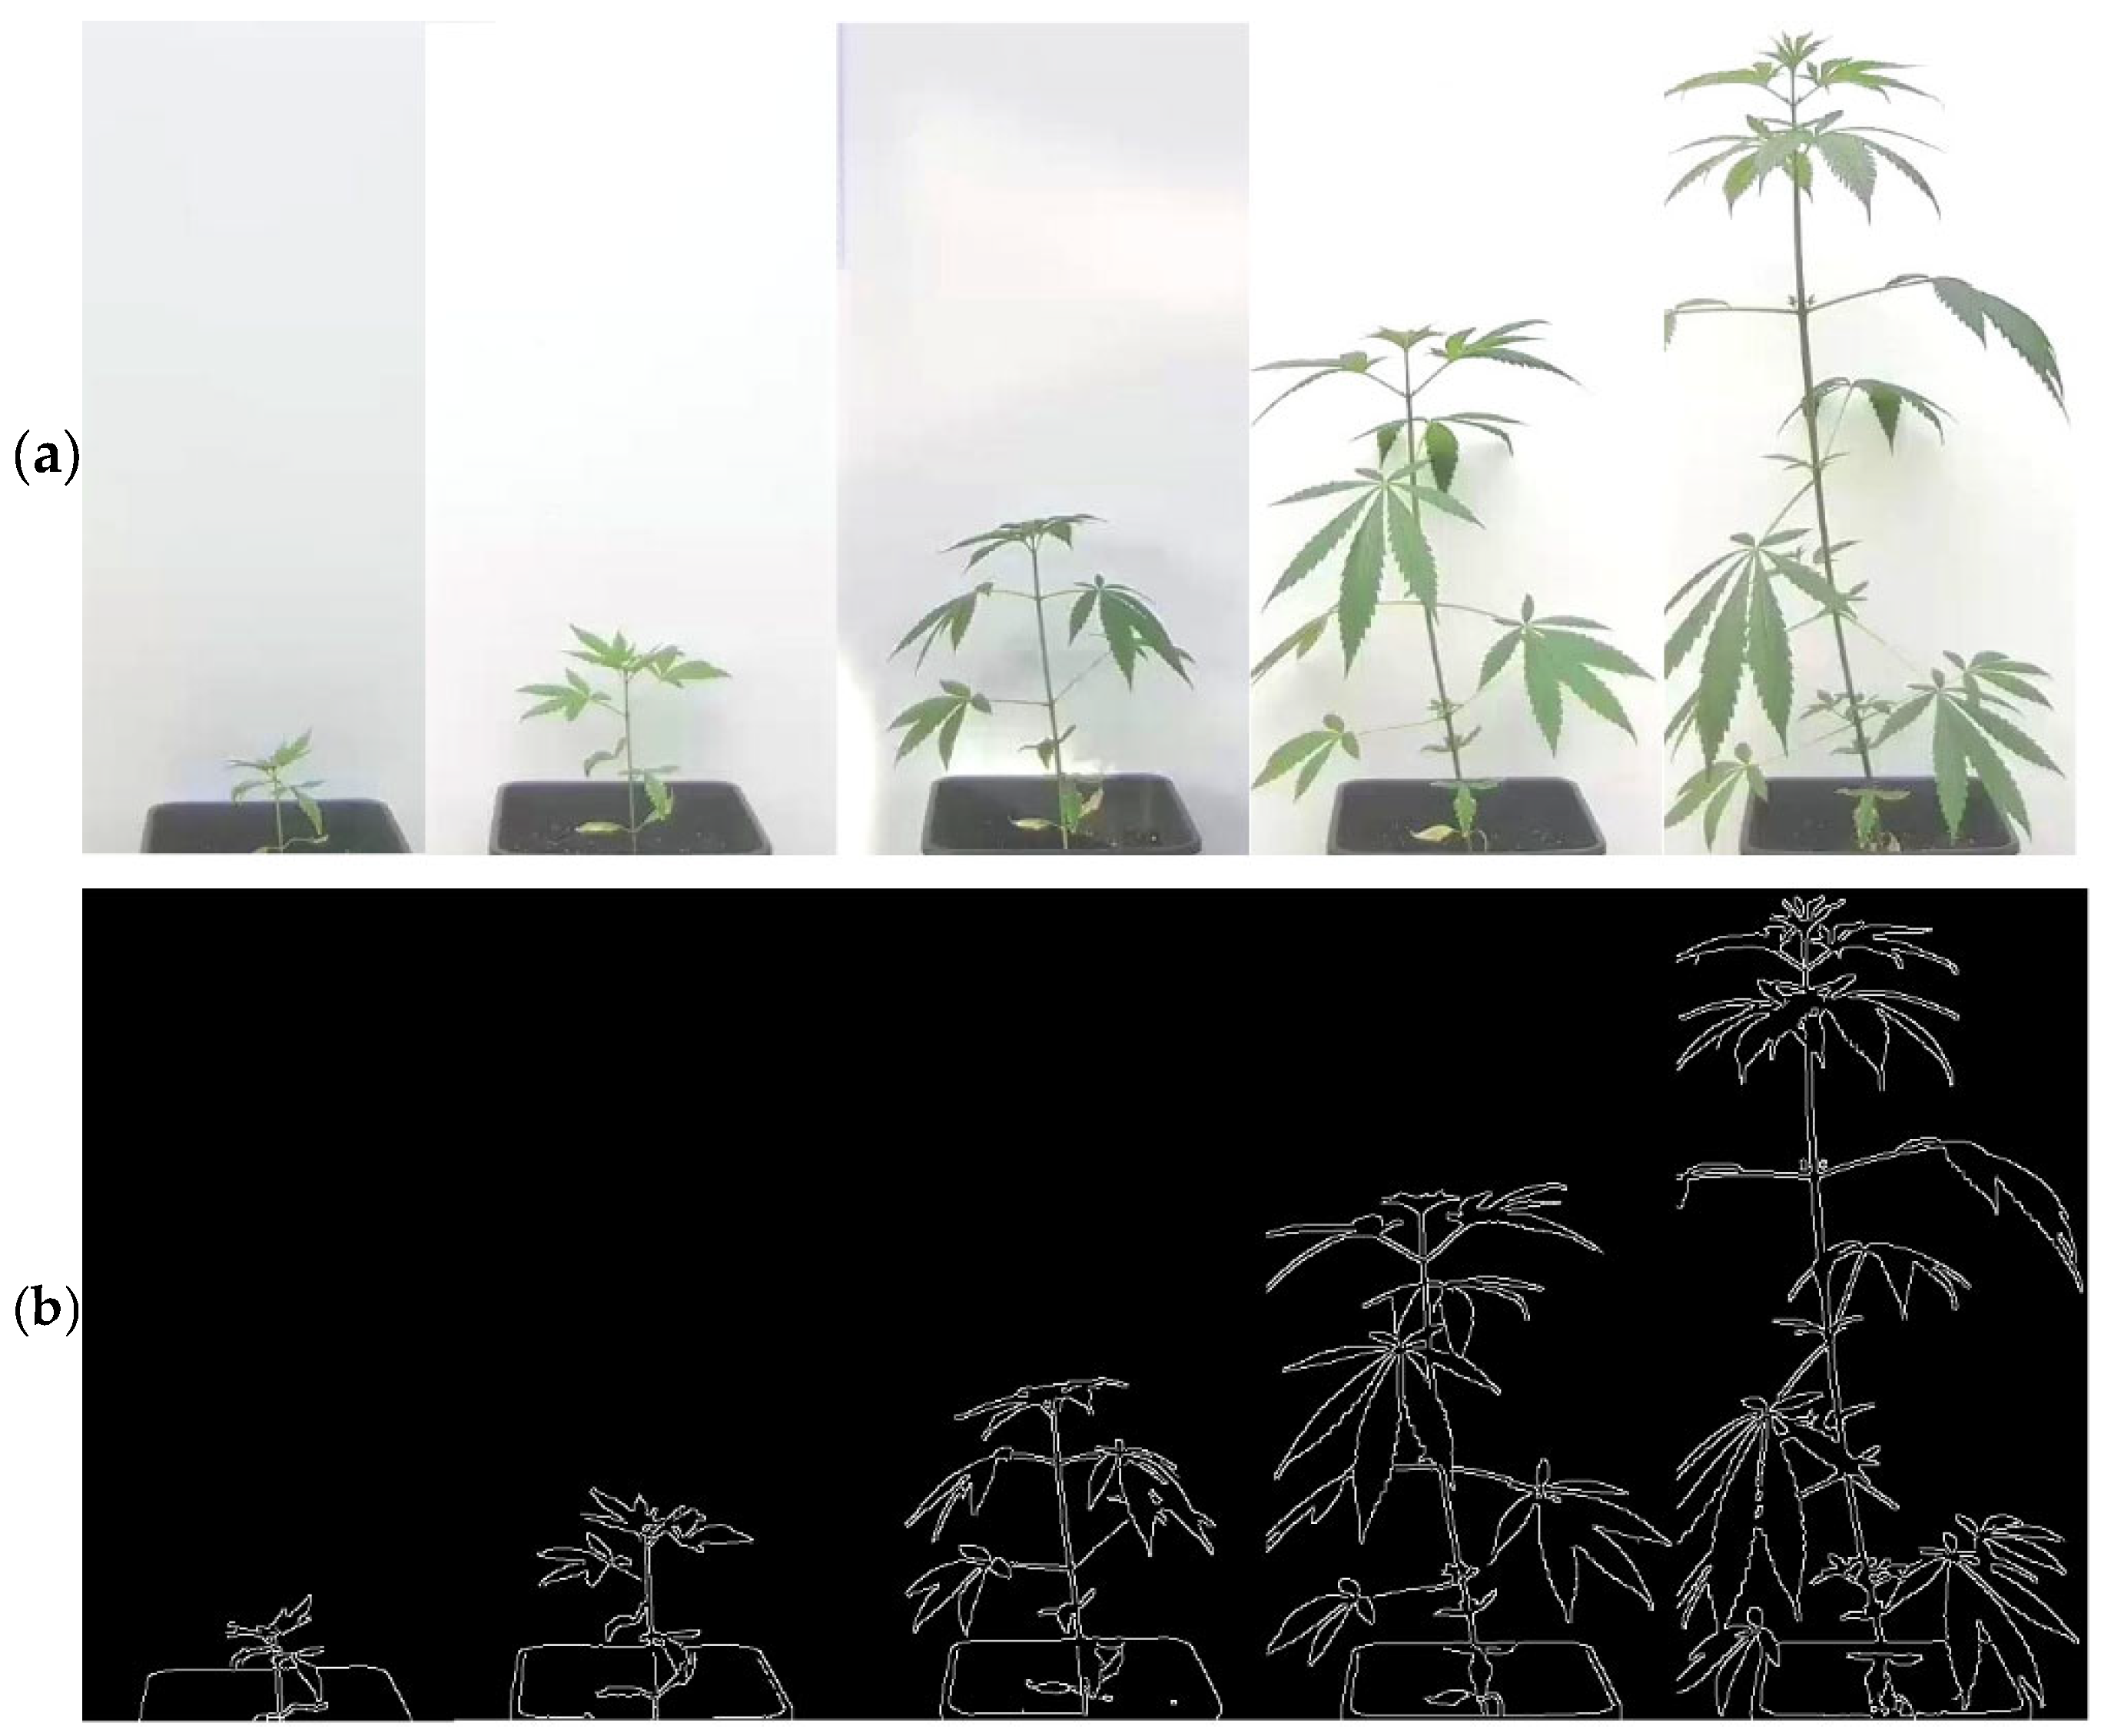
A series of procedures were carried out to process the images obtained from the cameras until the geometrical parameters of the crop were obtained. Firstly, brightness and contrast correction was carried out to standardize the histograms obtained by the various cameras, and the area of interest occupied by the plant and the panel was cropped, avoiding external objects (structures, supports, etc.). Two approaches were then taken, one using traditional computer vision techniques, in which features are manually designed and explicit algorithms are used [50,51], and the other using more modern deep learning algorithms (Figure 4). In the traditional approach, on the one hand, pre-processing was applied with a mask for the region of interest, a Gaussian filter (5 × 5 kernel) was used to smooth the image, and edge detection was carried out using the Canny algorithm [52]; to measure the height, the position of the top edge was detected and the results were saved in a csv file. On the other hand, clustering segmentation was carried out using the K-means algorithm [53] with three groups: background, pot, and plant. The plant cluster was identified based on the histogram of the red (R) and green (G) channel, and a mask was generated, segmenting the plant.
For deep learning, the multipurpose algorithm YOLO v11 was used, which can perform detection, segmentation, classification, and pose detection tasks, its architecture being a hybrid model between convolutional neural networks (CNNs) and transformers [16]. The version used was yolo11x-seg.pt. Inference was performed without training the algorithm, which was initialised with the weights of the COCO-seg dataset for the class ‘potted plant’ (class 58) [54]. Subsequently, to improve segmentation, the image was converted to HSV (Hue, Saturation, Value) colour space and filtered by the V channel values (>200), generating a binary image. As the final stage of both approaches, the geometry of the binarised plant image was analysed with the PlantCV library [55], which is based on OpenCV and commonly used in computer vision tasks.
In addition to the height, the geometric analysis of the plant yielded other parameters, including the width, the convex hull area of the plant, and plant solidity. The latter two shape parameters are defined as follows:
  • Convex hull area: Area of the smallest convex shape completely containing an object.
  • Solidity: The ratio of the plant area to the convex hull area.
The following metrics were used to compare the manually measured growth results with those obtained with the different estimation methods:
  • RMSE (Root Mean-Squared Error): This measures the root mean-squared difference between the predicted values and the real values. It is calculated according to Equation (1):
R M S E = 1 n i = 1 n y i y i ^ 2
where y i is the measured value, y i ^ is the estimated value, and n is the number of samples.
  • MAE (Mean Absolute Error): This calculates the average of the absolute errors between the actual and predicted values. It is calculated according to Equation (2):
M A E = 1 n i = 1 n y i y i ^
where y i is the measured value, y i ^ is the estimated value, and n is the number of samples.

2.5. Water Stress Assessment

Plants were subjected to water stress from 1 January 2025. To evaluate the ability of a classification model to identify the degree of water stress based on the number of days without irrigation, the YOLO11x-cls model was used. This model is designed for efficient image classification, assigning a single class label and a confidence score to the entire image. This is particularly useful in contexts where only the generic class of the image is required, without the need to locate specific objects within it. The dataset was organised into four classes corresponding to different levels of water stress: healthy plants (no stress); plants with three days without irrigation; plants with six days without irrigation; and plants with nine days without irrigation. Training and test sets were prepared for each class with the following distributions (approx. 80% for training and 20% for testing):
  • 81 images of healthy plants for training and 20 for testing;
  • 90 images corresponding to 3 days of stress for training and 20 images for testing;
  • 70 images with 6 days of stress for training and 17 for testing;
  • 64 images of plants with 9 days of stress for training and 16 for testing.
For the interpretability of the results obtained from the YOLO11x-cls prediction, the Grad-CAM algorithm was employed. This algorithm uses the gradients of the class in the final layer of a convolutional neural network (CNN) to generate a heatmap indicating the areas that have the greatest influence on the prediction [56].

3. Results and Discussion

3.1. Growth Determination

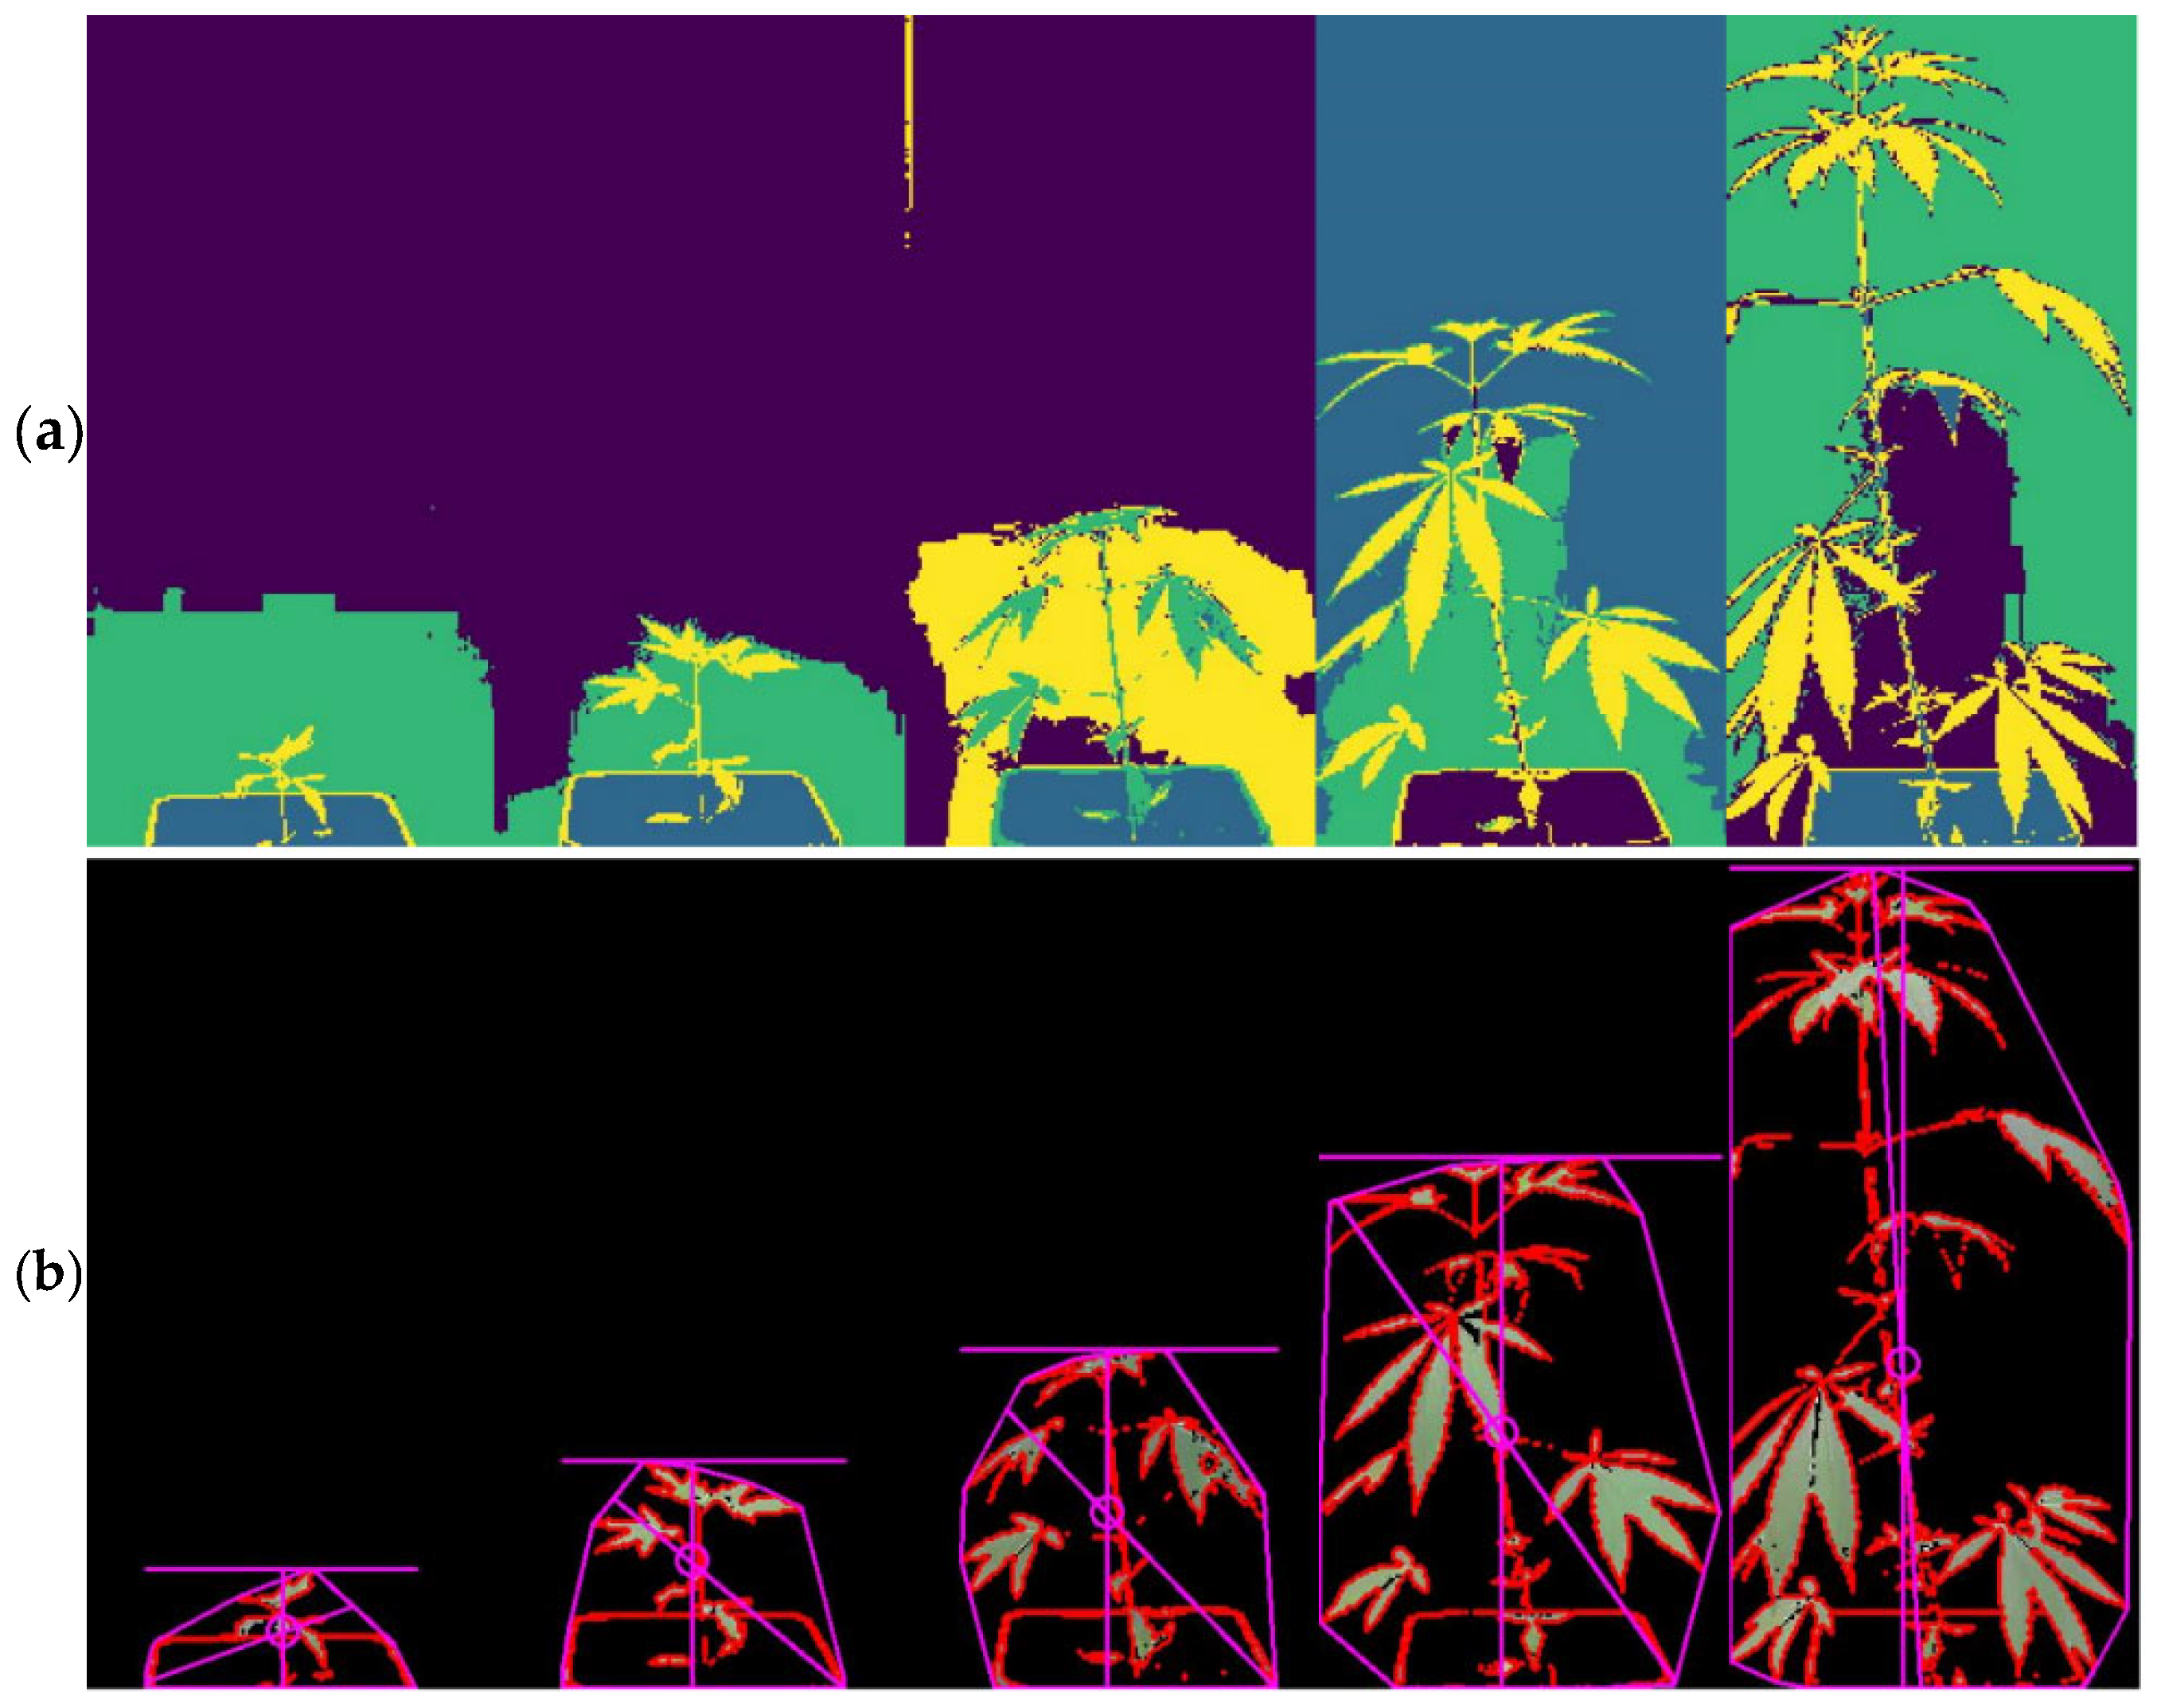
Figure 5 and Figure 6 show an example of the detection performed by the Canny edge detector and the K-means clustering model for the same plant. The Canny detector successfully captures the shape of the plant as well as the outer contour of the pot; however, it encounters difficulties when extraneous elements are present in the image, as it is unable to differentiate between entities within it. Regarding K-means, three groups were initially identified (background, pot, and plant). However, the variation in illumination caused by the sun’s position throughout the day created different tones and colours in the background of the image. Therefore, four groups were established to mitigate this variation.
As can be seen in the image, the plant and the edge of the pot are grouped into the same cluster based on the different colour channels (R, G, and B) [57], as the model has no spatial information. Therefore, it is less robust and flexible in response to changes in illumination, a problem that can be mitigated under controlled conditions or by employing adaptive optimisation algorithms to improve performance [58].
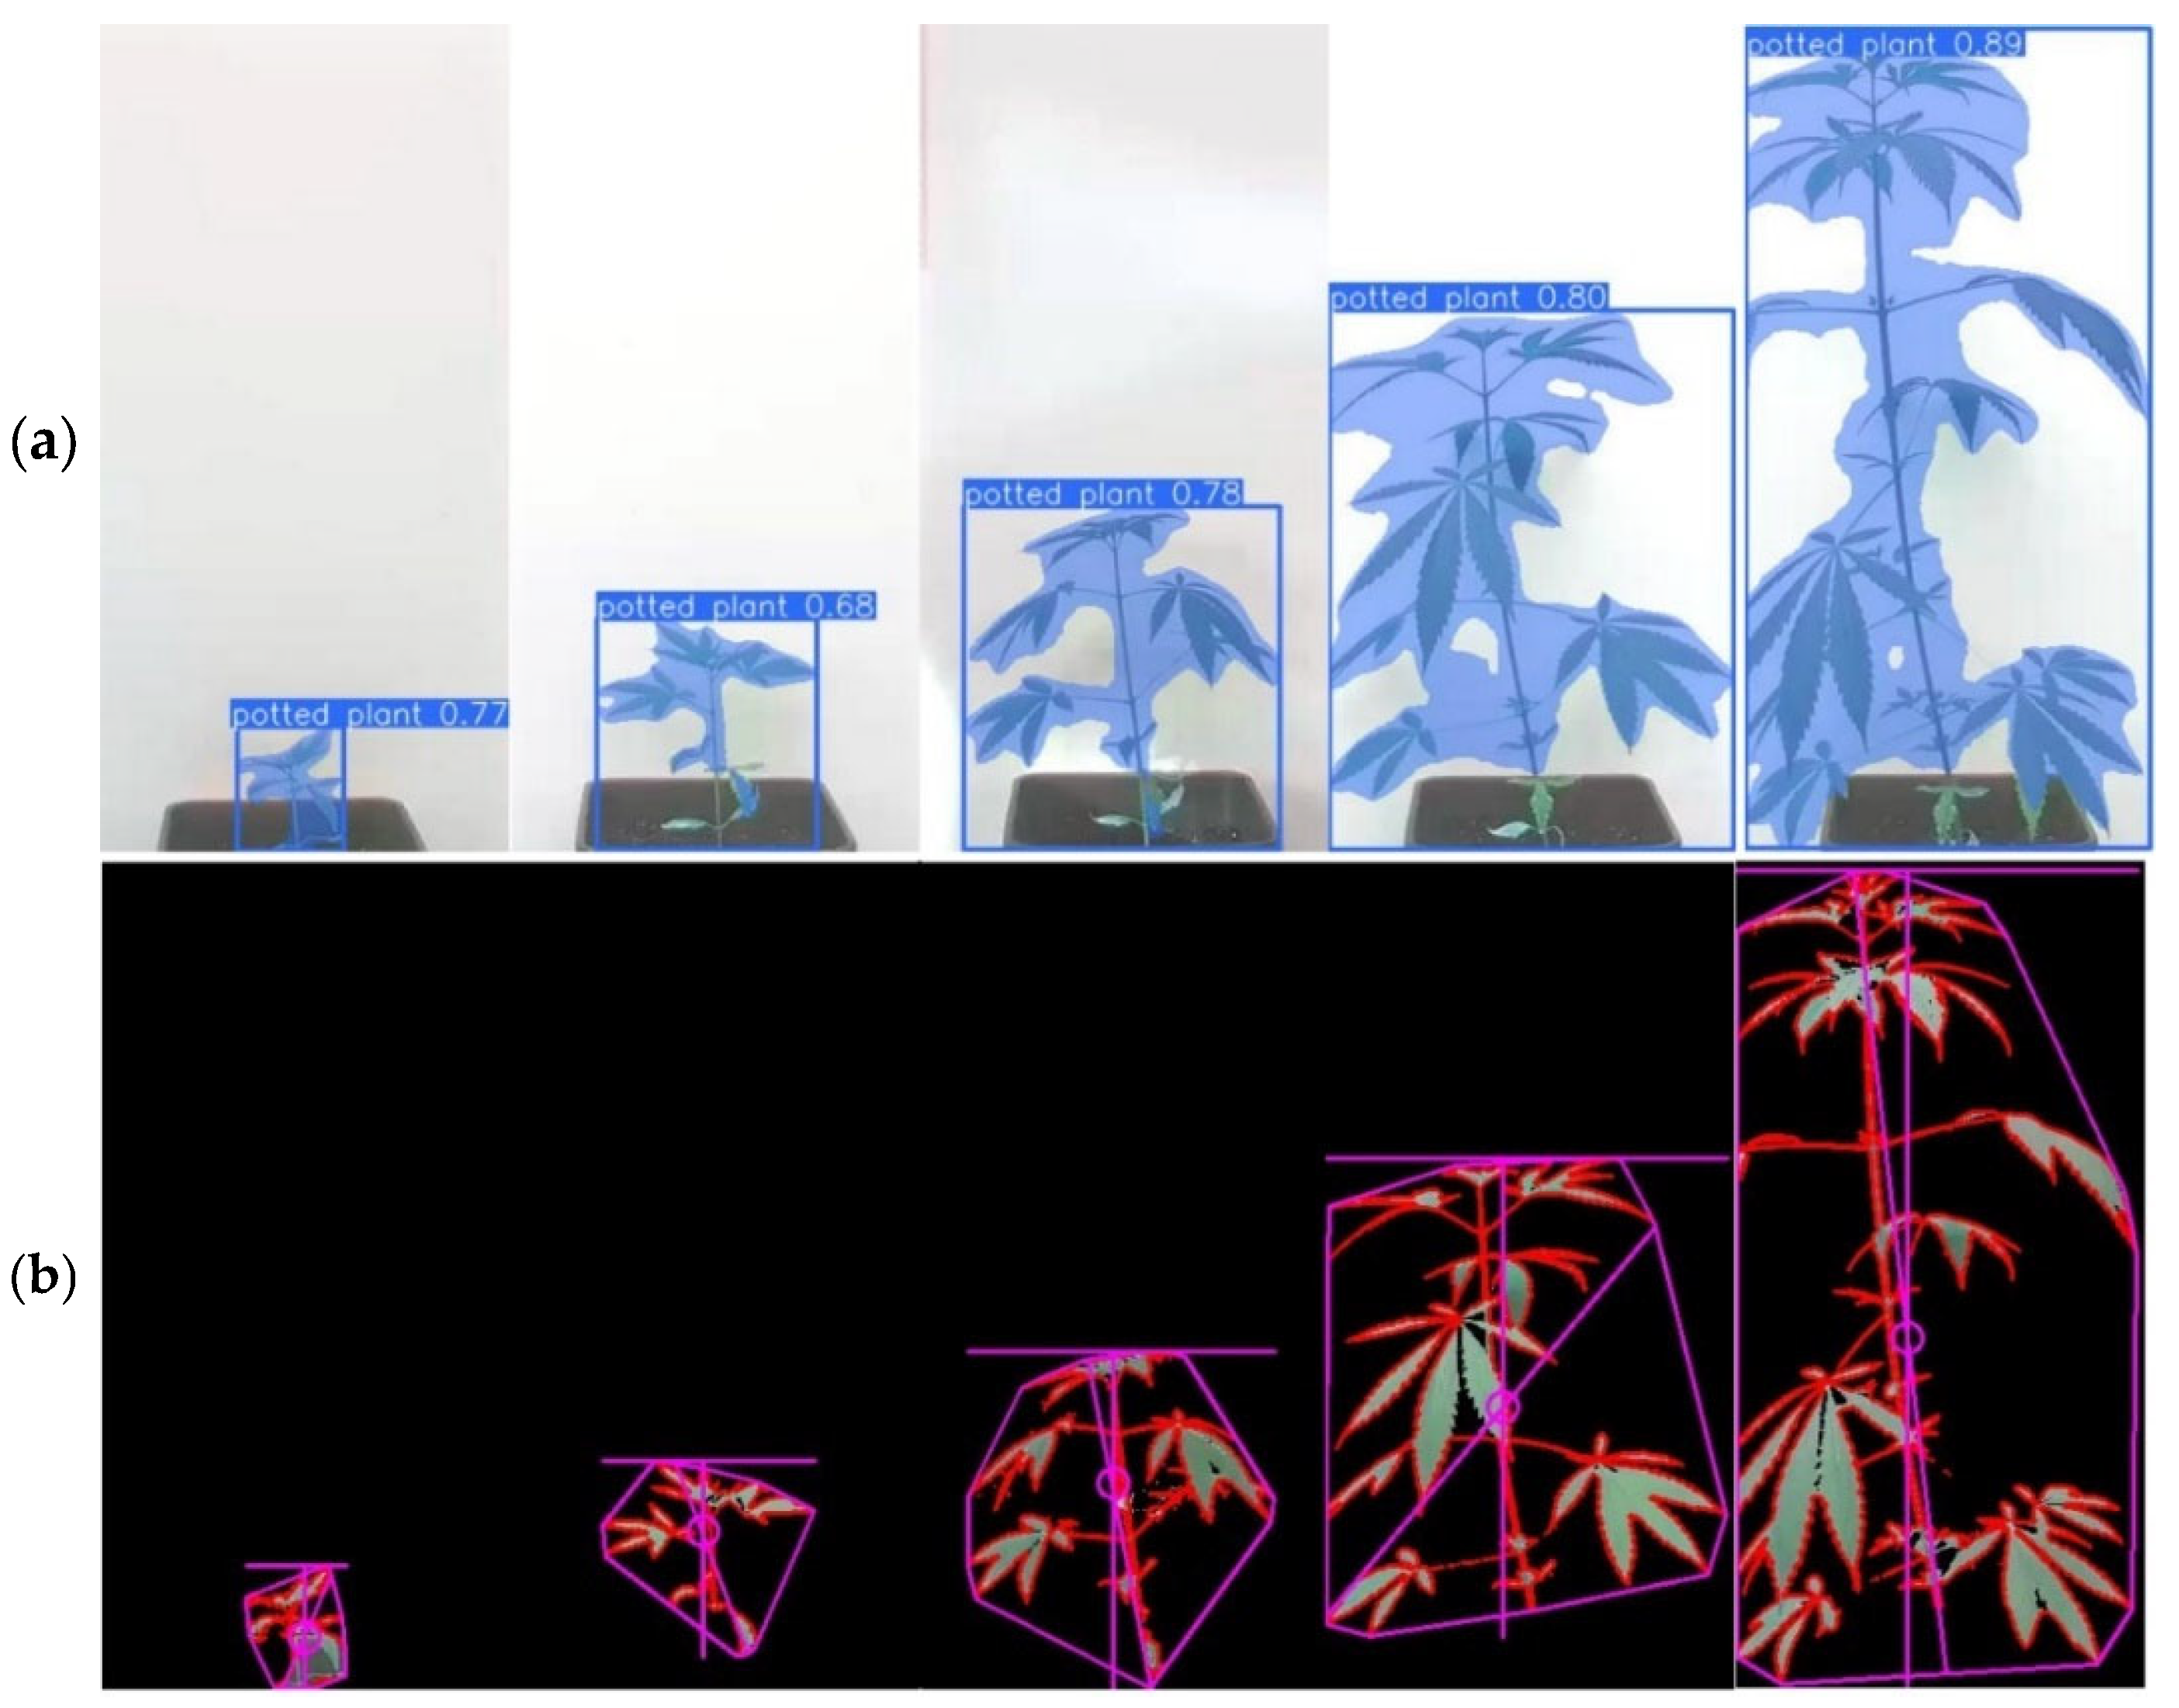
Figure 7 shows the detection and segmentation of the plant using YOLO v11. Using the pre-trained model weights, the model was able to detect the hemp plants with a high level of confidence. Although the segmentation defines the contour of the plant, it also picks up parts of the background, so post-processing is necessary. In certain segmentations, the model is unable to discern between the base of the plant and the pot. This can be corrected by adjusting the image to the edge of the pot or by setting the detection bounding box. Compared to the other two algorithms, it is more robust to the presence of foreign bodies or changes in illumination levels [17,18,59].
Table 1 shows the performance of each algorithm and model used, alongside the relevant metrics. The RMSE and MAE results are very similar, with mean values of 1.47 cm and 1.36 cm, respectively. The YOLO v11 model produced the lowest error value, followed by the Canny edge detector and then the K-means clustering-based model. The latter showed the highest variability in the measurements. However, no significant differences were found between them (Kruskal–Wallis test, p > 0.05).
These values are indicative of their possible use to accurately estimate the height growth of the crop, which can generate greater uncertainty in the initial days after transplanting, when the hemp is still small in terms of height. The automated approach allows real-time results to be obtained and has the potential to replace labour-intensive manual methods, which are prone to inconsistencies and errors in data collection [60]. While this approach can be useful, it is important to note that it is not without its limitations. One notable challenge is the loss of information when representing a three-dimensional plant in 2D, leading to an inability to obtain additional parameters of interest related to biomass, such as plant volume. This limitation has previously been observed by Carlson et al. [61]. This issue can be resolved through the implementation of a zenith camera, followed by the estimation of its volume. This approach entails higher investment per plant. Alternatively, the use of a zenith RGB-D camera, in conjunction with the D-channel (Depth) data, can be used to estimate the real height through a calibrated method [62]. A further associated constraint concerns the number of plants sampled. Given that the cameras are fixed, it is necessary to have at least one camera per plant, resulting in a limited number of sampled plants. This issue can be resolved by employing zenith cameras with rails, which would facilitate movement and enhance the sample size [63]. However, it would require dynamic adjustment of the camera due to lens distortion and could be less accurate compared to fixed cameras. In addition to visible light (RGB), other studies have utilised cameras with diverse spectral ranges. In their study, Story and Kacira [64] employed a device comprising three commercial cameras: one RGB (DFK 23G445, Imaging Source), one thermal (A325, FLIR), and one NIR (850 nm) (DFK 23G445, Imaging Source). The device was encased in a metal frame with rails to provide support for the monitoring of lettuce in greenhouses. This facilitated the extraction of substantial information, including morphological characteristics, vegetation indices, and plant temperature. Other scientific and commercial cameras such as the NetCam SC IR (StarDot Technologies) [65] and the CCFC (Campbell Scientific) [66] have been used for the phenotyping of crops such as soybeans and wheat. These cameras offer advantages in terms of robustness, lens properties, and image quality. However, they require considerable investment and are difficult to integrate with other existing systems.

3.2. Growth Curves

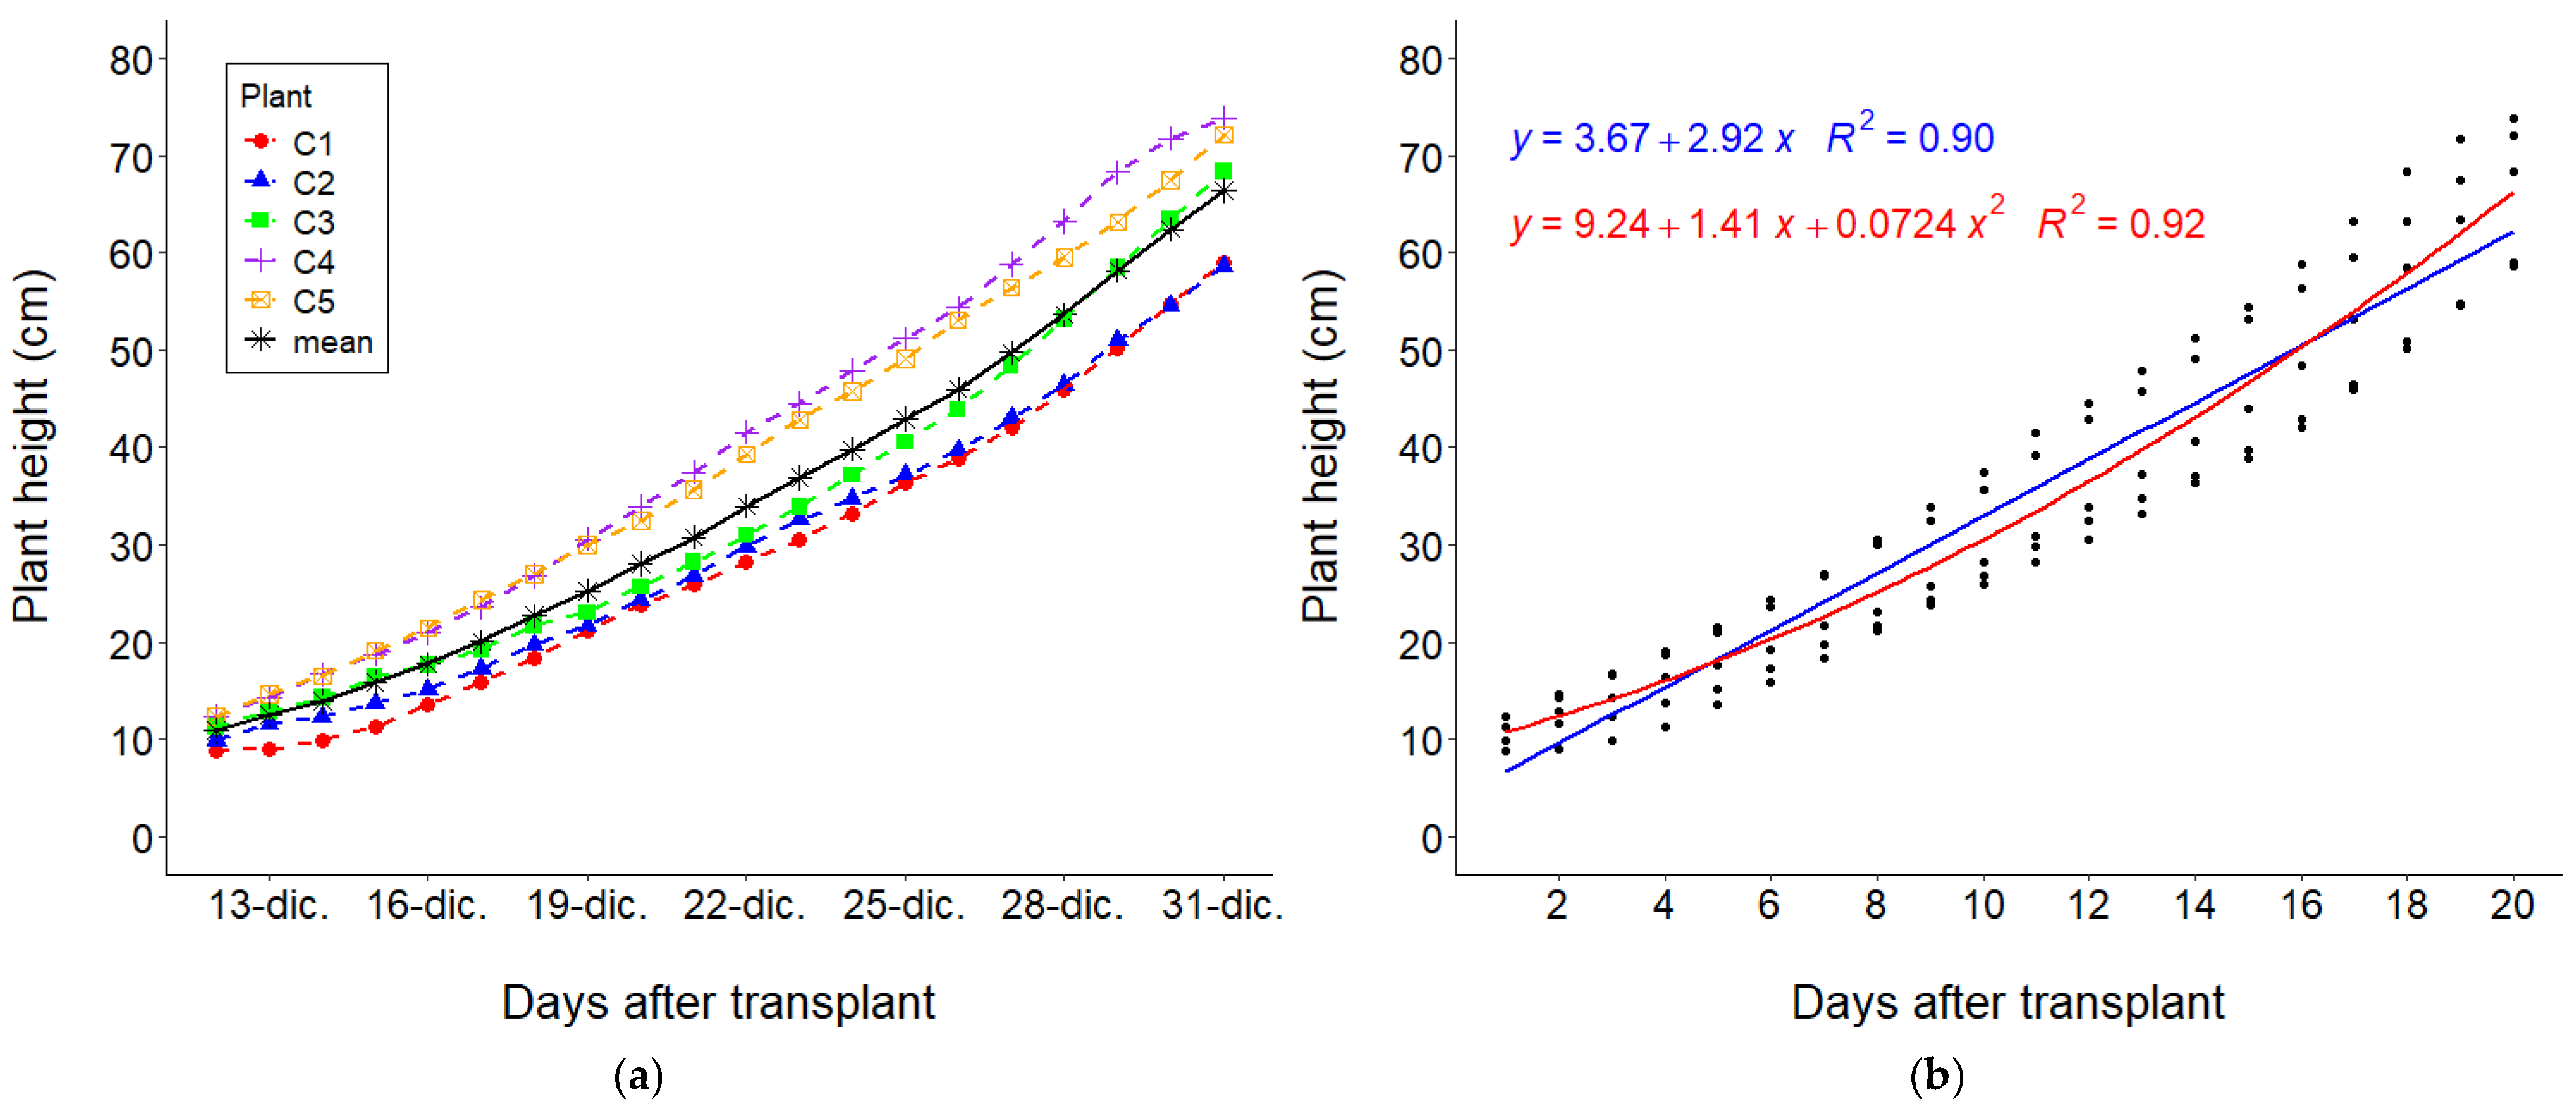
Figure 8a shows the growth curves of the hemp plants based on their recorded heights as captured by each camera. To create these curves, the median daily height values obtained from processing the images from 8 to 17 h were calculated and then averaged for the three models used. Some variability in the growth rate is observed, becoming more pronounced as the crop develops. Figure 8b shows good fits for linear and quadratic regressions of hemp height as a function of days since transplanting. According to the linear model, the daily height growth rate can be close to 2.9 cm. These daily growth values depend on the cultivation stage and usually follow a sigmoidal function, generally ranging from 1 to 3 cm [61,67]. This value may be influenced by variety, planting density, environmental conditions, and management practices [47,67,68]. Additionally, plant height is a key indicator correlated with biomass and fibre yield [69]. Therefore, determining the growth rate may be useful for the early detection of possible anomalies so that problems can be solved early on, crop yield can be predicted, and fertiliser and water use efficiency can be improved, thereby reducing costs and inputs [19,70].
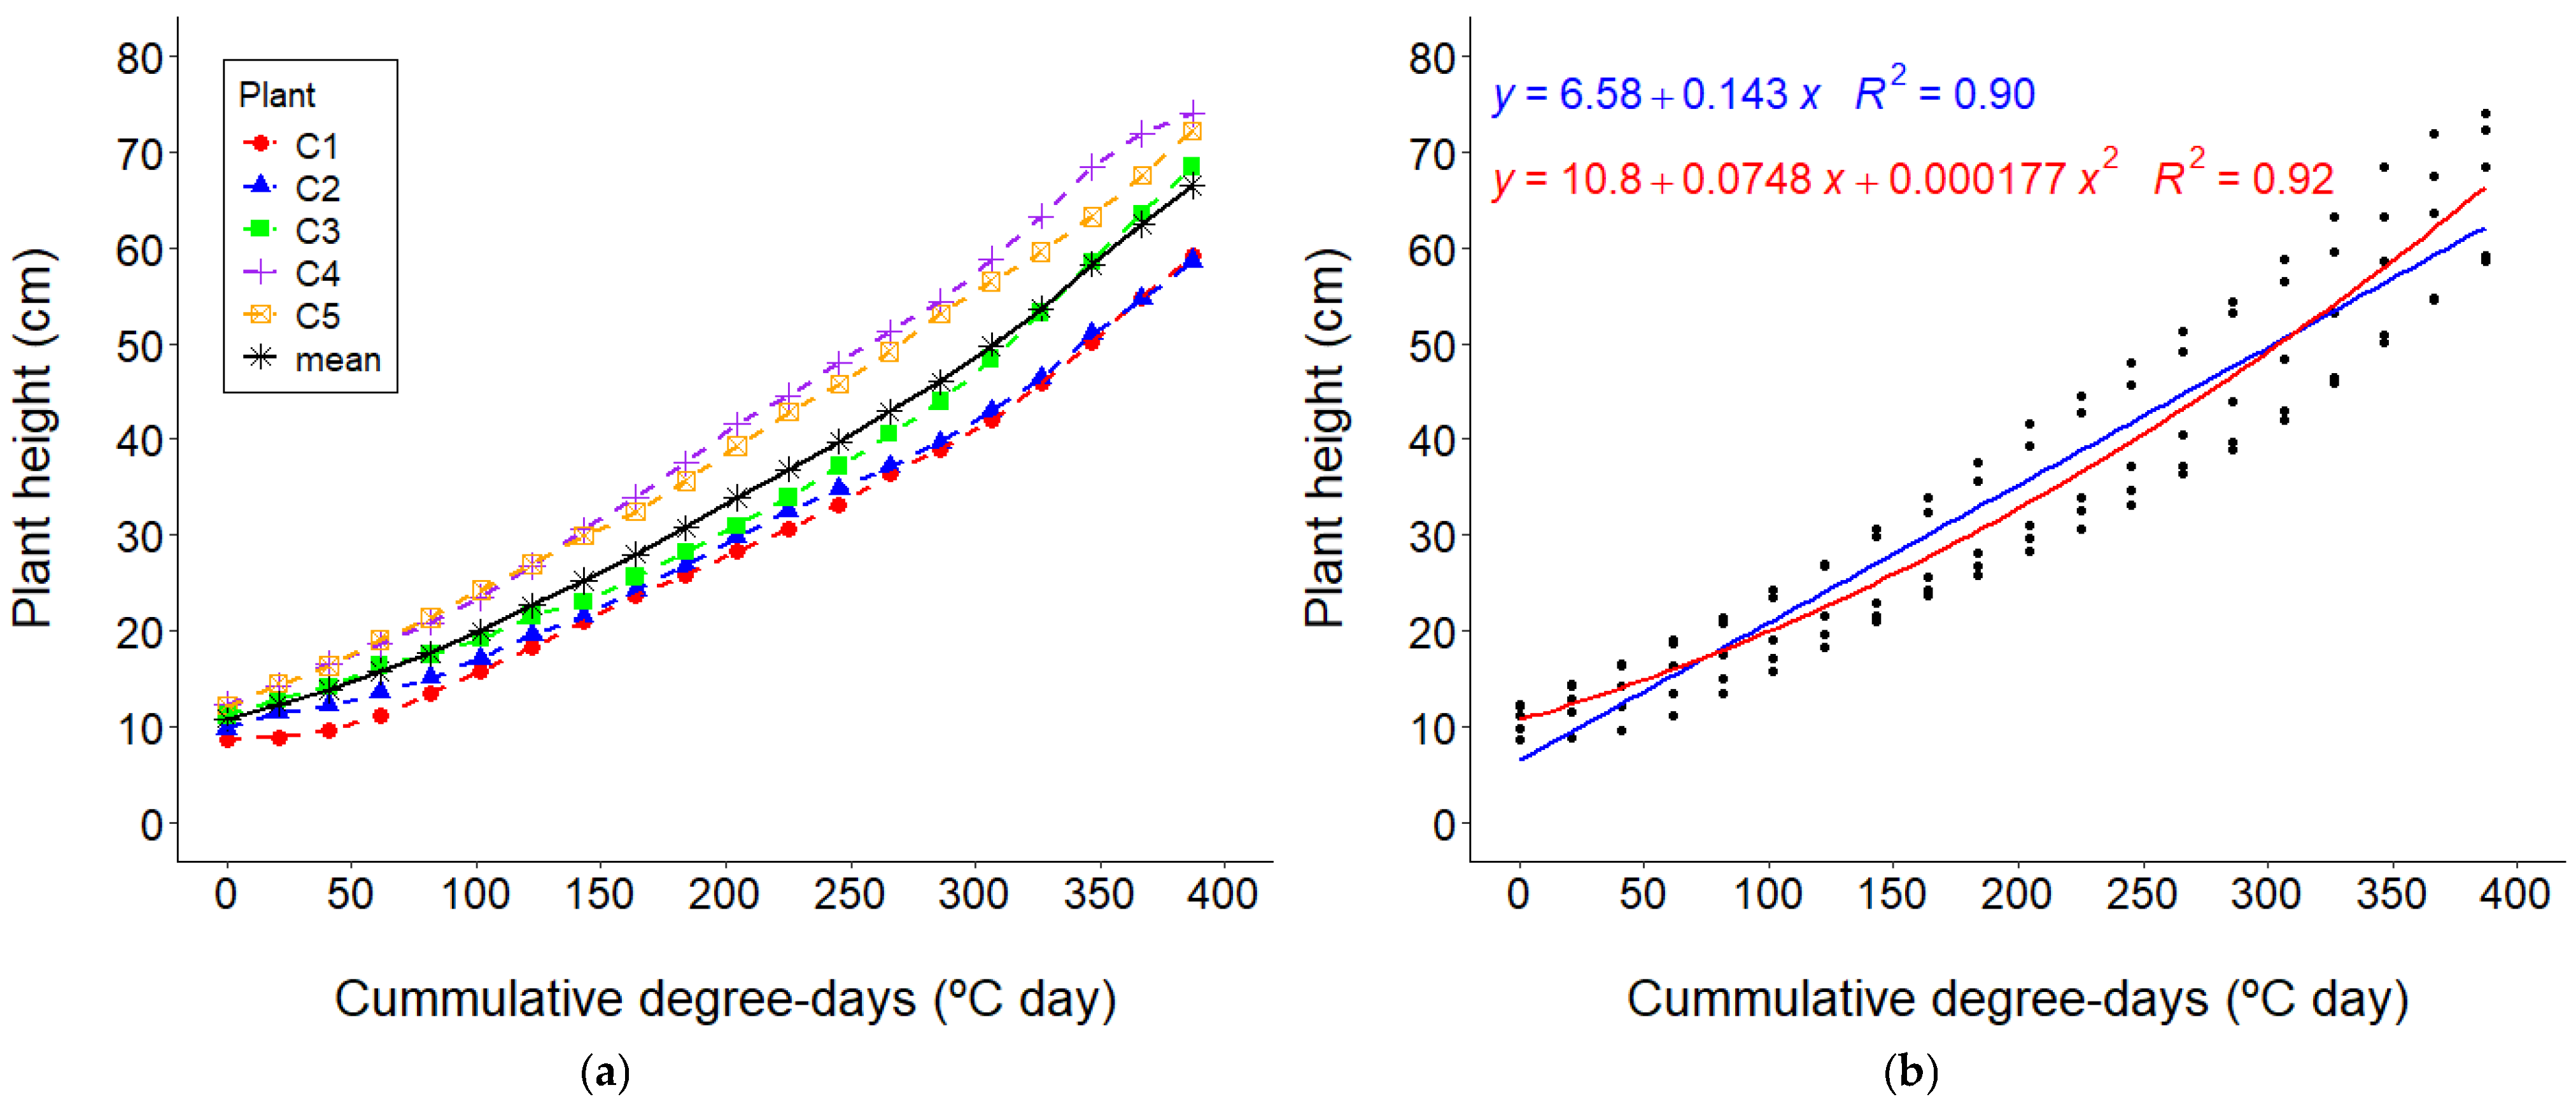
Hemp growth can also be expressed in terms of degree days, taking into account the base temperature. As can be seen in Figure 9b, there is a significant positive correlation between height growth and accumulated degree days (r = 0.95), with an approximate value (R2 = 0.90) of 1.43 mm/°C day. It is evident from the observation of both (Figure 8 and Figure 9) that a close relationship exists between the days since transplanting and the accumulated degree days. This is because in our study, controlled temperature conditions were established (M = 21.3 °C, SD = 2.5 °C) with slight variations throughout the day (CV = 11.7%) and in the average daily temperature (CV = 4.8%), so that the accumulation of degree days and that of natural days were close to constant proportionality. However, this information can be useful for predicting plant development stages and comparing the growth of hemp under different test conditions in protected environments or outdoors in the field [47,48,71].
With regard to other plant parameters, including width, area, convex hull area, and robustness, analysis was only possible up to the first 10 days after transplanting. This was due to the camera framing and the width of the image, with the plant exceeding the outer edges of the photograph. During the initial 10-day period, the growth rate for height was found to be lower, with an average of 2.1 centimetres per day (R2 = 0.77). A high positive linear correlation was observed between plant width and height, with a Pearson correlation coefficient of 0.79 and a p-value of less than 0.05. This indicates that the width of the plants increased by approximately 1.2 centimetres per day (R2 = 0.76), which is 43% less than the height growth rate. The correlations between plant area and both height and width were found to be positive (r = 0.93 and r = 0.78, respectively). The rate of growth in area was found to be 9.4 cm2/day (R2 = 0.77). The solidity levels exhibited a decline from 0.45 on day 1 to 0.25 on day 10 following transplantation, thereby indicating that the convex hull plant area exhibited a marked increase in comparison to the area of 40.7 cm2/day (R2 = 0.83). This finding suggests that, as the plant matured, it underwent a transformation from a more compact and denser configuration to a more open architecture characterised by increased separation between leaves and branches. This change was accompanied by a marked vertical growth, predominantly exhibiting apical dominance, a phenomenon that is commonly observed in fibre and grain varieties [61].

3.3. Water Stress Detection

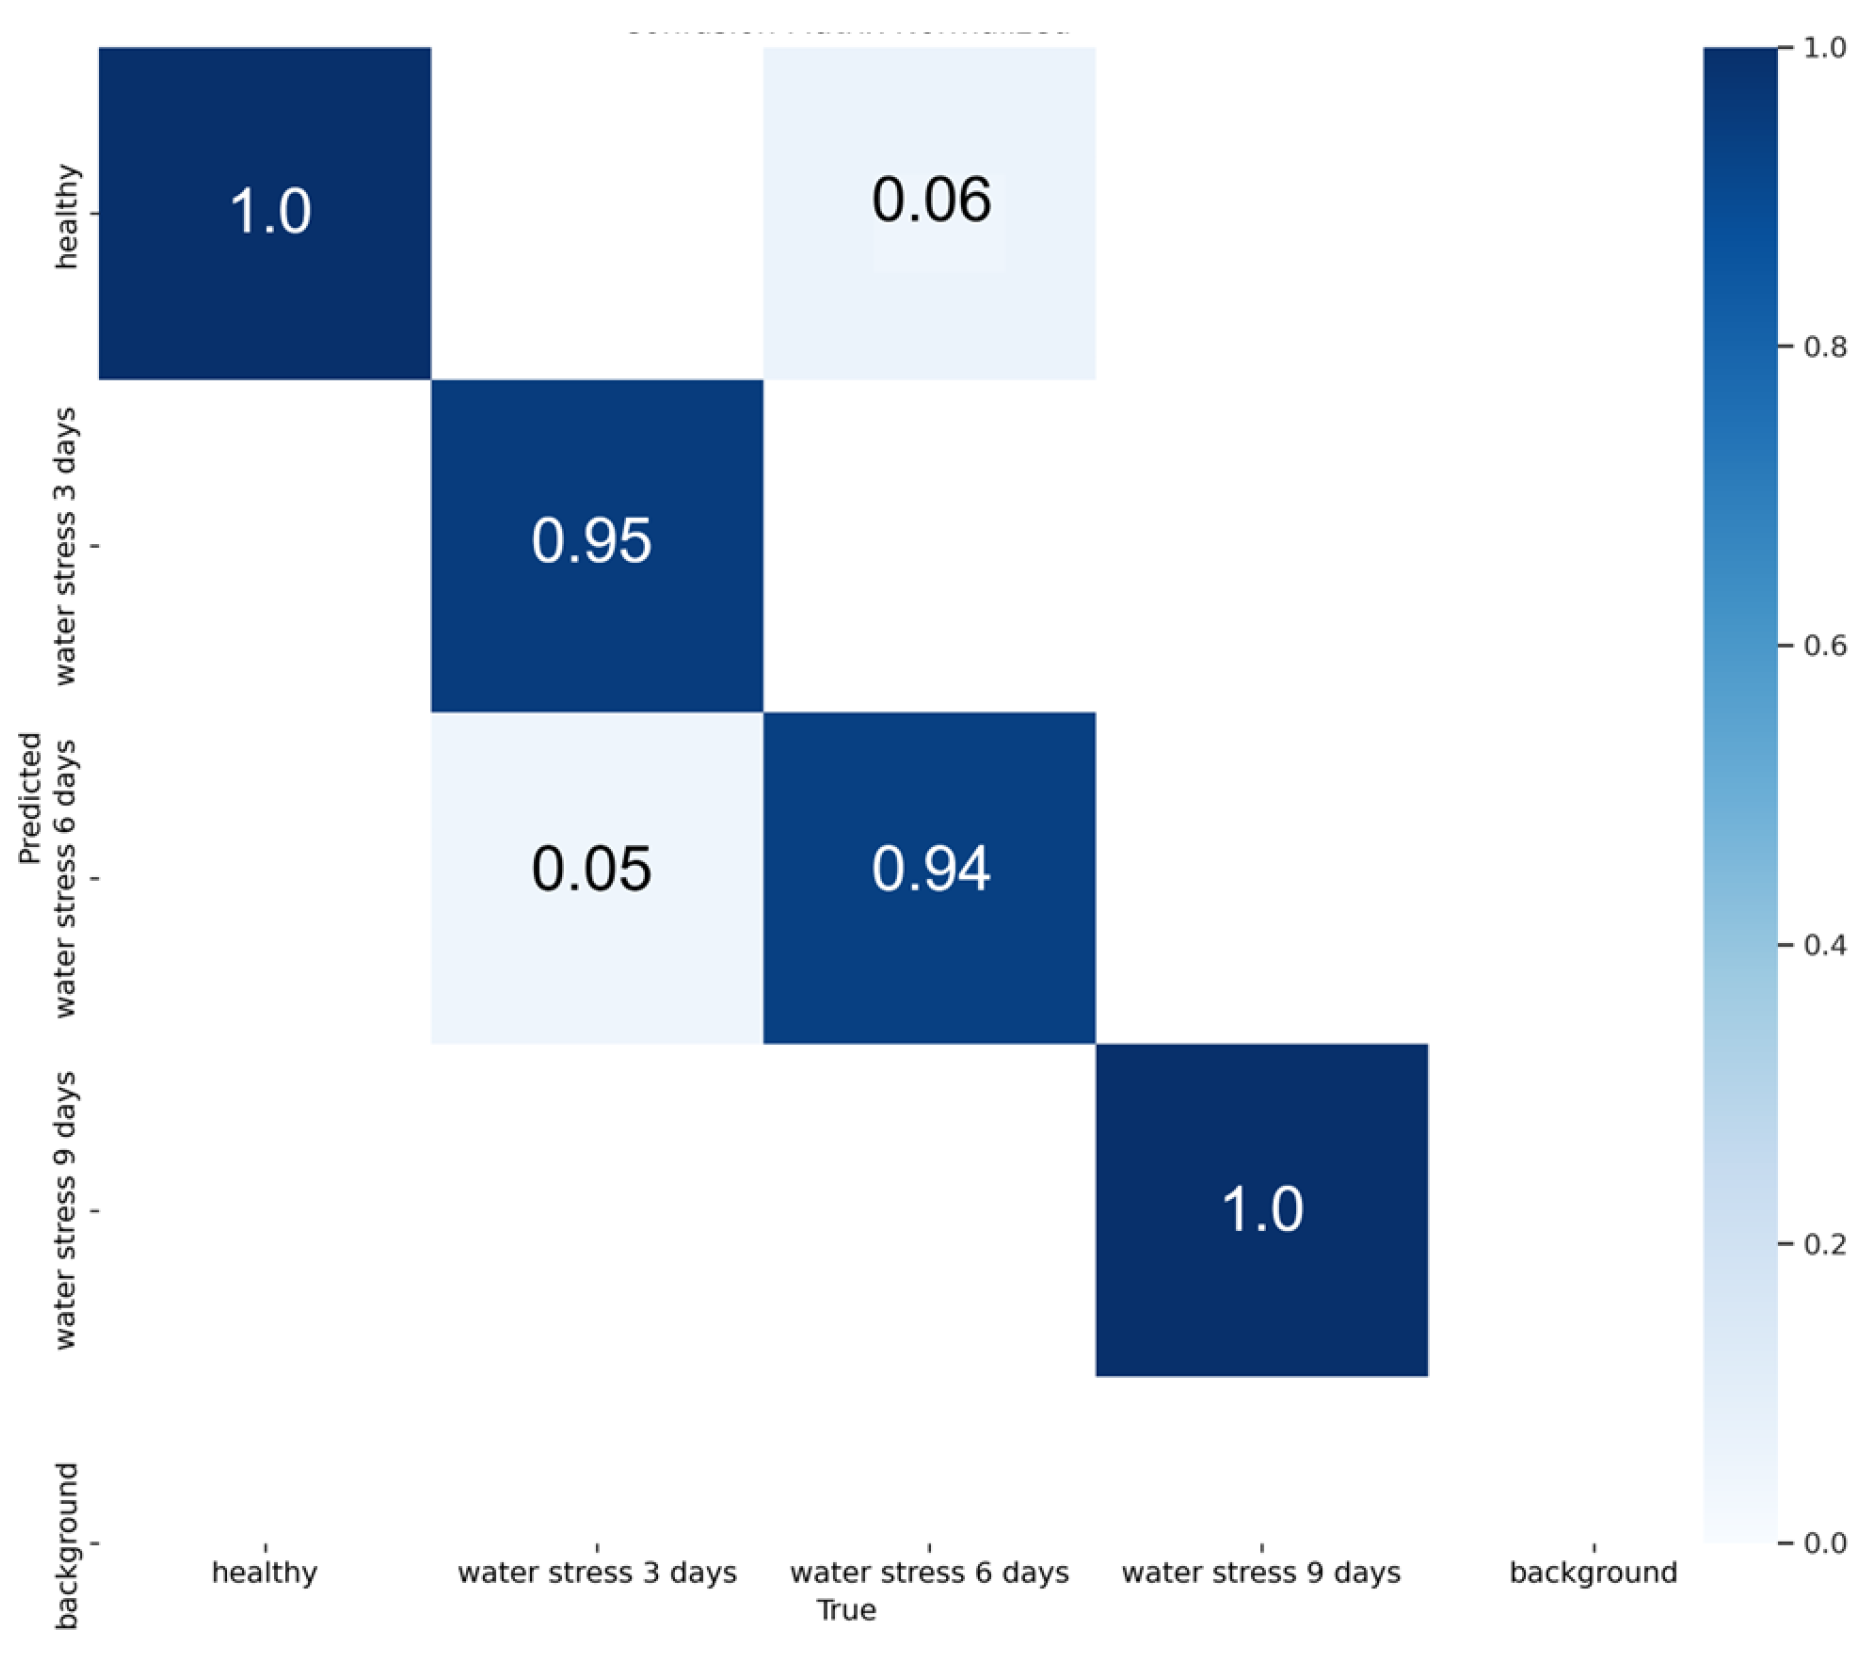
The confusion matrix depicted in Figure 10 reflects the performance of the YOLO11x-cls model in classifying Cannabis plants subjected to different levels of water stress (0, 3, 6, and 9 days without irrigation). The model correctly classified all images labelled as ‘healthy’ (no water stress), reaching an accuracy of 100%. This shows that the model identifies healthy plants very effectively. In the ‘water stress 3 days’ category, 95% of the images were correctly classified, while 5% were confused with the ‘water stress 6 days’ group. This is foreseeable, given that the visual differences between the initial stress states can be subtle. For the ‘water stress 6 days’ class, the model correctly classified 94% of the images. The remaining 6% were erroneously assigned to the ‘water stress 3 days’ category, which is also consistent considering that symptoms between 3 and 6 days of stress are progressive and difficult to distinguish visually. Finally, in the ‘water stress 9 days’ and ‘healthy’ classes, the model showed optimal performance, with 100% success. This suggests that plants subjected to 9 days without irrigation show distinctive visual signs that the model can readily recognise.
Figure 11 shows the results of the automatic classification process for identifying water stress in hemp plants using the YOLO11x-CLS model. This model was trained using images of plants at different stages of stress caused by a lack of irrigation, ranging from healthy plants to those experiencing 3, 6, or 9 days of water stress. The figure also shows the GradCAM activation maps corresponding to each category. As the number of days without irrigation increases, there is a progressive loss of turgor and leaf drop, as well as other visual signs that are characteristic of water stress. These differences are precisely what the YOLO11x-cls model has learnt to recognise in order to assign a class label to each image. GradCAM maps allow the regions of an image that the model considers most relevant for classification to be visualised. For healthy plants, the model focuses on the largest leaves. For plants with a higher level of water stress, however, the areas of activation shift towards fallen leaves or areas where stress symptoms are more evident. This visualisation suggests that the model could correctly classify images according to the number of days of stress based on physiologically consistent morphological characteristics.
The wilting observed in the water-stressed plants in this study is primarily attributable to the reduction in water content in the tissues, a direct consequence of the decrease in water availability in the substrate. In instances where the plant is unable to compensate for the loss of water through root uptake, a loss of cell turgor ensues, culminating in the collapse of metaphyll cells and leaf wilting, which is characterised by a visible manifestation of wilting. This response is commonly observed in conditions of water deficit, where the plant closes the stomata to reduce transpiration. However, this also results in limited CO2 entry, which in turn affects photosynthesis and thus energy and biomass production [23,72]. Moreover, the imbalance between reactive oxygen species (ROS) production and antioxidant capacity exacerbates cell damage, affecting the structural integrity of leaves and accelerating visual deterioration of the plant [24,73]. Consequently, the observed wilting is not only an early indicator of water stress but also a reflection of a profound physiological alteration that compromises plant health and yield.

3.4. The Potential of Internet of Things (IoT) Systems and Low-Cost Platforms

A key advantage of the developed system is its modular, replicable, and cost-effective nature, enabling its implementation with readily available components such as Raspberry Pi, commercial sensors, and IP cameras. This configuration of an embedded IoT architecture is consistent with the approaches documented in the literature, wherein analogous systems have been employed for the purposes of growth monitoring and stress diagnosis [70].
The integration of climate sensors (temperature, humidity, illuminance, conductivity) with computer vision has been proven to enrich phenotypic analysis. In this instance, plant growth measured by image analysis was quantified as a function of thermal time, expressed as degree days. This integration facilitates the early detection of growth deviations due to water stress or nutritional deficiencies. This convergence of visual and environmental data has been identified as a fundamental aspect in the progression towards autonomous and intelligent agricultural systems [13,14].
Moreover, the use of open-source platforms such as Home Assistant confers a strategic advantage over proprietary solutions. This is due to the fact that it does not require advanced programming knowledge, facilitates system customisation, and allows integration with storage (InfluxDB) and automation (MQTT, HTTP, etc.) services. This approach has already been validated in domestic environments and is now being successfully transferred to the agricultural sector, promoting a model of digital agriculture that is accessible to small farms [44].
Overall, this study aligns with a growing trend towards the development of solutions based on the IoT and artificial intelligence. This tendency facilitates the democratisation of access to crop monitoring through the implementation of simple, cost-effective, and efficient technologies that can be adopted by agricultural technicians, researchers, and farmers who lack substantial resources.

4. Conclusions

A system was implemented to monitor the growth of Cannabis sativa L. plants in greenhouses using artificial vision based on surveillance cameras integrated into an embedded IoT system that automates image capture and storage.
The captured images were analysed using traditional computer vision techniques, consisting of edge detection using the Canny algorithm and segmentation by clustering using the K-means algorithm, along with the use of the YOLO v11 algorithm based on deep learning.
These three methods made it possible to determine plant characteristics such as height and geometry and to analyse growth. The model that presented the lowest RMSE and MAE values was the one based on deep learning. However, no significant differences were found between the three models. Furthermore, image analysis facilitated the automated identification of water stress. The YOLO11x-CLS model demonstrated an ability to accurately classify images according to the number of days of stress.
It has been demonstrated that it is possible to implement an embedded artificial vision and IoT system for monitoring growth and detecting water stress in industrial hemp, without the need for sophisticated cameras or advanced programming knowledge. The system is based on open-source platforms, low-cost sensors, and conventional video cameras, allowing it to be replicated in various environments. This approach facilitates non-invasive, automatic, and efficient analysis of crop development, thereby establishing a foundation for simple and economical agricultural decision-making support systems.

Author Contributions

Conceptualization, C.R.-O. and F.-J.F.-P.; methodology, C.R.-O. and F.-J.F.-P.; software, C.R.-O., A.M.C.-A. and F.A.-R.; validation, C.R.-O. and F.A.-R.; formal analysis, C.R.-O. and F.A.-R.; investigation, C.R.-O.; resources, C.R.-O.; data curation, C.R.-O., A.M.C.-A. and F.A.-R.; writing—original draft preparation, A.M.C.-A. and F.A.-R.; writing—review and editing, C.R.-O. and F.-J.F.-P.; visualisation, F.A.-R.; supervision, C.R.-O. and F.-J.F.-P. All authors have read and agreed to the published version of the manuscript.

Funding

C.R.-O. has been funded by the Ministry of Universities and by the European Union-Next Generation EU within the framework of Grants for the Requalification of the Spanish University System, in the university teaching staff modality (Royal Decree 289/2021 and Rectoral Resolution 04912 of the Universidad Miguel Hernández).

Data Availability Statement

The original data presented in the study are openly available at the handle [https://doi.org/10.17632/3md2tbx74c.1]. Alternatively, they can be downloaded from this other repository: [https://github.com/fearro/IoT_monitoring_hemp] (accessed on 11 August 2025).

Conflicts of Interest

The authors declare no conflicts of interest.

References

  1. Guillevic, P.; Aouizerats, B.; Burger, R.; Besten, D.; Jackson, D.; Ridderikhoff, M.; Zajdband, A.; Houborg, R.; Franz, T.; Robertson, G.; et al. Planet’s Biomass Proxy for monitoring aboveground agricultural biomass and estimating crop yield. Field Crop. Res. 2024, 316, 109511. [Google Scholar] [CrossRef]
  2. Seo, B.; Lee, J.; Lee, K.; Hong, S.; Kang, S. Improving remotely-sensed crop monitoring by NDVI-based crop phenology estimators for corn and soybeans in Iowa and Illinois, USA. Field Crop. Res. 2019, 238, 113–128. [Google Scholar] [CrossRef]
  3. Zhou, L.; Tu, W.; Wang, C.; Li, Q. A heterogeneous access metamodel for efficient IoT remote sensing observation management: Taking precision agriculture as an example. IEEE Internet Things J. 2021, 9, 8616–8632. [Google Scholar] [CrossRef]
  4. Behmann, J.; Acebron, K.; Emin, D.; Bennertz, S.; Matsubara, S.; Thomas, S.; Bohnenkamp, D.; Kuska, M.T.; Jussila, J.; Salo, H.; et al. Specim IQ: Evaluation of a New, Miniaturized Handheld Hyperspectral Camera and Its Application for Plant Phenotyping and Disease Detection. Sensors 2018, 18, 441. [Google Scholar] [CrossRef] [PubMed]
  5. Zhang, R.; Koh, S.; Teo, M.; Bi, R.; Zhang, S.; Dev, K.; Urano, D.; Dinish, U.; Olivo, M. Handheld Multifunctional Fluorescence Imager for Non-invasive Plant Phenotyping. Front. Plant Sci. 2022, 13, 822634. [Google Scholar] [CrossRef]
  6. Cirilli, M.; Bellincontro, A.; Urbani, S.; Servili, M.; Esposto, S.; Mencarelli, F.; Muleo, R. On-field monitoring of fruit ripening evolution and quality parameters in olive mutants using a portable NIR-AOTF device. Food Chem. 2016, 199, 96–104. [Google Scholar] [CrossRef] [PubMed]
  7. Cherney, J.; Digman, M.; Cherney, D. Handheld NIRS for forage evaluation. Comput. Electron. Agric. 2021, 190, 106469. [Google Scholar] [CrossRef]
  8. Aykas, D.; Ball, C.; Sia, A.; Zhu, K.; Shotts, M.; Schmenk, A.; Rodriguez-Saona, L. In-Situ Screening of Soybean Quality with a Novel Handheld Near-Infrared Sensor. Sensors 2020, 20, 6283. [Google Scholar] [CrossRef]
  9. Gaikwad, S.; Vibhute, A.; Kale, K.; Mehrotra, S. An innovative IoT based system for precision farming. Comput. Electron. Agric. 2021, 187, 106291. [Google Scholar] [CrossRef]
  10. Mohtasim, S.; Khan, J.; Islam, M.; Sarker, M.; Uddin, M.; Hasan, M. IoT-based Crop Monitoring and Disease Detection. In Proceedings of the 2023 5th International Conference on Sustainable Technologies for Industry 5.0 (STI), Dhaka, Bangladesh, 9–10 December 2023; pp. 1–6. [Google Scholar] [CrossRef]
  11. Sushma, Y.; Lakshmi Ch, J.; Rajesh, K.; Hemanth, V.; Sowmyarao, V. IoT Based Soil Nutrient Monitoring and Analysis System. In Proceedings of the 2024 International Conference on IoT Based Control Networks and Intelligent Systems (ICICNIS), Bengaluru, India, 17–18 December 2024; pp. 348–353. [Google Scholar] [CrossRef]
  12. Kiran, G.; Srilakshmi, V.; Reddy, B.; Thatha, V.N.; Sanapala, S. Image Processing Techniques in Computer Vision; IIP Series: Chikkamagaluru, India, 2024; pp. 156–170. [Google Scholar] [CrossRef]
  13. Dhanya, V.; Subeesh, A.; Kushwaha, N.; Vishwakarma, D.; Kumar, N.; Ritika, G.; Singh, A. Deep learning based computer vision approaches for smart agricultural applications. Artif. Intell. Agric. 2022, 6, 211–229. [Google Scholar] [CrossRef]
  14. Ghazal, S.; Munir, A.; Qureshi, W. Computer vision in smart agriculture and precision farming: Techniques and applications. Artif. Intell. Agric. 2024, 13, 64–83. [Google Scholar] [CrossRef]
  15. Tian, H.; Wang, T.; Liu, Y.; Qiao, X.; Li, Y. Computer vision technology in agricultural automation—A review. Inf. Process. Agric. 2020, 7, 1–19. [Google Scholar] [CrossRef]
  16. Jocher, G.; Qiu, J. Ultralytics YOLO11 (11.0.0) 2024 [Computer Software]. Available online: https://github.com/ultralytics/ultralytics (accessed on 17 March 2025).
  17. Wu, D.; Lv, S.; Jiang, M.; Song, H. Using channel pruning-based YOLO v4 deep learning algorithm for the real-time and accurate detection of apple flowers in natural environments. Comput. Electron. Agric. 2020, 178, 105742. [Google Scholar] [CrossRef]
  18. Liu, G.; Nouaze, J.C.; Touko Mbouembe, P.L.; Kim, J.H. YOLO-tomato: A robust algorithm for tomato detection based on YOLOv3. Sensors 2020, 20, 2145. [Google Scholar] [CrossRef]
  19. Rana, S.; Gerbino, S.; Akbari Sekehravani, E.; Russo, M.B.; Carillo, P. Crop Growth Analysis Using Automatic Annotations and Transfer Learning in Multi-Date Aerial Images and Ortho-Mosaics. Agronomy 2024, 14, 2052. [Google Scholar] [CrossRef]
  20. Jamshidi Goharrizi, K.; Wilde, H.D.; Amirmahani, F.; Moemeni, M.M.; Zaboli, M.; Nazari, M.; Moosavi, S.S.; Jamalvandi, M. Selection and validation of reference genes for normalization of qRT-PCR gene expression in wheat (Triticum durum L.) under drought and salt stresses. J. Genet. 2018, 97, 1433–1444. [Google Scholar]
  21. Nazari, M.; Goharrizi, K.J.; Moosavi, S.S.; Maleki, M. Expression changes in the TaNAC2 and TaNAC69-1 transcription factors in drought stress tolerant and susceptible accessions of Triticum boeoticum. Plant Genet. Resour. 2019, 17, 471–479. [Google Scholar] [CrossRef]
  22. Nazari, M.; Moosavi, S.S.; Maleki, M.; Jamshidi Goharrizi, K. Chloroplastic acyl carrier protein synthase I and chloroplastic 20 kDa chaperonin proteins are involved in wheat (Triticum aestivum) in response to moisture stress. J. Plant Interact. 2020, 15, 180–187. [Google Scholar] [CrossRef]
  23. Pirbalouti, A.G.; Malekpoor, F.; Salimi, A.; Golparvar, A.; Hamedi, B. Effects of foliar of the application chitosan and reduced irrigation on essential oil yield, total phenol content and antioxidant activity of extracts from green and purple basil. Acta Sci. Pol. Hortorum Cultus 2017, 16, 177–186. [Google Scholar] [CrossRef]
  24. Babaei, K.; Moghaddam, M.; Farhadi, N.; Pirbalouti, A.G. Morphological, physiological and phytochemical responses of Mexican marigold (Tagetes minuta L.) to drought stress. Sci. Hortic. 2021, 284, 110116. [Google Scholar] [CrossRef]
  25. Méndez-Guzmán, H.A.; Padilla-Medina, J.A.; Martínez-Nolasco, C.; Martinez-Nolasco, J.J.; Barranco-Gutiérrez, A.I.; Contreras-Medina, L.M.; Leon-Rodriguez, M. IoT-Based Monitoring System Applied to Aeroponics Greenhouse. Sensors 2022, 22, 5646. [Google Scholar] [CrossRef]
  26. Mohabuth, A.; Nem, D. An IoT-Based Model for Monitoring Plant Growth in Greenhouses. J. Inf. Syst. Inform. 2023, 5, 536–549. [Google Scholar] [CrossRef]
  27. Pradeep, M.; Rinku, D.; Swapna, P.; Jyothi, V.; Athiraja, A.; Prasannakumar, G. An IoT Based Greenhouse Remote Monitoring System for Automation of Supervision for Optimal Plant Growth. In Proceedings of the 2024 10th International Conference on Advanced Computing and Communication Systems (ICACCS), Coimbatore, India, 14–15 March 2024; pp. 797–802. [Google Scholar] [CrossRef]
  28. Mali, P.; Rane, T.; Rawale, N.; Jadhav, A. Greenhouse Monitoring System Using IoT. In Proceedings of the 2024 15th International Conference on Computing Communication and Networking Technologies (ICCCNT), Kamand, India, 24–28 June 2024; pp. 1–6. [Google Scholar] [CrossRef]
  29. Harun, A.; Mohamed, N.; Ahmad, R.; Rahim, A.; Ani, N. Improved Internet of Things (IoT) monitoring system for growth optimization of Brassica chinensis. Comput. Electron. Agric. 2019, 164, 104836. [Google Scholar] [CrossRef]
  30. Kar, T.; Pahadsingh, S.; Giri, N.; Kuziakin, O.; Leliuk, S.; Bilyk, S. Smart Plant Monitoring and Controlling System for Greenhouse Application Using IoT. In Proceedings of the 2023 IEEE 5th International Conference on Modern Electrical and Energy System (MEES), Kremenchuk, Ukraine, 27–30 September 2023; pp. 1–5. [Google Scholar] [CrossRef]
  31. Karabay, G.S.; Çavaş, M. Artificial Intelligence Based Smart Agriculture Applications in Greenhouses. In Proceedings of the 2024 8th International Artificial Intelligence and Data Processing Symposium (IDAP), Malatya, Turkiye, 21–22 September 2024; pp. 1–8. [Google Scholar] [CrossRef]
  32. Tao, W.; Zhao, L.; Wang, G.; Liang, R. Review of the internet of things communication technologies in smart agriculture and challenges. Comput. Electron. Agric. 2021, 189, 106352. [Google Scholar] [CrossRef]
  33. Chen, T.; Yin, H. Camera-based plant growth monitoring for automated plant cultivation with controlled environment agriculture. Smart Agric. Technol. 2024, 8, 100449. [Google Scholar] [CrossRef]
  34. Yeh, Y.; Lai, T.; Liu, T.; Liu, C.; Chung, W.; Lin, T. An automated growth measurement system for leafy vegetables. Biosyst. Eng. 2014, 117, 43–50. [Google Scholar] [CrossRef]
  35. Wijanarko, A.; Nugroho, A.; Sutiarso, L.; Okayasu, T. Development of mobile RoboVision with stereo camera for automatic crop growth monitoring in plant factory. AIP Conf. Proc. 2019, 2202, 102010. [Google Scholar] [CrossRef]
  36. Soetedjo, A.; Hendriarianti, E. Plant Leaf Detection and Counting in a Greenhouse during Day and Nighttime Using a Raspberry Pi NoIR Camera. Sensors 2021, 21, 6659. [Google Scholar] [CrossRef]
  37. Islam, S.; Reza, M.; Samsuzzaman, S.; Ahmed, S.; Cho, Y.; Noh, D.; Chung, S.; Hong, S. Machine vision and artificial intelligence for plant growth stress detection and monitoring: A review. Precis. Agric. Sci. Technol. 2024, 6, 33–57. [Google Scholar] [CrossRef]
  38. Maraveas, C.; Bartzanas, T. Application of Internet of Things (IoT) for Optimized Greenhouse Environments. AgriEngineering 2021, 3, 954–970. [Google Scholar] [CrossRef]
  39. Farooq, M.; Riaz, S.; Helou, M.; Khan, F.; Abid, A.; Alvi, A. A Survey on IoT in Agriculture for the Implementation of Greenhouse Farming. IEEE Access 2022, 10, 53374–53397. [Google Scholar] [CrossRef]
  40. Kim, W.; Lee, W.; Kim, Y. A Review of the Applications of the Internet of Things (IoT) for Agricultural Automation. J. Biosyst. Eng. 2020, 45, 385–400. [Google Scholar] [CrossRef]
  41. Bayılmış, C.; Ebleme, M.A.; Çavuşoğlu, Ü.; Küçük, K.; Sevin, A. A survey on communication protocols and performance evaluations for Internet of Things. Digit. Commun. Netw. 2022, 8, 1094–1104. [Google Scholar] [CrossRef]
  42. Open Home Foundation. Home Assistant. Available online: https://www.home-assistant.io/ (accessed on 14 September 2024).
  43. Hüwe, P.; Hüwe, S. IoT at Home; Carl Hanser Verlag GmbH: Munich, Germany, 2019. [Google Scholar]
  44. Setz, B.; Graef, S.; Ivanova, D.; Tiessen, A.; Aiello, M. A Comparison of Open-Source Home Automation Systems. IEEE Access 2021, 9, 167332–167352. [Google Scholar] [CrossRef]
  45. Raspberry Pi Foundation. Raspberry Pi, 2024. Available online: https://www.raspberrypi.org/ (accessed on 14 September 2024).
  46. GitHub. GitHub: Where the World Builds Software. Available online: https://github.com/ (accessed on 14 September 2024).
  47. De Prato, L.; Ansari, O.; Hardy, G.E.S.J.; Howieson, J.; O’Hara, G.; Ruthrof, K.X. The cannabinoid profile and growth of hemp (Cannabis sativa L.) is influenced by tropical daylengths and temperatures, genotype and nitrogen nutrition. Ind. Crop. Prod. 2022, 178, 114605. [Google Scholar] [CrossRef]
  48. Lisson, S.N.; Mendham, N.J.; Carberry, P.S. Development of a hemp (Cannabis sativa L.) simulation model 2. The flowering response of two hemp cultivars to photoperiod. Aust. J. Exp. Agric. 2000, 40, 413–417. [Google Scholar] [CrossRef]
  49. Shiponi, S.; Bernstein, N. Response of medical cannabis (Cannabis sativa L.) genotypes to P supply under long photoperiod: Functional phenotyping and the ionome. Ind. Crop. Prod. 2021, 161, 113154. [Google Scholar] [CrossRef]
  50. O’Mahony, N.; Campbell, S.; Carvalho, A.; Harapanahalli, S.; Hernandez, G.V.; Krpalkova, L.; Riordan, D.; Walsh, J. Deep learning vs. traditional computer vision. In Advances in Computer Vision, Proceedings of the Computer Vision Conference (CVC 2019), Las Vegas, NV, USA, 2–3 May 2019; Springer International Publishing: Cham, Switzerland, 2020; pp. 128–144. [Google Scholar]
  51. Neha, F.; Bhati, D.; Shukla, D.K.; Amiruzzaman, M. From classical techniques to convolution-based models: A review of object detection algorithms. In Proceedings of the 2025 IEEE 6th International Conference on Image Processing, Applications and Systems (IPAS), Lyon, France, 9–11 January 2025; IEEE: New York, NY, USA, 2025; pp. 1–6. [Google Scholar]
  52. Canny, J. A Computational Approach to Edge Detection. IEEE Trans. Pattern Anal. Mach. Intell. 1986, PAMI-8, 679–698. [Google Scholar] [CrossRef]
  53. Lloyd, S. Least squares quantization in PCM. IEEE Trans. Inf. Theory 1982, 28, 129–137. [Google Scholar] [CrossRef]
  54. Lin, T.Y.; Maire, M.; Belongie, S.; Hays, J.; Perona, P.; Ramanan, D.; Dollár, P.; Zitnick, C.L. Microsoft coco: Common objects in context. In Computer Vision—ECCV 2014. ECCV 2014. Lecture Notes in Computer Science; Fleet, D., Pajdla, T., Schiele, B., Tuytelaars, T., Eds.; Springer: Cham, Switzerland, 2014; Volume 8693. [Google Scholar] [CrossRef]
  55. Gehan, M.A.; Fahlgren, N.; Abbasi, A.; Berry, J.C.; Callen, S.T.; Chavez, L.; Doust, A.N.; Feldman, M.J.; Gilbert, K.B.; Hodge, J.G.; et al. PlantCV v2: Image analysis software for high-throughput plant phenotyping. PeerJ 2017, 5, e4088. [Google Scholar] [CrossRef]
  56. Selvaraju, R.R.; Cogswell, M.; Das, A.; Vedantam, R.; Parikh, D.; Batra, D. Grad-cam: Visual explanations from deep networks via gradient-based localization. In Proceedings of the 2017 IEEE International Conference on Computer Vision (ICCV), Venice, Italy, 22–29 October 2017; pp. 618–626. [Google Scholar]
  57. Wang, Q.; Du, W.; Ma, C.; Gu, Z. Gradient Color Leaf Image Segmentation Algorithm Based on Meanshift and Kmeans. In Proceedings of the 2021 IEEE 5th Advanced Information Technology, Electronic and Automation Control Conference (IAEAC), Chongqing, China, 12–14 March 2021; IEEE: New York, NY, USA, 2021; pp. 1609–1614. [Google Scholar]
  58. Kumar, A.; Sachar, S. Swarm Intelligence for Segmentation of Leaf Images. Natl. Acad. Sci. Lett. 2023, 46, 413–421. [Google Scholar] [CrossRef]
  59. Tang, Y.; Zhou, H.; Wang, H.; Zhang, Y. Fruit detection and positioning technology for a Camellia oleifera C. Abel orchard based on improved YOLOv4-tiny model and binocular stereo vision. Expert. Syst. Appl. 2023, 211, 118573. [Google Scholar] [CrossRef]
  60. Akbar, J.U.M.; Kamarulzaman, S.F.; Muzahid, A.J.M.; Rahman, M.A.; Uddin, M. A comprehensive review on deep learning assisted computer vision techniques for smart greenhouse agriculture. IEEE Access 2024, 12, 4485–4522. [Google Scholar] [CrossRef]
  61. Carlson, C.H.; Stack, G.M.; Jiang, Y.; Taşkıran, B.; Cala, A.R.; Philippe, G.; Rose, J.K.C.; Smart, C.D.; Smart, L.B. Morphometric relationships and their contribution to biomass and cannabinoid yield in hybrids of hemp (Cannabis sativa). J. Exp. Bot. 2021, 72, 7694–7709. [Google Scholar] [CrossRef] [PubMed]
  62. Zhao, Y.; Zhang, X.; Sun, J.; Yu, T.; Cai, Z.; Zhang, Z.; Mao, H. Low-cost lettuce height measurement based on depth vision and lightweight instance segmentation model. Agriculture 2024, 14, 1596. [Google Scholar] [CrossRef]
  63. Kamarianakis, Z.; Perdikakis, S.; Daliakopoulos, I.N.; Papadimitriou, D.M.; Panagiotakis, S. Design and Implementation of a Low-Cost, Linear Robotic Camera System, Targeting Greenhouse Plant Growth Monitoring. Future Internet 2024, 16, 145. [Google Scholar] [CrossRef]
  64. Story, D.; Kacira, M. Design and implementation of a computer vision-guided greenhouse crop diagnostics system. Mach. Vision Appl. 2015, 26, 495–506. [Google Scholar] [CrossRef]
  65. Sunoj, S.; Igathinathane, C.; Saliendra, N.; Hendrickson, J.; Archer, D.; Liebig, M. PhenoCam Guidelines for Phenological Measurement and Analysis in an Agricultural Cropping Environment: A Case Study of Soybean. Remote Sens. 2025, 17, 724. [Google Scholar] [CrossRef]
  66. Bhatti, M.T.; Gilani, H.; Ashraf, M.; Iqbal, M.S.; Munir, S. Field validation of NDVI to identify crop phenological signatures. Precis. Agric. 2024, 25, 2245–2270. [Google Scholar] [CrossRef]
  67. Anderson, S.L.; Pearson, B.; Kjelgren, R.; Brym, Z. Response of essential oil hemp (Cannabis sativa L.) growth, biomass, and cannabinoid profiles to varying fertigation rates. PLoS ONE 2021, 16, e0252985. [Google Scholar] [CrossRef]
  68. Yazici, L. Optimizing plant density for fiber and seed production in industrial hemp (Cannabis sativa L.). J. King Saud. Univ. Sci. 2023, 35, 102419. [Google Scholar] [CrossRef]
  69. Stramkale, V.; Andze, L.; Cernova, L.; Teirumnieka, E.; Filipova, I.; Stramkalis, A.; Teirumnieks, E.; Andzs, M. Industrial Hemp Variety Performance in Latvia Under Baltic Sea Climate. Agronomy 2024, 14, 2750. [Google Scholar] [CrossRef]
  70. Paliyanny, H.; Thinakaran, R.; Jalari, S.; Neerugatti, V.; Nalluri, M.R.; Cholla, R.R. Smart Agriculture: Enhancing Crop Management through IoT-Based Real-Time Monitoring and Automation. In Proceedings of the 2024 9th International Conference on Information Technology and Digital Applications (ICITDA), Nilai, Negeri Sembilan, Malaysia, 7–8 November 2024; IEEE: New York, NY, USA, 2024; pp. 1–5. [Google Scholar]
  71. Cosentino, S.L.; Testa, G.; Scordia, D.; Copani, V. Sowing time and prediction of flowering of different hemp (Cannabis sativa L.) genotypes in southern Europe. Ind. Crop. Prod. 2012, 37, 20–33. [Google Scholar] [CrossRef]
  72. Soares, C.; Carvalho, M.E.; Azevedo, R.A.; Fidalgo, F. Plants facing oxidative challenges—A little help from the antioxidant networks. Environ. Exp. Bot. 2019, 161, 4–25. [Google Scholar] [CrossRef]
  73. Goharrizi, K.J.; Amirmahani, F.; Salehi, F. Assessment of changes in physiological and biochemical traits in four pistachio rootstocks under drought, salinity and drought+ salinity stresses. Physiol. Plant 2020, 168, 973–989. [Google Scholar] [CrossRef]
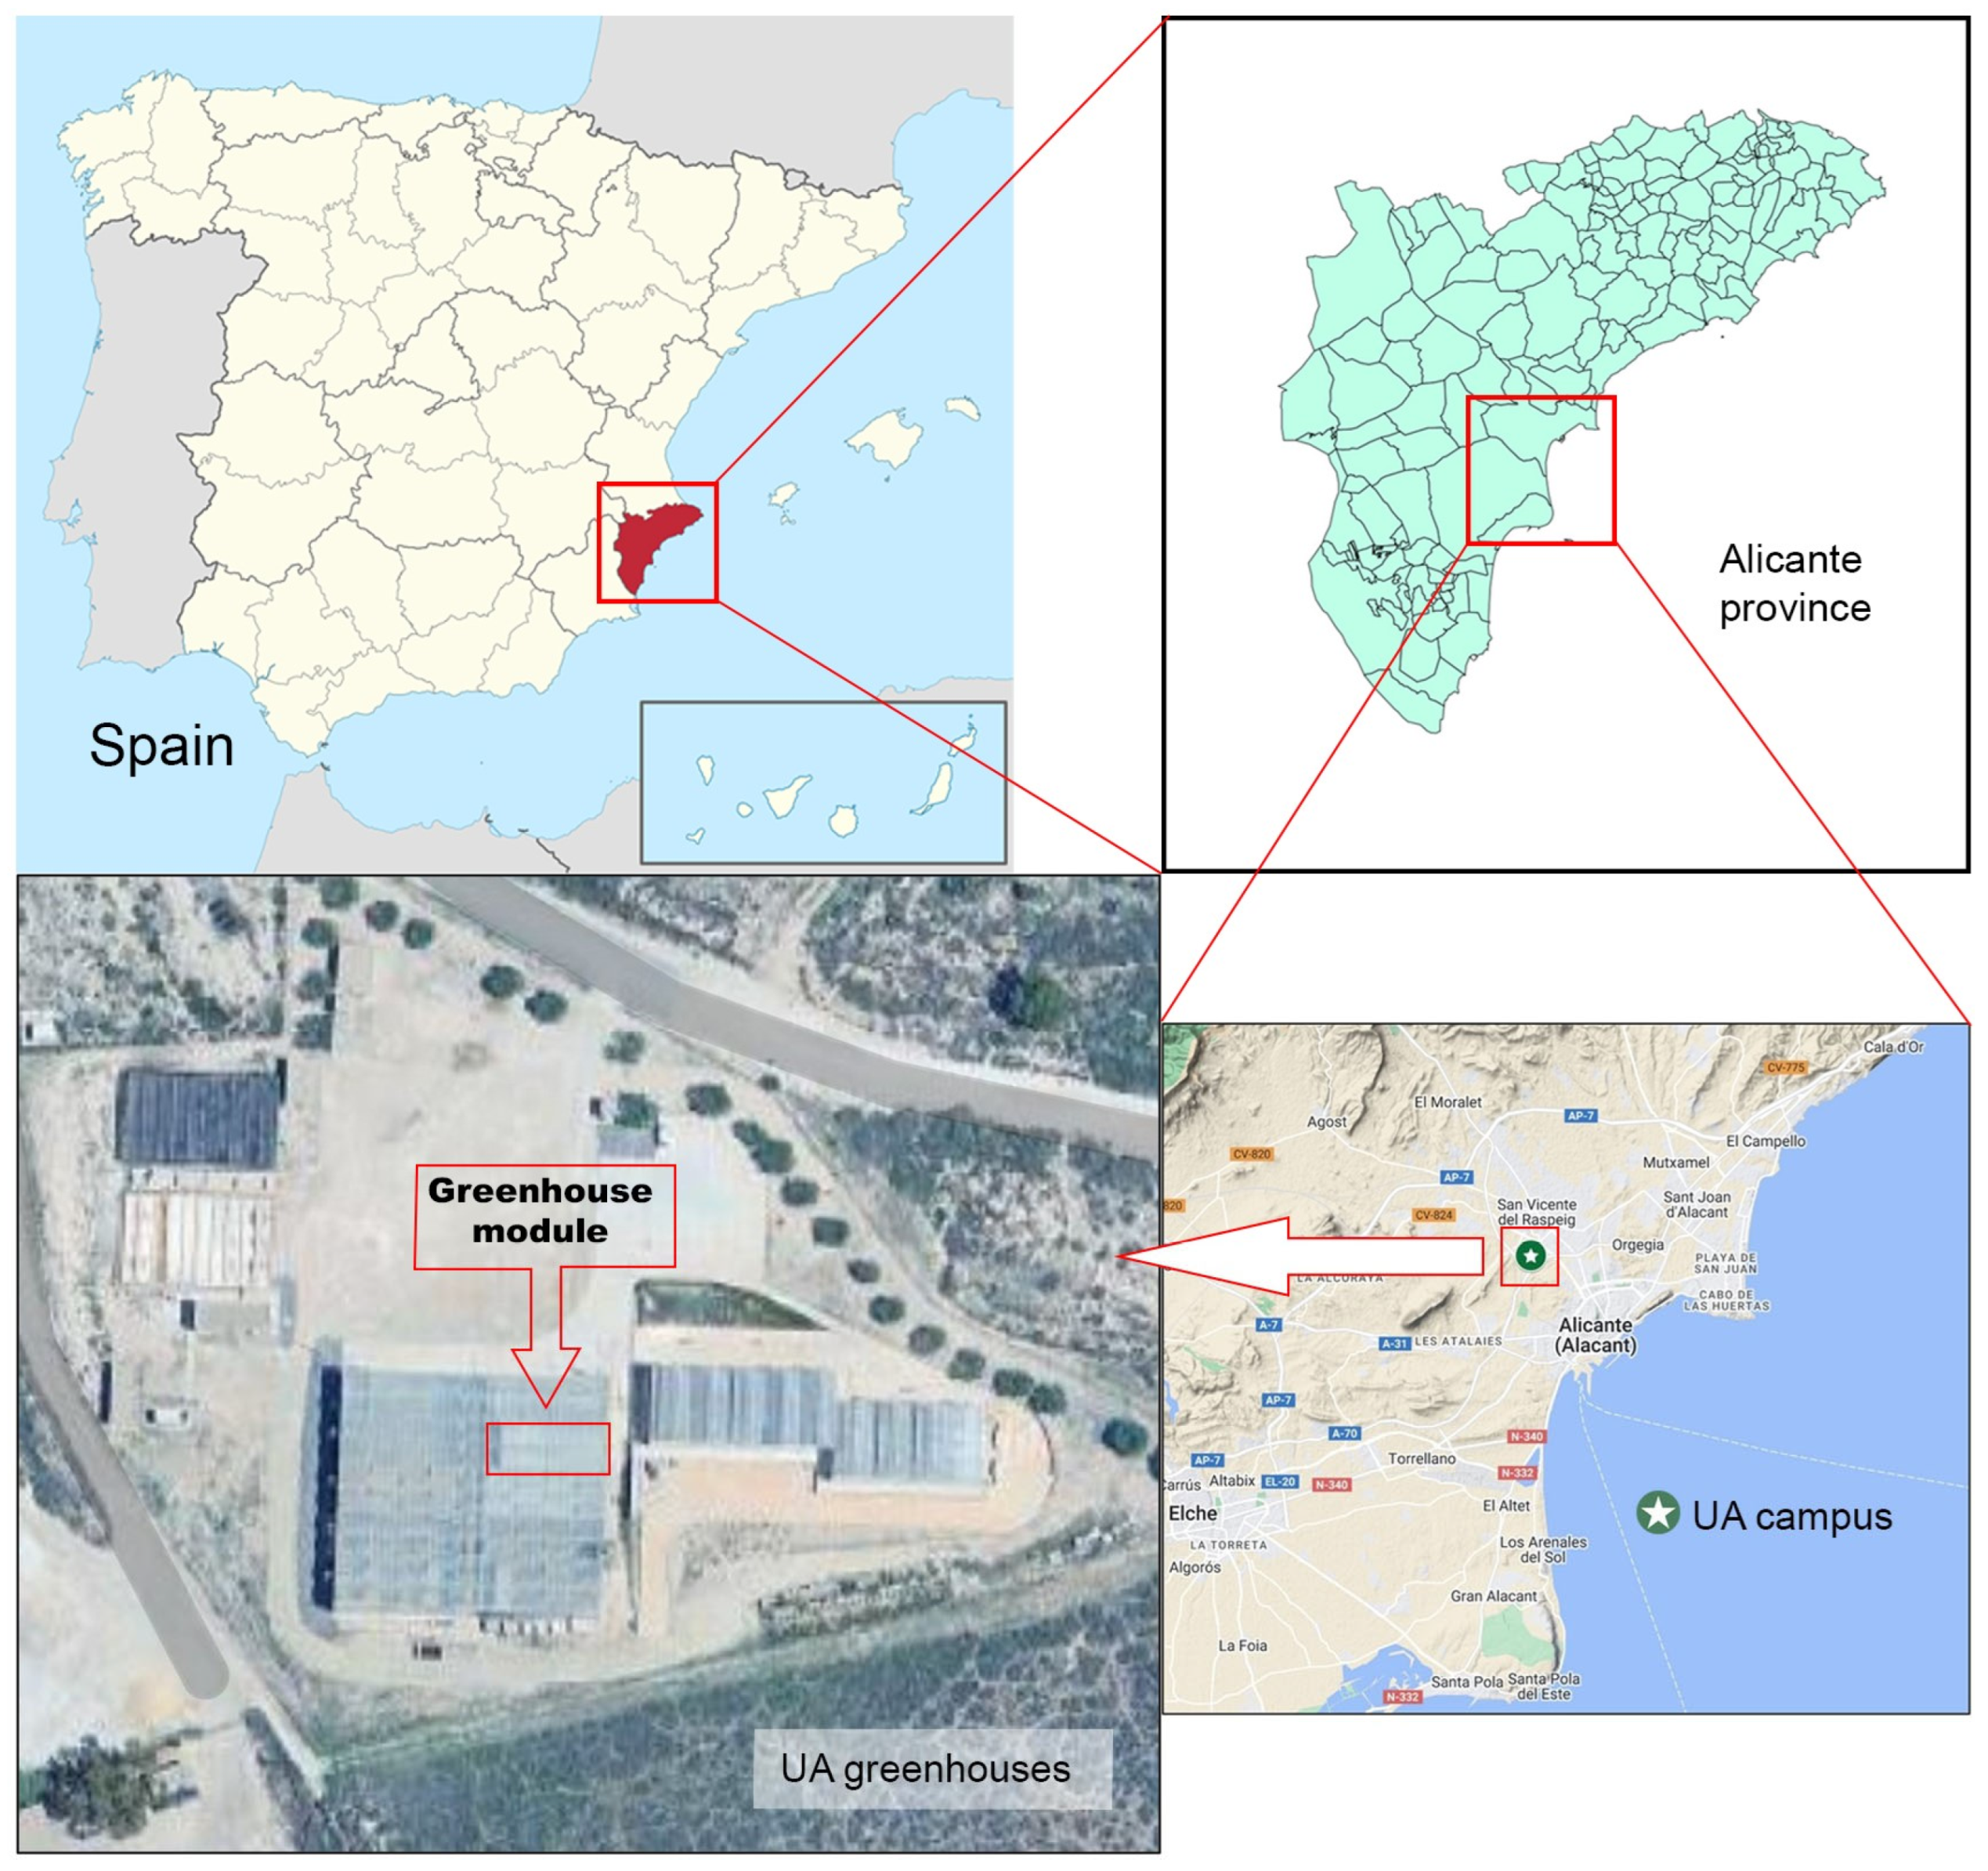
Figure 1. Location of experimental greenhouse module in UA greenhouses, Alicante province, Spain.
Agriengineering 07 00272 g001
Figure 2. (a) Temperature (red, °C), relative humidity (blue, %), and vapour pressure deficit (purple, hPa) of the air; (b) temperature (red, °C) and volumetric humidity (blue, %) of the substrate. Dashed lines represent the average values.
Agriengineering 07 00272 g002
Figure 3. (a) Plan view of the position and distance of the installed cameras; (b) details of the profile of each of the cameras and their position in relation to the crop.
Agriengineering 07 00272 g003
Figure 4. Schematic of plant image processing for the determination of plant height and geometric analysis.
Agriengineering 07 00272 g004
Figure 5. (a) Hemp plant at 1, 5, 10, 15, and 20 days after transplanting; (b) determination of the plant contour corresponding to each date.
Agriengineering 07 00272 g005
Figure 6. (a) Segmentation with k-means (k = 4) of the hemp plant at 1, 5, 10, 15, and 20 days after transplanting; (b) geometric analysis of the plant for each date.
Agriengineering 07 00272 g006
Figure 7. (a) Detection and segmentation with YOLO v11 of the hemp plant at 1, 5, 10, 15, and 20 days after transplanting; (b) geometric analysis of the plant for each date.
Agriengineering 07 00272 g007
Figure 8. (a) Growth curves of each tested plant from transplanting to 20 days after transplanting; (b) fitting of a linear (blue) and quadratic (red) regression to hemp growth.
Agriengineering 07 00272 g008
Figure 9. (a) Growth curves of each tested plant in terms of accumulated degree days since transplanting; (b) fitting of a linear (blue) and quadratic (red) regression to hemp growth in terms of accumulated degree days.
Agriengineering 07 00272 g009
Figure 10. Normalised confusion matrix of hemp plant water stress classification using YOLO v11.
Agriengineering 07 00272 g010
Figure 11. Hemp water stress classification results for the test set and heatmaps associated with activation maps corresponding to Grad-CAM.
Agriengineering 07 00272 g011
Table 1. Evaluation of hemp plant height growth using various approaches.
ApproachAlgorithm/ModelRMSE (cm)MAE (cm)
TraditionalCanny1.47 (0.57) 1,2 a1.39 (0.59) a
K-means1.54 (0.70) a1.41 (0.70) a
Deep learningYOLO v111.41 (0.58) a1.29 (0.54) a
1 Mean value of RMSE/MAE for each plant and the standard deviation in brackets. 2 Different letters indicate significant differences (Kruskal–Wallis, p < 0.05).
Disclaimer/Publisher’s Note: The statements, opinions and data contained in all publications are solely those of the individual author(s) and contributor(s) and not of MDPI and/or the editor(s). MDPI and/or the editor(s) disclaim responsibility for any injury to people or property resulting from any ideas, methods, instructions or products referred to in the content.