Abstract
This study applied geostatistics to analyze thermal images of the back surface of pigs’ ears (TSO) to understand how spatial temperature variability influences thermoregulation. The objective was to assess TSO variability in pigs housed under two climate control systems, namely, pens without cooling (BTEST) and with an evaporative cooling system (BECS), using infrared thermography and geostatistical tools. A total of 432 thermal images were obtained from 18 finishing pigs at 08:00, 12:00, and 16:00. Semivariograms were modeled and validated, and kriging maps were developed to visualize the spatial temperature distribution. The pens were thermally characterized using reclassified Temperature and Humidity Index (THI) values. The Gaussian model (R2 > 0.9) showed strong spatial dependence in temperature data. Pigs in the BECS system exhibited lower average TSO temperatures (28.2–38.6 °C) than those in the BTEST system, where temperatures exceeded 34 °C, highlighting the role of cooling in mitigating heat stress. In both systems, higher THI values were associated with increased TSO, indicating thermal discomfort under elevated environmental temperatures. Geostatistical analysis effectively revealed spatial patterns and variability in surface temperatures, providing key insights into how environmental conditions impact pigs’ thermal responses.
1. Introduction
The consumption of animal protein has grown significantly, making Brazil the fourth largest global consumer, according to the Brazilian Association of Animal Protein. In this context, pig farming stands out as an economically important activity, both for the domestic market and for exports, positioning Brazil among the largest global producers, with an output of approximately 5.1 million tons in 2023 [1].
One of the main concerns of consumers is ensuring the welfare of animals kept in confinement, which requires the adoption of ethical practices in animal production systems [2]. In its “Terrestrial Animal Health Code”, the World Organization for Animal Health (WOAH) establishes that animal welfare is related to an animal’s ability to adapt to the conditions in which it lives. According to Ref. [3], an animal is in good welfare conditions if scientific evidence shows that it is healthy, comfortable, well-fed, safe, able to express natural behavior, and free from negative sensations, such as pain, fear, or distress.
With the growth of pig production, animal comfort and welfare have been compromised by factors such as reduced space, limited movement, and changes in social interactions, contributing to problems related to thermal comfort, which negatively affect productivity [4]. In this sense, thermal comfort becomes essential for animal welfare, as it directly influences the health, productivity, and behavior of production animals [5].
An effective approach to quantifying animal welfare from a thermal perspective involves analyzing meteorological variables, such as air temperature, relative humidity, solar radiation, and wind speed [6]. Increases in ambient temperature can induce thermal stress in pigs, leading to adverse effects on their physiological responses, behavior, and feed intake, thus compromising the animals’ productive performance [7].
A growing trend in assessing confined animal production environments is the use of innovative, non-invasive methods that allow monitoring conditions without causing additional stress to the animals [8]. In animal science, infrared thermography has been widely adopted as a non-invasive alternative to evaluate the physiological and emotional state of animals [9].
Body temperature is an important indicator of pig health, and its alterations may signal physiological disturbances, indicate the early stages of infectious diseases during incubation—through elevated body temperature (a febrile response)—or reveal inadequate housing conditions, such as thermal stress [10]. Temperatures from specific areas of the animal, such as the ocular, auricular, frontal, tail, and udder regions, measured by infrared thermography, have been used to predict physiological parameters and assess stress in farm animals [11]. These regions are effective for thermal assessment due to their high density of blood vessels near the surface, absence or minimal presence of hair, and the presence of arteriovenous anastomoses, providing an approximation of the animal’s core body temperature [12].
Infrared thermography has proven to be a valuable non-invasive tool for detecting temperature changes in animals, with applications ranging from welfare assessment to early disease detection in livestock. Ref. [13] provides a comprehensive review of the current status and advances of this technology in livestock production and veterinary medicine, covering its physical principles, practical applications, and potential for improving animal management systems.
The temperature variation in the auricular region can reflect both environmental conditions and individual physiological factors that help in understanding the mechanisms of thermal regulation in pigs and cattle [14,15]. Studies have shown that measuring surface temperature, especially in these areas, can provide important information about health status and thermal stress in pigs [16].
In the study by ref. [17], the authors used thermal images of the ear back surface of newborn piglets, combined with machine learning models, to predict rectal temperature. The results highlight that the ear back region has the potential to be used as a non-invasive monitoring area for rectal temperature in these animals.
The auricular region of animals exhibits a peculiar characteristic in relation to body temperature variation, being able to record changes more quickly and noticeably than other parts of the body due to the high concentration of blood vessels near the skin’s surface. This facilitates a more immediate response to changes in blood flow and heat dissipation, making it a sensitive and effective indicator for monitoring body temperature variations, providing a valuable tool for thermoregulation studies [18]. The back of the ear is selected as the scanning site due to its high density of superficial blood vessels, minimal hair coverage, and presence of arteriovenous anastomoses, which facilitate rapid heat exchange with the environment and make it a validated, non-invasive indicator of thermal stress in pigs.
Thermal imaging has proven to be a valuable resource in the continuous assessment of the ear back surface temperature in pigs, using infrared cameras that allow the collection of accurate data on surface temperature, efficiently monitoring large groups of animals [19].
However, for a more comprehensive and accurate analysis, it is essential to consider not only the temperature point values but also the spatial variability in these data. In this context, geostatistics emerges as a powerful approach, allowing a detailed characterization of the spatial patterns of temperatures on the ear back surface of pigs [20].
Geostatistics is not limited to describing spatial variability; it also offers robust methods for interpolating and predicting temperatures in unsampled locations, providing a broader and more representative view of thermal conditions in pigs [21]. Techniques such as kriging not only map the spatial distribution of temperatures but also quantify the uncertainty associated with these estimates, providing a solid basis for decisions related to thermal management and animal welfare [22].
A better understanding of these thermal patterns not only enhances our knowledge of pigs’ thermal comfort but also significantly contributes to the development of more effective environmental and sanitary management strategies in pig production [23].
Thus, this study explores the application of geostatistics in the analysis of thermal images of the ear back surface in pigs, investigating how the spatial variability in temperatures can influence the thermoregulatory responses of these animals.
2. Materials and Methods
2.1. Geographical Location and Facilities
The database used in this research was obtained from records taken during the second half of 2023 at the Swine Experimentation Bioterium of the Academic Unit of Serra Talhada (BES-UAST) of the Federal Rural University of Pernambuco. It is located in the municipality of Serra Talhada, in the Sertão Mesoregion and Pajeú Microregion, in the state of Pernambuco, Brazil (longitude 07°57′01′′ S; latitude 38°17′53′′ W, and altitude of 523 m) (Figure 1).
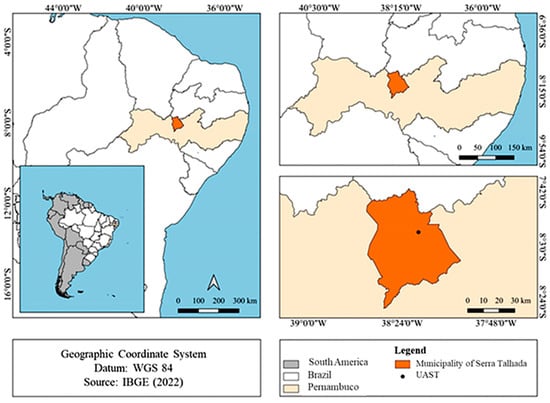
Figure 1.
Location of the experimental station in Serra Talhada, Pernambuco, Brazil.
According to the Köppen climate classification, the region’s climate is characterized as BShw’ semi-arid, hot, and dry, with rainfall occurring between December and May. The annual averages for rainfall, temperature, and relative humidity in the region are 642.1 mm, 24.8 °C, and 62.5%, respectively [24].
The animals were housed in an experimental masonry barn, oriented east–west, with pens covered by ceramic tile on a single-sloped roof, a ceiling height of 2.5 m, and a concrete floor. The corridor between the pens was covered by a fibrocement roof with a 4.5 m ceiling height and an uncovered floor (bare soil). The total area was 330 m2, with six 2 × 3 m pens, each containing 3 pigs, for a total of 18 animals. The pigs were subjected to the following variation factors: 3 pens without climate control (BTEST) and 3 pens with an evaporative cooling system (BECS).
In the pens equipped with the evaporative cooling system, an evaporative cooler was used, generating mist through the centrifugal effect of a central disk, with an average flow rate of 3 L/h. The equipment featured independent motors, with the fan blade operating at 1750 RPM and the central disk at 3450 RPM. In the other pens, only natural ventilation was used.
During the entire experimental period, meteorological variables inside and outside the facilities, as well as the animals’ physiological responses, were recorded. A datalogger was installed at the geometric center of the pens, at a height of 0.6 m from the floor. Outside, the datalogger was installed inside a weather shelter at 1.50 m above the ground. Data were recorded and stored every 10 min to generate hourly averages throughout the experimental period. The meteorological variables recorded in the pens and external environment included air temperature (Tair, °C), relative humidity (RH, %), and black globe temperature (Tgn, °C).
The thermal characterization of the pens was conducted through a reclassification of the Temperature and Humidity Index (THI) proposed by ref. [25], adapted for pigs. This reclassification considered the minimum value of the optimal temperature (15 °C), the upper critical temperature (27 °C), the average values of the thermoneutral zone for the finishing phase (15 to 18 °C), according to ref. [26], and the relative humidity range between 50 and 70%. Subsequently, the THI was estimated using Equation (1).
where
Tbs—dry bulb temperature (°C) and Tdp—dew point temperature (°C).
2.2. Thermal Image Acquisition
This research was approved by the CEUA/UFRPE (Ethics Committee on Animal Use of the Federal Rural University of Pernambuco) under protocol 23082.021090/2016-81. The experiment was conducted from August to December 2023, totaling 92 days of data collection. A total of 18 pigs (males and females) in the growth and finishing phases (64 to 138 days of age), from commercial line sows selected for high muscle mass deposition (¾ Duroc, ¼ Pietrain), born at BES-UAST, in their third parity, and covered by a purebred Duroc boar, were used. All females were prepubertal and not in estrus or gestation during the study.
Thermal images were captured using a FLIR i60 infrared thermographic camera (thermal resolution: 320 × 240 pixels; accuracy: ±2 °C), equipped with a 25° lens. The emissivity was set to 0.97, as recommended for biological tissues [27]. The camera was calibrated before each measurement session according to the manufacturer’s guidelines. Ambient temperature and relative humidity were measured at the time of image capture using a digital thermo-hygrometer, and these values were entered into FLIR Tools® software version 5.13. FLIR i60 operates at a frame capture rate of 9 Hz (approximately 9 frames per second). Images were acquired in shaded areas to avoid direct solar radiation, at a fixed distance of 1 m from each animal, with a capture rate of one image per second. For each pig, three images were taken at each time point (08:00, 12:00, and 16:00 h) on the following dates: 09/13, 09/20, 09/27, 10/04, 10/11, 10/18, 10/25, and 11/01/2023. The clearest image without motion artifacts was selected for analysis. In total, 216 thermal images were obtained for each treatment (BTEST and BECS), resulting in 432 images analyzed. Representative RGB and thermal images for the BTEST treatment are shown in Figure 2, and for the BECS treatment in Figure 3.
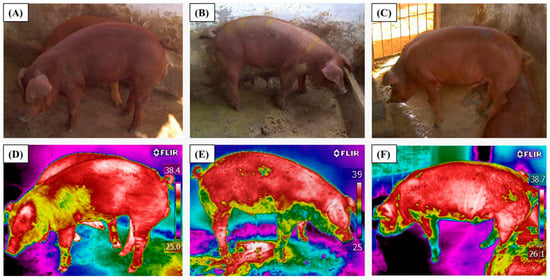
Figure 2.
Animals used in the study: RGB images (A–C) and thermal images (D–F) under the treatment without ventilation (BTEST).
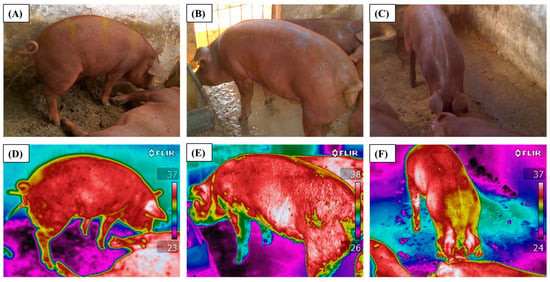
Figure 3.
Animals used in the study: RGB images (A–C) and thermal images (D–F) under the treatment with evaporative cooling (BECS).
2.3. Statistical and Geostatistical Analyses Procedures
From the thermographic images, matrices of the ear back region of the pigs were extracted, totaling 4050 pixels (45 × 90) and an area of 101,250 mm2. This area took into account the spatial resolution of the matrix in Dots per Inch (DPI), which represents the number of points found in one inch of a given image [28]. The points in this matrix were spaced 5 mm apart, resulting in a final matrix of 225 × 450 mm, as shown in the example schematic representation of a sample matrix in Figure 4.
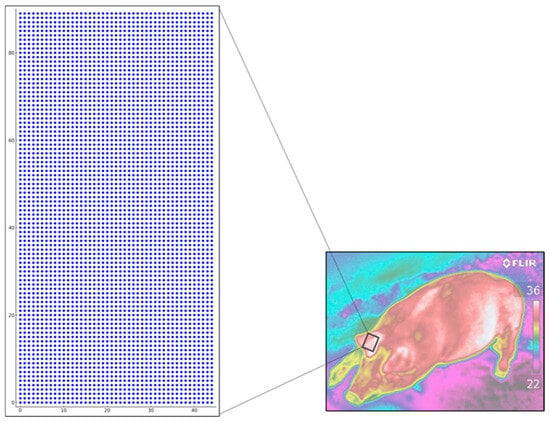
Figure 4.
Representation of a 45 × 90 mm sample matrix extracted from the thermal images of the ear back surface region (TSO).
The temperature data from the ear back surface region (TSO), obtained through the thermal images, were evaluated using descriptive statistics, determining measures of central tendency (mean and median) and measures of dispersion (standard deviation and coefficient of variation) using R software (R Core Team, 2023) through RStudio (version 2023.12.1 Build 402; © 2009–2024 Posit Software, PBC).
For comparison purposes, the coefficient of variation (CV) limits proposed by ref. [29] were adopted for classifying the variability in the analyzed attributes as follows: CV ≤ 12%, 12% < CV ≤ 24%, and CV > 24%, considered low, medium, and high variability, respectively.
The geostatistical analysis was performed based on the calculation of classical semivariances, using Equation (2), which estimates the structure and spatial dependence between pairs of observations.
where γ(h)—experimental semivariance, obtained from the sampled values Z(Xi); Z(Xi + h); N(h)—number of pairs of measured values; h—distance between sample pairs; and Z(Xi) and Z(Xi + h)—values of the i-th observation of the regionalized variable, collected at points Xi and Xi + h (i = 1,…, n), separated by the vector h.
The analysis of spatial dependence was carried out through the adjustment of theoretical semivariograms to estimate the model coefficients (nugget effect, C0; sill, C0 + C; and range, A). The tool used for geostatistical analysis was GS+ 7.0 [30], which enabled the generation of experimental semivariograms and the testing of Gaussian, Spherical, Exponential, and Linear models. The best models were chosen by analyzing the R2 value, and cross-validation was performed using the Jack-Knifing criterion by ref. [31], where errors with a mean close to zero and a standard deviation close to one indicated the best fit quality.
To analyze the degree of spatial dependence (DSD) of the ear back surface temperature, the classification suggested by ref. [32] was used, where semivariograms are considered to have strong spatial dependence (St) when the nugget effect is ≤25% of the sill, moderate spatial dependence (Md) when the nugget effect is between 25% and 75%, and weak spatial dependence (Wk) when the nugget effect is >75%.
3. Results
3.1. Micrometeorological Characterization
Figure 5 presents the average values of air temperature (Tair_ext, °C) and relative humidity (RH_ext, %) recorded in the external environment throughout the experimental period.
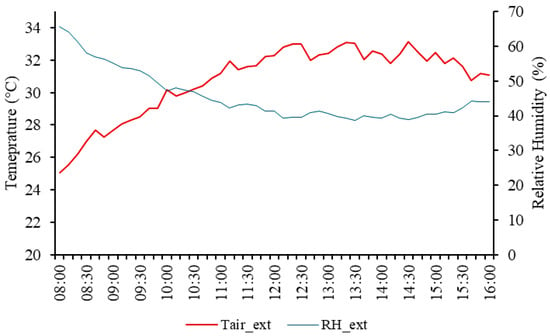
Figure 5.
Hourly average of the external air temperature (Tair_ext, °C) and relative humidity (RH_ext, %) in the external environment throughout the experimental period.
During the experimental period, the average air temperature was 30.76 °C, ranging from 25.04 °C at 8:00 AM to 33.16 °C at 2:30 PM. The average relative humidity was 45.50%, with a minimum of 38.67% at 1:30 PM and a maximum of 65.74% around 8:00 AM. At 12:00 PM, the recorded values were 32.25 °C for air temperature (Tair) and 41.30% for relative humidity (RH). At 4:00 PM, the readings were 31.10 °C for air temperature and 43.96% for relative humidity.
The thermal comfort characterization of the pens at 8:00 AM, 12:00 PM, and 4:00 PM was evaluated using the THI reclassification for pigs developed in this study and proposed by ref. [20], as presented in Table 1.

Table 1.
THI reclassification for pigs.
The reclassification of the THI for pigs considered critical values of air temperature and humidity specific to this species, as described by ref. [26]. The limit for the cold stress class was defined based on the minimum optimal temperature (15 °C), while the comfort class was determined by the average thermoneutral zone for finishing pigs (16.5 °C). The thresholds for the alert and emergency phases were established based on the variation in the upper critical temperature (27 °C). The humidity range considered varied between 50% and 70%.
The results presented highlight the effectiveness of cooling in maintaining thermal comfort in the pens, as reflected by the THI values (Figure 6). In the pens with cooling (BECS), the THI values ranged from 71.4 to 76.1, remaining within the comfort zone at all times analyzed. In contrast, in the pens without cooling (BTEST), the THI was comfortable only at 8:00 AM (72.6) but reached critical levels throughout the day, especially at 12:00 PM when the THI reached 80.9, classified as an emergency state. At 4:00 PM, the THI was 78.4, indicating an alert state.
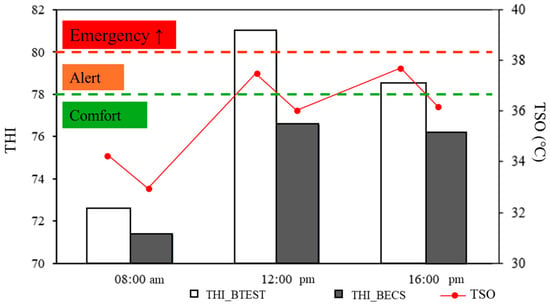
Figure 6.
THI reclassification in the animal pens and TSO.
The meteorological variables collected inside the pens where the animals were housed and exposed to two sources of variation, BTEST (without cooling) and BECS (with cooling), are presented in Table 2.

Table 2.
Average air temperatures and relative humidity inside the pens.
According to Table 2, the air temperatures and humidity levels inside the pens subjected to the BTEST and BECS treatments at 8:00 AM were within the optimal limits for growing pigs, as stated by ref. [33]. The authors define a comfortable temperature range for growing pigs between 20 and 27.0 °C and consider temperatures above 27.3 °C as critical. Based on this parameter, it can be inferred that the animals in the BTEST treatment were exposed to thermal stress starting at 12:00 PM, when the temperature exceeded 27 °C, indicating the need for cooling strategies to maintain animal welfare.
At noon (12:00 PM), the differences between the treatments became more pronounced. In BTEST, the air temperature (Tair) reached 31.4 °C, while in BECS, the temperature was significantly lower, recording 26.9 °C. This result highlights the effectiveness of evaporative cooling in mitigating the effects of heat during the hottest period of the day. The relative humidity (RH) in BECS rose to 83.2%, compared to 58.8% in BTEST, reflecting the increase in humidity associated with evaporative cooling.
In the late afternoon (4:00 PM), the Tair in BTEST dropped to 29.0 °C, while in BECS, the temperature remained lower at 26.0 °C. The RH in BCES continued to rise, reaching 88.9%, compared to 66.0% in BTEST.
3.2. Results of Statistical and Geostatistical Analyses
The descriptive statistics for the ear back surface temperature (TSO) of the pigs, extracted from the thermal images, are presented in Table 3 under their respective treatments (BTEST, without cooling; BECS, with evaporative cooling) and times of recording.

Table 3.
Descriptive statistics for the ear back surface temperature (TSO) of pigs.
When comparing the two treatments, it is observed that the average temperatures for the BTEST treatment are consistently higher across all three time points (08:00, 12:00, 16:00), with a maximum average of 37.8 °C recorded at 4:00 PM. In contrast, the BECS treatment shows lower surface average temperatures, with a maximum average of 36.4 °C at 4:00 PM, indicating that evaporative cooling is effective in mitigating high surface temperatures. This result suggests that in the BTEST treatment, the absence of cooling leads to greater heat retention in the pigs’ ear back surface region (TSO), particularly during the hottest parts of the day.
The temporal analysis reveals that the difference in TSO between the BTEST and BECS treatments is most pronounced at 8:00 AM, with averages of 34.4 °C in BTEST and 33.7 °C in BECS. This initial difference reflects the influence of evaporative cooling on thermal control early in the day, when thermal load has not yet reached its peak. Regarding the coefficient of variation (CV), in both the BTEST and BECS treatments, the temperature of the pig’s ear back surface (TSO) showed low variability, according to ref. [29], which categorizes data variability as low (CV < 12%), medium (12% < CV < 24%), and high (CV > 24%).
Among all the geostatistical models generated, each showed a coefficient of determination (R2) greater than 0.9, indicating a good fit to the experimental data. According to the Jack-Knifing technique [31], all the adopted models were validated, with means close to 0 (zero) and standard deviations close to 1.0 (one) (Table 4).

Table 4.
Semivariogram model and degree of spatial dependence (DSD) for the average temperature of the ear back surface (TSO, °C) for the two evaluated treatments: BECS and BTEST.
The analysis of the geostatistical models presented in Table 4 demonstrates an effective application of concepts widely discussed in the geostatistics literature, such as those by ref. [34,35]. The coefficients of determination (R2) greater than 0.9 indicate a strong correlation between the experimental data and the fitted models.
The predominance of the Gaussian model reflects its characteristic of smoothing spatial transitions, effectively capturing spatial structures with smooth continuity. This behavior is expected in environmental variables like temperature, where spatial changes are generally not abrupt.
The degree of spatial dependence (DSD), according to the classification by ref. [32], indicates that in both the BECS and BTEST treatments, the spatial variability in the TSO ranges between moderate and strong. In the BTEST treatment, across all three time points (8:00, 12:00, 16:00), the DSD values indicate strong spatial dependence (DSD < 25%). This suggests that even without cooling, there is a significant spatial structure in temperature variability, with less random variability.
In the BECS treatment, the moderate spatial dependence (25% < DSD ≤ 75%) observed across all three time points suggests that evaporative cooling introduces thermal uniformity but still allows a significant portion of variability to be explained by the spatial structure.
The relatively low nugget effect (C0), in contrast to the sill (C0 + C), indicates that spatial variability predominates over non-spatial or random variability. The range (A) of the semivariograms, defining the maximum distance of spatial correlation, varying between 55.07 and 96.64, is consistent with the literature that discusses the importance of range in defining zones of spatial influence [36]. The range determines how far an observation influences other observations in the neighborhood, being crucial for future sampling planning and the implementation of differentiated management zones.
The validation of the models using the Jack-Knifing technique showed means close to zero and standard deviations close to one, indicating that the models are statistically robust and do not present significant bias.
The kriging maps of the ear back surface region (TSO, °C) of the pigs in the two treatments evaluated, BTEST and BECS, are presented in Figure 7.
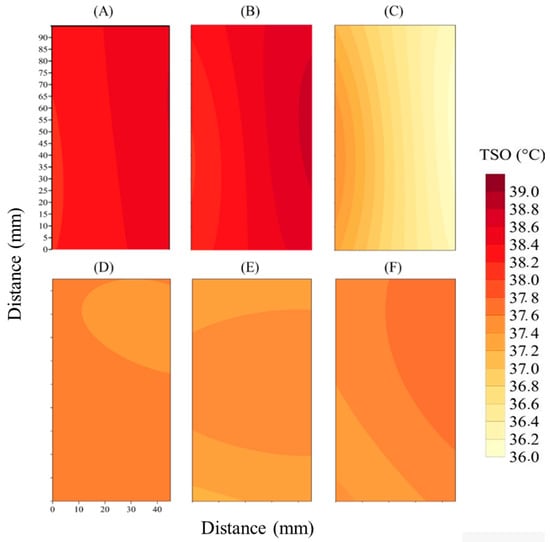
Figure 7.
Kriging maps of the ear back surface region (TSO, °C) of pigs in the BTEST treatment at 8:00 AM (A), 12:00 PM (B), and 4:00 PM (C) and in the BECS treatment at 8:00 AM (D), 12:00 PM (E), and 4:00 PM (F).
The kriging map for 8:00 AM in Figure 7A shows a relatively uniform thermal distribution with elevated TSO temperatures from the start of the day, indicating that the absence of climate control leaves the pigs exposed to the environment, where thermal conditions directly depend on external variables. At noon in Figure 7B, the intensification of high-temperature areas reflects the accumulation of heat typical in non-climatized systems. In the late afternoon in Figure 7C, temperatures remain high, suggesting that the heat accumulated throughout the day has not dissipated, exacerbating adverse conditions.
The kriging map for the evaporative cooling treatment at 8:00 AM in Figure 7D shows a more homogeneous thermal distribution with lower temperatures compared to the BTEST treatment. This reflects the effect of evaporative cooling in maintaining lower and more uniform temperatures, even in the early hours of the day. At noon in Figure 7E, the TSO remains relatively homogeneous with less thermal intensity compared to the non-climatized treatment. Evaporative cooling proves efficient in preventing the abrupt temperature increase observed in BTEST. At 4:00 PM in Figure 7F, the map shows that evaporative cooling continues to be effective, maintaining relatively stable temperatures.
Overall, the kriging maps clearly demonstrate the advantages of evaporative cooling (BECS) in maintaining a more controlled and predictable thermal environment, resulting in less TSO temperature variation throughout the day. The recent literature supports the idea that climate control, especially in hot regions and seasons, is essential for reducing thermal stress in pigs, improving their welfare, and optimizing productive efficiency. In contrast, the treatment without climate control (BTEST) exposes the animals to significant thermal variations, with the potential to seriously compromise their welfare and performance.
4. Discussion
The findings from this study highlight the critical influence of environmental conditions on pig thermal comfort and underscore the importance of effective climate control strategies. The Temperature and Humidity Index (THI) reached an emergency level of 80.9 at 12:00 PM in the pens without cooling (BTEST), a threshold strongly associated with physiological stress responses in pigs, such as increased respiratory rate, reduced feed intake, and heightened mortality risk [37,38].
The positive correlation between THI and the ear back surface temperature (TSO) reinforces the validity of TSO as a sensitive physiological indicator of thermal stress. In both treatments (BECS and BTEST), increased THI values led to elevated TSO, particularly in the BTEST pens where cooling was absent. This result confirms that high ambient temperatures, especially in uncooled environments, induce thermal discomfort, as pigs are highly sensitive to thermal fluctuations [12]. The difference observed between morning and afternoon TSO measurements can be partially explained by the phenomenon of delayed thermal accumulation, in which the animal’s body temperature progressively rises throughout the day due to continuous exposure to heat load. This process, combined with pigs’ limited capacity for evaporative heat loss, results in more pronounced vasodilation in the auricular region during the afternoon, increasing surface temperature compared to morning measurements. This physiological explanation reinforces the biological relevance of the spatial patterns identified through geostatistical analysis.
Although evaporative cooling proved effective in reducing air temperature and stabilizing TSO, it also significantly increased relative humidity (RH). While elevated RH can support thermal comfort by reducing ambient temperatures, it may also impair evaporative heat loss—a key thermoregulatory mechanism in pigs—especially when RH and temperature simultaneously exceed comfort thresholds [38,39,40].
Geostatistical analysis validated the spatial consistency and predictability of TSO patterns. The Gaussian model showed excellent fit (R2 > 0.9) across treatments and times, reflecting smooth spatial transitions characteristic of temperature fields [22,36]. The strong spatial dependence observed in BTEST (DSD < 25%) indicates persistent spatial structure even without artificial climate control, likely driven by environmental heterogeneity, such as airflow and solar radiation patterns [41]. In BECS, moderate spatial dependence (25% < DSD ≤ 75%) suggests improved thermal homogeneity while retaining some spatial variability.
These findings are consistent with results reported by ref. [20,42], who also observed the effectiveness of Gaussian semivariogram models in identifying spatial variability in surface temperature under different climate strategies. The low nugget effect observed supports the dominance of structured spatial variability over random variation, indicating that geostatistical modeling can be reliably applied to inform localized cooling interventions [43].
The kriging maps corroborated these conclusions visually. In the BTEST pens, heat accumulation led to increasingly heterogeneous and elevated TSO values throughout the day, aligning with previous studies that link heat buildup to impaired performance and welfare in pigs [44,45,46]. In contrast, the BECS treatment maintained more stable and uniform TSO conditions, even during peak heat hours. This pattern supports prior findings that evaporative cooling systems are effective in mitigating thermal stress and preserving productivity [47,48,49].
Together, these results emphasize the value of integrating geostatistical analysis with thermal imaging and climate data to better understand and manage thermal environments in pig production systems. Climate control not only improves animal welfare but also enhances environmental predictability, enabling more precise and responsive farm management strategies. A limitation of this study is the relatively small sample size (n = 18), which, while sufficient for the intended experimental design and geostatistical analyses, may limit the generalizability of the findings. Future studies with larger populations are recommended to validate and expand these results.
An additional approach that could enhance the interpretation of thermoregulatory responses in pigs is the measurement of the temperature difference between the ear back surface and a representative body site, such as the mid-dorsal region. This “delta temperature” could serve as a relative biometric index, essentially using the animal as its own thermostat, and may provide a more robust and individualized parameter for assessing thermal comfort. Future studies should explore this methodology to complement single-site surface temperature measurements.
5. Conclusions
The remote monitoring of thermal comfort in pigs, using thermal imaging focused on temperature variation in the ear back region, has proven to be an effective alternative to traditional methods such as measuring respiratory rate and rectal temperature. Geostatistical analysis, through semivariograms and kriging maps, allowed for the identification of spatial temperature variability in this region, which is essential for understanding pigs’ thermoregulatory responses. The evaporative cooling in the BECS treatment proved to be more efficient in maintaining a uniform thermal distribution, reducing thermal stress, and minimizing the activation of physiological heat dissipation mechanisms, such as vasodilation.
The application of thermal imaging and geostatistical techniques in pig farming provides a non-invasive tool for monitoring animal welfare, reducing stress associated with direct contact. The continuous use of thermal cameras allows for the rapid detection of thermal variations and the adjustment of environmental conditions, such as ventilation and cooling, before the animals reach critical levels of stress. This significantly contributes to enhancing the welfare of pigs and optimizing productivity in farming operations.
This study demonstrates that the ear back surface temperature (TSO), obtained via infrared thermography, is a sensitive and effective indicator of thermal comfort in pigs. The integration of geostatistical analysis with thermal imaging and climate data provides a powerful approach for identifying spatial patterns and variability in animal thermal responses, offering valuable insights for climate management in pig production systems. Although the FLIR i60 camera used in this research is a handheld device, the findings highlight the potential applicability of infrared thermography for remote monitoring when implemented through automated or fixed thermal imaging systems, in line with recent advances in precision livestock farming and developments in thermal imaging techniques for assessing livestock health [50].
The sample size (n = 18) may limit the generalizability of the findings. Measuring the temperature difference between the ear back surface and a representative body site, such as the mid-dorsal region, could serve as a relative biometric index—using the animal as its own thermostat—and provide a more robust parameter for assessing thermal comfort.
Future studies with larger populations and automated thermal monitoring systems are recommended to validate and expand these results.
Author Contributions
Conceptualization, T.C.S., C.G. and H.P.; methodology, T.C.S., H.P. and M.A.S.; software, T.C.S. and M.A.S.; validation, R.B.V., J.A.D.B.F., R.G.F.S. and H.P.; formal analysis, T.C.S., M.A.S. and L.D.d.L.; investigation, T.C.S., C.G. and H.P.; resources, C.G. and H.P.; data curation, T.C.S., M.A.S. and H.P.; writing—original draft preparation, T.C.S., C.G. and H.P.; writing—review and editing, H.P., C.G. and J.J.d.M.S.; visualization, T.C.S., L.D.d.L. and M.d.F.A.A.; supervision, H.P. and C.G.; project administration, T.C.S., C.G. and H.P.; funding acquisition, C.G. All authors have read and agreed to the published version of the manuscript.
Funding
This research received no external funding.
Data Availability Statement
The original contributions presented in this study are included in the article. The thermal images and derived matrices generated during the study are available from the corresponding author upon reasonable request.
Acknowledgments
The authors would like to thank the Graduate Program in Agricultural Engineering (PGEA) and the Research Group on Agricultural Environment (GPESA) of the Federal Rural University of Pernambuco (UFRPE) for supporting the development of this research. We also acknowledge the Coordination for the Improvement of Higher Education Personnel (CAPES—Finance Code 001) and the Foundation for the Support of Science and Technology of the State of Pernambuco (FACEPE) for funding the scholarships.
Conflicts of Interest
The authors declare no conflicts of interest.
References
- ABPA-Associação Brasileira de Proteína Animal Relatorio Anual. 2024. Available online: https://abpa-br.org/wp-content/uploads/2024/04/ABPA-Relatorio-Anual-2024_capa_frango.pdf (accessed on 4 March 2025).
- Galvão, A.T.; da Silva, A.D.S.L.; Pires, A.P.; de Morais, Á.F.F.; Mendonça Neto, J.S.N.; de Azevedo, H.H.F. Bem-Estar Animal na Suinocultura: Revisão. Pubvet 2019, 13, a289. [Google Scholar] [CrossRef]
- WOAH. Terrestrial Animal Health Code. Available online: https://www.woah.org/en/what-we-do/standards/codes-and-manuals/terrestrial-code-online-access/ (accessed on 28 March 2023).
- Damasceno, F.A.; Magela Soares, C.; Eduardo, C.; Oliveira, A.; Freire, L.; Damasceno, B.; Ferreira, P.; Ferraz, P. Evaluation of Behavior in Piglets Using Digital Image Processing. Energ. NA Agric. 2019, 34, 217–229. [Google Scholar] [CrossRef]
- Kumar, P.; Ahmed, M.A.; Abubakar, A.A.; Hayat, M.N.; Kaka, U.; Ajat, M.; Goh, Y.M.; Sazili, A.Q. Improving Animal Welfare Status and Meat Quality through Assessment of Stress Biomarkers: A Critical Review. Meat Sci. 2023, 197, 109048. [Google Scholar] [CrossRef]
- Gonzalez-Rivas, P.A.; Chauhan, S.S.; Ha, M.; Fegan, N.; Dunshea, F.R.; Warner, R.D. Effects of Heat Stress on Animal Physiology, Metabolism, and Meat Quality: A Review. Meat Sci. 2020, 162, 108025. [Google Scholar] [CrossRef] [PubMed]
- Godyń, D.; Herbut, P.; Angrecka, S.; Vieira, F.M.C. Use of Different Cooling Methods in Pig Facilities to Alleviate the Effects of Heat Stress—A Review. Animals 2020, 10, 1459. [Google Scholar] [CrossRef] [PubMed]
- Nääs, I.A.; Garcia, R.G.; Caldara, F.R. Infrared Thermal Image for Assessing Animal Health and Welfare. J. Anim. Behav. Biometeorol. 2020, 2, 66–72. [Google Scholar] [CrossRef]
- Ricci, G.D.; da Silva-Miranda, K.O.; Titto, C.G. Infrared Thermography as a Non-Invasive Method for the Evaluation of Heat Stress in Pigs Kept in Pens Free of Cages in the Maternity. Comput. Electron. Agric. 2019, 157, 403–409. [Google Scholar] [CrossRef]
- Süli, T.; Halas, M.; Benyeda, Z.; Boda, R.; Belák, S.; Martínez-Avilés, M.; Fernández-Carrión, E.; Sánchez-Vizcaíno, J.M. Body Temperature and Motion: Evaluation of an Online Monitoring System in Pigs Challenged with Porcine Reproductive & Respiratory Syndrome Virus. Res. Vet. Sci. 2017, 114, 482–488. [Google Scholar] [CrossRef]
- Ghezzi, M.D.; Napolitano, F.; Casas-Alvarado, A.; Hernández-Ávalos, I.; Domínguez-Oliva, A.; Olmos-Hernández, A.; Pereira, A.M.F. Utilization of Infrared Thermography in Assessing Thermal Responses of Farm Animals under Heat Stress. Animals 2024, 14, 616. [Google Scholar] [CrossRef]
- Mota-Rojas, D.; Titto, C.G.; Orihuela, A.; Martínez-Burnes, J.; Gómez-Prado, J.; Torres-Bernal, F.; Flores-Padilla, K.; Carvajal-De la Fuente, V.; Wang, D. Physiological and Behavioral Mechanisms of Thermoregulation in Mammals. Animals 2021, 11, 1733. [Google Scholar] [CrossRef]
- Luzi, F.; Mitchell, M.; Nanni Costa, L.; Redaelli, V. Thermography: Current Status and Advances in Livestock Animals and in Veterinary Medicine; Fondazione Iniziative Zooprofilattiche e Zootecniche: Brescia, Italy, 2013; pp. 1–216. ISBN 978-88-97562-06-1. [Google Scholar]
- Jia, G.; Li, W.; Meng, J.; Tan, H.; Feng, Y. Non-Contact Evaluation of Pigs’ Body Temperature Incorporating Environmental Factors. Sensors 2020, 20, 4282. [Google Scholar] [CrossRef]
- Talukder, S.; Thomson, P.C.; Kerrisk, K.L.; Clark, C.E.F.; Celi, P. Evaluation of Infrared Thermography Body Temperature and Collar-Mounted Accelerometer and Acoustic Technology for Predicting Time of Ovulation of Cows in a Pasture-Based System. Theriogenology 2015, 83, 739–748. [Google Scholar] [CrossRef] [PubMed]
- Soerensen, D.D.; Pedersen, L.J. Infrared Skin Temperature Measurements for Monitoring Health in Pigs: A Review. Acta Vet Scand 2015, 57, 5. [Google Scholar] [CrossRef]
- Xiong, Y.; Li, G.; Willard, N.C.; Ellis, M.; Gates, R.S. Modeling Neonatal Piglet Rectal Temperature with Thermography and Machine Learning. J. ASABE 2023, 66, 193–204. [Google Scholar] [CrossRef]
- Lu, M.; He, J.; Chen, C.; Okinda, C.; Shen, M.; Liu, L.; Yao, W.; Norton, T.; Berckmans, D. An Automatic Ear Base Temperature Extraction Method for Top View Piglet Thermal Image. Comput. Electron. Agric. 2018, 155, 339–347. [Google Scholar] [CrossRef]
- McManus, C.; Tanure, C.B.; Peripolli, V.; Seixas, L.; Fischer, V.; Gabbi, A.M.; Menegassi, S.R.O.; Stumpf, M.T.; Kolling, G.J.; Dias, E.; et al. Infrared Thermography in Animal Production: An Overview. Comput. Electron. Agric. 2016, 123, 10–16. [Google Scholar] [CrossRef]
- Alves, M.d.F.A.; Pandorfi, H.; Montenegro, A.A.D.A.; Silva, R.A.B.D.; Gomes, N.F.; Santana, T.C.; Almeida, G.L.P.D.; Marinho, G.T.B.; Silva, M.V.D.; Silva, W.A.D.; et al. Evaluation of Body Surface Temperature in Pigs Using Geostatistics. AgriEngineering 2023, 5, 1090–1103. [Google Scholar] [CrossRef]
- Marques, S.d.F.; Pitombo, C.S. Intersecting Geostatistics with Transport Demand Modeling: A Bibliographic Survey. Rev. Bras. DE Cartogr. 2020, 72, 1004–1027. [Google Scholar] [CrossRef]
- Cressie, N. Statistics for Spatial Data; John Wiley & Sons: Hoboken, NJ, USA, 2015. [Google Scholar]
- Hoffmann, G.; Schmidt, M.; Ammon, C.; Rose-Meierhöfer, S.; Burfeind, O.; Heuwieser, W.; Berg, W. Monitoring the Body Temperature of Cows and Calves Using Video Recordings from an Infrared Thermography Camera. Vet. Res. Commun. 2013, 37, 91–99. [Google Scholar] [CrossRef]
- da Silva, T.G.F.; Primo, J.T.A.; de Mura, M.S.B.; e Silva, S.M.S.; de Morais, J.E.F.; de Caldas Pereira, P.; de Souza, C.A.A. Soil Water Dynamics and Evapotranspiration of Forage Cactus Clones under Rainfed Conditions. Pesqui. Agropecu. Bras. 2015, 50, 515–525. [Google Scholar] [CrossRef]
- Thom, E.C. The Discomfort Index. Weatherwise 1959, 12, 57–61. [Google Scholar] [CrossRef]
- Baêta, F.C.; Souza, C. Ambiência em Edificações Rurais: Conforto Animal; UFV: Minas Gerais, Brazil, 2010; p. 246. [Google Scholar]
- Soerensen, D.D.; Clausen, S.; Mercer, J.B.; Pedersen, L.J. Determining the Emissivity of Pig Skin for Accurate Infrared Thermography. Comput. Electron. Agric. 2014, 109, 52–58. [Google Scholar] [CrossRef]
- Gonzalez, R.C.; Woods, R.E. Processamento Digital de Imagem; Prentice Hall: Hoboken, NJ, USA, 2010; Volume 10, pp. 11–27. [Google Scholar]
- Warrick, A.W.; Nielsen, D.R. Spatial Variability of Soil Physic Properties in the Field; Academic: New York, NY, USA, 1980; pp. 655–675. [Google Scholar]
- GS+-Geostatistics for the Environmental Sciences; Gamma Design Software: Plainwell, MI, USA, 2004.
- Vauclin, M.; Vieira, S.R.; Vachaud, G.; Nielsen, D.R. The Use of Cokriging with Limited Field Soil Observations. Soil Sci. Soc. Am. J. 1983, 47, 175–184. [Google Scholar] [CrossRef]
- Cambardella, C.A.; Moorman, T.B.; Novak, J.M.; Parkin, T.B.; Karlen, D.L.; Turco, R.F.; Konopka, A.E. Field-Scale Variability of Soil Properties in Central Iowa Soils. Soil Sci. Soc. Am. J. 1994, 58, 1501–1511. [Google Scholar] [CrossRef]
- Gomes, N.F.; Pandorfi, H.; Barnabé, J.M.C.; Guiselini, C.; de Almeida, G.L.P.; de Holanda, M.C.R.; de Holanda, M.A.C.; da Silva, M.V. Behavior of Pigs Subjected to Climate Control System in the Semiarid Region of Pernambuco, Brazil. Dyna 2021, 88, 34–38. [Google Scholar] [CrossRef]
- Journel, A.G.; Huijbregts, C.J. Mining Geostatistics; Academic Press: London, UK, 1978; Volume 17, pp. 1–15. [Google Scholar]
- Isaaks, E.H.; Srivastava, R.M. An Introduction to Applied Geoestatistics. J. Glob. Optim. 1989, 23, 345–383. [Google Scholar]
- Goovaerts, P. Geostatistics for Natural Resources Evaluation; Oxford University Press: Oxford, UK, 1997; ISBN 9780195115383. [Google Scholar]
- Ross, J.W.; Hale, B.J.; Gabler, N.K.; Rhoads, R.P.; Keating, A.F.; Baumgard, L.H. Physiological Consequences of Heat Stress in Pigs. Anim. Prod. Sci. 2015, 55, 1381–1390. [Google Scholar] [CrossRef]
- Oliveira, A.C.d.F.d.; Vanelli, K.; Sotomaior, C.S.; Weber, S.H.; Costa, L.B. Impacts on Performance of Growing-Finishing Pigs under Heat Stress Conditions: A Meta-Analysis. Vet. Res. Commun. 2019, 43, 37–43. [Google Scholar] [CrossRef]
- Bracke, M.B.M.; Herskin, M.S.; Marahrens, M.; Gerritzen, M.A.; Spoolder, H.A.M. Review of Climate Control and Space Allowance during Transport of Pigs; EURCAW-Pigs: Grange, Ireland, 2020. [Google Scholar]
- Bleizgys, R.; Čėsna, J.; Kukharets, S.; Medvedskyi, O.; Strelkauskaitė-Buivydienė, I.; Knoknerienė, I. Adiabatic Cooling System Working Process Investigation. Processes 2023, 11, 767. [Google Scholar] [CrossRef]
- Quiniou, N.; Dubois, S.; Noblet, J. Voluntary Feed Intake and Feeding Behaviour of Group-Housed Growing Pigs are Affected by Ambient Temperature and Body Weight. Livest. Prod. Sci. 2000, 63, 245–253. [Google Scholar] [CrossRef]
- Batista, P.H.D.; de Almeida, G.L.P.; Pandorfi, H.; da Silva, M.V.; da Silva, R.A.B.; da Silva, J.L.B.; Santana, T.C.; Rodrigues, J.A.d.M. Thermal Images to Predict the Thermal Comfort Index for Girolando Heifers in the Brazilian Semiarid Region. Livest. Sci. 2021, 251, 104667. [Google Scholar] [CrossRef]
- Rossi, R.E.; Mulla, D.J.; Journel, A.G.; Franz, E.H. Geostatistical Tools for Modeling and Interpreting Ecological Spatial Dependence. Ecol. Monogr. 1992, 62, 277–314. [Google Scholar] [CrossRef]
- Renaudeau, D.; Gourdine, J.L.; St-Pierre, N.R. A Meta-Analysis of the Effects of High Ambient Temperature on Growth Performance of Growing-Finishing Pigs. J. Anim. Sci. 2011, 89, 2220–2230. [Google Scholar] [CrossRef] [PubMed]
- Renaudeau, D.; Collin, A.; Yahav, S.; De Basilio, V.; Gourdine, J.L.; Collier, R.J. Adaptation to Hot Climate and Strategies to Alleviate Heat Stress in Livestock Production. Animal 2012, 6, 707–728. [Google Scholar] [CrossRef] [PubMed]
- Brown-Brandl, T.M. Understanding Heat Stress in Beef Cattle. Rev. Bras. DE Zootec. 2018, 47, e20160414. [Google Scholar] [CrossRef]
- St-Pierre, N.R.; Cobanov, B.; Schnitkey, G. Economic Losses from Heat Stress by US Livestock Industries. J. Dairy Sci. 2003, 86, E52–E77. [Google Scholar] [CrossRef]
- Gómez-Prado, J.; Pereira, A.M.F.; Wang, D.; Villanueva-García, D.; Domínguez-Oliva, A.; Mora-Medina, P.; Hernández-Avalos, I.; Martínez-Burnes, J.; Casas-Alvarado, A.; Olmos-Hernández, A.; et al. Thermoregulation Mechanisms and Perspectives for Validating Thermal Windows in Pigs with Hypothermia and Hyperthermia: An Overview. Front. Vet Sci. 2022, 9, 1023294. [Google Scholar] [CrossRef]
- Bjerg, B.; Brandt, P.; Pedersen, P.; Zhang, G. Sows’ Responses to Increased Heat Load—A Review. J. Therm. Biol. 2020, 94, 102758. [Google Scholar] [CrossRef]
- Berckmans, D. Advances in Precision Livestock Farming; Burleigh Dodds Science Publishing: Cambridge, UK, 2022; p. 418. ISBN 9781003180661. [Google Scholar]
Disclaimer/Publisher’s Note: The statements, opinions and data contained in all publications are solely those of the individual author(s) and contributor(s) and not of MDPI and/or the editor(s). MDPI and/or the editor(s) disclaim responsibility for any injury to people or property resulting from any ideas, methods, instructions or products referred to in the content. |
© 2025 by the authors. Licensee MDPI, Basel, Switzerland. This article is an open access article distributed under the terms and conditions of the Creative Commons Attribution (CC BY) license (https://creativecommons.org/licenses/by/4.0/).