Article

Impact of Drying Conditions on Soybean Quality: Mathematical Model Evaluation

by
Emmanuel Baidhe
,
Clairmont L. Clementson
*,
Ibukunoluwa Ajayi-Banji
,
Wilber Akatuhurira
,
Ewumbua Monono
and
Kenneth Hellevang
Department of Agricultural and Biosystems Engineering, North Dakota State University, Fargo, ND 58102, USA
*
Author to whom correspondence should be addressed.
AgriEngineering 2025, 7(9), 273; https://doi.org/10.3390/agriengineering7090273 (registering DOI)
Submission received: 30 July 2025 / Revised: 16 August 2025 / Accepted: 21 August 2025 / Published: 25 August 2025
(This article belongs to the Section Pre and Post-Harvest Engineering in Agriculture)

Abstract

Soybean (Glycine max L.) is one of the world’s most important sources of plant-based protein, with a protein content exceeding 35–40% (dry basis), along with other essential nutritional benefits. Ideally, soybeans are field-dried to approximately 13% moisture content (wet basis, wb); however, adverse weather conditions can necessitate harvesting at elevated moisture levels sometimes exceeding 20% (wb). In such cases, mechanized drying systems, particularly in northern U.S. regions, become essential for safe storage and quality preservation. This study investigated the effects of drying temperature, airflow rate, and initial moisture content on drying kinetics and kernel integrity using mathematical modeling. Drying behavior was modeled using fractional calculus and compared to the empirical Page model, while kernel cracking and breakage were analyzed using logistic regression. Both fractional and Page models exhibited strong agreement with experimental data (R2 = 0.903–0.993). The fractional model achieved superior predictive accuracy, improving RMSE and MAE by 83.7% and 81.2%, respectively, compared to the Page model. Cracking and breakage were more strongly influenced by drying temperature than by initial moisture content, with the greatest quality degradation occurring at high temperatures. Optimal drying conditions were identified as temperatures below 27 °C and initial moisture contents between 19 and 20% (wb), which best preserved kernel quality. Logistic models more accurately predicted breakage than cracking, confirming their effectiveness in assessing mechanical damage during drying. The results affirm the suitability of fractional order models for accurately capturing drying kinetics, while logistic models offer robust performance for evaluating physical quality degradation. These modeling approaches provide a framework for efficient and quality-preserving soybean drying strategies in regions reliant on off-field drying systems.

1. Introduction

Soybean (Glycine max L.) is one of the world’s most important sources of protein and essential nutrients [1,2]. With protein content typically ranging from 35 to 40% (dry basis), it plays a vital role in combating hunger, particularly in densely populated and underdeveloped countries. In addition to direct consumption, soybeans are widely used in non-dairy products such as soymilk and tofu [2].
The U.S. is the largest global producer of soybeans, accounting for approximately 45% of global production, followed by Brazil (20%) and China (12%) [2]. Illinois, Iowa, Minnesota, and Indiana are the leading soybean-producing states in the U.S. [3]. In 2024, North Dakota ranked eighth while South Dakota ranked ninth among U.S. producers [3]. Ideally, soybeans dry naturally in the field to about 13% (wet basis, wb) moisture content. However, climate variability poses a significant risk. Frost before maturity or rainfall during harvest can disrupt drying and compromise quality. These risks are more pronounced in the Northern Plains, where the growing season is limited by fewer frost-free days and early winter onset. In contrast, southern or lower Midwest U.S. states typically benefit from longer fall seasons, generally allowing for adequate field drying.
Drying temperature is the most significant factor influencing drying rates [4], but frost can hinder field drying. In adverse conditions, soybeans may be harvested at elevated moisture content, sometimes exceeding 20% (wb). Consequently, mechanized drying using either natural air or high-temperature systems may be necessary, especially in northern states. Despite this greater need, limited research exists on soybean drying in the Northern Plains. Compounding this research gap, soybean cultivars have undergone significant genetic modification to improve pest and disease resistance, yield potential, and climate adaptability, which may alter drying characteristics. Currently, over 90% of the planted acres are herbicide-tolerant genetically modified soybean varieties, making much of the existing literature outdated and less applicable to modern soybean cultivars.
While elevated drying temperatures accelerate moisture removal, they may also damage soybean kernels, causing seed coat scarring, kernel breakage, and increased susceptibility to mold and insect infestation, ultimately reducing market value [5]. In contrast, lower drying temperatures better preserve grain integrity and quality but significantly extend drying times [4,6]. Understanding how drying parameters such as temperature, airflow, and initial moisture content affect drying behavior and kernel integrity is critical for promoting the adoption of soybean mechanized drying in the Northern Plains. A previous study on corn revealed that temperature and initial moisture content greatly influence the drying constant, whereas air velocity has less effect [7].
Mathematical modeling is an effective tool for analyzing drying behavior, predicting quality degradation, and optimizing drying systems [8,9]. Previous studies have used approaches such as logistic modeling [10] and the reaction engineering approach (REA) [9], which treats drying as a competition between “evaporation” and “condensation” reactions. The REA is valued for its simplicity, accuracy, and versatility in both continuous and intermittent drying [9]. Other empirical and semi-theoretical models like the Page model [11], Wang and Singh model [8], and Midilli et al. model [12] have also been used. More recently, fractional calculus has gained attention for accurately representing complex, non-linear drying kinetics [13]. These models more comprehensively incorporate the effects of drying conditions (temperature, airflow, initial moisture) and have been successfully applied to crops such as corn, beans, wheat, and eggplants [14,15,16].
This study aims to (1) apply fractional order modeling to describe soybean drying behavior, (2) assess the effect of drying parameters on cracking, breakage, and seed coat scarring, (3) establish optimal drying conditions for maximum soybean quality, and (4) evaluate the effectiveness of logistic modeling for predicting quality impacts during heated air soybean drying. Findings from this research will offer valuable guidance to soybean farmers and processors on preserving seed quality for global markets, potentially securing premium prices. It will also enhance storage practices and improve drying system efficiency by identifying optimal energy inputs needed to maintain quality.

2. Materials and Methods

2.1. Sample Collection and Preparation

Soybeans of variety P08A244E were obtained from a local representative of Pioneer Hi-bred International in Georgetown, MN, USA. The initial moisture content of the soybean samples was approximately 9% (wb). This represents specific grain characteristics of several other soybean cultivars currently grown in the region. Whole, undamaged seeds were reconditioned to 17%, 20%, and 23% (wb) by adding a calculated amount of distilled water using Equation (1). The treated samples were sealed in airtight plastic Ziploc bags and stored for at least a week to ensure uniform moisture distribution throughout the kernels [17,18]. Final moisture content after reconditioning was verified using the hot air oven method at 103 °C for 72 h, in accordance with ASABE standards [19].
M w = M c ( W f W c ) 100 W f
where Mw is the mass of water added (g), Mc is the initial weight of the cleaned sample (g), Wc is the initial moisture content of the cleaned sample (% wb), and Wf is the final desired moisture content of the sample (% wb).

2.2. Drying Apparatus and Experiments

Drying experiments were conducted at the Peltier Complex, North Dakota State University (NDSU), USA, using a laboratory-scale fixed-bed dryer (Figure 1). The dryer was equipped with a 1/25 HP variable speed 12 V DC centrifugal fan and a 5 kW heating element controlled by a temperature regulator. The drying chamber had a depth of approximately 0.3 m.
About 5.8 kg of soybeans was loaded into the drying bin to a depth of about 0.21 m above the wire mesh tray. Three drying temperatures (21.1 °C, 40.6 °C, and 60 °C) were evaluated, with the drying air maintained within ±1 °C of the setpoint. Temperatures below 60 °C were reported to have acceptable ranges of breakage and cracking in soybean [10]. Two airflow velocities (0.6 m/s and 0.94 m/s) were evaluated, and an anemometer was used to confirm the airflow.
Soybean samples were collected at 0, 10, 20, 30, 40, and 60 min and then every 30 min until the moisture content reached approximately 13% (wb). Before each sampling, the soybean seeds were thoroughly mixed with a stirrer to ensure uniformity. Sampling was conducted at five different positions within the dryer using an aluminum grain trier to achieve an accumulated sample weight of approximately 200 g for every time interval.

2.3. Mathematical Modeling of Drying Kinetics Using the Fractional Order Model

The moisture content of the samples at different time intervals was determined using a hot air oven at 103 °C for 72 h [19] and calculated using Equation (2).
M t = W 1 W 2 W 2 × 100
where Mt is the moisture content at any time (% db), W1 is the weight of the wet sample (g), and W2 is the weight of the dried sample (g).
The instantaneous moisture content was converted to moisture ratio using Equation (3) [21,22].
M R = M t M e M i M e
where MR is the moisture ratio (dimensionless), Mt is the moisture content of soybean at any given time (fraction db), Mi is the initial moisture content at t = 0 min (fraction db), and Me is the equilibrium moisture content (EMC), which was estimated using the EMC tables for soybean based on the modified Halsey model at 24 °C and 45% relative humidity, yielding a constant value of 0.072 wb across all experiments [23].
The fractional order model, derived from the first-order kinetic model (Equation (4)), assumes that the rate of moisture change is proportional to the material’s own moisture content. The corresponding initial condition for solving Equation (4) is given in Equation (5) [14].
d M t ( t ) d t = k [ M t ( t ) M e ]
M t ( 0 ) = M i
where k is the kinetic constant (h−1), and t is the drying time (h).
To generalize the model, a fractional time derivative of arbitrary order α is introduced as shown in Equation (6) [14].
d α M t ( t ) d t α = k [ M t M e ]
where k is the fractional order kinetic constant (h−α), and t is the drying time (h).
This arbitrary-order model is expressed using the Caputo derivative, which allows the inclusion of initial conditions for fractional differential equations (Equation (7)) [13,14].
D t α M t ( t ) = 1 Γ ( α m ) 0 t M t m × τ ( t τ ) α + 1 m d τ
where m is the Caputo derivative constant, and τ is the dummy time derivative of the Caputo derivative.
For m 1 < α < m , Equation (7) is considered a Laplace function and can be re-arranged in the form of Equation (8) for 0 < α < 1, where parameters α and k are estimated from the drying data [14,16]. Equation (8) can be simplified to Equation (9).
M t ( t ) = ( M i M e ) × j = 0 ( k t α ) j Γ ( α j + 1 ) + M e
M t ( t ) = ( M i M e ) × E α ( k t α ) + M e M R = E α ( k t α )
where j is the number of terms of the series of the Mittag-Leffler function, and Eα is the Mittag-Leffler function.
The parameter values of α and k were obtained by fitting the experimental drying data using a sum of squares minimization approach (Equation (10)), with a series expansion using about 100 terms [14,16]. The fmincon optimization in MATLAB was employed to determine the most optimal values of α and k that minimized the difference between predicted and experimental moisture content.
ϕ = j = 0 ( M t , p r e d j M t , exp j ) 2
For comparison, the Page model was also fitted to the drying data (Equation (11)), which is commonly used for grain drying applications involving temperatures above 40 °C [24,25].
M R = exp ( k t n )
where n is the reaction order (unitless), and t is the drying time (h).

2.4. Determination of Breakage Quality Indices

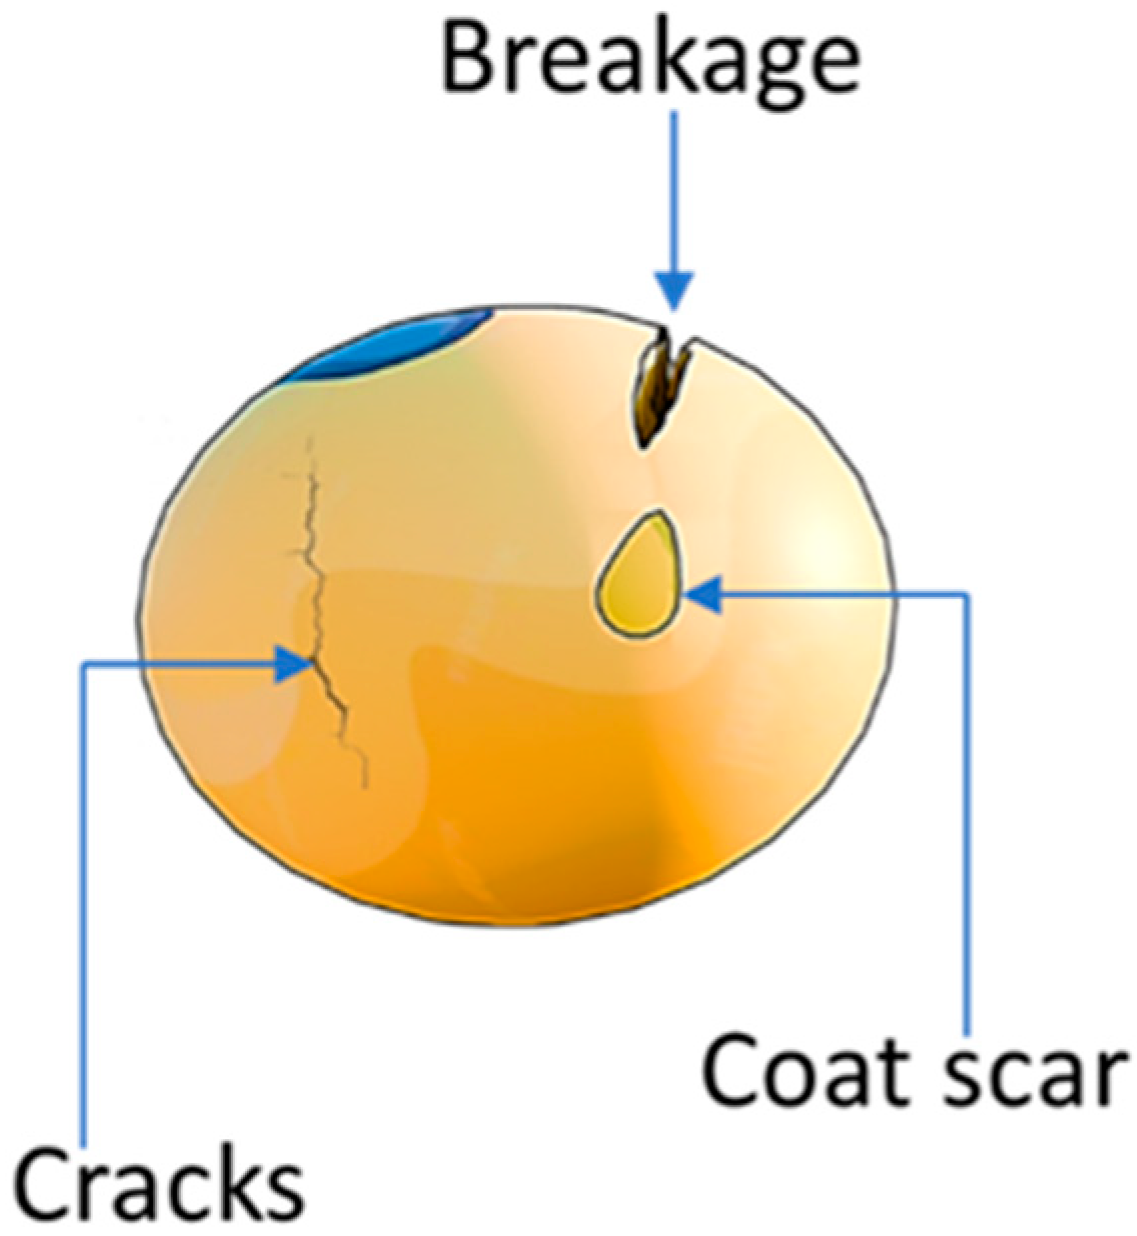
Kernel breakage quality was assessed based on the presence of cracks, breakage, and scarred seed coats, as illustrated in Figure 2. Each 200 g sample was visually examined and classified into three quality categories: cracked kernels, broken kernels, and scarred kernels [26]. While breakage and scarring were readily visible, cracks were identified under enhanced lighting and magnification using an LED lamp coupled with a 1.75× magnifying lens (LED Magnifier Desk Lamp, Intertek, Patriot Lighting, Inc., Los Angeles, CA, USA).
The weight of cracked, broken, and scarred kernels was expressed as percentages using Equations (12)–(14), respectively [26,27].
C r = W c r W s × 100
B r = W b r W s × 100
S c = W s c W s × 100
where Cr is the percentage of cracked kernels (%), Br is the percentage of broken kernels (%), Sc is the percentage of scarred kernels (%), Ws is the weight of the soybean sample (g), Wcr is the weight of the cracked kernels (g), Wbr is the weight of broken kernels (g), and Wsc is the mass of scarred kernels (g).

2.5. Logistic Modeling of Breakage Quality Indices

The effect of drying on soybean quality was further assessed by modeling percentage of cracking and breakage as a function of initial moisture content, final moisture content, and drying temperature. The experimental quality data were fitted to logistic models (Equation (15)) using non-linear regression in MATLAB [10].
Y = a 1 + exp [ b ( M f c ) ]
where Y is the quality index such as Cr and Br, Mf is the final moisture content (%, db), and a, b, and c are model constants expressed as a function of initial moisture content and drying temperature, as given in Equation (16).
Y c = k 0 + k 1 M i + k 2 T
where Yc is the model constant such as a, b, and c, k0, k1, and k2 are constants, Mi is the initial moisture content (%, db), and T is the drying temperature (K).

2.6. Statistical Analysis

Model fitting for drying behavior was performed using non-linear regression analysis and evaluated using root mean square error (RMSE), mean absolute error (MAE), coefficient of determination (R2), and adjusted R2. The improvement in predictive accuracy of the fractional order model over the Page model was assessed using the Accuracy Improvement (AI) index given by Equation (17) [28], where positive AI values indicate better performance relative to the base model (Page model). The effect of drying conditions on the fractional model parameters was analyzed using ANOVA and t-tests.
A I = X p X f X p × 100
where AI is the Accuracy Improvement (%), X is a model performance metric (such as MAE or RMSE), and the subscripts p and f represent the baseline model (Page model) and the compared fractional order model, respectively.
A two-stage non-linear regression analysis was conducted for the logistic model using least square curve fitting in MATLAB 2022 (Mathworks, Boston, MA, USA). In this approach, the logistic model parameters were estimated in two sequential stages. In the first stage, least square regression was applied to determine a, b, and c as functions of initial moisture content and drying temperature. These parameter values were then used in the second stage to establish the final relationship between the respective quality indices and the final moisture content.
The fitting accuracy of constants a, b, and c was assessed using R2, adjusted R2, MAE, and RMSE. Logistic model performance was further assessed using MAE and the Nash–Sutcliffe efficiency (NSE). A model is considered a better fit with higher R2 and adjusted R2 and lower RMSE. NSE values range from 0 to 1, with values > 0.75 indicating very good model performance and values between 0.35 and 0.75 considered satisfactory [29]. The effect of drying temperature, airflow velocity, and initial moisture was further assessed using analysis of variance (ANOVA), with statistical significance determined at the 95% confidence level.

3. Results and Discussion

3.1. Drying Characteristics of Soybean Kernels

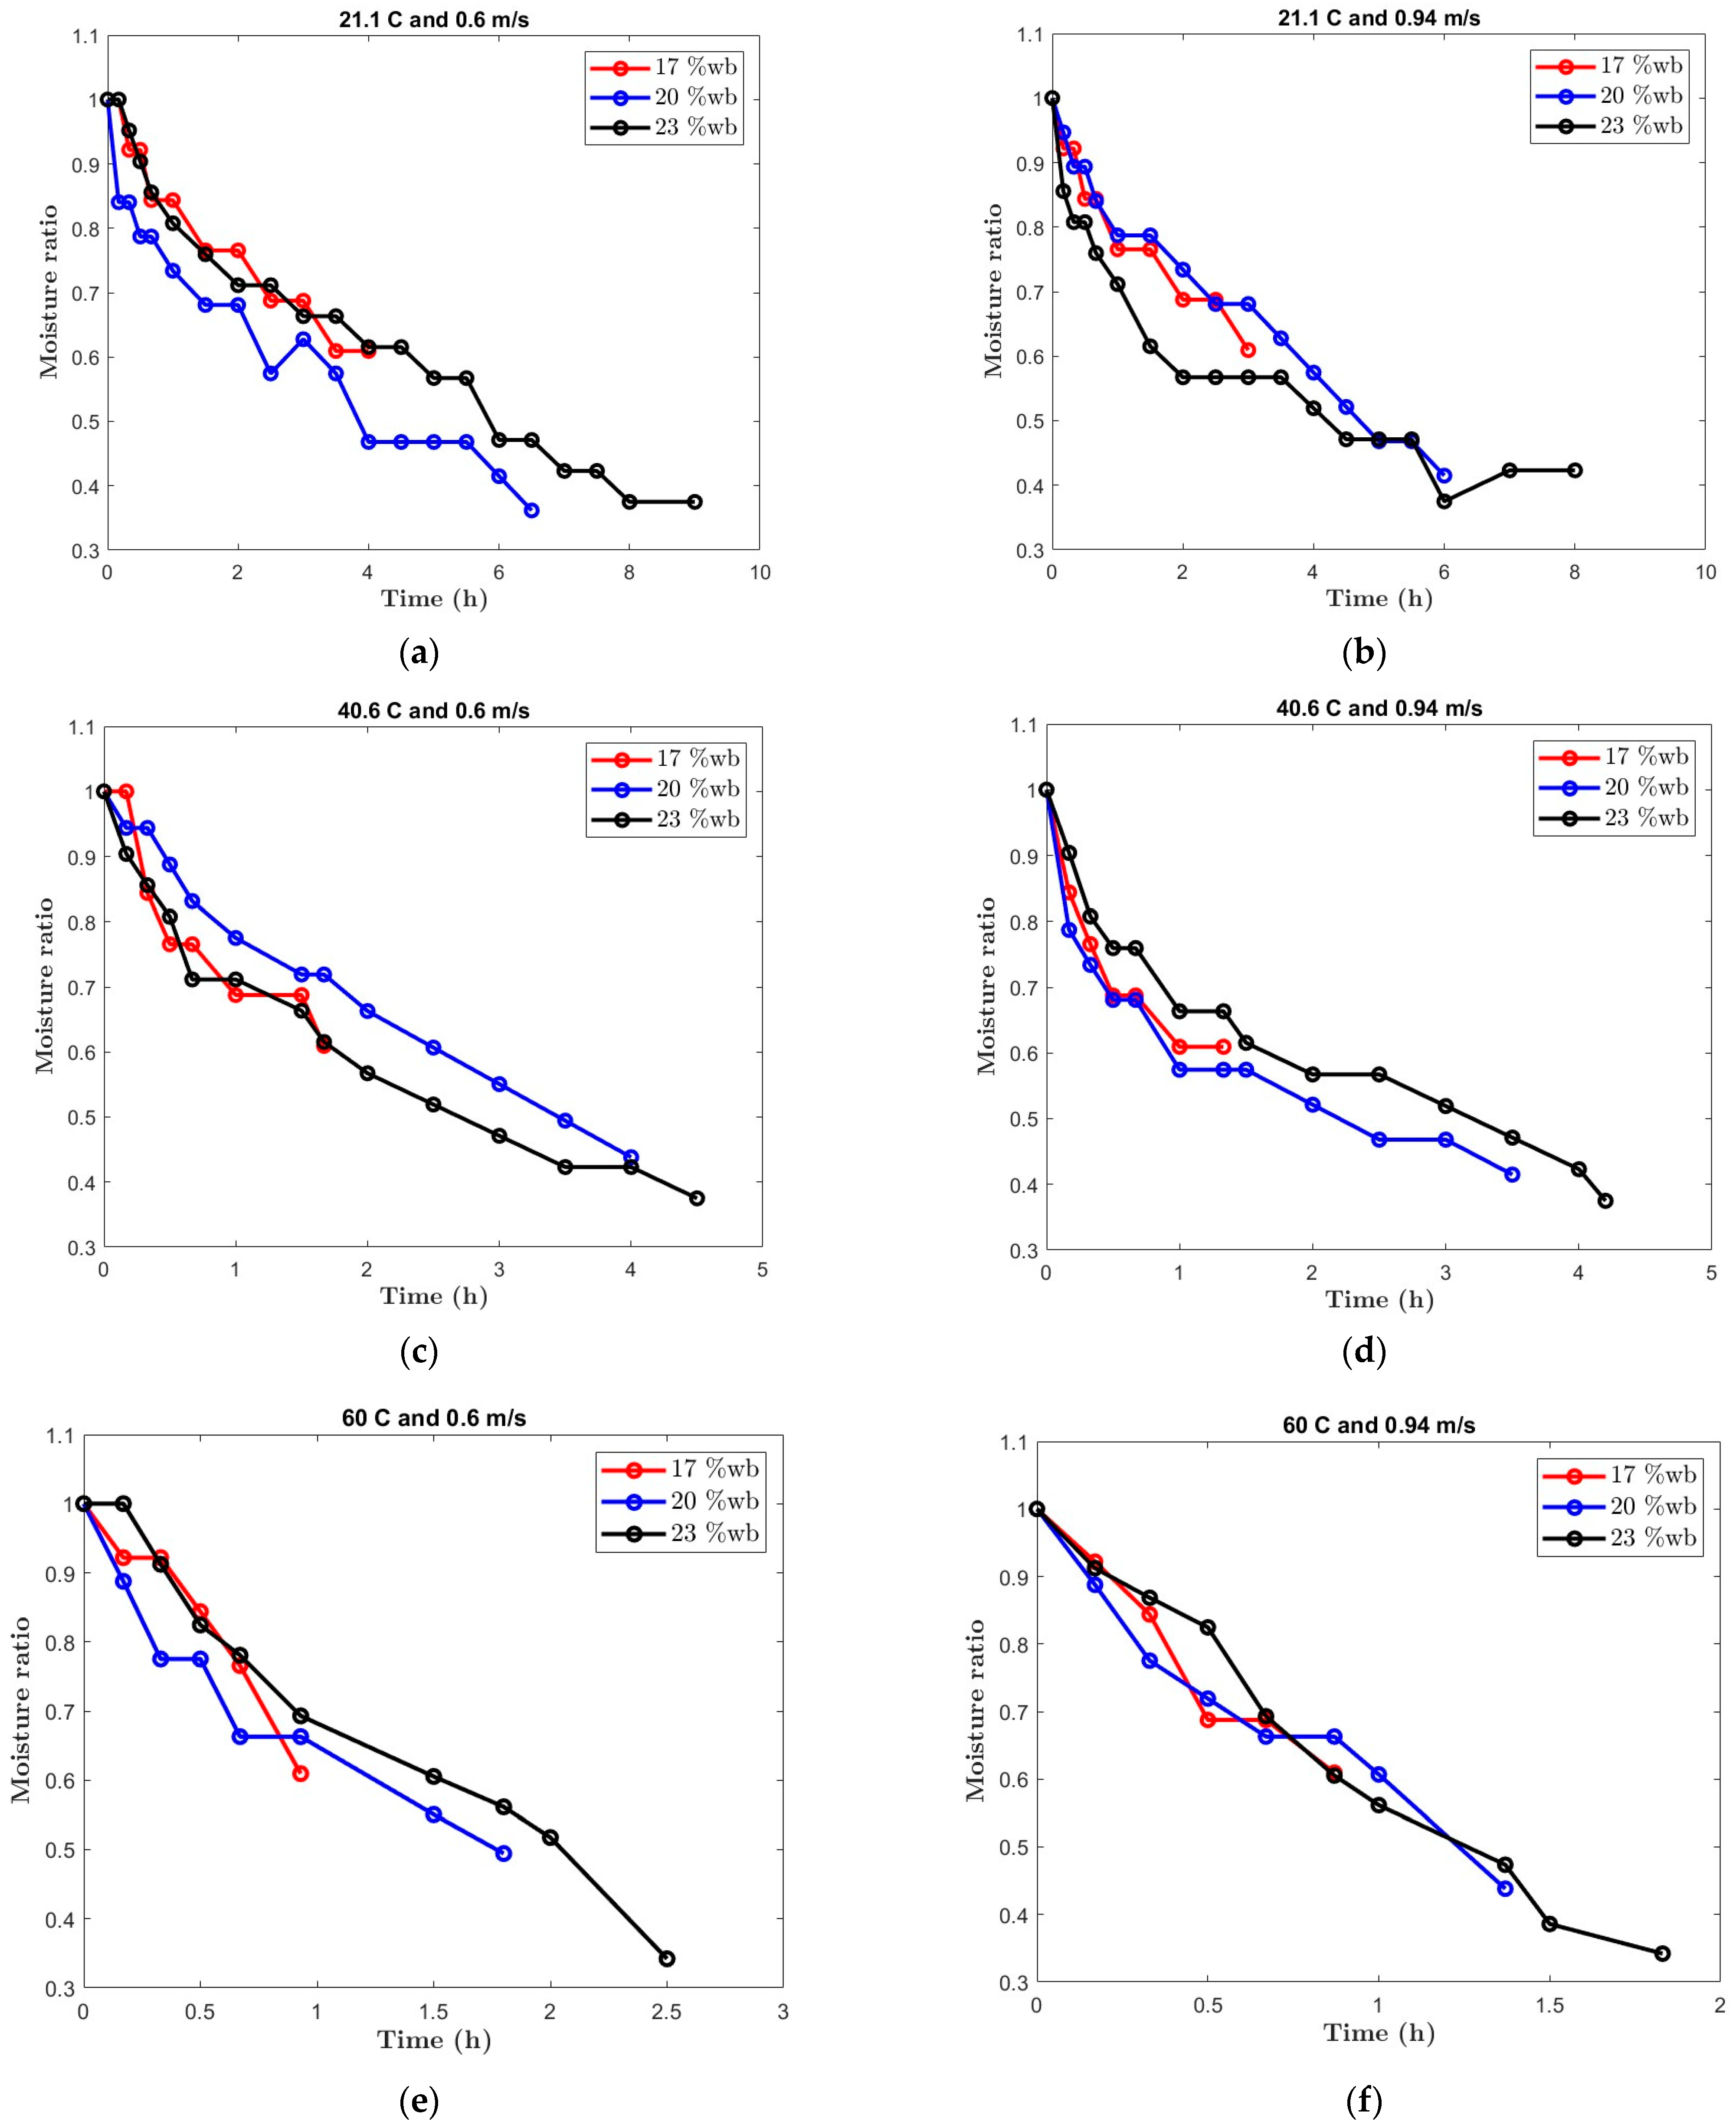
The drying curves depicting the variation of moisture ratio over drying time for different drying conditions are shown in Figure 3. These curves exhibit the typical drying behavior for most food products: an initial rapid decrease in moisture content, followed by a gradual reduction, and finally, a stage where moisture evaporation becomes negligible. The initial rapid moisture reduction is attributed to the availability of free water for evaporation at the start of the experiment.
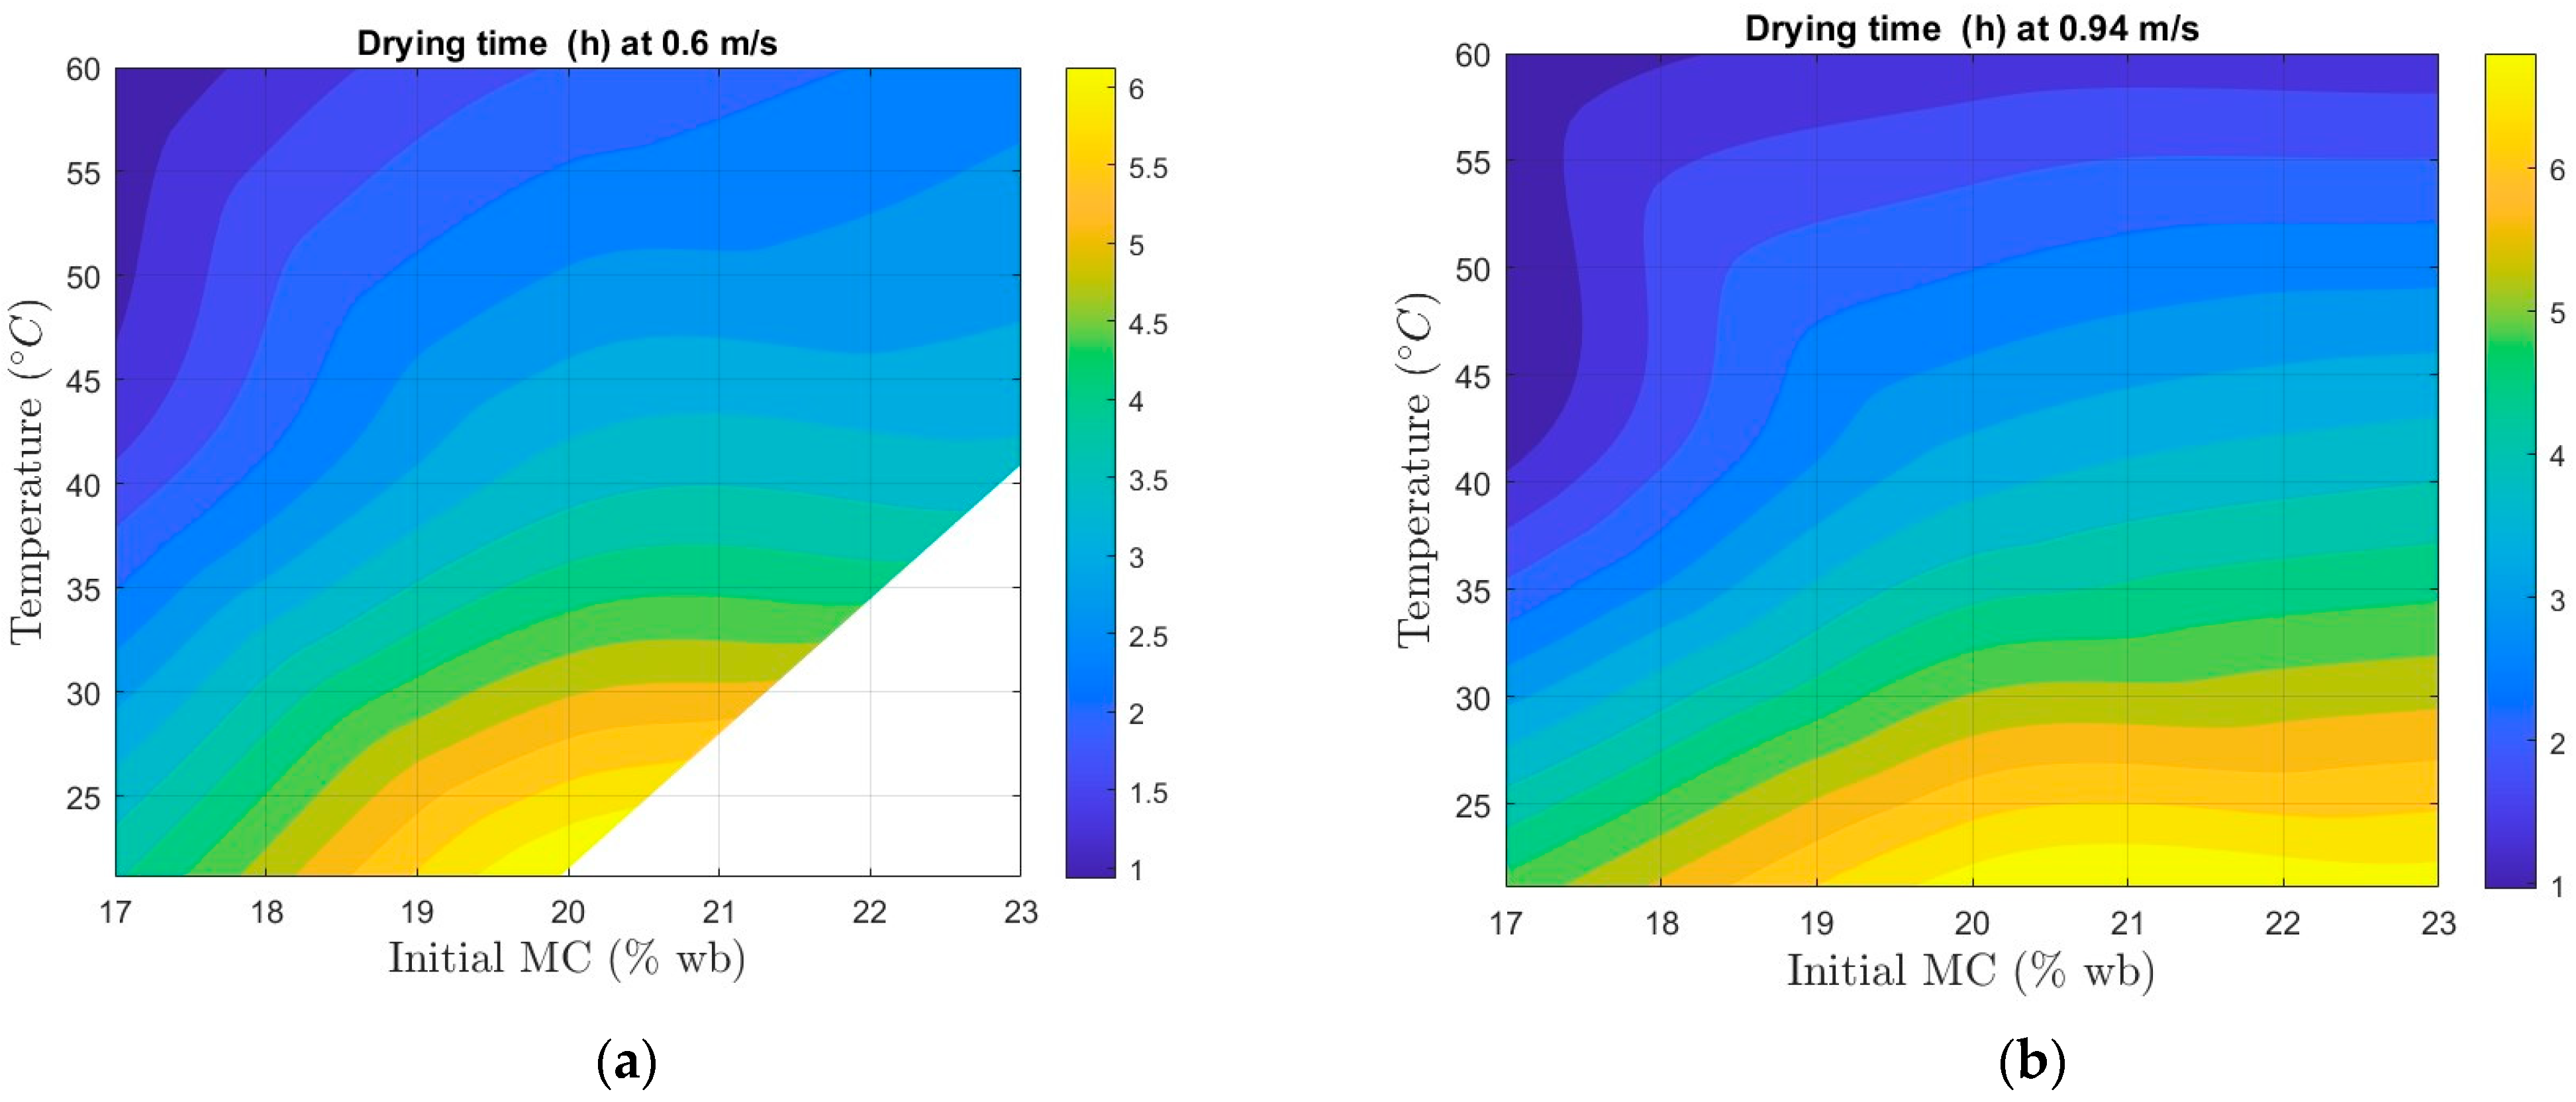
Drying time decreased significantly with increasing drying temperature (p < 0.05). Similarly, soybeans with lower initial moisture content require significantly shorter drying durations compared to those with higher moisture levels (p < 0.05). In contrast, air velocity had no significant effect on drying time (p ≥ 0.05) (Figure 4). Similar trends have been reported for paddy rice [30] and soybean [31].
The reduction in drying time at higher temperatures is likely due to increased water vapor pressure gradient, which enhances moisture migration and evaporation. This effect was consistent across all initial moisture contents. The relatively uniform internal structure of soybean kernels, composed mainly of cotyledons, may facilitate even moisture distribution and transport during drying. These findings confirm that drying temperature and initial moisture content are the primary factors influencing drying rates.

3.2. Mathematical Modeling of Drying Kinetics

3.2.1. Comparison of Fractional Order and Lumped Parameter Models

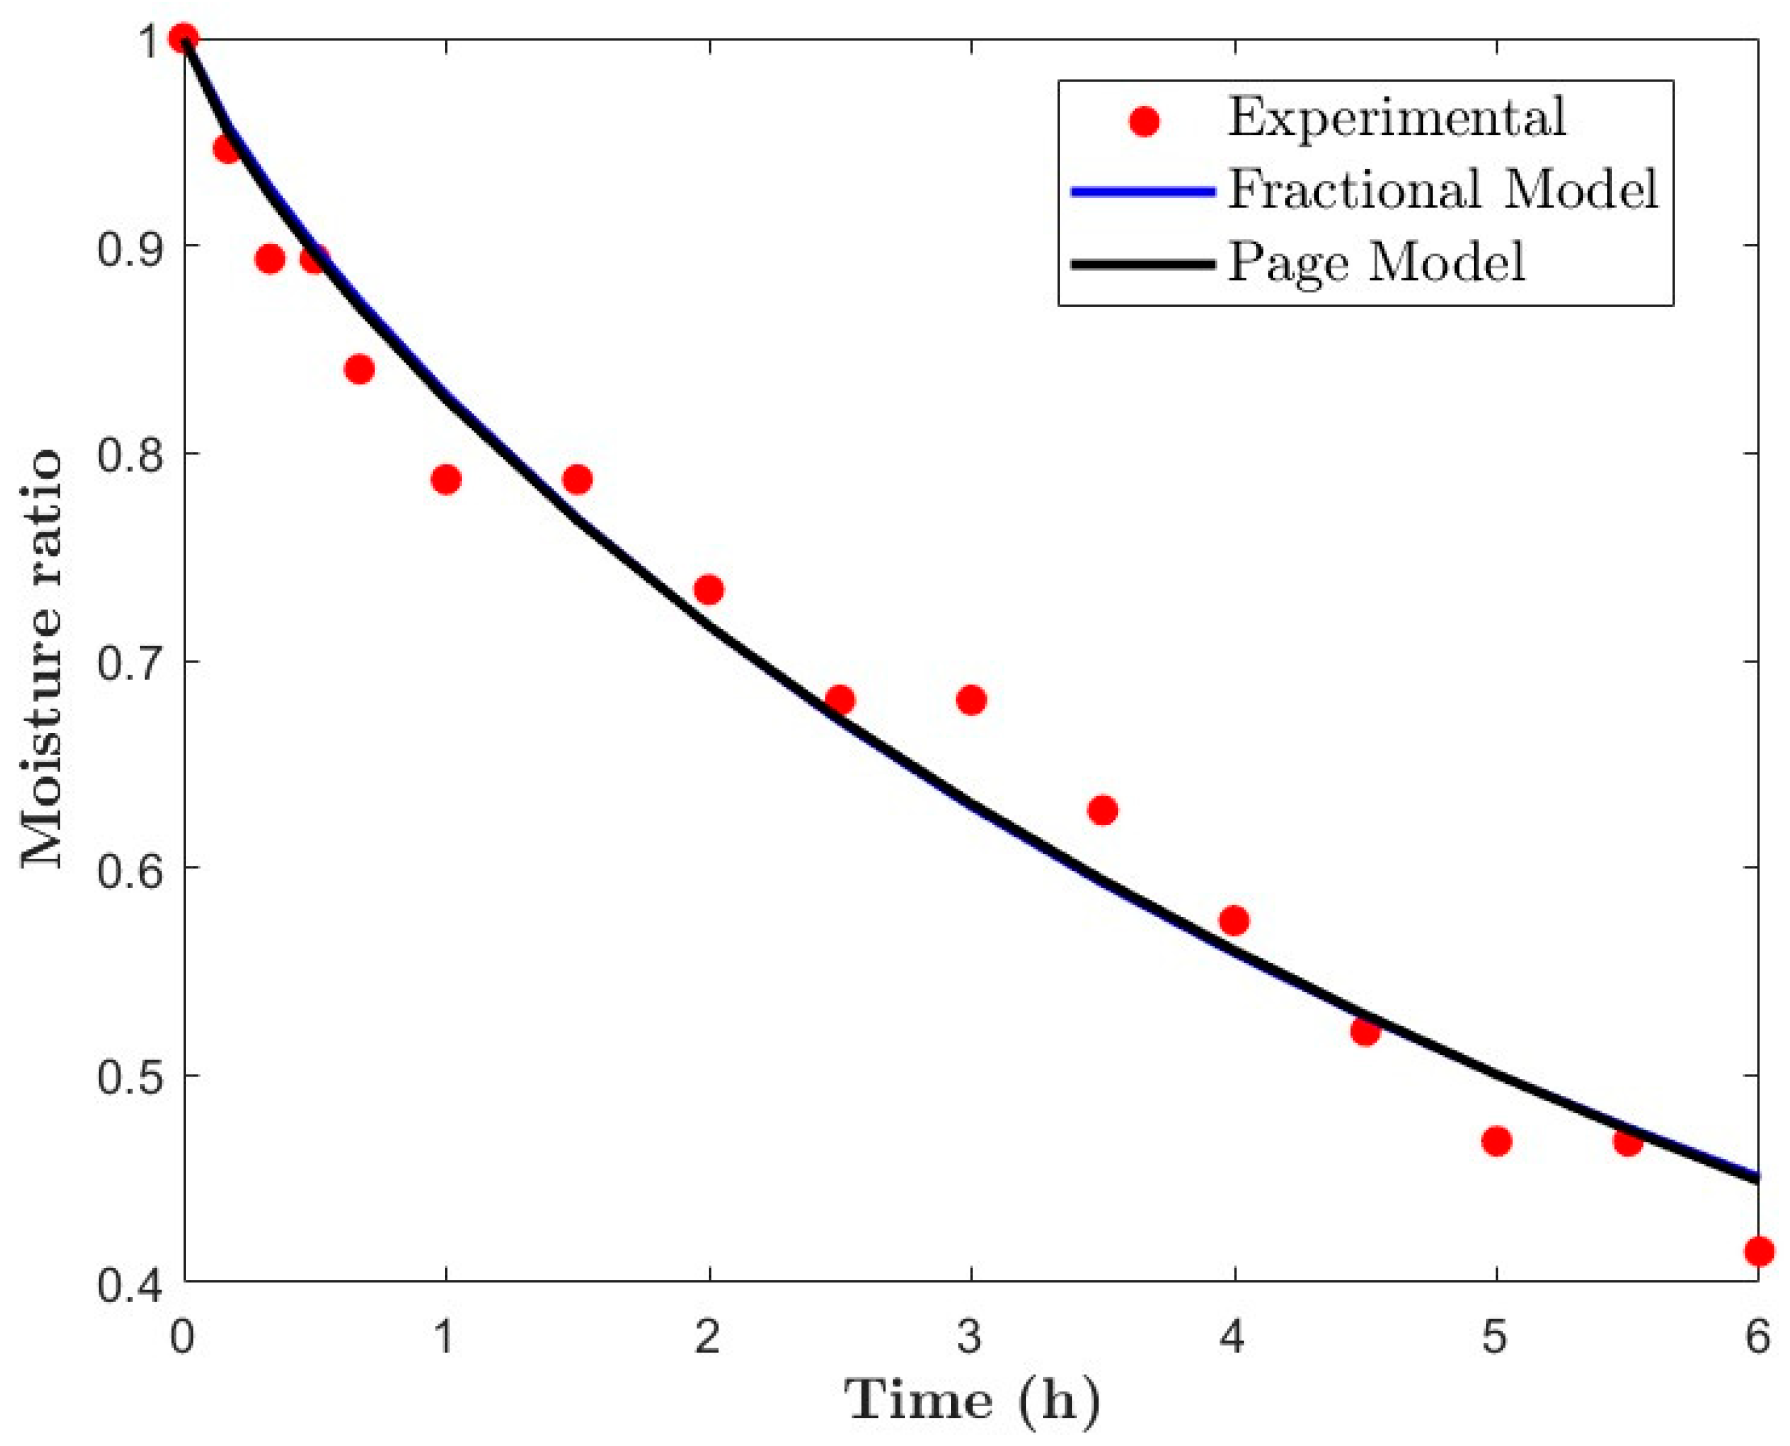
Experimental moisture ratio data were fitted to both the fractional order and Page models, with fitting metrics and model parameters summarized in Table 1. Both models showed excellent agreement with the experimental drying data, with coefficients of determination (R2) ranging from 0.903 to 0.993 across all drying conditions. A graphical comparison of predicted moisture ratio variation over time for the two models is presented in Figure 5, with accuracy consistent with the error metrics reported for 0.94 m/s, 20%wb, and 21.1 °C (Table 1).
The fractional order model consistently exhibited lower error values than the Page model (Table 1). On average, RMSE and MAE for the fractional model were 0.0044 and 0.0036, respectively, compared with 0.0272 and 0.0189 for the Page model. This represents reductions in RMSE and MAE of 83.7% and 81.2%, respectively, relative to the Page model. These results demonstrate the superior predictive accuracy of the fractional model for soybean drying kinetics.
Similar findings have been reported in previous studies, which highlighted the superior predictive capabilities of fractional order models over conventional thin layer drying [13,14,32]. Furthermore, fractional models have shown enhanced performance over traditional kinetic models (pseudo-first order, pseudo-second order, and first order) in modeling separation processes [16].

3.2.2. Effect of Drying Conditions on Model Parameters

The kinetic parameter k increased significantly (p < 0.05) with rising drying temperatures for both the fractional order and Page models (Figure 6a,c). In contrast, drying temperature, airflow rate, and initial moisture content had no statistically significant effect (p ≥ 0.05) on the fractional order model’s parameter α or on the Page model’s parameter n (Table 2, Figure 6b,d). These results align with previous findings on soybean drying, where temperature strongly influenced k but not α [13]. The pronounced dependency of k on temperature is attributed to the inherent relationship between elevated drying temperatures and increased moisture removal rates [13].
Due to the minimal effect of drying conditions on α, its value ranged from 0.499 to 1.11, with an overall mean of 0.79 ± 0.18. Interestingly, this average was comparable to the mean value of the Page model’s parameter n, which was 0.79 ± 0.28. This alignment further supports the applicability of the fractional order model as a robust tool for modeling drying kinetics across varying conditions.
The value of the parameter α aligns closely with the parameter n in the Page model. The average value of α = 0.79 is consistent with those reported for other grains, such as corn (0.689), bean (0.789), and wheat (0.73) [32]. An α value less than 1 indicates that the drying process exhibited sub-diffusion behavior, characterized by slower, less intense moisture migration that deviates from Fickian diffusion [16,32,33]. The observed trends of fractional order model parameters under various drying conditions further validate its suitability for predicting drying behavior.
With α = 0.79, the fractional order model in Equation (9) can be expressed in a generalized form, given in Equation (18). The Mittag-Leffler function in the solution changes form depending on the value of α. Notably, as α → 1, the solution converges to an exponential form E α ( x ) exp ( x ) [13], causing the fractional model to approximate the classic Page model Equation (19). This convergence highlights that the Page model can be regarded as an empirical simplification of the fractional order model applied in this study. This close relationship between the two models further explains their comparable fitting performance (Table 1), with the fractional model offering a more theoretically grounded framework.
M R = E α ( k t 0.79 )
M R = exp ( k t 0.79 )
where MR is moisture ratio, t is drying time (h), and k is the drying constant given by k = 0.0068 T + 0.09 ; R 2 = 0.949 .

3.3. Effect of Drying Conditions on Soybean Quality

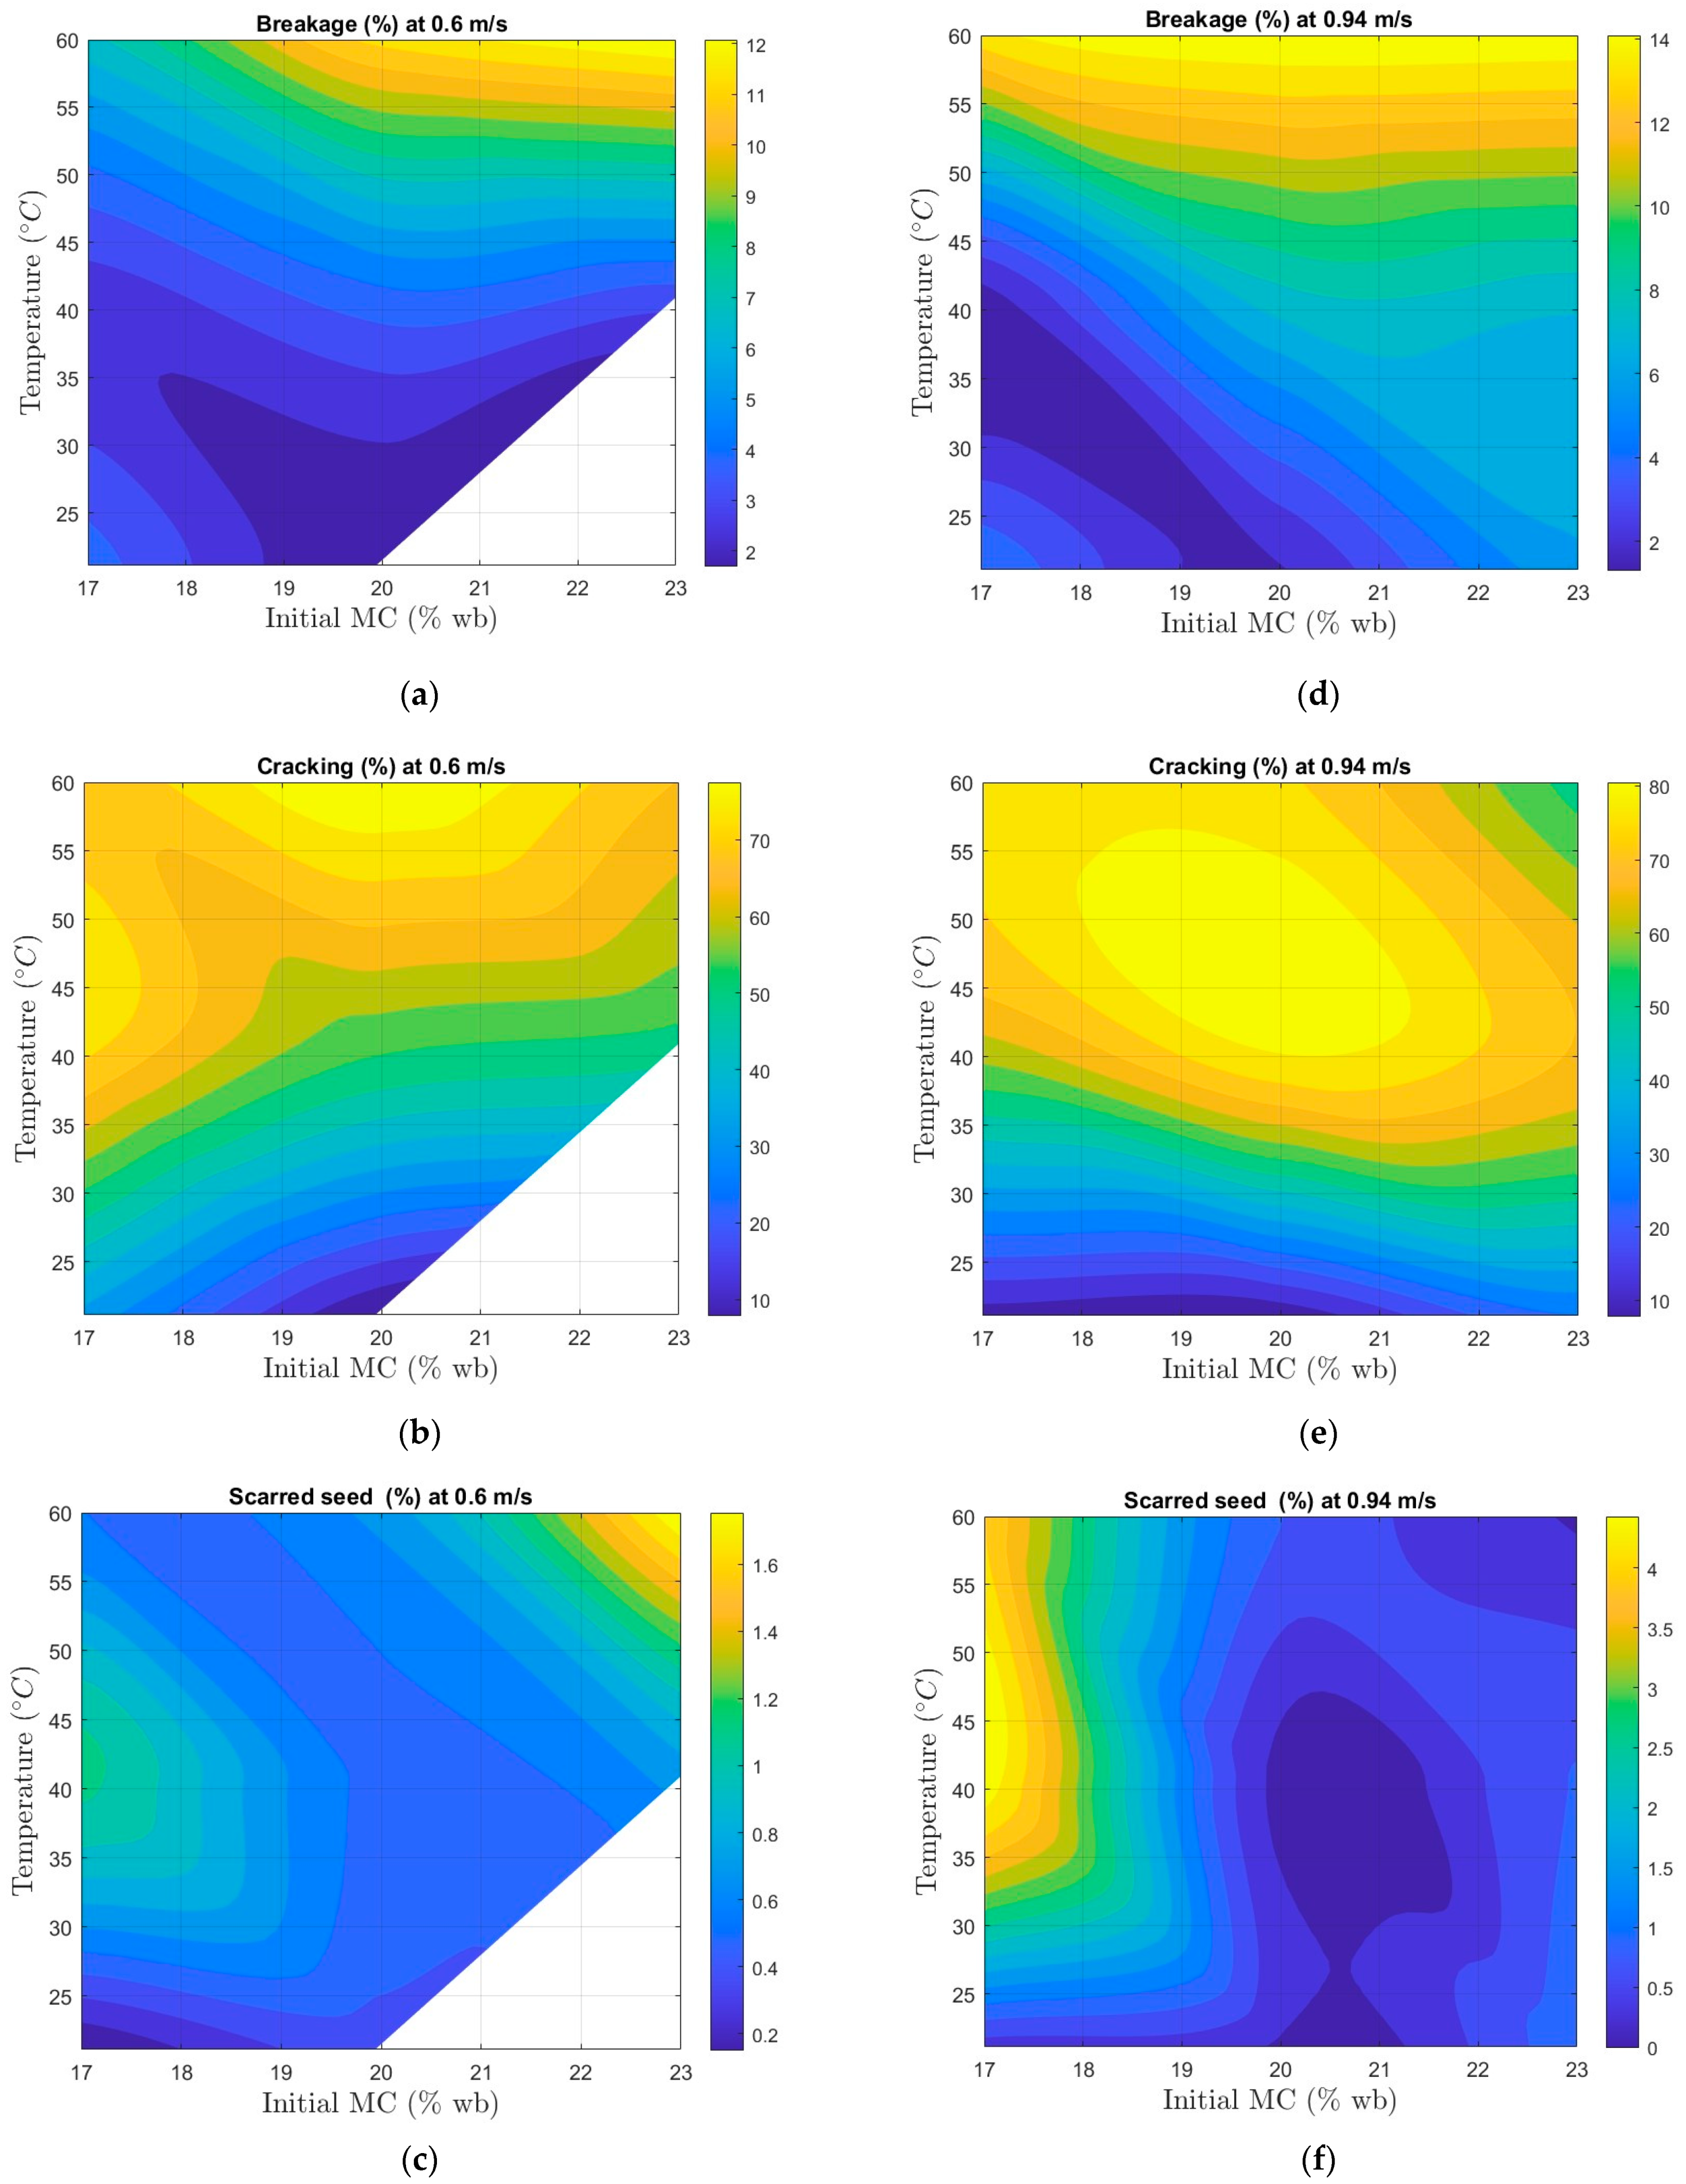
Cracking and breakage increased with both rising drying temperature and higher initial moisture content (Figure 7), with temperature exerting a stronger influence on cracking than on breakage. This may be attributed to the large temperature gradient between the drying air and the kernel surface, which induces internal stress and compromises seed coat integrity. While soybean kernels with low initial moisture content exhibited greater seed scarring at elevated drying temperatures, the effects of temperature and initial moisture content on the seed scarring were generally limited (Figure 7).
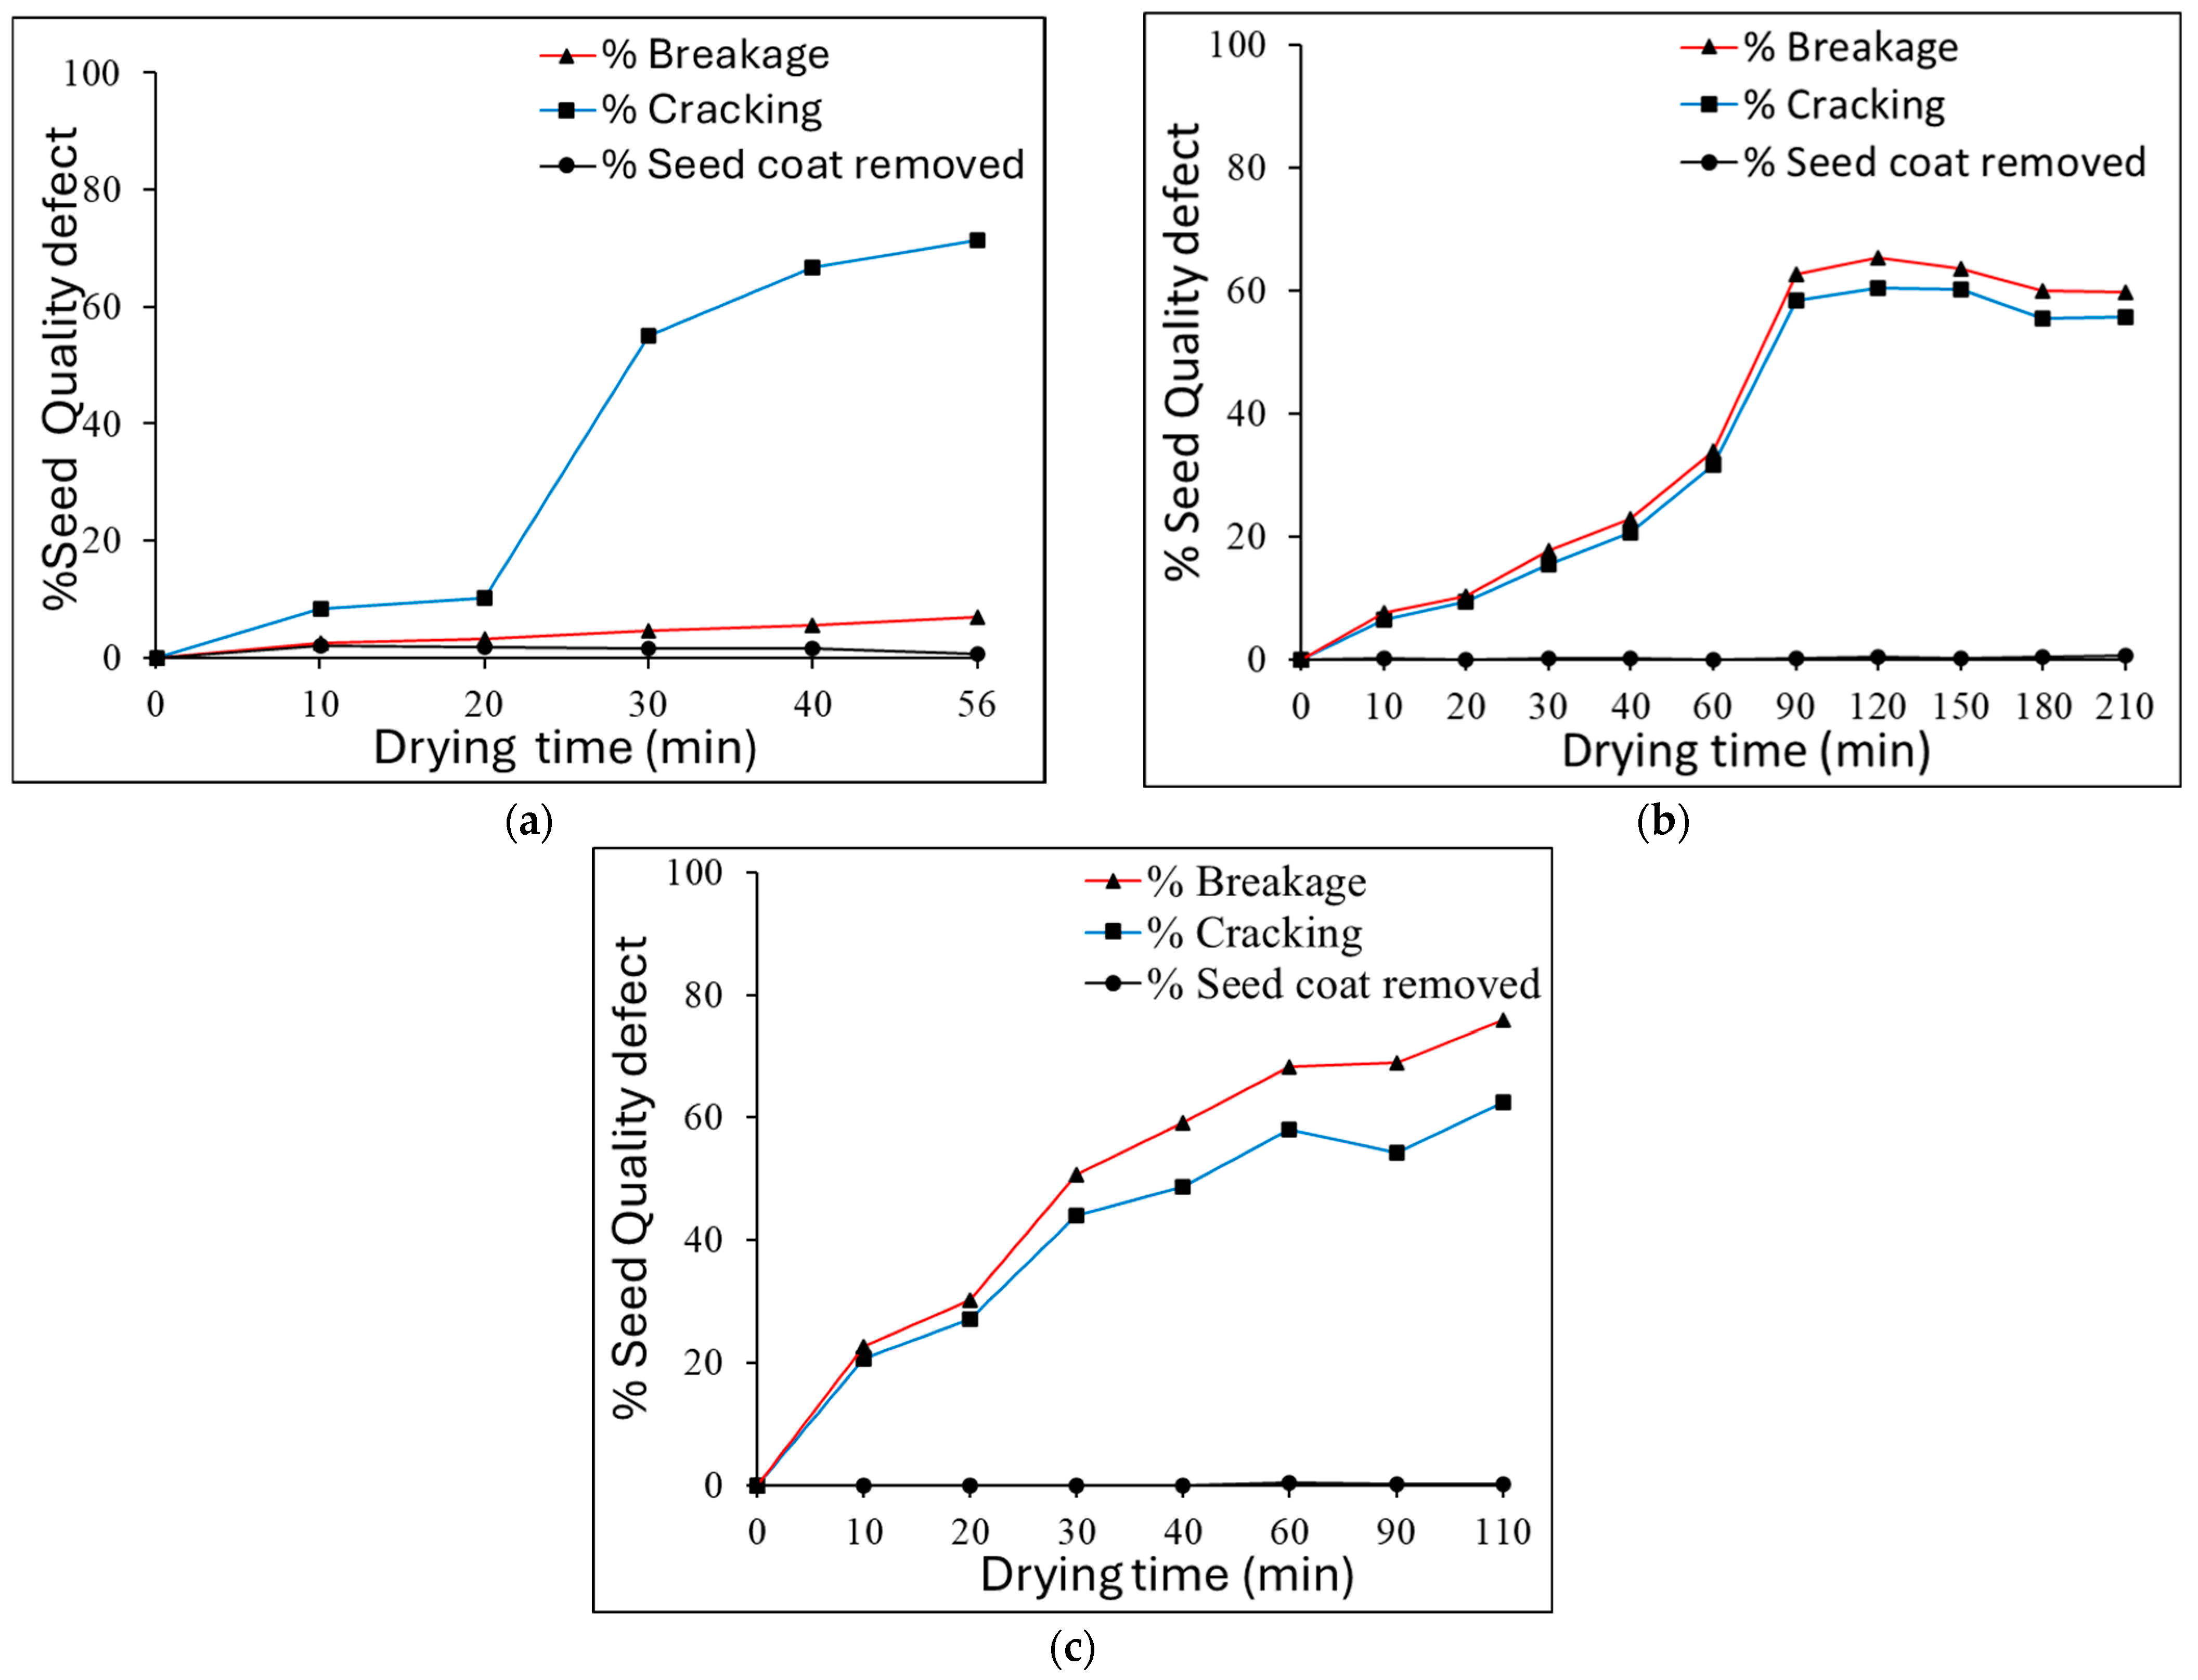
Cracking and breakage also increased with longer drying times (Figure 8), suggesting that these quality defects are strongly influenced by the instantaneous moisture content during drying [27]. For soybeans with initial moisture content ≥ 20% (wb), both cracking and breakage were observed at the onset of the drying process, likely due to enhanced moisture migration from high internal water content. Diffusive moisture loss elevated seed coat temperatures above the air’s wet-bulb temperature, increasing brittleness and susceptibility to mechanical damage. This phenomenon supports the observed trends in cracking and breakage at high drying temperatures and extended drying durations [10,27].
Industry standards consider breakage below 3% acceptable for soybeans intended for animal feed, with 3–5% being marginally acceptable [10,26]. The results of this study indicate that optimal drying conditions for maintaining soybean quality occur at temperatures below 27 °C and initial moisture between 19 and 20% (wb). These conditions are well below the 37.8 °C threshold reported by Hirning (1973), cited in Ting et al. [5], beyond which cracking becomes significant. This range also aligns with low-temperature drying methods, which are considered more suitable for long-term soybean storage compared to natural air drying [34].

3.4. Logistic Modeling of Cracking and Breakage Indices

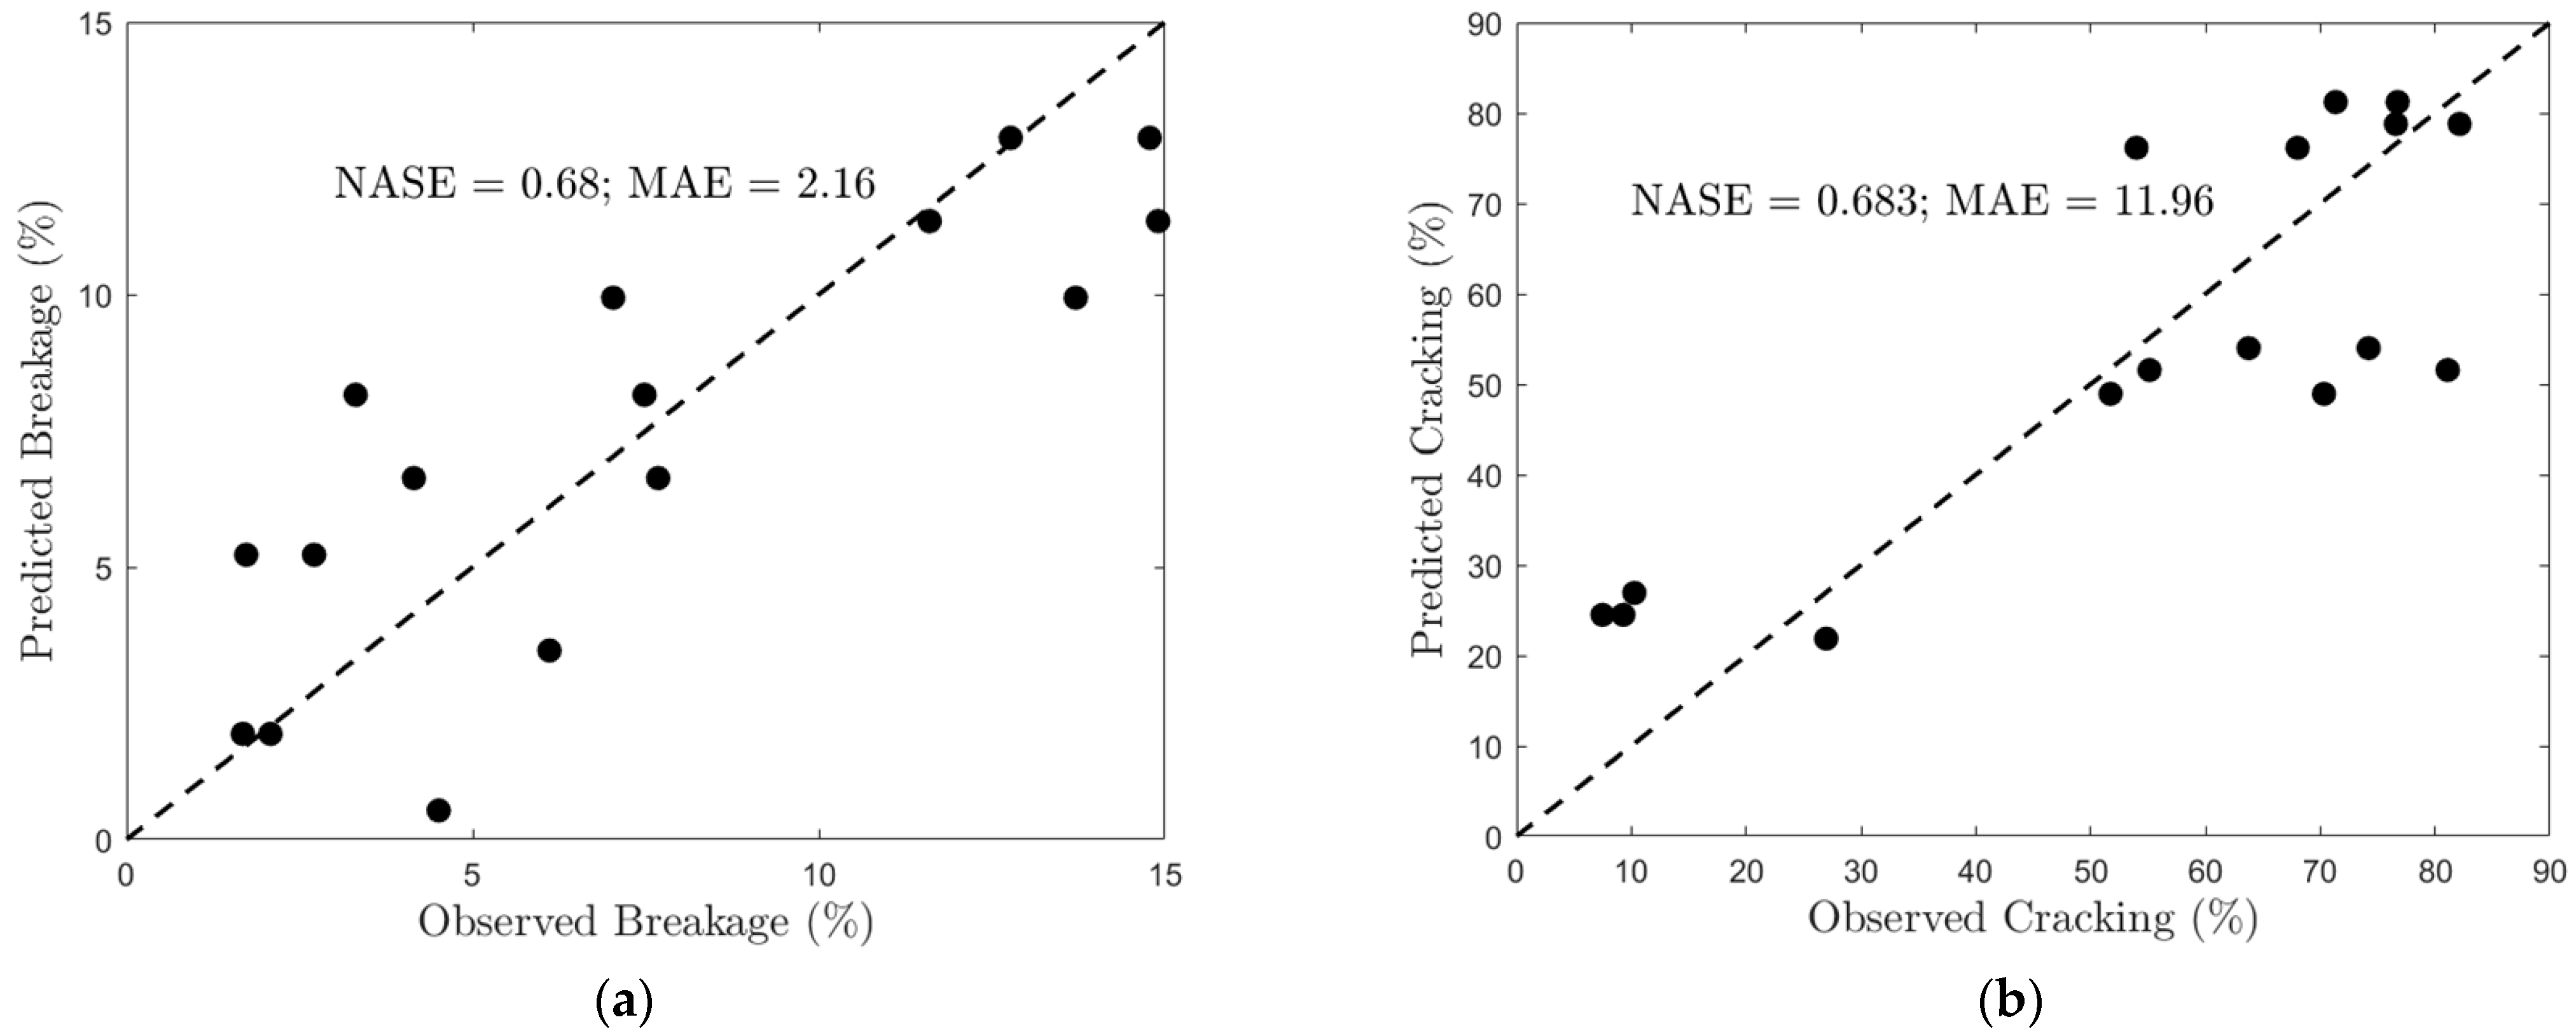
Cracking and breakage were modeled as functions of drying temperature, initial moisture content, and final moisture content, with model fitting metrics presented in Table 3 and Figure 8. Except for constant a, all logistic model constants demonstrated excellent predictive performance. Constants b and c achieved high adjusted R2 values (all >0.98) and low error metrics, with RSME and MAE values both below 1.5 for predicting both breakage and cracking indices (Table 3). The logistic models also gave comparable Nash–Sutcliffe efficiency (NSE) values for both quality indices, indicating similar predictive effectiveness for cracking and breakage behavior. However, a more detailed analysis based on MAE revealed that the logistic model performed slightly better in predicting breakage than cracking (Figure 9). These findings are consistent with previous observations by Soponronnarit et al. [10], who reported similar trends for modeling grain quality indices during drying.

4. Conclusions

This study employed mathematical modeling to evaluate the effects of drying temperature, airflow rate, and initial moisture content on drying kinetics and kernel breakage quality in soybeans. Fractional calculus and logistic regression approaches were applied to characterize drying behavior and quality degradation under controlled conditions. The key findings include the following:
(a)
The fractional model provided significantly greater accuracy in predicting drying behavior, achieving performance improvement of 83.7% in RSME and 81.2% in MAE compared to the Page model. Notably, the fractional order model closely approximated the empirical Page model, suggesting a strong theoretical basis for its application.
(b)
Cracking and breakage increased with both rising drying temperature and higher initial moisture content. Drying temperature had a more pronounced effect on breakage quality than initial moisture content. The optimal drying conditions for minimizing quality deterioration were below 27 °C at 45% relative humidity and an initial moisture content of 19–20% (wb).
(c)
Logistic models demonstrated high predictive accuracy for both breakage and cracking indices, with stronger performance observed for breakage prediction. All logistic model parameters, except constant a, achieved excellent fit statistics (adjusted R2 > 0.98, RMSE and MAE < 1.5).
Overall, the results indicate that both the fractional order and logistic models effectively describe the drying kinetics and quality degradation of soybeans. These findings support the potential for implementing efficient, quality-preserving off-field soybean drying strategies in the northern U.S. production zone.

Author Contributions

Conceptualization, C.L.C.; methodology, C.L.C., I.A.-B., and E.B.; writing—original draft preparation, E.B. and C.L.C.; writing—review and editing, E.B., C.L.C., E.M., and K.H.; visualization, E.B. and C.L.C.; supervision, C.L.C.; project administration, C.L.C.; investigation, I.A.-B.; data curation, E.B., I.A.-B., and W.A.; formal analysis, E.B. and W.A.; funding acquisition, C.L.C. and E.M. All authors have read and agreed to the published version of the manuscript.

Funding

This research was funded in part by the North Dakota Soybean Council, the State Board of Agricultural Research and Extension, and the U.S. Department of Agriculture, National Institute of Food and Agriculture, Multistate Hatch [7010037 & 7005304]. The findings and conclusions in this publication represent those of the author(s) and have not been formally disseminated by the U.S. Department of Agriculture and should not be construed to represent any agency determination or policy.

Data Availability Statement

Data used are contained within the article.

Conflicts of Interest

The authors declare no conflicts of interest.

Nomenclature

a, b, cmodel constants expressed as function of initial moisture content and drying temperature
AIAccuracy Improvement (%)
Brpercentage of broken kernels (%)
Crpercentage of cracked kernels (%)
EαMittag-Leffler function
jnumber of terms of the series of the Mittag-Leffler function
kkinetic constant (h−1)
k0, k1, k2constants
mCaputo derivative constant
MAEmean absolute error
Mcinitial weight of cleaned sample (g)
Meequilibrium moisture content
Mffinal moisture content (%, db)
Miinitial moisture content at t = 0 min (db)
MRmoisture ratio (dimensionless)
Mtmoisture content of soybean at any given time (db)
Mwmass of water added (g)
nreaction order (unitless)
R2coefficient of determination
RMSEroot mean square error
Scpercentage of scarred kernels (%)
Tdrying temperature (K)
tdrying time (h)
W1weight of wet sample (g)
W2weight of dried sample (g)
Wbrweight of broken kernels (g)
Wcinitial moisture content of the cleaned sample (% wb)
Wcrweight of the cracked kernels (g)
Wffinal desired moisture content of the sample (% wb)
Wsweight of soybean sample (g)
Wscmass of scarred kernels (g)
Xmodel performance metric (such as MAE or RMSE)
Yquality index such as Cr and Br
Ycmodel constant such as a, b, and c
τdummy time derivative of Caputo derivative

References

  1. Dai, H.; Wei, S.; Twardowska, I. Biofortification of soybean (Glycine max L.) with Se and Zn, and enhancing its physiological functions by spiking these elements to soil during flowering phase. Sci. Total Environ. 2020, 740, 139648. [Google Scholar] [CrossRef]
  2. Qin, P.; Wang, T.; Luo, Y.J.J.o.A.; Research, F. A review on plant-based proteins from soybean: Health benefits and soy product development. J. Agric. Food Res. 2022, 7, 100265. [Google Scholar] [CrossRef]
  3. CropProphet. US Soybean Production by State: Ranking the Top 11 [In 2024]. Available online: https://www.cropprophet.com/soybean-production-by-state-top-11/ (accessed on 26 July 2025).
  4. Lima, R.E.; Coradi, P.C.; Rodrigues, D.M.; Teodoro, P.E.; Teodoro, L.P.R.; de Oliveira, D.P. Monitoring and predicting the quality of soybeans for different drying and storage technologies on a real scale using sensors and Machine Learning models. J. Stored Prod. Res. 2024, 108, 102386. [Google Scholar] [CrossRef]
  5. Ting, K.; White, G.; Ross, I.; Loewer, O. Seed coat damage in deep-bed drying of soybeans. Trans. ASAE 1980, 23, 1293–1296. [Google Scholar] [CrossRef]
  6. Khoshtaghaza, M.H.; Darvishi, H.; Minaei, S. Effects of microwave-fluidized bed drying on quality, energy consumption and drying kinetics of soybean kernels. J. Food Sci. Technol. 2014, 52, 4749–4760. [Google Scholar] [CrossRef] [PubMed]
  7. Baidhe, E.; Clementson, C.L.; Hellevang, K.; Lin, Z. Comprehensive analysis of drying kinetics, heat and mass transfer, and thermaodynamic properties in high-temperature drying of high-moisture corn. J. Food Process Eng. 2025, 48, e70159. [Google Scholar] [CrossRef]
  8. Lima, R.E.; Coradi, P.C.; Nunes, M.T.; Bellochio, S.D.C.; da Silva Timm, N.; Nunes, C.F.; de Oliveira Carneiro, L.; Teodoro, P.E.; Campabadal, C. Mathematical modeling and multivariate analysis applied earliest soybean harvest associated drying and storage conditions and influences on physicochemical grain quality. Sci. Rep. 2021, 11, 23287. [Google Scholar] [CrossRef] [PubMed]
  9. Jung, H.; Yoon, W.B. The effect of intermittent drying on the cracking ratio of soybeans (Glycine max) at different relative humidity using reaction engineering approach modeling. Food Sci. Nutr. 2018, 6, 1492–1500. [Google Scholar] [CrossRef]
  10. Soponronnarit, S.; Swasdisevi, T.; Wetchacama, S.; Wutiwiwatchai, W. Fluidised bed drying of soybeans. J. Stored Prod. Res. 2001, 37, 133–151. [Google Scholar] [CrossRef]
  11. de Oliveira, D.E.C.; Resende, O.; Bessa, J.F.V.; Kester, A.N.; Smaniotto, T.A.S. Mathematical modeling and thermodynamic properties for drying soybean grains. Afr. J. Agric. Res. 2015, 10, 31–38. [Google Scholar] [CrossRef]
  12. Silva, L.P.; dos SANTOS, S.G.F.; Queiroz, J.S.; Rodovalho, R.S.; Buso, W.H.D. Drying kinetics of soybean grains. Científica 2020, 48, 99–106. [Google Scholar] [CrossRef]
  13. Nicolin, D.J.; Defendi, R.O.; Rossoni, D.F.; de Matos Jorge, L.M. Mathematical modeling of soybean drying by a fractional-order kinetic model. J. Food Process Eng. 2018, 41, e12655. [Google Scholar] [CrossRef]
  14. Aranha, A.C.R.; Ferrari, A.L.; Bissaro, C.A.; Matias, G.D.S.; Defendi, R.O.; Paschoal, S.M.; Jorge, L.M.D.M. Mathematical modelling of wheat drying by fractional order and assessment of transport properties. Can. J. Chem. Eng. 2024, 102, 996–1006. [Google Scholar] [CrossRef]
  15. Erenturk, K.; Kose, B.; Erenturk, S.J.F.S.; International, T. Fractional order calculus approach for drying modeling of eggplants. Food Sci. Technol. Int. 2020, 26, 379–387. [Google Scholar] [CrossRef]
  16. Ferrari, A.L.; Gomes, M.C.S.; Aranha, A.C.R.; Paschoal, S.M.; de Souza Matias, G.; de Matos Jorge, L.M.; Defendi, R.O. Mathematical modeling by fractional calculus applied to separation processes. Sep. Purif. Technol. 2024, 337, 126310. [Google Scholar] [CrossRef]
  17. Balasubramanian, D. Physical properties of raw cashew nut. J. Agric. Eng. Res. 2001, 78, 291–297. [Google Scholar] [CrossRef]
  18. Visvanathan, R.; Palanisamy, P.; Gothandapani, L.; Sreenarayanan, V. Physical properties of neem nut. J. Agric. Eng. Res. 1996, 63, 19–25. [Google Scholar] [CrossRef]
  19. ASAE S352.2 April 1988 (R2008); Moisture Measuremtn-Unground Grain and Seeds. ASABE: St. Joseph, MI, USA, 2008.
  20. Baidhe, E.; Clemenston, C.L.; Hellevang, K.; Lin, Z. Optimization of high-temperature drying conditions for enhanced quality of high-moisture corn. Smart Agric. Technol. 2025, 12, 101271. [Google Scholar] [CrossRef]
  21. He, C.; Wang, H.; Yang, Y.; Huang, Y.; Zhang, X.; Arowo, M.; Ye, J.; Zhang, N.; Xiao, M. Drying behavior and kinetics of drying process of plant-based enteric hard capsules. Pharmaceutics 2021, 13, 335. [Google Scholar] [CrossRef]
  22. Mondal, M.H.T.; Akhtaruzzaman, M.; Sarker, M.S.H. Modeling of dehydration and color degradation kinetics of maize grain for mixed flow dryer. J. Agric. Food Res. 2022, 9, 100359. [Google Scholar] [CrossRef]
  23. Agnew, J. Equilibrium Moisture Content Charts for Grain Storage Management; Prairie Agricultural Machinery Institute: Humboldt, SK, Cannda, 2017. [Google Scholar]
  24. Page, G.E. Factors Influencing the Maximum Rates of Air Drying Shelled Corn in Thin layers. Master’s Thesis, Purdue University, West Lafayette, IN, USA, 1949. [Google Scholar]
  25. ANSI/ASAE S448.2 SEP2014 (R2022); Thin-Layer Drying of Agricultural Crops. ASABE: St. Joseph, MI, USA, 2022.
  26. Dondee, S.; Meeso, N.; Soponronnarit, S.; Siriamornpun, S. Reducing cracking and breakage of soybean grains under combined near-infrared radiation and fluidized-bed drying. J. Food Eng. 2011, 104, 6–13. [Google Scholar] [CrossRef]
  27. Wiriyaumpaiwong, S.; Soponronnarit, S.; Prachayawarakorn, S. Effect of temperature on soybean quality using spouted bed technique. Kasetsart J. (Nat. Sci.) 2001, 35, 460–466. [Google Scholar]
  28. Hanoon, M.S.; Ammar, A.M.; Ahmed, A.N.; Razzaq, A.; Birima, A.H.; Kumar, P.; Sherif, M.; Sefelnasr, A.; El-Shafie, A. Application of soft computing in predicting groundwater quality parameters. Front. Environ. Sci. 2022, 10, 828251. [Google Scholar] [CrossRef]
  29. Eryani, I.; Jayantari, M.; Wijaya, I. Sensitivity analysis in parameter calibration of the WEAP Model for integrated water resources management in Unda watershed. Civ. Eng. Archit. 2022, 10, 455–469. [Google Scholar] [CrossRef]
  30. Golpour, I.; Guiné, R.P.; Poncet, S.; Golpour, H.; Amiri Chayjan, R.; Amiri Parian, J. Evaluating the heat and mass transfer effective coefficients during the convective drying process of paddy (Oryza sativa L.). J. Food Process Eng. 2021, 44, e13771. [Google Scholar] [CrossRef]
  31. Coradi, P.C.; Fernandes, C.H.; Helmich, J.C.; Goneli, A.L.J.E.A. Effects of drying air temperature and grain initial moisture content on soybean quality (Glycine max (L.) Merrill). Eng. Agrícola 2016, 36, 866–876. [Google Scholar] [CrossRef]
  32. Ferrari, A.L.; Aranha, A.C.R.; Nascimento, F.M.; Romansina, B.C.; de Matos Jorge, L.M.; Nicolin, D.J.; Gomes, M.C.S.; Defendi, R.O. Mathematical modeling of beans, corn and wheat drying by fractional calculus. J. Food Process Eng. 2023, 46, e14390. [Google Scholar] [CrossRef]
  33. Matias, G.S.; Lermen, F.H.; Matos, C.; Nicolin, D.J.; Fischer, C.; Rossoni, D.F.; Jorge, L.M. A model of distributed parameters for non-Fickian diffusion in grain drying based on the fractional calculus approach. Biosyst. Eng. 2023, 226, 16–26. [Google Scholar] [CrossRef]
  34. Sadaka, S. On-Farm Drying and Storage of Soybeans. In Arkansas Soybean Production Handbook; University of Arkansas Division of Agriculture: Little Rock, AR, USA, 2014. [Google Scholar]
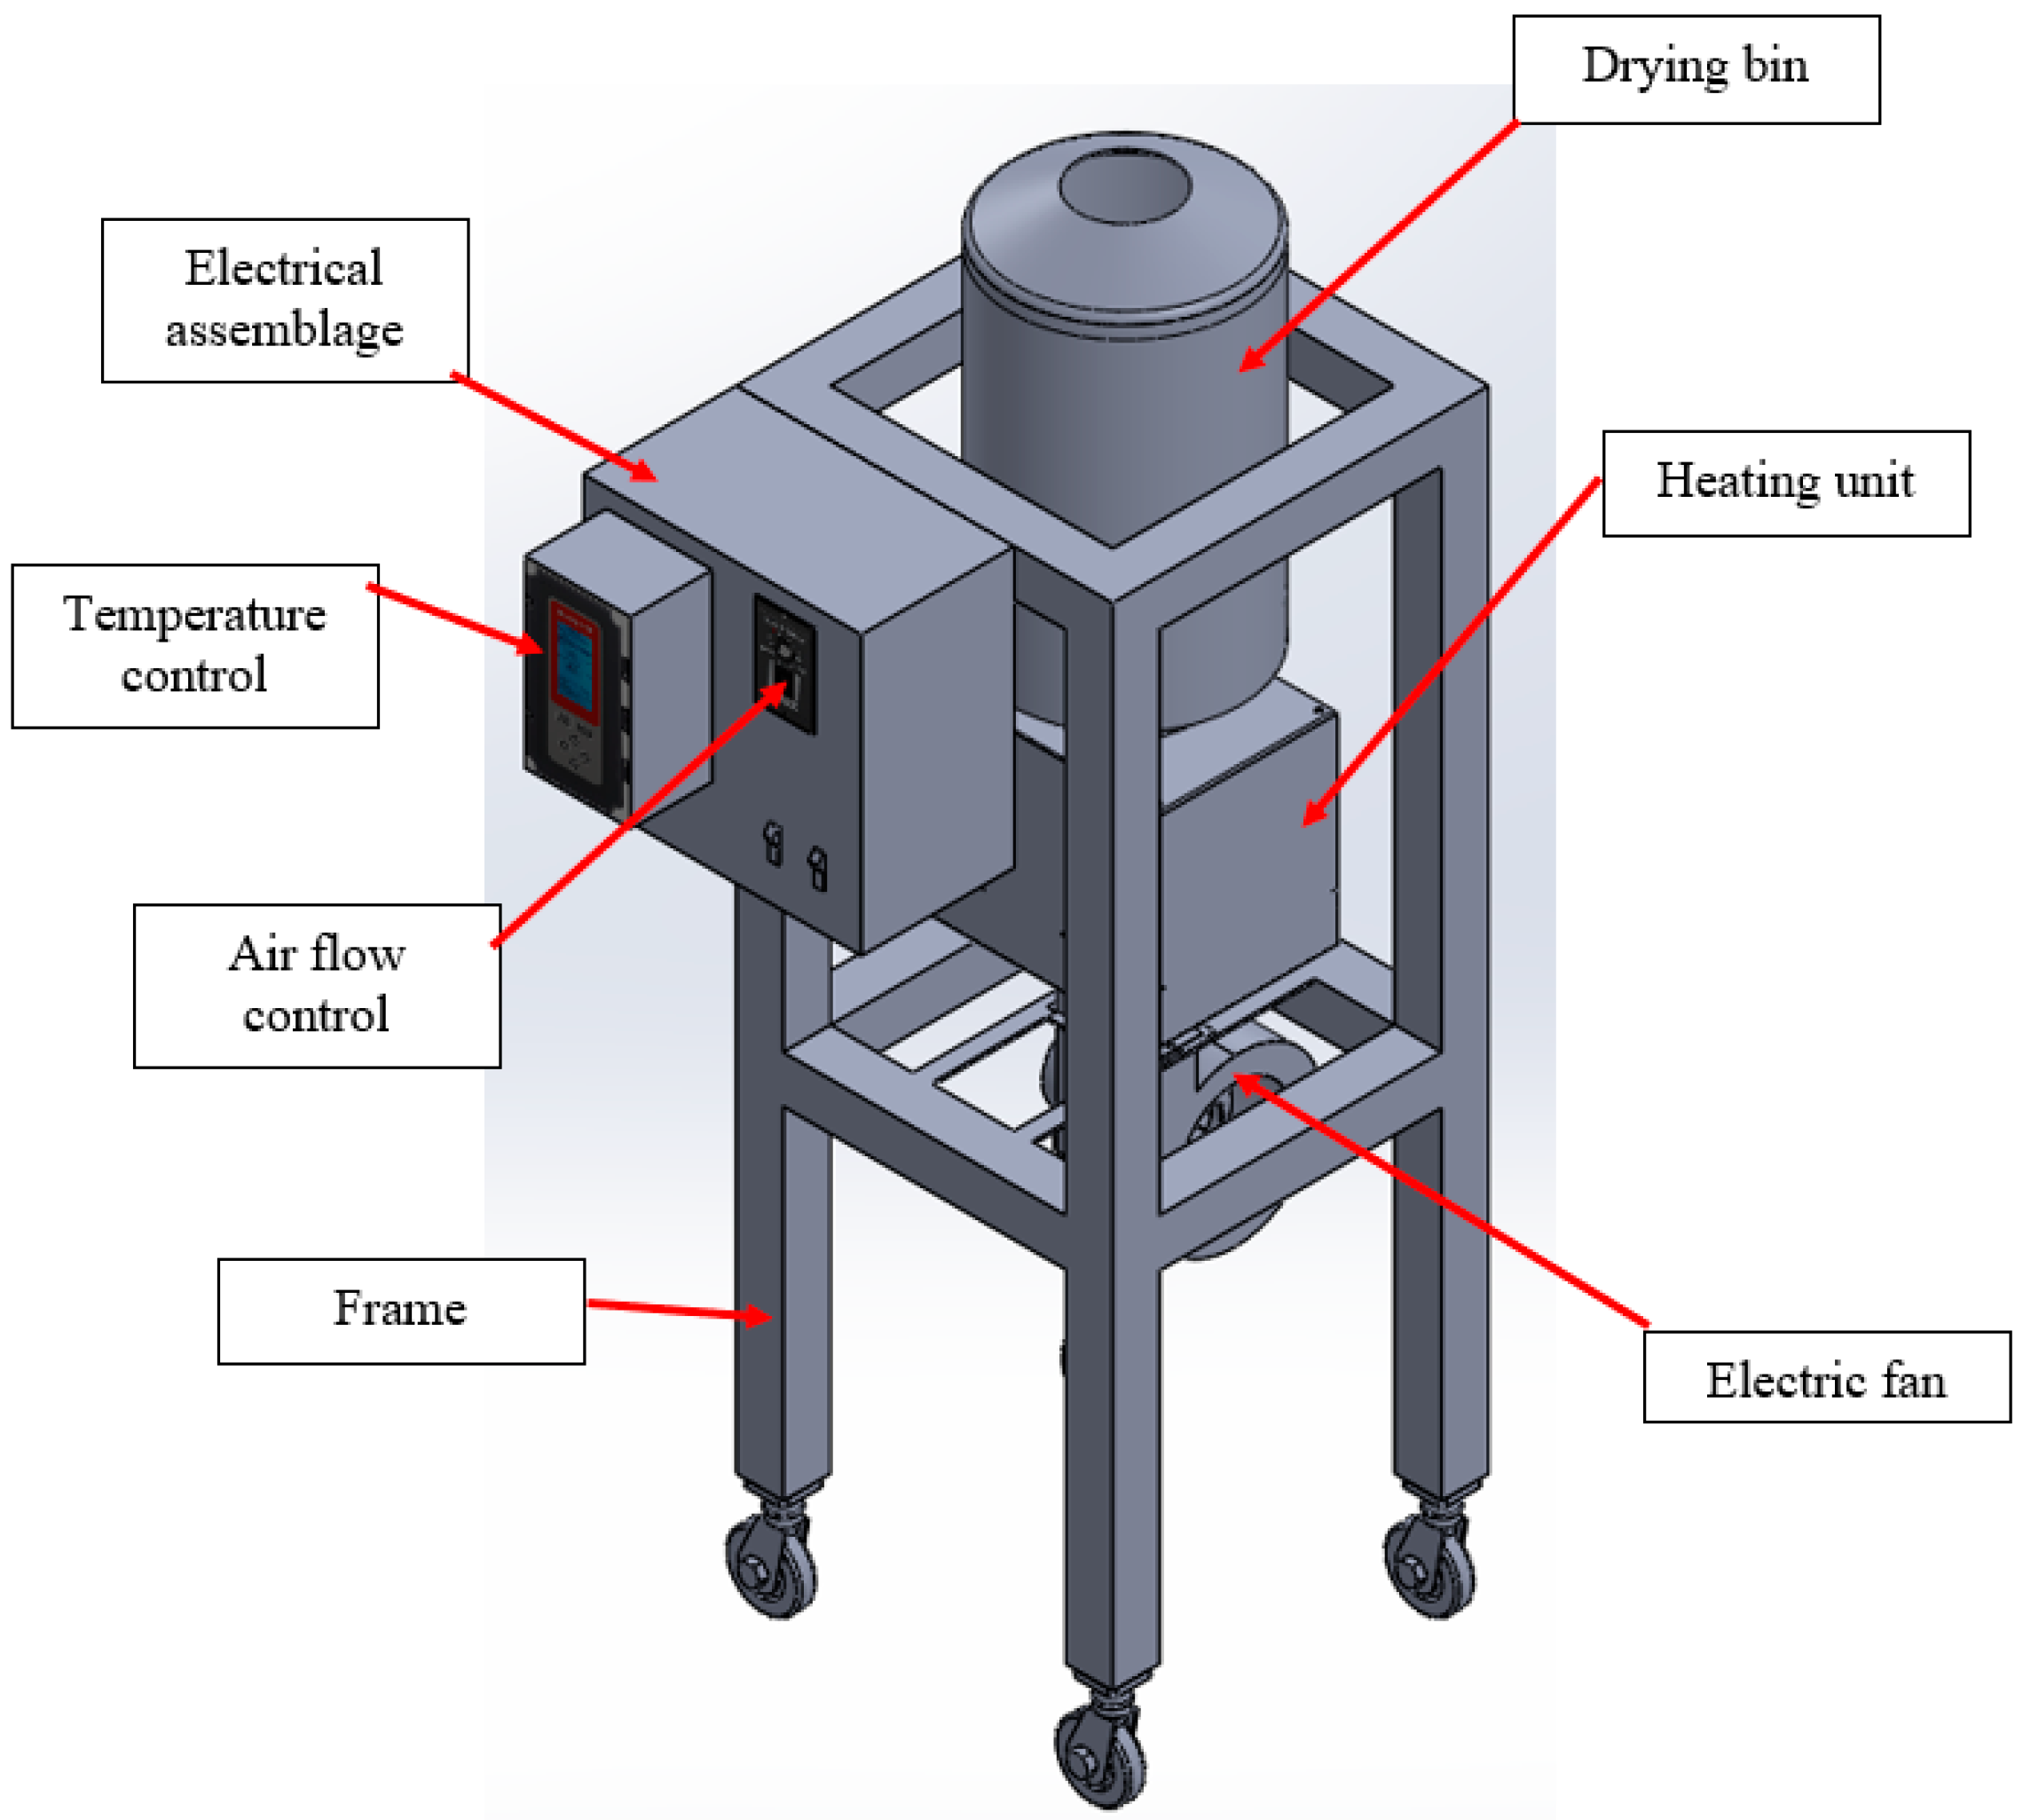
Figure 1. Isometric view of laboratory drying equipment [20].
Agriengineering 07 00273 g001
Figure 2. Visual description of breakage quality indices.
Agriengineering 07 00273 g002
Figure 3. Moisture ratio curves for soybean drying at different conditions of initial moisture, airflow, and temperature: (a) 21.1 °C, 0.6 m/s, (b) 21.1 °C, 0.94 m/s, (c) 40.6 °C, 0.6 m/s, (d) 40.6 °C, 0.94 m/s, (e) 60 °C, 0.6 m/s, and (f) 60 °C, 0.94 m/s.
Agriengineering 07 00273 g003
Figure 4. Contour plots of the effect of drying conditions on drying time: (a) 0.6 m/s and (b) 0.94 m/s. [Note: color bars represent the range of drying time].
Agriengineering 07 00273 g004
Figure 5. Variation of moisture ratio with drying time under different modeling approaches. [Note: experimental values based on drying conditions of 21.1 °C, 0.94 m/s, and 20%wb].
Agriengineering 07 00273 g005
Figure 6. Interactive effect of drying temperature and initial moisture content on (a,b) fraction order model parameters and (c,d) Page model parameters. [Note: Bars with same letters are not significantly different at 5% level of significance].
Agriengineering 07 00273 g006
Figure 7. Contour plots of the effect of drying conditions on soybean quality: (ac) 0.6 m/s, (df) 0.94 m/s. [Note: color bars represent the range of respective breakage quality indices].
Agriengineering 07 00273 g007
Figure 8. Variation of quality parameters over drying time for (a) 17% wb, 60°C, 0.6 m/s, (b) 20% wb, 40.6°C, 0.6 m/s, and (c) 23% wb, 60°C, 0.94 m/s.
Agriengineering 07 00273 g008
Figure 9. Plots of predicted vs. observed values of quality indices of soybean as a function of initial moisture content, final moisture content, and drying temperature. (a) Breakage, (b) cracking.
Agriengineering 07 00273 g009
Table 1. Statistical comparison of fractional order and Page model.
Airflow Velocity (m/s)IMC
(% wb)
Temp (°C)Fractional ModelPage Model
RMSEMAER2Adj R2RMSEMAER2Adj R2
0.617600.00480.00380.9140.8570.02540.01460.9730.967
20600.00390.00330.9810.9730.02540.01840.980.977
23600.00740.00650.9750.9680.03660.02860.9750.972
0.9417600.00340.00260.9640.9390.03280.02020.9640.955
20600.00540.00420.9640.950.03460.02370.9660.96
23600.0050.00430.9890.9870.02390.01850.990.989
0.61740.60.00530.00390.9050.8670.04850.03140.9030.887
2040.60.00260.00210.9930.9920.01540.01140.9930.993
2340.60.00390.00250.9890.9880.020.01220.990.99
0.941740.60.00220.00180.9820.9730.02150.01450.980.977
2040.60.0030.00250.9890.9870.0170.01210.990.989
2340.60.00490.00410.9810.9780.02470.01920.9830.981
0.61721.10.00280.00240.9730.9670.02430.01050.9720.97
2021.10.00640.00480.9620.9570.03370.02430.9670.965
2321.10.00580.00480.980.9780.02840.02230.9810.98
0.941721.10.00250.00220.9720.9640.02190.01790.9720.969
2021.10.00490.00410.9780.9740.0270.02080.980.978
2321.10.00540.00420.9770.9730.02820.02020.9760.974
IMC—initial moisture content, RMSE—root mean square error, MAE—mean absolute error, R2—coefficient of determination, Adj R2—adjusted coefficient of determination.
Table 2. Effect of drying airflow rates on model parameters.
Airflow Velocity (m/s)Fractional Order ModelPage Model
k (h−α)αk (h−1)n
0.60.306 ± 0.107 a0.828 ± 0.143 a0.324 ± 0.123 a0.862 ± 0.308 a
0.940.423 ± 0.152 a0.748 ± 0.216 a0.423 ± 0.145 a0.718 ± 0.255 a
p-value0.080.3730.1380.297
Means ± SD with different superscripts within a column are significantly different at 0.05; k—fractional order or Page model kinetic constant, α—arbitrary order for fractional time derivative, n—the reaction order.
Table 3. Statistical values of prediction of constants in logistic model.
Quality IndexConstant ExpressionsRMSEMAER2Adj R2
Cracking a = 372.79 0.539 M i + 1.394 T 21.28417.8320.85950.8494
b = 0.473 0.0077 M i 0.0552 T 0.8380.7050.99760.9973
c = 15.02 0.0053 M i 0.086 T 1.3071.0990.98890.9871
Breakage a = 77.03 + 0.312 M i + 0.242 T 3.8553.3160.78030.7465
b = 0.498 0.0023 M i 0.0282 T 0.4290.3610.99750.9971
c = 2.988 0.048 M i + 0.012 T 0.2510.2050.99790.9976
a, b, and c are constants, R2 is coefficient of determination, Adj R2 is adjusted R2, RMSE is root mean square error, MAE is mean absolute error, Mi is the initial moisture content (%, db), T is the drying temperature (K).
Disclaimer/Publisher’s Note: The statements, opinions and data contained in all publications are solely those of the individual author(s) and contributor(s) and not of MDPI and/or the editor(s). MDPI and/or the editor(s) disclaim responsibility for any injury to people or property resulting from any ideas, methods, instructions or products referred to in the content.