1. Introduction
Brazil is the world’s largest coffee producer and exporter, contributing approximately 37% of global production in the 2024/2025 harvest, amounting to a total of 3.882 million tons [
1]. Minas Gerais stands out as the country’s leading coffee-producing state, responsible for about 69.9% of national Arabica coffee production over the last decade [
2]. Given this significance, losses in coffee crops caused by pest infestations have a direct impact on state, national, and global economies, thereby driving the ongoing pursuit of improved methods for sampling, evaluation, and monitoring of coffee plantations.
The coffee leaf miner (CLM),
Leucoptera coffeella (Guérin-Mèneville), is one of the main pests of coffee plants [
3]. The larval stage is responsible for the leaf damage, considering the feeding process on the plant parenchyma and the building of galleries, which reduces the photoassimilate area [
4]. This injury can reduce the final coffee production, indirectly affecting the coffee yield and quality [
5]. Normally, the infestation rates consider the damage caused by the insect, which involves a mine formation that changes the color and texture of the leaf, promoting visual differences in the color scale. Those color parameters allow the remote sensing to act distinctly, evaluating and comparing the infested and healthy plants [
6], highlighting the urgent need and pursuit of new methodologies and parameters that respond with accuracy and efficiency to the challenges faced by different crop producers worldwide.
Severe infestations can result in yield losses exceeding 50% [
4]. In addition to the production damage, chemical control of this pest entails high costs and environmental risks due to the intensive use of insecticides in coffee production. Furthermore, the widespread and growing resistance of Brazilian pest populations to various classes of insecticides exacerbates these challenges. Such resistance not only undermines the efficacy of chemical control measures but also contributes to an increase in pesticide use, thereby intensifying the environmental and economic burdens associated with pest management [
7]. Recent studies indicate that such practices may compromise the sustainability of production systems [
8,
9]. It is also important to note that CLM infestation levels are often underestimated in the field, as conventional monitoring methods typically based on the use of traps or manual counting of mined leaves may fail to capture the true spatial extent and intensity of damage [
4]. Therefore, adopting strategies that enable early, continuous, and cost-effective monitoring is crucial to ensure more efficient control, more assertive decision-making, and the rational use of pesticides.
Combined time series of Landsat and Sentinel-2 have proven highly effective for phenological monitoring in agricultural systems. Ref. [
10] demonstrated that the use of harmonized NDVI enables the identification of consistent phenological patterns in small-scale areas in East Africa, even under high spatial heterogeneity. Complementarily, Ref. [
11] presented a workflow implemented in Google Earth Engine to generate harmonized data from Landsat and Sentinel-2, allowing for continuous and large-scale analyses.
In this context, remote sensing through the Google Earth Engine (GEE) platform emerges as an effective tool for monitoring CLM. GEE is a free computational platform for research and education, widely applied in studies involving remote sensing and geotechnologies [
12]. Its use has expanded to several areas, including geoprocessing, agriculture, monitoring degraded and unproductive areas, and detecting environmental disasters [
13,
14,
15,
16]. GEE integrates a vast satellite image database with analytical tools in JavaScript and Python, allowing for the efficient processing of large volumes of data and significantly contributing to scientific research. With fast and continuous access, GEE shows strong potential for broader applications in agriculture [
17]. However, further research is still required on coffee pest monitoring, particularly regarding the integration of fuzzy logic with remote sensing data for CLM detection.
Fuzzy logic, an extension of Boolean logic, supports continuous degrees of truth in the interval 0, 1, enabling the representation of uncertainties through linguistic terms such as “high” or “low.” Each variable is described by membership functions, and outputs are derived from IF–THEN rules, generating gradual responses [
18]. In coffee farming, fuzzy logic-based models have proven to be effective in both crop management and post-harvest processes. For instance, Ref. [
19] developed a fuzzy inference system to estimate Coffea arabica yield based on irrigation, water deficit, and temperature, contributing to crop management. Similarly, Ref. [
20] applied fuzzy controllers to rotary dryers for Coffea canephora, achieving greater thermal stability, reduced drying time, and improved bean quality.
Beyond coffee cultivation, Fuzzy Logic has also been employed in the agricultural monitoring of different crops. Ref. [
21] Applied fuzzy inference systems to analyze environmental variables related to rice growth, enabling the identification of stress conditions and supporting crop management. Similarly, Ref. [
22] used this approach in sugarcane, integrating agronomic parameters and spectral indices derived from remote sensing to improve predictions of crop development. These findings highlight the versatility of Fuzzy Logic and reinforce its potential for application in diverse production contexts. Although recent studies have demonstrated the feasibility of detecting coffee leaf miner infestation using multispectral data from UAVs [
23], satellite-based approaches for monitoring this pest are still emerging in the scientific literature [
24]. Existing applications of fuzzy systems in agriculture have primarily targeted environmental monitoring, crop quality evaluation, and post-harvest processes, with few implementations focused on spectral responses specifically associated with pest-induced stress [
25,
26].
Moreover, vegetation indices such as GNDVI, IPVI, and MCARI have been widely used in tropical crops to assess chlorophyll content, canopy vigor, and structural changes under biotic stress [
27,
28]. Studies applying these indices to coffee plantations have shown that infested plants tend to exhibit lower VI values, indicating their sensitivity to physiological effects caused by coffee leaf miner infestation [
23,
24].
Given this background, the present study aims to evaluate the potential of a fuzzy logic algorithm to identify coffee leaf miner infestation patterns using a 2.5-year historical series of Sentinel-2A satellite imagery processed through the Google Earth Engine platform.
2. Materials and Methods
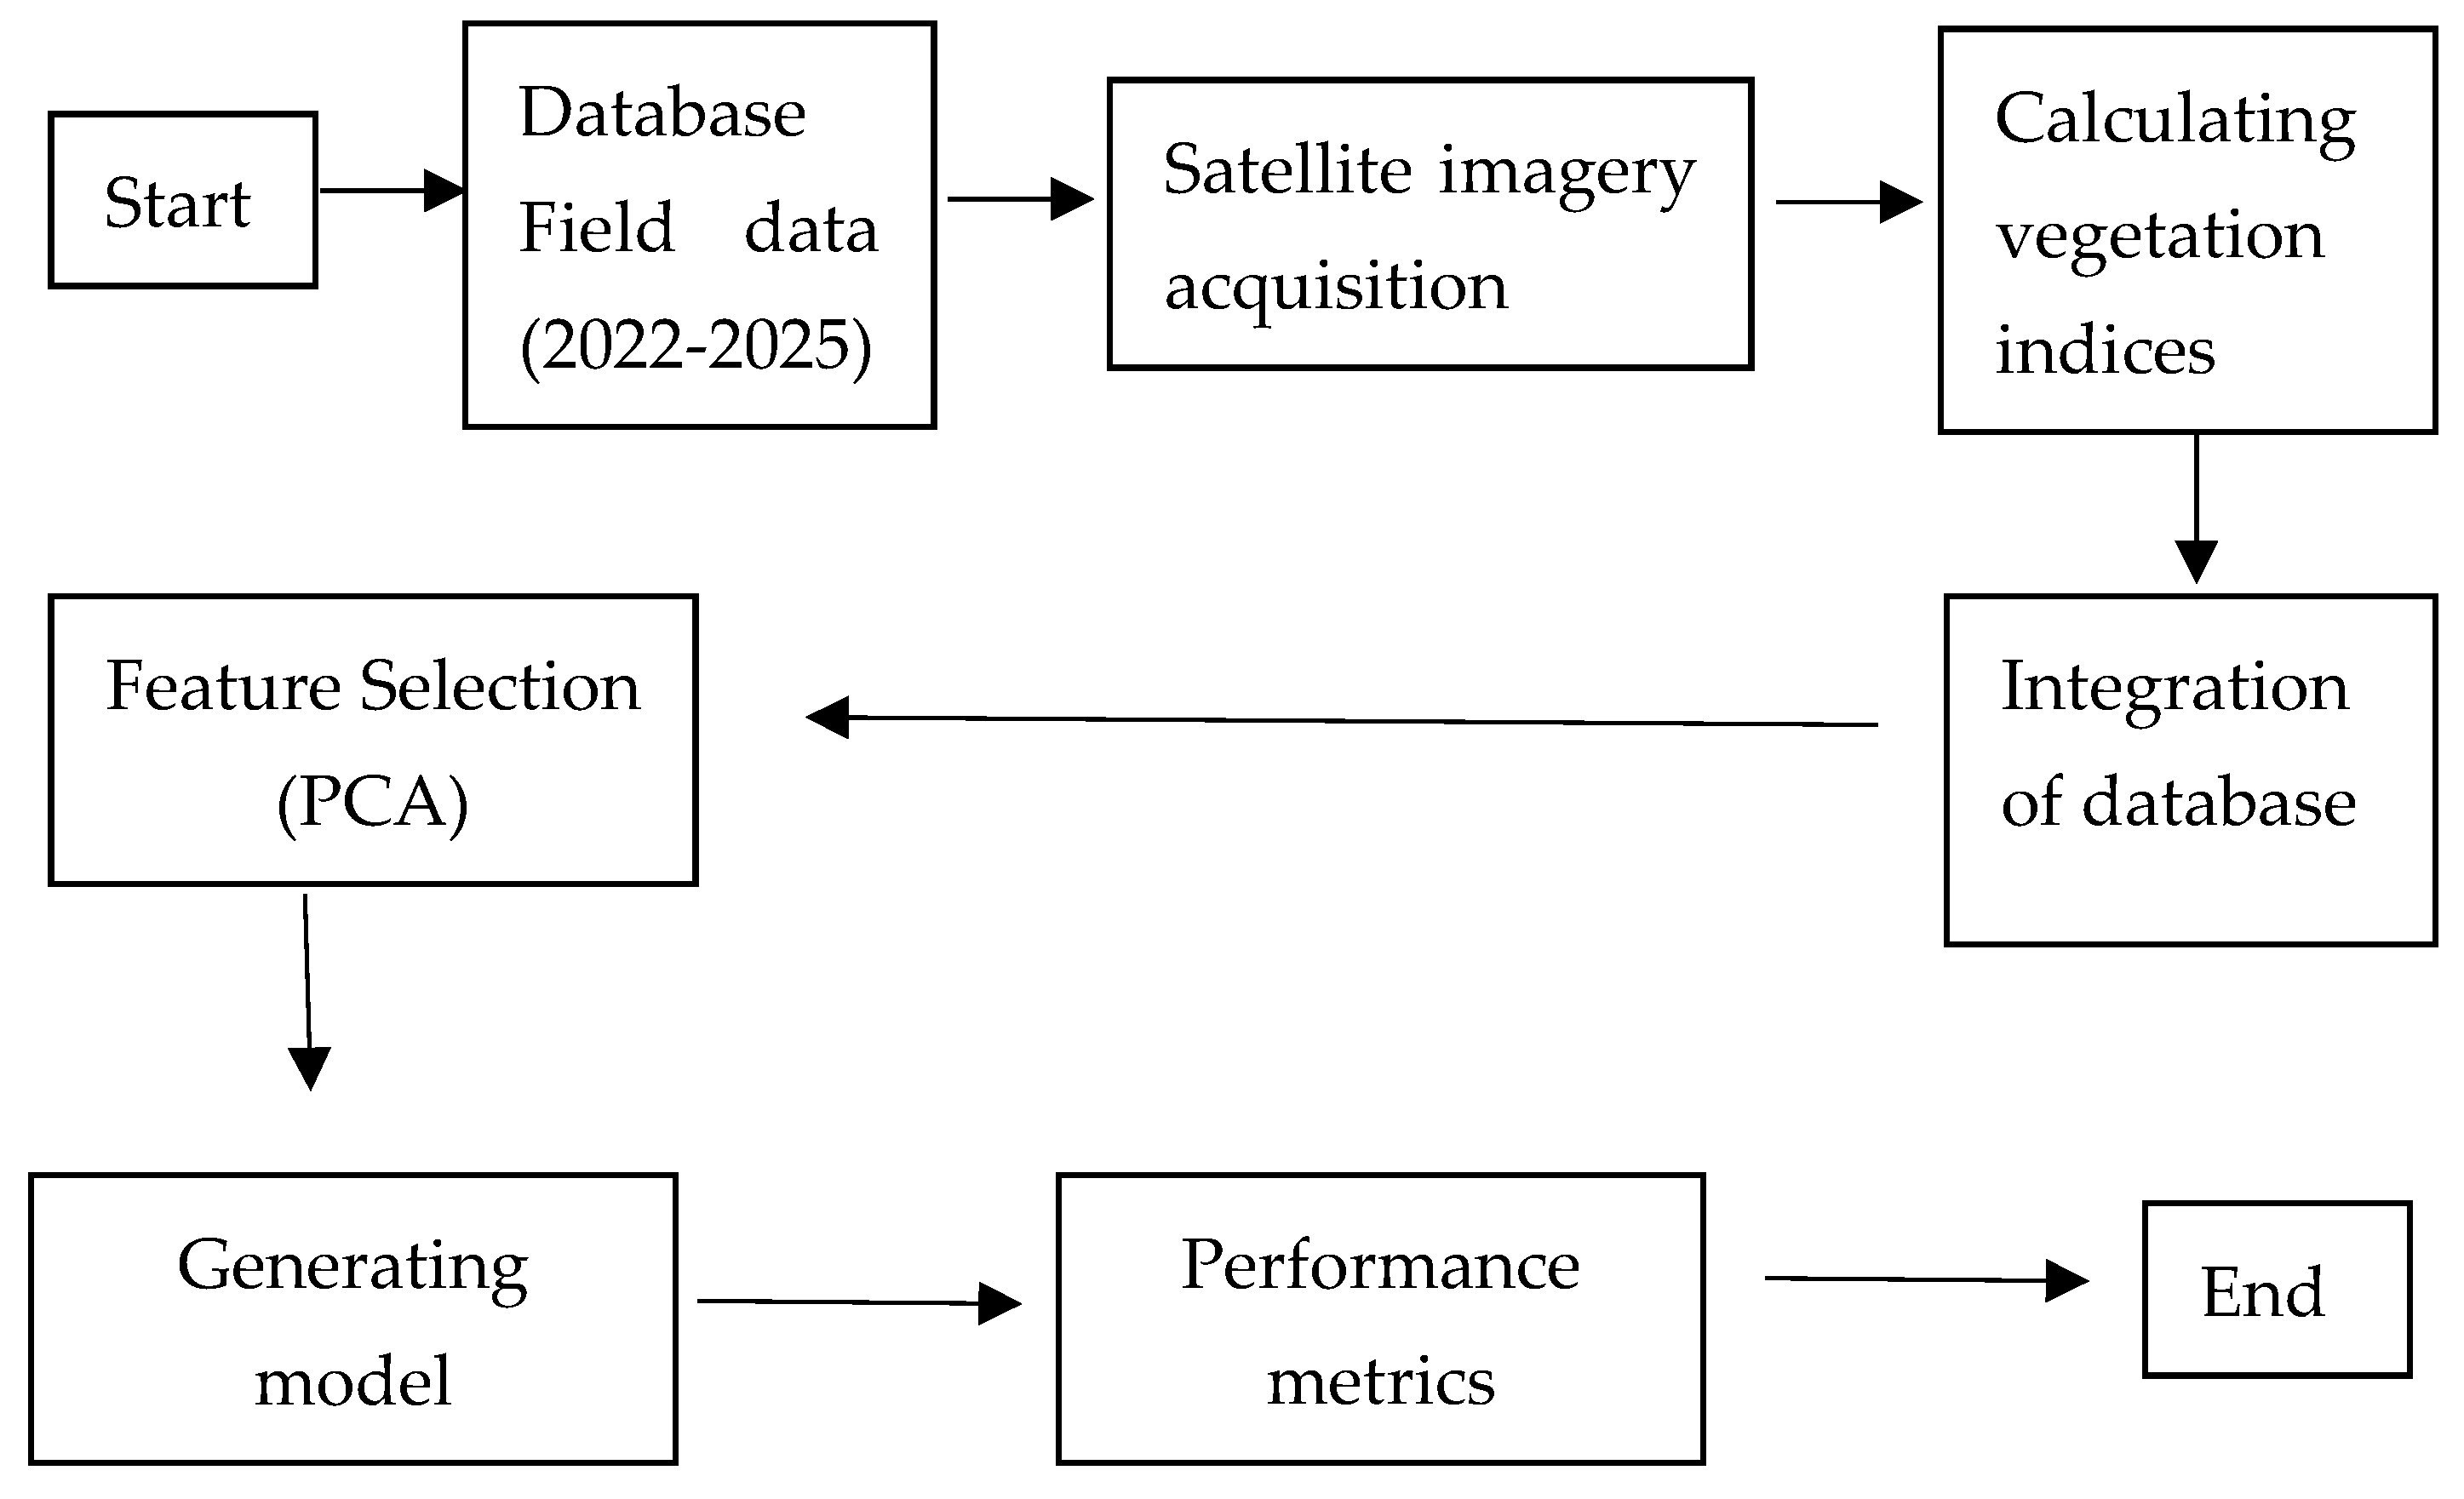
To evaluate the application of fuzzy logic in detecting coffee leaf miner infestation using Sentinel-2 satellite imagery, the study was conducted in four stages, as shown in the flowchart below (
Figure 1).
2.1. Location
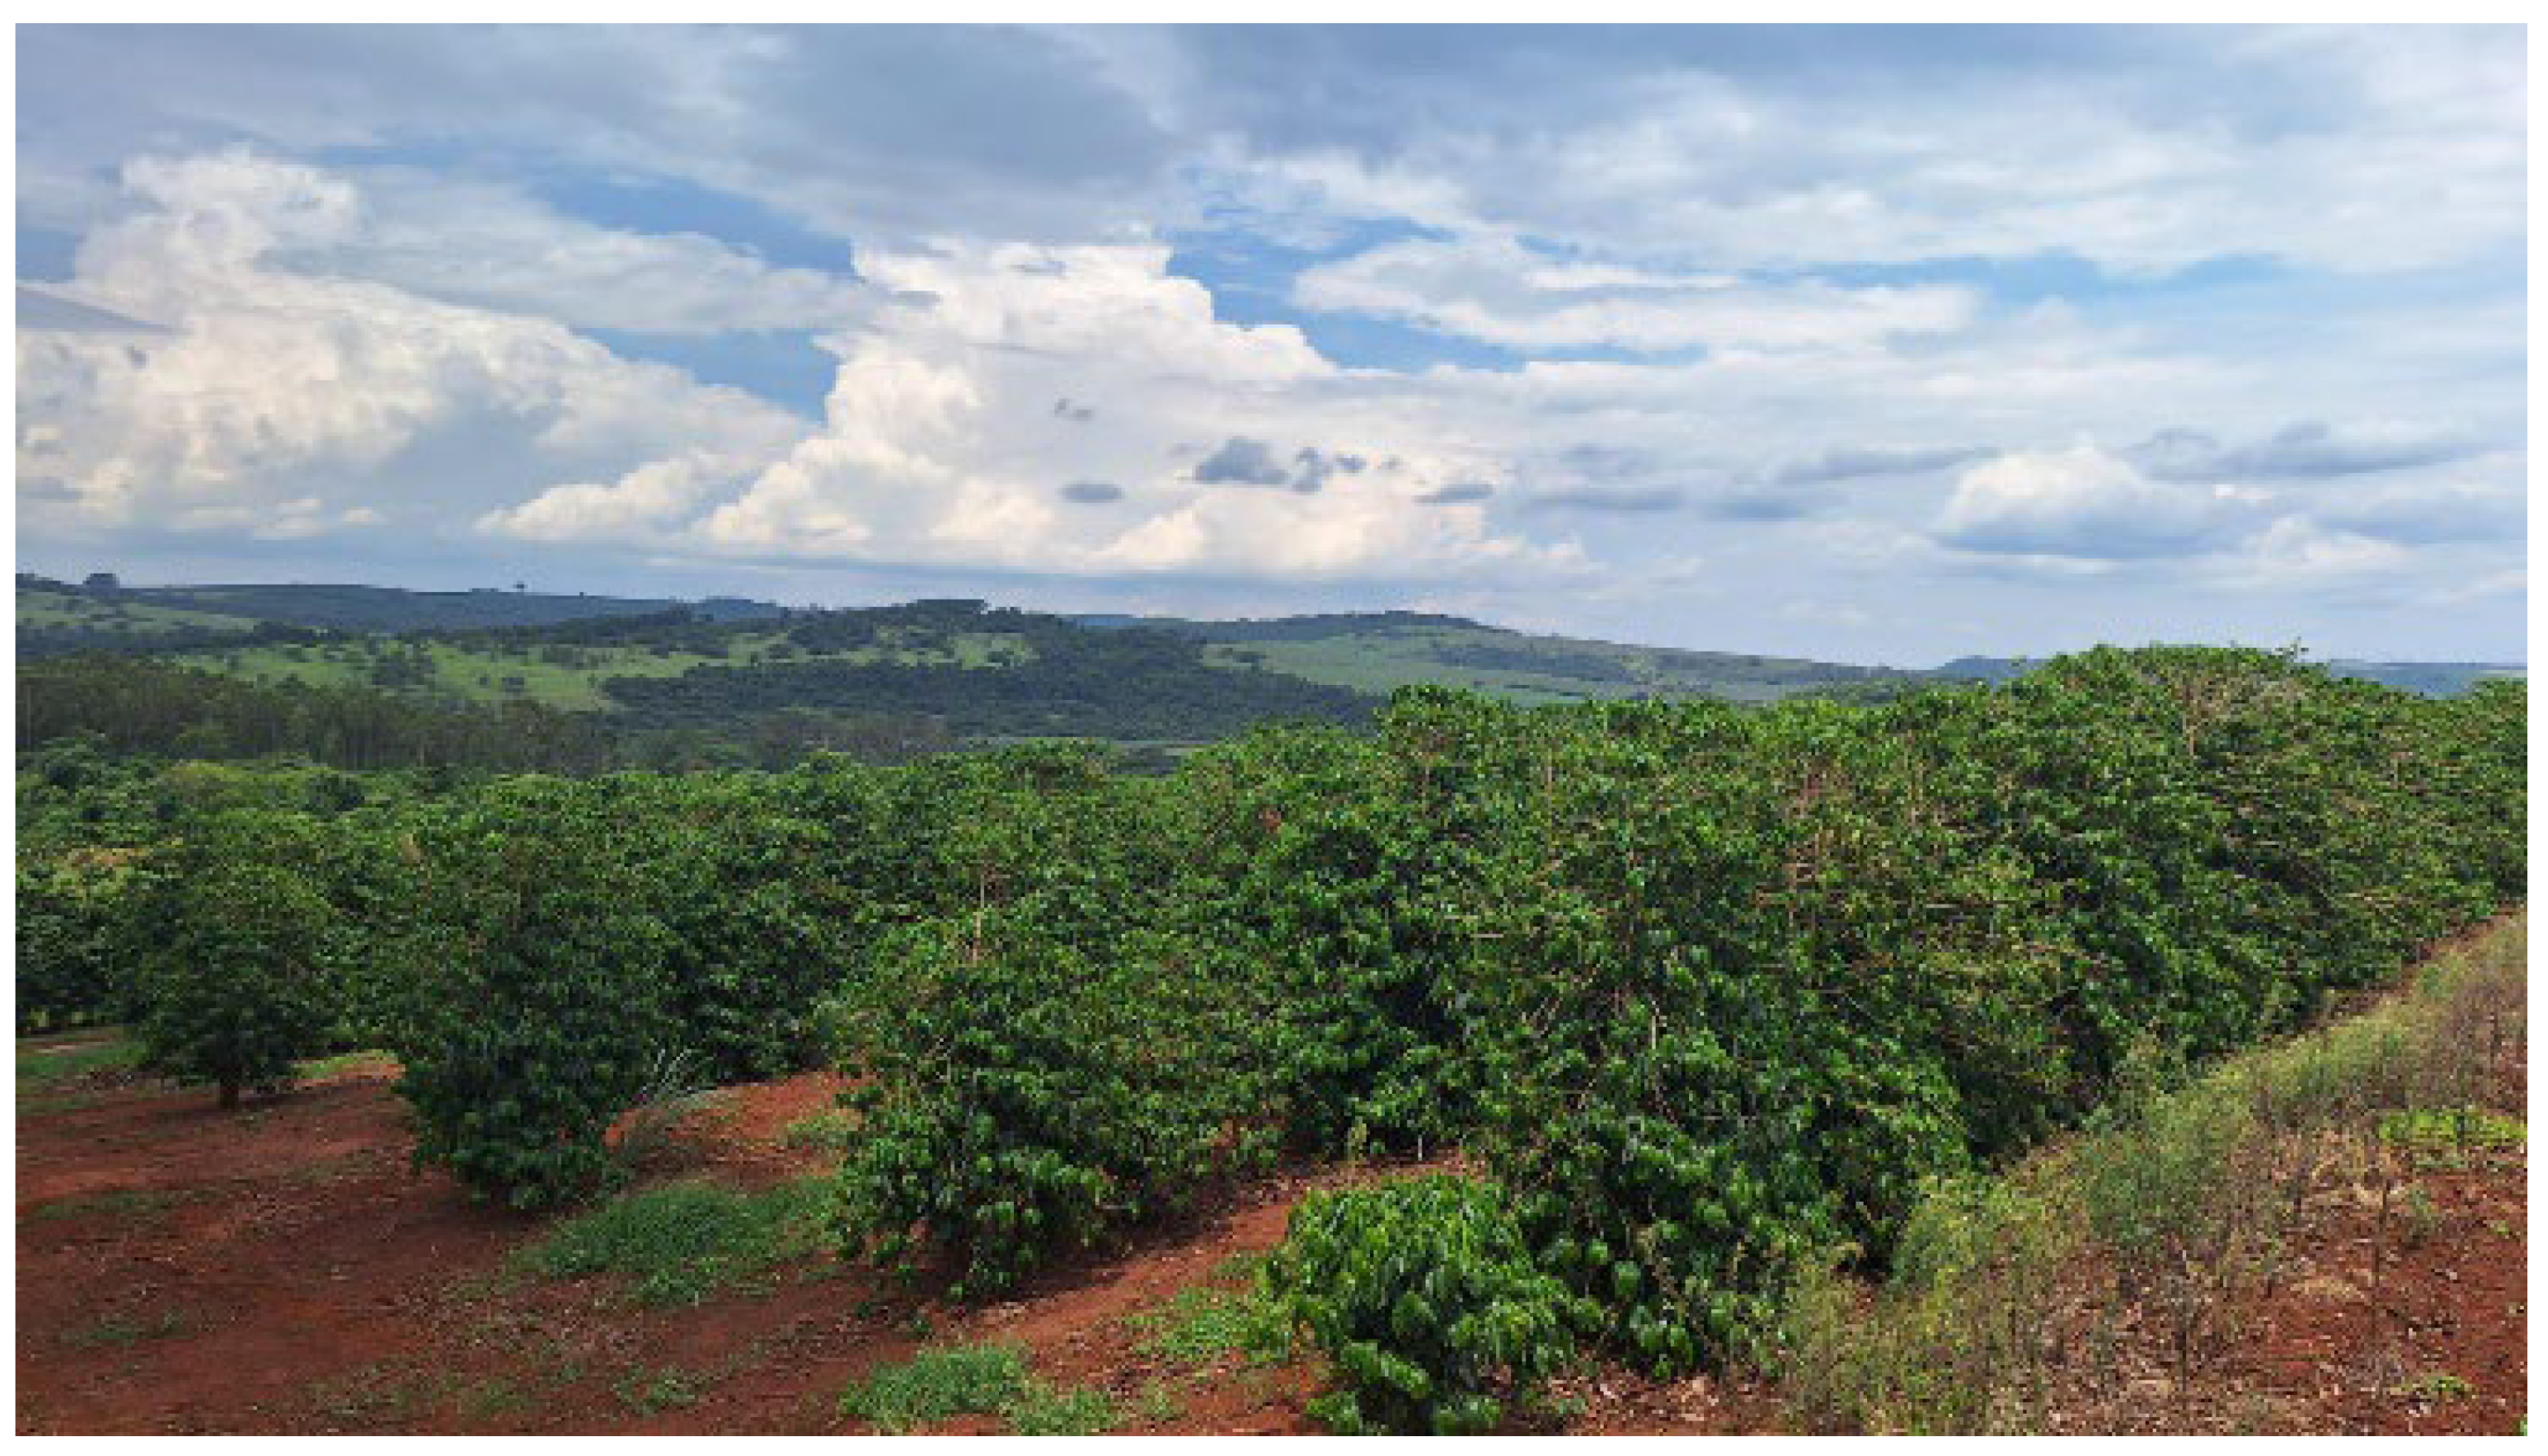
The study was conducted at the EPAMIG Experimental Field, located in the municipality of São Sebastião do Paraíso, Minas Gerais, Brazil (47°06′47.2″ S, 20°54′58.4″ W). The evaluated coffee cultivar (Coffea arabica) was Paraíso MG H 419-1, 25 years old, planted at a spacing of 3.2 × 0.7 m. The cultivation system is conventional under full sun. The soil is classified as an Oxisol, with a slope of 12% and an elevation of 840 m. According to the Köppen classification, the local climate is Cwb, characterized as subtropical highland, with dry winters and mild summers.
2.2. Experimental Design and Sampling
The experiment followed a completely randomized design, with simple random sampling of 100 plants within the study area. Sample size was determined through statistical power analysis, assuming a Type I error rate of 5%, statistical power of 80%, and a minimum detectable difference of 15% in coffee leaf miner incidence between healthy and infested plants, based on pilot studies conducted in the same area. The spatial distribution of sampled plants was checked to ensure representativeness of the entire area, avoiding sampling along borders or in areas with atypical or unrepresentative characteristics.
The sampling procedure was standardized to minimize inter-evaluator variability and to ensure temporal consistency across evaluations. All selected plants were of similar age, size and vigor, with no signs of severe nutritional or water stress (
Figure 2).
2.3. Coffee Leaf Miner Monitoring
During the period from September 2022 to April 2025, a total of 32 monthly sampling events were conducted. In each event, 100 plants were evaluated, and two leaves per plant were consistently examined, resulting in 200 leaf-level observations per sampling date. This corresponds to a total of 3200 plant-level evaluations and 6400 leaf-level records across the entire monitoring period. For analysis, infestation incidence was aggregated at the plant level for each sampling event, yielding one infestation value per plant per date. These plant-level values were then averaged at the plot level and temporally aligned with the corresponding Sentinel-2A imagery used for spectral index extraction.
Sampling was performed monthly, recording the number of leaves with coffee leaf miner (CLM) lesions. The incidence of CLM was calculated using the following equation:
The database was then classified into two categories: healthy plants and plants with CLM infestation. Samples with less than 10% infestation were classified as healthy, while samples with 10% or higher infestation were classified as infested, as production losses may begin at this threshold [
29].
2.4. Spectral Data and Vegetation Indices
Sentinel-2 Level-2A satellite images acquired between September 2022 and April 2025 were used. Image selection was based on the dates of field assessments, following these criteria: (i) absence of clouds over the study area; (ii) absence of cloud shadows; (iii) a maximum interval of ±8 days from each field assessment date; and (iv) adequate radiometric quality according to the product metadata. When multiple images met these criteria on the same date, the image with the best overall quality was selected. Quality control included a visual inspection of each image to detect artifacts, noise, or processing issues.
The selected images were subsequently organized and prepared for spectral analysis. Each image was associated with the corresponding field assessment date to ensure temporal alignment between satellite observations and in situ data. This step enabled consistent comparison of canopy conditions across different sampling periods. All data handling and spectral computations were conducted using standardized scripts in the Google Earth Engine environment to ensure methodological consistency across the entire time series. The processed dataset was then used as the basis for calculating vegetation indices aimed at detecting variations related to coffee leaf miner infestation.
Based on previous studies [
24,
30], eight vegetation indices most sensitive to detecting CLM infestation were selected (
Table 1). The indices were computed using JavaScript routines implemented in the same platform, ensuring consistency in the calculation process and compatibility with the temporal dataset.
In addition to basic atmospheric correction and cloud filtering, spectral processing included the extraction of reflectance values from red, green, NIR, red-edge, and SWIR bands, which were subsequently used to compute the indices associated with pest-related physiological changes. Comparative visual analyses between healthy and infested leaves were performed, linking field-observed symptoms—such as chlorosis, necrotic lesions, and reduced canopy vigor—to variations in GNDVI, IPVI, and MCARI values. Representative images highlighting these spectral differences were incorporated to illustrate the contrast between conditions.
Vegetation indices and CLM infestation were calculated based on the average value for the plot. A database was created using the leaf miner infestation data and vegetation indices.
2.5. Statistical Analysis
Vegetation indices, along with the categorization of CLM infestation, were subjected to principal component analysis (PCA) to reduce data dimensionality and identify patterns of variation among samples.
Scores from the first principal component (PC1) were extracted and analyzed using analysis of variance (ANOVA) to assess significant differences between infested and healthy areas. All statistical analyses were performed with R software version 4.3.3 (R Core Team, Vienna, Austria, 2024).
Before applying PCA, all vegetation index values were preprocessing using scaling so that they had a mean of zero and a standard deviation of one. Scaling so that they had a mean of zero and a standard deviation of one. No missing values were present in the dataset. The selection of variables was based on the highest negative loading (PC1;PC2), and the highest positive loading (PC1; PC2), cumulative explained variance above 90%, and inflection observed in the scree plot, which together justified the retention of the first two components.
2.6. Model Development
Vegetation indices were selected based on the PCA results (
Figure 3a,b). The PCA results directly guided the selection of input vegetation indices for the fuzzy inference system. Indices with the highest absolute loadings in PC1 and PC2—CLMI, GNDVI, IPVI, and MCARI—were chosen because they captured most of the spectral variance associated with differences between healthy and infested plants. CLMI showed the strongest negative loading, while IPVI, GNDVI, and MCARI exhibited the highest positive contributions, reflecting spectral patterns linked to canopy vigor, chlorophyll concentration, and miner-induced tissue damage. These PCA-derived relationships informed the design of the membership functions by defining which indices should be represented with “low” and “high” linguistic terms based on their biological interpretation. Similarly, the rule base was constructed from the PCA patterns: indices with opposite loadings were paired as complementary conditions in the IF–THEN rules, ensuring that the fuzzy system encoded the same spectral separation between healthy and infested plants revealed by the PCA. After compiling the database with the selected indices, the data were normalized to the interval [0, 1], and a Mamdani-type fuzzy logic algorithm was applied. Index selection for the fuzzy system was guided by the following criteria: (i) highest contribution to the first two principal components (loadings > 0.3); (ii) statistical significance in differentiating groups (
p < 0.05 in the
t-test); (iii) biological interpretability regarding the spectral response of infestation; and (iv) low inter-index correlation (r < 0.7) to avoid redundancy. Each vegetation index was modeled with two fuzzy sets using triangular membership functions, representing the linguistic terms “low” and “high.” The parameters for these functions were: Low: a = 0, b = 0, c = 1; High: a = 0, b = 1, c = 1.
For the output variable, values near 0 indicated infestation, while values near 1 represented healthy areas. The fuzzy rule base was constructed from the PCA as follows:
If CLMI is low and GNDVI is high, then Infestation = Healthy.
If CLMI is high and GNDVI is low, then Infestation = CLM infestation.
If CLMI is high and IPVI is low, then Infestation = CLM infestation.
If CLMI is high and MCARI is low, then Infestation = CLM infestation.
These rules were selected based on the spectral behavior associated with coffee leaf miner infestation, where decreases in GNDVI, IPVI, and MCARI typically correspond to reductions in chlorophyll content, canopy vigor, and structural integrity caused by CLM damage. The fuzzy inference system does not require parameter training; therefore, no train/test partition was applied. All computations were performed on the complete dataset to preserve the full variance structure. Uncertainties arising from spectral fluctuations, mixed pixels, and biological variability were handled through gradual membership transitions, allowing for intermediate values to be represented as partial degrees of infestation rather than forcing binary decisions. Model performance was evaluated through a complete validation process using confusion-matrix-based metrics, enabling transparent assessment of classification robustness and reproducibility.
Defuzzification was performed using the centroid (center of gravity) method. For each record in the dataset, the system returned a continuous output between 0 and 1, which was then categorized into two classes: Healthy for values ≥ 0.5 and CLM infestation for values < 0.5. The centroid method was chosen after a comparative analysis of five approaches (centroid, center of maximum, mean of maximums, first maximum, and last maximum), as it provided greater output stability and smoothness, which are critical for classification tasks.
The model was implemented in Python (version 3.9), using libraries such as NumPy [
38], Pandas [
39], MinMaxScaler(), and Simpful [
40].
2.7. Model Performance Evaluation
The performance of the CLM monitoring model was assessed using standard performance metrics commonly applied in artificial intelligence algorithms: confusion matrix, global accuracy, precision, specificity, recall, and area under the curve (AUC), as expressed in the equations below:
In this context:
True Positive (TP): areas predicted as infested and confirmed as infested in the field; True Negative (TN): areas predicted as healthy and confirmed as healthy in the field; False Positive (FP): areas predicted as infested but healthy in the field; False Negative (FN): areas predicted as healthy but infested in the field.
3. Results
The year with the highest CLM infestation was 2022, reaching a maximum value of 38.2%, while 2025 had the lowest infestation with a maximum of 1% of CLM. The years 2023 and 2024 reached maximum infestation levels of 5% and 24%, respectively. The annual average between 2022 and 2025 ranged from 35.1% to 1%. These results indicate clear separability between the groups. (
Table 2). These results indicate clear separability between the groups. (
Table 2).
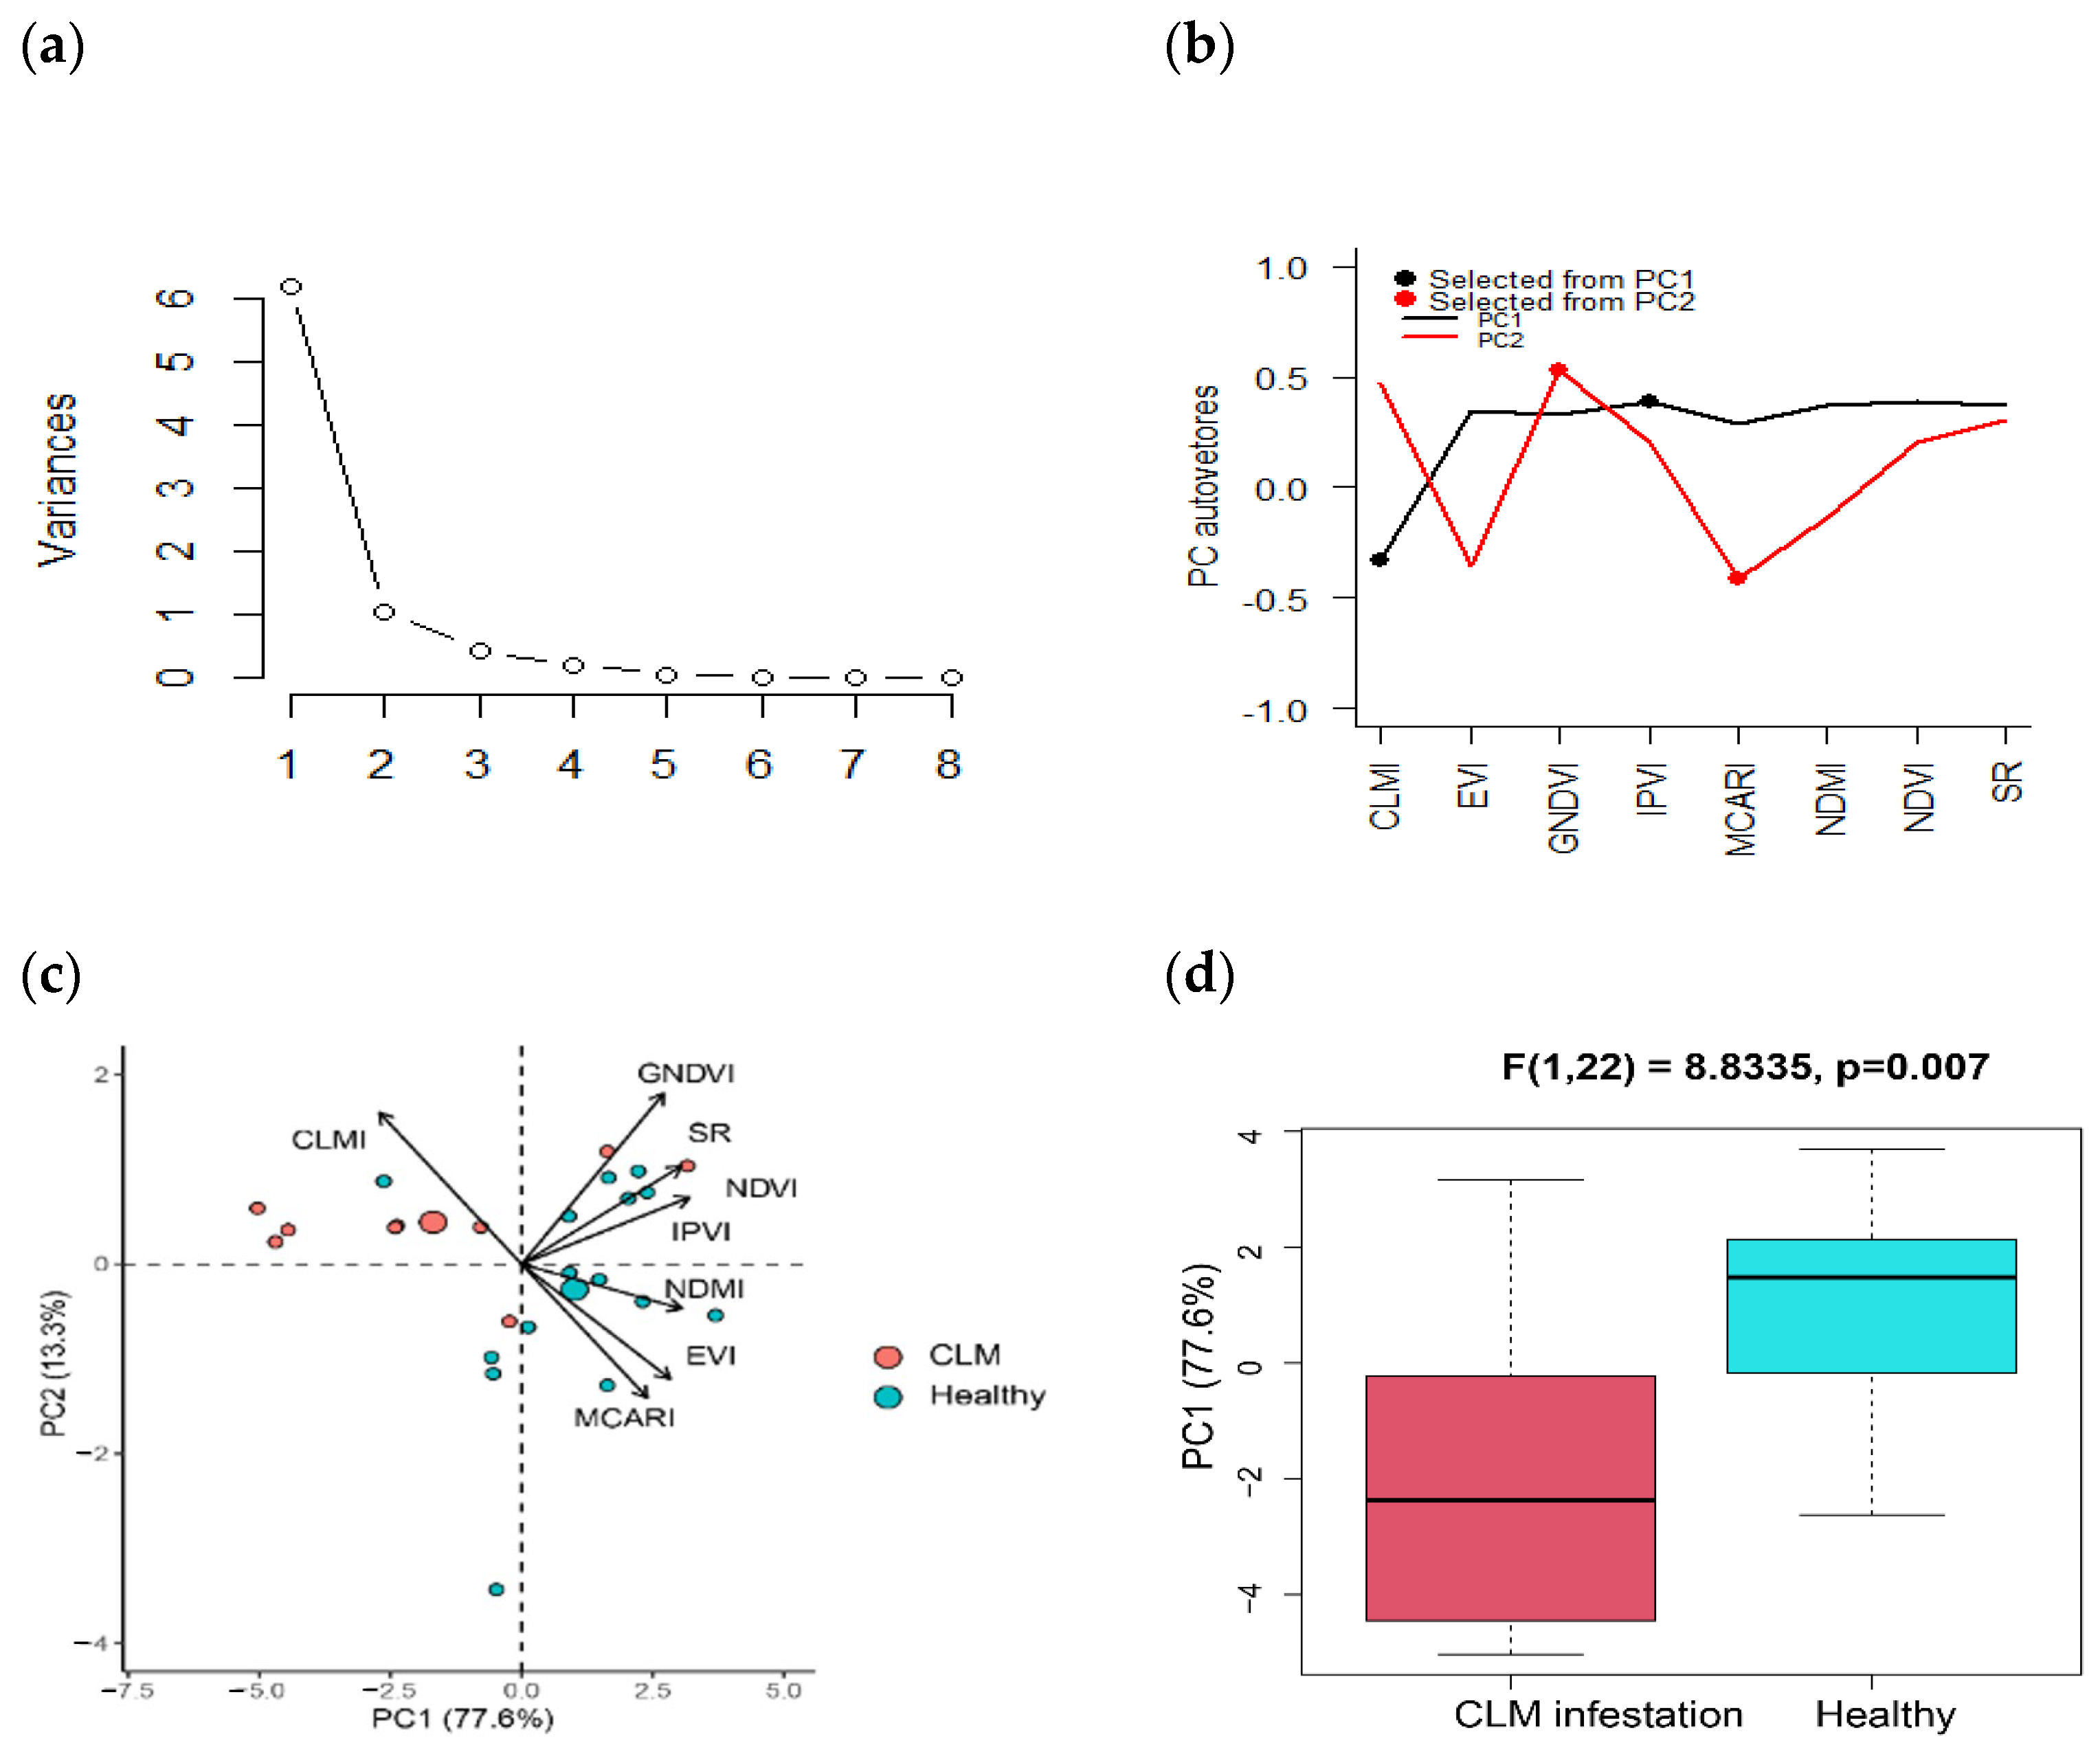
Results from the principal component analysis (PCA) revealed that two principal components were selected, both with eigenvalues greater than the mean of all eigenvalues. PC1 and PC2 explained 77.6% and 13.3% of the total data variance, respectively (
Table 3,
Figure 3). The first two principal components (PC1 and PC2) accounted for 90.9% of the total data variability, demonstrating a robust and reliable representation of the underlying data structure. This high proportion of explained variance indicates that the selected components effectively capture the most significant patterns in the dataset.
The PC1 and PC2 components explained 90.9% of the data variability.
Figure 3.
(
a) Principal component variance. PC1 (first component) explains more than 6 units of variance. (
b) Selection of the most important eigenvectors. (
c) Principal component analysis (PCA) plot of eight variables (
Table 1) along the first two principal component axes. (
d) Score plots of the first principal component, which explained 77.6% of the data variance. Box plots show the median (solid line), dispersion (first and third quartiles), and outliers of the PCA scores.
Figure 3.
(
a) Principal component variance. PC1 (first component) explains more than 6 units of variance. (
b) Selection of the most important eigenvectors. (
c) Principal component analysis (PCA) plot of eight variables (
Table 1) along the first two principal component axes. (
d) Score plots of the first principal component, which explained 77.6% of the data variance. Box plots show the median (solid line), dispersion (first and third quartiles), and outliers of the PCA scores.
In PC1, the CLMI index exhibited the highest negative loading (−0.33), whereas the IPVI displayed the highest positive loading (0.39). In PC2, the greatest loadings were observed for MCARI (−0.41) and GNDVI (0.53). The values of all other indices were ordered according to PC1 and PC2, as presented in
Table 3.
Figure 3c demonstrates that PCA explained 90.9% of the total variance, with 77.6% attributed to PC1 and 13.3% to PC2. The statistical comparison of PC1 scores between groups (
Figure 3d) revealed a significant difference (F(1,22) = 8.8335;
p = 0.007). Healthy samples were predominantly associated with positive PC1 values, whereas infested samples presented negative scores, reinforcing the capability of PCA to effectively discriminate between infested and non-infested areas.
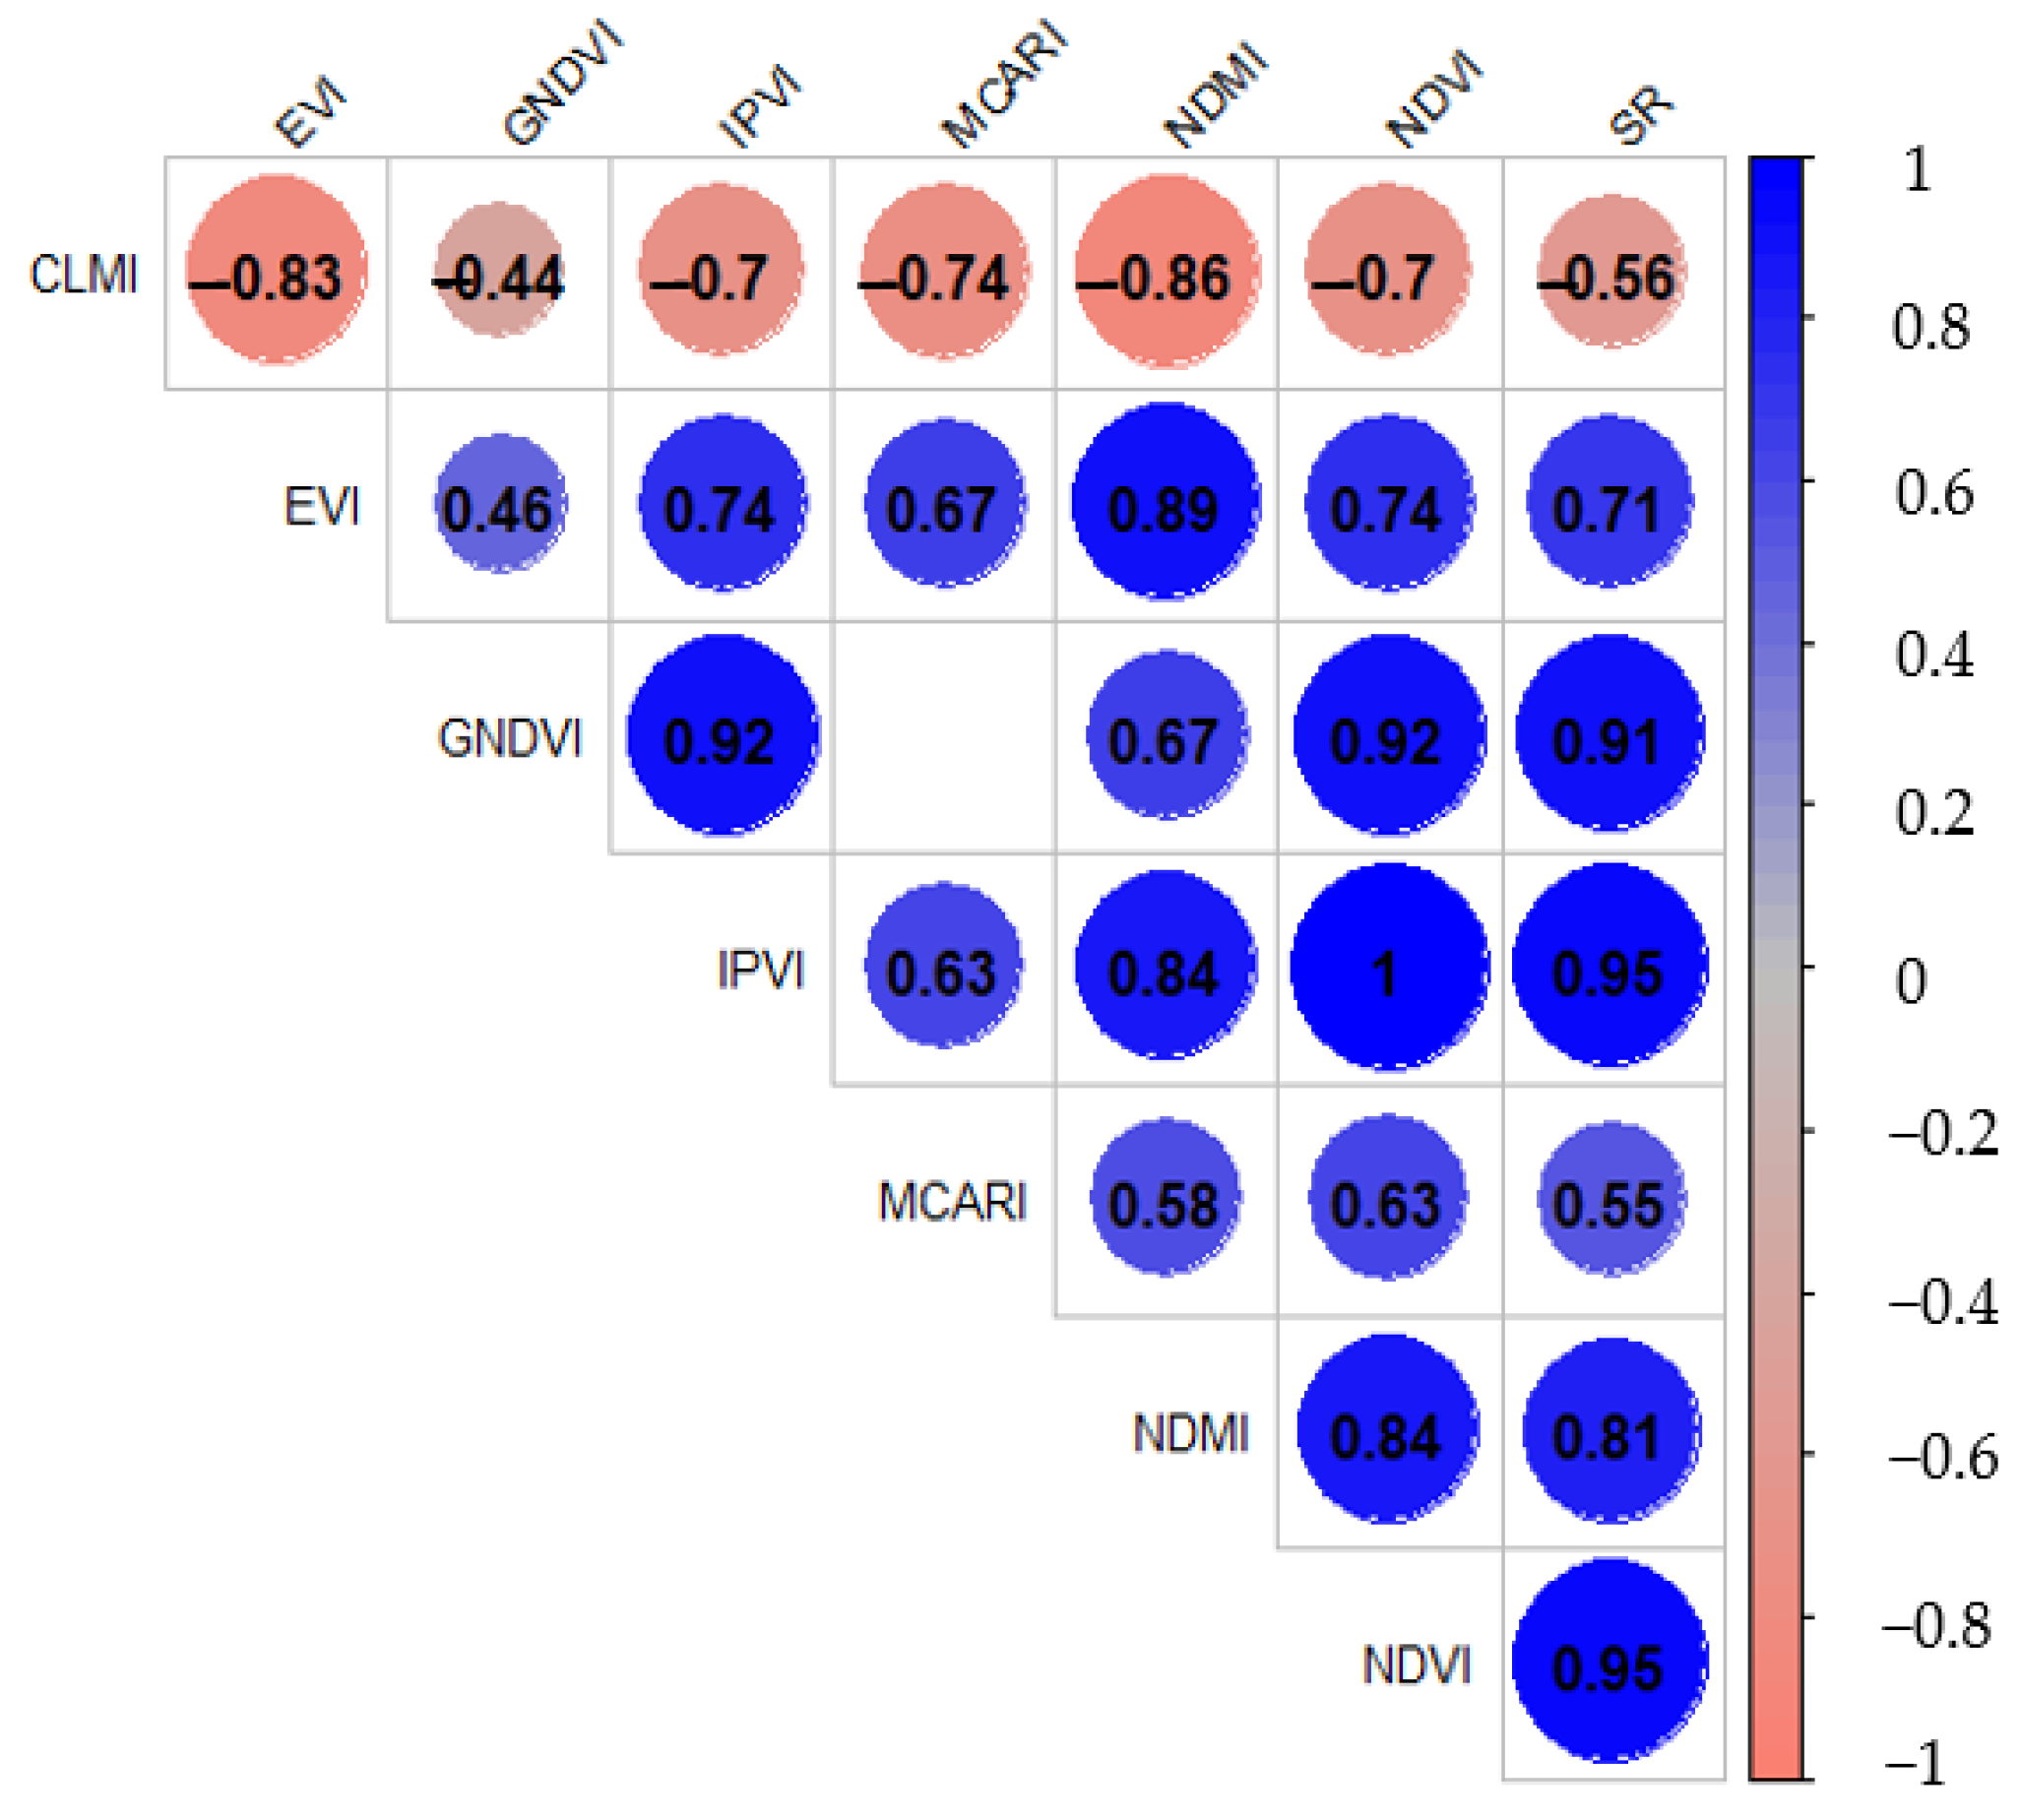
The correlation matrix of the eight vegetation indices (
Figure 4) demonstrated that CLMI was the only index to exhibit a negative correlation with the other indices, highlighting its unique role in differentiating pest-infested conditions from healthy vegetation.
When comparing the most important indices highlighted in (
Figure 3b) with the correlation matrix shown in (
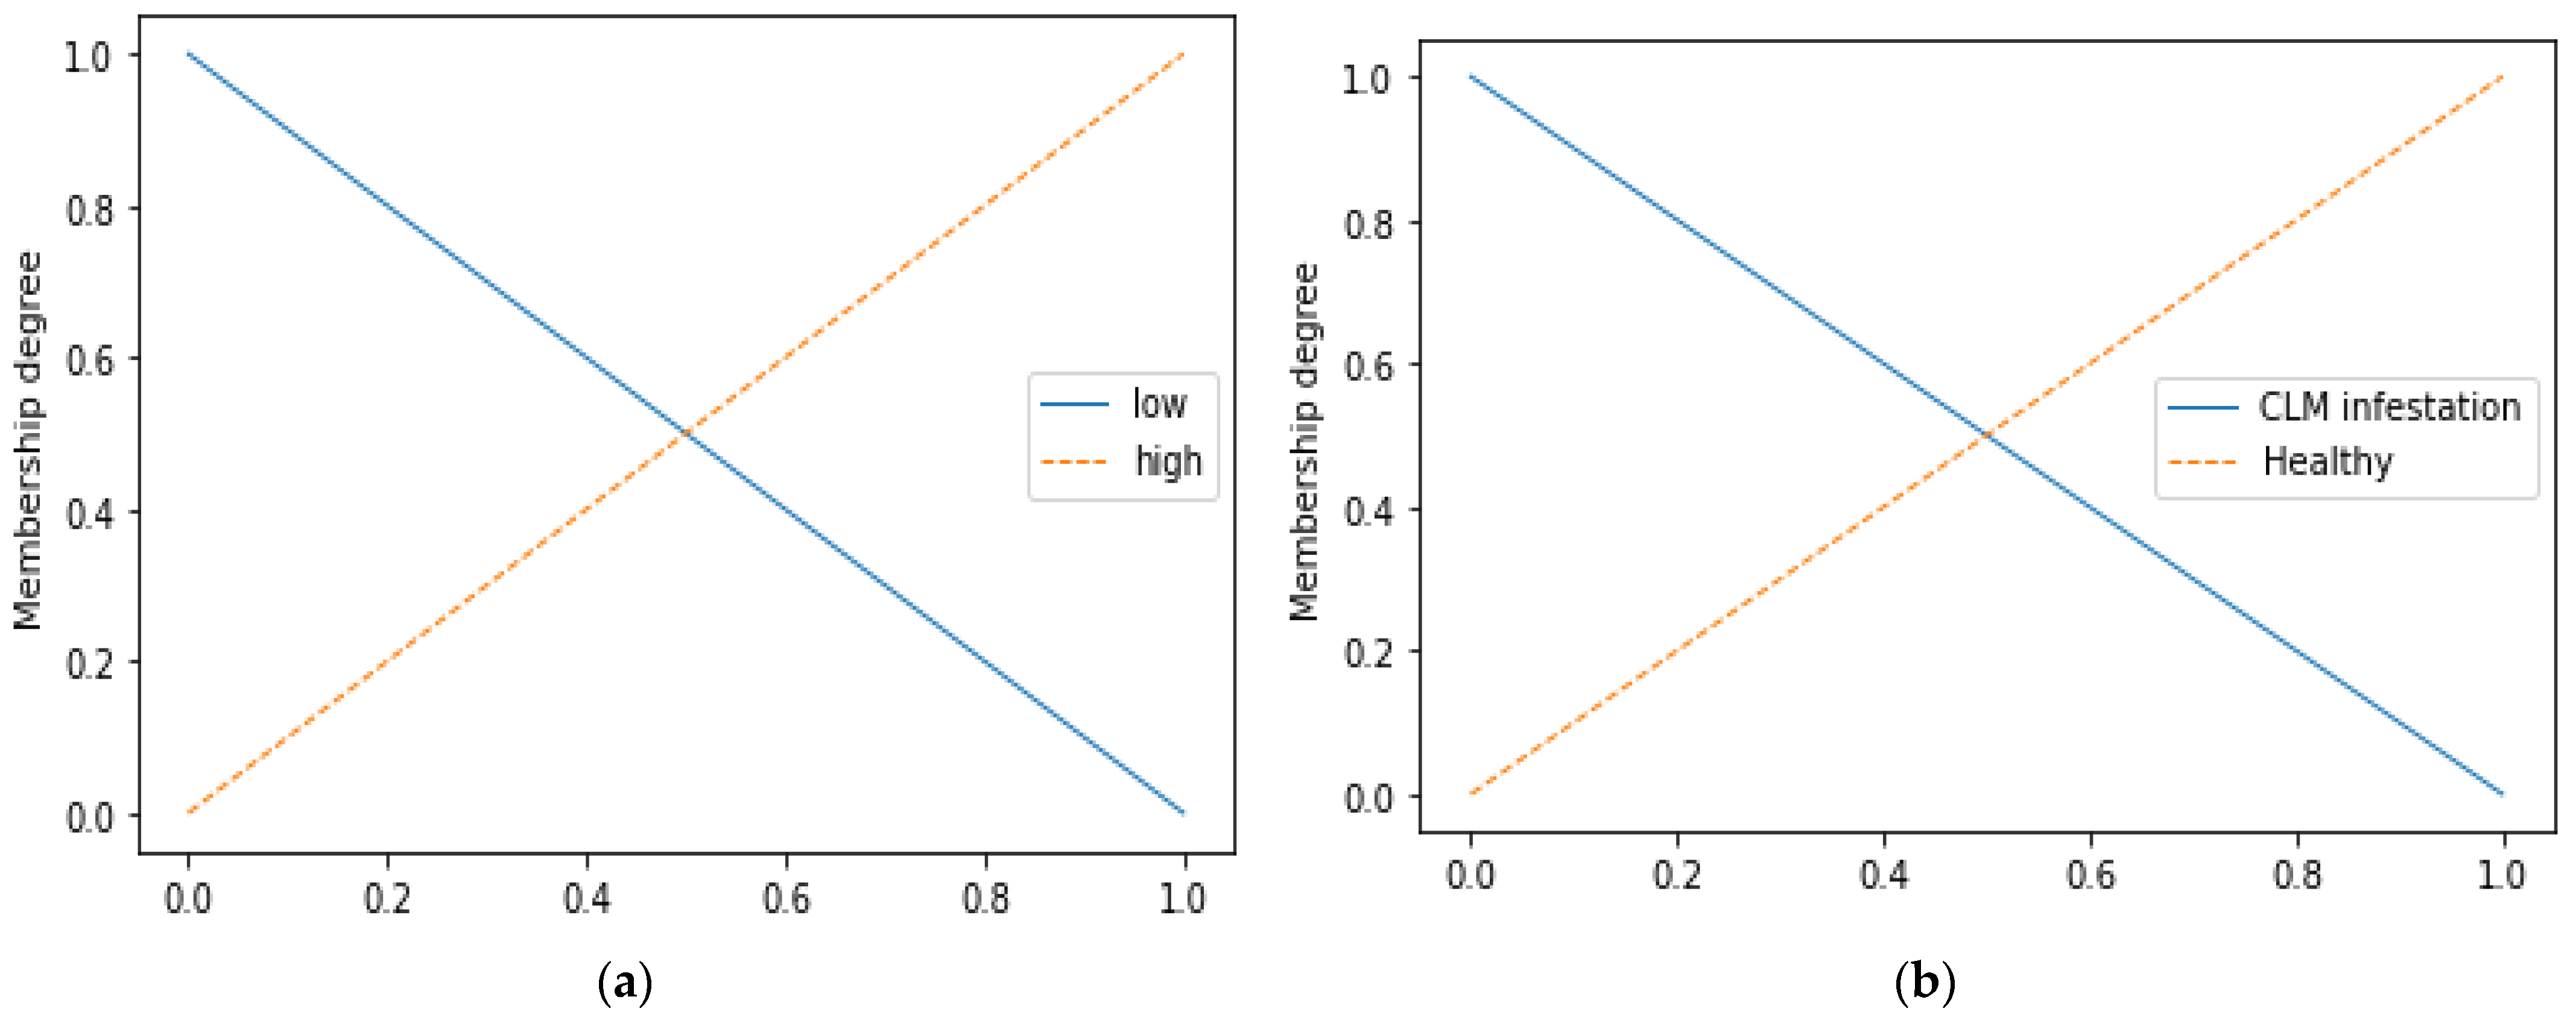
Figure 4), it can be observed that the CLMI index exhibited a strong negative correlation with NDMI (–0.86) and GNDVI (–0.44). The IPVI index correlated positively with NDVI (1.0) and to a lesser extent with MCARI (0.63). GNDVI showed strong positive correlations with both IPVI (0.92) and NDVI (0.92), and a moderate correlation with NDMI (0.67). MCARI index exhibited positive correlations with NDVI (0.63) and a weaker correlation with SR (0.55). Fuzzy membership functions for the input and output variables in the inference system were defined for the vegetation indices, with all values normalized to the interval [0, 1] (
Figure 5).
The solid blue line (“low”) represents the membership function of the “low” fuzzy set (
Figure 5a) and corresponds to the infested output (
Figure 5b). This triangular function decreases linearly from a membership degree of 1 (for values close to 0) to 0 (for values close to 1).
The dashed orange line (“high”) represents the “high” fuzzy set, with a linearly increasing triangular function. The membership degree rises from 0 (for low variable values) to 1 (for values approaching 1).
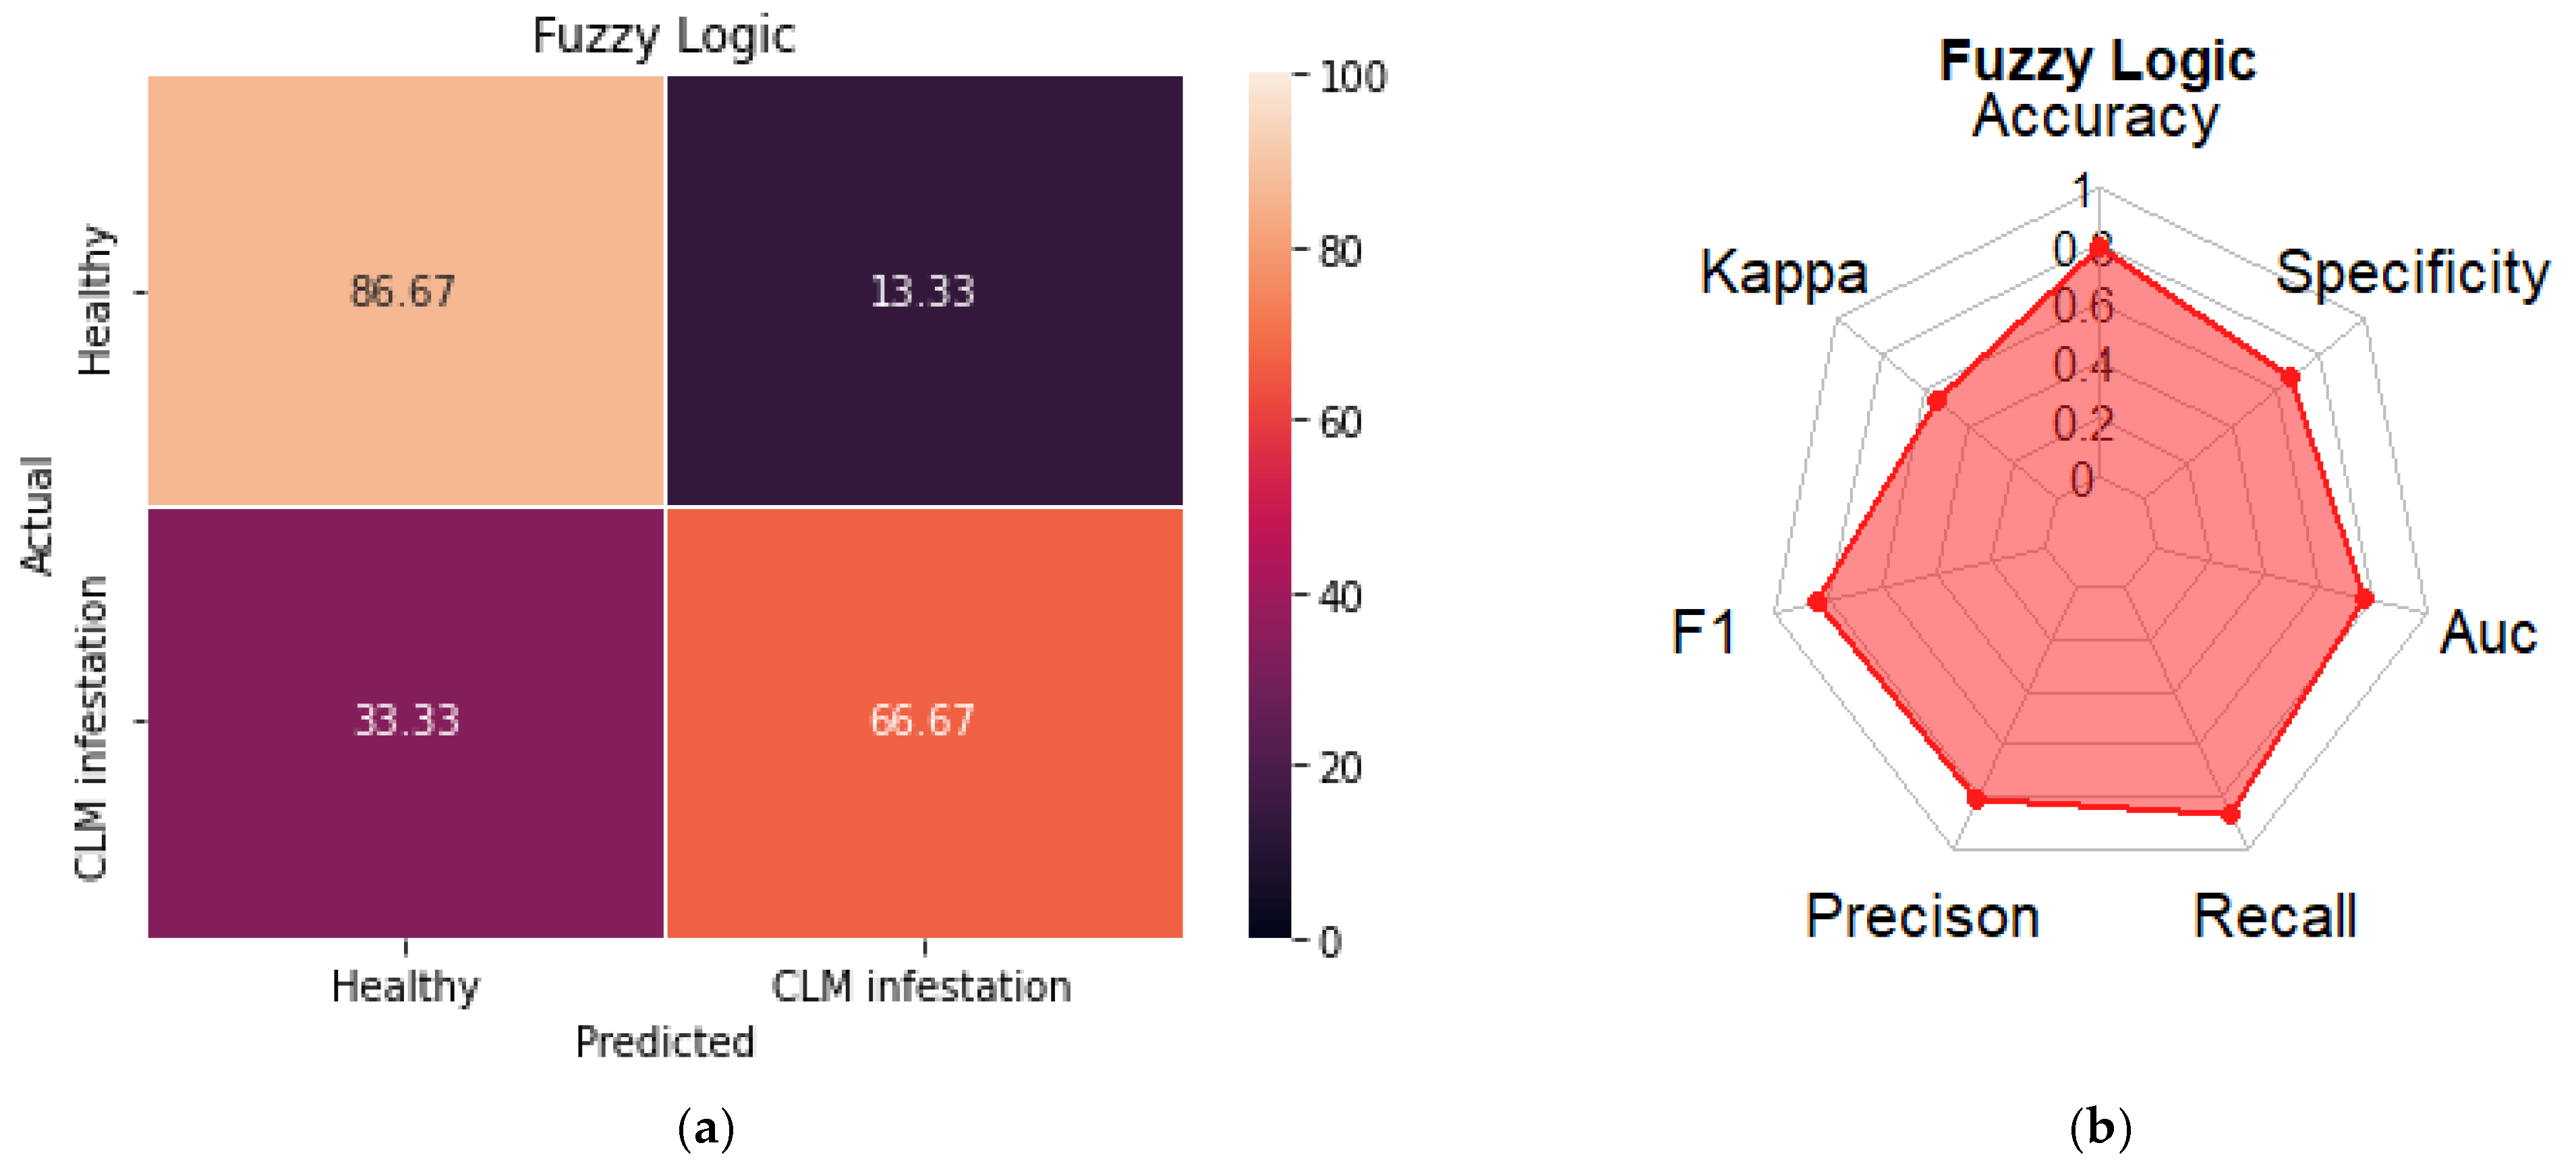
The fuzzy logic algorithm proved effective in discriminating between healthy plants and those infested with CLM, although its specificity was moderate (
Figure 6b). Specifically, 33% of the plants classified as healthy by the algorithm were, in fact, infested (
Figure 6a), indicating some limitations in correctly identifying non-infested plants.
The model achieved a precision of 0.812, indicating that 81.2% of the predicted as infested were correct. The recall was 0.866, showing that the model successfully identified 86.6% of all predicted as infested in filed. The overall accuracy reached 0.791, meaning the model correctly classified 79.1% of all instances. The F1-score, which balances precision and recall, was 0.838, suggesting a good equilibrium between areas predicted as infested but healthy in the field and areas predicted as healthy but infested in the field. The AUC value of 0.766 reflects a moderate ability of the model to distinguish between the two classes. However, the specificity was 0.666, indicating that the model correctly recognized 66.6% of the areas predicted as healthy and confirmed as healthy in the field, with some tendency to misclassify healthy as infested. Finally, the Kappa coefficient of 0.545 suggests a moderate level of agreement between the predicted and actual classifications, beyond chance. The results presented in the Confusion matrix (
Figure 6) are detailed in
Appendix A (
Table A1,
Table A2 and
Table A3).
When validation data were available, performance metrics such as accuracy, sensitivity, specificity, precision, and AUC were calculated to provide a more rigorous evaluation of the system. These metrics allow a deeper understanding of the strengths and limitations of the model when detecting CLM infestation under real field conditions.
A comparative table was added to summarize the classification performance of each vegetation index individually (threshold-based classification) versus the fuzzy inference system. This comparison highlights the gain in accuracy and robustness achieved by combining multiple spectral indicators into a fuzzy decision-making structure.
4. Discussion
Descriptive data analysis revealed significant differences between coffee leaf miner-infested and healthy plants, with medians of 24% and 1.5%, respectively, and means indicating greater variability within the infested group. These findings confirm the potential of remote sensing data to clearly distinguish phytosanitary conditions, supporting its use for coffee leaf miner infestation monitoring and potentially extending to the monitoring of other pests, or even diseases in a variety of agricultural crops. This predictive capacity is likely enhanced by the characteristic symptoms caused by CLM infestation particularly necrotic spots and foliar damage which significantly alter the spectral response of the plants, making remote detection more feasible and reliable.
Principal component analysis (PCA) further reinforced this distinction: PC1 and PC2 together explained 90.9% of the data variability, with PC1 accounting for 77.6%. The distribution of scores showed a statistically significant difference between groups, demonstrating the effectiveness of PCA in separating healthy and infested areas. PC1 is the most important component and captures most of the data information. Most of the data structure can be represented by the first one to three principal components. Dimensionality can be reduced by retaining only the components that explain a significant portion of the variance (e.g., PC1 + PC2) (
Figure 3a) indicates that, from the second principal component (PC2) onward, the variance stabilizes, suggesting that the majority of the data variability is concentrated within the first two components (PC1 and PC2). (
Table 3), in conjunction with (
Figure 3b), identifies the variables that contributed most significantly to the formation of these components. Moreover, indices associated with pest-infested areas (CLMI) showed lower values for EVI, NDMI, and MCARI, which are typically associated with healthy vegetation. The indices that contributed most to the first principal component (CLMI, IPVI, MCARI, and GNDVI) exhibited consistent correlations, indicating that indices related to plant health and pest stress are particularly relevant for characterizing phytosanitary status. Specifically, the CLMI index was designed to be a sensitive indicator of coffee leaf miner infestation [
24]; the IPVI index indicates the relative proportion of active vegetation and is widely used to monitor vegetation density and vigor [
41]; the MCARI index estimates vegetation chlorophyll content, demonstrating strong sensitivity to physiological variations [
42]; and the GNDVI index is highly sensitive to chlorophyll variation and plant water stress [
43], highlighting the use of this indices as an adequate tool for remote sensing. Therefore, the integration of these spectral indices was instrumental in enhancing the discriminatory power of the analysis, highlighting their relevance for precise differentiation between healthy (IPVI, MCARI, and GNDVI) and infested (CLMI) coffee areas in this present study. Although the present study followed the standard field protocol based on counting mined leaves, this method is known to underestimate infestation severity because it does not account for the actual damaged leaf area. Assessing the mined surface area would provide a more continuous and biologically representative metric of CLM impact, improving the calibration of remote sensing models and reducing classification uncertainty. Future studies should incorporate quantitative measurements of damaged leaf area through digital image analysis or high-resolution field sensors, allowing for more precise correspondence between spectral changes and infestation intensity.
Existing applications of fuzzy systems in crop monitoring have mainly focused on environmental variables, crop quality assessment, or post-harvest processes, leaving a gap regarding spectral changes induced by the pest. In addition, vegetation indices such as GNDVI, IPVI, and MCARI have been successfully used in tropical crops to detect changes in chlorophyll content, canopy vigor, and structural modifications associated with biotic stress [
44,
45]. Studies applying these indices to coffee plantations have demonstrated their sensitivity to physiological changes triggered by coffee leaf miner infestation, supporting their inclusion in remote sensing-based detection models.
The fuzzy logic algorithm proved effective in classifying plants, achieving accuracy of 79.1% and sensitivity of 86.6%, although specificity was moderate (66.6%), indicating that about 33% of healthy plants were incorrectly classified as infested. These results suggest that, while effective, the method could benefit from further refinements to reduce false positives and enhance monitoring reliability, particularly if remote distinction between active and inactive mines is achievable, as they exhibit similar spectrometric patterns but differ in their biological significance, especially regarding the temporal dynamics of CLM infestation. An in-depth evaluation of additional performance metrics provides further insights into the model’s effectiveness. The precision of 81.2% indicates that the fuzzy logic algorithm is relatively accurate when classifying plants as infested, ensuring that a high proportion of those identified as infested are indeed correctly classified. However, the moderate specificity (66.6%) suggests that the algorithm misclassified healthy plants as infested, supported by the moderate Kappa value of 0.545, which suggests a medium level of agreement between the predicted and true classifications, but also indicates room for improvement, particularly in reducing the impact of false positives. The F1 score of 0.838 demonstrates an adequate trade-off between precision and recall, highlighting that the model effectively identifies infested plants while minimizing the number of missed detections. Furthermore, the AUC of 0.766 suggests that the model has a solid ability to distinguish between infested and healthy plants, although there is still room for improvement to achieve more robust discrimination, especially in challenging cases where active and inactive infestations share similar spectrometric features. The likely reason for the high discrepancy between specificity and the other indices stems from the fact that plants are classified as infested or non-infested based on the number of infected leaves, rather than the total affected area, which is quantitatively measured and expressed in continuous values. This approach is commonly used and interpreted by satellite systems to assess discrepancies between the green and red spectra of the leaves. The use of leaf count as the primary indicator of infestation likely leads to the underestimation of the true infestation levels in coffee crops, as it fails to capture the full extent of damage. With this work, we therefore suggest that the method for evaluating CLM infestation be shifted from the number of infected leaves to the damaged leaf area, thereby aiming for greater calibration accuracy and facilitating improved decision-making by providing a more accurate representation of infestation levels. Furthermore, this study broadens the scope of fuzzy logic-based models in coffee production, extending their application beyond crop management and post-harvest processes [
16,
17] to include integrated coffee pest management.
Thus, the findings confirm the effectiveness of integrating spectral data with statistical and classification techniques for monitoring coffee leaf miner infestations. This approach shows strong potential for supporting sustainable pest management in coffee cultivation, offering a practical and efficient tool for precision monitoring and early decision-making. The integration of fuzzy logic with the Google Earth Engine platform enhances the model’s predictive capacity, enabling spatially explicit, near-real-time analysis that is both scalable and accessible, facilitating continuous, global monitoring with the capability to process large-scale environmental data efficiently and support proactive decision-making across diverse geographical regions.
This synergy allows for reliable identification of risk areas in the field, facilitating timely interventions and contributing to more sustainable and data-driven pest control strategies. The integration of Google Earth Engine with a fuzzy inference system proved effective for translating spectral information into infestation estimates, highlighting the potential for large-scale and continuous monitoring.
5. Conclusions
The human monitoring of CLM on coffee crops demands a high effort in the field, increasing the costs, time of evaluation and costs of execution, and needs to be realized frequently in order to evaluate the infestation rates along the seasons. Considering the large coffee areas, the application of remote systems can increase the efficiency in pest-monitoring and in decision-making processes, contributing to a more sustainable economical and environmental approach. The results demonstrate that remote sensing data processed through the Google Earth Engine platform are effective in distinguishing areas infested by coffee leaf miners from healthy areas, revealing significant differences in vegetation indices. Multivariate statistical analysis confirmed the relevance of these indices in differentiating plant health conditions, with most of the variability explained by two principal components and four vegetation indices (CLMI, IPVI, MCARI, and GNDVI).
Fuzzy logic also proved to be a valuable tool for plant classification, showing strong performance in identifying infested areas, although there is still room for improvement in classification accuracy. Therefore, integrating efficient data processing with Google Earth Engine and advanced classification methods, such as fuzzy logic, provides a promising approach for monitoring coffee leaf miner infestations and may also offer valuable insights for monitoring other pests across a variety of agricultural crops. One of the main limitations of using this methodology to classify the level of CLM infestation lies in the evaluation based solely on the number of infested leaves, without considering the degree of infestation on each leaf. Therefore, one alternative to improve the accuracy of the assessment would be to adopt infestation scales that take into account the infested area, and further the number of mined leaves. In this context, the evaluation of control levels in coffee crops will be carried out more accurately, leading, for instance, to a reduction in the number of pesticide applications and the monitoring spending time, which account for a significant portion of the crop’s production costs. This integration supports the adoption of more sustainable and time-precise pest management practices in Brazilian coffee production, enabling more informed and efficient decision-making and increasing competitiveness in the global coffee markets.




 ,
,