1. Introduction
Ride-hailing has grown into a global phenomenon with adoption and mode-shift effects documented across diverse urban and regional settings [
1,
2,
3,
4,
5]. These demand-responsive services offer a convenient, time-efficient mobility alternative that relieves travelers of the need to park [
5,
6,
7]. Yet this growth is not without consequences: ride-hailing fleets increase overall vehicle miles traveled (VMT) when passengers ride alone [
8,
9,
10,
11,
12], raising concerns about the energy footprint of the service [
7,
13]. It is therefore widely recognized that pooling multiple travelers into shared vehicles is essential to counteract these negative externalities by reducing the passengerless trips that drive excess VMT [
14,
15]. Ride-hailing’s mode share continues to grow, and autonomous vehicles are widely expected to lower per-trip costs at scale, potentially broadening adoption further [
14,
16,
17]. Current deployments, however, tell a different story: Waymo averaged
$20.43 per ride versus
$15.58 for Uber and
$14.44 for Lyft (31% and 41% more expensive, respectively) in San Francisco as of mid-2025 [
16], suggesting that cost-driven expansion of autonomous ride-hailing adoption remains limited in the near term.
Against this backdrop of growing demand, persistent externalities, and unrealized automation promises, understanding current ride-hailing operations is increasingly vital for planners and policymakers. That need is underscored by a large and consistent body of observational evidence showing that ride-hailing increases VMT and worsens urban congestion [
5,
6,
7,
9,
12], raising the question of whether pooling can meaningfully mitigate these effects. Recent disaggregate vehicle-level evidence from the Boston region sharpens this question further by showing that TNC-induced VMT stems primarily from ride-hailing operations themselves, including deadheading, vehicle repositioning, induced demand, and transit mode substitution, rather than from indirect displacement of private car trips [
18]. In turn, this points to a broader possibility: that these externalities may be intrinsic to ride-hailing as a service model, such that even pooling, long proposed as the remedy, may not be able to overcome the systemic constraints that have limited its expected benefits.
This possibility has motivated a substantial body of research on pooling and dispatch algorithms designed to improve the operational efficiency of ride-hailing systems. Several studies have explored algorithms to efficiently allocate ride-hailing vehicles to multiple customers [
19,
20,
21,
22]. Using millions of taxi trips from New York City, Santi et al. [
19] demonstrated that shared taxis could achieve low passenger waiting times while reducing trip length by 40% through pooled rides. A lazy shortest-path heuristic [
23] pools customers while minimizing vehicle travel distance, enabling 40% more customers to be served while traveling 15% less distance. Cordeau [
24] applied a mixed-integer programming formulation with a branch-and-cut algorithm, with computational experiments showing successful application to small- and medium-sized problems. While many of these efforts relied on purpose-built simulators, only a limited number [
25,
26] embedded their algorithms within agent-based travel demand models, where endogenous traffic flow allows ride-hailing operations to be evaluated alongside broader network dynamics.
Within such modeling frameworks, several studies found that replacing conventional modes with fleets of shared automated vehicles could reduce the number of personally owned vehicles by 66–90% [
27,
28,
29], with analogous fleet-sizing analyses conducted for Zurich [
30], Berlin [
31], Stockholm [
32], and New York [
33]. Agent-based modeling has further shown that if autonomous vehicles expand road capacity, congestion could be practically eliminated despite higher VMT [
34]. A pooled ride-hailing model for Berlin identified optimal service areas based on average vehicle occupancy and revenue [
35]. Taken together, these studies established the promise of ride-hailing pooling but relied on relatively contained algorithms or limited modal competition.
Subsequent research has both broadened and deepened this evidence base. Systematic reviews synthesize a rapidly growing literature, documenting persistent heterogeneity in estimated impacts across geographic and operational contexts [
5,
7]. On the operations side, researchers have examined dynamic ride-sharing under explicit service-quality and efficiency trade-offs, including waiting-time and detour balancing, pooled first- and last-mile connections to transit, and integrated pricing and lane-management approaches [
36,
37,
38,
39,
40]. Across this body of work, agent-based simulation has emerged as the most effective framework for capturing emergent system-level behaviors that characterize ride-hailing at scale [
41], one that extends across complex systems in many fields of science [
42,
43].
Implementing such system-level analyses, however, requires balancing behavioral and network realism against computational tractability. Highly detailed microsimulations like VISSIM [
44] are currently computationally impractical for large-scale simulations involving millions of agents. The MATSim (Multi-Agent Transportation Simulation) community [
41] has found a productive balance between simulation resolution and scenario scale, and has contributed to various areas of ride-hailing simulation [
34], including fleet sizing [
30,
43,
45], pooled rides [
35], competing ride-hailing operators [
25], and evaluating control algorithms [
46,
47]. POLARIS, developed at Argonne National Laboratory, is another regional-scale agent-based framework applied to simulating shared autonomous vehicle fleets and multi-strategy mobility policy evaluation in the Chicago metropolitan area [
48,
49].
Even with these advances, however, the systemic mechanisms that cause pooling to underperform remain poorly characterized. Observational studies have documented these outcomes, but the causal mechanisms and system-level feedbacks that generate them have not been rigorously traced at the metropolitan scale. Three methodological gaps help explain this shortfall. First, most pooling algorithms have been evaluated in purpose-built simulators or stylized models in which traffic flow is treated as exogenous, masking the feedback between fleet operations and network congestion. Second, the system-level limits of pooling have not been quantified at the scale of a metropolitan region with a complete multimodal choice set. Third, because the computational demands of high-resolution models often necessitate population sampling, it remains unclear whether ride-hailing system dynamics are preserved below full scale.
To address these gaps, we propose repositioning and pooling algorithms rooted in the Alonso-Mora framework [
33], but substantially rearchitected to scale to hundreds of thousands of customers and tens of thousands of vehicles, and compare them to an optimal matching algorithm. We deploy these algorithms in large-scale ride-hailing pooling simulations within a MATSim-derived, open-source, fully integrated, multimodal, agent-based travel demand simulator: the modeling framework for Behavior, Energy, Autonomy, and Mobility (BEAM) [
50]. This fully multimodal environment allows travelers to dynamically switch modes in response to poor fleet performance, thereby capturing real-world feedbacks more faithfully. We then conduct a sensitivity analysis to assess whether pooling may have the counterintuitive effect of reducing, rather than increasing, vehicle occupancy. Finally, because the computational requirements of these large-scale scenarios necessitate population sampling, we also carry out a systematic sampling study to identify the threshold at which ride-hailing system dynamics stabilize.
The sections that follow present the methods, evidence, and analyses underlying these contributions. We begin with the simulation platform, BEAM, along with its ride-hailing module and algorithmic formulation, then present the performance results, and conclude with the sensitivity analyses that reveal these system-level dynamics.
2. Materials and Methods
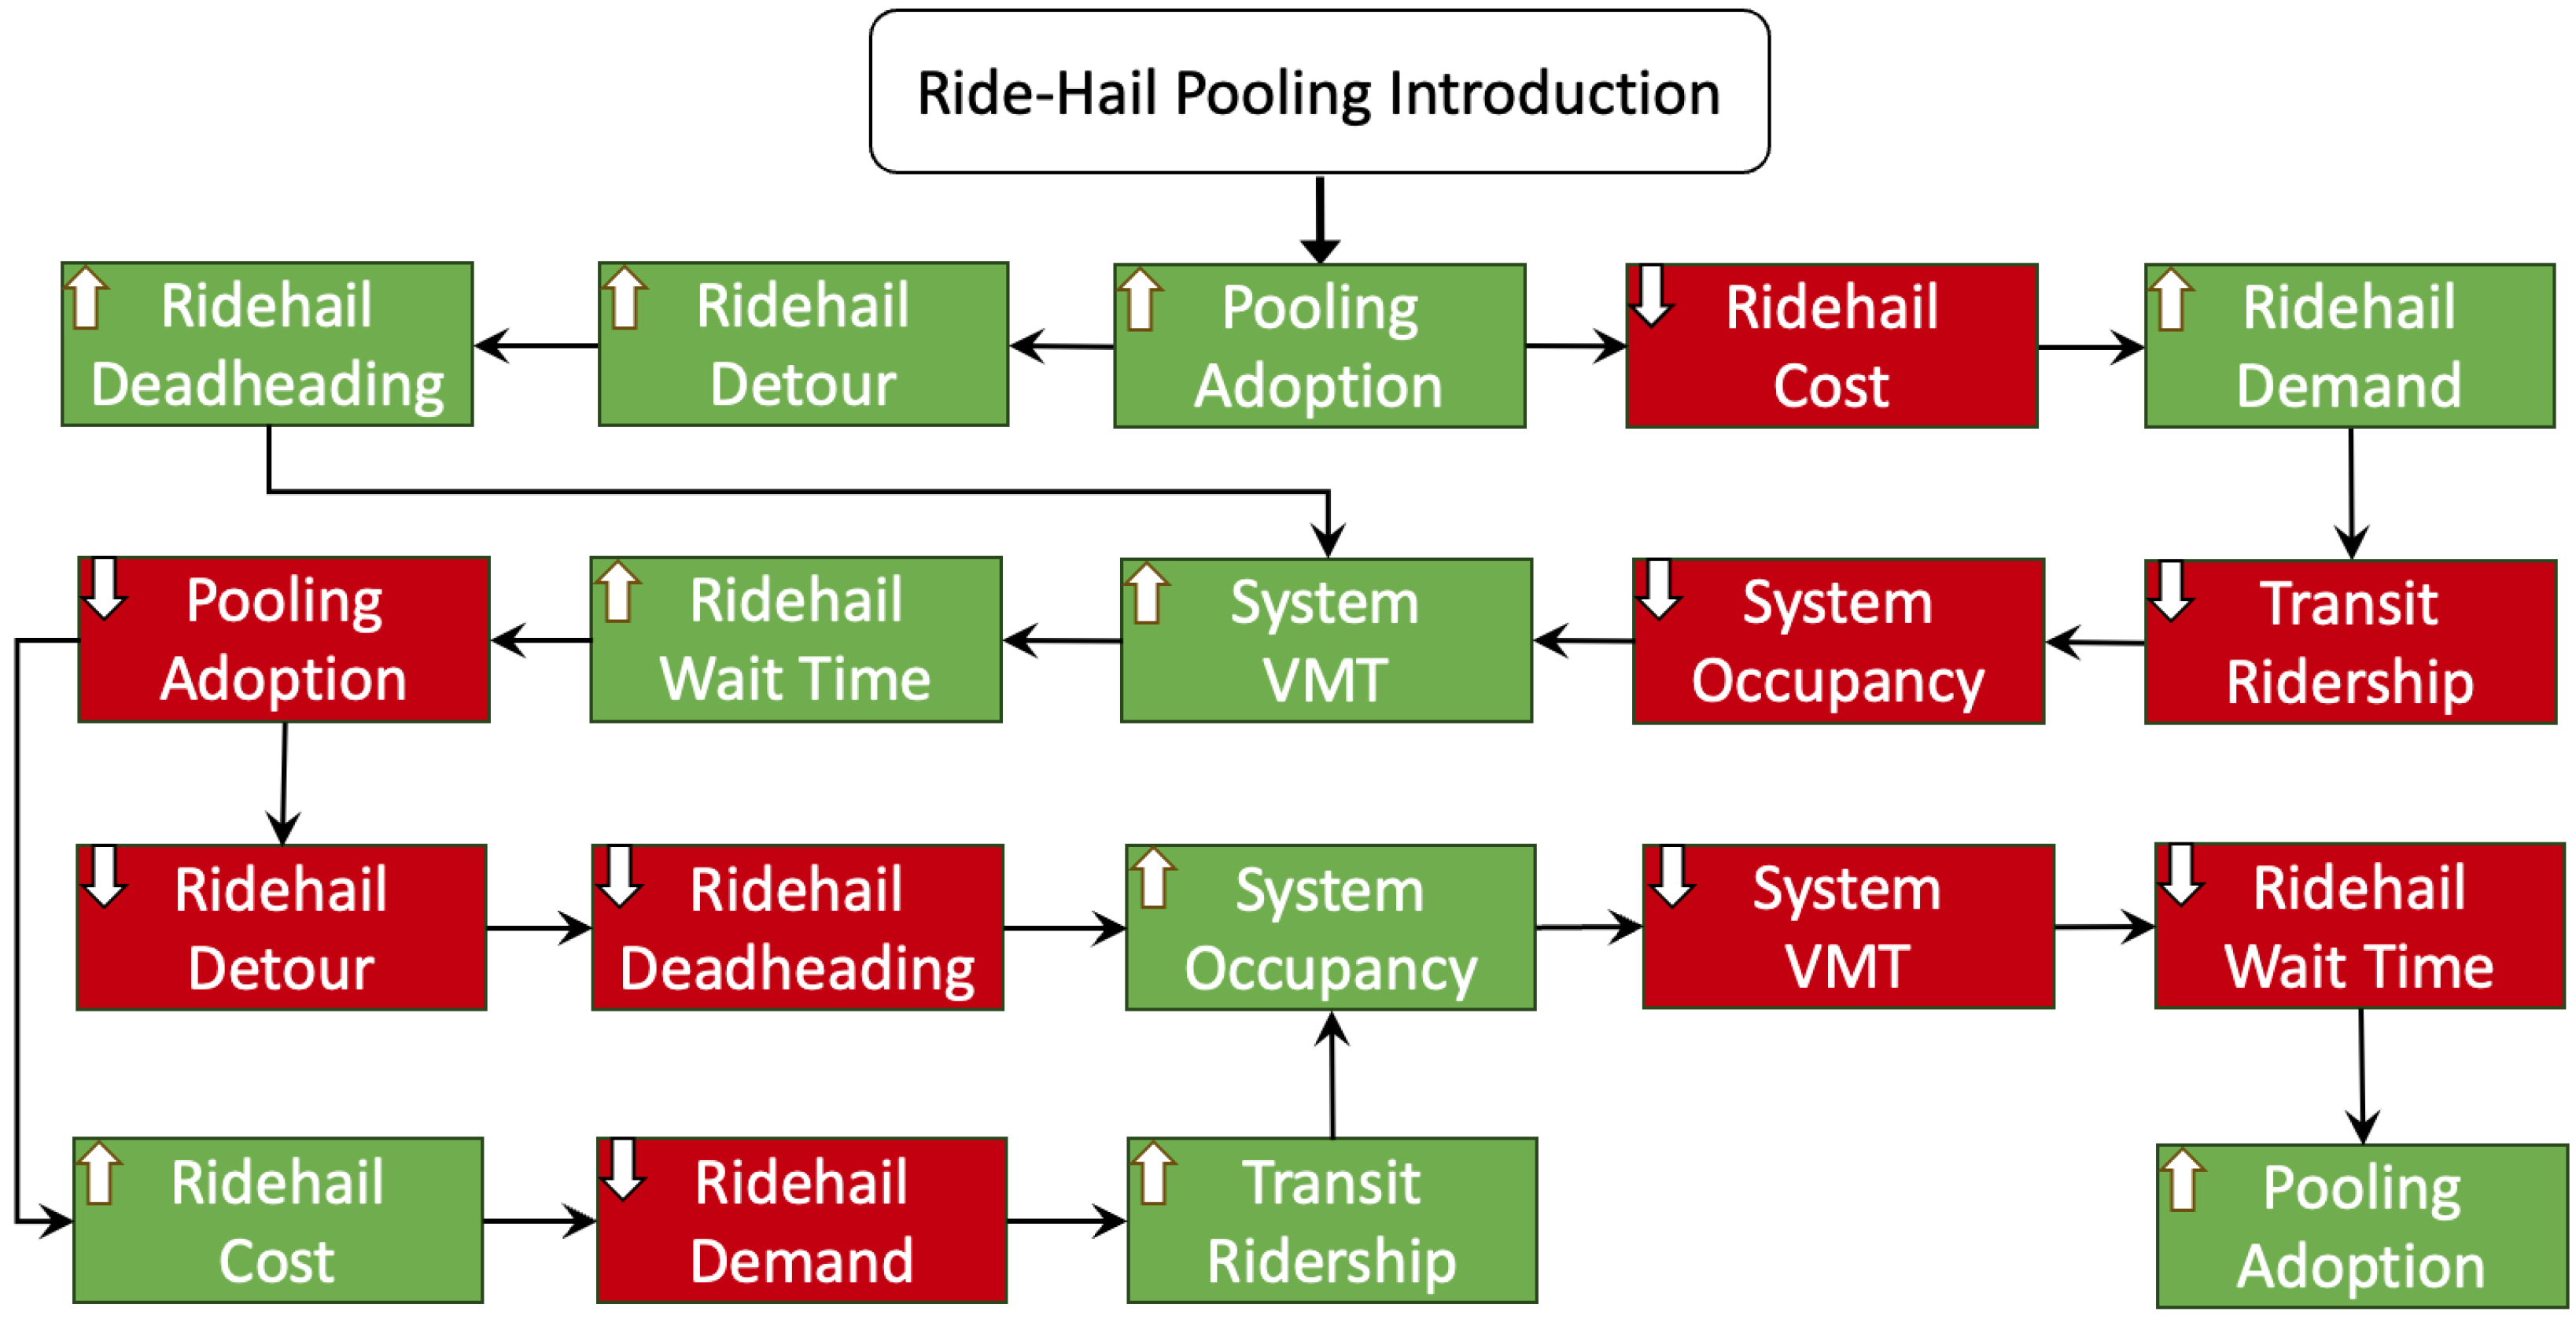
Introducing pooling sets off a cascade of competing feedback effects, as illustrated in
Figure 1. On one hand, greater pooling adoption increases detour and deadheading miles, pushing wait times up and gradually eroding the service appeal of ride-hailing. On the other hand, pooling drives down the cost per ride, drawing more travelers away from transit and toward ride-hailing, which ultimately lowers system occupancy and pushes overall vehicle miles traveled upward [
7,
10].
Tracing these feedback dynamics at metropolitan scale requires modeling individual behaviors from the bottom up, so that system-level complexity emerges organically from the interactions of hundreds of thousands of travelers and vehicles, a capability that aggregate models cannot provide. To this end, we simulate large-scale ride-hailing operations within BEAM [
50], which includes a full array of multi-modal alternatives available to each traveler, including single-occupant ride-hailing, pooled ride-hailing, driving alone, walking, biking, and transit; the transit alternative further offers four sub-alternatives where access and egress can be achieved by walking, biking, driving, or ride-hailing. Mode choice occurs dynamically within the simulation day, allowing travelers to receive accurate price and wait time quotes from a ride-hail fleet manager at the moment of departure. Individual agents express preferences through a utility-maximizing evolutionary algorithm that minimizes each individual’s cost and time spent traveling via diverse modal options, including competition for scarce supply resources such as vehicle seating capacities, parking spaces, refueling infrastructure, and ride-hailing fleet.
BEAM is also the behavioral simulation backbone of BEAM CORE (Comprehensive Regional Evaluator), a broader integrated modeling workflow that couples BEAM with the ActivitySim activity-based travel demand model, enabling a co-evolutionary process in which agents iteratively learn from experienced travel outcomes to refine their plans toward a dynamic user equilibrium. It simulates the essential elements of a dynamic transportation system for both passenger and freight, incorporating land-use, a synthetic population and firms with activity plans and preferences, and vehicle ownership. BEAM CORE has been calibrated and validated for the San Francisco Bay Area [
51].
2.1. Ride-Hailing in BEAM
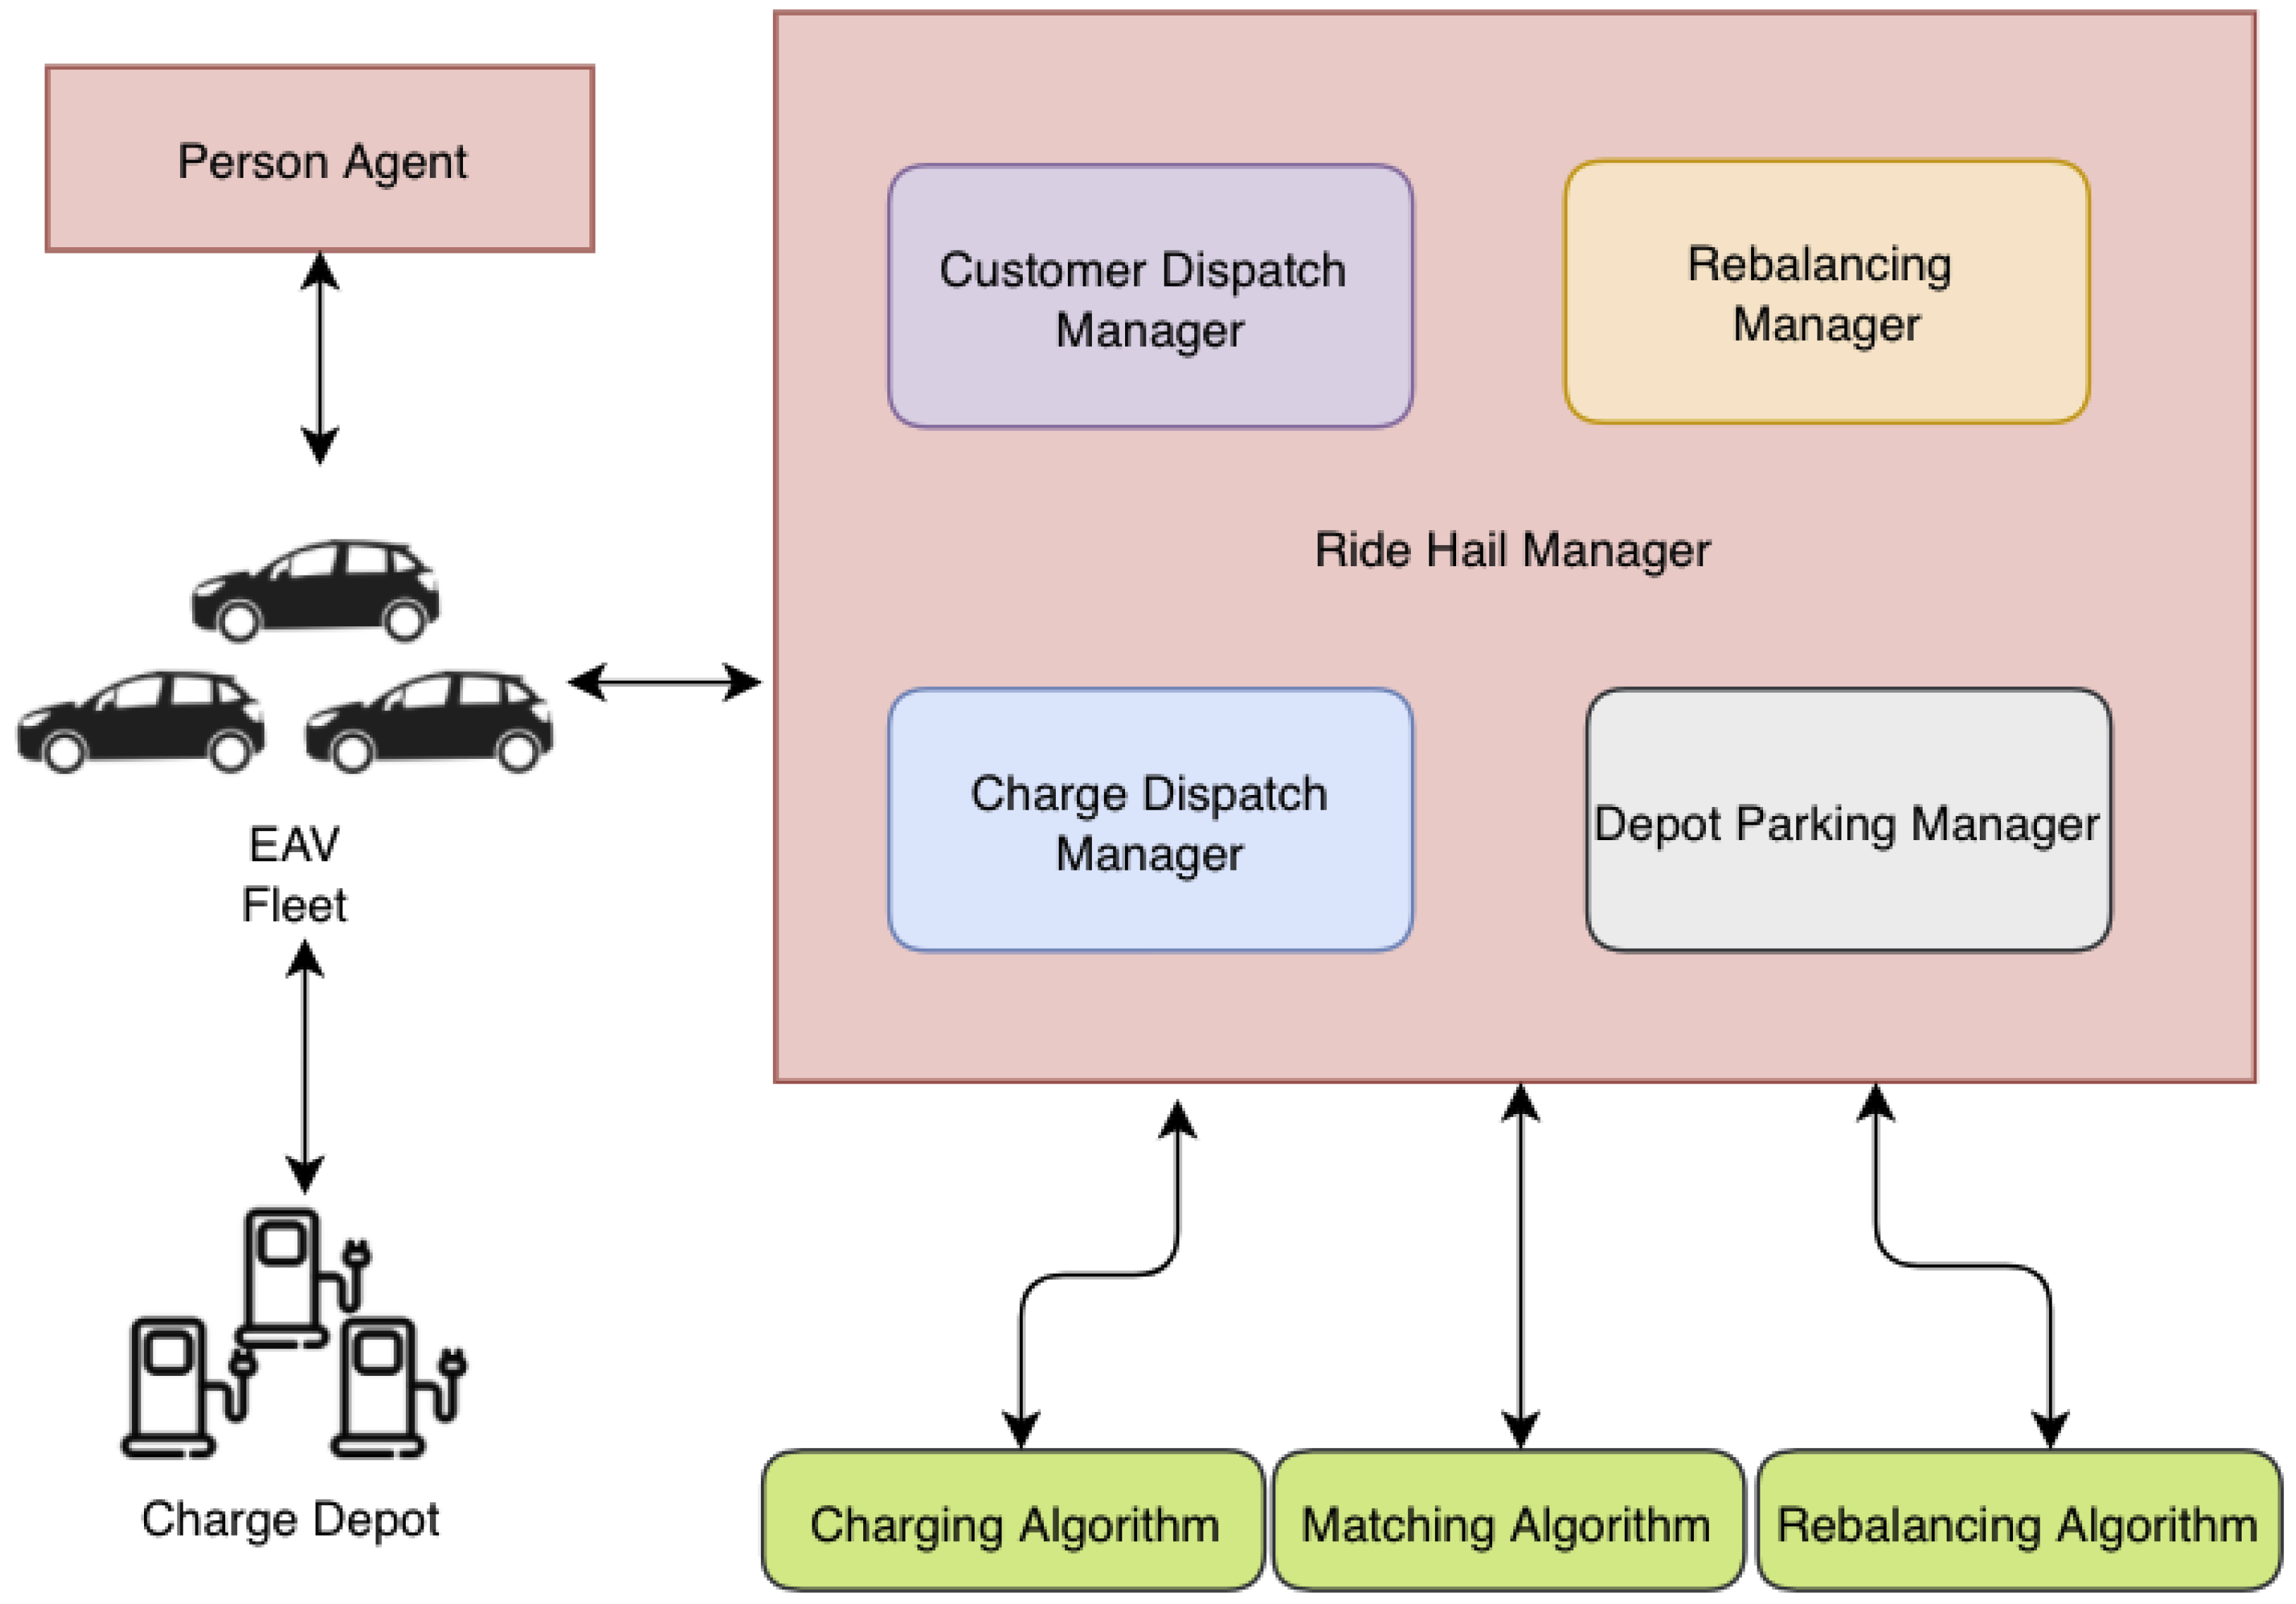
As depicted in
Figure 2, the ride-hailing module is a containerized module that interacts with the rest of the transportation system through competition for resources such as the road network and infrastructure (parking and charging stalls).
The vital component of the ride-hailing module is the RideHailManager (RHM), which operates as an independent agent and oversees the entire fleet assigned to it. The ride-hailing fleet is made up of individual vehicle agents whose availability follows log-normal shift duration distributions calibrated to observed TNC driver data from the Chicago dataset [
52], with an average on-duty time of approximately 3.5 h per day; fleet size therefore varies organically over the course of the day as drivers begin and end their shifts, and differs between scenarios based on the total number of registered drivers. When a traveler requests a ride-hailing trip, RHM pairs them with a nearby ride-hailing vehicle with available seats that, once notified, traverses the road network to pick them up and drive them to their destination. If the traveler chooses a cheaper shared ride option, a customer matching algorithm is used to pair that trip with other requests for pooled trips if possible. To reposition (or rebalance) to areas of higher demand, ride-hailing agents follow a demand-driven heuristic after finishing a trip in an area with low expected demand, guided by the number of pending requests or average waiting time in neighboring zones. When the electric vehicle range falls below a configurable threshold, drivers make an independent stochastic decision to charge at a public fast-charging station and remain unavailable until the state of charge reaches at least 80%. BEAM also supports a ridehail-transit mode in which ride-hailing serves as a first- or last-mile connection to public transit, allowing travelers to combine a ride-hailing leg with a transit leg within a single trip [
53]. This combined mode is evaluated alongside standalone ride-hailing and other alternatives in the multinomial logit choice model.
In the BEAM model, agents utilize an evolutionary learning process to optimize personal utility over successive simulated days through exploration (mutation) and exploitation (selection from previous plans). Agents decide their mode either during plan mutation, before the simulation day starts, or at the moment of departure by evaluating all modal alternatives. They receive price and wait time quotes for both solo and pooled options from the RHM and assess these alongside other modes. The fare quoted to the traveler is computed as a base cost plus a distance-based and a time-based component:
, where
is the base fare,
the cost per mile,
the cost per minute, and
d and
t the trip distance and duration. Default fare parameters are estimated from 45 million TNC trips in Chicago [
52] using a linear regression of fare on trip miles and trip minutes, fitted separately for solo and pooled rides:
$1.80 base,
$0.91/mile, and
$0.28/min for solo rides, and
$1.89 base,
$1.11/mile, and
$0.07/min for pooled rides; for autonomous vehicles, the time component is set to zero to reflect the absence of a driver. A multinomial logit choice model, considering each agent’s personal value of time (linked to their household income), is used to weigh time and cost, and a final choice is sampled.
It should be noted that several notable BEAM features were not included in this study. First, BEAM supports a zone-level surge pricing mechanism that adaptively adjusts a fare multiplier
between iterations based on revenue changes per TAZ; this feature was not activated, and all fares were computed at their base rates. Disabling surge pricing means that demand-side rebalancing signals are absent, which in real systems can prevent severe matching inefficiencies during demand spikes [
54]; the repositioning algorithm studied here serves as a supply-side substitute for this function. Second, although the ridehail-transit integration mode was available during this study, subsequent enhancements to this feature (including pooled ridehail-transit trips and walk access/egress options) were introduced later and were therefore not reflected in the version used. Third, the ride-hailing module operated with a single fleet managed by one RHM at the time this study was conducted. Since then, a multi-fleet ride-hailing feature was introduced, enabling the simulation of competing ride-hailing operators (akin to real-world services such as Uber, Lyft, and Waymo) within the same scenario. In this newer framework, a
RideHailMaster orchestrates multiple RHM instances, each representing a distinct fleet operator with its own vehicle allocation algorithm, repositioning strategy, pricing structure, and supported modes (e.g., goods delivery). Travelers are assigned service subscriptions as part of their population attributes, and when a ride-hailing request is issued, it is broadcast to all fleets the traveler is subscribed to. Competing proposals are then evaluated using a similar multinomial logit framework, extended with a subscription preference parameter, allowing customers to probabilistically select among offers from different operators. None of these capabilities were active in our analysis, and the results presented here reflect a single-operator ride-hailing market with fixed base fares, without inter-fleet competition, surge pricing, the latest ridehail-transit enhancements, or calibration to 2014–2019 Uber and Lyft datasets released in 2024 by the California Public Utilities Commission (CPUC).
2.2. Ride-Hailing Vehicle Repositioning (The Inverse-Square Law Algorithm)
The ideal goal of repositioning (or rebalancing) ride-hailing vehicles is for idle vehicles to move to a nearby area where they are guaranteed to match with a customer request, such that deadheading represents only a small fraction of total operations. Vehicle relocation is a well-known challenge in shared mobility systems more broadly, including car sharing fleets where user-based and operator-based strategies have been explored to maintain spatial balance between supply and demand [
55]. To meet this expectation, the ride-hailing system must make correct predictions of where and when demand will arise and where and when vehicles will become idle, which is often hard to estimate in a real-world environment. In this study, we utilize a demand-following repositioning algorithm that is highly sensitive to distance, relying on the natural law of the inverse square. The algorithm mimics this physical law by treating estimated demand as a mass in a gravitational field; the attraction toward a demand zone is therefore inversely proportional to the square of the distance from the ride-hailing vehicle’s location.
Let T be the set of time steps where repositioning decisions are taken, and Z the set of spatial indices. h is the horizon of demand prediction in seconds. is the demand in zone z between time t and . is the distance from a vehicle v to a zone z. is the sensitivity to demand expressed as a fraction. is the sensitivity to distance expressed as a fraction.
The repositioning attraction score of a vehicle
v toward a zone
z at time
t is:
given that
and
with
When the adjusted distance falls below unity, the vehicle is considered to be effectively within the demand zone itself, and the inverse-square penalty is removed so that the attraction score depends solely on the magnitude of demand. The target zone is then sampled from the distribution obtained by normalizing across all candidate zones, making the selection probability proportional to the attraction score.
2.3. Ride-Hailing Vehicle Pooling: The Greedy Vehicle-Centric (GVC) Algorithm
At a high level, the GVC algorithm answers a simple question: given a set of ride requests arriving over a short time window, which groups of passengers can share a vehicle without unacceptable detours or waits, and which vehicle should serve each group? It does so in three steps: (1) narrow down the candidates for each vehicle to the requests most likely to be compatible (proximity and direction filters); (2) evaluate valid pooled combinations for each vehicle and score them by how efficiently they use passengers’ tolerance for delay; and (3) assign trips greedily, prioritizing the largest carpools first. The technical formulation below gives the precise constraints and scoring used in each step.
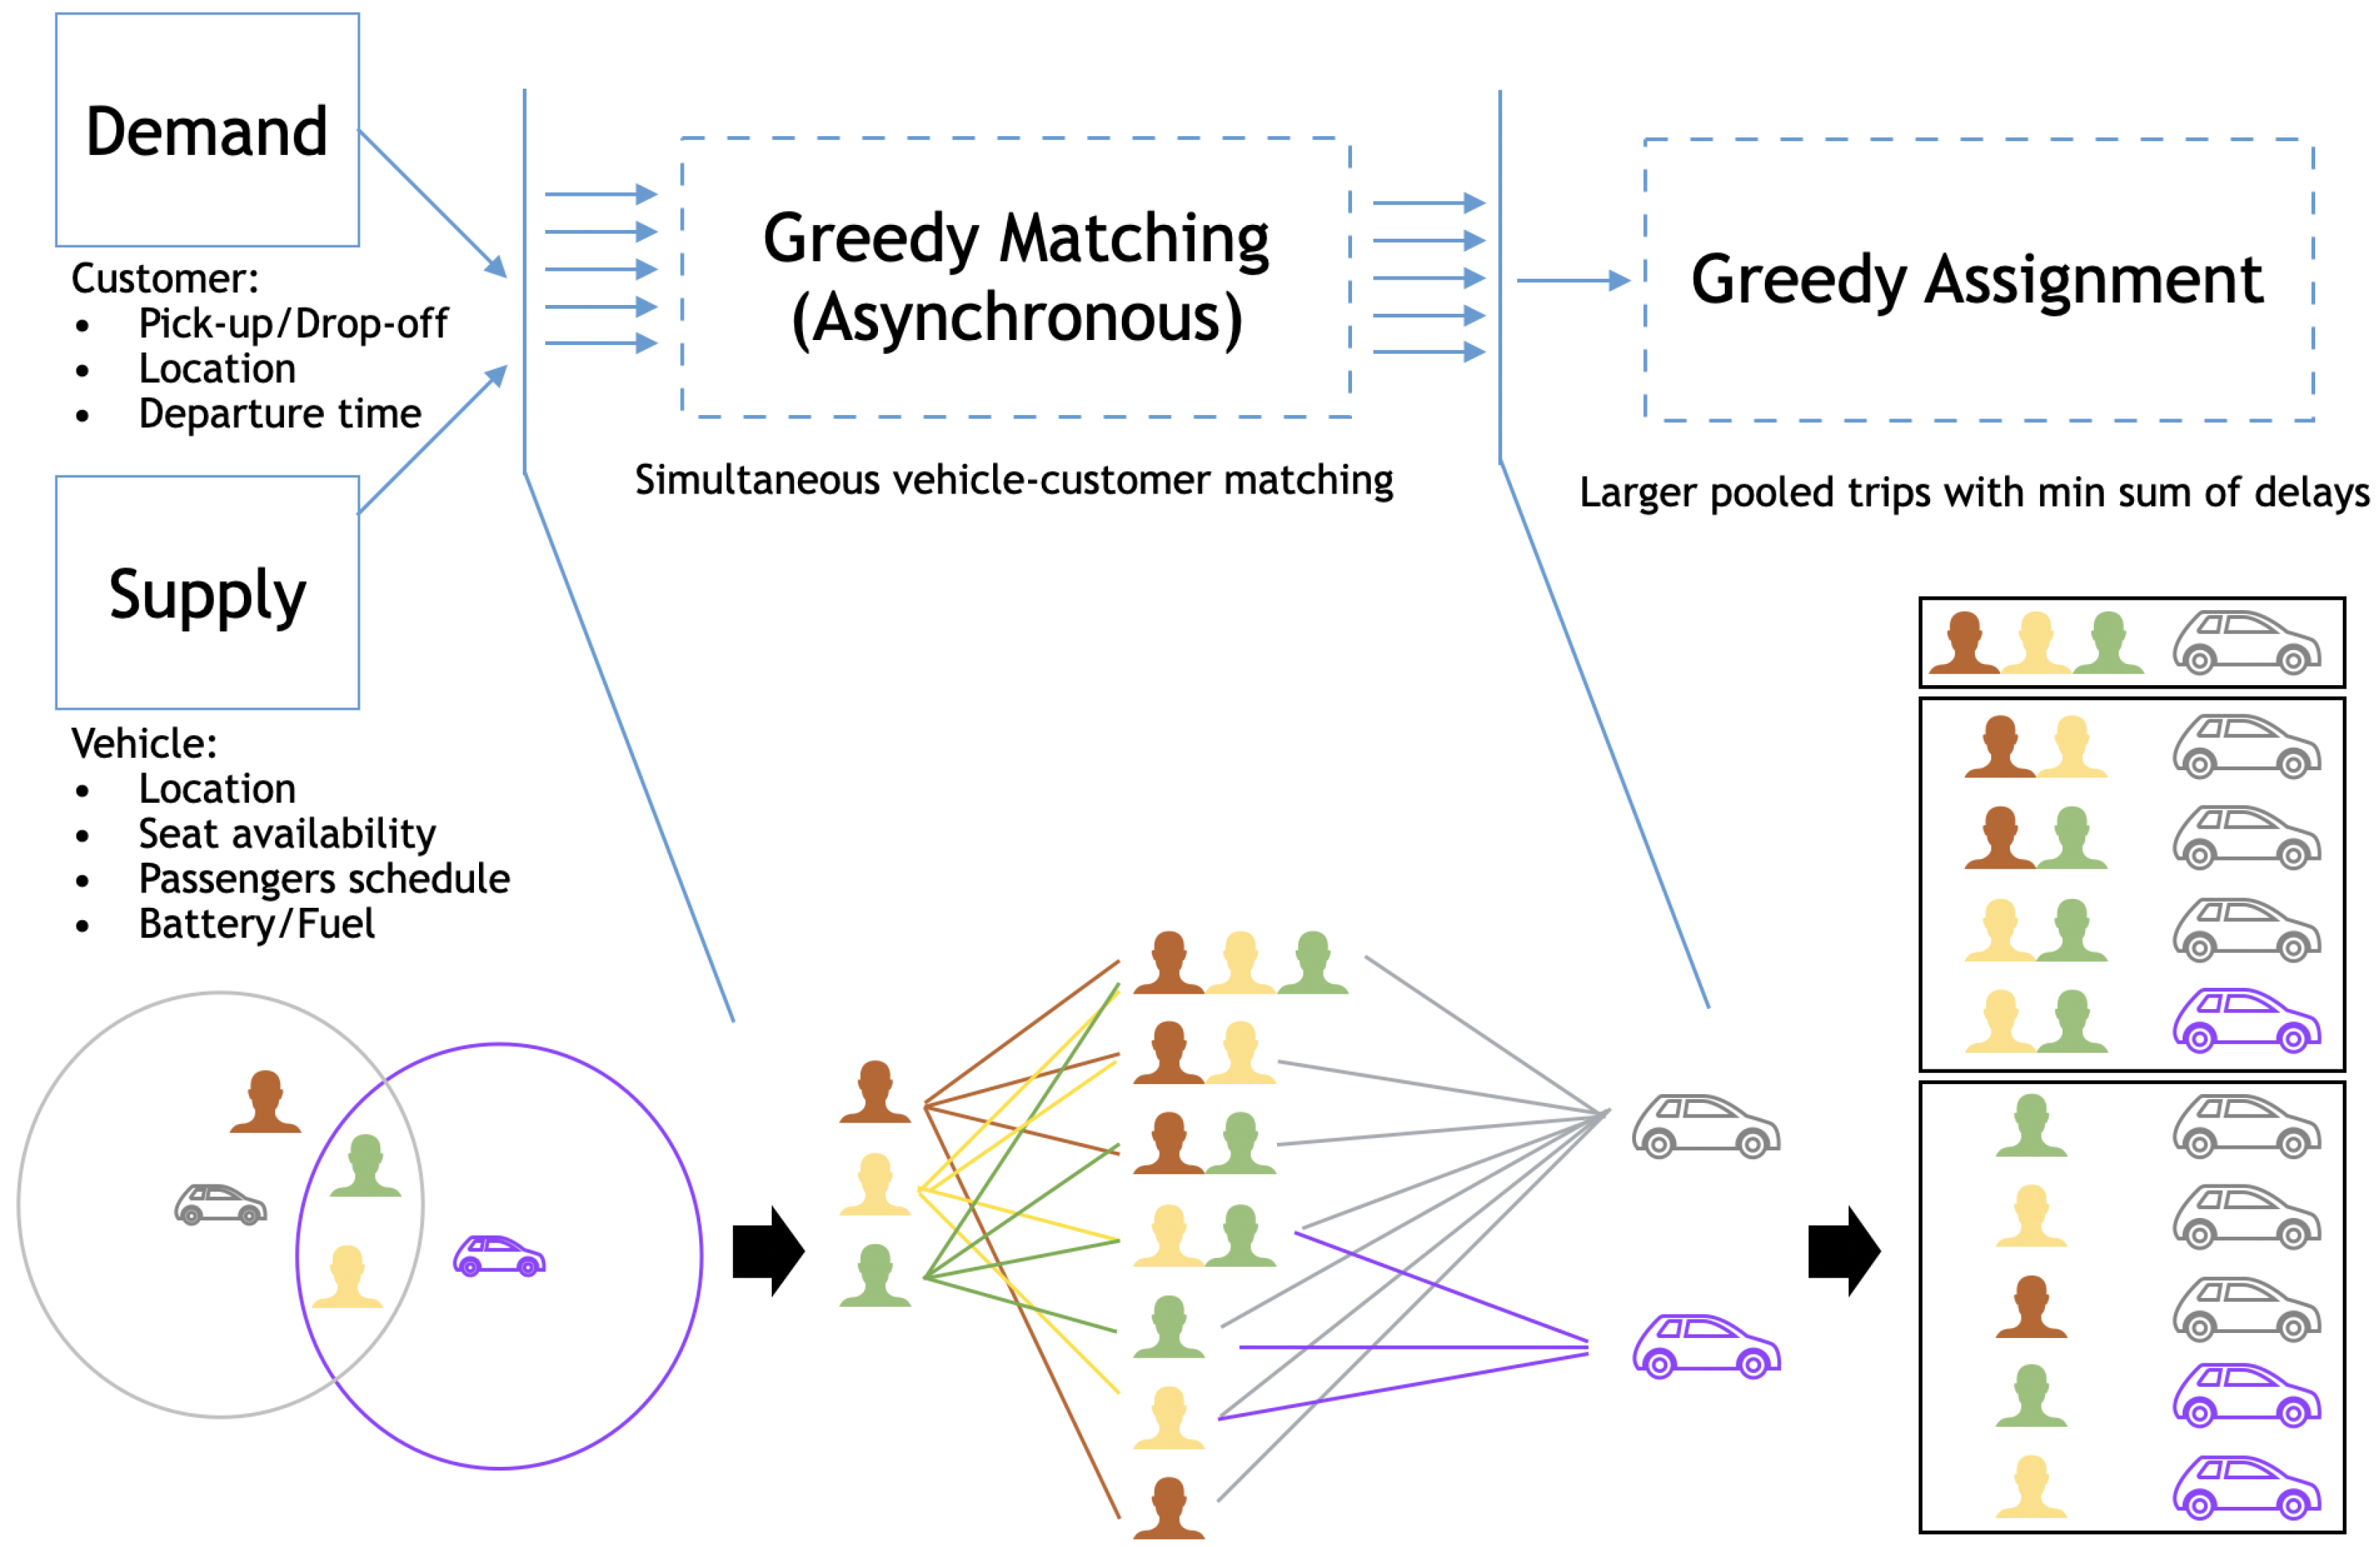
The proposed algorithm proceeds in three steps as portrayed in
Figure 3. Given a list of travel requests submitted by customers and ride-hailing vehicle statuses collected over a time window, the algorithm first filters the inputs, then initiates the second phase of matching vehicles to customers. Once the list of potential trips has been defined, a third phase makes final assignments based on two metrics: the pool size and the sum of delays.
2.3.1. Greedy Selection Step
To speed up the matching process, the algorithm operates on a subset of requests most likely to be matched together, as an optimal algorithm would do. In this step, requests are filtered by proximity (to minimize wait time) and by direction (to minimize detour time and increase the likelihood of a successful match). To filter by proximity, the algorithm uses an input radius to select all requests within a certain distance. To verify the direction of these requests, including customers already on board, the algorithm uses an input angle: the straight line from the vehicle to one customer’s destination forms an angle with the straight line from the same vehicle to a second customer’s destination. If this angle is smaller than or equal to the input angle, the two customers are considered to be heading in the same direction and are therefore more likely to be successfully matched; they are consequently added to the candidate list for that vehicle.
2.3.2. Greedy Matching Step
Every vehicle is assigned a maximum number of requests, referred to in this paper as RPV and in the algorithm as maxRequestsPerVehicle, representing the candidates most likely to be their best match. Since the matching algorithm is vehicle-centric (i.e., vehicles are the independent variables), it is both efficient and natural to move from procedural to asynchronous matching, where the list of potential trips for every vehicle is built simultaneously. The sub-lists of trips are then merged into a single list covering all potential combinations.
In the current implementation, three filters identify the best requests for each vehicle, noting that the same request can be assigned to multiple vehicles. First, all requests outside a predefined geofence are excluded. Second, if the vehicle is en-route, the dropoff locations of its current passengers are used as reference destinations; if it is deadheading, the list of requests is ordered by pickup distance and the dropoff locations of the top RPV requests are selected. Based on this set of destinations, all other requests are clustered by direction using the angle criterion from the selection step, with the largest groups heading in the same direction ranked highest. Third, only the top N requests per vehicle (i.e., RPV) are retained. The underlying assumption is that the closer the pickup location and the more similar the direction, the better the match, whether the vehicle is deadheading or en-route.
Once every vehicle has been assigned its top requests, the algorithm matches requests to each other within the pool of candidates assigned to the same vehicle. A trip pooling two or more customers is considered valid if all service times (pickup and dropoff) satisfy the constraints defined by
maxWaitingTimeInSec (denoted here as
w),
maxExcessRideTime (denoted as
), and
remainingRangeInMeters (denoted as
, representing the maximum distance vehicle
v can traverse given its current energy at average speed
). The ideal service time, representing zero waiting time along a direct trip without pooling or detours, is denoted as
. The actual service time of a passenger
by a vehicle
v is expressed as
, where
is the time the customer waited before being picked up, and
and
are respectively the dropoff and pickup times. The conditions the matching algorithm must satisfy are:
Once a trip is deemed valid, its cost
for vehicle
v pooling a set of passengers
is computed as shown in Formula (
7).
with the delay experienced by passenger
expressed as:
and the maximum delay:
A lower cost indicates that passengers experience delays closer to their maximum tolerance, leaving less unused slack; the algorithm therefore favors trips that more fully utilize the allowable delay budget, biasing toward tighter, more efficient pooling arrangements. Each vehicle maintains a limited list of
pooled trips computed with Formula (
8), which equals
N times the square root of the binomial coefficient representing the total number of possible combinations of choosing
(the number of free seats in vehicle
v) from the
N remaining customers assigned to it. This reflects the greedy nature of the algorithm: it does not consider all possible combinations. The top
trips are selected by cost; if a newly computed cost is lower than the highest cost currently in the list, it replaces it, otherwise the trip is discarded.
2.3.3. Greedy Assignment Step
After generating the list of potential trips, the greedy assignment algorithm proceeds with a top-down approach in which larger pooled rides are prioritized first, following the same approach applied by Alonso-Mora in [
33]. The algorithm selects the largest pools first (e.g., all candidate assignments achieving 4 passengers) and sorts them by sum of delays, which occurs automatically through the ordering of trips by the cost function defined in Formula (
7). Trips are then assigned in order, marking the respective customer requests and ride-hailing vehicles as successfully assigned. If any of those customers or vehicles appear in a subsequent trip, that alternative is discarded. The algorithm then moves to the next largest pool size (e.g., 3-passenger assignments) and repeats until all candidate assignments have been processed or all customers and vehicles have been assigned.
2.4. Three Pooling Algorithms
In addition to the pooling algorithm described above, referred to from this point onward as Greedy Vehicle-Centric (GVC), we implemented two versions of the Alonso-Mora pooling algorithm [
33]. The matching algorithms implemented in BEAM v1.0.0 are available in the BEAM source code on GitHub at
https://github.com/LBNL-UCB-STI/beam/blob/v1.0.0/src/main/scala/beam/agentsim/agents/ridehail/ (accessed on 27 March 2026): The first is the Optimal Alonso-Mora (OAM), which follows the three original steps exactly: pairwise Request-Vehicle graph construction, followed by tripartite Request-Trip-Vehicle graph construction generating all possible matching combinations, and finally optimal assignment via mixed-integer programming as described in [
33]. The second is the Greedy Alonso-Mora (GAM), which skips the pairwise Request-Vehicle graph construction and relies on a greedy approach for the assignment step. In GAM, the tripartite Request-Trip-Vehicle graph is built asynchronously: for each vehicle a sub-graph of requests and trips is constructed, and the final graph used by the assignment solver is assembled by merging all sub-graphs.
GAM can be considered a computationally efficient, non-NP-Hard, sub-optimal version of OAM, while GVC is designed to be more efficient than GAM while producing comparable results. It is worth noting that all three algorithms operate on the same reduced domain: they all rely on the Greedy Selection Step before matching, selecting the closest requests heading in the same direction as input. Consequently, even OAM, despite being an optimal solver, is applied to a sub-problem rather than the full domain space.
2.5. Study Area and Scenario Design
The analysis relies on a San Francisco Bay Area implementation of the BEAM framework [
50,
51,
56], with a population of 7.75 million residents and high ride-hailing adoption. Behavioral and network parameters were calibrated on a 10% population sample covering commuting trips over 30 h of simulated time, so that current mode split and travel times match observations as closely as possible. The choice model replicates modal shares as estimated by the local metropolitan planning organization in 2016 [
57]. The effective disutility of pooling relative to solo ride-hailing—combining the mode-specific intercept (
$1.68) and the additional value of travel time for shared rides (
$23.70/h, implying roughly
$2.77 for a 7-min trip)—was estimated from the same Chicago dataset [
52] to be approximately
$4.5 per trip. Solo ride-hailing trips are priced at
$1.80 +
$0.91/mile +
$0.28/min and pooled trips at
$1.89 +
$1.11/mile +
$0.07/min, consistent with the Chicago-estimated parameters described in
Section 2. Over successive BEAM iterations, the pooling quote presented to customers is updated based on observed skims of travel time and distance from previous iterations. The SFBay scenario draws on multiple data sources for its inputs and calibration [
51]: the road network is derived from OpenStreetMap, transit routes and schedules from GTFS feeds, the synthetic population and land use from UrbanSim. Traffic flow was validated against speeds and travel times collected via the Google Maps API and U.S. Highway Performance Monitoring System (HPMS) VMT estimates, and transit ridership against agency-level boarding counts from the Metropolitan Transportation Commission [
58].
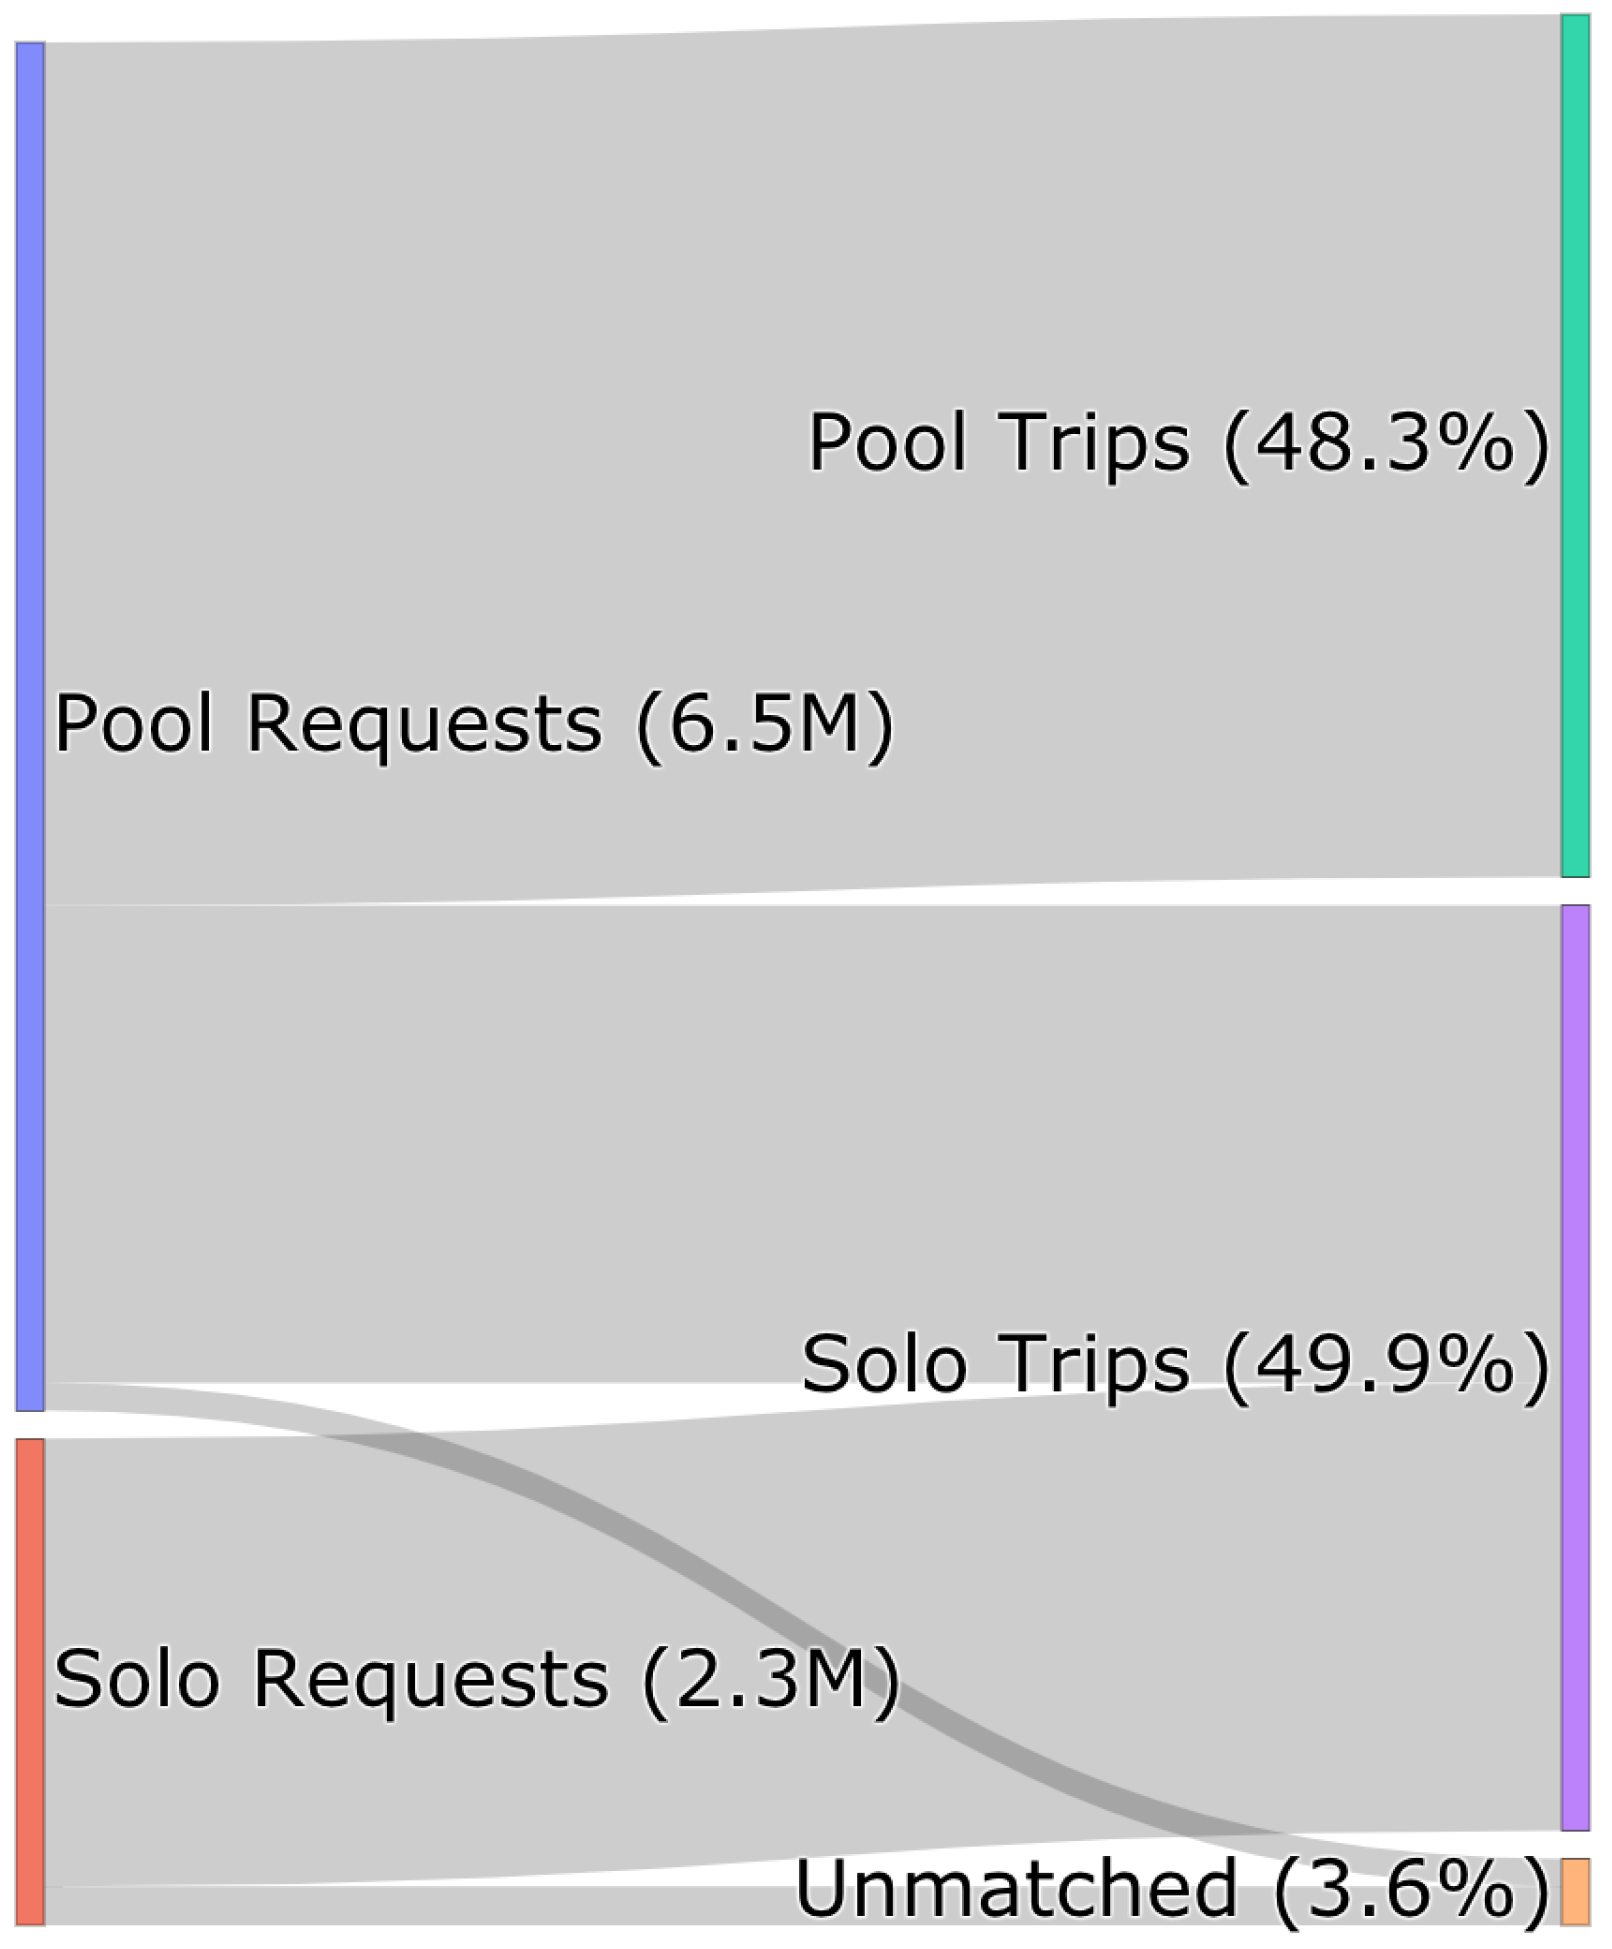
Ride-hailing was calibrated for 40% deadheading, 7 min waiting time, and a 60–75% pool match ratio (
Figure 4). Ride-hailing drivers are not permitted to reject trip offers, so in terms of dispatch they behave identically regardless of shift type; human-driven vehicles do, however, operate in limited shifts based on empirical data from the Chicago dataset [
52]. Once a person agent chooses ride-hailing, they send a request for a pooled or solo pickup. The ride-hailing manager collects these requests in a buffer and, every few minutes, executes the pooling algorithm on the set of pooled requests first, then allocates the remaining solo requests based on the nearest available vehicle in terms of travel time. The vehicles are finally dispatched to pick up customers.
3. Results and Discussion
Zooming in on ride-hailing operations in
Figure 4, from a representative weekday simulation of the San Francisco Bay Area (SFBay) with projected growth in ride-hailing mode share (computed on a 10% population sample with selected metrics reported as scaled full-population equivalents), we find that 65.4% of pooled requests result in actual pooled trips, which lies within the model’s baseline calibration range (60–75%).
This pooled-request conversion is the same operational quantity used here as the pool match ratio reported in calibration. Although solo requests represent only 26% of demand, nearly 50% of travelers end up riding solo, roughly double the requested solo share. Combined with the low unmatched-request rate (3.6%), this indicates that unmet demand is not the primary bottleneck. Rather, endogenous operational constraints, specifically timing mismatches between pooled requests, geographic dispersion of demand, and vehicle capacity conflicts, limit pooling even when dispatch logic prioritizes pooled assignments. Consistent with this interpretation, disabling pooling increases total energy use by only about 1.5%, suggesting that deadheading and service degradation offset a substantial share of the expected gains from shared rides, consistent with Schaller [
10], who found that pooling’s theoretical VMT savings are largely neutralized by induced demand and operational overhead in practice.
These findings suggest negative feedbacks that constrain ride-hailing occupancy. To isolate where they arise, we use two complementary sensitivity analyses: one focused on repositioning and fleet sizing, and one focused on pooling algorithm design.
The first set isolates the contribution of fleet sizing and repositioning to overall system efficiency and sustainability across approximately thirty scenarios. Repositioning sensitivity is a fractional control on repositioning probability, scaled to peak-hour demand (e.g., at 50% sensitivity, up to half of idle vehicles reposition at peak hour). Fleet size is expressed as a fraction of the initial personal-vehicle stock. The second set evaluates pooling efficiency by algorithm and its contribution to occupancy. To benchmark the proposed method, we compare GVC against GAM (Alonso-Mora with greedy assignment and asynchronous graph construction) and OAM (full mixed-integer optimal assignment). These algorithms are tested both on a peak-hour sample of 1167 commuting requests with 100 ride-hailing vehicles and on the full SFBay scenario across varying RPV values.
3.1. The Repositioning Dilemma
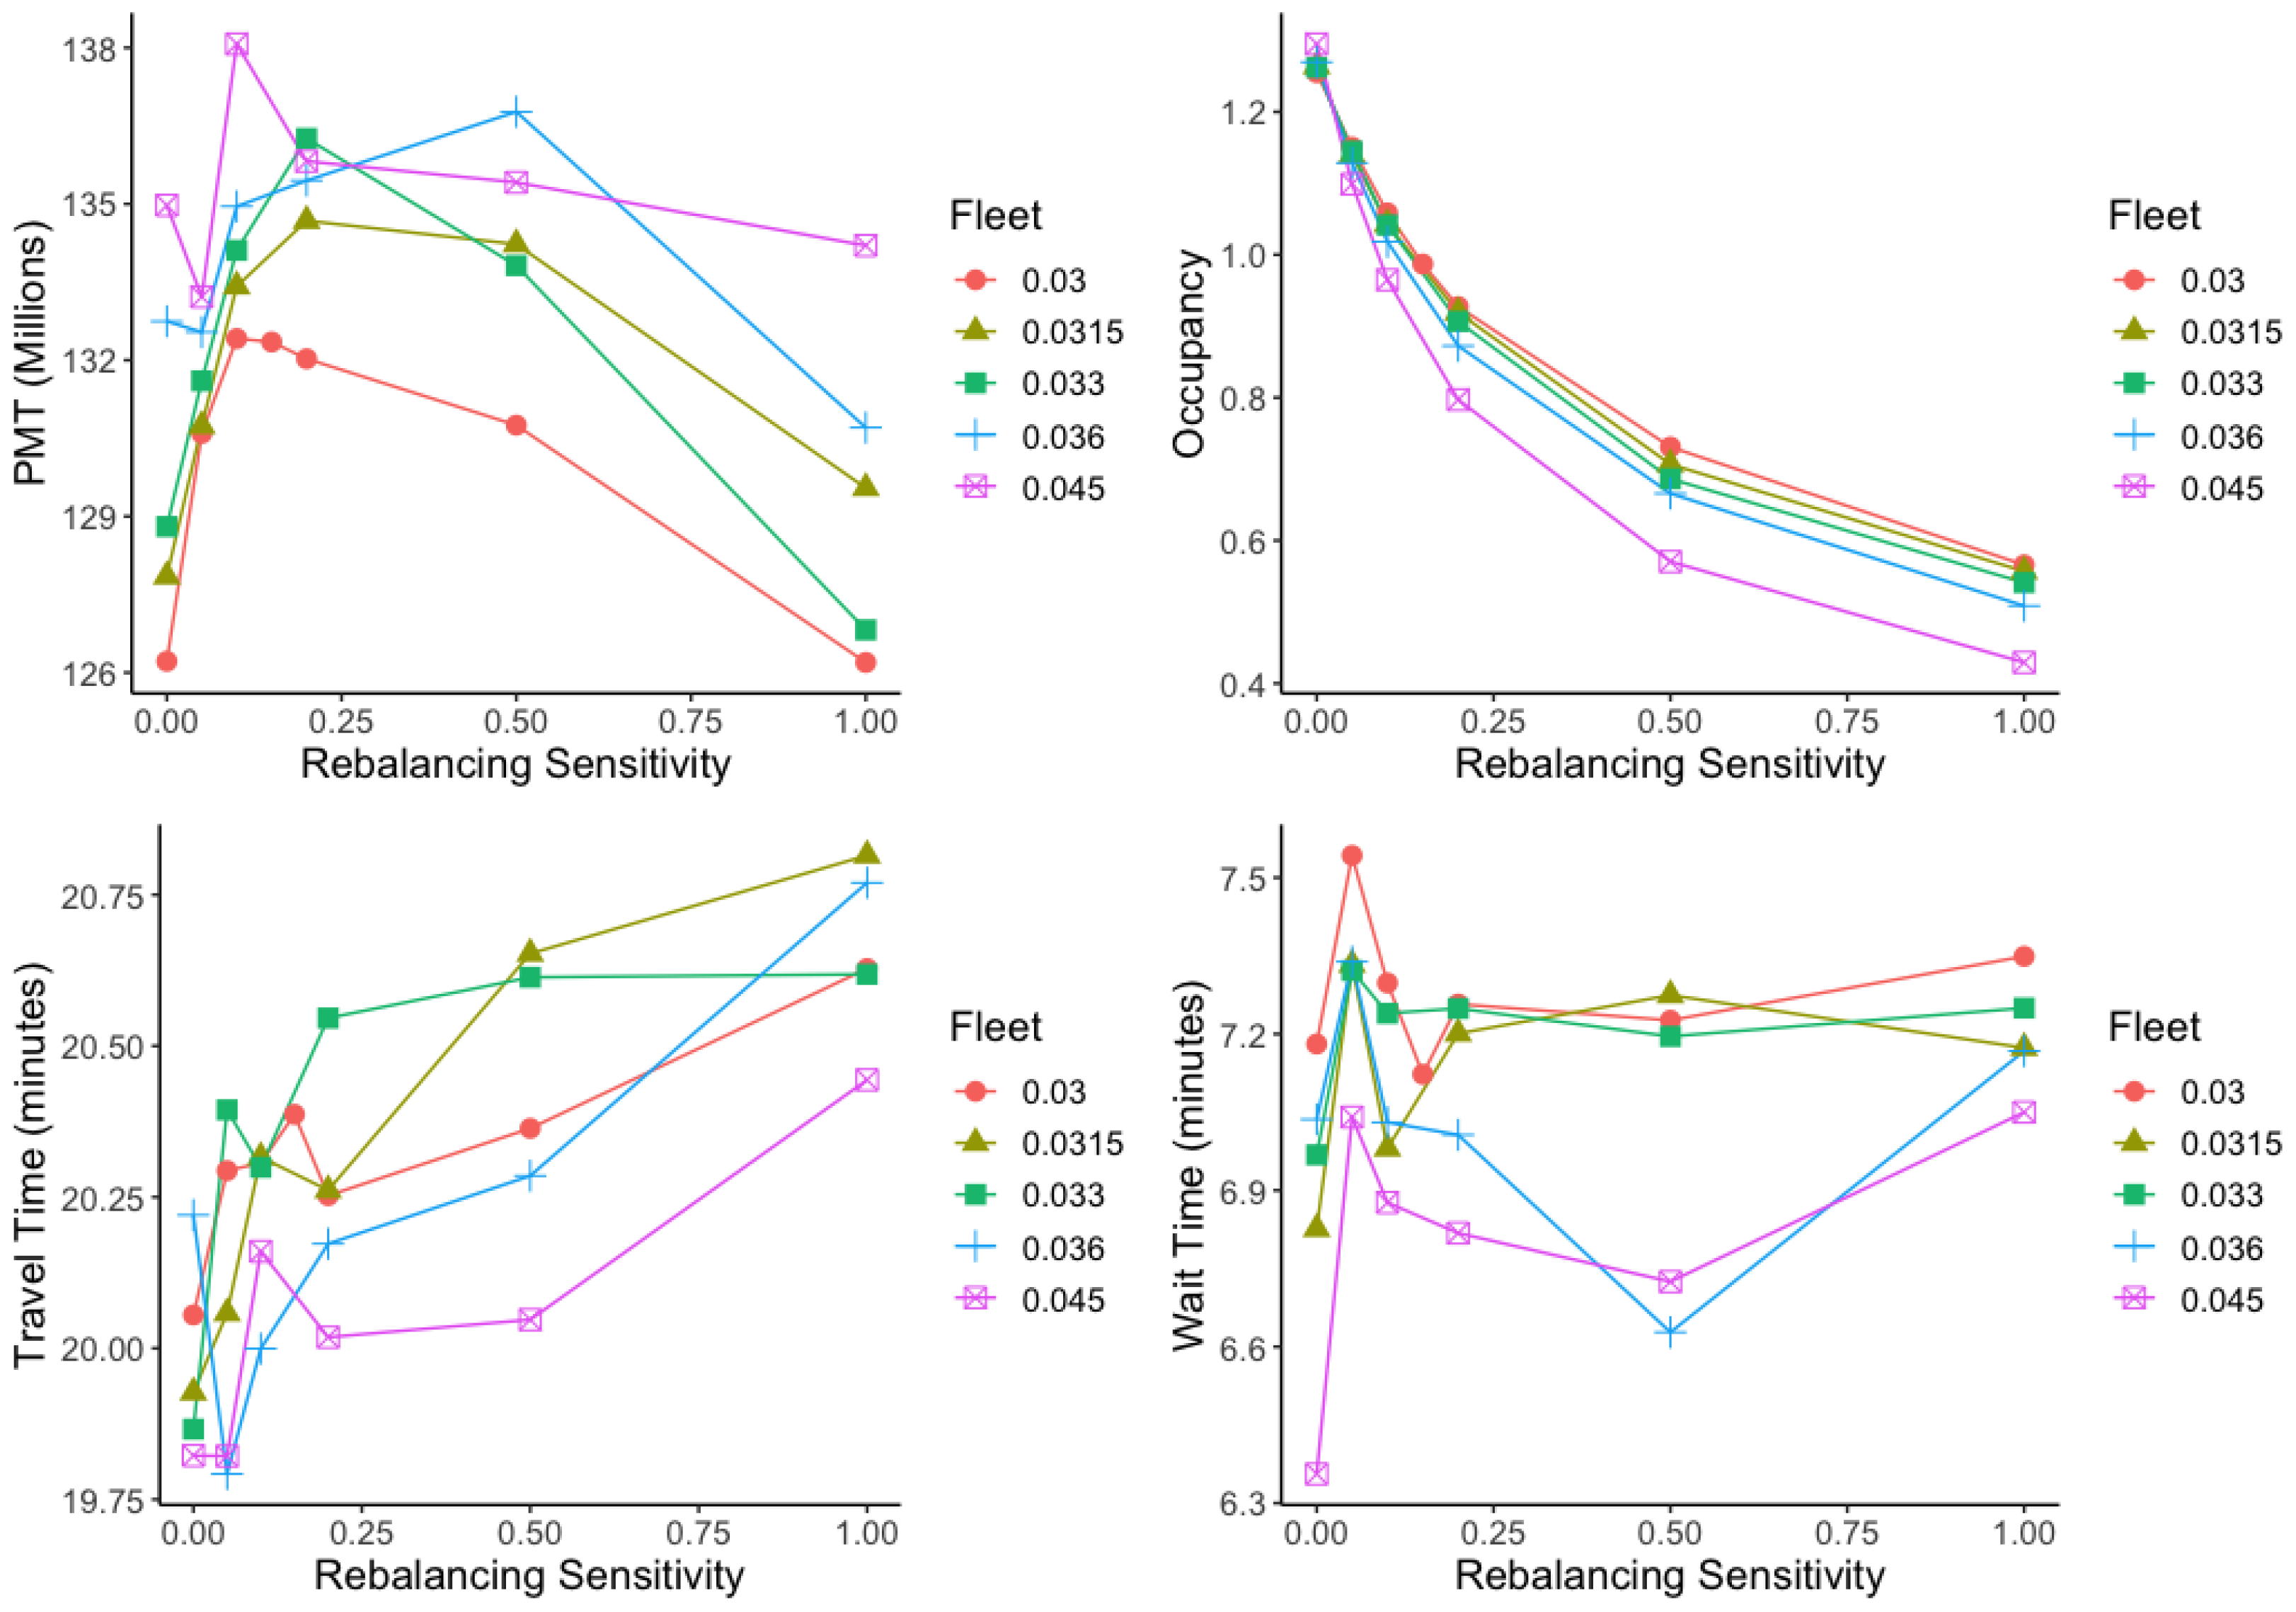
When examining how PMT varies with repositioning sensitivity in
Figure 5, we observe that both PMT and the number of satisfied trips increase with sensitivity up to a certain threshold, then decline, forming an inverted-U-shaped curve. This pattern persists across fleet sizes, though the inflection point shifts proportionally; in the selected scenarios used below, the turning point is around a sensitivity of 0.2. Three interacting mechanisms explain this negative feedback.
Higher repositioning sensitivity relocates more vehicles beyond high-demand cores. While this can initially expand supply coverage, it can also make supply allocation more volatile: small local fluctuations in requests can redirect a larger share of idle vehicles across zones. In parallel, vehicles moving toward high-demand zones may be matched en route in intermediate zones, reducing effective supply at intended destinations where pooling opportunities are typically higher. As these effects become more frequent with increasing sensitivity, the negative feedback can outweigh the benefit of repositioning and the system can become increasingly unbalanced, consistent with findings on fleet rebalancing trade-offs in dynamic ride-sharing systems [
36,
54].
More repositioning directly generates empty VMT, which increases congestion and can offset pooling gains. Ride-hailing customers experiencing longer service times in the early iterations of the BEAM simulation begin switching to alternative modes that offer better travel time and cost trade-offs. Once the network relaxes and the simulation converges, fewer agents choose ride-hailing. This endogenous relationship between repositioning and congestion is visible in the travel time and wait time plots in
Figure 5: ride-hailing travel time increases modestly from 0 to 0.5 sensitivity, then rises sharply, while wait time first declines until 0.5 sensitivity before rising again, tracing an inverted-U-shaped curve in terms of service quality.
Expanding the fleet increases trips and PMT while reducing travel and wait times. However, both larger fleets and higher repositioning sensitivity erode occupancy considerably, as shown in
Figure 5: the more vehicles added to the system and the higher the repositioning sensitivity, the lower the occupancy. The empty miles generated by repositioning cancel out the gains from pooling.
To isolate the impact of repositioning on the overall transportation system, we focus on selected scenario pairs. We define a low repositioning sensitivity of 0.05 (LR) and a high sensitivity of 0.2 (HR), the latter representing the inflection point in most scenarios. We also consider a low fleet size of 0.03 (LF) and a high fleet size of 0.036 (HF), as well as a long-term calibrated pooling-enabled reference scenario (P-HR; fleet size 0.033 and repositioning sensitivity 0.2) together with its no-pooling counterpart (NP-HR) (see
Table 1).
Table 1 should be read by considering trade-offs between service and system burden: higher Trips/PMT and lower VMT/Energy/DH are preferred, while WT/TT and Occ indicate passenger experience and pooling efficiency. The intended comparisons are pairwise (NP-LR vs. NP-HR, P-LR vs. P-HR, and P-LF-LR vs. P-HF-LR). Trips denotes scaled ride-hailing trips in millions per simulated day, not total regional trips across all modes.
When pooling is unavailable, repositioning has a larger adverse effect on ride-hailing service and broader transportation outcomes. In the no-pooling scenario, ride-hailing shows higher total VMT, deadheading, and per-capita energy use, while serving fewer trips and passenger miles than the comparable pooling-enabled scenario (P-HR), confirming the expected role of pooling in absorbing part of the deadheading burden. Comparing NP-LR to NP-HR also shows that no-pooling outcomes are sensitive to repositioning: increasing sensitivity from 0.05 to 0.2 raises VMT by 19.1%, per-capita energy by 19.8%, and deadheading by 75%, while trips fall by 1.9% and PMT falls by 2.9%.
In pooling-enabled scenarios (P-LR vs. P-HR), increasing repositioning sensitivity from 0.05 to 0.2 results in a 9.2% increase in VMT, 8.6% more kWh of energy consumed per person, and a 77% increase in deadheading, while occupancy drops from an average of 1.13 to 0.9 (below one person per vehicle). The gain in number of trips is only 1.7%, wait time decreases by just 0.9%, and the congestion from additional empty VMT raises travel time by 0.6%. These occupancy values are broadly consistent with real-world fleet-level utilization data; fleet-average occupancy and deadheading fraction are two sides of the same phenomenon, and the high deadheading rates documented empirically (28–59% of TNC VMT) directly imply fleet occupancies well below theoretical pooling capacity [
8,
59].
In pooling-enabled low-repositioning scenarios (P-LF-LR vs. P-HF-LR), increasing fleet size from 0.03 to 0.036 results in only a 1% increase in VMT, 1.2% more kWh consumed per person, and a 9.5% increase in deadheading, with occupancy dropping modestly from 1.14 to 1.12 (still above one person per vehicle). In return, trips increase by 4.2%, wait time falls by 5.4%, and travel time decreases by 1.6%.
These results show that increasing fleet size generates far fewer negative feedbacks than increasing repositioning sensitivity, which undermines the initial hypothesis that repositioning alone can substitute for a larger fleet. It is worth noting that a 5% sensitivity means that at most, during peak hour, only 5% of idle vehicles will reposition—a conservative fraction compared to what occurs in real-world systems, where idle vehicles must find a parking stall, which is particularly difficult in dense urban areas [
6,
12].
The deadheading fractions reported across scenarios (40–75%) are consistent with empirical observations from real-world operations: Wenzel et al. [
8] documented a deadheading rate of approximately 49% in Austin, Texas; a multi-city study covering San Francisco, Los Angeles, and Washington, D.C. found that deadheading accounts for 28–59% of TNC VMT across the literature, with CPUC data for California estimating approximately 40% [
59]; and CPUC data on Waymo autonomous vehicles show a deadheading fraction of 44.3% as of September 2025, down from 51.5% in January 2024 [
60]. Taken together, these data confirm that substantial deadheading is an inherent operational feature of ride-hailing systems, not a modeling artifact specific to this simulation.
Repositioning and fleet sizing, therefore, interact through occupancy erosion and congestion feedbacks, with the inflection point at a sensitivity of 0.2 marking where repositioning costs outweigh coverage gains, and fleet expansion generating far smaller negative feedbacks than repositioning for the same service improvement.
3.2. The Pooling Dilemma
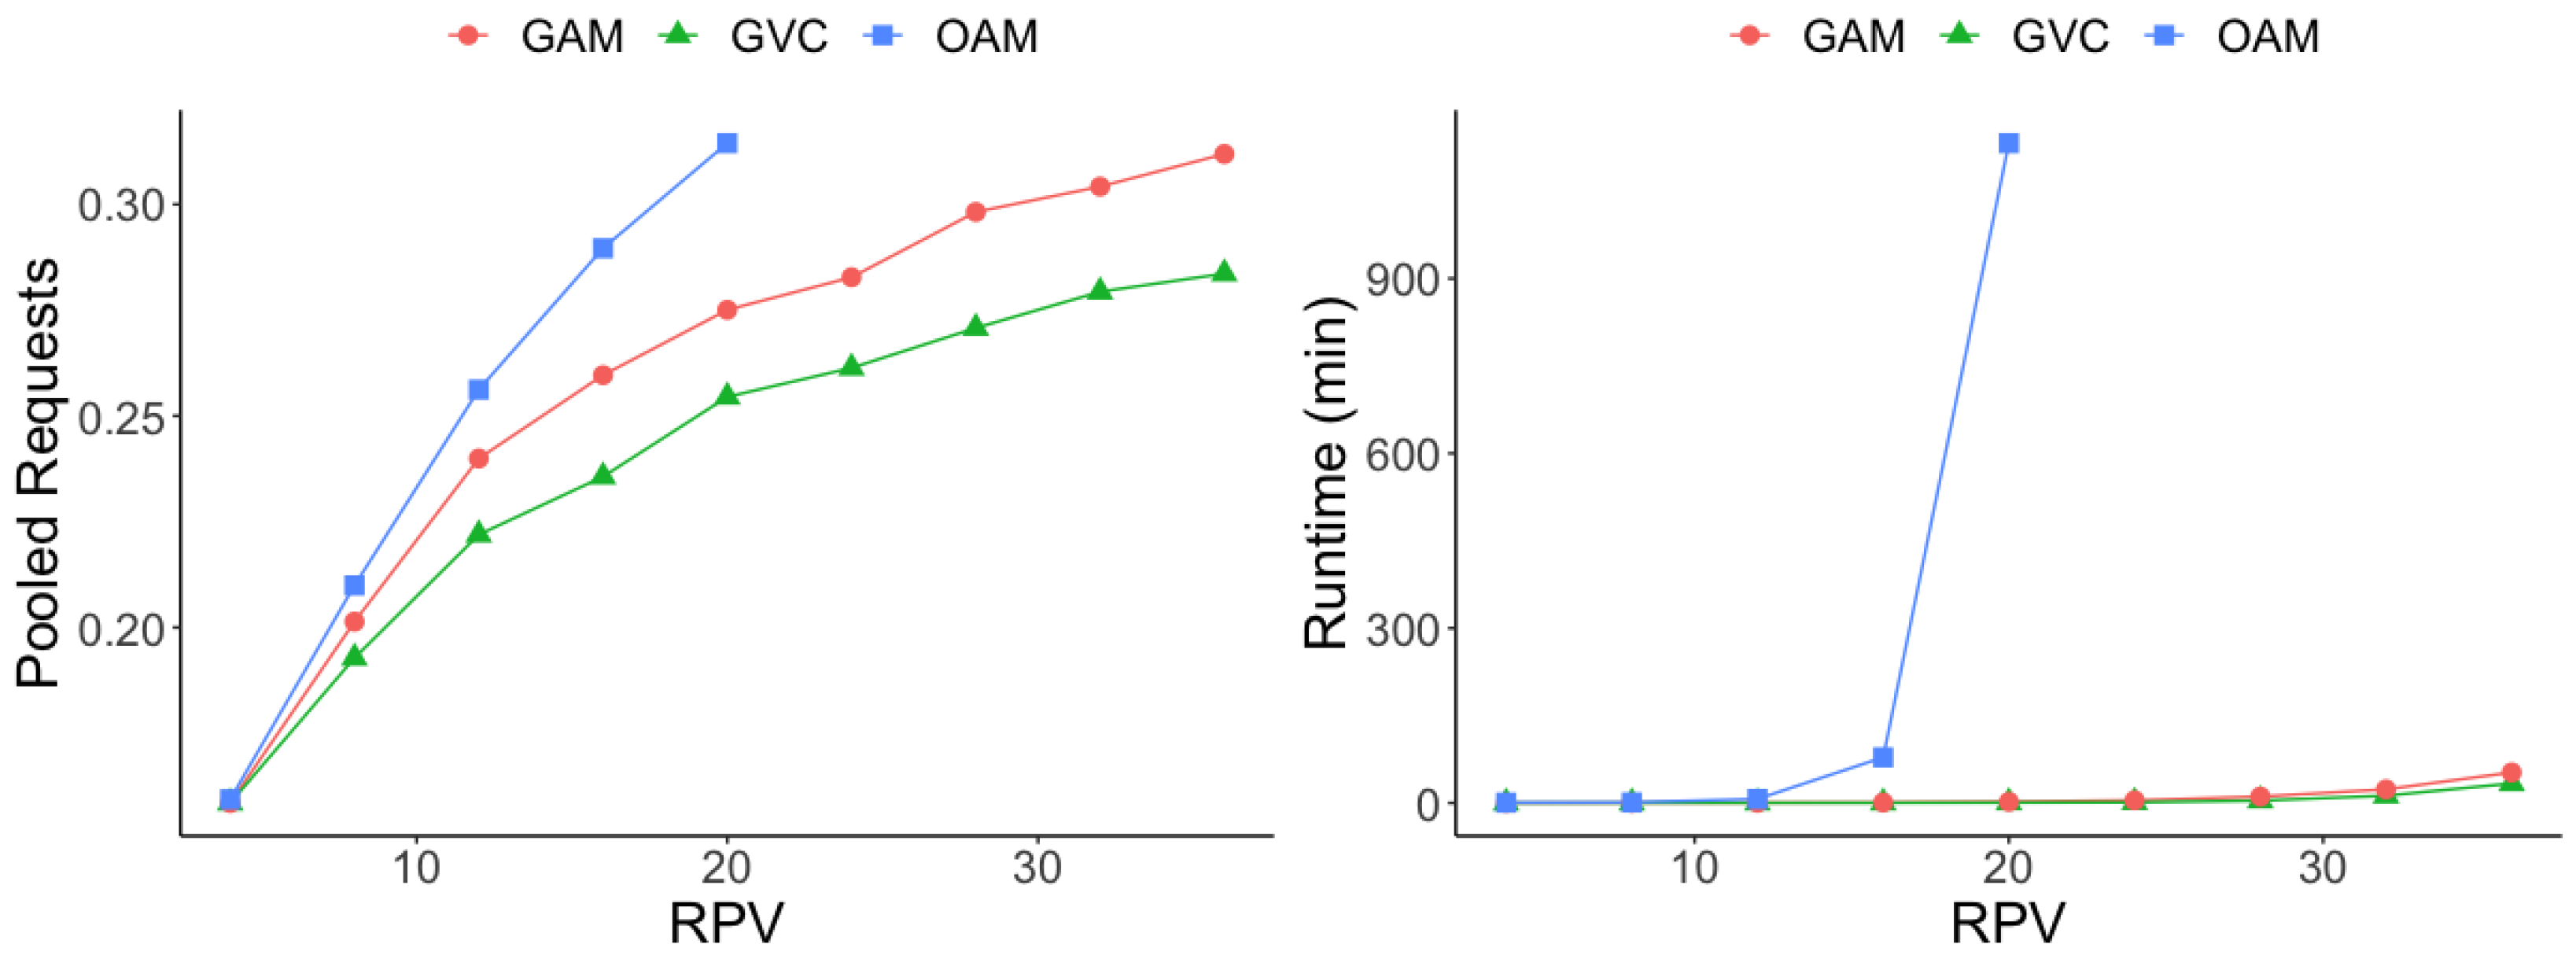
To understand the efficiency of each algorithm, we ran them on a scenario with high pooling opportunities: peak-hour commuting. From 8:00 to 8:05 am, we collected 1167 commuting mobility requests from the SFBay scenario, regardless of transportation mode, and ran each algorithm with varying values of RPV. The results are striking, as shown in
Figure 6. OAM escalates rapidly in runtime: at RPV = 20, it took more than 16 h to find the optimal solution, which precluded further testing at larger RPV values. This level of runtime is completely impractical, whether for research purposes or real-world ride-hailing operations.
There may be opportunities to reduce OAM runtime by partitioning the search space to enable distributed graph construction and parallel optimal assignment, potentially combined with large computing resources. If such efforts yield a reasonable real-time response at sufficiently high RPV, optimal assignment can, in certain cases, increase the share of pooled requests by up to 25% relative to GVC at the same RPV.
Comparing the default SFBay setup (GVC, RPV = 4) against all three algorithms at RPV = 20, the share of pooled requests rises substantially: to 61% for GVC, 74% for GAM, and 98% for OAM. This substantial jump is largely driven by the composition of the demand: commuting requests heading in the same direction are precisely the kind of demand typically served by transit [
14]. While the algorithm and RPV settings can play a significant role in increasing occupancy, the demand pattern itself may not be the most appropriate for point-to-point pooling, and where it is, it would be better served by a robust transit infrastructure.
The OAM–GVC gap observed here therefore represents an upper bound on algorithm-driven pooling gains. Under more spatially dispersed, mixed-purpose demand typical of full-day operations, the gap is expected to be smaller, as reflected in the full-scenario results in
Table 2. GVC, therefore, achieves comparable quality to OAM at a fraction of the runtime, making it the only computationally feasible algorithm for regional-scale simulation.
This is further illustrated in
Table 2, which shows metrics from the full SFBay scenario run with a fleet fraction of 0.03 and repositioning sensitivity of 0.2 across algorithm and RPV combinations (excluding OAM, which produces unreasonable runtime even at RPV = 4).
Figure 6 therefore illustrates OAM behavior in the controlled peak-hour sample, while
Table 2 summarizes feasible full-scenario configurations. Increasing RPV from 4 to 12 for GVC yields 2% more matched trips and 14% more pooled trips, raising occupancy by only 0.04, still below 1.
Comparing GVC with GAM, results are similar, with GAM performing slightly worse on total trips, pooled trips, and occupancy. This can be explained by GAM’s slightly higher average travel and wait times, which discourage customers from continuing to choose ride-hailing over successive iterations until network convergence.
Table 2 is read across each algorithm as RPV increases: compare Pool and Occ gains against WT/TT penalties and RT growth to identify feasible operating points. RT is matching runtime per simulation iteration, not full end-to-end scenario runtime.
The no-pooling reference row is included as an operational benchmark, not as an algorithm-comparison case. Relative to the default pooling case (GVC, RPV = 4), no pooling yields lower wait and travel times (WT: 6.85 vs. 7.35; TT: 17.09 vs. 20.21) because trips are direct, but it also yields lower occupancy (0.68 vs. 0.93) and lower total trips served (7.07 vs. 8.19), indicating faster individual service at the expense of system efficiency.
The same dynamic applies to OAM: its much higher average wait and travel times stem from the objective of matching as many requests as possible, since unmatched requests incur a large negative cost in the MIP formulation. This is another instance of the same negative feedback: seeking to maximize pooled and matched trips in point-to-point service increases detours and additional VMT, which raises average delays and, over successive iterations, pushes customers away from pooling and ride-hailing altogether. This trade-off between pooling efficiency and service quality has been documented in dynamic ride-sharing research [
36,
37].
The runtime increases from 44 min to 244 min for GVC (RPV 4 to 12, a 5.5× increase) and from 44 min to 422 min for GAM (RPV 4 to 8, 9.6×). These numbers make higher RPV values impractical for research use, since network relaxation requires multiple iterations and the feedback loop with other modules such as land use requires additional simulation runs. That said, we can attach an uncertainty band to our results based on the maximum occupancy achievable by GVC at a sufficiently large RPV.
One final consideration under this sensitivity analysis is the impact of maxWaitingTimeInSec and maxExcessRideTime. Applying stricter service constraints (GVC*) reduces runtime by 39%, but at the cost of a pooling share that drops to 0.39 and occupancy that falls to 0.85. The same pattern appears for GAM*: stricter constraints lower runtime (77 to 66 min) and wait/travel times (7.33/20.48 to 6.73/19.15), but also reduce pool share (0.46 to 0.39) and occupancy (0.93 to 0.85). Conversely, relaxing these parameters toward their upper limits would quickly produce impractical runtimes while also triggering the same negative feedback: larger tolerated detours increase point-to-point VMT and delay, and excessively long wait and travel times drive customers away from pooling entirely.
3.3. Impact of Population Sampling
The high resolution and large scale of the BEAM framework often require users to simulate only a fraction of the population through random sampling, particularly in contexts such as calibration or sensitivity analysis. In BEAM, the primary runtime bottleneck is not the physical simulation of the transportation network, but the behavioral simulation of agents, of which ride-hailing operations are among the most demanding. At the same time, the efficiency of on-demand modes like ride-hailing is highly sensitive to economies of scale and can vary significantly with sample size [
19,
33].
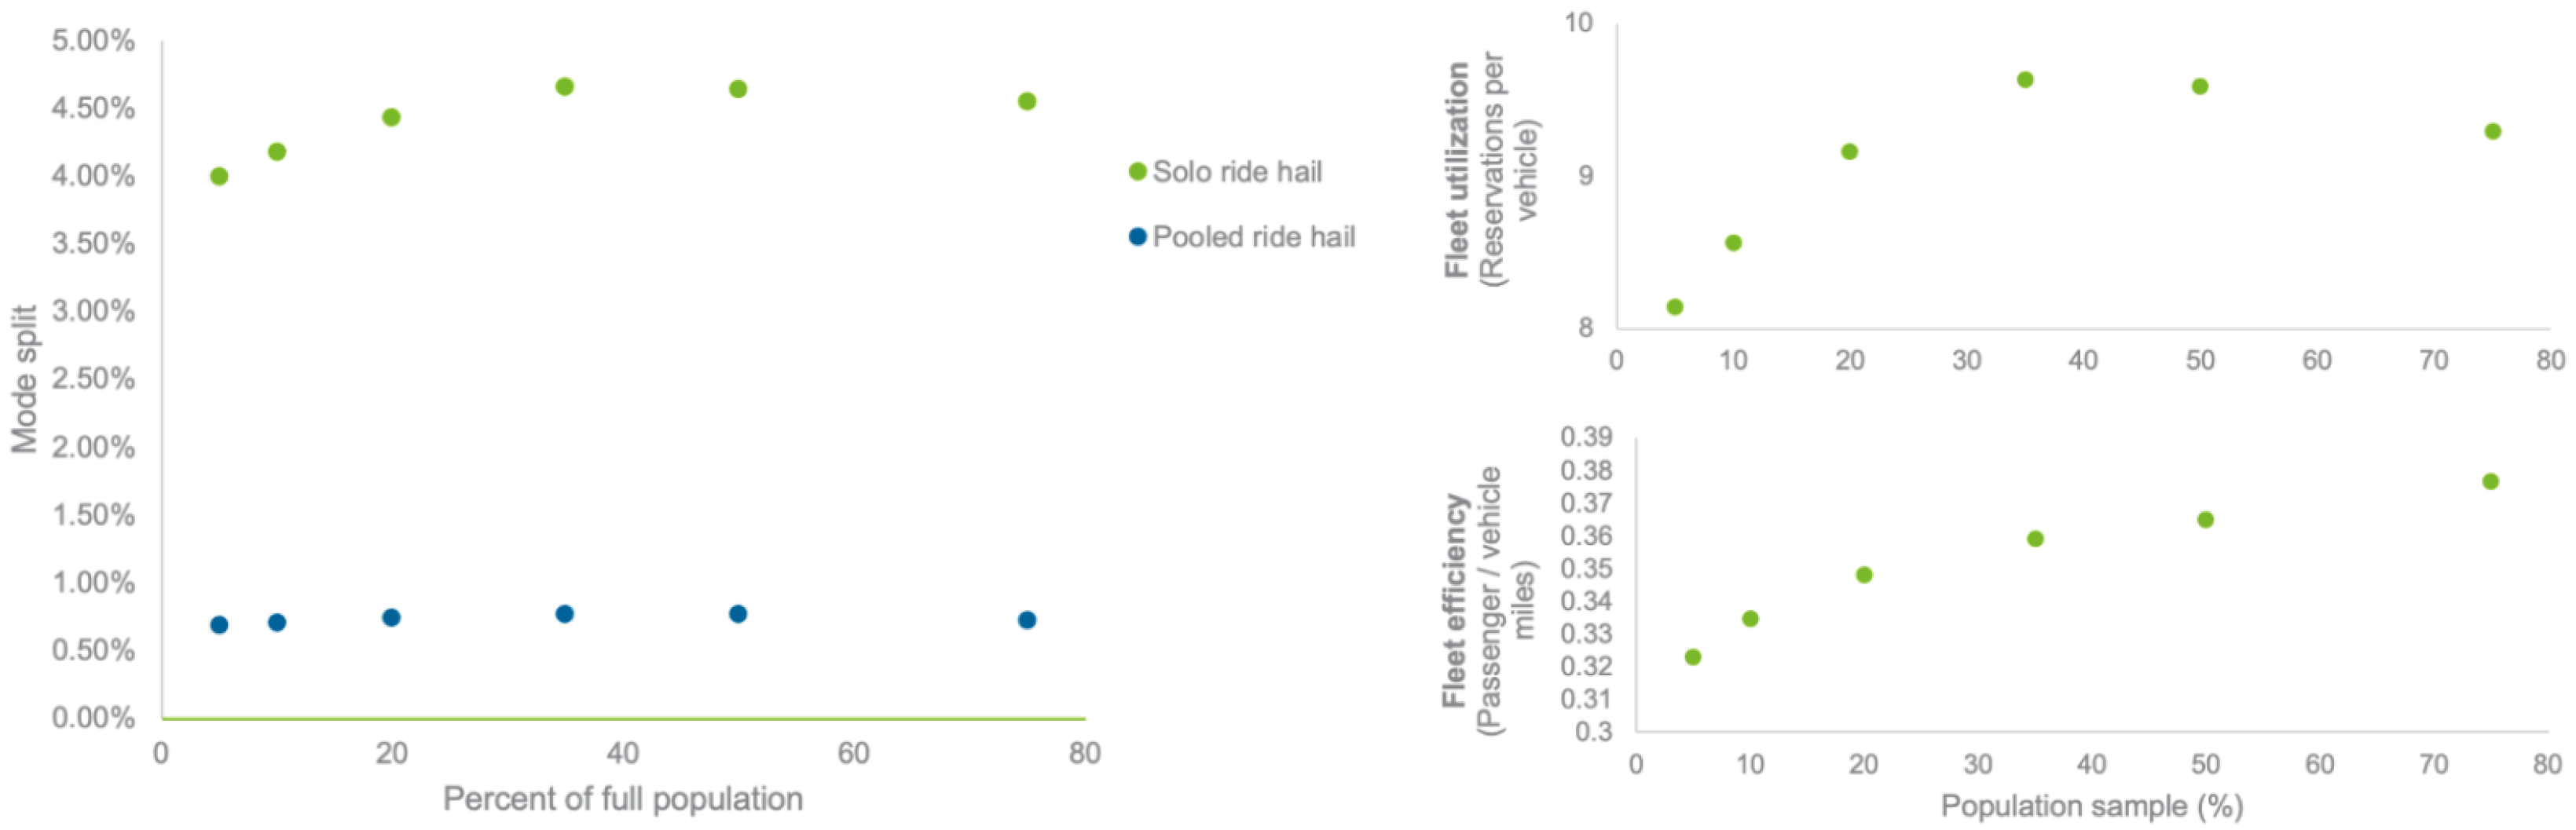
In
Figure 7, a separate sensitivity analysis shows that increasing the population sample size improves ride-hailing efficiency in terms of passengers per vehicle mile and fleet utilization (requests per vehicle), leading to higher ride-hailing mode share. The 40% threshold is identified empirically: both the passengers-per-vehicle-mile and fleet utilization curves rise steeply from 10% to 40% sample size, then flatten noticeably, with marginal gains between 40% and higher sample sizes falling well within the noise of the simulation.
This pattern is consistent across the two key indicators shown in
Figure 7, which capture distinct dimensions of system efficiency. Passengers per vehicle mile measures how effectively the fleet converts vehicle travel into productive passenger carriage, with higher values indicating less deadheading and better pooling; fleet utilization measures how frequently vehicles are matched to requests relative to their total available time, reflecting the adequacy of supply relative to demand. The convergence of both indicators at 40% provides evidence from complementary perspectives that the threshold is robust and not an artifact of any single metric.
Beyond 40%, the analytical benefit is limited while runtime increases substantially, since ride-hailing matching and behavioral iteration are the primary bottlenecks. Random seed variability was not explicitly tested across multiple seeds at each sample size, which represents a limitation; however, the smooth and consistent convergence pattern across the full range of sample sizes from 10% to 100% suggests that the result is not an artifact of a specific random draw. Importantly, given the near-linear relationship between ride-hailing efficiency and sample size below the convergence threshold, the ordering and direction of effects observed in the repositioning and pooling sensitivity analyses remain valid across sample sizes, even if absolute magnitudes scale with sample size.
It should also be noted that the 40% threshold pertains to the stability and direction of change of internal ride-hailing operational dynamics, and is therefore separate from the validity of the calibrated model parameters; the latter are calibrated against system-level observed metrics such as VMT, network speeds, and mode split, which are not sensitive to ride-hailing fleet-scale dynamics and remain valid regardless of the population sample size used in the sensitivity analysis.
3.4. Policy Implications and Limitations
Taken together, the three analyses paint a consistent picture: ride-hailing pooling improves system efficiency relative to no pooling, but its gains are bounded by interlocking negative feedbacks from repositioning overhead, algorithm design constraints, and demand-scale dynamics. Effective pooling therefore requires conservative repositioning, appropriate fleet sizing, and maintaining the right balance between pooled trip share and deadheading. Pushed beyond these thresholds, pooling actively degrades system performance rather than improving it.
Real-world evidence reinforces this picture: systematic reviews document actual pooling rates of only 6–7% across major platforms [
7], far below what algorithms can achieve under favorable demand conditions; analysis of Uber and Lyft data across five major U.S. cities attributes this gap to persistent rider preference for solo travel driven by concerns about circuitous routes, longer travel times, and privacy [
10], suggesting that behavioral constraints suppress pooling well before algorithmic limits are reached. This points to a complementary rather than central role for ride-hailing, most effectively serving as a first- and last-mile connector to high-capacity transit, filling late-night service gaps, and providing access in areas where transit is sparse [
10].
Sharing is therefore best understood as a systemic challenge rather than a feature of any single mode. The results of this study suggest that transit and microtransit may be better positioned to anchor shared mobility: by design, fixed-route services eliminate the need for repositioning and generate negligible empty VMT per passenger, structural advantages that point-to-point ride-hailing inherently cannot replicate [
14]. Prior work confirms that high-frequency transit achieves vehicle occupancies and per-passenger energy intensities substantially lower than ride-hailing [
7,
13], a direct consequence of the structural advantages this study’s negative feedbacks make explicit: repositioning overhead and deadheading are absent in transit by design.
Embedding ride-hailing as a constructive actor within the broader urban mobility ecosystem, one that interacts with transit, infrastructure, traveler behavior, and network conditions, requires collaboration between TNC operators and public actors. Operators control the operational levers explored in this study, specifically repositioning sensitivity, fleet sizing, and pooling parameters, and are best positioned to tune these for service quality and business viability.
Cities and states, in turn, manage the infrastructure and regulatory environment. Investment in transit, including dedicated bus lanes, signal priority, and high-frequency service, makes transit a genuinely competitive alternative and reduces the demand pressure that drives deadheading, a concern made more urgent by empirical evidence that 37–50% of ride-hailing trips substitute for transit [
5,
7]. Complementary measures, such as curb management to reserve dedicated pick-up and drop-off zones near transit stops [
10,
61], spatial coordination to identify high-demand transfer locations [
62], and integrated fare systems, make the ride-hailing-to-transit connection seamless in practice.
A productive collaboration between the two would allow operators to build sustainable business models while enabling cities and states to achieve a more efficient, lower-VMT regional transportation system with higher passenger miles traveled (PMT).
Several limitations of this study should be considered when interpreting these findings. First, the analysis has been applied only to the San Francisco Bay Area under a projected high ride-hailing adoption rate, a polycentric, large-footprint metropolitan region with an established multimodal transit network. These dynamics are expected to be most pronounced in low-to-medium density contexts where demand is spatially dispersed, increasing deadheading distances, and may be weaker in compact, high-density cities where demand is more concentrated and wait times shorter [
5,
7]. Conversely, regions with weaker transit systems may show larger induced demand effects from ride-hailing and stronger mode substitution away from transit [
5]. Importantly, these geographic differences are expected to affect the magnitude of the effects rather than their direction: inflection points in repositioning sensitivity and pooling efficiency are likely to shift across contexts, but the underlying negative feedbacks should persist.
Second, the study assumes a single-operator ride-hailing market with no surge pricing and a fixed fleet composition, whereas real markets involve competing operators, dynamic pricing, and heterogeneous vehicle types. Competing fleets operating independently fragment the supply pool, forcing each operator to dispatch from a restricted set of available vehicles rather than the globally nearest one, which inherently lengthens pickup distances and adds deadheading to the network [
63,
64]. Dynamic pricing in high-demand areas could further amplify repositioning sensitivity by simultaneously directing multiple vehicles toward the same surge zones: empirical evidence shows that drivers relocate toward high-surge areas and remain online longer when multipliers rise [
54], and that multiple drivers simultaneously flood the same zones in a competition effect that can erode individual earnings while congesting supply [
65].
Finally, the fare parameters and pooling disutility estimates are derived from 2018–2022 Chicago trip data and may not fully reflect traveler preferences in other markets.
4. Conclusions
This study reveals a counterintuitive system-level result: the more stringently point-to-point pooling is promoted, the more detour burdens erode matching feasibility and drive vehicle occupancy down rather than up. This finding, produced through large-scale agent-based simulation of a high ride-hailing-adoption scenario for the San Francisco Bay Area, clarifies why pooled ride-hailing has consistently fallen short of theoretical expectations.
The primary driver of VMT and energy consumption in the ride-hailing system is the operational design of the fleet itself, particularly the interplay between repositioning, pooling, and fleet sizing. Crucially, pushing pooling harder does not resolve this: as pooling requirements tighten, increased detours reduce the feasibility of matching additional customers, and more travelers abandon pooled trips due to longer ride times, resulting in lower vehicle occupancy than with lighter pooling requirements. Without pooling, ride-hailing shows higher total VMT and per-capita energy use due to increased deadheading, while serving fewer passenger miles and trips. In pooling-enabled operations, efficiency gains remain limited by multiple interacting negative feedbacks: repositioning directly adds empty VMT and makes supply allocation more volatile; vehicles redirected toward high-demand zones may be matched en route in intermediate zones, reducing effective supply where pooling opportunities are highest; and relaxing wait-time and excess-ride-time constraints to maximize pooling increases detours while discouraging customers from choosing pooled trips altogether.
Effective shared mobility therefore requires treating pooling, repositioning, and fleet sizing as interdependent levers. Transit holds structural advantages in serving high-demand corridors, while ride-hailing is best positioned as a dynamic, demand-responsive complement, filling first- and last-mile gaps that fixed-route services cannot efficiently address.