1. Introduction
1.1. Research Background and Existing Problems
The concept of Smart Tourism has evolved in recent decades from a niche technological trend into a fundamental element of development strategies [
1] for sustainable cities and regions [
2]. In the literature, it is defined as an integrated ecosystem combining Information and Communication Technologies (ICTs) with physical tourism infrastructure [
3,
4], aimed at enhancing traveler experiences, increasing destination management efficiency, and promoting sustainable development [
4,
5,
6]. Contemporary approaches to Smart Cities increasingly incorporate tourism into Sustainable Urban Mobility Plans (SUMP) [
7], aiming to shift transport habits through smart traffic control, Park-&-Ride systems, or the full digitization of ticketing services [
8,
9]. Dynamic passenger information systems, providing real-time data, have become standard in urbanized areas, facilitating multimodal travel [
10,
11]. However, this paradigm cannot be limited solely to the city’s administrative boundaries. In line with the “Smart Region” concept, a smart city must assume responsibility for the mobility of its residents also within functional zones, including recreational areas to which these residents travel [
12,
13,
14].
Therefore, ensuring so-called “Seamless Mobility” becomes a key challenge [
15,
16]. A resident of a smart city, utilizing accessible low-floor rolling stock daily, should not lose their autonomy the moment they leave the agglomeration [
17,
18]. Despite dynamic technological progress, inclusivity remains a significant and often overlooked aspect within the Smart Tourism paradigm, particularly regarding people with disabilities [
19,
20,
21].
The general background of this research is bridging this gap. While urban environments have seen significant accessibility improvements, protected mountain areas remain largely inaccessible to tourists with mobility disabilities. To systematically address this, it is necessary to identify and solve three highly specific, interrelated problems:
Problem 1: Severe Spatial Exclusion in Natural Terrain. Tourists using assistive mobility devices are practically confined to paved, urbanized zones. Natural areas lack designated, verified off-road routes and the necessary supportive infrastructure (such as rental hubs for specialized off-road equipment), completely depriving disabled individuals of the ability to explore wilderness independently.
Problem 2: The Mathematical Defect of Conventional Mapping. Standard tourist maps and conventional geoinformatics models calculate terrain difficulty based on the average slope of long trail sections. This approach is fundamentally flawed for accessibility planning because it mathematically hides critical micro-barriers such as short, sudden steep ascents, deep ruts, or erosional gaps.
Problem 3: The Strict Physical Limits of Off-Road Wheelchairs. Unlike a walking tourist who can step over an obstacle, heavy, electric Specialized Off-Road Wheelchairs have strict mechanical constraints (e.g., a maximum safe tilt angle of 25%). Encountering just one hidden micro-barrier practically traps the user, causing wheel slip or vehicle instability, and making the entire route impassable regardless of its otherwise-safe average characteristics.
1.2. Mainstream Solutions and Defects
Mainstream solutions for accessibility and smart mobility predominantly focus on urban and built environments. They typically assess paved infrastructure, public transport nodes, and architectural barriers (e.g., dropped curbs and building ramps). While these models successfully allow wheelchair users to navigate through smart cities, their primary defect is that they cannot be directly transferred to off-road contexts. They assume there is a uniform surface and entirely ignore the physical limits of specialized off-road equipment.
Tourists with mobility disabilities are deprived of reliable spatial off-road information [
22,
23,
24]. In practice, this means the accessibility chain ends at the “last stop” or parking lot [
25,
26]. In this article, we propose that the subsequent part of the journey in the natural environment should be treated as a specific form of the “Last Mile” problem, namely, the “Wilderness Last Mile”. Currently, standard GIS models applied to tourism attempt to solve this by using low-resolution elevation data, which masks localized steep ascents. Therefore, current analytical methods are dangerously misleading for planning accessible off-road tourism and fail to extend the Smart City digital ecosystem into the natural environment.
1.3. Proposed Methods, Innovations, and Advantages
To address these critical defects, this study proposes a novel four-stage GIS-based spatial decision support model specifically tailored for electric Specialized Off-Road Wheelchairs. Rather than a simple routing algorithm, the proposed model is a comprehensive analytical framework characterized by four specific operational stages: (1) graph-based trail network topologization; (2) traction safety verification utilizing high-resolution 1 × 1 m Digital Elevation Model (DEM) micro-segmentation; (3) multi-criterion evaluation calculating user-calibrated indices (Difficulty Index-EDI, and Tourism Quality Index-TQI); and (4) a hub-location optimization algorithm.
The main advantage of this high-resolution approach is its ability to computationally detect and isolate hidden micro-barriers (short steep ascents) that standard average-slope methods miss. By doing so, the model directly solves the core problem of spatial exclusion in natural terrains: it successfully transforms raw, unstructured topographic data into a strictly verified, safe tourism product and mathematically identifies the optimal location for inclusive rental infrastructure.
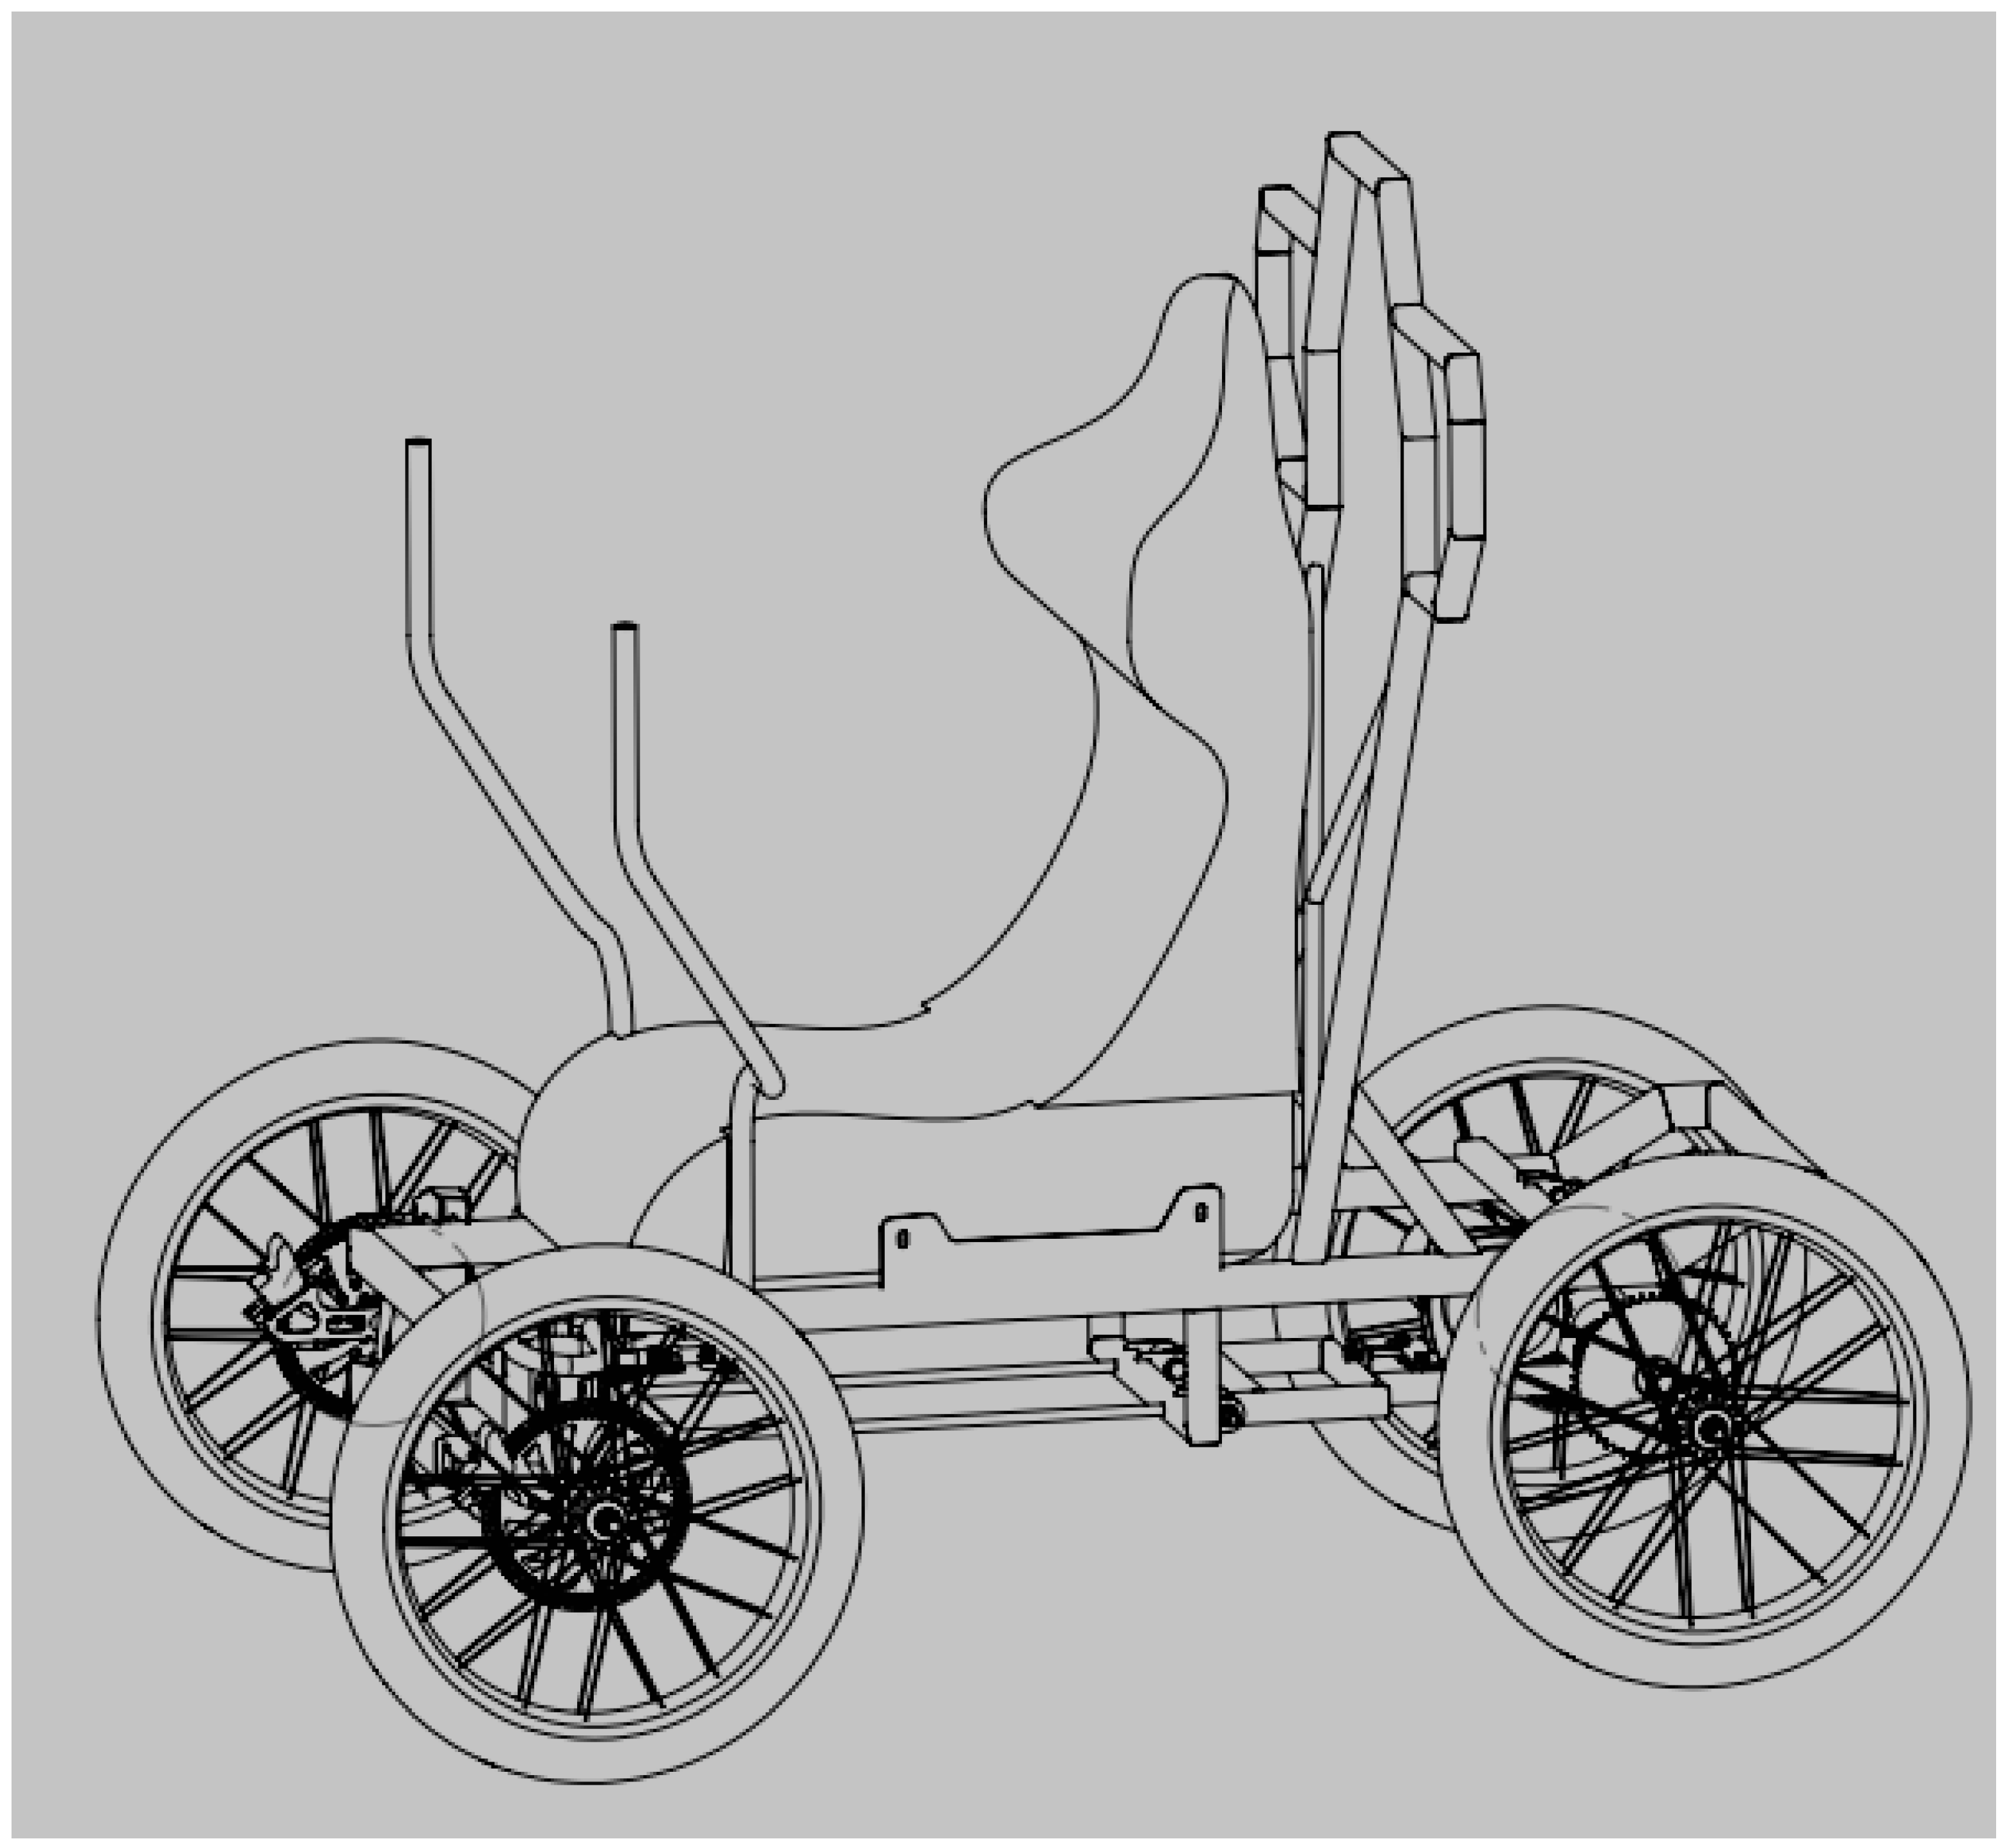
The empirical boundary conditions feeding this spatial model were derived from the prototype of a specialized electric off-road wheelchair developed in the “Mountains without Barriers” (Góry bez barier) project (
Figure 1). While the broader IT and social objectives of that project are outside the scope of this spatial study, the physical characteristics of this specific vehicle are fundamental to the proposed GIS model. As shown in
Figure 1, unlike standard manual wheelchairs, this device is a heavy, four-wheeled off-road vehicle with a specific footprint (1550 mm length, 1000 mm width) and a 1000 W rear-wheel drive system.
Visualizing the vehicle is crucial to understanding the spatial problem: its specific wheelbase, center of gravity, and traction mechanics dictate a maximum safe hill-climbing ability of 25%. These precise technical parameters, specifically the 1000 mm track width and the strict 25% incline, constitute the absolute algorithmic constraints for our micro-segmentation model. Any trail micro-segment exceeding this threshold poses an unacceptable rollover or slip risk and is strictly eliminated by the model from the accessible network.
Finally, it should be emphasized that although the empirical Case Study is based on the parameters of this specific prototype, the applied algorithmic approach is fully reproducible and universal. The method allows for the automatic analysis of thousands of kilometers of paths. Because the developed algorithm is parameterizable, introducing new input data (e.g., for a wheelchair with a different track width or motor power) allows the model to automatically generate a new accessibility graph and route recommendations. Consequently, this solution is scalable and adaptable to various types of micromobility vehicles in tourism.
1.4. Main Structure, Work, and Contribution
The main objective of this article is to present a novel GIS-based methodology for planning accessible mountain tourism. This method performs two key tasks:
From the end-user perspective (User-centric): It allows for the generation of ready-made excursion routes, categorized by the Difficulty Index (EDI)—understood as the psychophysical burden resulting from terrain configuration—and the Tourism Quality Index (TQI). Consequently, the user receives information not only on “whether they can pass,” but also “how comfortable and attractive the trip will be.”
From the land manager perspective (Decision-maker): It enables the optimization of base station locations (rental hubs) for Specialized Off-Road Wheelchairs. The algorithm indicates locations (integrated with public transport and parking facilities) that offer access to the most diverse and attractive routes, maximizing investment efficiency.
Consequently, the article addresses three research questions:
How can we transform a generally accessible trail network into a topological graph enabling off-road accessibility assessment at the micro-segment level?
How can we define a difficulty index linked to traction limitations and the user’s psychophysical comfort?
How can we combine accessibility assessment with tourism valuation to generate ready-made route scenarios and support location decisions (hub location)?
The developed solution represents a paradigm shift in mountain tourism—moving from viewing mountains as an environment accessible only to fully able-bodied individuals to an inclusive space managed in a data-driven manner, where technology bridges physical and psychological barriers. In planning terms, the method aligns with the principles of Universal Design and social inclusion policies, extending the logic of accessibility beyond urbanized areas. Simultaneously, it complements Smart Tourism tools with a “route productization” component, i.e., the automatic generation of structured tourism products adapted to mobility limitations.
Implementing the presented solution will increase accessibility of tourism in non-urban areas for people with special needs, including those with individual needs resulting from limited fitness. This represents a shift in the approach to mountain tourism from a field intended solely for fully able-bodied people to one that requires additional support to be realized. By using innovative technical solutions, including travel planning and navigation systems, as well as monitoring and predicting the operational parameters of devices supporting mountain tourism, it is possible to improve the independent mobility of people with special needs. In practice, this translates to limiting decision-making uncertainty (whether the route contains critical edges), reducing risk (technical and health-related), and increasing the predictability of the tourist experience through transparent route classification according to EDI and TQI.
The primary contribution of this work is bridging the gap between urban transport networks and nature tourism by providing a precise, scalable tool for implementing Universal Design in protected mountain areas. The main work involved conducting a spatial analysis of the Bieszczady Mountains trail network, demonstrating the elimination of unsafe routes and optimizing the location of a rental hub to maximize accessible route diversity. The remainder of this paper is structured as follows:
Section 2 reviews the relevant literature.
Section 3 details the proposed four-stage GIS methodology and mathematical indices.
Section 4 presents the experimental results of the case study.
Section 5 discusses the broader implications, external validity, and limitations of the findings, and
Section 6 provides the final conclusions.
The scientific contributions of this study are framed within three core innovations: (1) a theoretical one, namely, introducing the concept of the ‘Wilderness Last Mile’ to bridge the gap between urban smart mobility and remote natural areas; (2) a methodological one, namely, developing a high-resolution (1 × 1 m) micro-segmentation graph-based approach for safety verification; and (3) and a practical one, namely, providing a data-driven tool for the optimal placement of inclusive infrastructure. By extending the Smart City paradigm into natural landscapes, this research addresses the critical challenge of universal accessibility in unstructured environments.
3. Method
To address the identified research problem, this study proposes a comprehensive, logical four-stage GIS-based methodology. The primary goal of this method is to systematically transform raw, unstructured geographic data into a verified, safe tourism product, culminating in the optimal location of a rental hub. The research workflow is strictly sequential: the output of each stage serves as the absolute input constraint for the next.
Specifically, the specific research steps are logically structured as follows:
1. Network Topologization: Converting continuous geographic paths into a discrete, computable topological graph.
2. Safety Verification (Micro-segmentation): Utilizing high-resolution DEM to mathematically eliminate edges that exceed the wheelchair’s physical traction limits.
3. Multi-criteria Evaluation: Assessing the remaining safe network using indices for psychophysical difficulty (EDI) and tourism quality (TQI).
4. Hub-Location Optimization: Applying a diversity maximization algorithm to pinpoint the optimal rental infrastructure location.
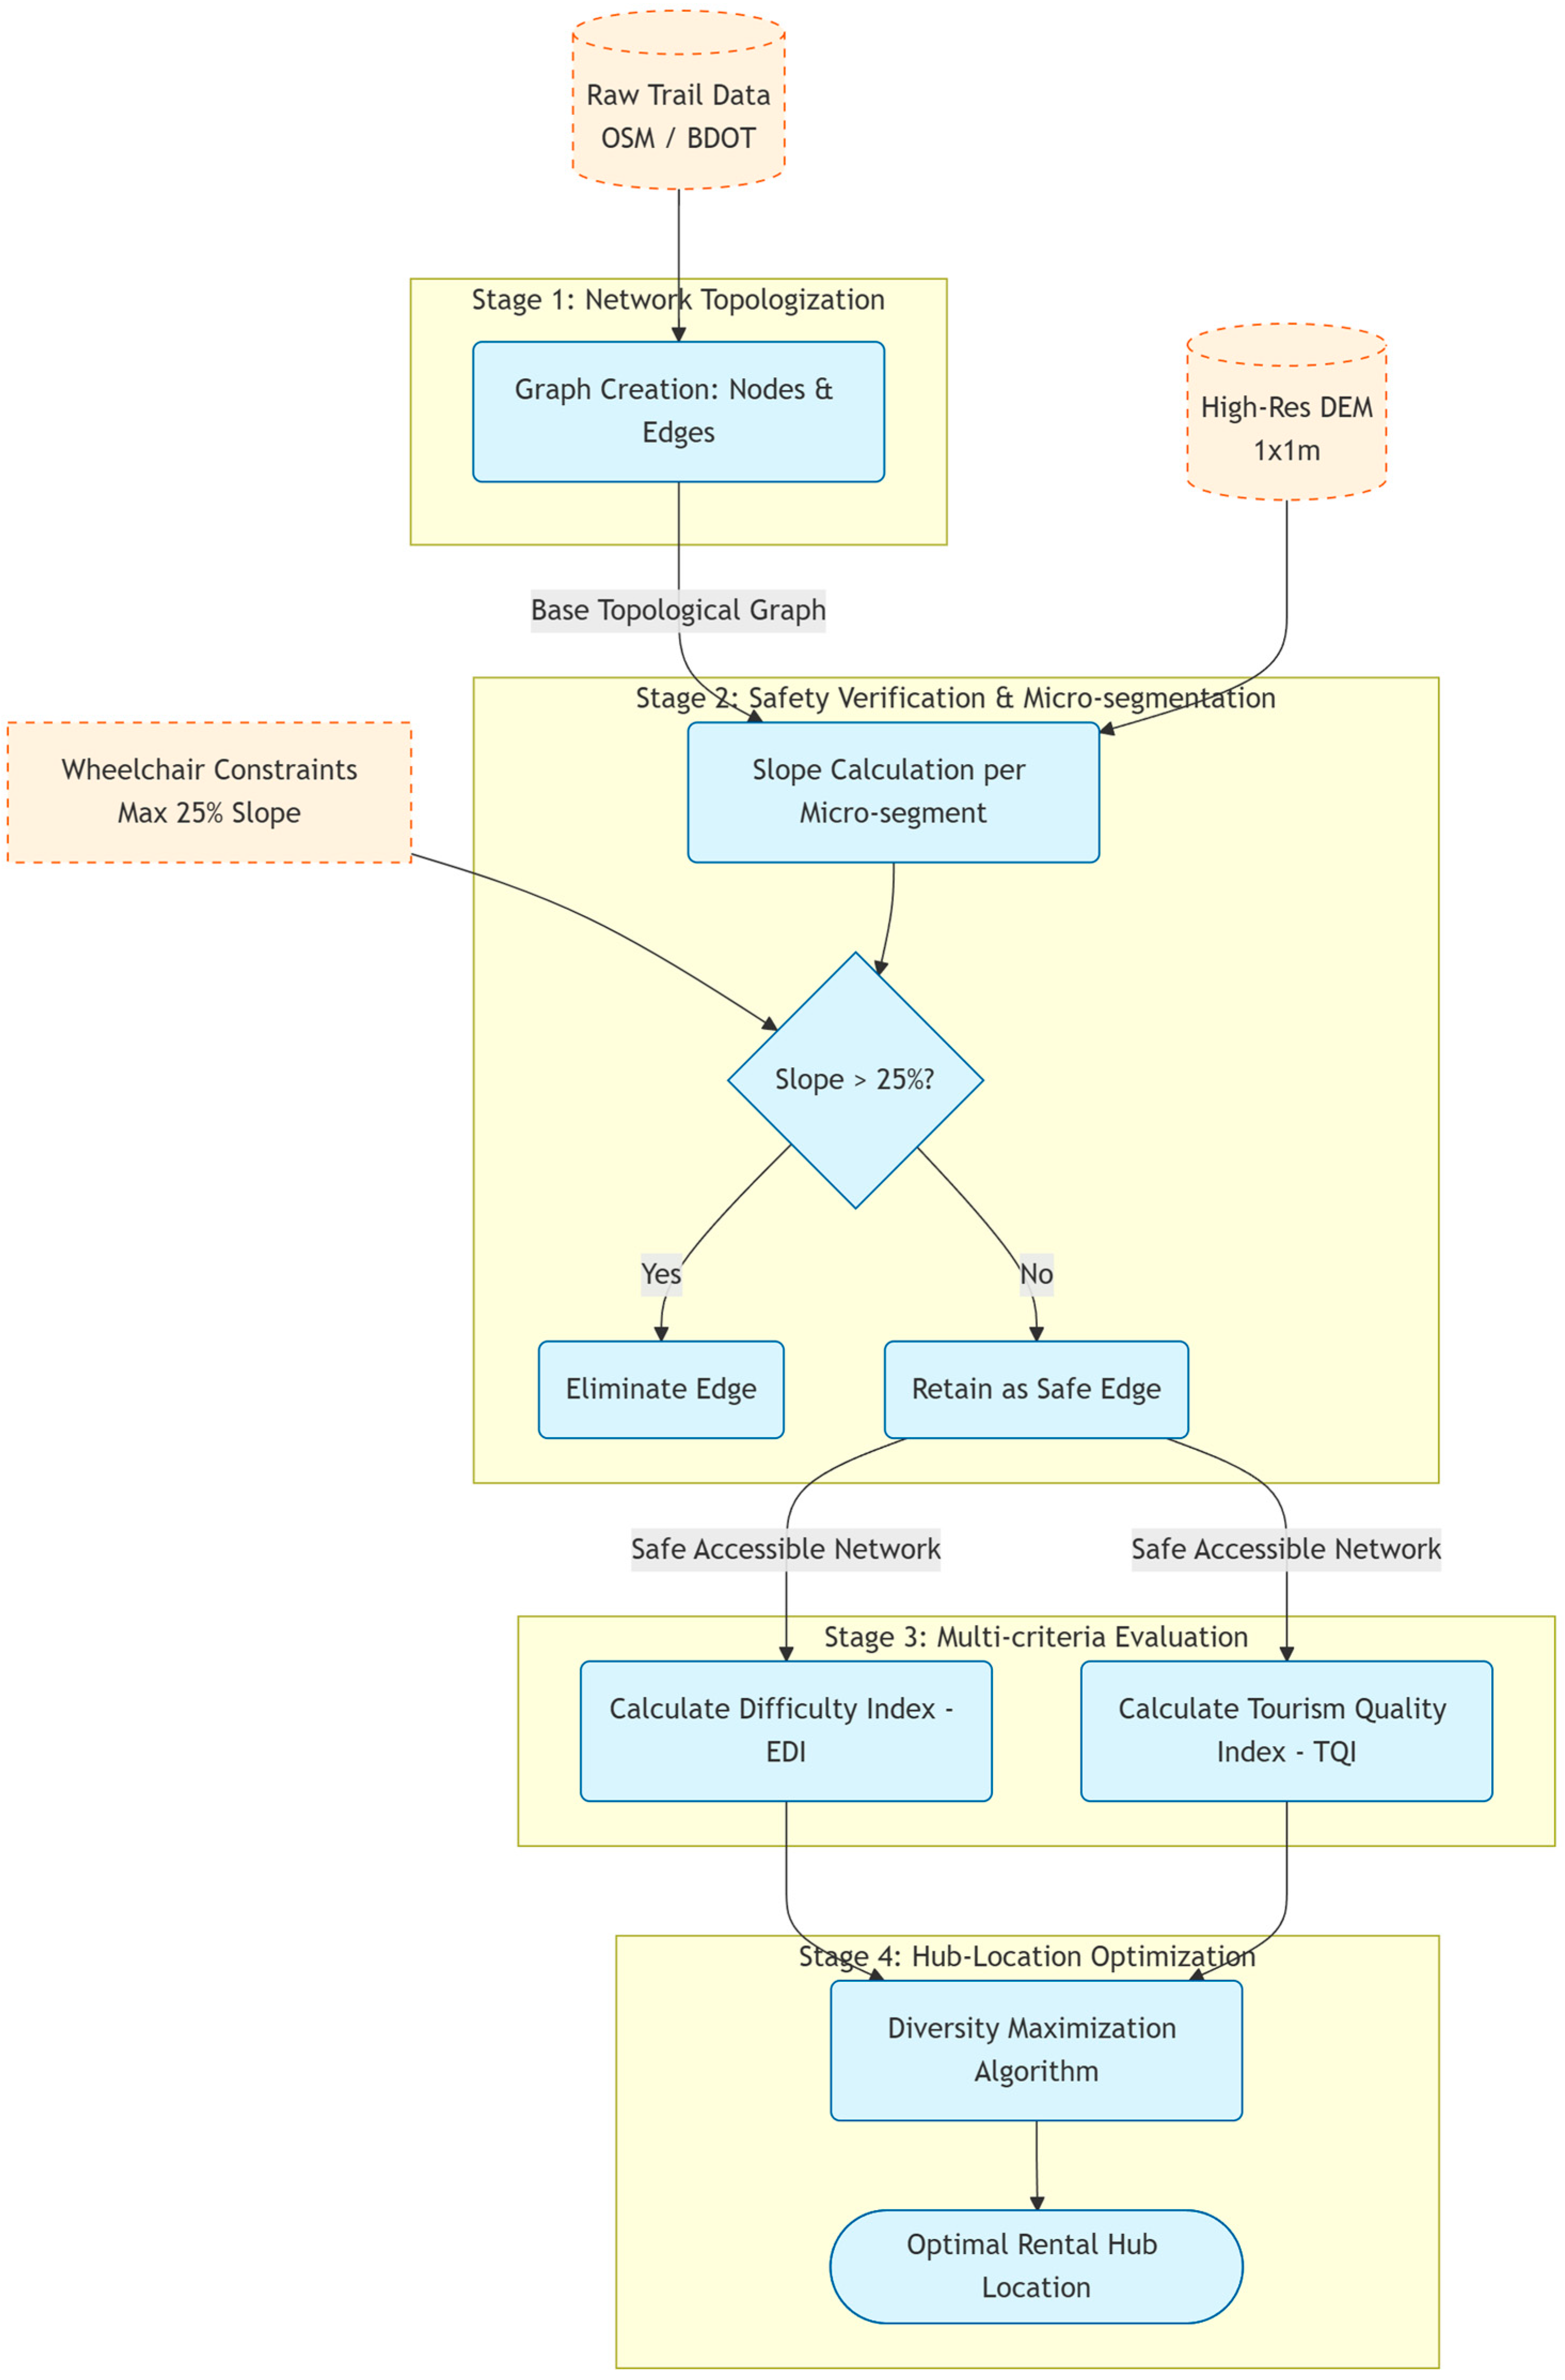
To provide a clear and structured overview of the research approach,
Table 2 summarizes the four main operational stages of the proposed methodology, detailing the specific inputs, analytical processes, and outputs for each phase. The logical workflow between these stages is further illustrated in the flowchart (
Figure 2).
It is crucial to emphasize that the technical parameters and the theoretical assumptions of the Difficulty Index (EDI) and Tourism Quality Index (TQI) were empirically developed and validated during the “Mountains without Barriers” project. Extensive field trials were conducted with the active participation of individuals with various mobility disabilities. The qualitative and quantitative feedback regarding their perceived psychophysical burden, sense of safety, and overall comfort during off-road trips was directly utilized to formulate and calibrate the proposed indices.
The entire process was realized in the GIS environment using a metric coordinate system (projected CRS) to ensure calculation correctness. To ensure the analysis is replicable, key input values were explicitly parameterized. The developed analytical model was integrated into the QGIS environment 3.40 [
63] (Graphical Model Center), allowing for full automation of the valuation process for any geographic area. The script automatically performs iterative topology cleaning, node extraction, and spatial attribute joining (Spatial Join) with POI layers.
The applied method fits into the Big Data paradigm in transport planning. For example, for a network of x kilometers, the system generates analytical records. Such high data granularity allows the identification of micro-difficulties (e.g., a rapid slope increase at a 10-m edge), which in standard macroscopic models are averaged out and omitted.
3.1. Graph Definition
The specific goal of this first analytical stage is to translate unstructured geographical space into a computable mathematical framework. Its function within the overall model is to break down continuous tourist trails into discrete, independent edges and nodes. This logical abstraction is a prerequisite for the subsequent spatial analysis, as it allows the algorithm to evaluate the physical safety parameters of specific short trail segments individually, rather than erroneously averaging them over the entire route.
Standard spatial data repositories (e.g., OpenStreetMap [
64]) represent tourist trails as long polyline sequences, preventing precise segmentation regarding accessibility. To conduct the analysis, raw vector data were topologized. For instance, a trail may have a single edge that extends across an entire mountain range. Trails marked in a geolocated form for project needs cannot exist in such a form. The proposed method involves constructing a proprietary graph between the nearest nodal points and accounting for branching.
Raw vector data (polylines) must be transformed into a directed network graph , reflecting the actual trail topology.
A set of nodes , was defined, where each node represents
A set of edges was defined, where each edge constitutes a trail edge connecting two adjacent nodes. Such decomposition allows for assigning unique attributes (slope, surface, attractiveness) to each network fragment independently.
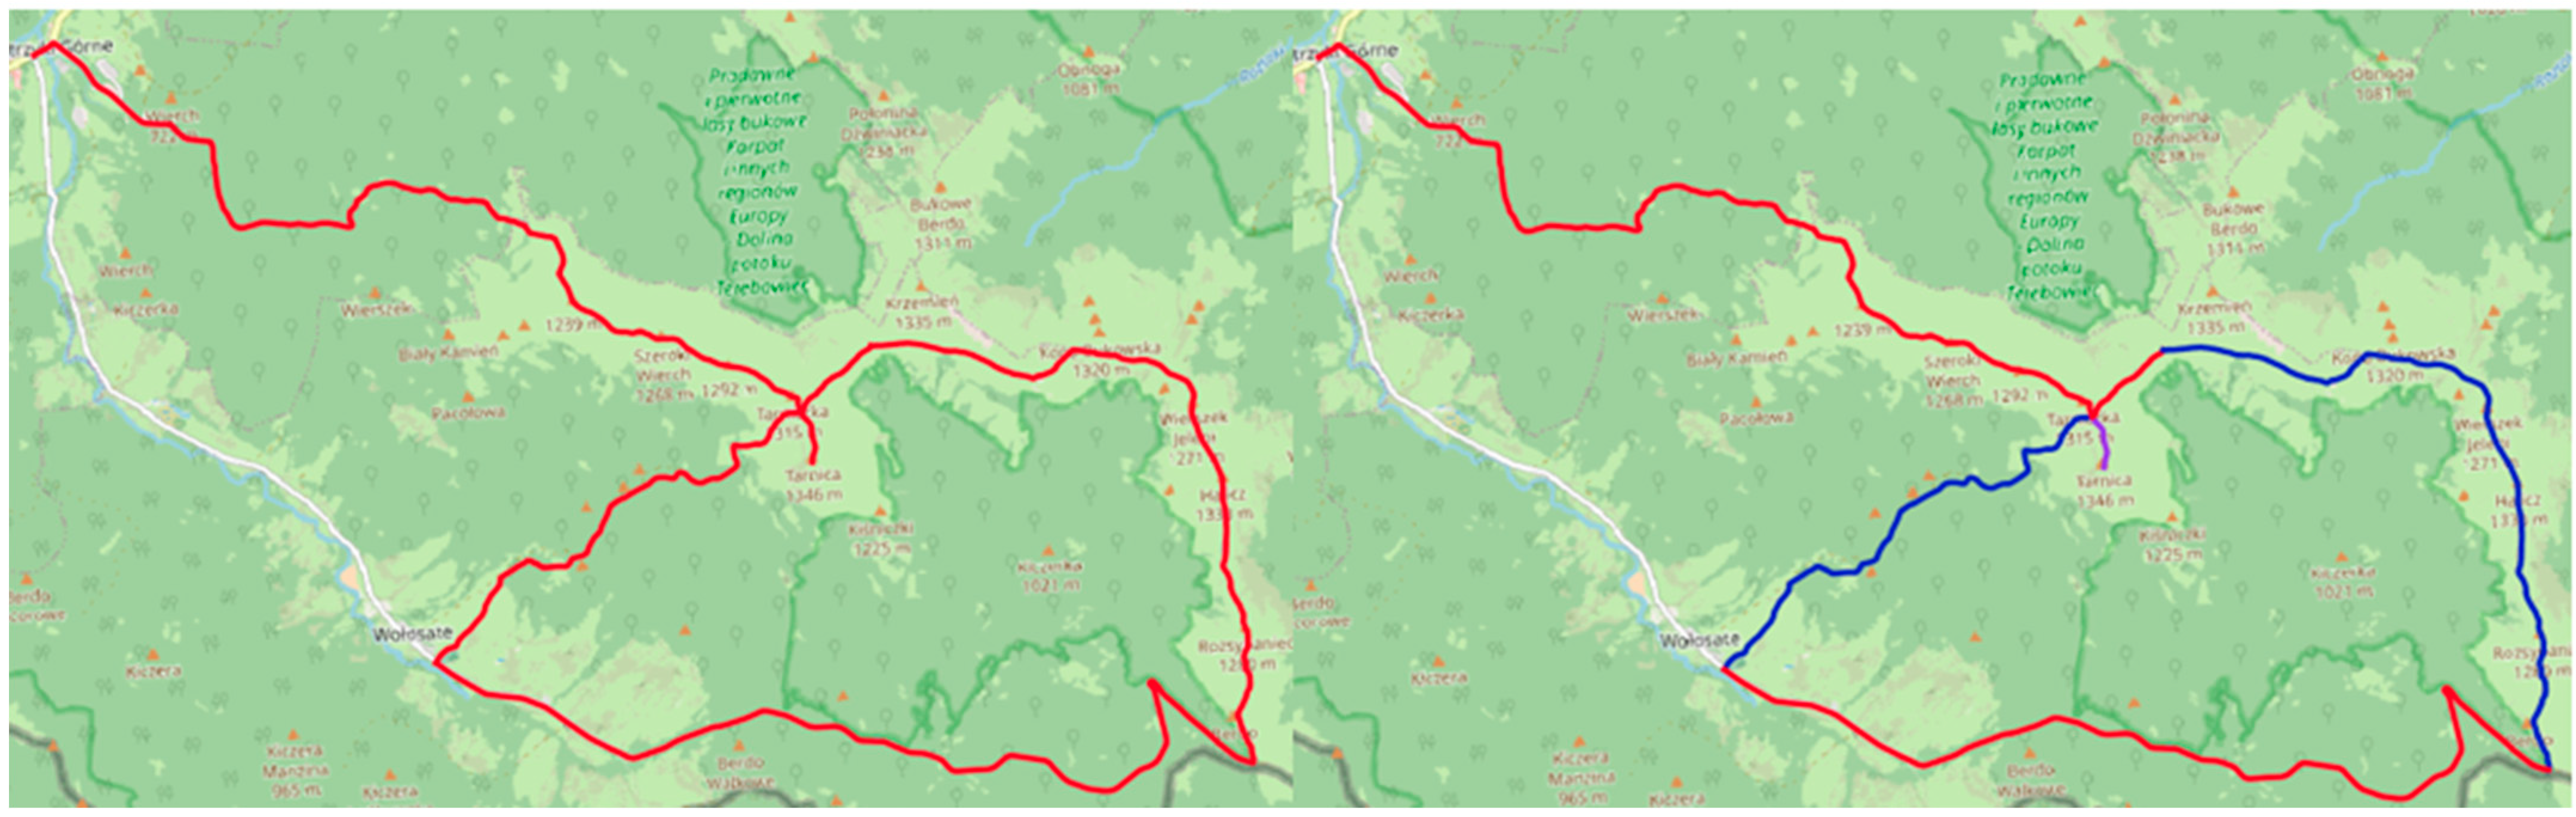
To illustrate the transformation of real geographic space into a computable mathematical model,
Figure 3 provides a schematic representation of the network topologization process. In standard tourist maps, a route is typically represented as a single, continuous geographical line (e.g., the red trail shown on the left side of
Figure 3). However, for precise spatial analysis and routing, this continuous geometry must be abstracted into discrete topological elements. As demonstrated in
Figure 3 (right side), a single continuous red trail from the map has been topologically divided into six independent segments. This conversion is a fundamental step: it ensures that routing algorithms can evaluate the physical parameters (such as micro-slopes) of each specific edge individually, preventing the critical error of averaging terrain data over the entire length of the original trail.
3.2. Edge Slope Analysis
Building upon the topological graph established in
Section 3.1, the goal of this second stage is to execute a rigorous safety verification of every identified edge. Its primary function is to act as a physical traction filter: by applying high-resolution DEM micro-segmentation, the model mathematically detects and eliminates any terrain micro-barrier that exceeds the strict 25% hill-climbing limit of the wheelchair. This step logically ensures that the surviving network is 100% physically passable and safe for the user.
For each Edge
path discretization was performed by establishing measurement points
at a constant interval
(the adopted length results from the DEM resolution input and the traction characteristics of wheelchairs/electric vehicles), thereby creating segments. If edge
consists of a sequence of elevation points
, they form a set
, of elementary edges. For each elementary edge, its slope expressed in percentages was determined:
The sifnigicance of is as follows: To determine the longitudinal profile of edge , an algorithm projecting measurement points onto the plane of the Digital Elevation Model (DEM) with a resolution of 1 × 1 m was applied. The elevation value for each point is determined using the Bilinear Interpolation method applied to adjacent raster cells, which minimizes errors resulting from terrain quantization.
is the length of the edge.
From graph , we removed edges for which the vehicle’s limiting traction parameters were exceeded at any measurement point (in the case analyzed in the article, this is the value of ). The remaining subset of constitutes the basis for further analyses.
3.3. Start Node Qualification and Connectivity Analysis
Once the definitively safe base network has been isolated (
Section 3.2), the goal of the third stage is to evaluate the qualitative aspects of these passable routes. Its function is to calculate user-calibrated indices for psychophysical Difficulty (EDI) and Tourism Quality (TQI). Logically, while the previous step simply determined ‘whether the route is passable’, this step evaluates ‘how demanding and attractive the route is’, generating actionable route classifications for the end-user.
The connectivity stage verifies whether the subgraph meeting the traction criteria forms connected components accessible from start nodes . Meeting the slope criterion alone does not guarantee operational accessibility. In the set , isolated subgraphs were identified. Only edges that possessed a continuous connection with at least one start node qualified for further valuation. The start node selection process proceeds according to the following cascade algorithm:
Infrastructure Identification (Parking): In the first iteration, nodes
are selected within a radius
of which parking infrastructure is located (OpenStreetMap key amenity = parking).
A key assumption of sustainable mobility is integration. For each node with parking, the Euclidean distance to the nearest public transport stop (
) is verified. To be qualified, a node must meet the proximity condition (adopted
)—acceptable distance for the Specialized Off-Road Wheelchair).
This condition promotes locations supporting trip chaining (multimodal travel). Next, the presence of an adapted toilet is verified (amenity = toilets + wheelchair = yes). Although the lack of a toilet does not disqualify the point completely (it is a soft criterion), nodes possessing this facility receive priority in the subsequent Hub optimization phase.
The final “technical” condition is checking whether at least one edge
belonging to the set of
(defined in
Section 3.2) originates from a given node).
The final set of start nodes was defined as:
The introduction of a rigorous requirement for public transport proximity () for the base location (Hub) results from two premises:
Operational: The rental base requires maintenance (service, battery exchange), which often involves employee commuting or access to the power grid, which usually correlates with the transport network.
Social: In accordance with the Smart Cities idea, the system should not enforce the possession of a private car adapted for transporting people with disabilities. Locating the base near a bus stop enables a person with a disability to arrive by a low-floor bus, transfer to an off-road wheelchair, and realize the trip, ensuring full autonomy and an accessibility chain.
3.4. Edge Difficulty Index (EDI)
The final logical step of the methodology shifts the perspective from the end-user to the spatial decision-maker. The goal of this stage is to mathematically identify the optimal geographical coordinates for placing the inclusive rental infrastructure (the hub). Its function is to run a spatial optimization algorithm on the fully evaluated safe network (from
Section 3.3) to maximize the diversity and quality of accessible routes available from a single starting point.
For each edge
a difficulty index
was determined. This index defines the average psychophysical burden over the entire length of the edge, resulting from the sum of slopes of individual 10-m elementary edges.
where
is the number of 10-m elementary edges comprising edge
is the slope of the -th elementary edge (always positive, according to Formula 1)
Based on
and the maximum slope
, edges are categorized into three difficulty groups (Easy, Medium, Hard). To ensure the method’s universality, regardless of the morphological specificity of the studied area (lowland, upland, high mountain), rigid percentage thresholds were abandoned in favor of relative assessment. Raw
values were subjected to global Min-Max normalization with respect to the entire analyzed set of edges:
where
and
are, respectively, the lowest and highest average slope values recorded in the entire studied network.
The obtained normalized index
allows for an objective ranking of routes from easiest to hardest within a given geographical context. On this basis, the set was divided into three difficulty classes (quantiles), as presented in
Table 3.
3.5. Tourist Quality Index (TQI)
Tourist attractiveness is determined through the spatial aggregation of point objects within buffer polygons with a radius of r = 10 m. The Point-in-Polygon counting method allows dynamic recalculation of object weights based on their function (safety vs. recreation). Additionally, impediments were taken into account that may be caused by poor conditions due to increased water levels in streams. The number of intersections between a given edge and the streams was checked. Due to the specificity of tourism for people with disabilities, key groups of objects affecting the quality and safety of the trip were identified:
The availability of sanitary facilities and shelters is a critical factor that often determines whether people with mobility limitations or comorbidities undertake an expedition. In the case of people with disabilities, access to an adapted toilet is not merely a matter of comfort, but a medical and physiological necessity, conditioning the sense of safety on the route. Similarly, mountain huts and shelters act as rescue points in the event of sudden weather phenomena changes; for a person moving in a wheelchair or with limited respiratory capacity, rapid rainfall or a temperature drop poses a significantly greater threat than for an able-bodied tourist, due to the difficulty in quickly leaving the exposed terrain. Therefore, in the model, these objects receive the highest positive weights, thereby determining the edge’s baseline utility.
Toilets: Key for physiological comfort, especially on longer routes.
Shelters/Roofs: Provide protection against sudden weather changes, which is critical for people with limited mobility.
Transport and recreation planning for groups with special needs must account for limited physical endurance and the necessity of frequent body position changes. Benches, picnic tables, and dedicated resting places distributed along the graph edges perform the function of rest intervals that prevent organism overload. Significantly, this infrastructure enables safe exit from the vehicle (e.g., the wheelchair) and a change of body position, which is key in pressure ulcer prevention and the reduction of muscle tension resulting from staying in one position for a prolonged period. In the TQI model, the verification of the density of these objects allows for the assessment of the route in terms of its predictable arduousness and the degree of regeneration offered by a given segment.
Inclusive accessibility assumes that a person with a disability has the right to have the same aesthetic and educational experiences as other tourists. Viewpoints, peaks, and information boards constitute the “operational goals” of the expedition, performing a strong motivational function to undertake physical effort. In the case of mountain routes, where full terrain exploration may be impossible, educational boards and observation points become a substitute for direct contact with inaccessible parts of nature, allowing for participation in tourism culture without the necessity of overcoming extreme barriers. A high score in this category promotes routes with a rich substantive program, which raises the TQI index despite potential terrain challenges.
Viewpoints/Peaks: Constitute the goal of the trip, motivating the undertaking of effort.
Info boards: Enhance educational value without the necessity of physical exploration of difficult terrain.
The final element of valuation is the identification of negative factors that may worsen the ride experience. Particular attention was paid to the intersection points of the trail with watercourses. While for a pedestrian tourist a small stream is a marginal obstacle, for a wheelchair user (especially an electric one) it signifies a risk of traction loss and dirtying of drive mechanisms. The analysis of intersections with streams in the TQI model serves as a negative correction, warning against edges that, in specific weather conditions, may lower comfort. The developed wheelchair allows traversing the indicated elements without issue; however, depending on the weather, it may cause dirtying and splashing.
For each edge
, a raw point score was calculated:
where
is the number of objects of type on edge
is the weight assigned to an object of type .
Table 4 presents the weights of individual POI objects and the issue of accounting for streams. To ensure high model reliability, the process of assigning weights
or individual POI objects was preceded by expert consultations and tests in real-world conditions. The weighting procedure for POIs was conducted using a Structured Expert Judgment (SEJ) approach. A panel of twenty specialists including GIS analysts, physiotherapists specializing in mobility, and mountain tourism experts evaluated the relative importance of each POI category on a 5-point Likert scale. To ensure methodological rigor and minimize subjectivity, the final weights were calculated as the geometric mean of expert scores. Furthermore, the stability of these weights was verified through the sensitivity analysis described in
Section 4.8, confirming that minor fluctuations in weight values do not significantly alter the final hub-location rankings, thus ensuring the reliability of the spatial indices.
To enable the comparison of trail quality, the raw result
was subjected to Min-Max normalization to the range
:
where
and
are the extreme point values recorded in the entire analyzed network.
To facilitate the interpretation of results for end-users and infrastructure planners, the normalized values were assigned to three tourism standard categories:
High Standard (Gold Standard): . These edges are characterized by maximum saturation with supporting infrastructure, identified during field tests as key for the safety and comfort of people with disabilities. On routes of this class, objects with the highest weights (adapted toilets, mountain huts) occur with high frequency, which allows for full control of physiological and atmospheric risks. These are model routes, fully realizing Universal Design assumptions.
Optimal Standard (Silver Standard): . Routes in this range offer the necessary infrastructural minimum, mainly in the form of resting points (benches, tables) and cognitive values. Although they may not possess full sanitary facilities at every stage, their POI saturation is sufficient for safe recreation with appropriate logistical preparation. In this category, sporadic impediments (e.g., stream crossings) are admissible, provided they are balanced by high scenic values.
Base Standard (Bronze Standard): . Edges with the lowest service saturation, where technical parameters (slope) dominate over amenities. These are routes intended for advanced users of Specialized Off-Road Wheelchairs, requiring a high degree of independence. The low TQI value here often results from the geographical isolation of the edge or the lack of technical possibilities for installing permanent infrastructure.
3.6. Hub Optimization
The objective of the optimization is to indicate the node , hich will become the best location for the rental base. In accordance with the Smart Tourism concept, the base should maximize the so-called “tourism utility” available to the user.
A good base should not be evaluated solely through the prism of the sum of the attractiveness of available routes. A key aspect of inclusivity is diversity. The base must offer routes for both beginners (Easy) and advanced users (Hard).
An objective function
, was defined, which aggregates the potential of all routes originating from a given node. Instead of averaging the quality of entire trips, a model was adopted in which every route edge contributes a value to the system proportional to its length weighted by the quality index
.
where
is the set of all unique routes (itineraries) starting at node
is a single segment comprising route ;
is the geometric length of edge [km];
is the normalized quality index of edge (according to formula 9)
is the difficulty diversity factor.
The diversity factor assumes a value of
1.0, if routes from all three difficulty categories (Easy, Medium, Hard) are available from base;
0.6, if only two categories are available;
0.3, if only one category is available (e.g., only hard trails).
This approach is justified by the necessity of ensuring Universal Design—the rental base, as a public investment, must serve the widest possible group of recipients, and not only a narrow group of users seeking extreme routes or exclusively walking ones.
4. Results
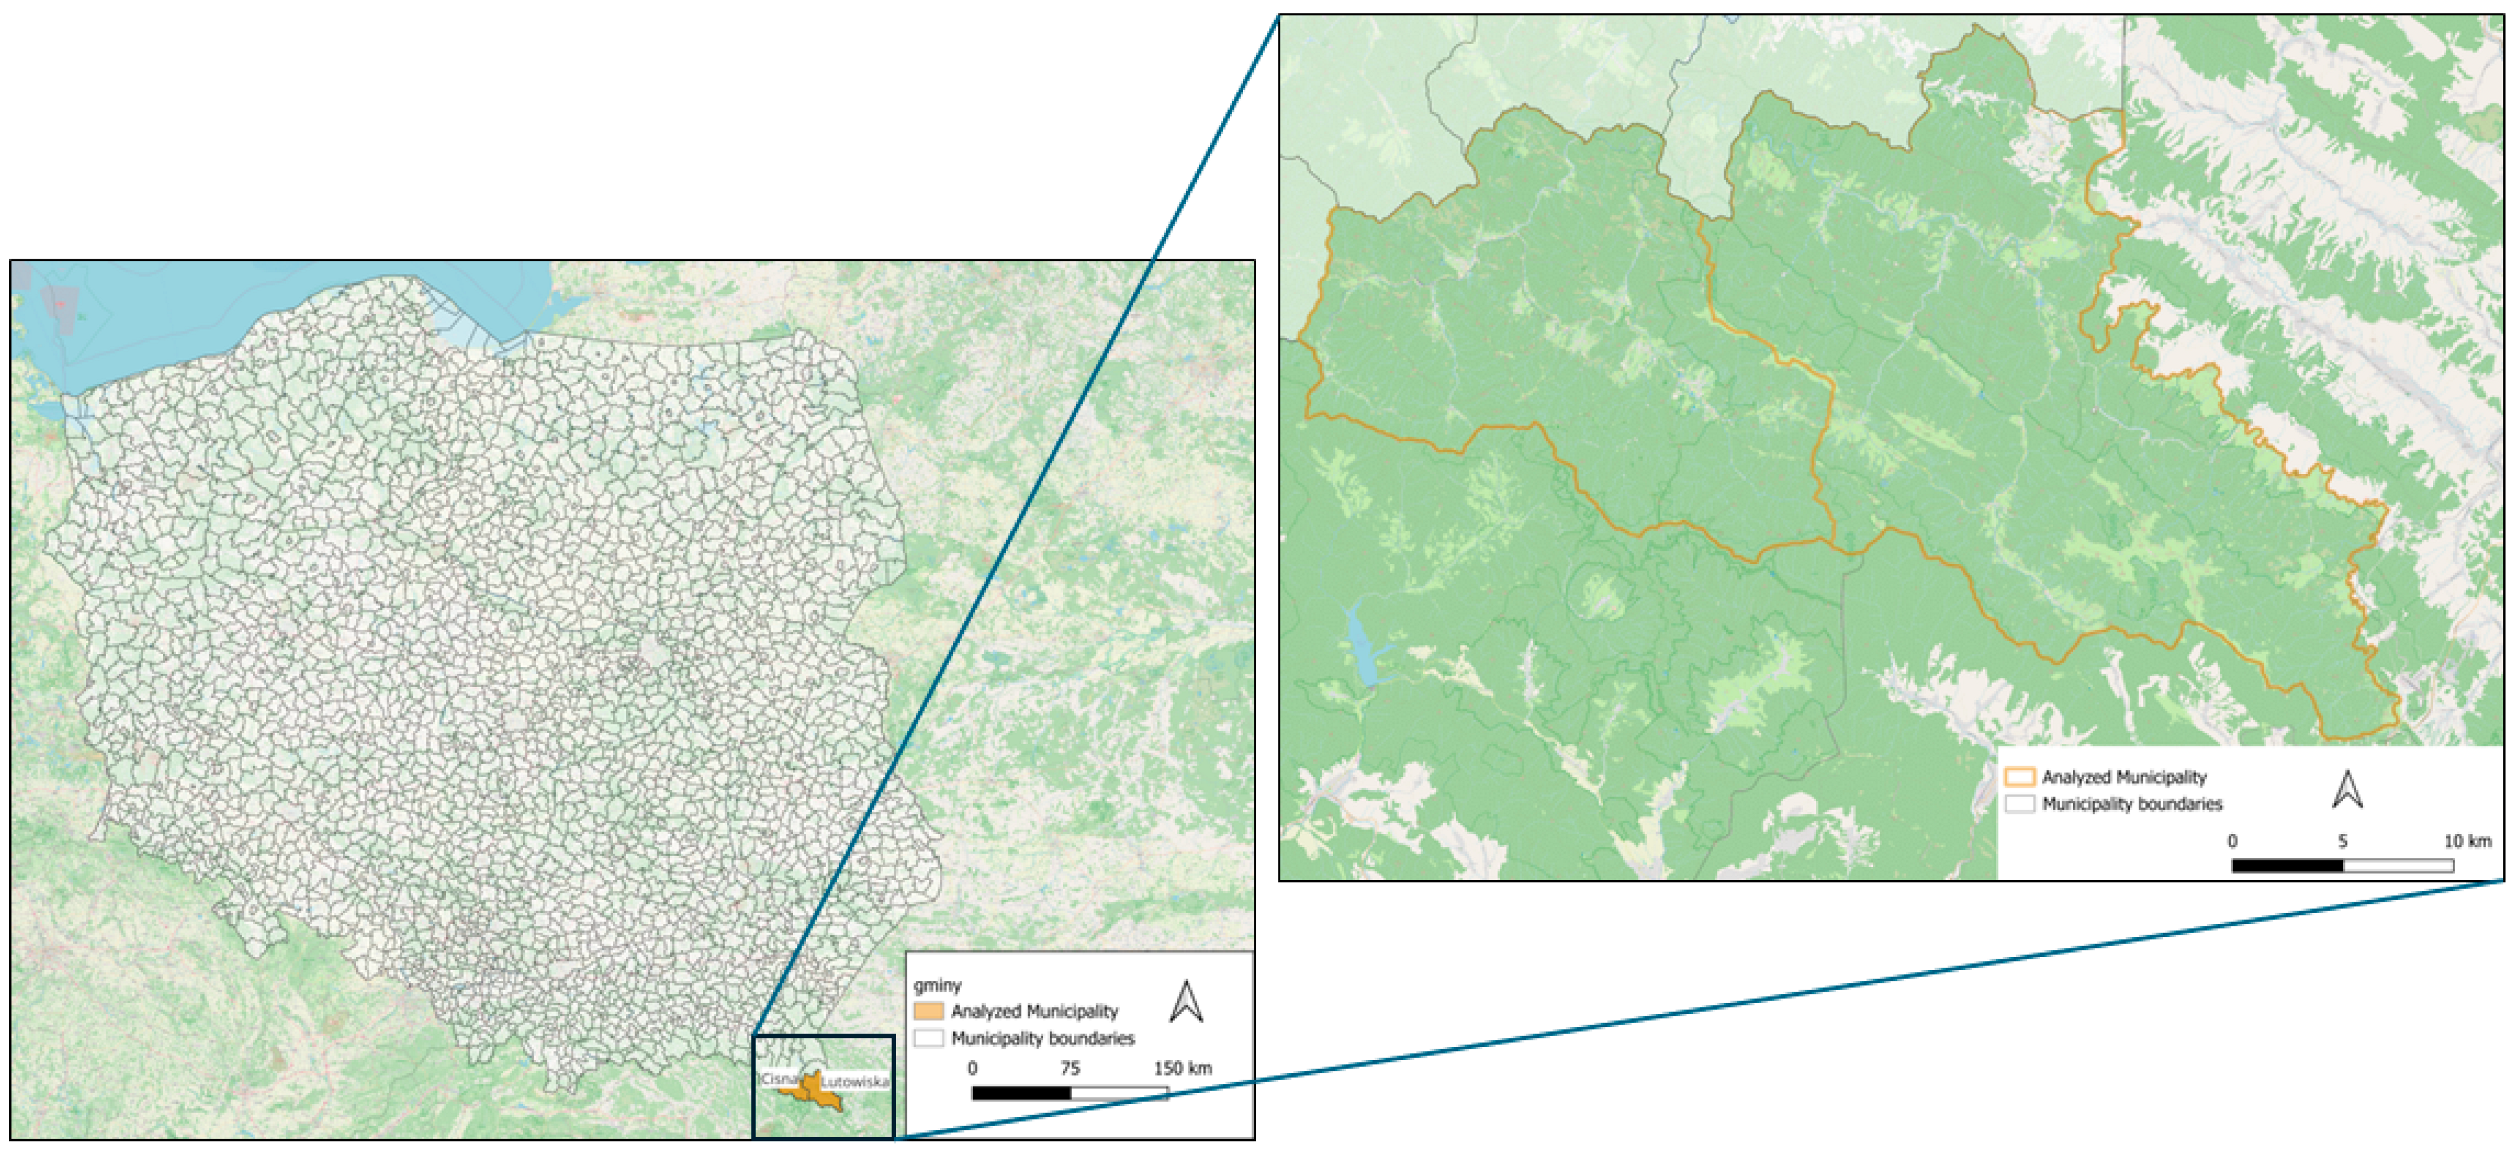
To empirically verify the developed methodology, a case study was conducted in southeastern Poland, in the Podkarpackie Voivodeship. The study area covers two municipalities with outstanding natural and tourism values: the Cisna Municipality and the Lutowiska Municipality, located in the heart of the Bieszczady Mountains. The geographical location of the research area is presented in
Figure 4.
The choice of this location was dictated by the unique terrain morphology, characterized by the occurrence of the polonyna zone (alpine meadows), and the status of the protected area within the Bieszczady National Park and the Cisna-Wetlina Landscape Park.
The study area covers a total of approximately 761 square kilometers (Lutowiska Municipality: approx. 476 km2, Cisna Municipality: approx. 285 km2), which constitutes a significant part of the Polish section of the “East Carpathians” International Biosphere Reserve. This terrain is characterized by long, parallel mountain ranges separated by river valleys. The highest peak in the analyzed area (and in the Polish Bieszczady) is Tarnica (1346 m a.s.l.), while other key massifs include Połonina Wetlińska, Połonina Caryńska, and the Wielka Rawka massif.
The tourism significance of the region results from its wild character and unique landscape values, attracting hundreds of thousands of tourists annually. However, difficult topography (steep ascents, uneven stony ground) combined with infrastructural limitations makes the Bieszczady one of the most difficult-to-access mountain ranges for people with motor disabilities. These factors make this area key for verifying the effectiveness of Specialized Off-Road Wheelchairs. Introducing a rental system in such demanding terrain constitutes a stress test for the proposed methodology, aiming to demonstrate that thanks to technology and appropriate planning (GIS), even peripheral areas can become inclusive and accessible to people with special needs.
To ensure the reproducibility and transparency of the study, time frames and data sources were defined. All vector data regarding the road network, tourist trails, and point infrastructure (POI) were downloaded from the OpenStreetMap (OSM) repository and the resources of the Polish Tourist and Sightseeing Society (PTTK) in November 2025. The Digital Elevation Model (DEM) with a resolution of 1 m × 1 m was acquired from the resources of the Head Office of Geodesy and Cartography (GUGiK). The entirety of spatial analyses and the valuation process were conducted using QGIS software version 3.34 “Prizren”.
4.1. Experimental Setup and Data Sources
To strictly align the empirical application with the theoretical methodology, the specific experimental conditions, data sources, and analytical environment must be explicitly defined before presenting the final outcomes. The experiment was structured based on the following prerequisites:
Study Area and Experimental Conditions: The empirical experiment was conducted in the Bieszczady Mountains (SE Poland), chosen for their diverse off-road topology. The experimental conditions were strictly bounded by the physical parameters of the Specialized Off-Road Wheelchair prototype (1000 mm track width, 1000 W motor, and a hard traction limit of 25% slope).
Data Sources: The foundational spatial data included a high-resolution 1 × 1 m Digital Elevation Model (DEM) sourced from [geoportal.gov.pl], generated via LiDAR scanning. The initial vector trail network was acquired from [OpenStreetMap topographic databases].
Experimental Steps and Software: The data processing, network topologization, and micro-segmentation steps (as defined in
Section 3) were executed within the QGIS software environment.
Validation Approach: The technical validation of the network’s traversability was conducted mathematically by testing each 1 × 1 m segment against the 25% slope threshold. Routes containing any segment exceeding this value were computationally disqualified.
With these prerequisites and datasets established, the subsequent subsections detail the step-by-step experimental results, moving from initial network reduction to the final hub-location optimization.
4.2. Graph Definition
The analyzed area encompasses a network of tourist trails and forest roads made available for pedestrian traffic, constituting the basis of the accessibility analysis. In the first step, vector data extraction was performed from the OpenStreetMap and PTTK databases (including objects marked with tags highway = path, highway = track, and tourism relations), creating a digital twin of the trail network.
A key stage was data topologization, involving the splitting of long lines (polylines) at intersection points to enable correct routing. So-called “dangles” (hanging nodes) and isolated network fragments that did not possess a connection to the main communication system were also eliminated.
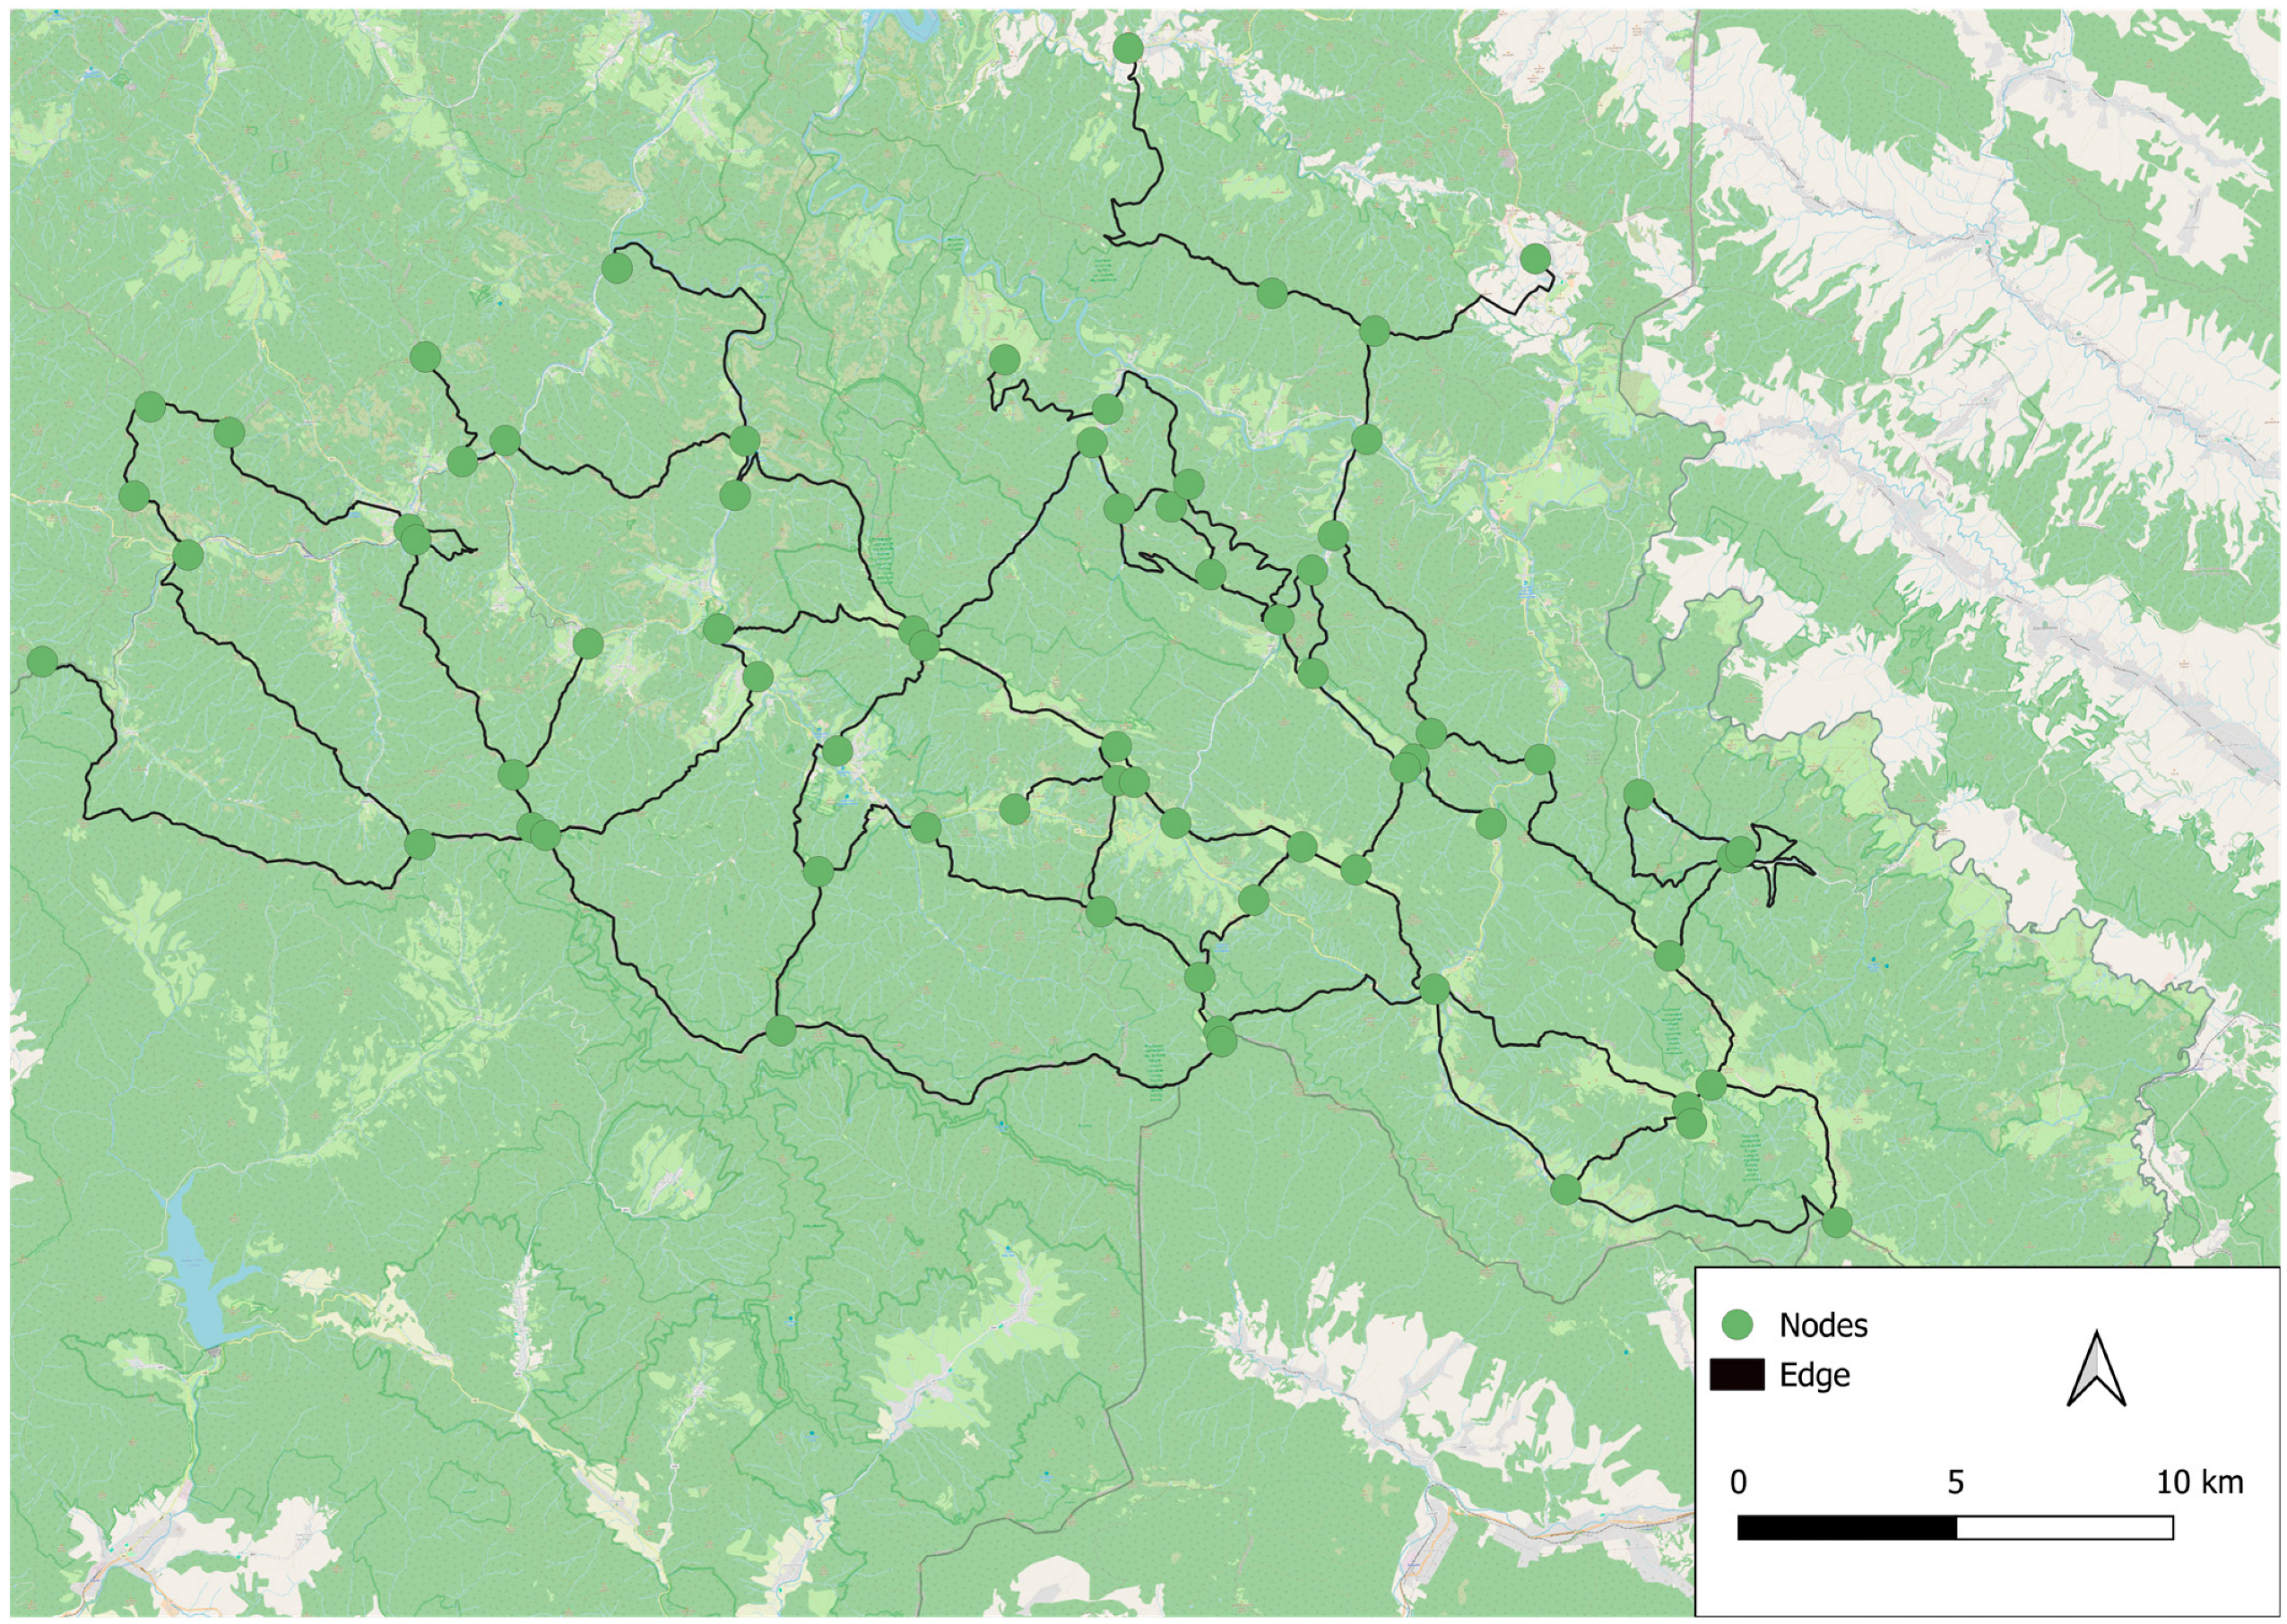
Figure 5 presents the constructed topological graph prepared for further analyses.
A total of 338.5 km of marked tourist trails were identified within the territory of both municipalities. After transformation into graph G = (V, E), the network consisted of 70 edges and 69 nodes.
This stage is critical because it transforms a static map into a dynamic, computable graph. Without this discrete abstraction, localized safety parameters could not be assigned to specific segments, which is a common failure in existing tourist navigation systems.
4.3. Edge Slope Analysis
A key stage was the elimination of edges exceeding the vehicle’s limiting traction parameters
. Using a Digital Elevation Model (DEM) with a resolution of 1 m, a slope analysis was conducted for every 10-m network segment. Using a Digital Elevation Model (DEM) with a resolution of 1 m × 1 m, a detailed slope analysis was conducted for every 10-m network segment in accordance with Formula (1) defined in the methodology. Such high sampling resolution allowed for the detection of local terrain extremes which, in the case of averaging for longer edges, could remain undetected.
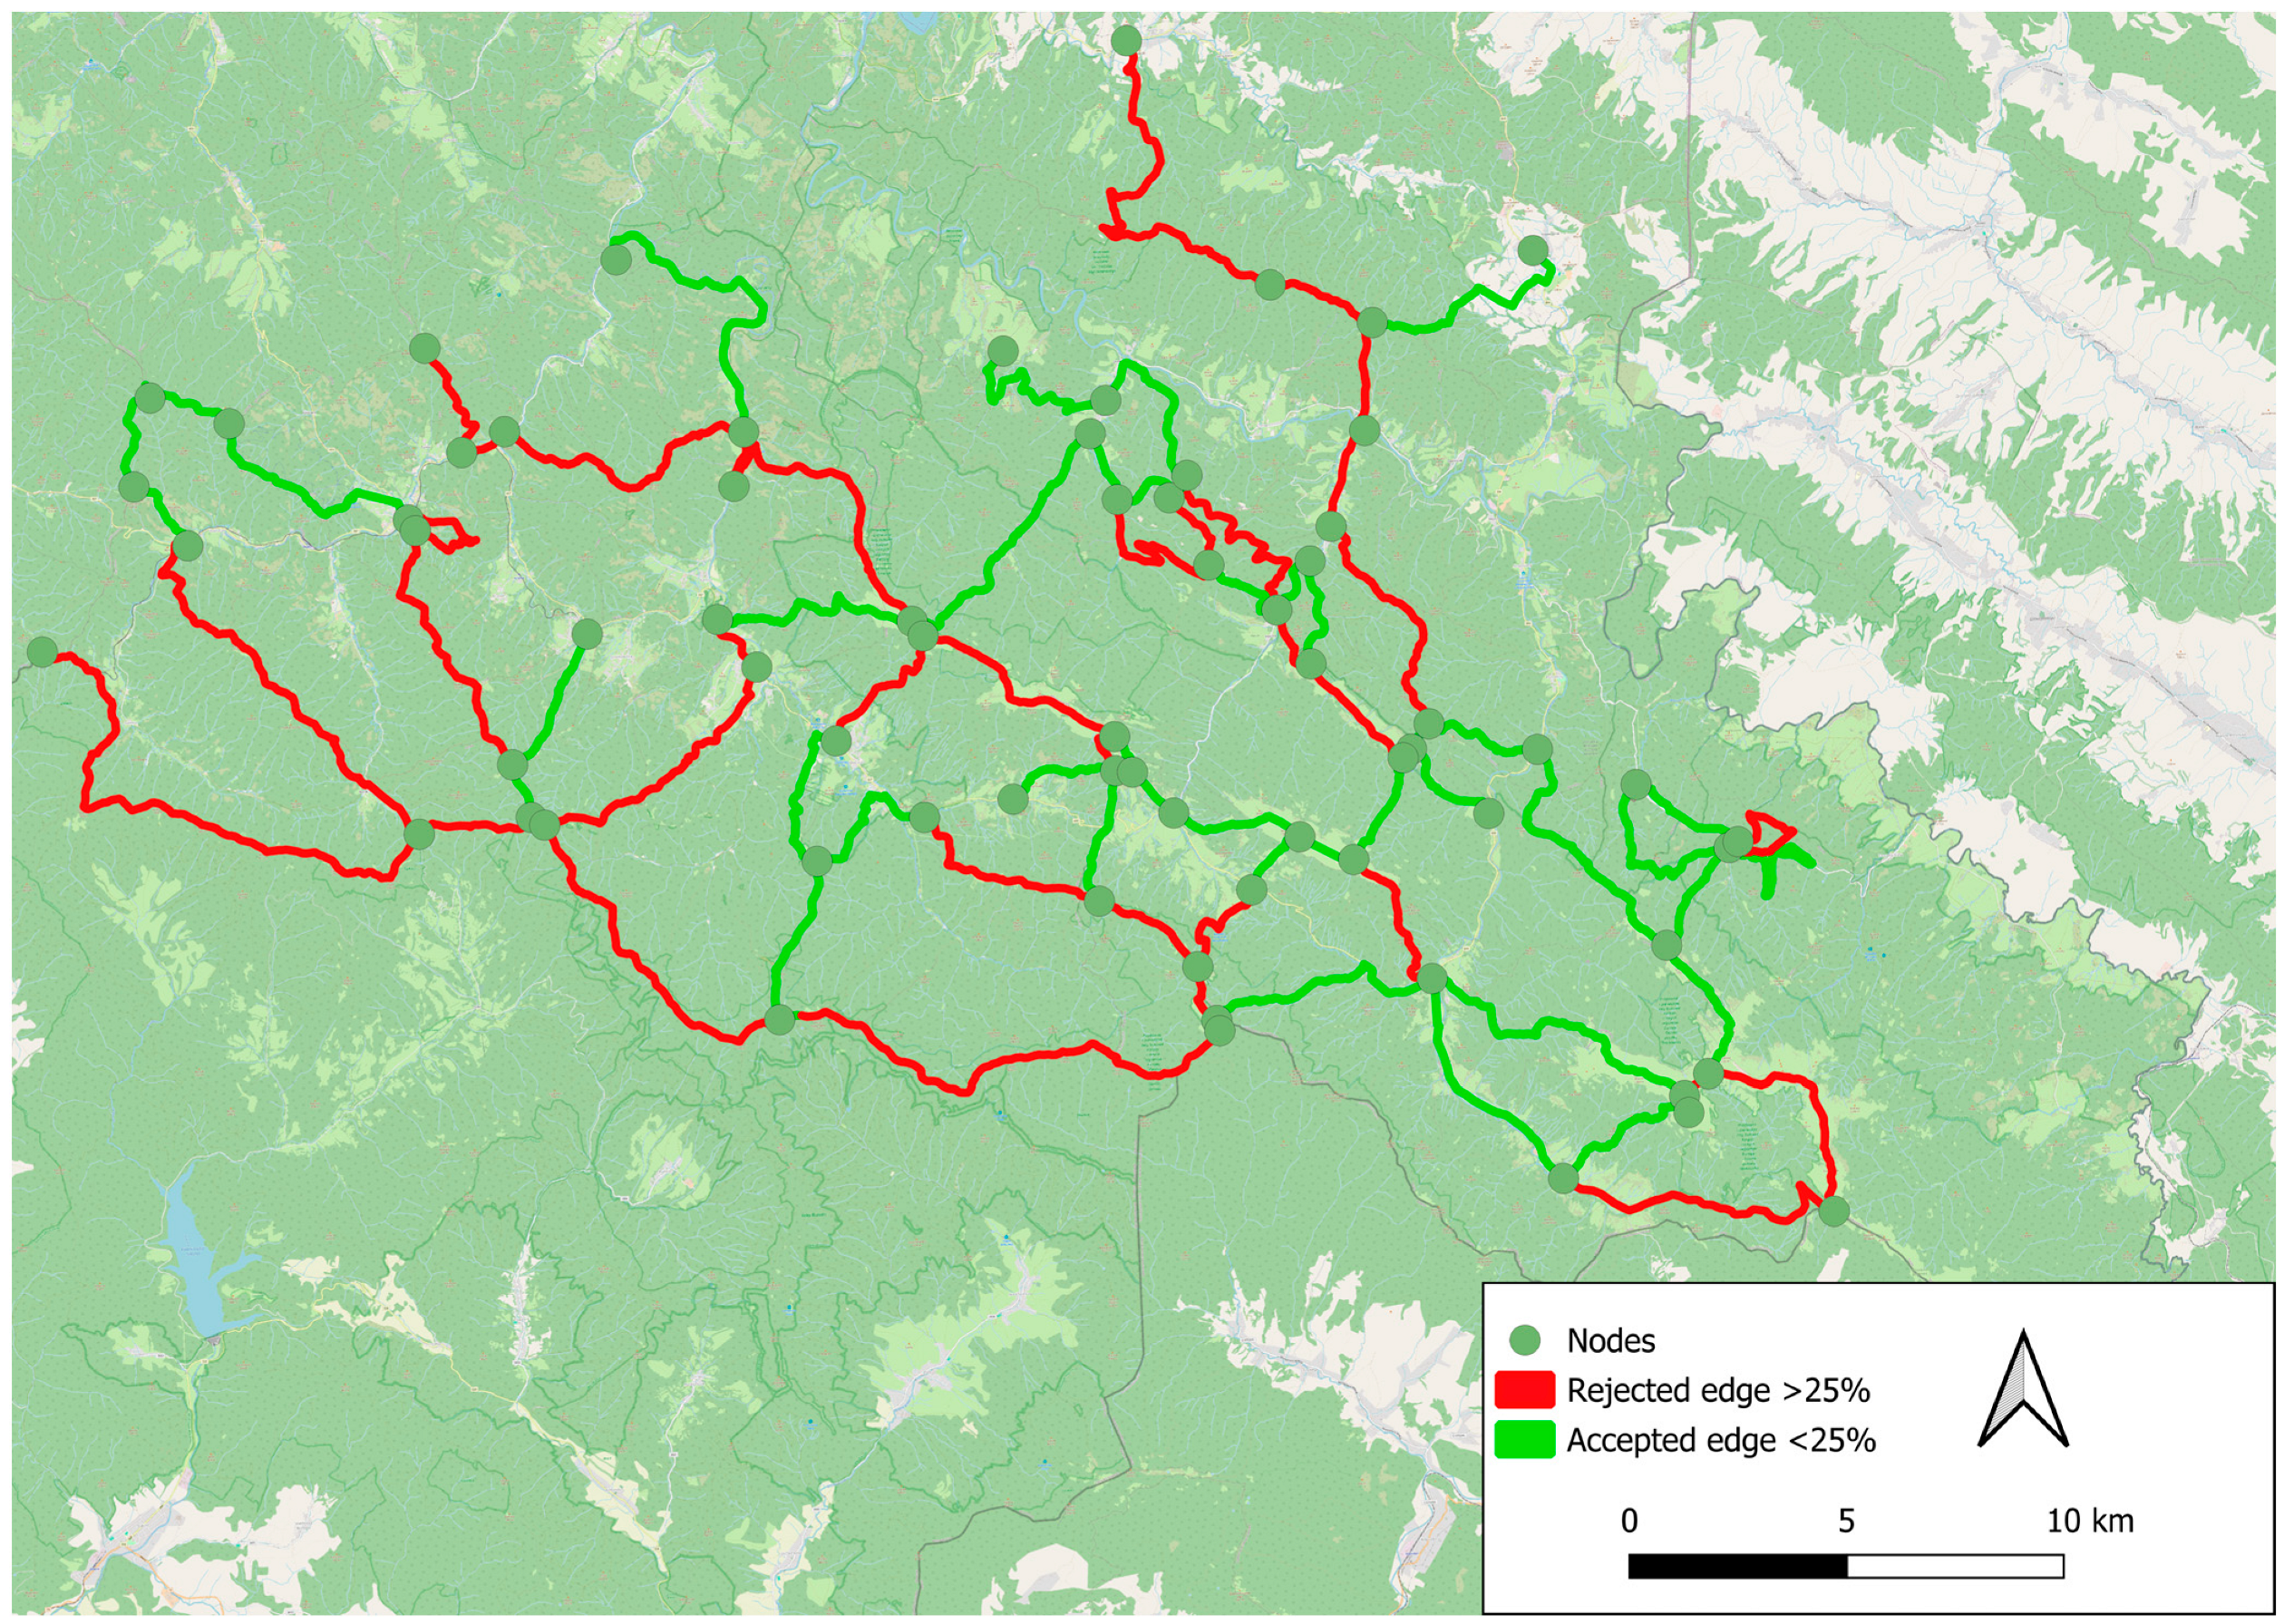
Figure 6 presents a map of trails, where rejected edges are marked in red and accepted ones in green.
This process led to a significant reduction in the available network. From the initial set of 70 test edges, as many as 29 (41.4%) did not meet safety requirements, which resulted in retaining 41 edges in the final subset.
Table 5 presents the results for individual edges describing length, maximum, minimum, and average slope. Edges that do not meet criterion
are marked in gray.
The analysis of the tabular data (
Table 5) confirms the validity of the adopted discretization methodology. Traditional approaches relying on average slope values (often falling within a seemingly safe 14–16% range) can dangerously mask critical, localized barriers. As demonstrated by several edges (e.g., IDs 2, 8, 56, and 63), routes with acceptable average slopes frequently contain isolated steep ascents or erosional fragments exceeding 40–50%, completely disqualifying them for off-road wheelchairs. Consequently, the technical verification eliminated both short connecting fragments and long, strategically important ridges, removing a total of 185.2 km (54.7%) from the initial network. The final length of the base network (
), recognized as safe for off-road wheelchairs, amounts to 153.3 km. This high reduction rate clearly indicates that relying solely on publicly available tourist maps or averaged slope data creates a real safety threat for people with disabilities in mountain terrain, underscoring the necessity of the applied micro-segmentation method.
4.4. Start Node Qualification and Connectivity Analysis
In accordance with the methodology (
Section 3.3), potential base locations (parking lots) were verified in terms of integration with public transport
and connectivity with the available trail network
.
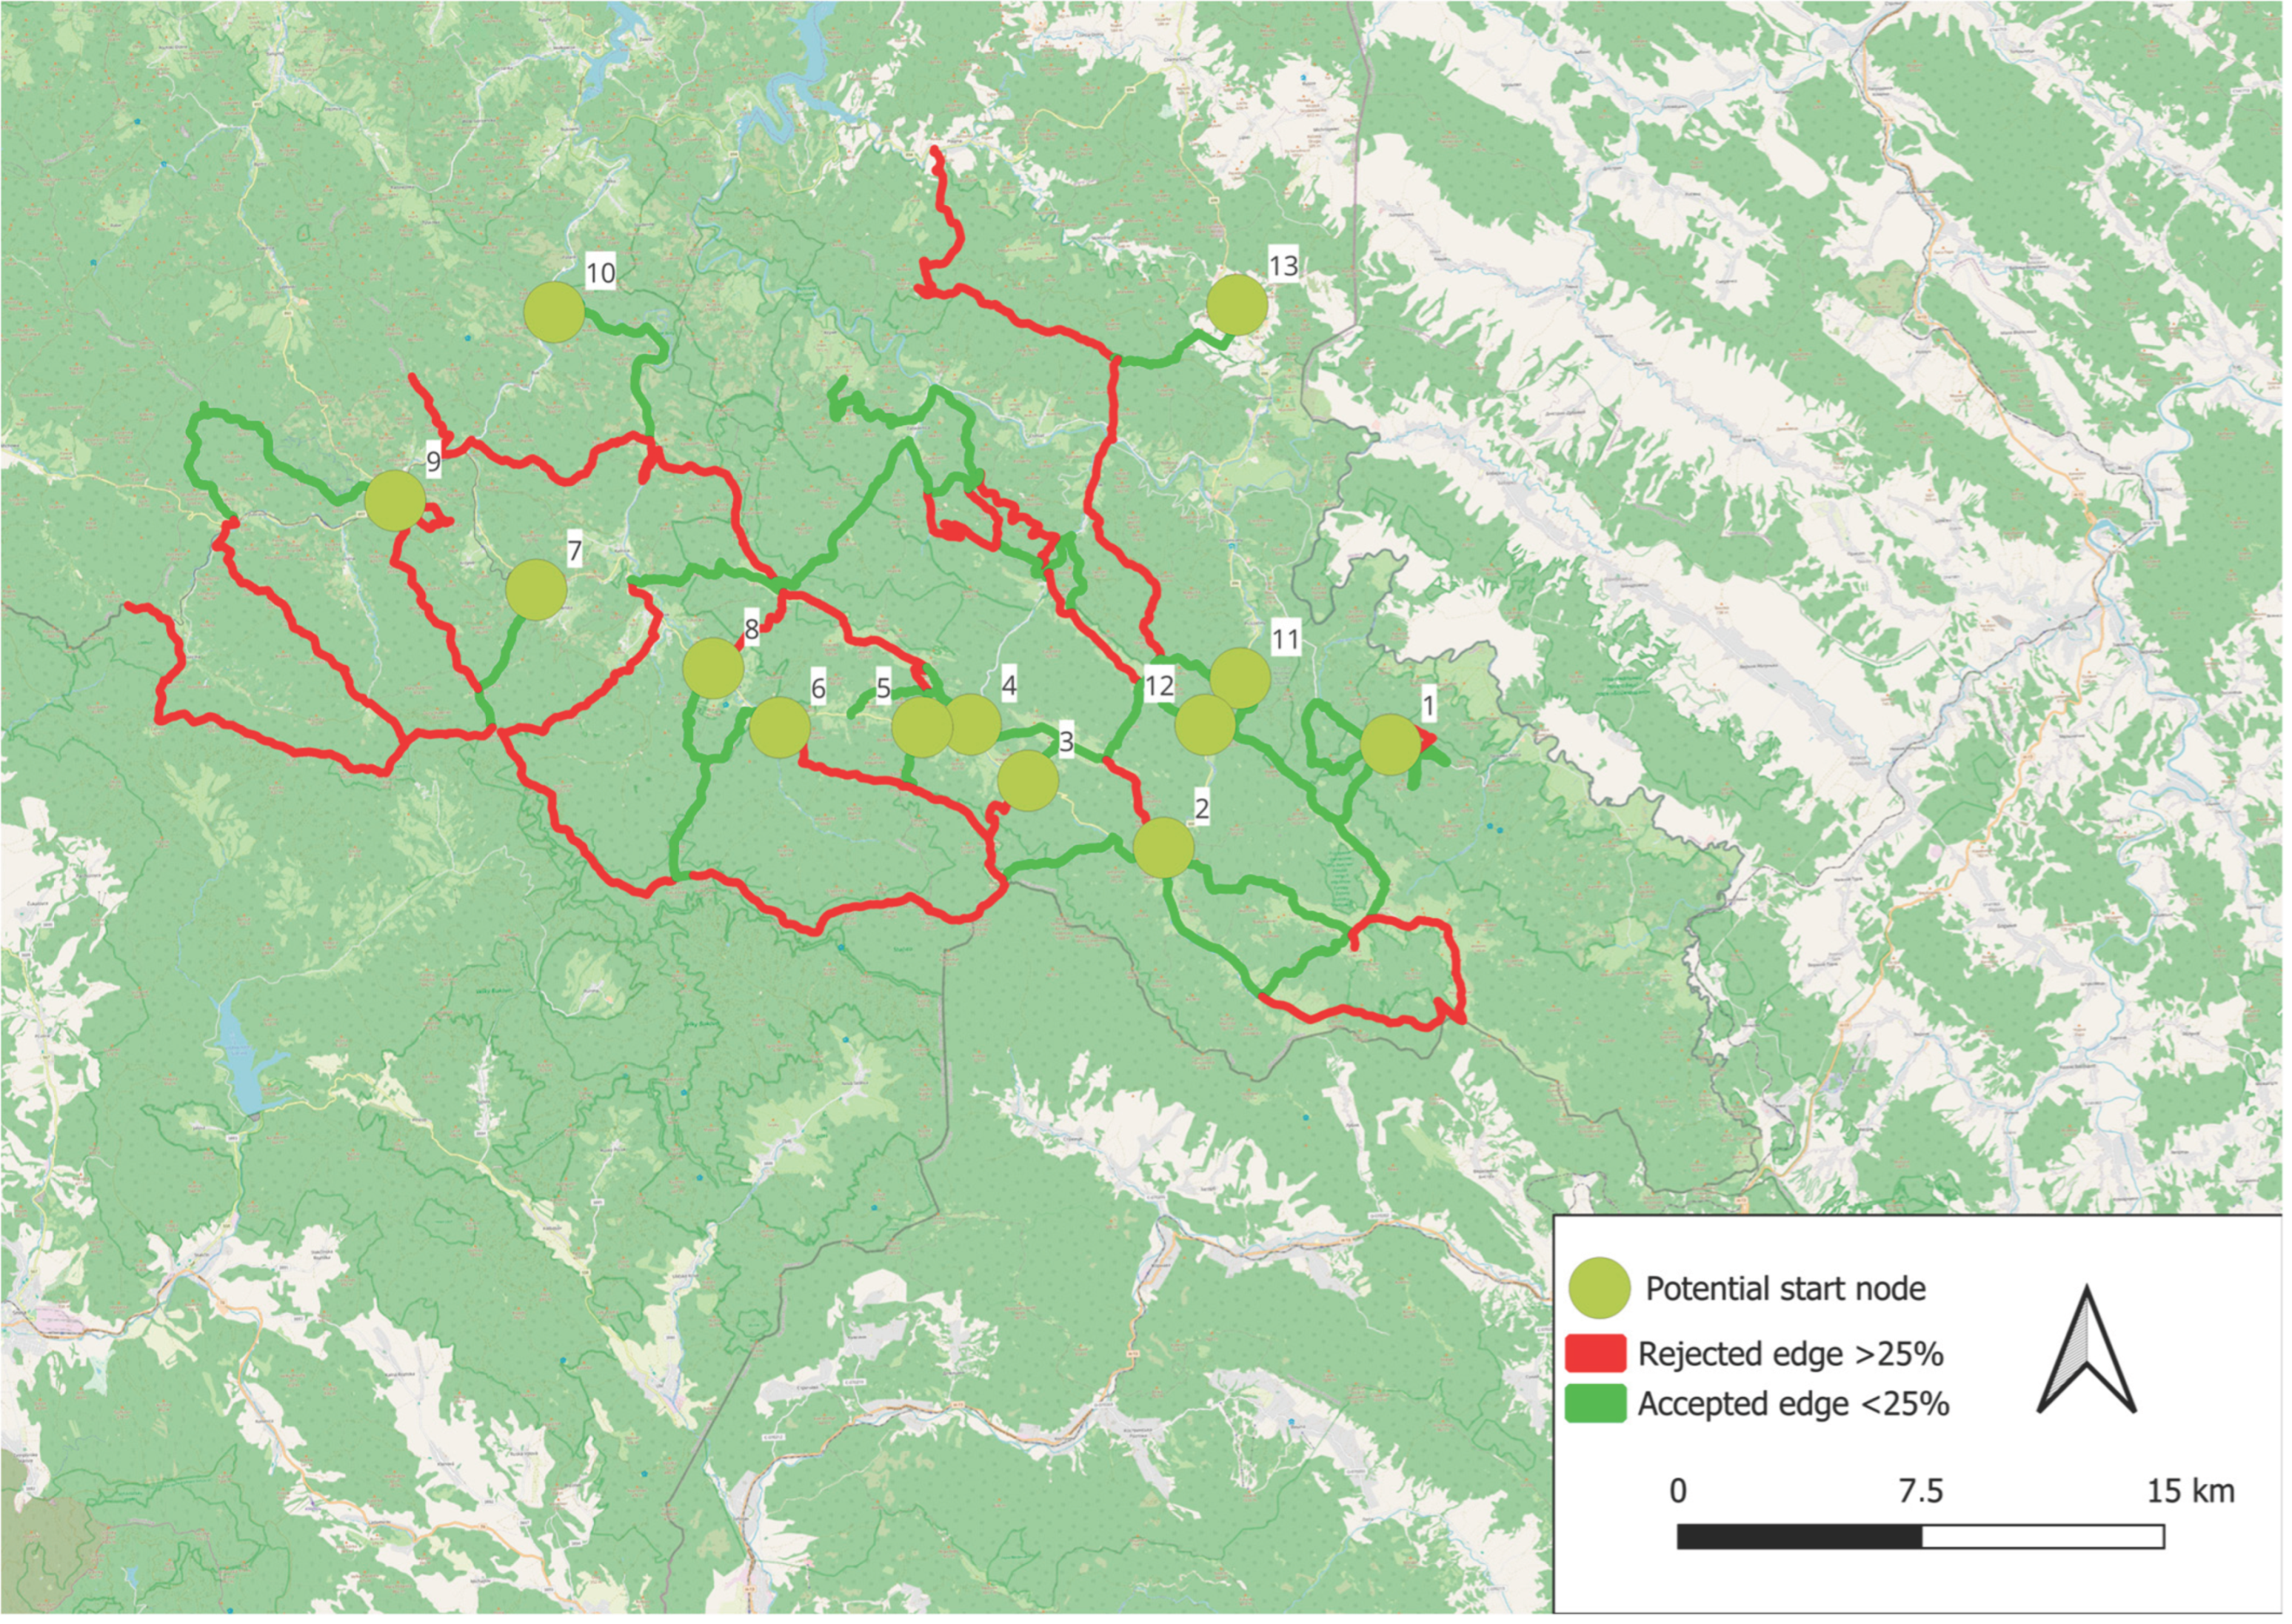
Figure 7 presents the location of potential points meeting the conditions, while
Table 6 shows their parameterization.
To maintain consistency with passenger information systems, node names were adopted in accordance with the official names of the nearest public transport (bus) stops. This allows for the unambiguous identification of the node in trip planners. Parking infrastructure (Parking count): This value refers to the number of distinct parking objects (polygons defined in the OSM database as amenity = parking) located in the node buffer, rather than the total number of parking spaces (capacity). Such an approach results from the attribute limitations of open data (lack of information on the number of spaces in OSM); however, the number of designated parking lots is a strong indicator of the tourism rank of a given place.
Ustrzyki Górne (ID 2) and Cisna (ID 9) are characterized by the highest infrastructure concentration. Ustrzyki Górne distinguishes itself with the highest number of parking lots (9 objects) and high connectivity (3 outgoing trails), which predisposes it to the role of the main eastern HUB. As many as 6 out of 13 analyzed locations (including Muczne, Przełęcz Wyżna) do not possess a publicly available toilet in the immediate vicinity (Toilet count = 0). This is a critical observation in the context of accessible tourism, suggesting the necessity of retrofitting these points upon the potential implementation of the base.
4.5. Edge Difficulty Index-EDI
For the set of edges
, which successfully passed the technical verification (described in
Section 4.3), a detailed difficulty assessment was conducted. The aim of this stage was not only determining “whether it is passable”, but quantifying “how difficult the passage is” from the perspective of the user’s psychophysical burden. In the first step, the raw value of the index
was calculated for each edge, being the arithmetic mean of slopes of all 10−meter elementary segments. Next, to ensure classification objectivity in the specific, mountain terrain of the Bieszczady, a normalization of results to the range
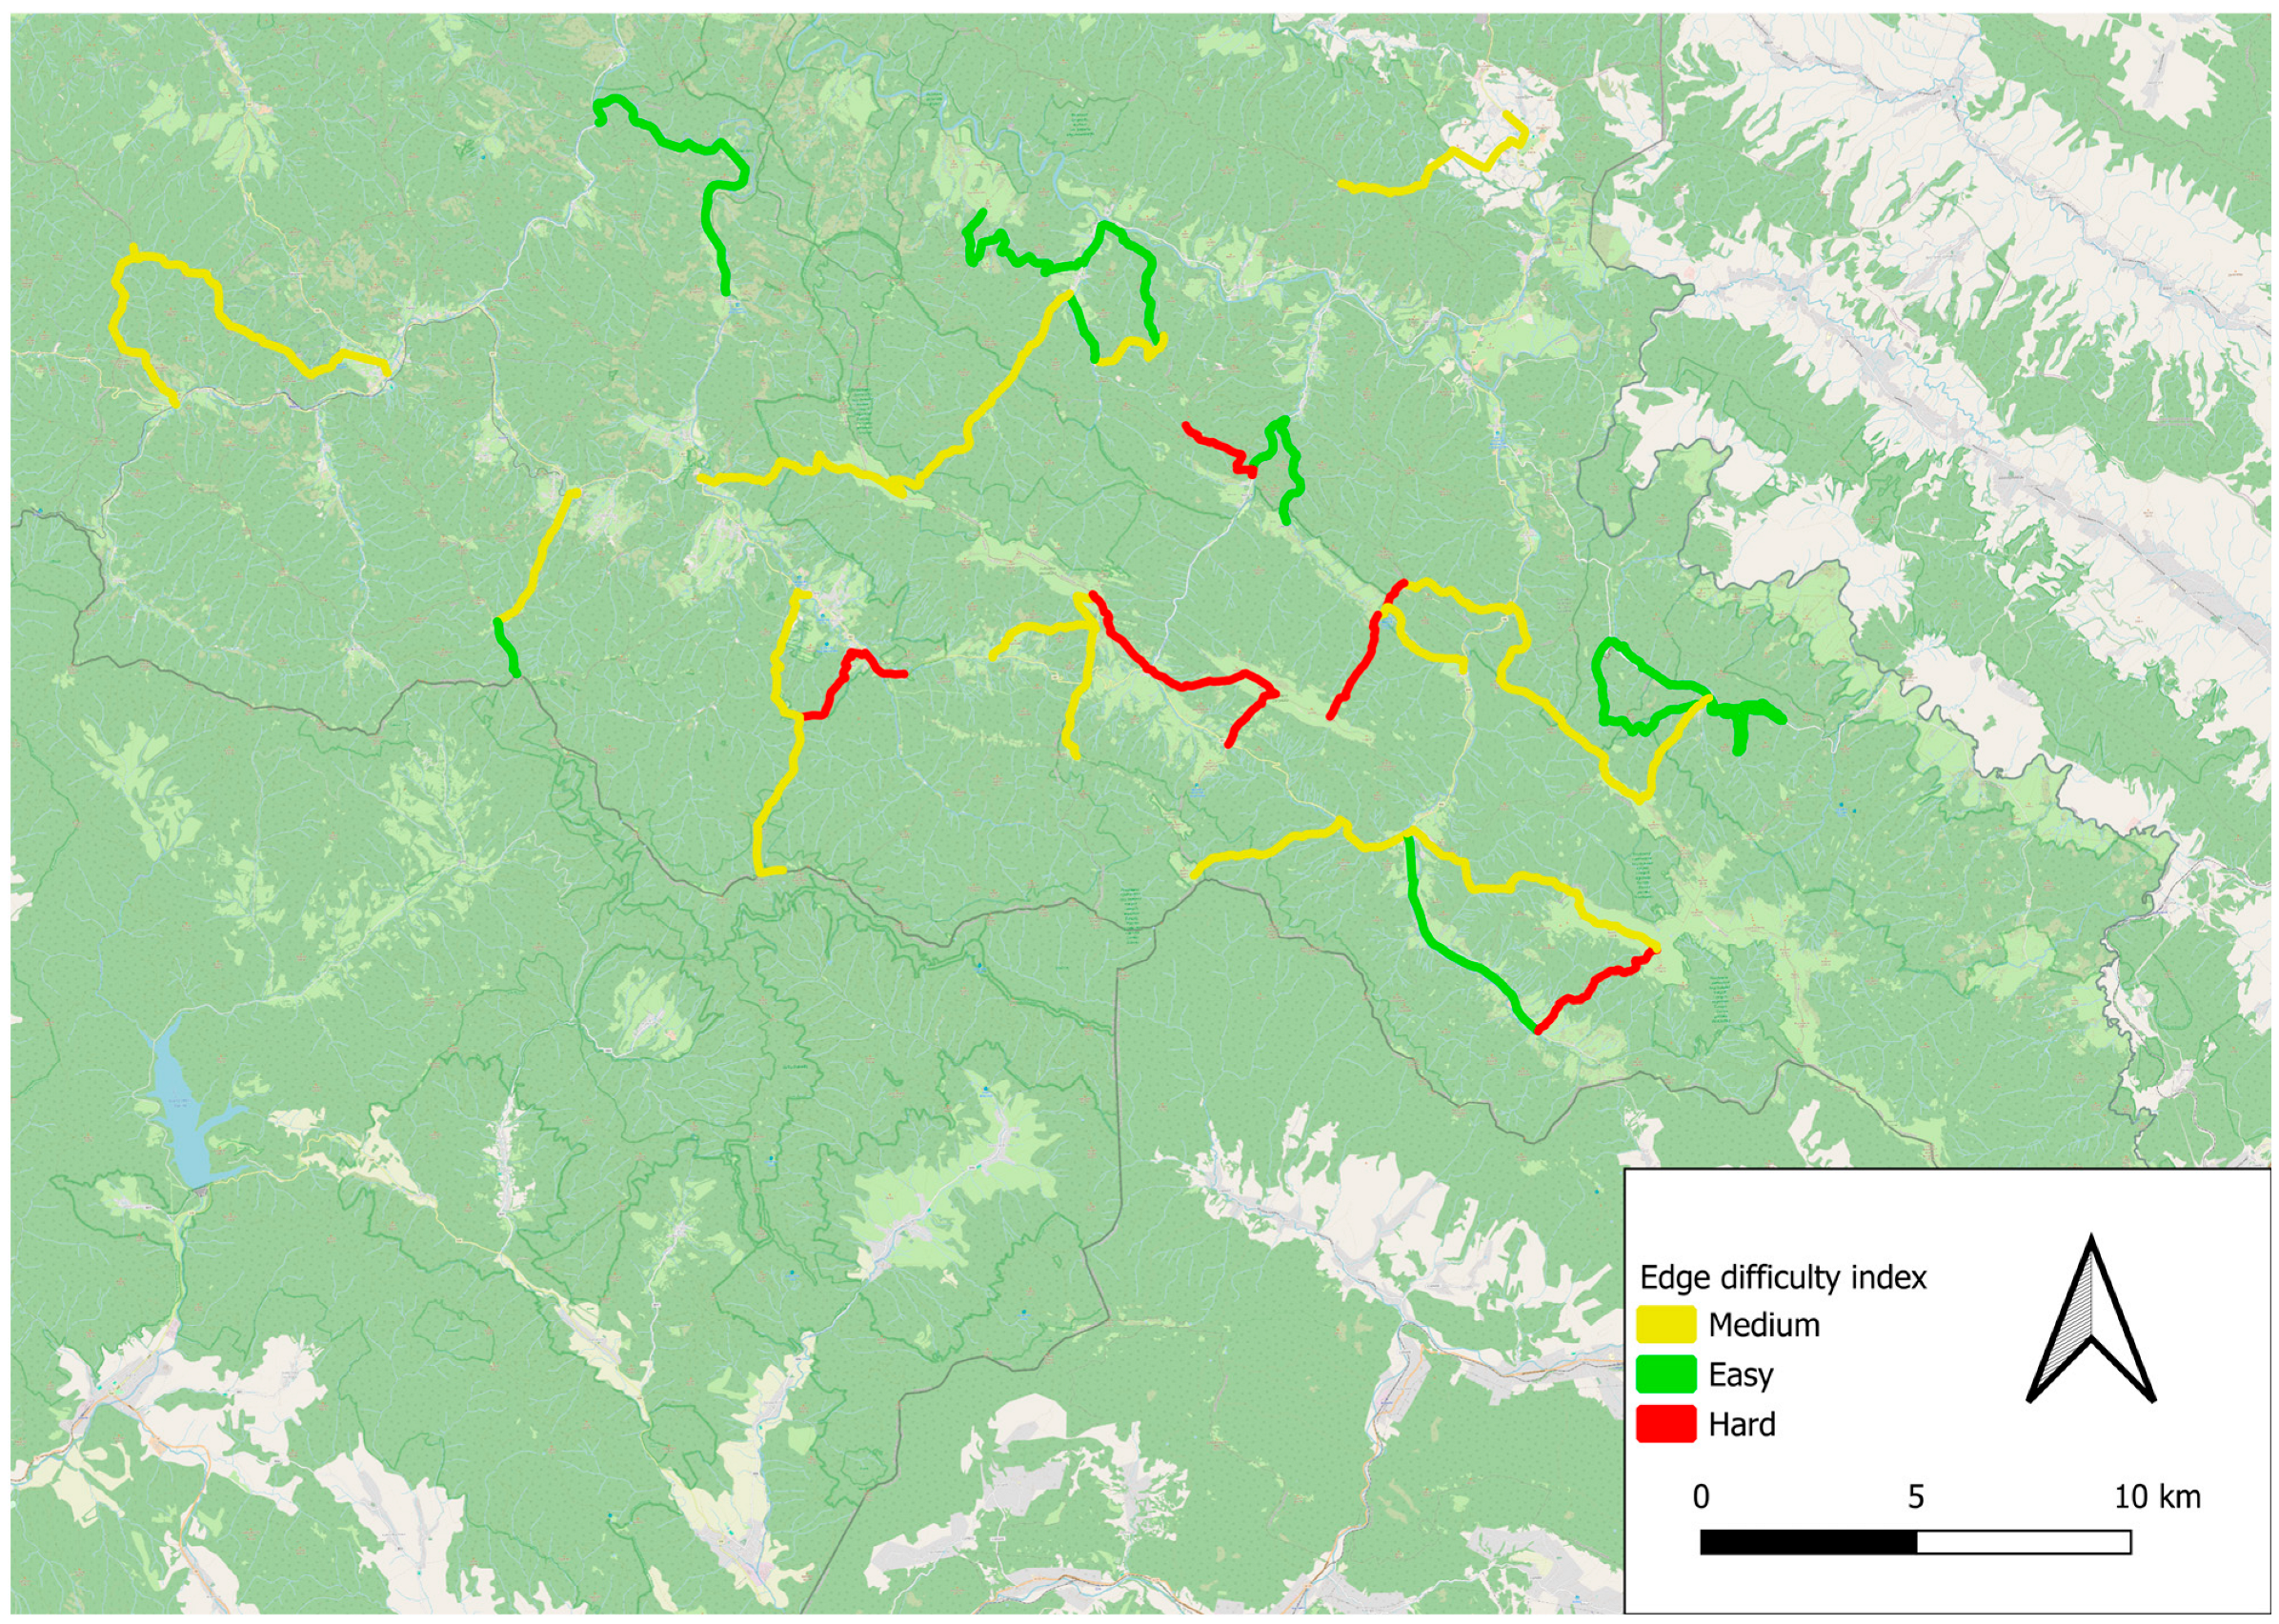
was performed in accordance with formula (7). The spatial distribution of trail difficulty in the analyzed area is presented in
Figure 8.
Based on the normalized EDI index, each edge was assigned to one of three difficulty classes. The aggregate results of this classification are presented in
Table 7.
Over half of the available routes (78.0 km) were qualified as routes of medium difficulty level. This is a result reflecting the specific morphology of the Bieszczady, characterized by long, gentle ridges and valleys. For the user of the electric Specialized Off-Road Wheelchair, this means that most trips will require moderate attention while steering but will not involve extreme concentration and inconveniences.
A significant share of easy routes (47.5 km, 11 edges) indicates the region’s high inclusive potential for beginners. These routes, located mainly in river valleys (e.g., the San valley, the Wetlinka valley), constitute a safe base for learning to operate the Specialized Off-Road Wheelchair. Their low EDI index suggests minimal battery consumption, which allows for longer trips without the risk of energy deficit.
The hard category, comprising 9 edges with a total length of 27.7 km, constitutes the smallest, but strategically significant part of the network. These are usually connector edges (connectors) leading to higher parts of the mountains or traversing steeper slopes.
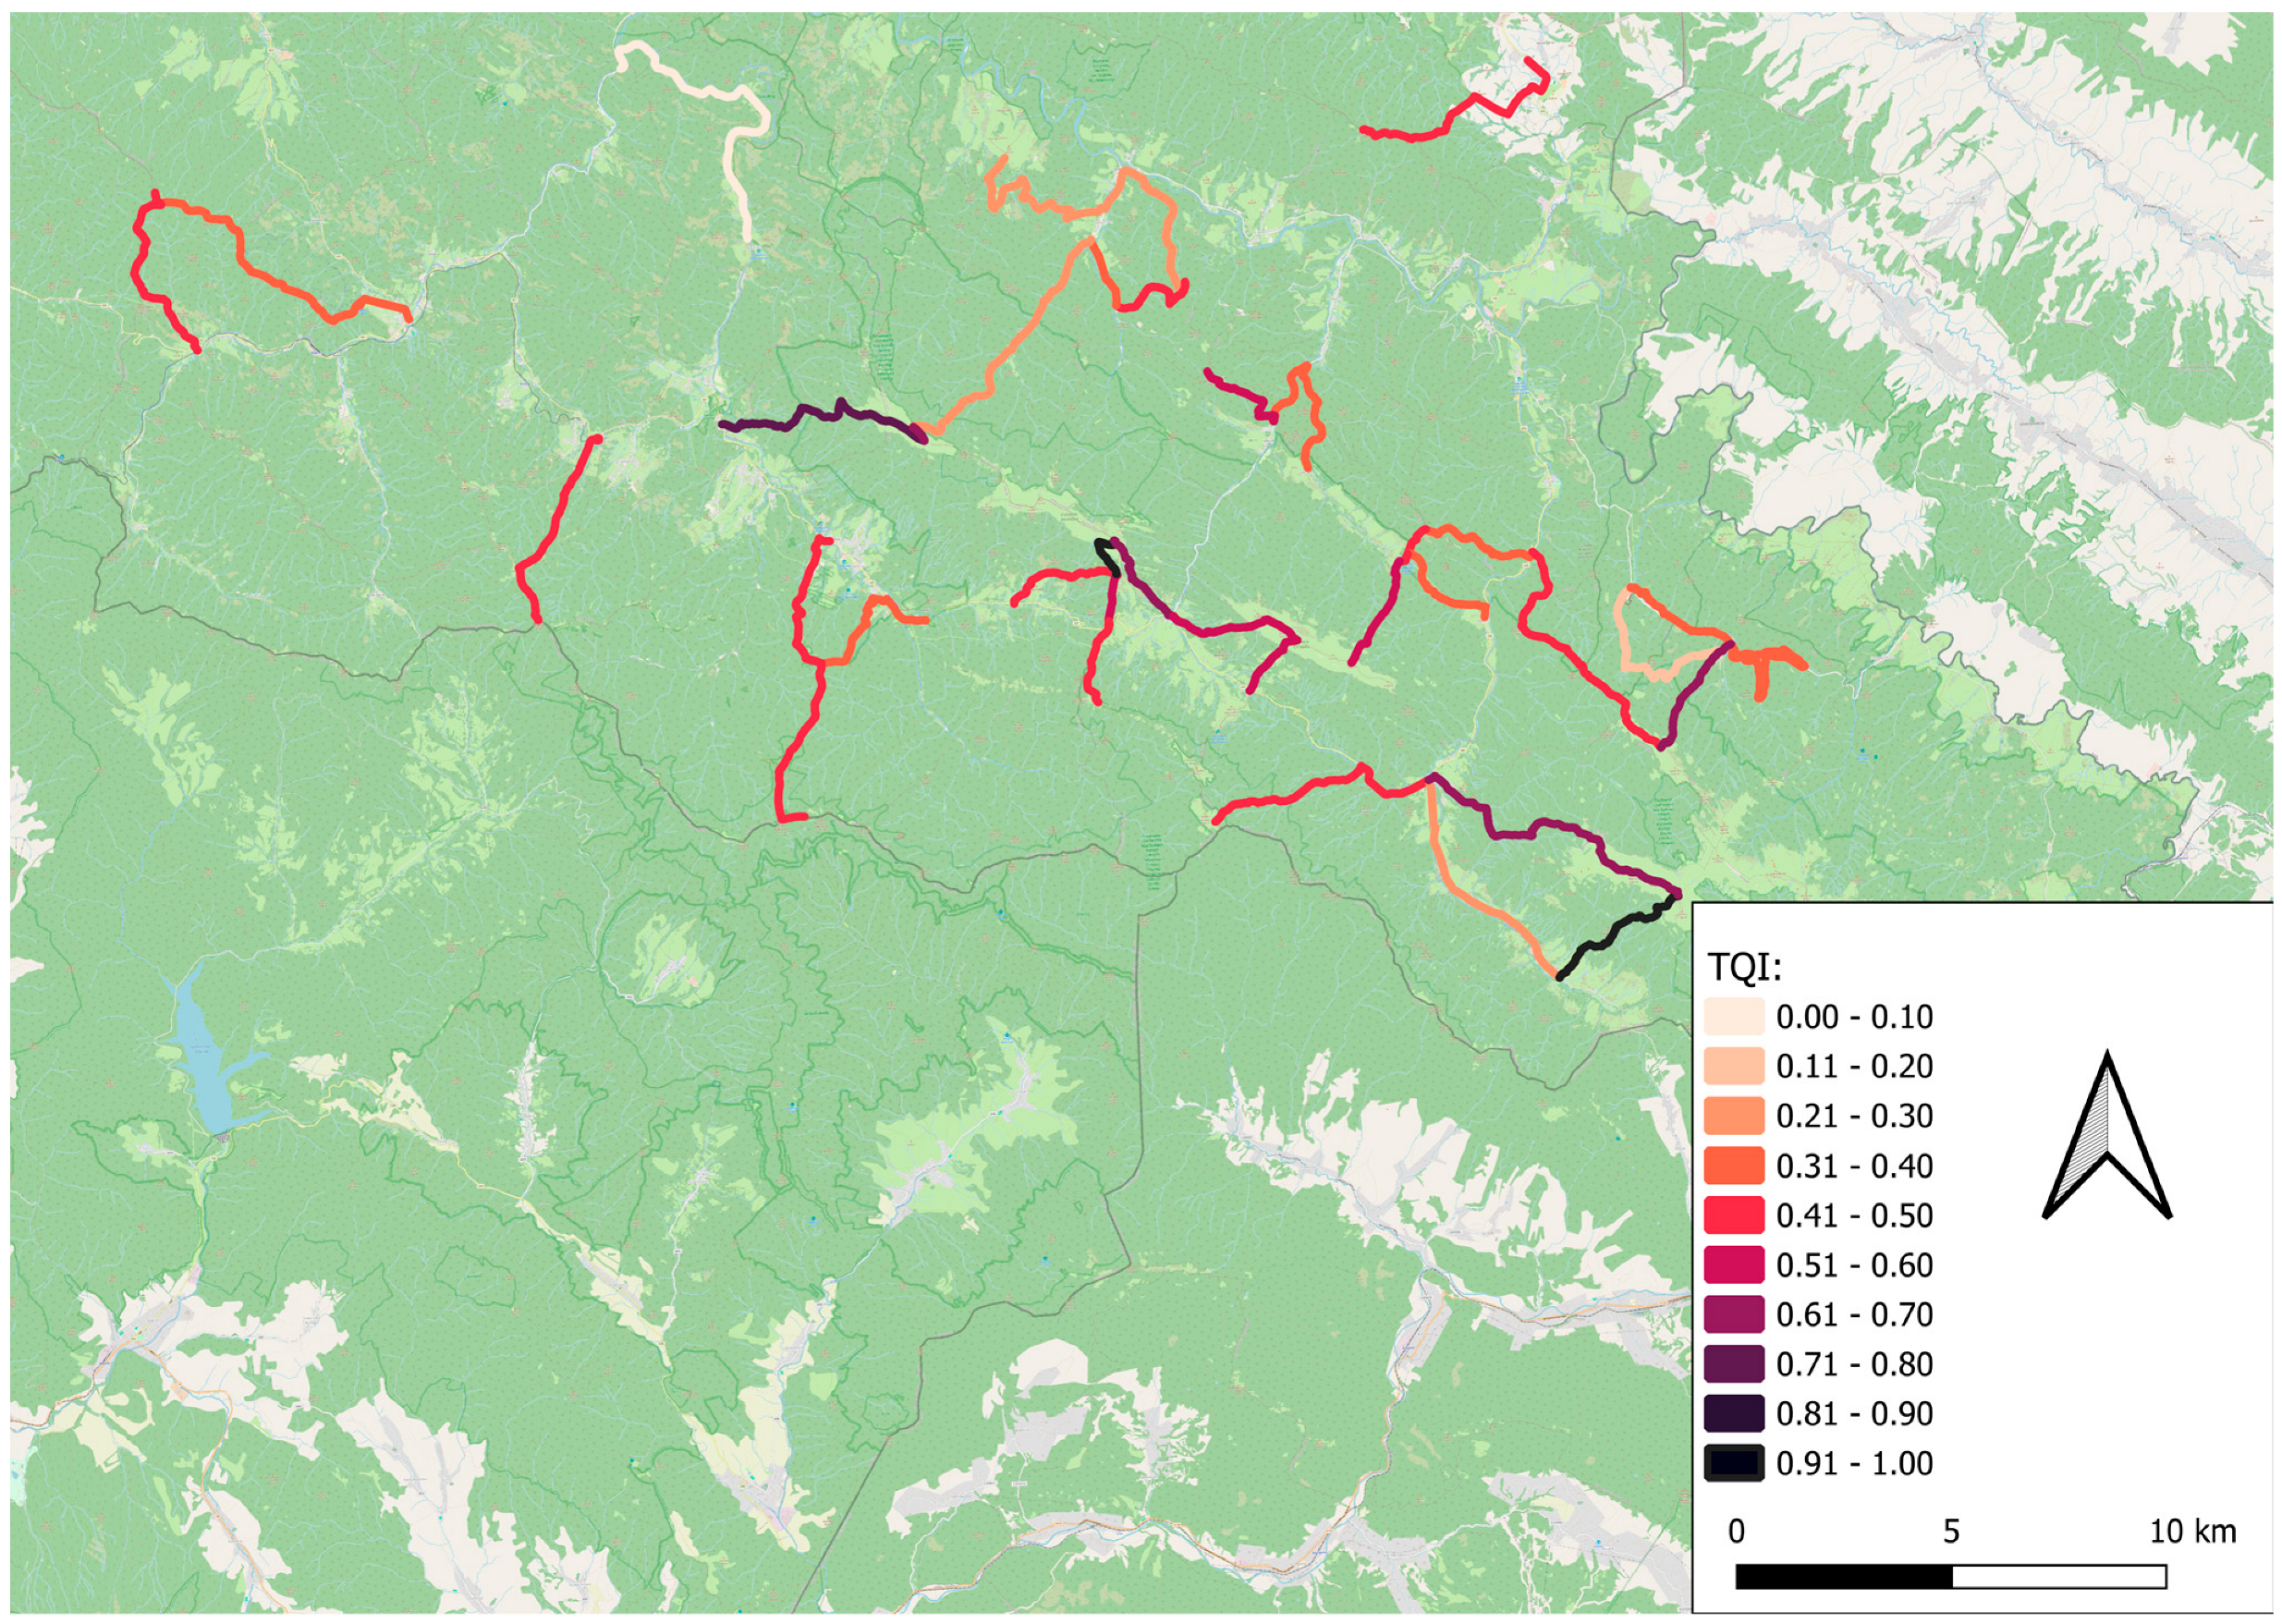
4.6. Tourist Quality Index—TQI
Based on the inventory of POI objects in the trail buffer, a normalized quality index was calculated for each edge of the available network
. The spatial distribution of trail quality is presented in
Figure 9.
Detailed quantitative results, aggregated to the quality standards defined in the methodology, are summarized in
Table 8. The aggregation of raw data allowed for a legible segmentation of the region’s tourism offer.
The most numerous groups consist of edges in the range 0.41–0.50 (13 edges) and 0.31–0.40 (8 edges). Together, they constitute nearly 47% of the length of the entire network. This indicates the homogeneous character of Bieszczady trails these are routes of a “sustainable standard,” offering basic facilities (benches, shelters), but devoid of excessive infrastructure. This result is consistent with the landscape protection policy in national parks.
Only 5.6% of the network (8.7 km) falls within the lowest range (0.0–0.1). The low number of routes of critically low quality testifies to the good state of tourism development in the region. The identified “Bronze” edges are mainly access and technical roads, which perform the function of connectors, rather than excursion destinations.
In the upper range of the histogram, we observe an interesting polarization phenomenon. A “gap” occurs in the 0.8–0.9 range, followed by a jump in the 0.91–1.00 range (2 edges). This testifies to the existence of a narrow group of “elite” routes (Gold Standard), which were intentionally designed as model routes (e.g., educational paths near large parking lots in Wołosate). They are clearly qualitatively separated from the rest of the network, constituting “flagships” of the region’s accessibility.
The correlation analysis between EDI and TQI suggests that the most visually attractive routes (high TQI) often coincide with the most demanding terrain (high EDI). This finding highlights a fundamental conflict in inclusive tourism: the “best” trails are often the least accessible. This necessitates the use of multi-criteria optimization to find a balance between effort and reward for the end-user.
4.7. Hub Optimization
In the final stage, the value of the objective Function
was calculated for each of the 10 qualified nodes, taking into account the difficulty diversity factor
. In
Table 9, the ranking list of individual start nodes is presented.
The undisputed leader of the ranking is node Ustrzyki Górne (ID 2), achieving a point score of 13.88. It is the only location in the analyzed area that obtained a diversity factor . This means that only from this point does the user have direct access to the full spectrum of routes: easy (for beginners), medium, and hard. The high final value results from the synergy of high mileage availability (23.62 km) and offer completeness, which makes Ustrzyki Górne an ideal location for the main rental base (Master Hub). Particular attention is drawn to the case of node Muczne (ID 1). This location offers the greatest total length of routes in the entire listing (25.08 km), surpassing in this respect even the victorious Ustrzyki Górne.
4.8. Validation and Method Stability
To verify the robustness and practical superiority of the developed approach, a dual-track validation and comparative benchmark analysis were conducted. First, the proposed high-resolution micro-segmentation method was compared against the standard ‘Average Slope Method’ (ASM) frequently cited in literature [
65,
66]. While the ASM, operating on 50-m segments, identified the entire test network as ‘accessible’ (average slopes < 25%), our method detected 14 critical micro-barriers (e.g., local erosion gaps and steep peaks) that exceeded the safety threshold. This proves that traditional methods provide a false sense of safety through data averaging.
Second, the model’s predictive accuracy was empirically validated through field trials during the ‘Mountains without Barriers’ project. The prototype Specialized Off-Road Wheelchair navigated the routes flagged by the algorithm. The field tests confirmed a 100% correlation between the model’s predicted micro-barriers and the actual terrain challenges encountered. Furthermore, stress-testing the algorithm with varying input parameters (e.g., changing slope limits from 15% to 30%) confirmed that the methodological logic remains computationally stable across different vehicle profiles. This comprehensive validation demonstrates that the method is not only mathematically robust but significantly safer and more reliable than existing theoretical models.
5. Discussion
The conducted research on tourism accessibility of the Western Bieszczady, based on dedicated GIS methodology and parameters of the Specialized Off-Road Wheelchair, leads to several key observations that shed new light on the issue of inclusivity in protected areas.
The primary objective of this study was to bridge the accessibility gap in mountainous terrains by developing a robust GIS-based methodology for locating Specialized Off-Road Wheelchair rental hubs. By addressing the core research problem how to effectively identify hidden terrain barriers and where to optimally position infrastructure to maximize inclusive tourism the proposed model successfully achieved a paradigm shift from standard urban accessibility to the ‘Wilderness Last Mile’. Specifically, the micro-segmentation approach proved capable of filtering out critical terrain traps that traditional average-slope methods fail to detect, transforming raw topographic data into a safe tourism product.
Furthermore, it is essential to contextualize these findings within the broader landscape of smart tourism and accessibility studies. The vast majority of the existing literature in this field predominantly focuses on urban environments, analyzing paved infrastructure, public transport nodes, and architectural barriers (e.g., dropped curbs, indoor navigation). While these models successfully route wheelchair users through smart cities, they often fall short in off-road, natural contexts where micro-topography heavily dictates traversability. Compared to traditional accessibility studies, our research pioneers a systemic approach for unstructured environments. It demonstrates that with appropriate high-resolution spatial analysis, protected mountain areas can be systematically integrated into the accessible smart mobility chain.
5.1. The Illusion of Accessibility vs. Operational Safety
The most important result of the analysis is the drastic reduction of the available trail network after applying technical filters. From the initial 338.5 km of trails, as much as 54.7% (185.2 km) was classified as inaccessible. This result exposes the “illusion of accessibility” created by standard tourist maps, which do not differentiate trails in terms of micro-slopes. For a user of a wheelchair with limiting parameters (max slope 25%), relying on average data could lead to critical situations. Our method showed that many edges with an acceptable average slope (of the order of 14–15%) contain local extremes exceeding 40–50%, which constitutes an impassable barrier. This confirms the necessity of applying high-granularity analyses (10-m segments) in accessible tourism planning.
5.2. Characteristics of the Tourism Offer (“Silver Standard”)
The analysis of the TQI index (
Figure 7 and tabular data) showed that the Bieszczady offer has a “Silver Standard” character—trails of moderate quality (TQI 0.3-0.7) dominate, constituting over 70% of the network. Referring to the quality distribution histogram, we observe a distribution close to normal with a distinct peak in the 0.41–0.50 range (13 edges). This testifies to the fact that the Bieszczady—unlike heavily urbanized Alpine resorts—maintain a balance between accessibility and wildness. The lack of dominance of the “Gold” category should not be interpreted as a defect, but as a specific feature of nature tourism, where excessive infrastructural “concretosis” is inadvisable. At the same time, the negligible percentage of routes of critically low quality (Bronze 0.0-0.1 is only 1 edge) proves that basic infrastructure (benches, shelters) is evenly distributed.
5.3. Research Limitations
The main limitation of the presented approach is basing the analysis solely on static data. The Digital Elevation Model does not account for variable weather conditions (mud, snow), which can drastically change traction on dirt surface trails. The EDI index, based on slope, is therefore an “optimistic” estimate (for dry conditions). Further research works should consider integration with real-time meteorological data, which would allow for dynamic changing of route difficulty classification (e.g., change from Medium to Hard after rainfall).
Furthermore, it is important to critically acknowledge certain methodological assumptions underlying the current model. First, the accuracy of the micro-slope analysis is inherently dependent on the resolution and quality of the underlying Digital Elevation Model (DEM). Potential DEM artifacts or interpolation errors may occasionally result in false positive or false negative barrier identifications. Second, the current analytical framework assumes static terrain conditions, not accounting for dynamic variables (e.g., mud, snow, or heavy rain), which can drastically alter traction and safety thresholds for off-road wheelchairs. Finally, while the initial validation of the 25% limiting slope criterion was reliably based on the technical specifications and preliminary testing of the Specialized Off-Road Wheelchair prototype developed in the “Mountains without Barriers” project, comprehensive empirical validation across a wider variety of real-world terrains and diverse user profiles remains a critical next step. Future research will focus on extensive field testing to continuously calibrate the Difficulty (EDI) and Tourism Quality (TQI) indices based on real user feedback.
While the analytical logic of the method is presented as fully reproducible and universal, its empirical outcomes in this study are tied to a specific case study in a mountainous region in SE Poland. The elements of the methodology that are truly generalizable include graph-based topological transformation, the micro-segmentation approach for slope analysis, and the mathematical criterion for hub-location optimization. However, several variables remain context dependent. Beyond the previously mentioned static DEM and weather conditions, the current model does not fully account for micro-scale surface types (e.g., deep mud, loose rocks, or protruding roots), which are critical for off-road traction. Furthermore, the model currently lacks demand-side data integration, such as tourism seasonality, expected user volume, or likely trip lengths. Consequently, adapting this method to other geographic contexts will require the local calibration of these environmental and behavioral constraints.