
Assaying Traffic Settings with Connected and Automated Mobility Channeled into Road Intersection Design


Abstract
Highlights
- Integrating road intersection geometric design with smart vehicle technologies enhances the benefits of well-designed road infrastructure, optimizing traffic efficiency as the prevalence of smart vehicles continues to rise.
- Traffic settings involving connected and automated vehicles (CAVs) can inform the design of road intersections within the context of smart cities, using microsimulation to analyze performance in mixed urban traffic environments.
- Support the development of expertise in the comparative analysis of the performance of alternative intersection designs that incorporate smart vehicle technologies.
- The microsimulation-driven framework underlines the importance of effective calibration to promote the development of evaluation methodologies for intersection designs and smart mobility integration in city planning.
Abstract
1. Introduction
- To what extent can the calibration process of Aimsun’s parameters replicate simulated data that align with the reference capacity functions (RCFs) for a given road entity?
- What is the impact of the geometric and functional design of intersections, along with traffic control modes, on the expected operational performance of CAVs as their market entry rates (MERs) vary?
- Is it feasible to develop a performance criterion that enables the comparison of alternative geometric designs of intersections based on the analogy of entry mechanisms?
2. Materials and Methods
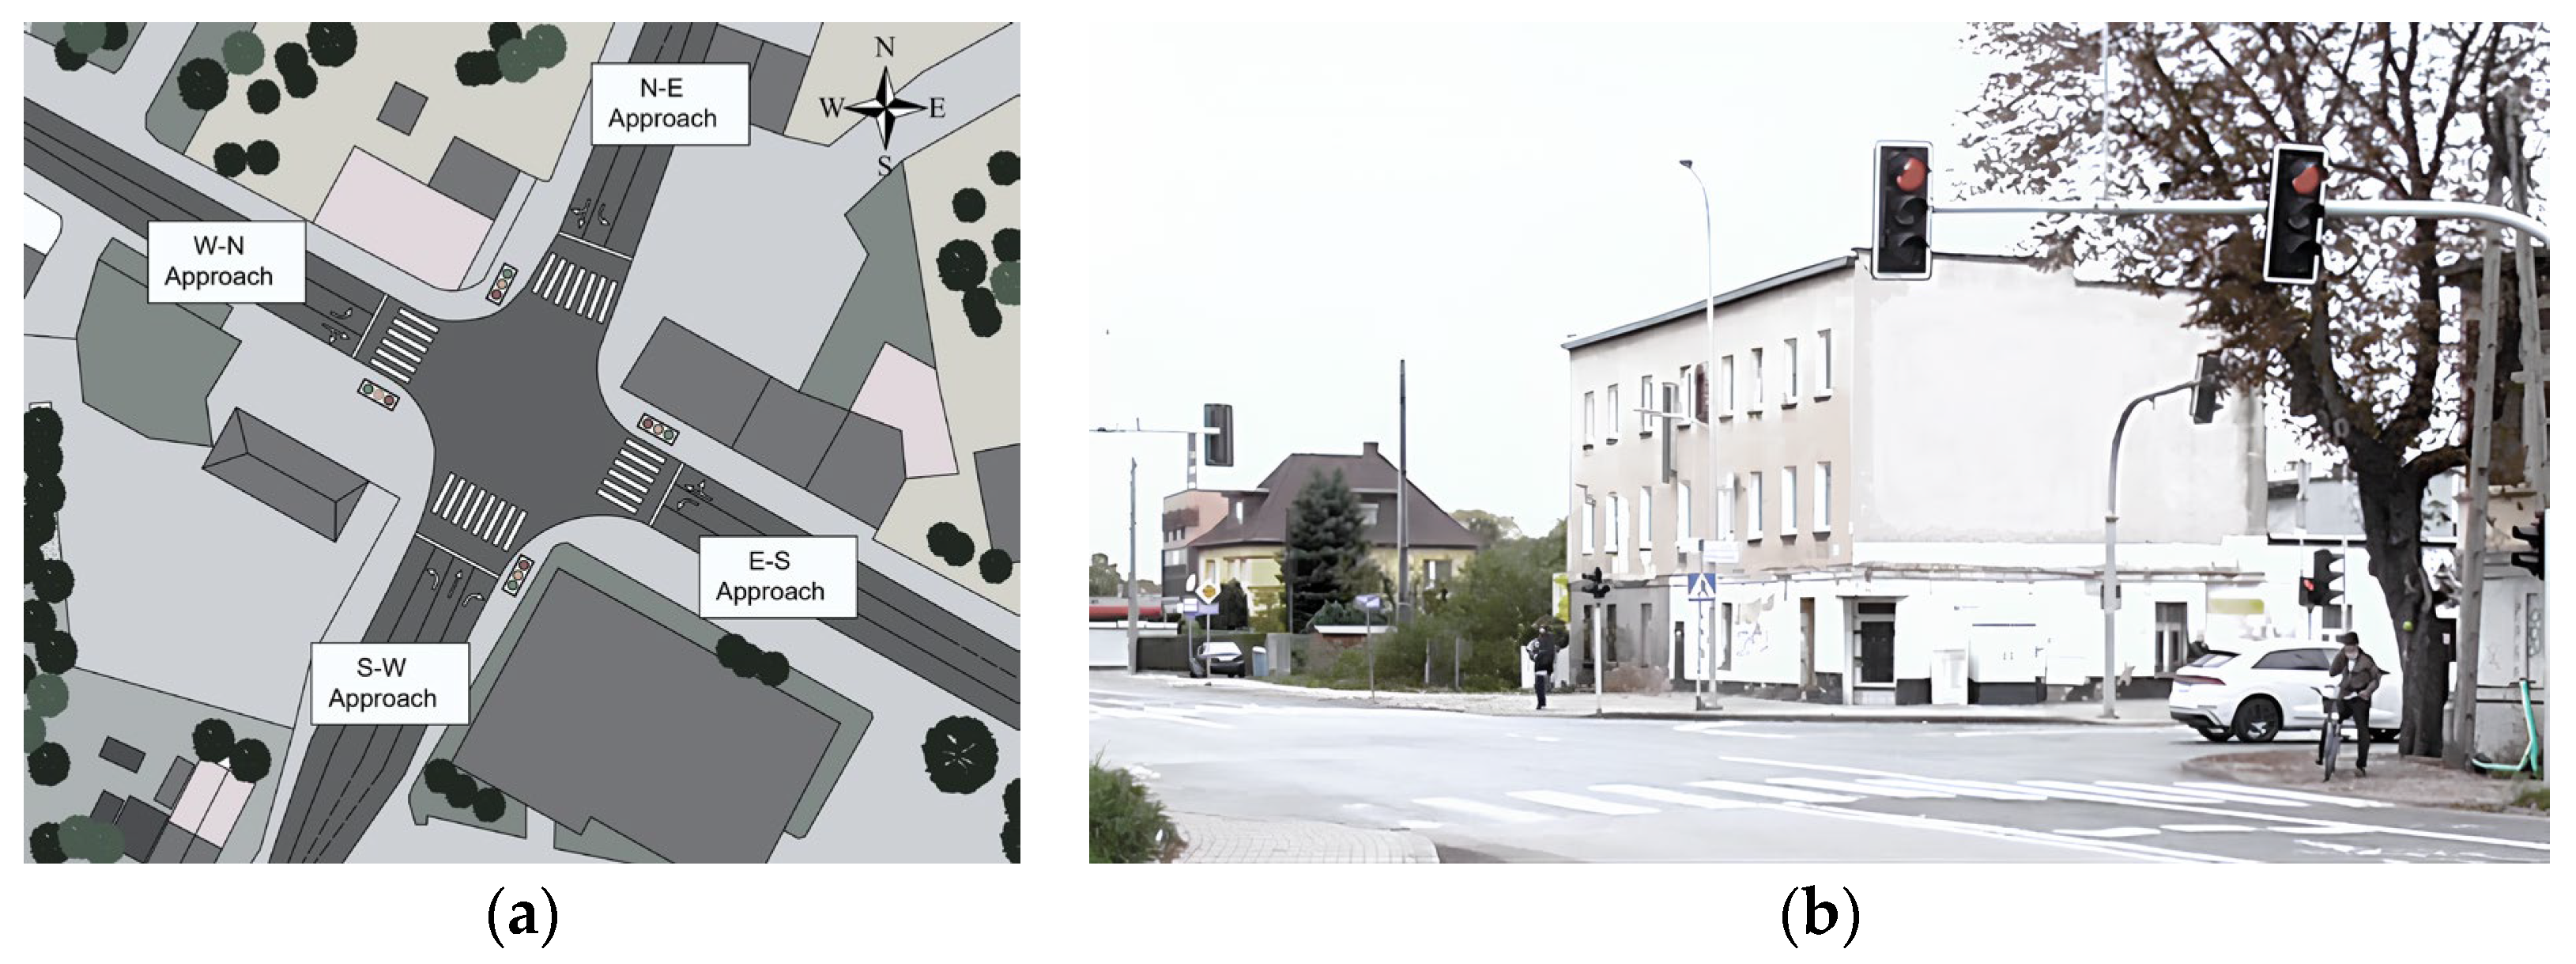
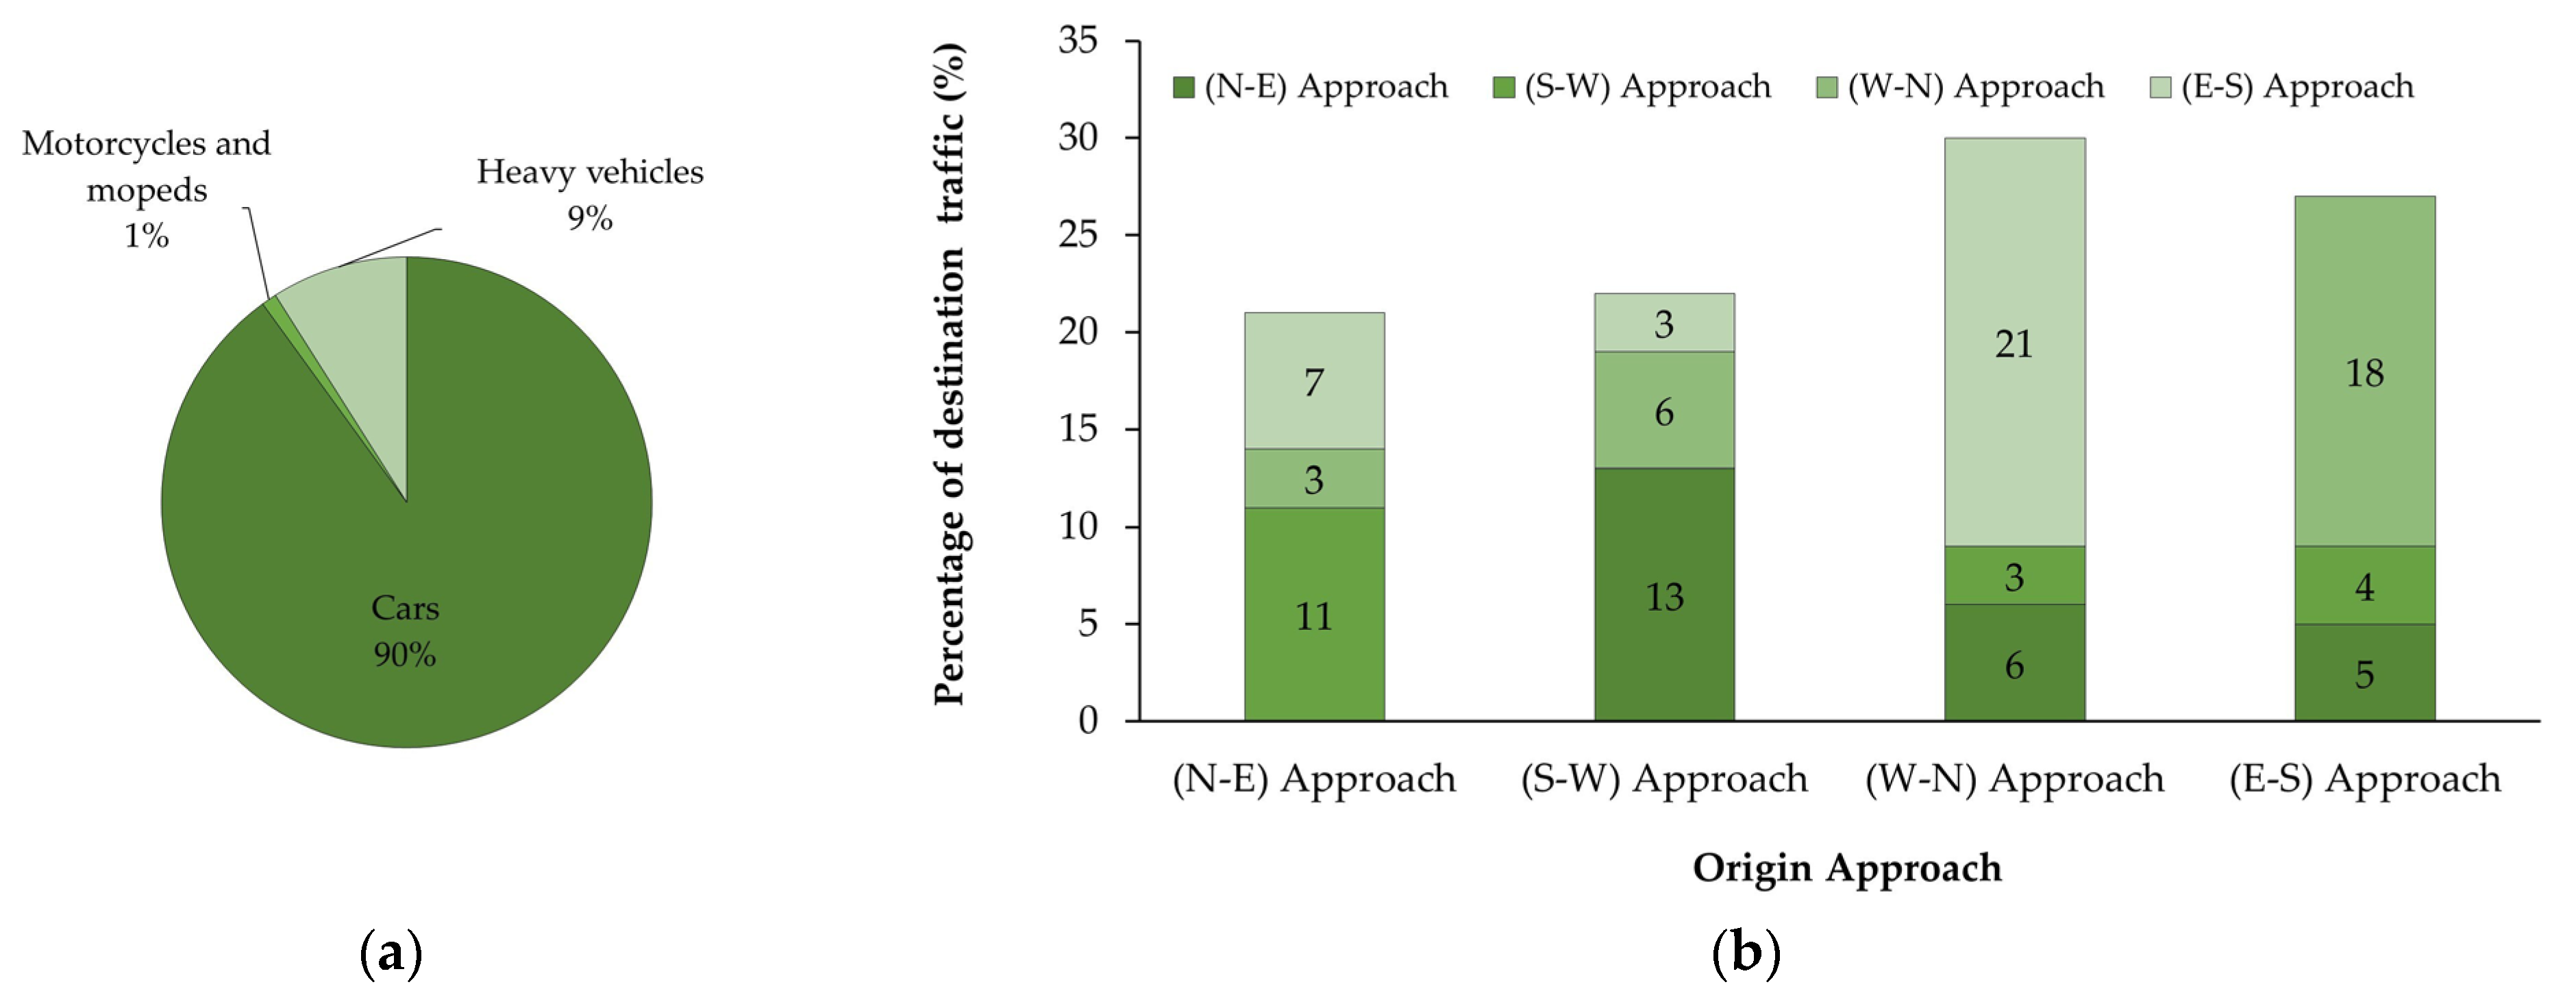
2.1. Case Study Description
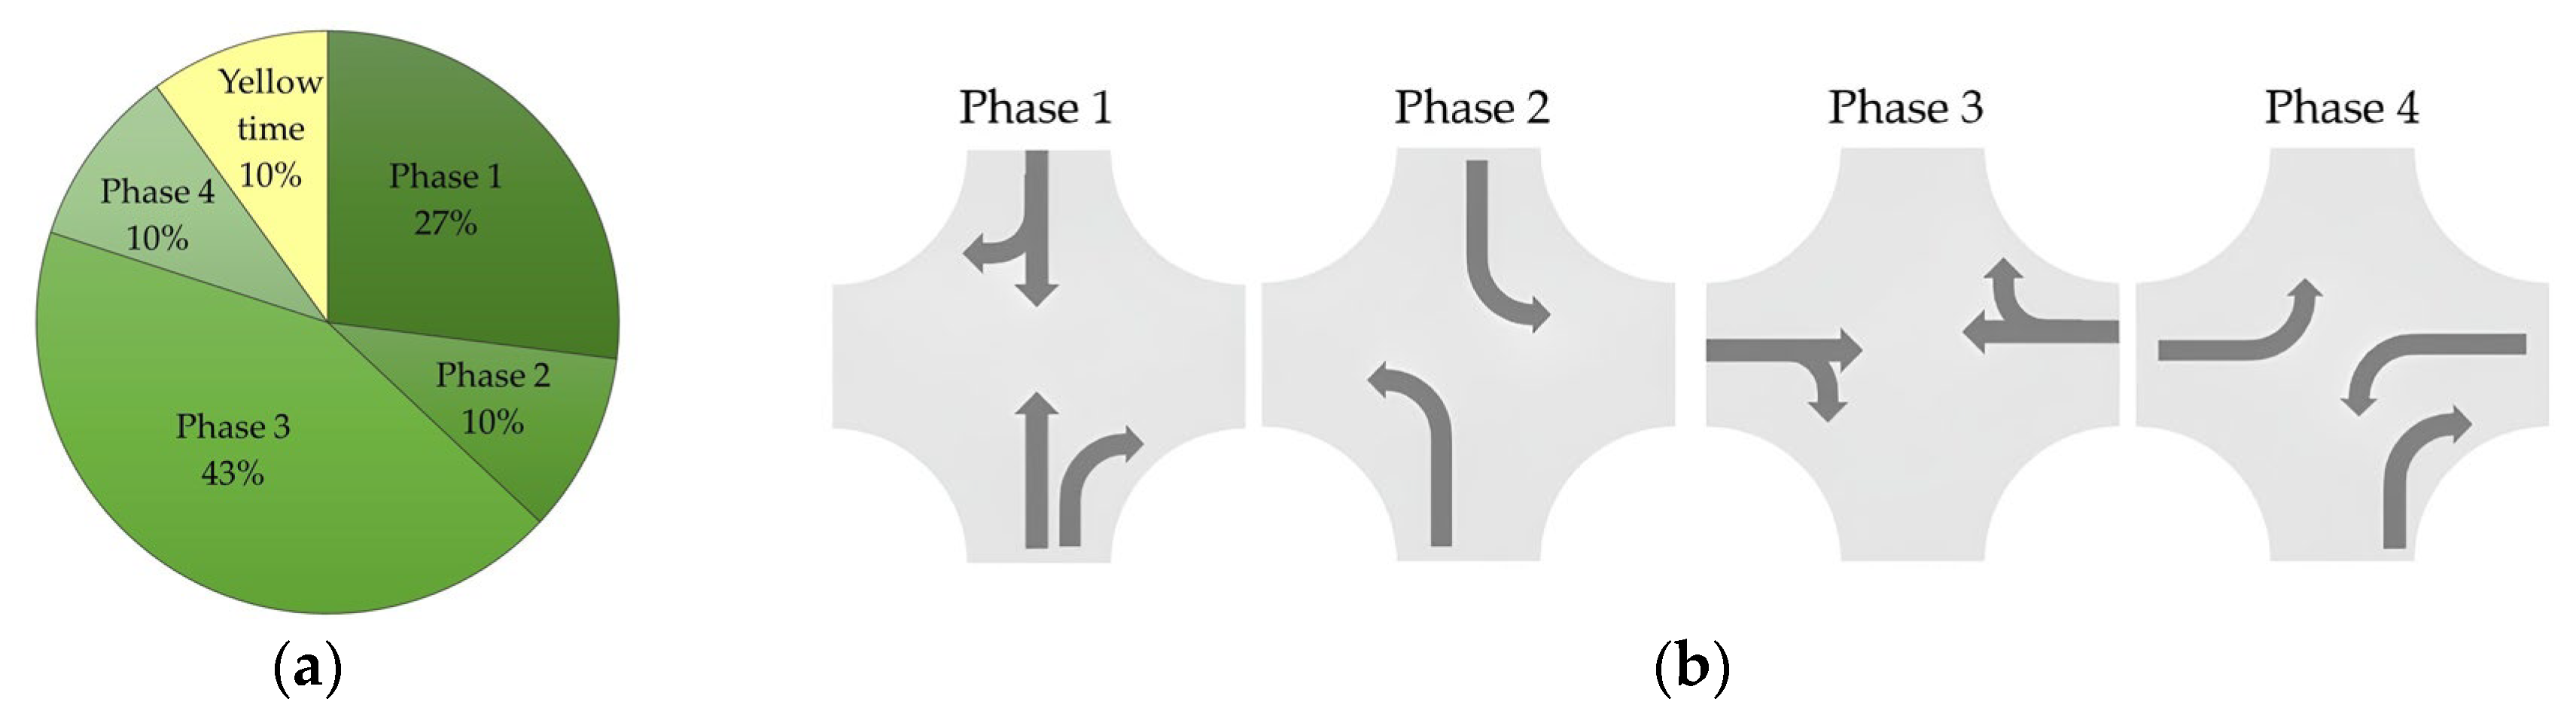
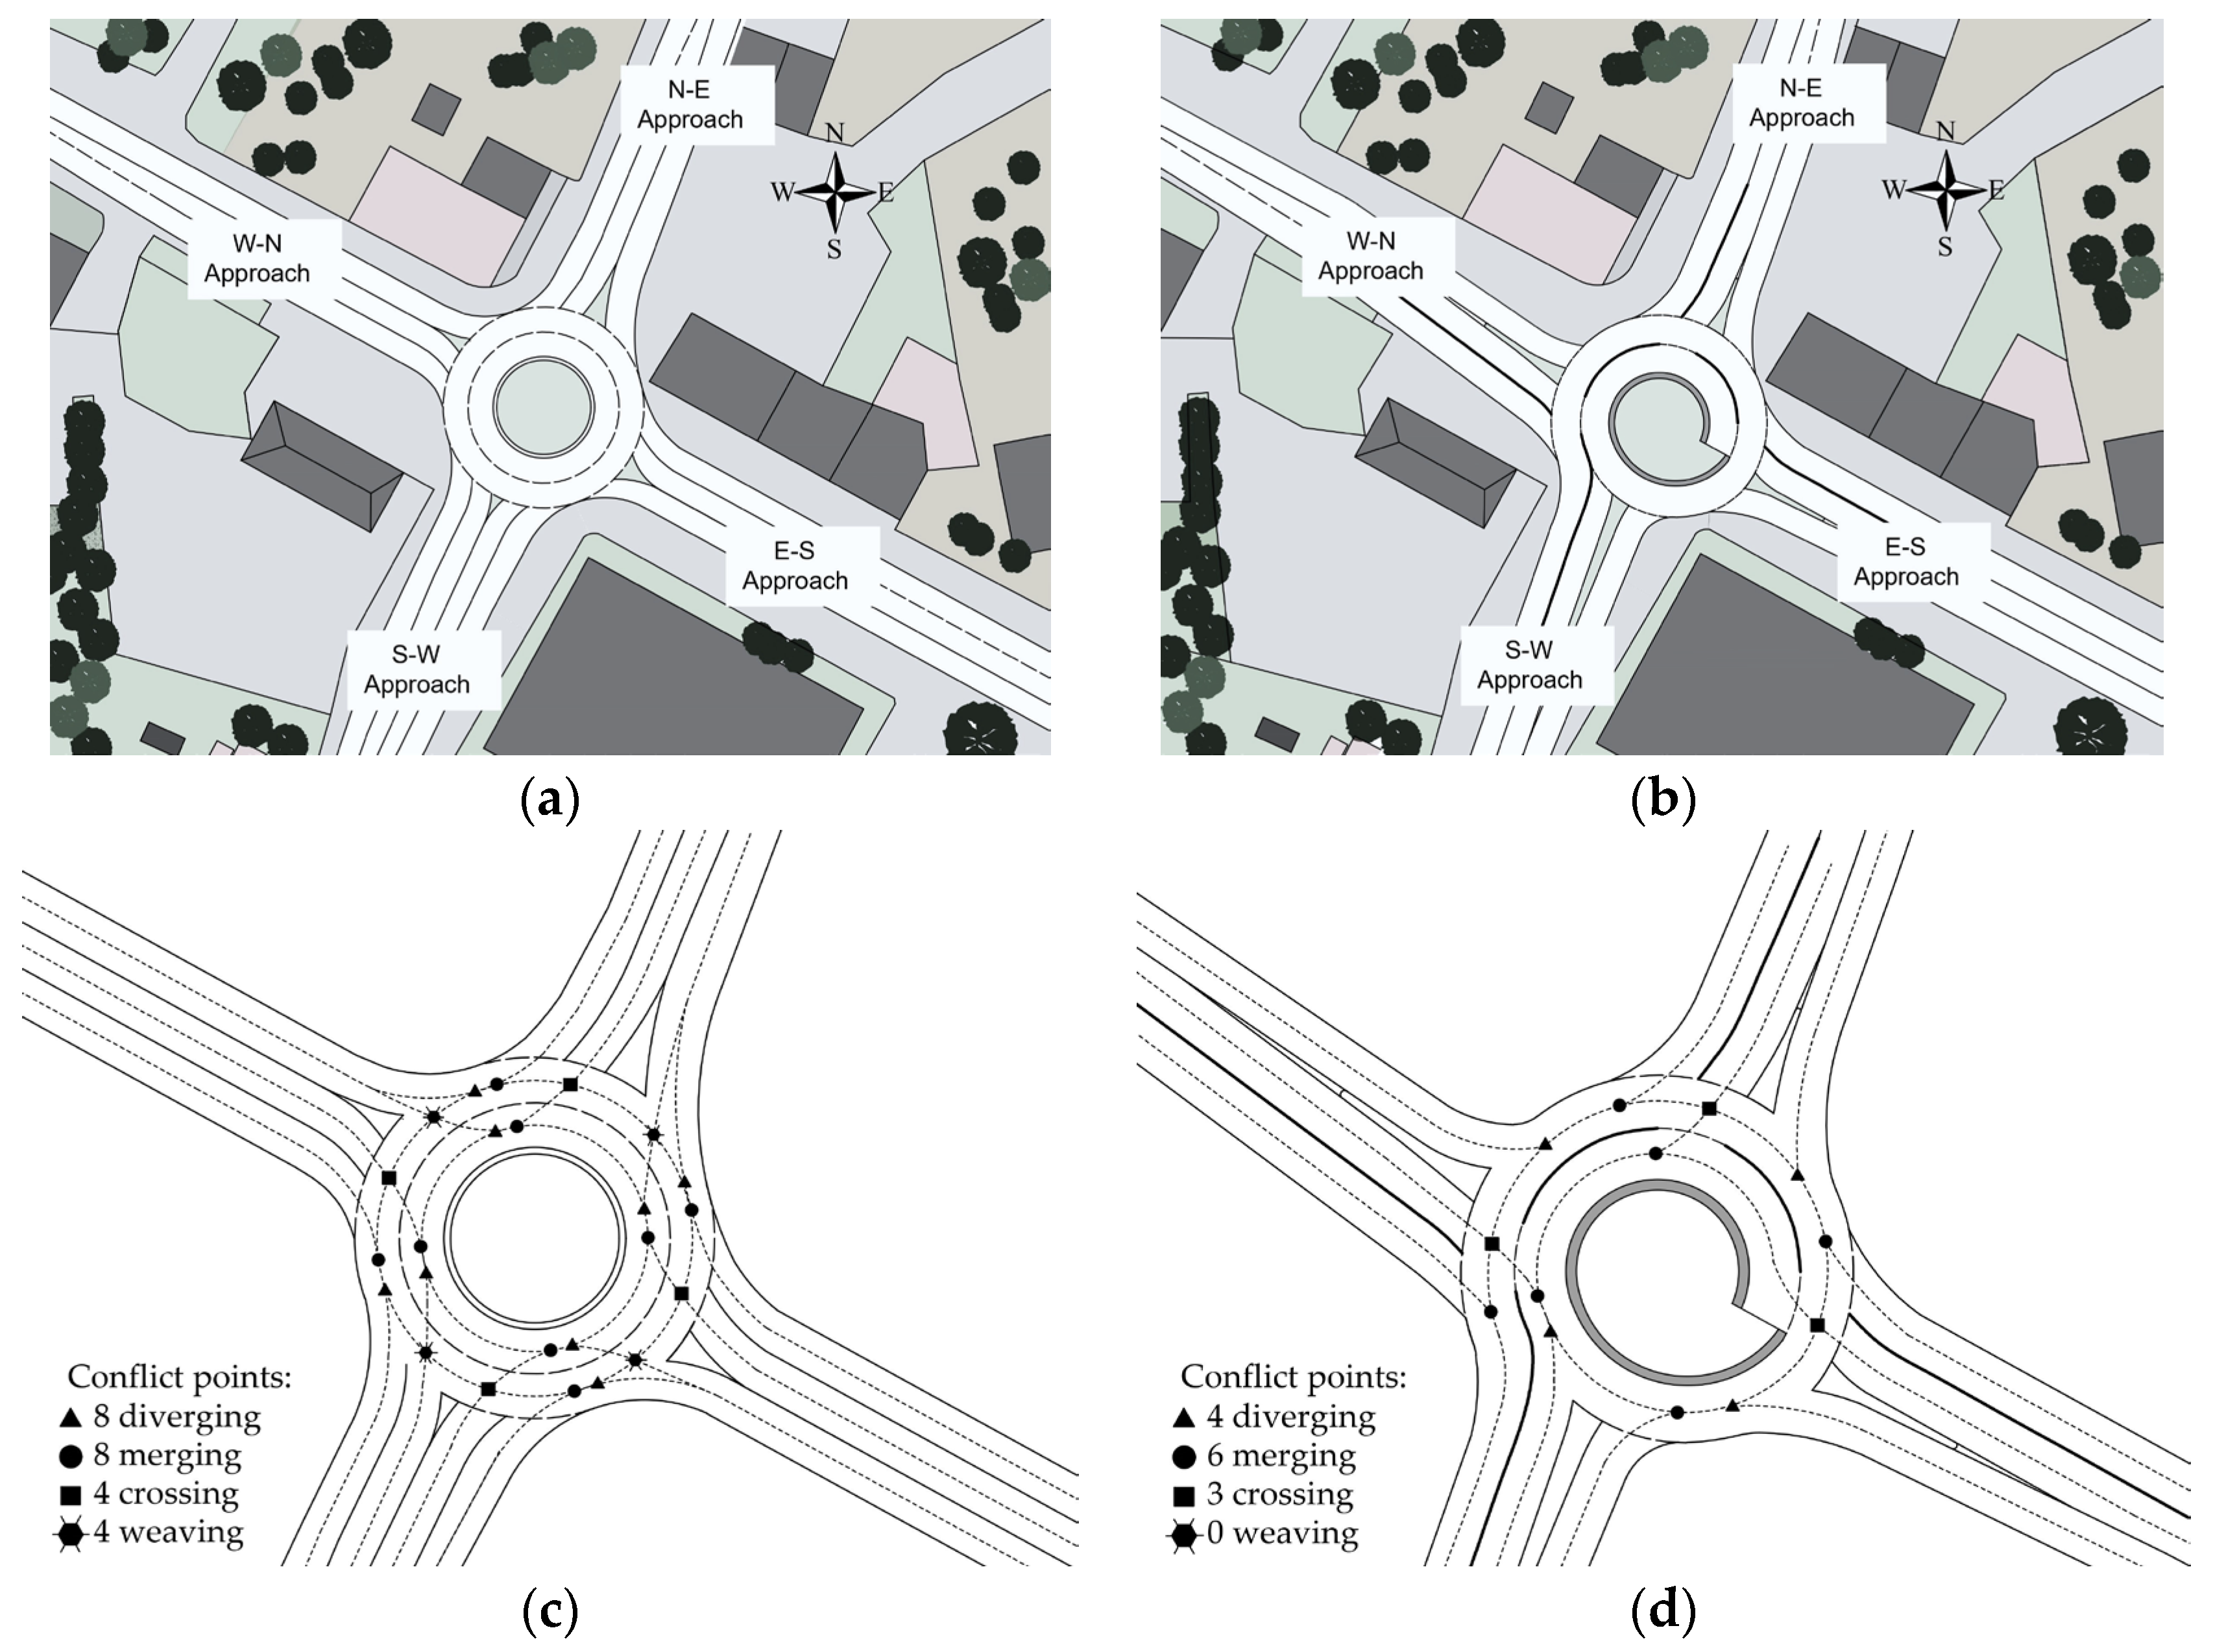
2.2. Intersection Operation Analysis
2.3. Modeling Intersection Case Studies in AIMSUN to Evaluate the Validation-Driven Approach
3. Results of the Simulation Experiments
4. Discussion
5. Conclusions
Author Contributions
Funding
Data Availability Statement
Acknowledgments
Conflicts of Interest
Abbreviations
| ITS | Intelligent Transport Systems |
| CAVs | Connected and Automated Vehicles |
| VHDs | Vehicles with Human Drivers |
| MERs | Market Entry Rates |
| CAV-MERs | Market Entry Rates for CAVs |
| RCFs | Reference Capacity Functions |
| CACC | Cooperative Adaptive Cruise Control |
| V2V | vehicle-to-vehicle |
| L | exclusive left-turn lane |
| R&T | shared right-turn and through lane |
| LEL | left entry lane |
| REL | right entry lane |
| N-E | north-east |
| E-S | east-south |
| S-W | south-west |
| W-N | west-north |
| CACC-CAVs | Connected and Automated Vehicles with the Cooperative Adaptive Cruise Control system |
| GEH | Geoffrey index |
| s.e. | standard error |
| RMSNE | root mean squared normalized error |
References
- Pompigna, A.; Mauro, R. Smart Roads: A State of the Art of Highways Innovations in the Smart Age. Eng. Sci. Technol. Int. J. 2022, 25, 100986. [Google Scholar] [CrossRef]
- Makridis, M.; Mattas, K.; Mogno, C.; Ciuffo, B.; Fontaras, G. The impact of automation and connectivity on traffic flow and CO2 emissions: A detailed microsimulation study. Atmos. Environ. 2020, 226, 117399. [Google Scholar] [CrossRef]
- Matin, A.; Dia, H. Impacts of connected and automated vehicles on road safety and efficiency: A systematic literature review. IEEE Trans. Intell. Transp. Syst. 2023, 24, 2705–2736. [Google Scholar] [CrossRef]
- SAE International. SAE J3016 Automated-Driving Graphic. Available online: https://www.sae.org/news/2019/01/sae-updates-j3016-automated-driving-graphic (accessed on 30 March 2025).
- Malik, S.; Khan, M.A.; El-Sayed, H.; Khan, M.J. Should Autonomous Vehicles Collaborate in a Complex Urban Environment or Not? Smart Cities 2023, 6, 2447–2483. [Google Scholar] [CrossRef]
- Sadaf, M.; Iqbal, Z.; Javed, A.R.; Saba, I.; Krichen, M.; Majeed, S.; Raza, A. Connected and Automated Vehicles: Infrastructure, Applications, Security, Critical Challenges, and Future Aspects. Technologies 2023, 11, 117. [Google Scholar] [CrossRef]
- Ni, D. Signalized Intersections, 1st ed.; Springer: Cham, Swizerland, 2020; p. XV, 335. [Google Scholar] [CrossRef]
- Tahiri, M.A.; Rachid, A.; Boudmane, B.; Mortabit, I.; Laaroussi, S. Toward Cooperative Adaptive Cruise Control: A Mini-review. In Proceedings of the International Conference on Circuit, Systems and Communication (ICCSC), Fes, Morocco, 28–29 June 2024; pp. 1–6. [Google Scholar] [CrossRef]
- Xu, L.; Ma, J.; Zhang, S.; Wang, Y. Car following models for alleviating the degeneration of CACC function of CAVs in weak platoon intensity. Transp. Lett. 2023, 16, 599–611. [Google Scholar] [CrossRef]
- Karbasi, A.; O’Hern, S. Investigating the Impact of Connected and Automated Vehicles on Signalized and Unsignalized Intersections Safety in Mixed Traffic. Future Transp. 2022, 2, 24–40. [Google Scholar] [CrossRef]
- Tumminello, M.L.; Macioszek, E.; Granà, A.; Giuffrè, T. Simulation-Based Analysis of “What-If” Scenarios with Connected and Automated Vehicles Navigating Roundabouts. Sensors 2022, 22, 6670. [Google Scholar] [CrossRef]
- National Academies of Sciences, Engineering, and Medicine. Guide for Roundabouts; The National Academies Press: Washington, DC, USA, 2023. [Google Scholar] [CrossRef]
- National Academies of Sciences, Engineering, and Medicine. Highway Capacity Manual: A Guide for Multimodal Mobility Analysis, 7th ed.; The National Academies Press: Washington, DC, USA, 2022. [Google Scholar] [CrossRef]
- Fortuijn, L.G. Turbo roundabouts: Design principles and safety performance. Transp. Res. Rec. 2009, 2096, 16–24. [Google Scholar] [CrossRef]
- Tollazzi, T. Alternative Types of Roundabouts at Development Phases. In Alternative Types of Roundabouts. Springer Tracts on Transportation and Traffic, 1st ed.; Springer: Cham, Swizerland, 2015; Volume 6, pp. 157–169. [Google Scholar] [CrossRef]
- Barceló, J. Fundamentals of Traffic Simulation, 1st ed.; Springer: New York, NY, USA, 2010; p. 442. [Google Scholar] [CrossRef]
- Aimsun Next. Version 20 Dynamic Simulator User Manual; TSS-Transport Simulation Systems: Barcelona, Spain, 2020. [Google Scholar]
- Ahmed, H.U.; Ahmad, S.; Yang, X.; Lu, P.; Huang, Y. Safety and Mobility Evaluation of Cumulative-Anticipative Car-Following Model for Connected Autonomous Vehicles. Smart Cities 2024, 7, 518–540. [Google Scholar] [CrossRef]
- Song, L.; Fan, W.; Liu, P. Exploring the effects of connected and automated vehicles at fixed and actuated signalized intersections with different market penetration rates. Transp. Plan. Technol. 2021, 44, 577–593. [Google Scholar] [CrossRef]
- Hajbabaie, A.; Tajalli, M.; Bardaka, E. Effects of connectivity and automation on saturation headway and capacity at signalized intersections. Transp. Res. Rec. 2023, 2678, 31–46. [Google Scholar] [CrossRef]
- Jiang, Y.; Cong, H.; Chen, H.; Yao, Z. Safety evaluation for mixed traffic flow of CAVs with different automation and connection levels. Expert. Syst. Appl. 2025, 261, 125561. [Google Scholar] [CrossRef]
- Tong, H.; Xu, C.; Ai, Q.; Ren, W.; Wang, C.; Peng, C.; Jiao, Y. Developing a jam-absorption strategy for mixed traffic flow at signalized intersections using deep reinforcement learning. Transp. Lett. 2024, 1–12. [Google Scholar] [CrossRef]
- Li, D.; Zhu, F.; Wu, J.; Wong, Y.D.; Chen, T. Managing mixed traffic at signalized intersections: An adaptive signal control and CAV coordination system based on deep reinforcement learning. Expert. Syst. Appl. 2024, 238 Pt C, 121959. [Google Scholar] [CrossRef]
- Mohebifard, R.; Hajbabaie, A. Trajectory control in roundabouts with a mixed fleet of automated and human-driven vehicles. Comput.-Aided Civ. Infrastruct. Eng. 2022, 37, 1959–1977. [Google Scholar] [CrossRef]
- Martin-Gasulla, M.; Elefteriadou, L. Traffic management with autonomous and connected vehicles at single-lane roundabouts. Transp. Res. C Emerg. Technol. 2021, 125, 102964. [Google Scholar] [CrossRef]
- Wu, Y.; Zhu, F. Junction management for connected and automated vehicles: Intersection or roundabout? Sustainability 2021, 13, 9482. [Google Scholar] [CrossRef]
- Turbo Roundabouts Informational Primer. FHWA Safety Program. In Federal Highway Administration; U.S. Department of Transportation: Washington, DC, USA, 2022. Available online: https://highways.dot.gov/sites/fhwa.dot.gov/files/2022-06/fhwasa20019_0.pdf (accessed on 20 March 2025).
- Gkyrtis, K.; Kokkalis, A. An overview of the efficiency of roundabouts: Design aspects and contribution toward safer vehicle movement. Vehicles 2024, 6, 433–449. [Google Scholar] [CrossRef]
- Ministry of Infrastructure. Guidelines for the design of road intersections. In Part 3: Roundabouts; WR-D-31-3; Ministry of Infrastructure: Warsaw, Poland, 2022. [Google Scholar]
- Garg, M.; Bouroche, M. Can Connected Autonomous Vehicles Improve Mixed Traffic Safety Without Compromising Efficiency in Realistic Scenarios? IEEE Trans. Intell. Transp. Syst. 2023, 24, 6674–6689. [Google Scholar] [CrossRef]
- Gipps, P.G. A Behavioural Car-Following Model for Computer Simulation. Transp. Res. Part B 1981, 15, 105–111. [Google Scholar] [CrossRef]
- Sadid, H.; Antoniou, C. Modelling and simulation of (connected) autonomous vehicles longitudinal driving behavior: A state-of-the-art. IET Intell. Transp. Syst. 2023, 17, 1050–1070. [Google Scholar] [CrossRef]
- Mauro, R.; Branco, F. Comparative analysis of compact multilane roundabouts and turbo-roundabouts. J. Transp. Eng. 2010, 136, 316–322. [Google Scholar] [CrossRef]
- Emami, A.; Sarvi, M.; Asadi Bagloee, S. A review of the critical elements and development of real-world connected vehicle testbeds around the world. Transp. Lett. 2020, 14, 49–74. [Google Scholar] [CrossRef]
- PTV Planung Transport Verkehr AG. PTV VISSIM User Manual; PTV Planung Transport Verkehr AG: Karlsruhe, Germany, 2017. [Google Scholar]


| Intersection Type | Capacity Formula | Parameters Description | |
|---|---|---|---|
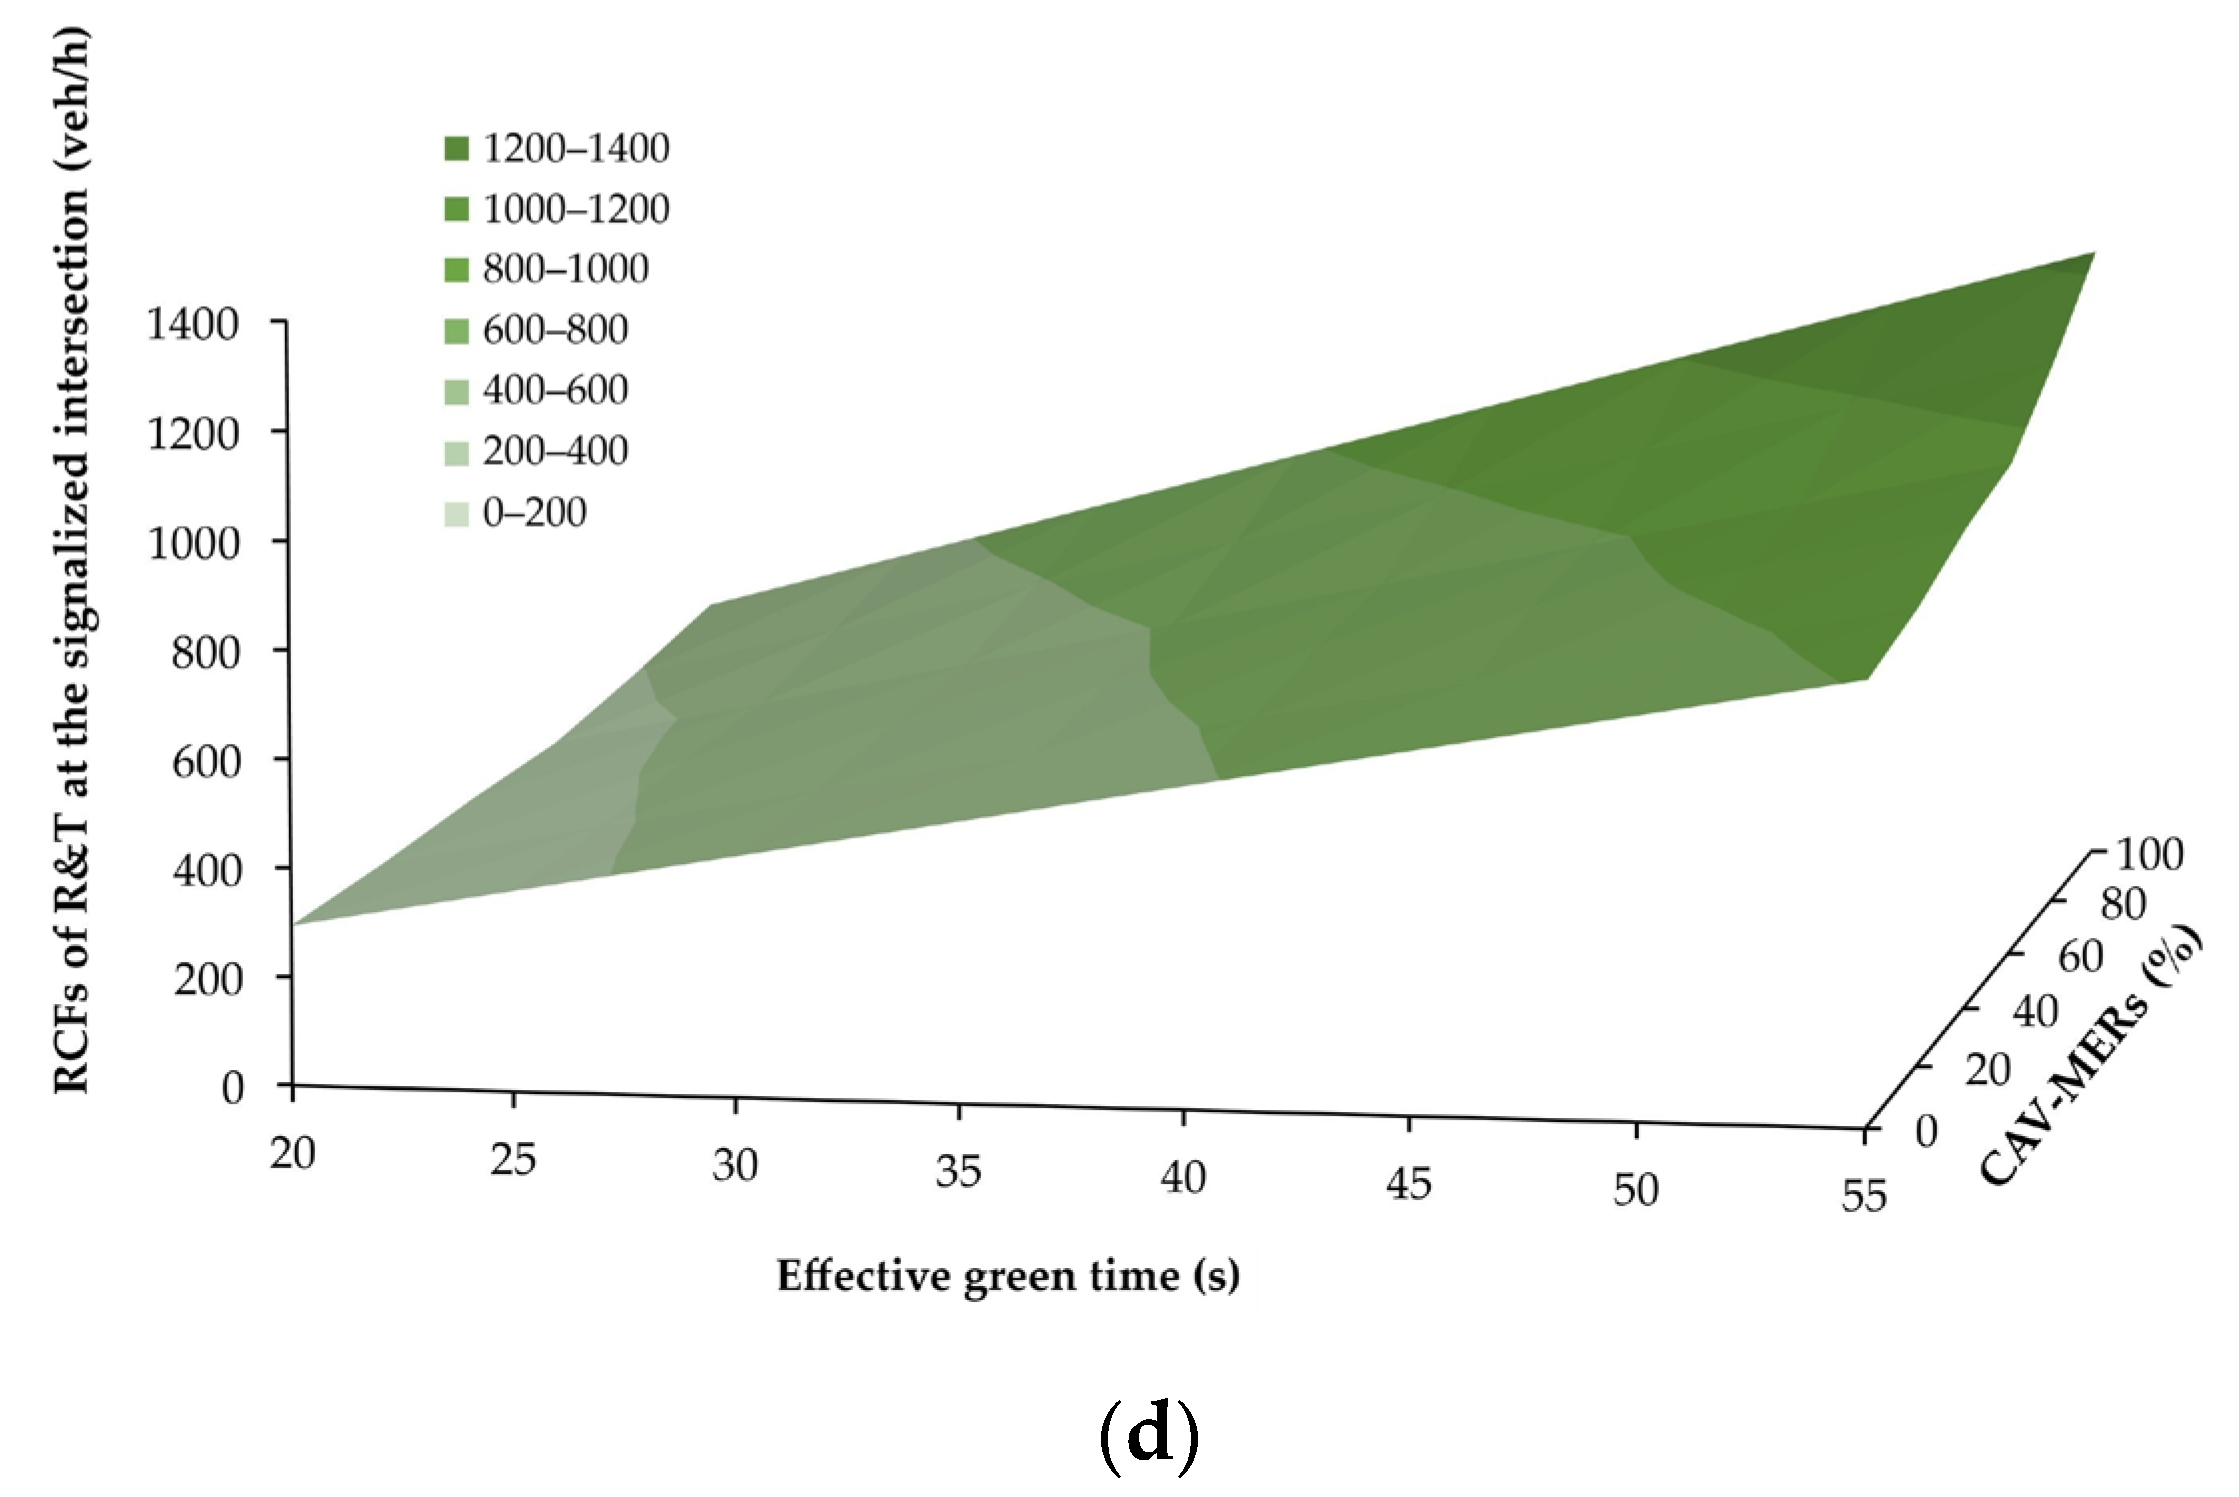
| Signalized intersection | CCAVs: entry capacity (veh/h); G: the effective green time (s); Nl is the number of lanes in a lane group; Sfr,CAVs: the saturation flow rate (veh/h/ln); and c: the total cycle length (s). | (1) | |
| Sfr,CAVs: the saturation flow rate (veh/h/ln); Sb: the base saturation flow rate (veh/h/ln); fi: the correction factors. | (2) | ||
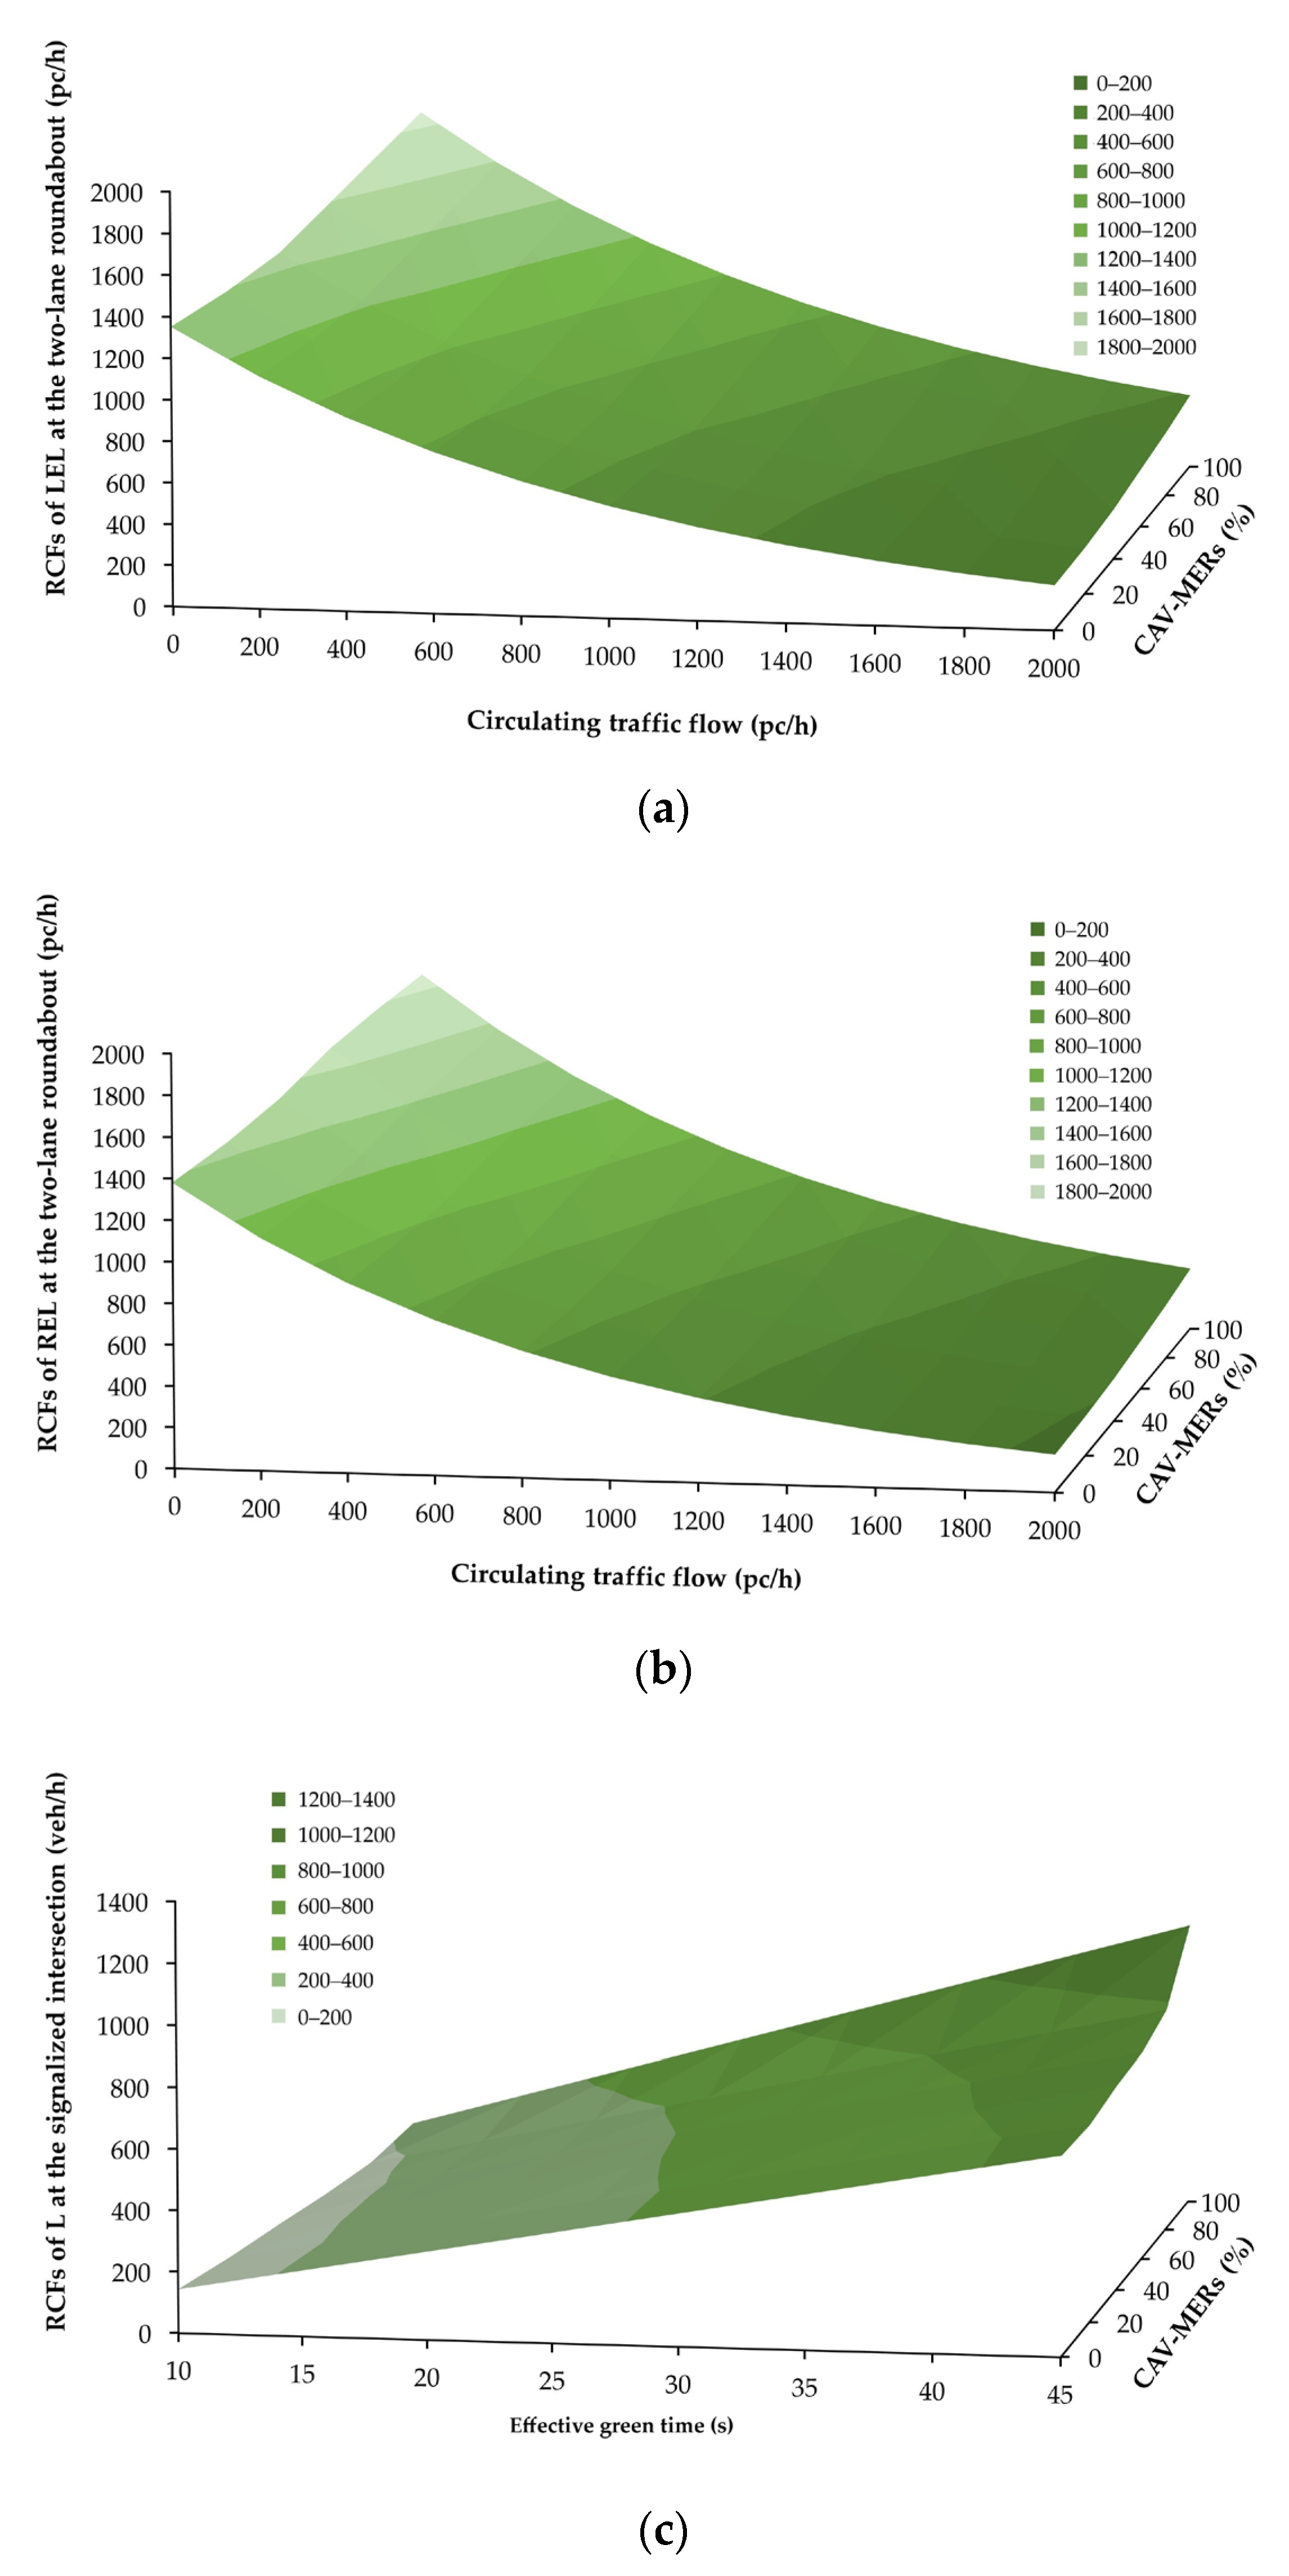
| Roundabout | Ce,CAVs: CAVs’ capacity (pc/h); Qc: circulating flow rate (pc/h); a: intercept parameter (equal to 1380 pc/h for the right entry lane; 1350 pc/h for the left entry lane); b: slope parameter (equal to 0.00102 and 0.00092 for the right and left entry lanes, respectively); and f(a) and f(b): correction factors for the parameters a and b, respectively [13]. | (3) |
| Model Parameters | Default Values | Tuned-up Model Parameter Values | |||||||
|---|---|---|---|---|---|---|---|---|---|
| Signalized Intersection | Two-Lane Roundabout | ||||||||
| L | R&T | LEL | REL | ||||||
| VHDs | CAVs | VHDs | CAVs | VHDs | CAVs | VHDs | CAVs | ||
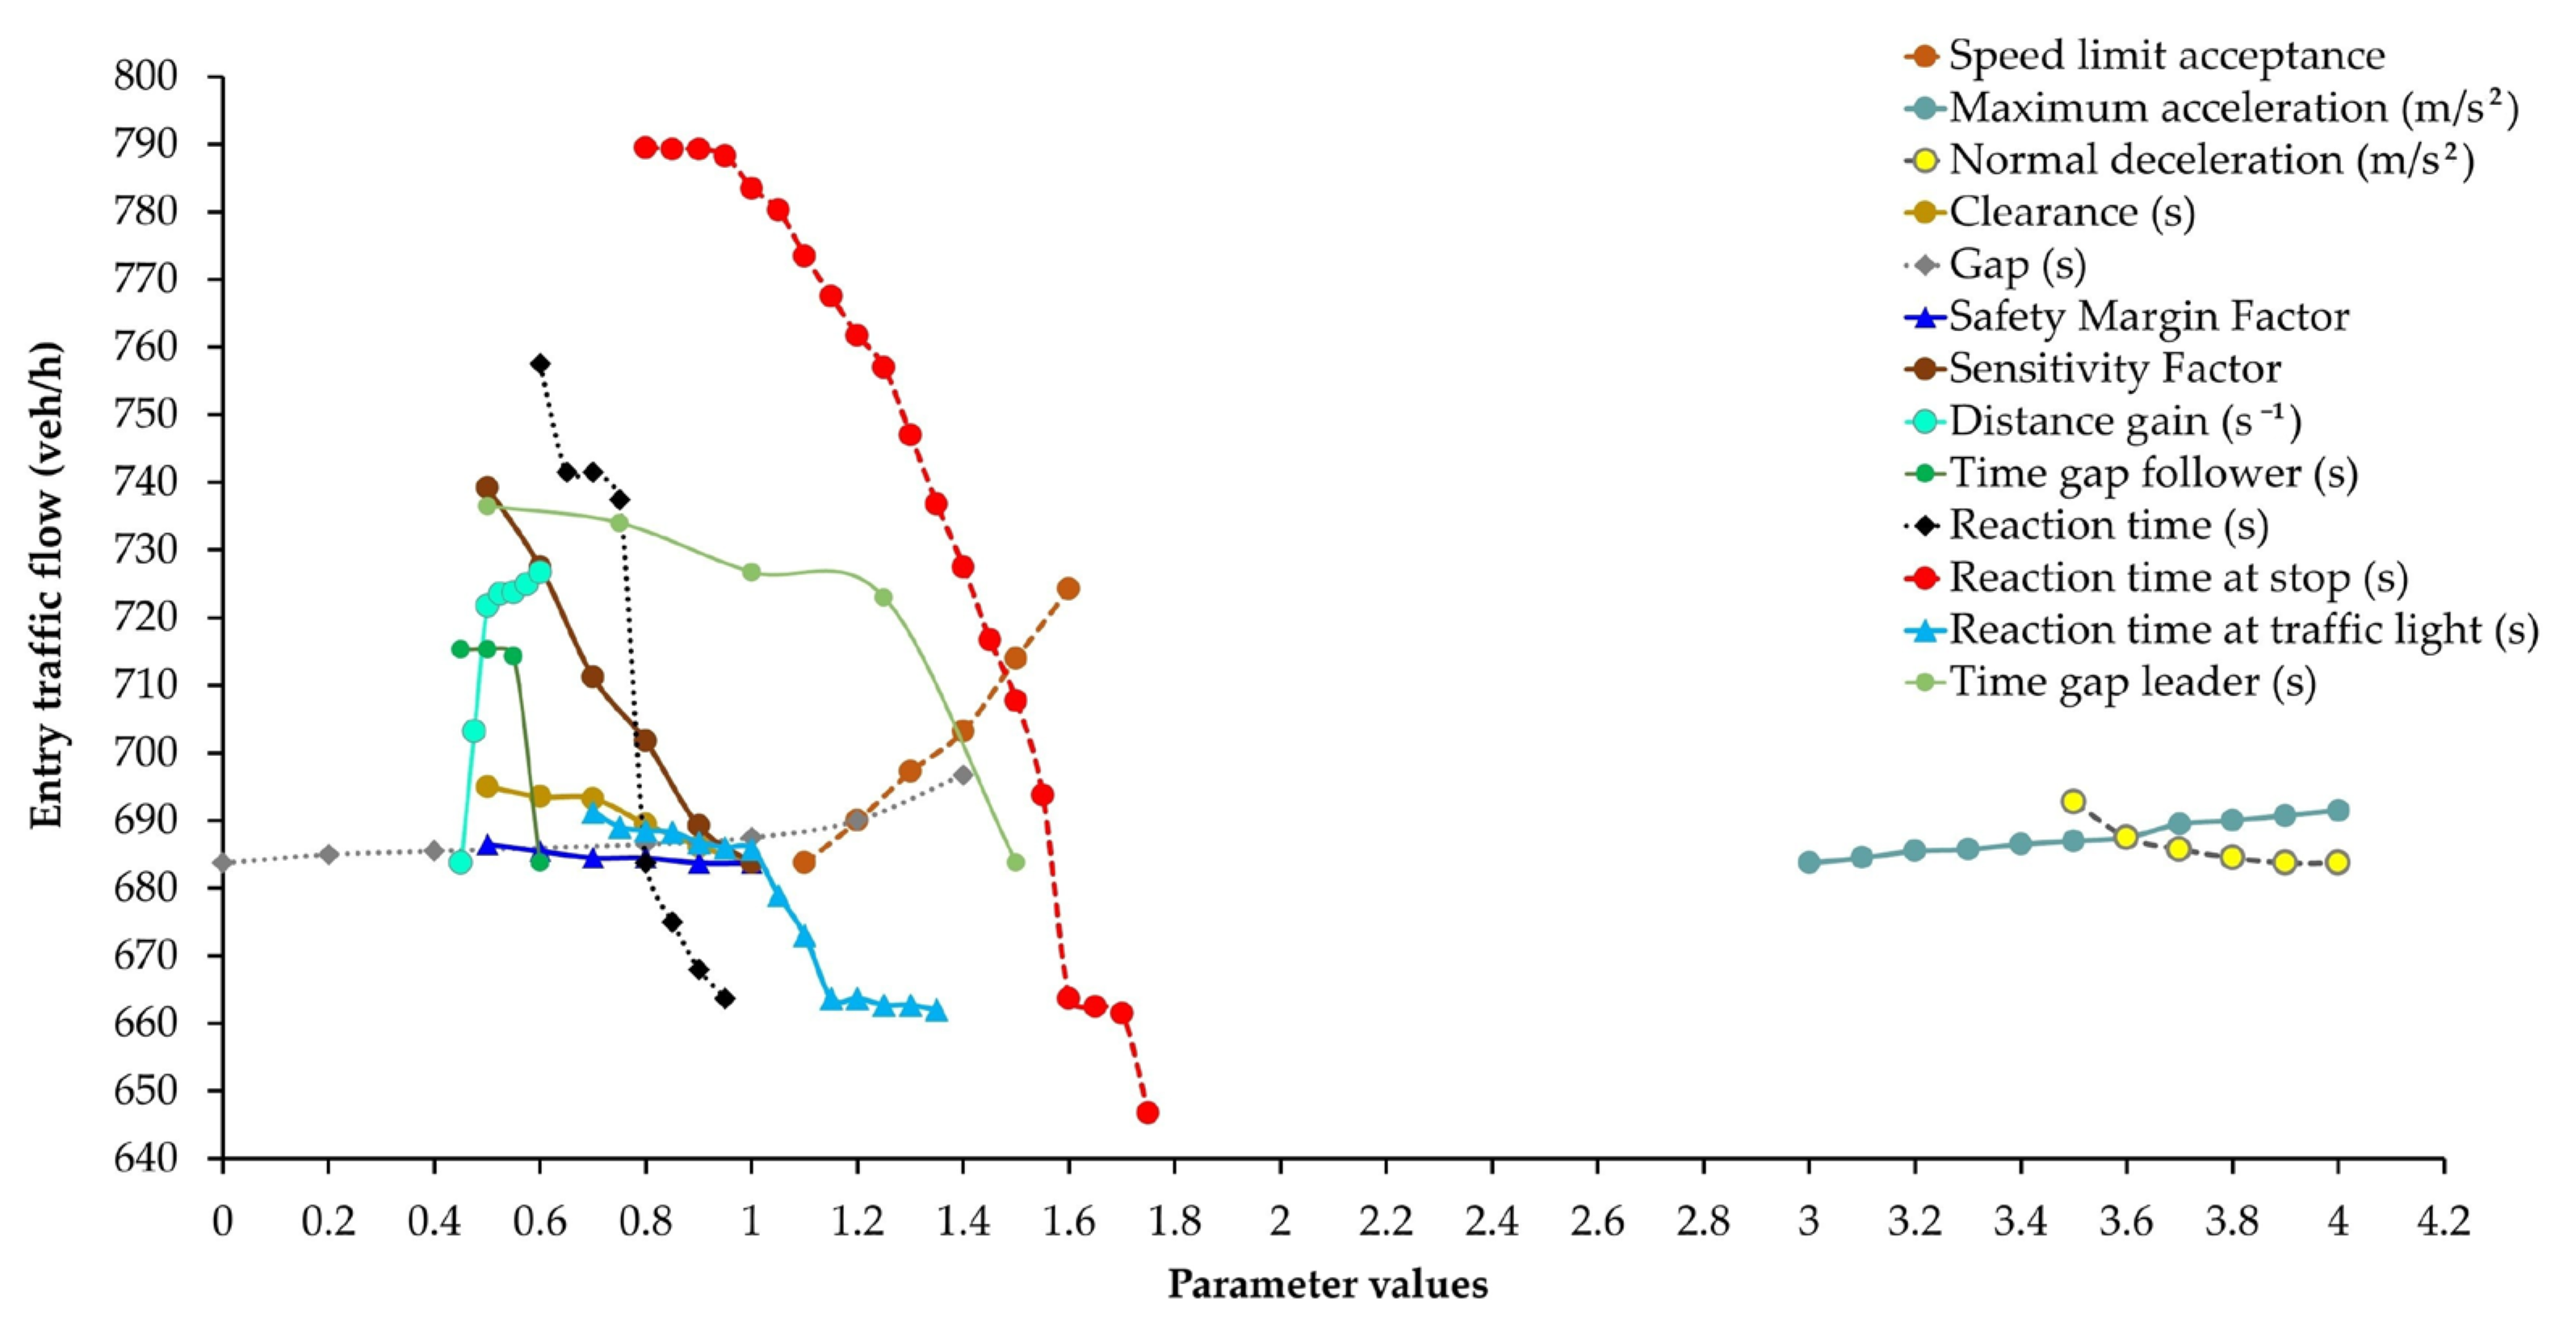
| Speed limit acceptance | 1.10 | 1.30 | 1.60 | 1.30 | 1.60 | 0.97 | 1.10 | 1.00 | 1.10 |
| Maximum acceleration (m/s2) | 3.00 | 3.20 | 3.40 | 3.20 | 3.40 | 3.00 | 4.00 | 3.00 | 4.00 |
| Normal deceleration (m/s2) | 4.00 | 4.00 | 3.50 | 4.00 | 3.50 | 4.00 | 4.00 | 4.00 | 4.00 |
| Clearance (s) | 1.00 | 1.00 | 0.50 | 1.00 | 0.50 | 1.00 | 1.00 | 1.00 | 1.00 |
| Gap (s) | 0.00 | 0.00 | 0.00 | 0.00 | 0.00 | 1.33 | 0.00 | 1.58 | 0.00 |
| Safety Margin Factor | 1.00 | 1.00 | 1.00 | 1.00 | 1.00 | 1.00 | 0.50 | 1.00 | 0.50 |
| Sensitivity Factor | 1.00 | 1.00 | 1.00 | 1.00 | 1.00 | 1.00 | 0.50 | 1.00 | 1.00 |
| Distance gain (s−1) | 0.45 | 0.45 | 0.60 | 0.45 | 0.60 | 0.45 | 0.45 | 0.45 | 0.45 |
| Time gap leader (s) | 1.50 | 1.50 | 0.50 | 1.50 | 0.50 | 1.50 | 1.50 | 1.50 | 1.50 |
| Time gap follower (s) | 0.60 | 0.60 | 0.50 | 0.60 | 0.50 | 0.60 | 0.60 | 0.60 | 0.60 |
| Reaction time (s) | 0.80 | 0.85 1 | 0.62 2 | 0.80 1 | 0.60 2 | 0.95 1 | 0.67 2 | 0.86 1 | 0.63 2 |
| Reaction time at stop (s) | 1.20 | 1.75 1 | 1.06 2 | 1.60 1 | 0.82 2 | 1.20 | 1.20 | 1.20 | 1.20 |
| Reaction time at traffic light (s) | 1.60 | 1.36 1 | 1.02 2 | 1.20 1 | 0.73 2 | 1.60 | 1.60 | 1.60 | 1.60 |
| Statistics | CAV-MERs by Lane Group (%) | |||||||||||
|---|---|---|---|---|---|---|---|---|---|---|---|---|
| 0 | 20 | 40 | 60 | 80 | 100 | |||||||
| L | R&T | L | R&T | L | R&T | L | R&T | L | R&T | L | R&T | |
| Mean 1 | 362.22 | 566.67 | 371.00 | 594.22 | 395.33 | 648.22 | 417.44 | 690.22 | 449.33 | 760.11 | 551.78 | 858.33 |
| s.e. 1 | 62.04 | 61.86 | 62.78 | 64.70 | 64.66 | 69.84 | 70.77 | 72.19 | 74.85 | 79.13 | 91.94 | 89.39 |
| Mean 2 | 367.54 | 574.80 | 371.21 | 605.05 | 393.27 | 650.43 | 407.97 | 680.68 | 444.72 | 771.44 | 573.36 | 877.32 |
| s.e. 2 | 60.66 | 60.91 | 61.27 | 64.12 | 64.91 | 68.93 | 67.33 | 72.13 | 73.40 | 81.75 | 94.63 | 92.97 |
| 95% c.i. * | (−189.3, 178.6) | (−192.2, 175.9) | (−186.2, 185.7) | (−203.9, 182.4) | (192.2, 196.3) | (−210.4, 205.7) | (−197.6, 216.6) | (−206.7, 226.0) | (−217.6, 226.9) | (−252.6, 229.9) | (−301.3, 258.1) | (−292.4, 254.4) |
| t-value | −0.06 | −0.09 | −0.002 | −0.12 | 0.02 | −0.02 | 0.10 | 0.09 | 0.04 | −0.10 | −0.16 | −0.15 |
| t-critical | 2.12 | 2.12 | 2.12 | 2.12 | 2.12 | 2.12 | 2.12 | 2.12 | 2.12 | 2.12 | 2.12 | 2.12 |
| p(α)value | 0.95 | 0.93 | 0.98 | 0.91 | 0.98 | 0.98 | 0.92 | 0.93 | 0.96 | 0.93 | 0.87 | 0.88 |
| F-statistic | 1.05 | 1.03 | 1.05 | 1.02 | 1.01 | 1.03 | 1.10 | 1.01 | 1.04 | 1.07 | 1.06 | 1.08 |
| F-critical | 3.44 | 3.44 | 3.44 | 3.44 | 3.44 | 3.44 | 3.44 | 3.44 | 3.44 | 3.44 | 3.44 | 3.44 |
| F-prob | 0.95 | 0.97 | 0.95 | 0.98 | 0.99 | 0.97 | 0.89 | 0.98 | 0.96 | 0.93 | 0.94 | 0.91 |
| RMSNE | 0.04 | 0.02 | 0.02 | 0.03 | 0.02 | 0.01 | 0.03 | 0.02 | 0.02 | 0.02 | 0.04 | 0.02 |
| Statistics | CAV-MERs by Entry Lane (%) | |||||||||||
|---|---|---|---|---|---|---|---|---|---|---|---|---|
| 0 | 20 | 40 | 60 | 80 | 100 | |||||||
| LEL | REL | LEL | REL | LEL | REL | LEL | REL | LEL | REL | LEL | REL | |
| Mean 1 | 774.50 | 821.69 | 745.93 | 876.45 | 786.75 | 943.93 | 881.15 | 1046.77 | 980.67 | 1128.53 | 1067.83 | 1211.58 |
| s.e. 1 | 57.99 | 61.22 | 56.60 | 63.20 | 58.35 | 65.86 | 62.70 | 71.86 | 67.64 | 72.67 | 71.40 | 72.09 |
| Mean 2 | 731.11 | 810.41 | 738.00 | 883.28 | 799.77 | 954.29 | 887.45 | 1019.71 | 1001.66 | 1060.85 | 1107.11 | 1115.14 |
| s.e. 2 | 67.97 | 72.37 | 66.28 | 75.90 | 68.27 | 77.33 | 72.47 | 79.67 | 78.52 | 79.79 | 85.92 | 77.71 |
| 95% c.i. * | (−135.3; 222.0) | (−178.8; 201.4) | (−165.9; 181.8) | (−204.8; 191.2) | (−192.2; 166.1) | (−214.0; 193.3) | (−197.4; 184.8) | (−188.1; 242.2) | (−227.7; 185.7) | (−148.7; 284.1 | (−262.1; 183.5) | (−116.1; 309.0) |
| t-value | 0.51 | 0.12 | 0.13 | 0.07 | 0.15 | 0.10 | 0.11 | 0.25 | 0.20 | 0.63 | 0.35 | 0.91 |
| t-critical | 2.000 | 2.006 | 1.995 | 2.007 | 1.995 | 2.006 | 1.995 | 2.006 | 1.995 | 2.005 | 1.995 | 2.005 |
| p(α)value | 0.63 | 0.91 | 0.93 | 0.95 | 0.88 | 0.92 | 0.95 | 0.80 | 0.84 | 0.53 | 0.73 | 0.37 |
| F-statistic | 1.37 | 1.40 | 1.37 | 1.44 | 1.37 | 1.38 | 1.34 | 1.23 | 1.35 | 1.21 | 1.45 | 1.16 |
| F-critical | 1.76 | 1.91 | 1.76 | 1.91 | 1.76 | 1.91 | 1.76 | 1.91 | 1.76 | 1.91 | 1.76 | 1.91 |
| F-prob | 0.38 | 0.40 | 0.35 | 0.35 | 0.36 | 0.41 | 0.40 | 0.60 | 0.38 | 0.63 | 0.28 | 0.70 |
| RMSNE | 0.13 | 0.16 | 0.09 | 0.14 | 0.07 | 0.10 | 0.07 | 0.08 | 0.06 | 0.11 | 0.07 | 0.13 |
Disclaimer/Publisher’s Note: The statements, opinions and data contained in all publications are solely those of the individual author(s) and contributor(s) and not of MDPI and/or the editor(s). MDPI and/or the editor(s) disclaim responsibility for any injury to people or property resulting from any ideas, methods, instructions or products referred to in the content. |
© 2025 by the authors. Licensee MDPI, Basel, Switzerland. This article is an open access article distributed under the terms and conditions of the Creative Commons Attribution (CC BY) license (https://creativecommons.org/licenses/by/4.0/).
Share and Cite
Tumminello, M.L.; Zare, N.; Macioszek, E.; Granà, A. Assaying Traffic Settings with Connected and Automated Mobility Channeled into Road Intersection Design. Smart Cities 2025, 8, 86. https://doi.org/10.3390/smartcities8030086
Tumminello ML, Zare N, Macioszek E, Granà A. Assaying Traffic Settings with Connected and Automated Mobility Channeled into Road Intersection Design. Smart Cities. 2025; 8(3):86. https://doi.org/10.3390/smartcities8030086
Chicago/Turabian StyleTumminello, Maria Luisa, Nazanin Zare, Elżbieta Macioszek, and Anna Granà. 2025. "Assaying Traffic Settings with Connected and Automated Mobility Channeled into Road Intersection Design" Smart Cities 8, no. 3: 86. https://doi.org/10.3390/smartcities8030086
APA StyleTumminello, M. L., Zare, N., Macioszek, E., & Granà, A. (2025). Assaying Traffic Settings with Connected and Automated Mobility Channeled into Road Intersection Design. Smart Cities, 8(3), 86. https://doi.org/10.3390/smartcities8030086