Article

Prediction of Sound Insulation Using Artificial Neural Networks—Part I: Lightweight Wooden Floor Structures

by
Mohamad Bader Eddin
1,*,
Sylvain Ménard
1,
Delphine Bard Hagberg
2,
Jean-Luc Kouyoumji
3 and
Nikolaos-Georgios Vardaxis
2
1
Department of Applied Sciences, University of Québec at Chicoutimi, Saguenay, QC G7H2B1, Canada
2
Engineering Acoustics, Lund University, John Ericssons väg 1, 223 63 Lund, Sweden
3
Technological Institute FCBA, All. de Boutaut, 33000 Bordeaux, France
*
Author to whom correspondence should be addressed.
Acoustics 2022, 4(1), 203-226; https://doi.org/10.3390/acoustics4010013
Submission received: 26 January 2022 / Revised: 24 February 2022 / Accepted: 26 February 2022 / Published: 2 March 2022

Abstract

:
The artificial neural networks approach is applied to estimate the acoustic performance for airborne and impact sound insulation curves of different lightweight wooden floors. The prediction model is developed based on 252 standardized laboratory measurement curves in one-third octave bands (50–5000 Hz). Physical and geometric characteristics of each floor structure (materials, thickness, density, dimensions, mass and more) are utilized as network parameters. The predictive capability is satisfactory, and the model can estimate airborne sound better than impact sound cases especially in the middle-frequency range (250–1000 Hz), while higher frequency bands often show high errors. The forecast of the weighted airborne sound reduction index R w was calculated with a maximum error of 2 dB. However, the error increased up to 5 dB in the worse case prediction of the weighted normalized impact sound pressure level L n , w . The model showed high variations near the fundamental and critical frequency areas which affect the accuracy. A feature attribution analysis explored the essential parameters on estimation of sound insulation. The thickness of the insulation materials, the density of cross-laminated timber slab and the concrete floating floors and the total density of floor structures seem to affect predictions the most. A comparison between wet and dry floor solution systems indicated the importance of the upper part of floors to estimate airborne and impact sound in low frequencies.

1. Introduction

Controlling the acoustic environment in building constructions is an essential aspect of new as well as old renovated buildings [1], especially dwellings. Improving the perception of the acoustic comfort for the building users is also critical for research, development and design of contemporary constructions [2]. The sound insulation data of existing building elements are derived from standardized measurements and used as an indication or usually prediction for the performance of building components in a new structure. Such measurements can happen in situ or various test building elements may be set up in a laboratory, e.g., to test insulation of wall or floor partitions [3,4,5,6,7,8,9].
To meet sufficient acoustic requirements, it is necessary to use prediction models and acoustic products with the expected performance to provide a proper indoor climate. Such prediction tools have been presented to estimate the acoustic behavior inside buildings [10,11,12,13,14,15,16]. However, some tools have demonstrated non-negligible deviations in the results [17,18,19,20]. Specific details with building parameters that could affect the acoustic performance are required to be involved in the prediction tools in order to increase their reliability [14,20,21,22].
Many problems arise for the acoustic performance prediction from that data due to: technical differences between components, effects of the whole structure on the same components, variations between field measurements (in a realized building) and laboratory measurements (in a controlled environment). The sound insulation curves measured for the same partition in a laboratory setup and in situ may deviate significantly due to many reasons, the most profound being flanking transmission, i.e., indirect propagation paths from the adjacent components in the entire mechanical system of a structure [9]. The acoustic comfort perception of residents may vary as well based on the material properties (heavyweight or lightweight structures) and the different cases of the measured sound insulation, e.g., airborne or impact sound related [21,23,24].
Wood is continuously and widely used in construction engineering because of its availability in nature and ease of use [25]. In North America, wood-frame structures were the dominant building construction system in housing in the 20th century [26]. A lightweight construction can be defined as a construction technique utilizing materials to reduce the total mass of a structure while increasing its workable quality [27]. The term ’lightweight construction systems’ is not limited to specific materials, but now often refers to lightweight wooden frame buildings. This study is mainly focused on wooden building constructions. The main challenge in some types of lightweight construction is that the subjective sound insulation quality is perceived as lower than that of a heavy structure with the same sound insulation data [28].
The simplest approach of a prediction model is based on mass, stiffness and losses [9]. This may be reasonable for a single wall structure, but it is not the situation for multi-layered and lightweight constructions. An accurate estimation of sound insulation for double structures has been and still remains a challenge [9]. Some construction details, such as mechanical connections between different materials, can hardly be considered especially in the analytical approaches [29]. The variety of construction materials makes the prediction process more difficult. Furthermore, the standardized methods for estimating the acoustic performance of building elements, which are indicated in ISO 12354 Part 1 and 2 [30,31], are presently not appropriate for multilayered complex and lightweight structures [21]. The standardized methods are widely used and were developed based on data from heavy monolithic constructions [21].
Recently, machine learning (ML) and its applications have been used widely for solving complex problems in different fields, such as: image classification, speech recognition and building acoustic applications [15,32,33,34]. ML is defined as a branch of statistics in which a model can learn automatically based on data without exclusively being programmed [35]. Thus, it is the tool used for large-scale data processing. A strength of the many machine learning techniques, and deep learning (DL) in particular, is that they perform best when huge data sets are provided, thus improving analytic and predictive power, with accurate results and decreased errors. In other words, ML models, and deep learning artificial neural networks (ANNs) in particular, learn best when they utilize large and diverse data sets which cover a representative sample of cases.
In acoustics, ANNs have been used in the field of audio engineering in some studies [36,37,38,39,40], and to optimize the acoustic performance of car interiors in other studies [41,42]. In environmental acoustics, sound emission data of wind farms have been used by ANN models to automatically recognize the positions of wind turbines [43,44]. Other studies also utilized ANNs to predict the sound absorption for different materials based on their physical properties [45,46].
In building acoustics, ANN models were used to predict the sound insulation of sandwich partition panels and to estimate the weighted airborne sound reduction index R w and sound transmission class STC values with error within ± 3 dB and a confidence level higher than 95% [16]. Similar research was done on wooden windows insulation to estimate the R w based on technical parameters [22], namely: window typology, frame and shutter thickness, number of gaskets, R w of glazing and R w of the window. However, the two previous studies were limited to the single value estimation of the weighted index without utilizing full measurement curves in different frequency bands.
Another use of ANN was performed for prediction of airborne sound insulation curves of masonry walls [15]. Thirty-four laboratory measurements of simple monolithic brick walls were examined. Geometric and physical characteristics were used as input data in the ANN model: material, dimensions, density, mass, Poisson’s module, Young’s modulus, etc. Then, a feature attribution analysis determined the most statistically significant parameters for the airborne sound insulation [15]. The parameters influencing the estimation most were: mass per unit area, the thickness, the Young’s modulus, the frequency, the length and the height of the brick. Although the predicted values showed agreement with the real ones, the study was limited to a specific kind of construction.
In a previous study by the authors [47], an ANN was utilized to predict the whole acoustic spectrum of different lightweight wooden floor structures. The study was limited to 67 measurements and using the thickness and the installation order of the materials as the only parameters in the model. However, the model showed an acceptable accuracy, providing indications that confident estimations can be achieved with more parameters and measurement data.
The goal of this study is to develop a prediction tool based on artificial neural networks for airborne and impact sound insulation estimation of different floor structures. The data used in this study consist of collected standardized laboratory measurements performed on various floor configurations. Finally, a feature attribution analysis is carried out to determine the most significant parameters and their effect on sound insulation for the test floor structures.

2. Materials and Methods

2.1. Artificial Neural Networks

The concept of artificial neural networks was motivated by the structure of a real brain, but ANNs have gone far beyond their original inspiration from biology [48]. They allow using very simple computational operations (additions, multiplication and fundamental logic elements) to solve complex, mathematically ill-defined problems [49,50]. The architecture of an ANN consists of layers, and each layer contains computation units that are referred to as neurons [51]. Those units are connected to one another through weights, which take the same role as the strength connections in biological organisms. Weights are used to scale each input to a neuron, which consequently affects the function computed at that unit. An ANN computes a function of the inputs by propagating computed values from the input neurons to the output neuron(s) and using the weights as intermediate parameters [52]. The training data contain examples of input–output pairs of the function to be learned. It provides feedback on the correctness of the weights depending on how good the network can predict output values. Errors made by an ANN are viewed to evaluate the weights between neurons. Then, the weights are adjusted in a neural network (this is how an ANN learns). The features of an ANN (weights and bias) are adjusted during the learning phase of the network. Neural networks are typically arranged in layers, and each layer is an array of processing neurons. A data set flows through each neuron in an input–output manner. In other words, each neuron receives a signal, manipulates it and forwards an output signal to the other connected neurons in the adjacent layer. A neuron can be defined as a mathematical function that takes one or more input values and outputs a single numerical value. The neuron is identified as follows:
y = f ( ( w i x i + b ) )
where y, w i , x i and b represent output, weight value, input and bias of a specific neuron, respectively. Output values from neurons are known as activation values, which are used as an input to the activation function. The activation functions most commonly used are sigmoid, hyperbolic, tangent, ReLU and LeakyReLU functions [53].

Sensitivity Analysis

Explaining the mechanism of complex deep learning models, such as neural networks, is quite cumbersome as they are identified as black box predictor tools [54]. To understand which features the model relies on, a problem of attributing the prediction power of a deep network to input features has to be identified. The attribution problem was previously studied in several papers [55,56,57].
A significant challenge in attribution techniques is that they are difficult to evaluate empirically. In addition, it is hard to distinguish between errors that came from the misbehavior of the model or from misbehavior of the attribution method. This limitation can be compensated by taking an axiomatic approach, called integrated gradients (IGs) [58]. This is different from the gradient descent algorithm [59], which is a common way to optimize ANN models.
It is denoted here as I G i ( x ) and uses a function F : R n [ 0 , 1 ] that presents a neural network and an input x = ( x 1 , . . . , x n ) R n . An attribution of the prediction at the input x relative to a baseline input z R n is a vector A F ( x , z ) = ( a 1 , . . . , a n ) R n , where a i is the attribution of x i of the prediction function F ( x ) . The integrated gradients can be defined as the integral of the gradients along the straight path from the baseline input z to the input x. The integrated gradient for the i t h dimension between a baseline and an input is defined by [58]:
I G i ( x ) = ( x i z i ) * α = 0 1 F ( z + α * ( x z ) ) x i d α

2.2. Study Design

Structure Samples

The database is developed based on 252 standardized laboratory measurements received from Lund University in Sweden, FCBA in France, FPinnovations and CNRC [60] in Canada. The measurements consist of airborne and impact sound insulation tests performed on 142 different floor structures in the frequency range of 50 Hz to 5 kHz. The airborne sound reduction index measurements were carried out according to ISO 140-1 (1995) [3] or the latest ISO 10140-2 (2010) [5] and ASTM E90-09 (2016) [61]. The impact sound pressure level data were measured following ISO 140-6 (1998) [4] or the latest ISO 10140-3 (2010) [7] and ASTM E492-09 (2016) [62].
Measurement data based on ASTM standards were converted to comply with ISO standards descriptors, the weighted airborne sound R w and the weighted normalized impact sound pressure level L n , w . The latter are described in ISO 717-1 (2013) [63] and ISO 717-2 (2013) [64], respectively. This conversion is done in order to have a total agreement with the acoustic descriptors that are calculated from the airborne and impact sound insulation curves.
In this study, the 252 standardized laboratory measurements are used as input data to develop an ANN model, and they are all presented in Figure A1 and Figure A2 in the Appendix A. Figure 1 shows the mean and standard deviation values of the airborne and impact sound insulation curves in the frequency bands (50–5000 Hz) that are used in the database. The database contains two types of measurement curves: airborne sound reduction index R and normalized impact sound pressure level L n in one-third octave frequency bands (50–5000 Hz). The measurements concern 142 different floor structures, which correspond to the data observations. Hence, for every floor structure or observation there is the technical and material parameters, the airborne sound reduction index data and/or the normalized impact sound pressure level data. There are 107 structures that have both airborne and impact sound insulation data, 26 that have only airborne sound data and 12 that have only impact sound curves (Table 1).
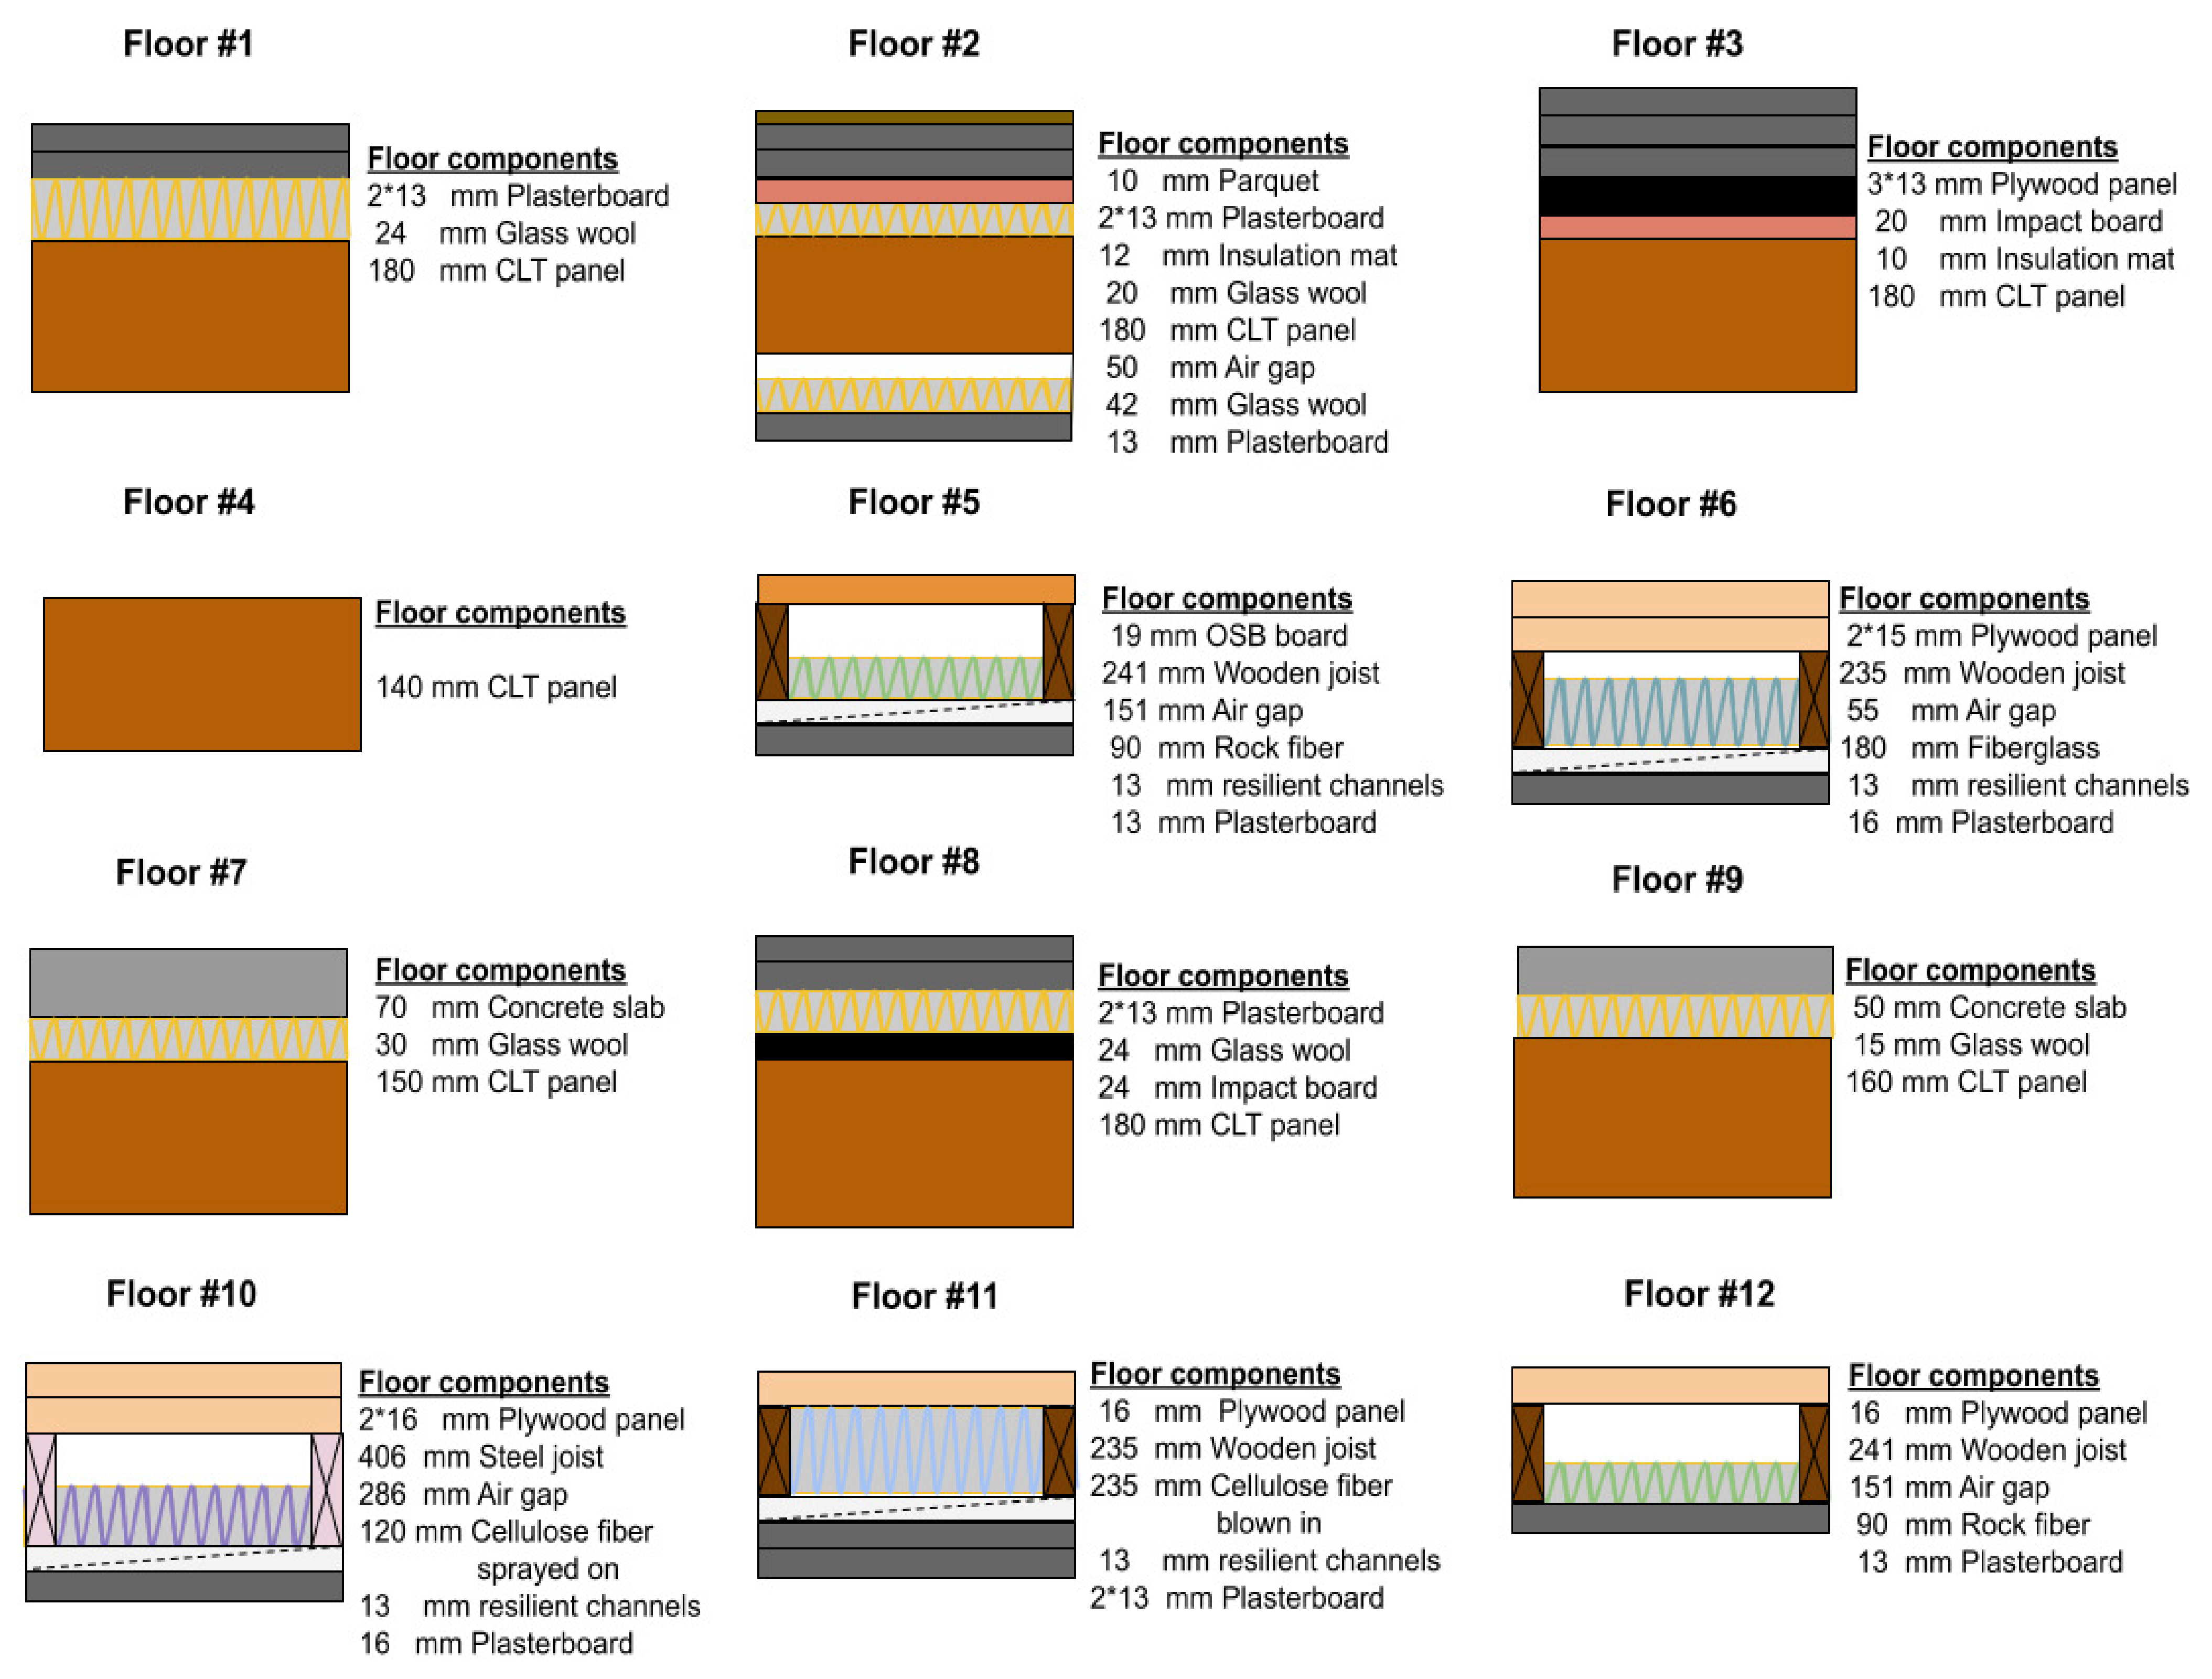
A set of 24 different floor structures were used to validate the models’ features (as defined in Section 2.1) and another 24 were used for testing, i.e., predictions. Figure A3 in the Appendix A illustrates the testing data cases of floor configurations, which were randomly selected from the total data observations. They mostly cover the average trends of the insulation curves but some extreme higher or lower cases too, as seen for floors #1, #4 and #9 in Figure A1, or floors #2, #3 and #4 in Figure A2.
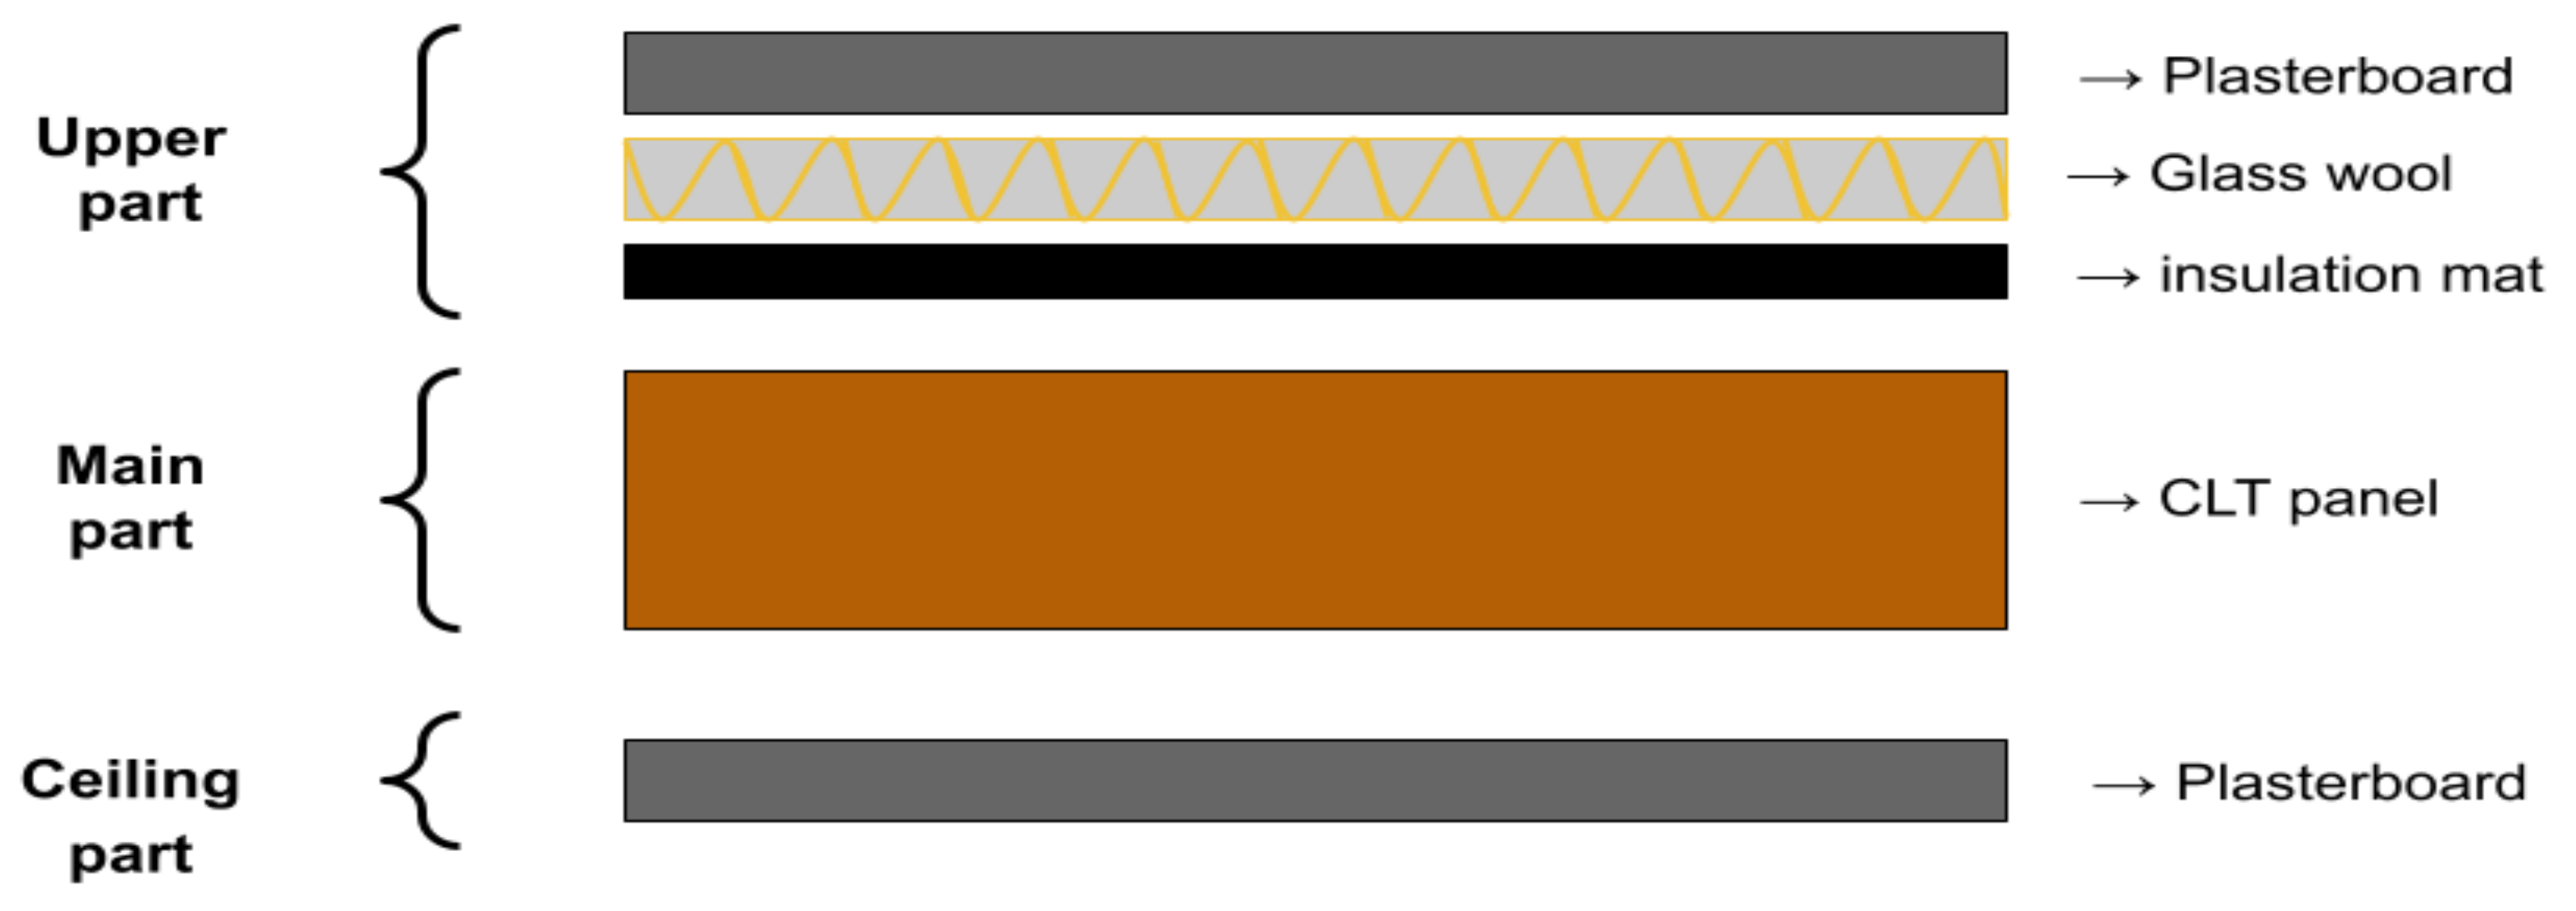
Each floor configuration in the database is arranged in three parts: upper, main and ceiling part, following the order of material layers. The main part presents the dominant material for the structure’s character among all floor components. The upper and ceiling parts represent materials located and clustered above and below the main part of each floor structure, respectively (Figure 2).
The database is organized with MySQL software [65]. In this study, 23 variables are used as structural parameters (Table 2). All those parameters are used as inputs to train the ANN model. The model’s output values are the airborne and impact sound insulation curves, with 21 values that are presented in dB in one-third octave bands for each curve. The parameters of the observations are arranged with respect to: type of materials, material layer order, thickness, density, joist type, width and depth of joist, area of test floor (S), volume of the receiving room (V), the ratio ( S / V ), total mass and total density of the structure, mass per unit area (P.U.A) of upper, main and ceiling parts, depth of the resilient metal channel, spacing between resilient channels, slope of curves in three different frequency ranges (low: 50–200 Hz, middle: 250–1000 Hz and high: 1250–5000 Hz) and the airborne and impact sound insulation curves in dB in one-third octave bands (50–5000 Hz).

2.3. Prediction Model Configuration

The ANN model is based on a multilayer perceptron algorithm which consists of two hidden layers with 40 and 30 neurons in each layer, respectively. The cross-validation method was used not only to design and validate the ANN model, but also to overcome the overfitting issue [52,66]. The leaky rectified linear unit (LeakyReLU) function [53,67,68] was used as an activation function for both layers. This is a type of activation function base on the ReLU function, which has a small slope for negative values. It is used to overcome the vanishing gradient issues in normal activation functions such as sigmoid and tan functions by giving negative gradients instead of zeros [69]. For the training, the Adam optimizer [70] was utilized, which is one of several optimization algorithms used to optimize neural networks [59]. It is based on the gradient descent method in order to find the optimum weight values that minimize errors in a prediction model [71].
The entire database is split into three subsets: training, validation and test sets with a percentage of 80 % , 10 % and 10 % , respectively, from the total number of measurements. The training set is used to initiate the ANN features such as weights, bias, etc. The validation set is employed for optimizing the architecture of the model in order to find a suitable one, while the test set is used for estimating the predictive capabilities of the chosen model.
The cost function is a mathematical expression which is used to evaluate the performance of the model. In this case, prediction deals with continuous values because the target is to predict the acoustic curve. Therefore, the root mean squared error ( R M S E ) can be used as a cost function:
R M S E = 1 n i = 1 n ( y ^ i y i ) 2
where n is the total number of measurements used as the training set, y ^ i and y i are the predicted and measured values, respectively. The overall prediction accuracy of the model (using the test set) is equal to 3.97 dB. For better evaluation in different frequency ranges, each predicted curve is evaluated individually against the measured one using the R M S E function.

3. Results and Discussion

3.1. Prediction of Airborne Sound Insulation

After training and validating the model with 202 and 24 laboratory measurements, respectively, another 24 sound insulation curves are chosen randomly to test the accuracy of the ANN model (12 for airborne reduction index and 12 for impact sound pressure levels). The acoustic performance (in dB) in one-third octave bands (50 Hz–5 kHz) is the dependent set of variables to be estimated by the model.
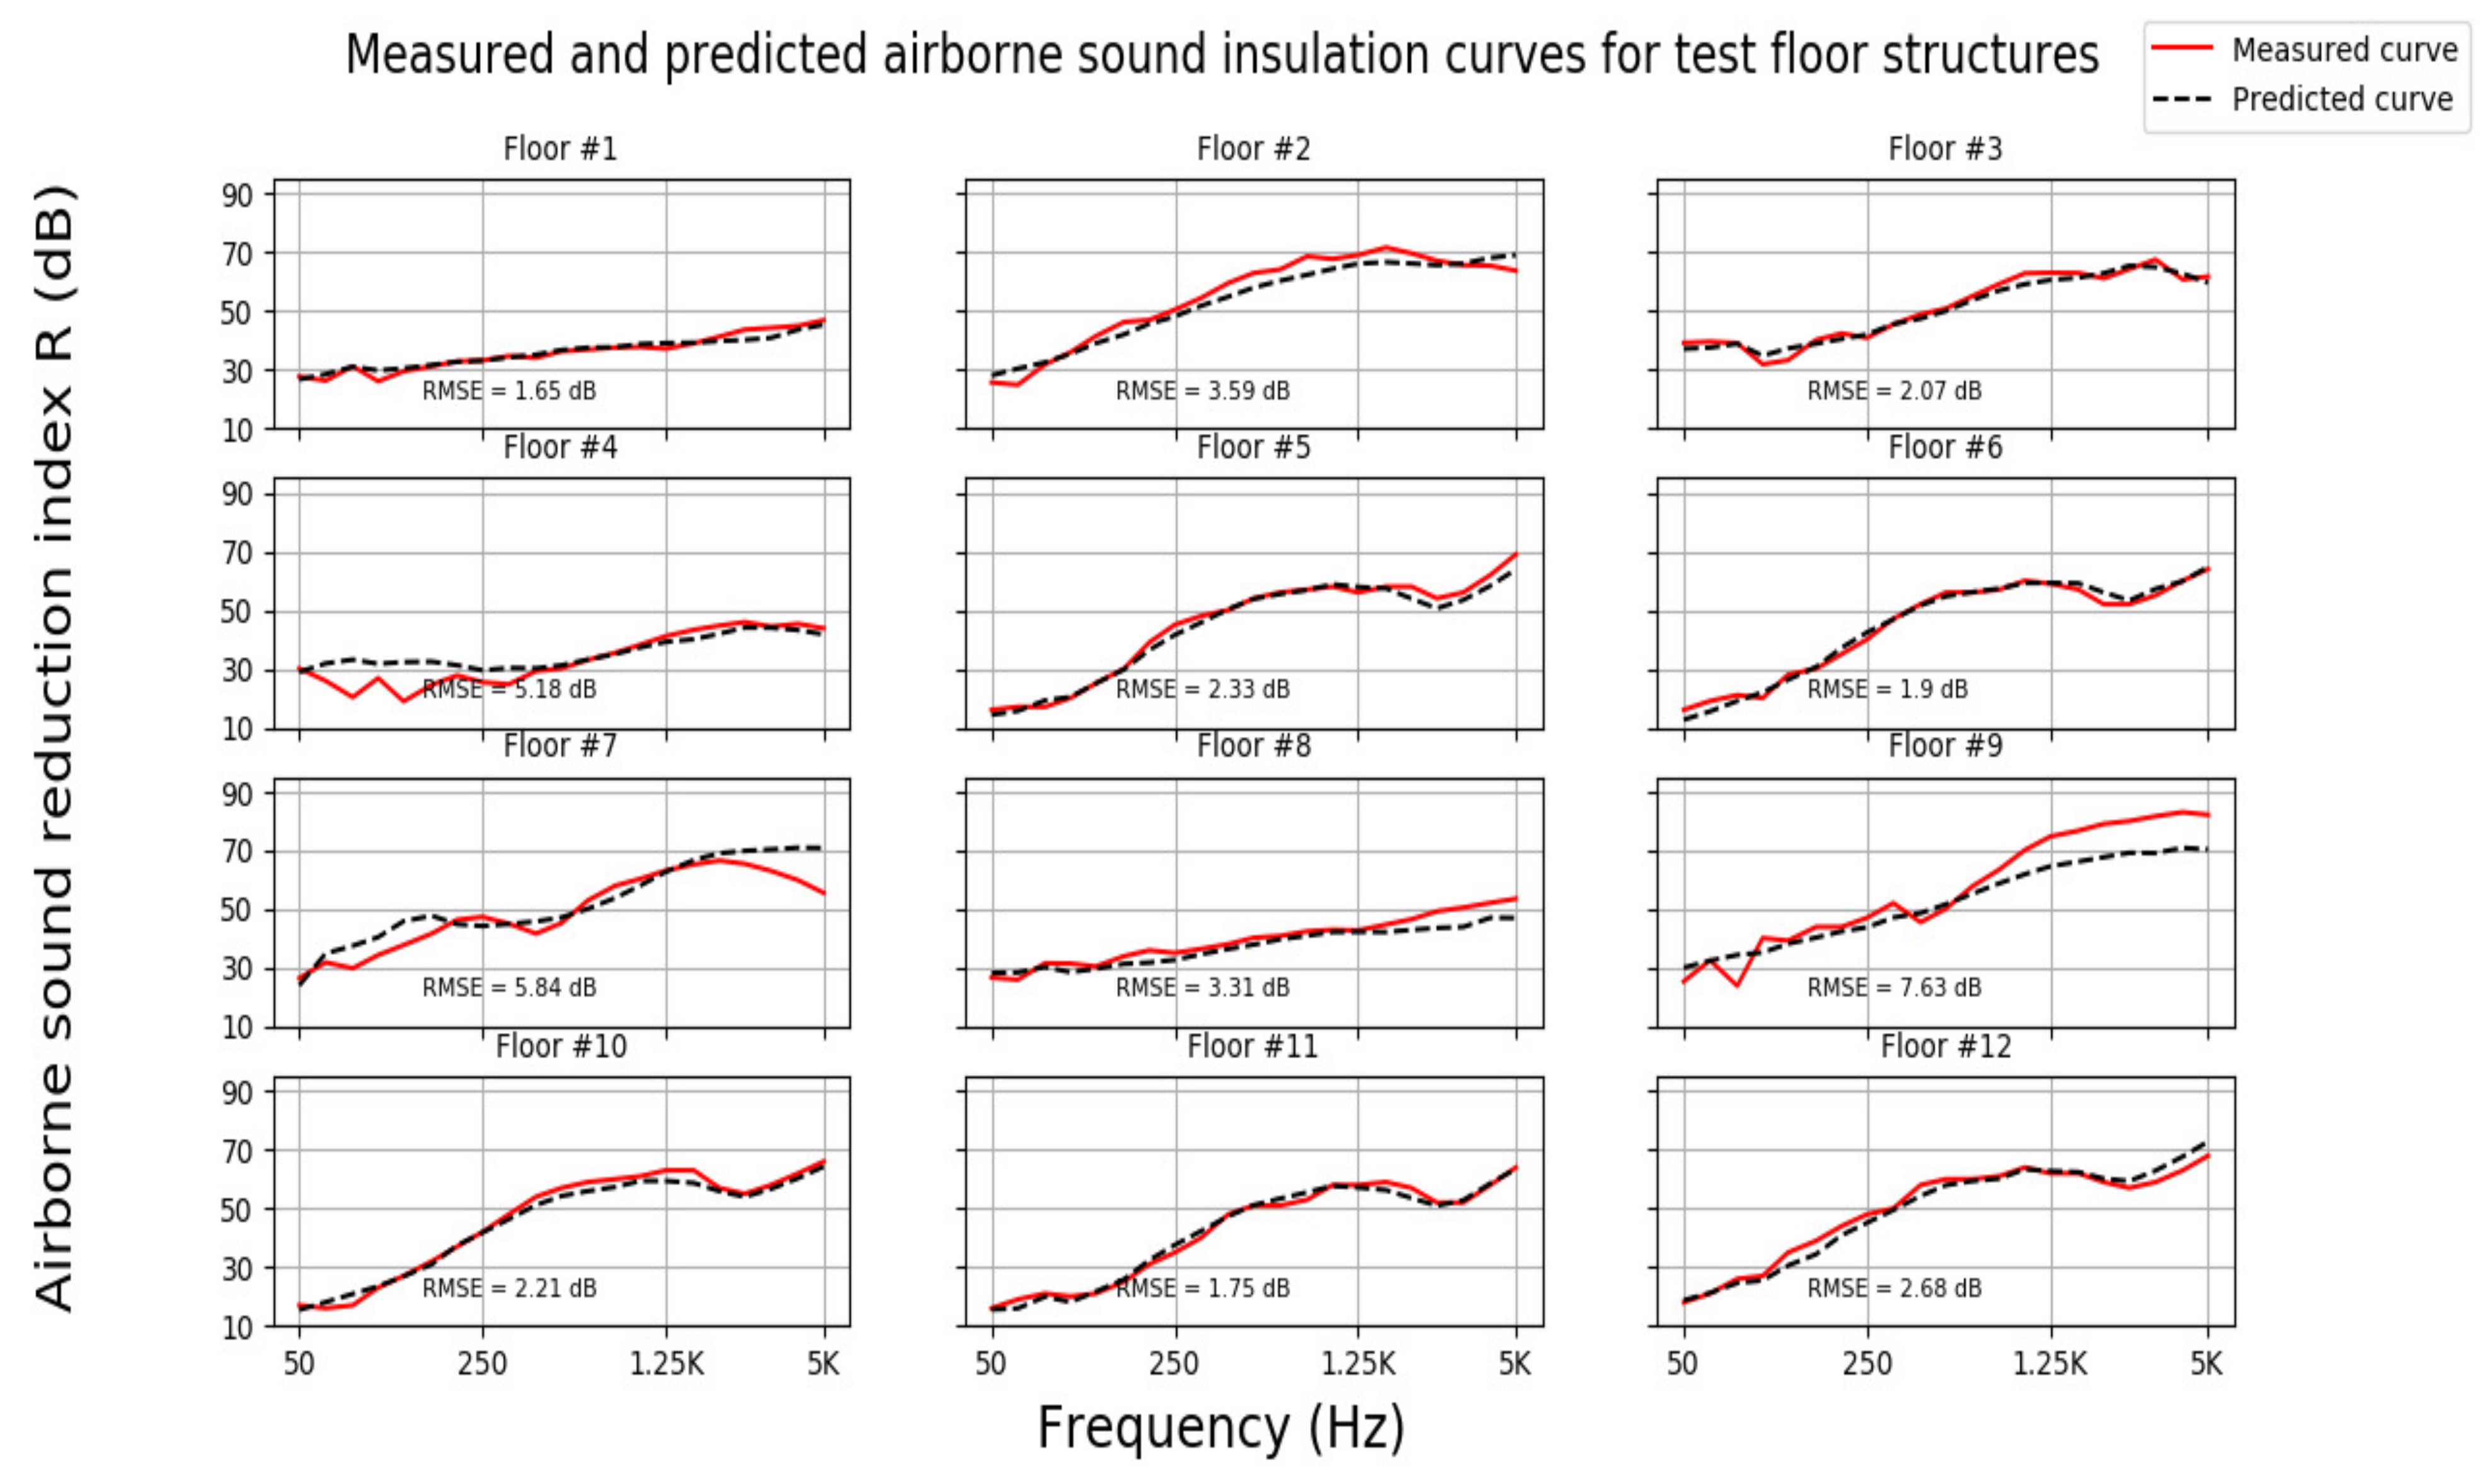
Figure 3 shows a comparison between the measured and predicted curves of different floor configurations for airborne sound insulation. It is noticeable that the predicted curves are close to the measured ones, especially in the low-frequency ranges, while the deviations increase in some cases in the high-frequency bands. The smallest deviation is visible for floor #1 with an R M S E value of 1.65 dB, while the largest is for floor #9 with 7.63 dB. The case of floor #9 is noticeably a simple configuration with 160 mm cross-laminated timber (CLT) and two light layers on top, while floor #1 is only slightly more complex.
Often, significant variance is observed at high frequency (1.25–3 kHz), where the critical frequency for lightweight floors is usually located. That is the frequency at and above which the sound radiation is easy due to resonance and most efficient [72]. It can be noticed that some predicted curves tend to be smoother near the critical frequency, which reveals the limitation of the model in understanding these phenomena. This phenomenon is usual for plate-type structures, i.e., components where the third dimension is negligible compared to length and width, e.g., a gypsum plate. Hence, a thick floor slab or multilayered floor configuration may not completely fit this description. However, this behavior at the critical frequency is observed a lot in building acoustic insulation measurements and every individual layer corresponds better to a plate-type component in theory [9]. The sound radiation is dependent on the overall vibration response of the system after excitation and the properties of the material included [72]. Therefore, below the critical frequency, every plate structure is excited and radiates sound at low levels, but at the critical frequency there is a big resonance in the mechanical system. Then, above the critical frequency, the whole plate structure can synchronize and radiate sound at high levels with the input vibration [9].
Similar deviations can be observed occasionally for low frequencies below 150 Hz, where the fundamental resonances (first eigenfrequencies) occur profoundly and remain distinct [9], e.g., floors #4 and #9. Those low resonance frequencies affect the airborne sound reduction performance more than the model can predict.
Table 3 illustrates the total root mean square error of deviations between measured and predicted airborne sound curves for each test floor configuration in one-third octave bands. It also shows the measured and predicted single-number quantities (SNQs), R w and R w P r e d i c t e d , respectively, for each test floor. The differences between the weighted reduction indices vary from zero deviation (floors #3, #5 and #7) to a maximum deviation of 2 dB (floors #2, #4, #8 and #11) as seen in Table 3. The calculated and predicted correction terms C 100 3150 and C 50 5000 , also presented in Table 3, show similar deviations that do not exceed the deviations from the weighted reduction index comparison.
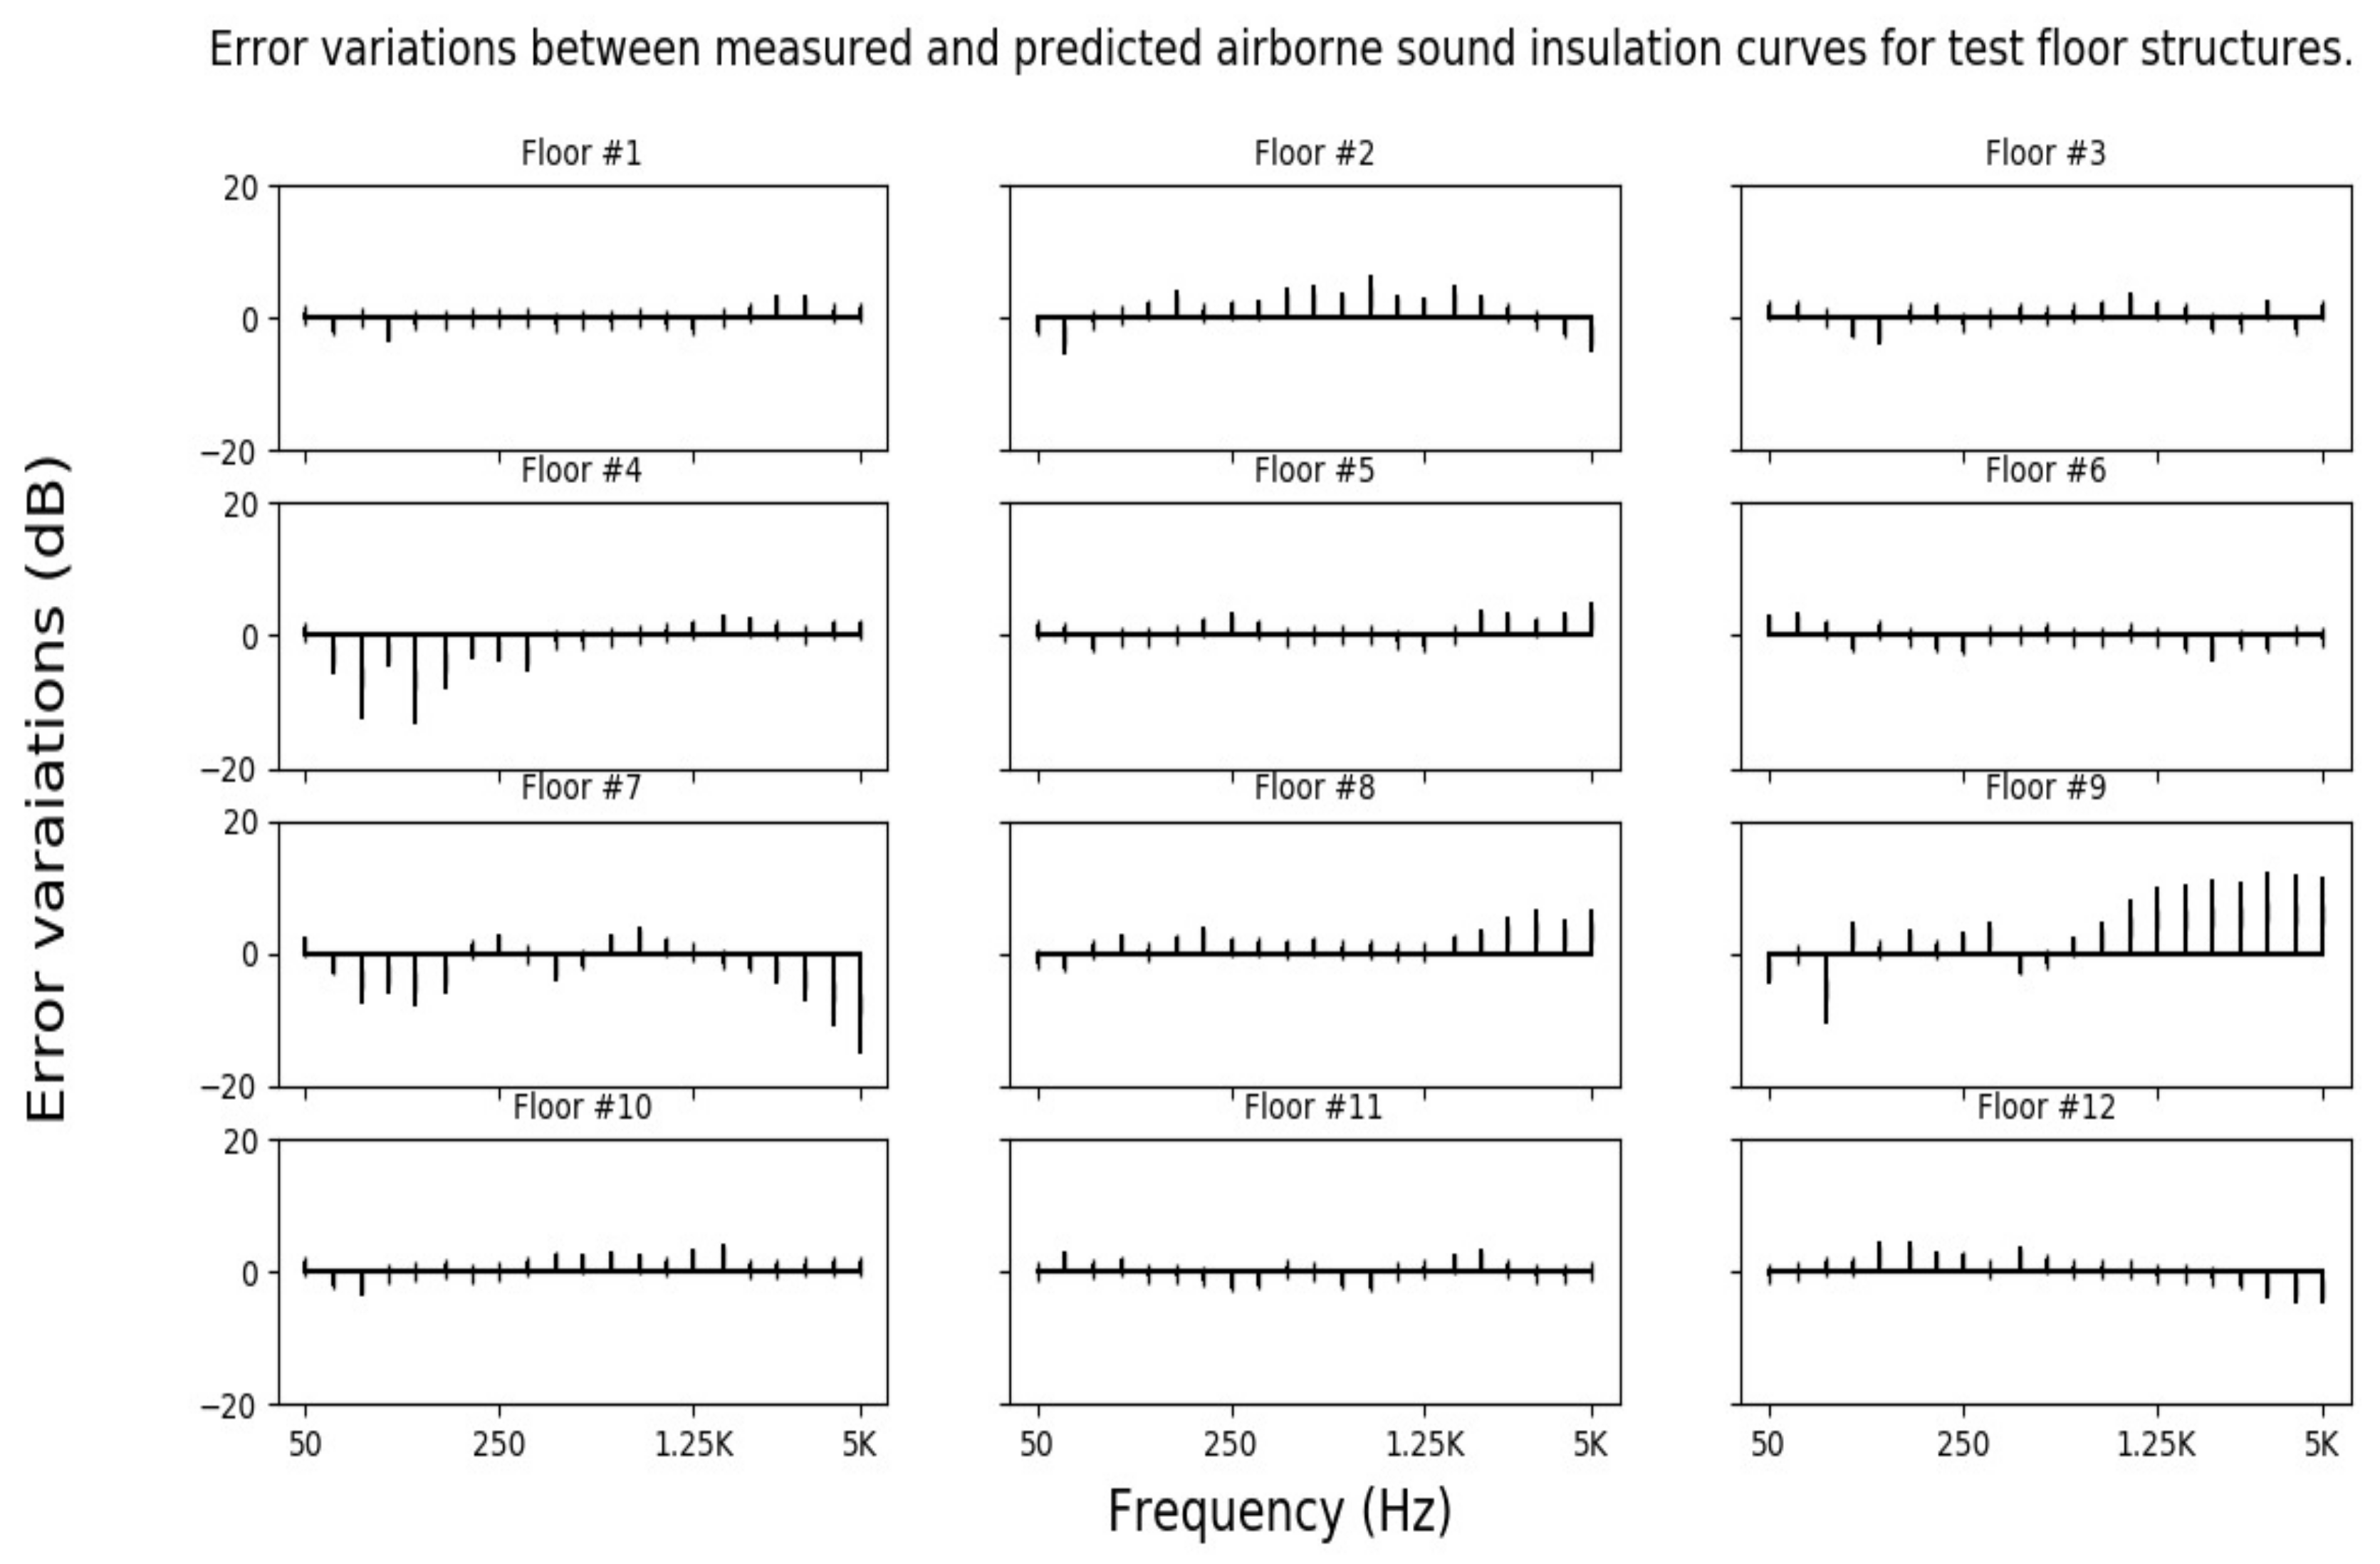
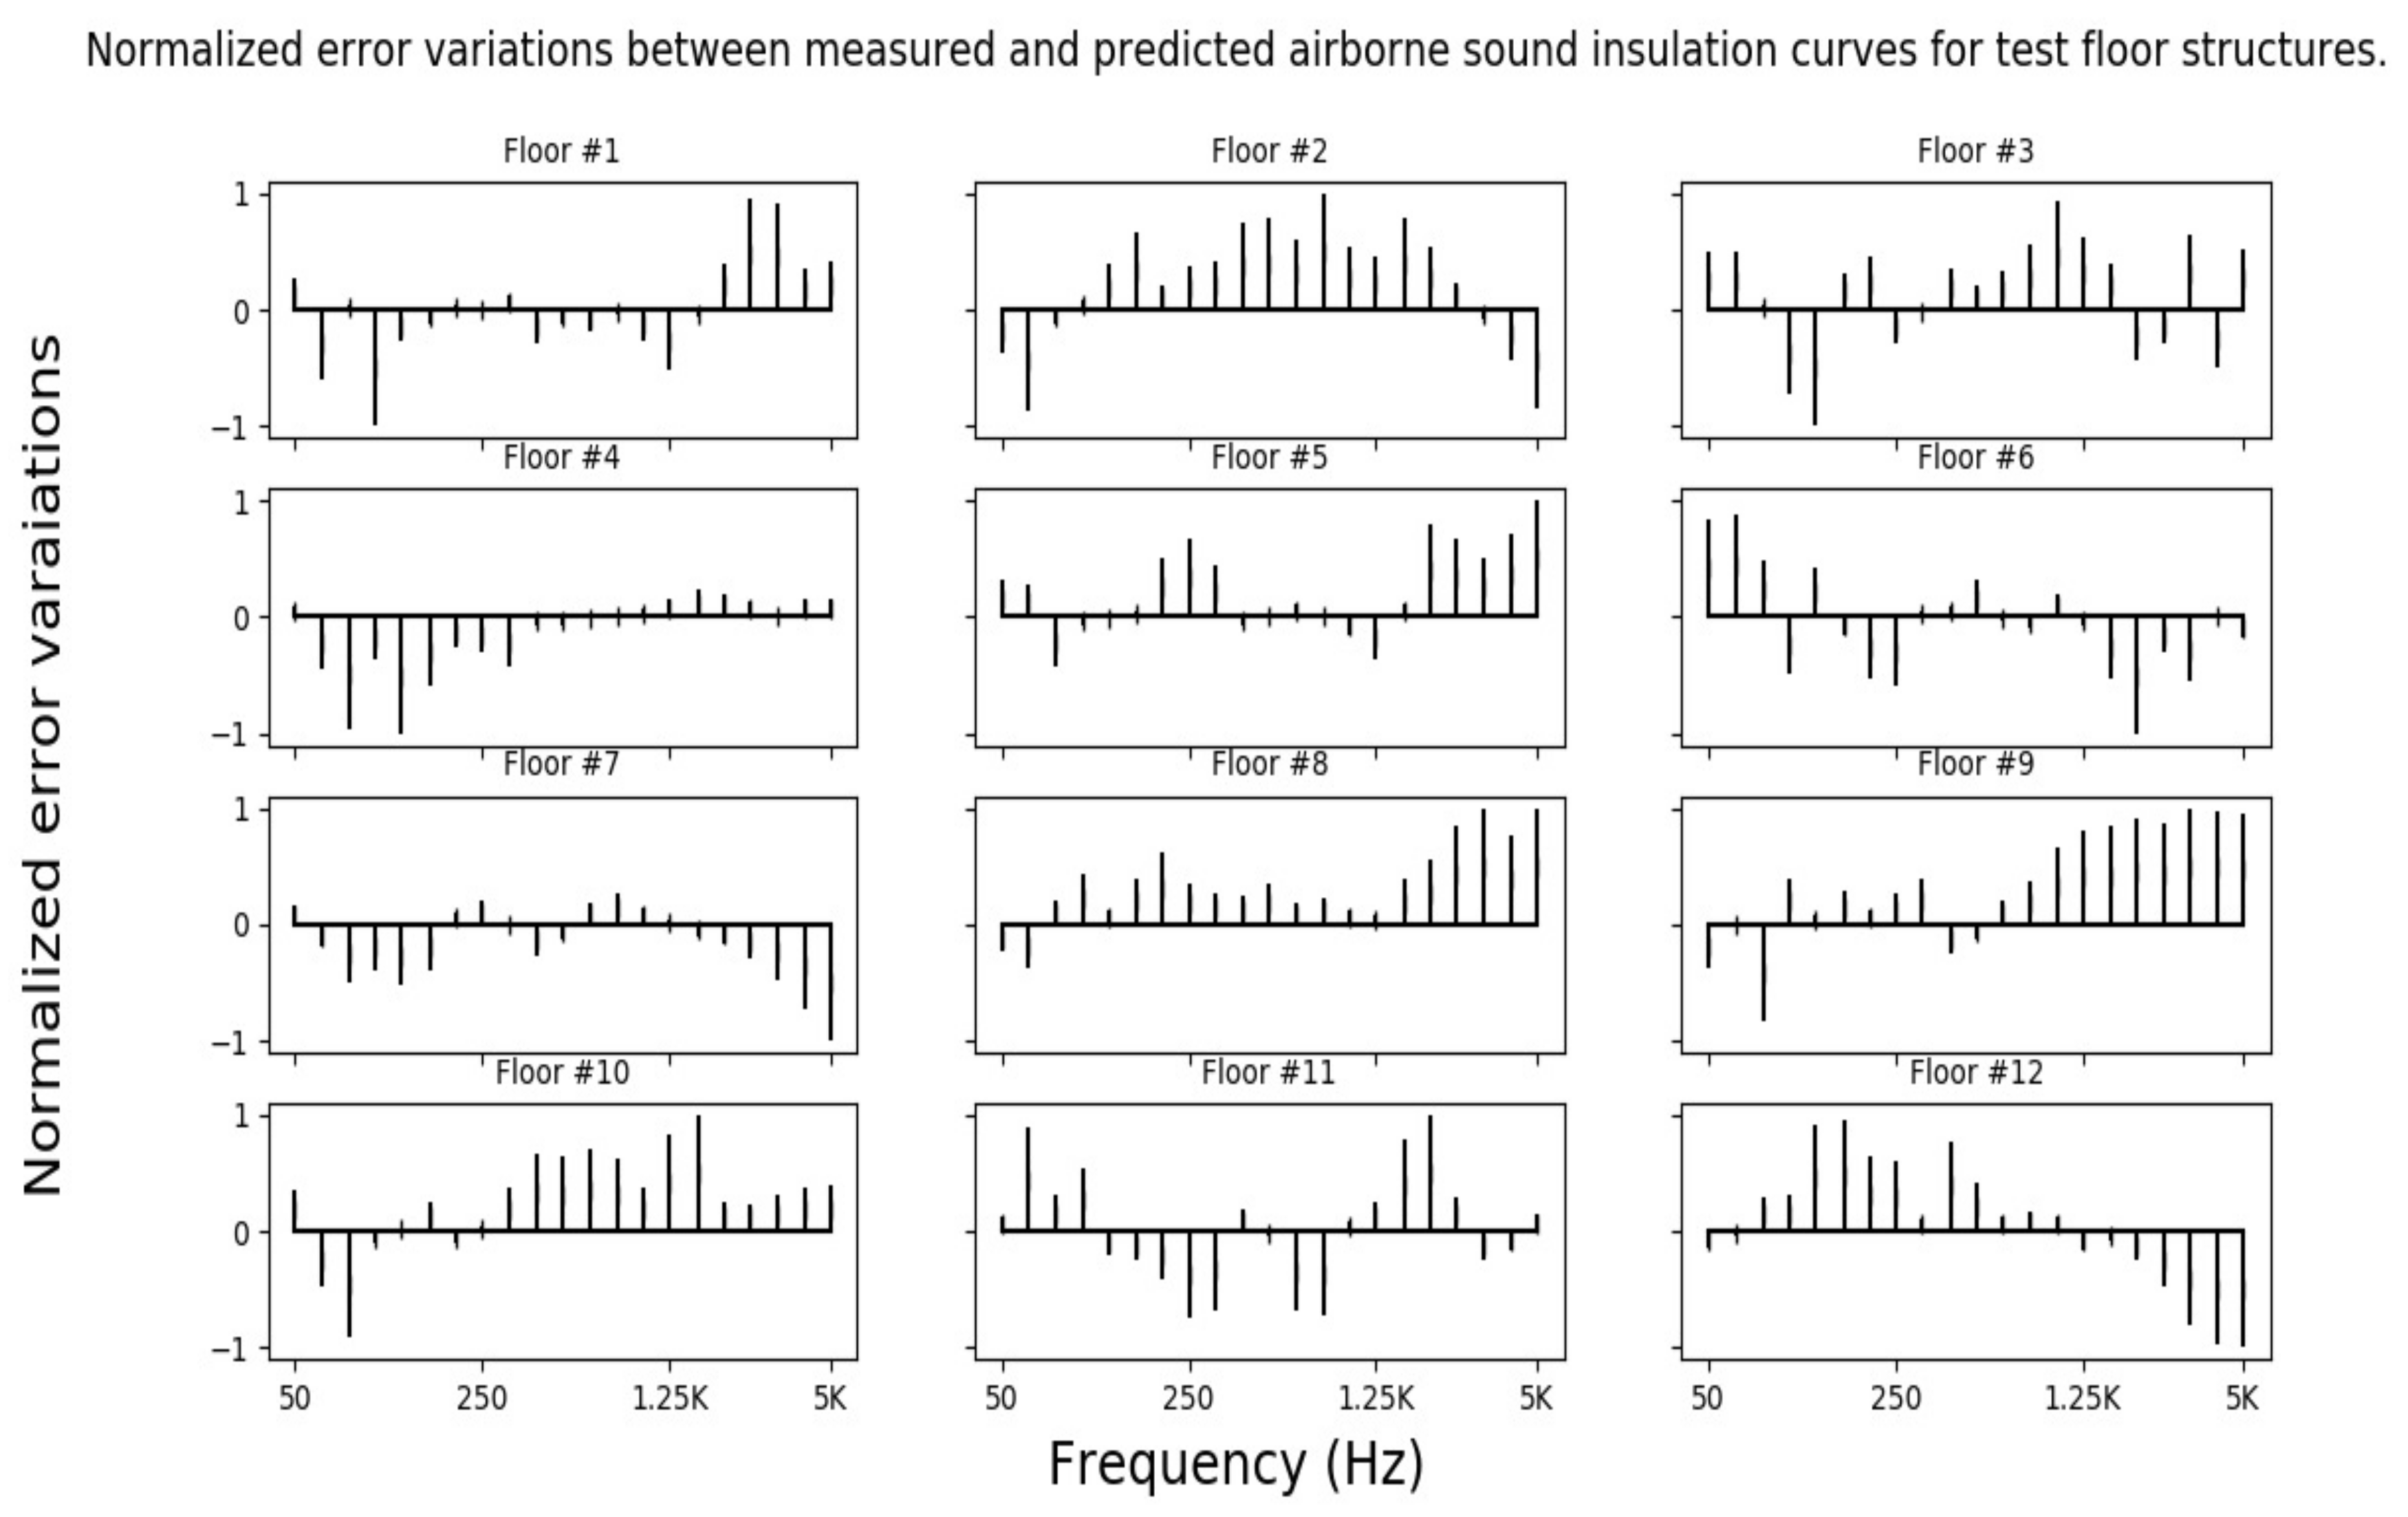
Test error variations in d B and normalized error variations (in the interval [ 1 , 1]) between measured and predicted airborne sound insulation curves of the test floor structures are presented in Figure 4 and Figure 5, respectively. Again, the biggest prediction errors are located in high frequencies, while in low-frequency bands, the model shows a good accuracy except floors #4 and #7 (Figure 4). For the normalized errors, there is a fairly random dispersion among frequency bands in every test case, though with a bigger density in middle and high frequencies (Figure 5).

3.2. Prediction of Impact Sound Insulation

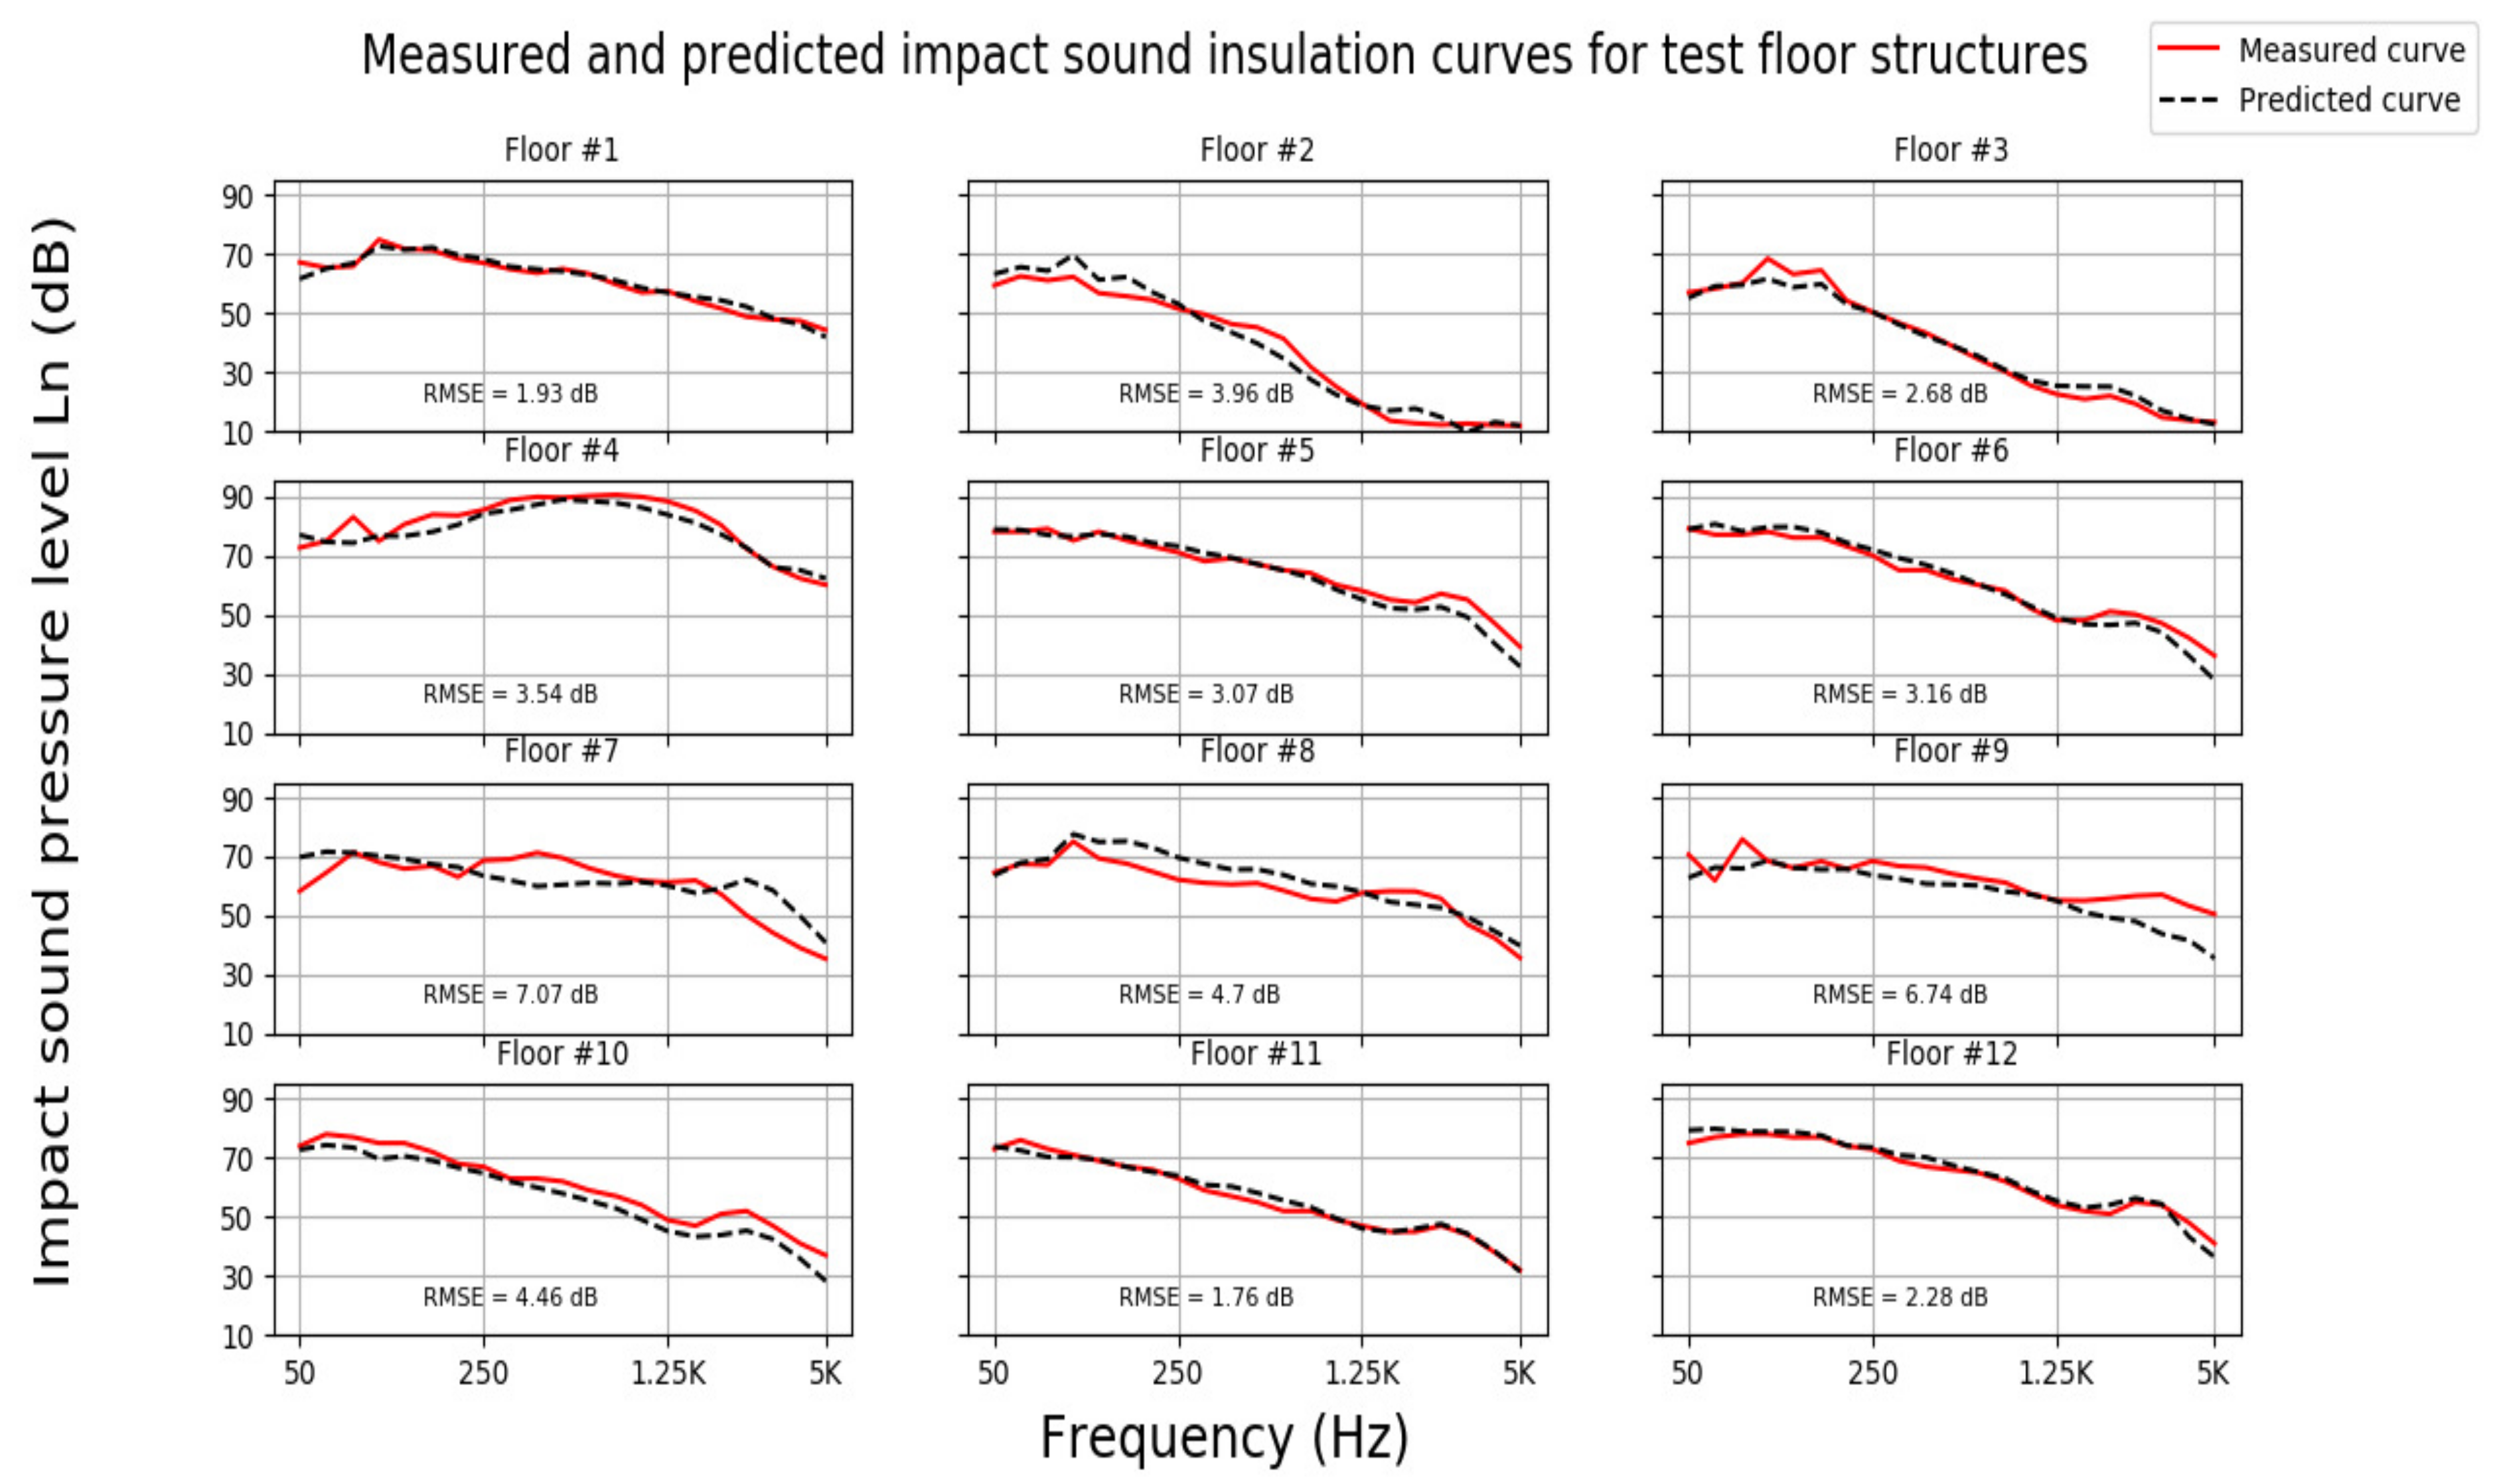
The same 12 test floors were selected randomly to evaluate the model in predicting the normalized impact sound pressure level curves in the frequency range 50 Hz to 5 kHz (Figure 6). In most cases, the model demonstrates a good agreement between the measured and predicted curves, especially in low and middle frequencies. The lowest deviation is 2.28 dB ( R M S E ) for floor configuration #12, while it is 7.07 dB for floor #7.
At frequencies around 1.25 kHz, there are often gaps between the measured and predicted curves, again due to the critical frequency effect, as seen for floors #3, #4 and #10. Likewise, similar deviations occur at fundamental resonances (first eigenfrequencies) below 200 Hz, e.g., for floors #2, #3, #4, #7 and #9 (Figure 6).
Regarding single-number quantities, the weighted normalized impact sound pressure level index ( L n , w ) and the predicted one ( L n , w P r e d i c t e d ) are calculated and presented in Table 4. The maximum error deviation is up to 5 dB ( R M S E ) for the worst cases of floors #2 and #3, while the estimated weighted index is equal to the measured one for floors #1 and #11. Again, the calculated and predicted correction terms, C I , 100 2500 and C I , 50 5000 in Table 4, also show errors of 0–3 dB, without any extreme values but within the range of deviations for the weighted indices: L n , w and L n , w P r e d .
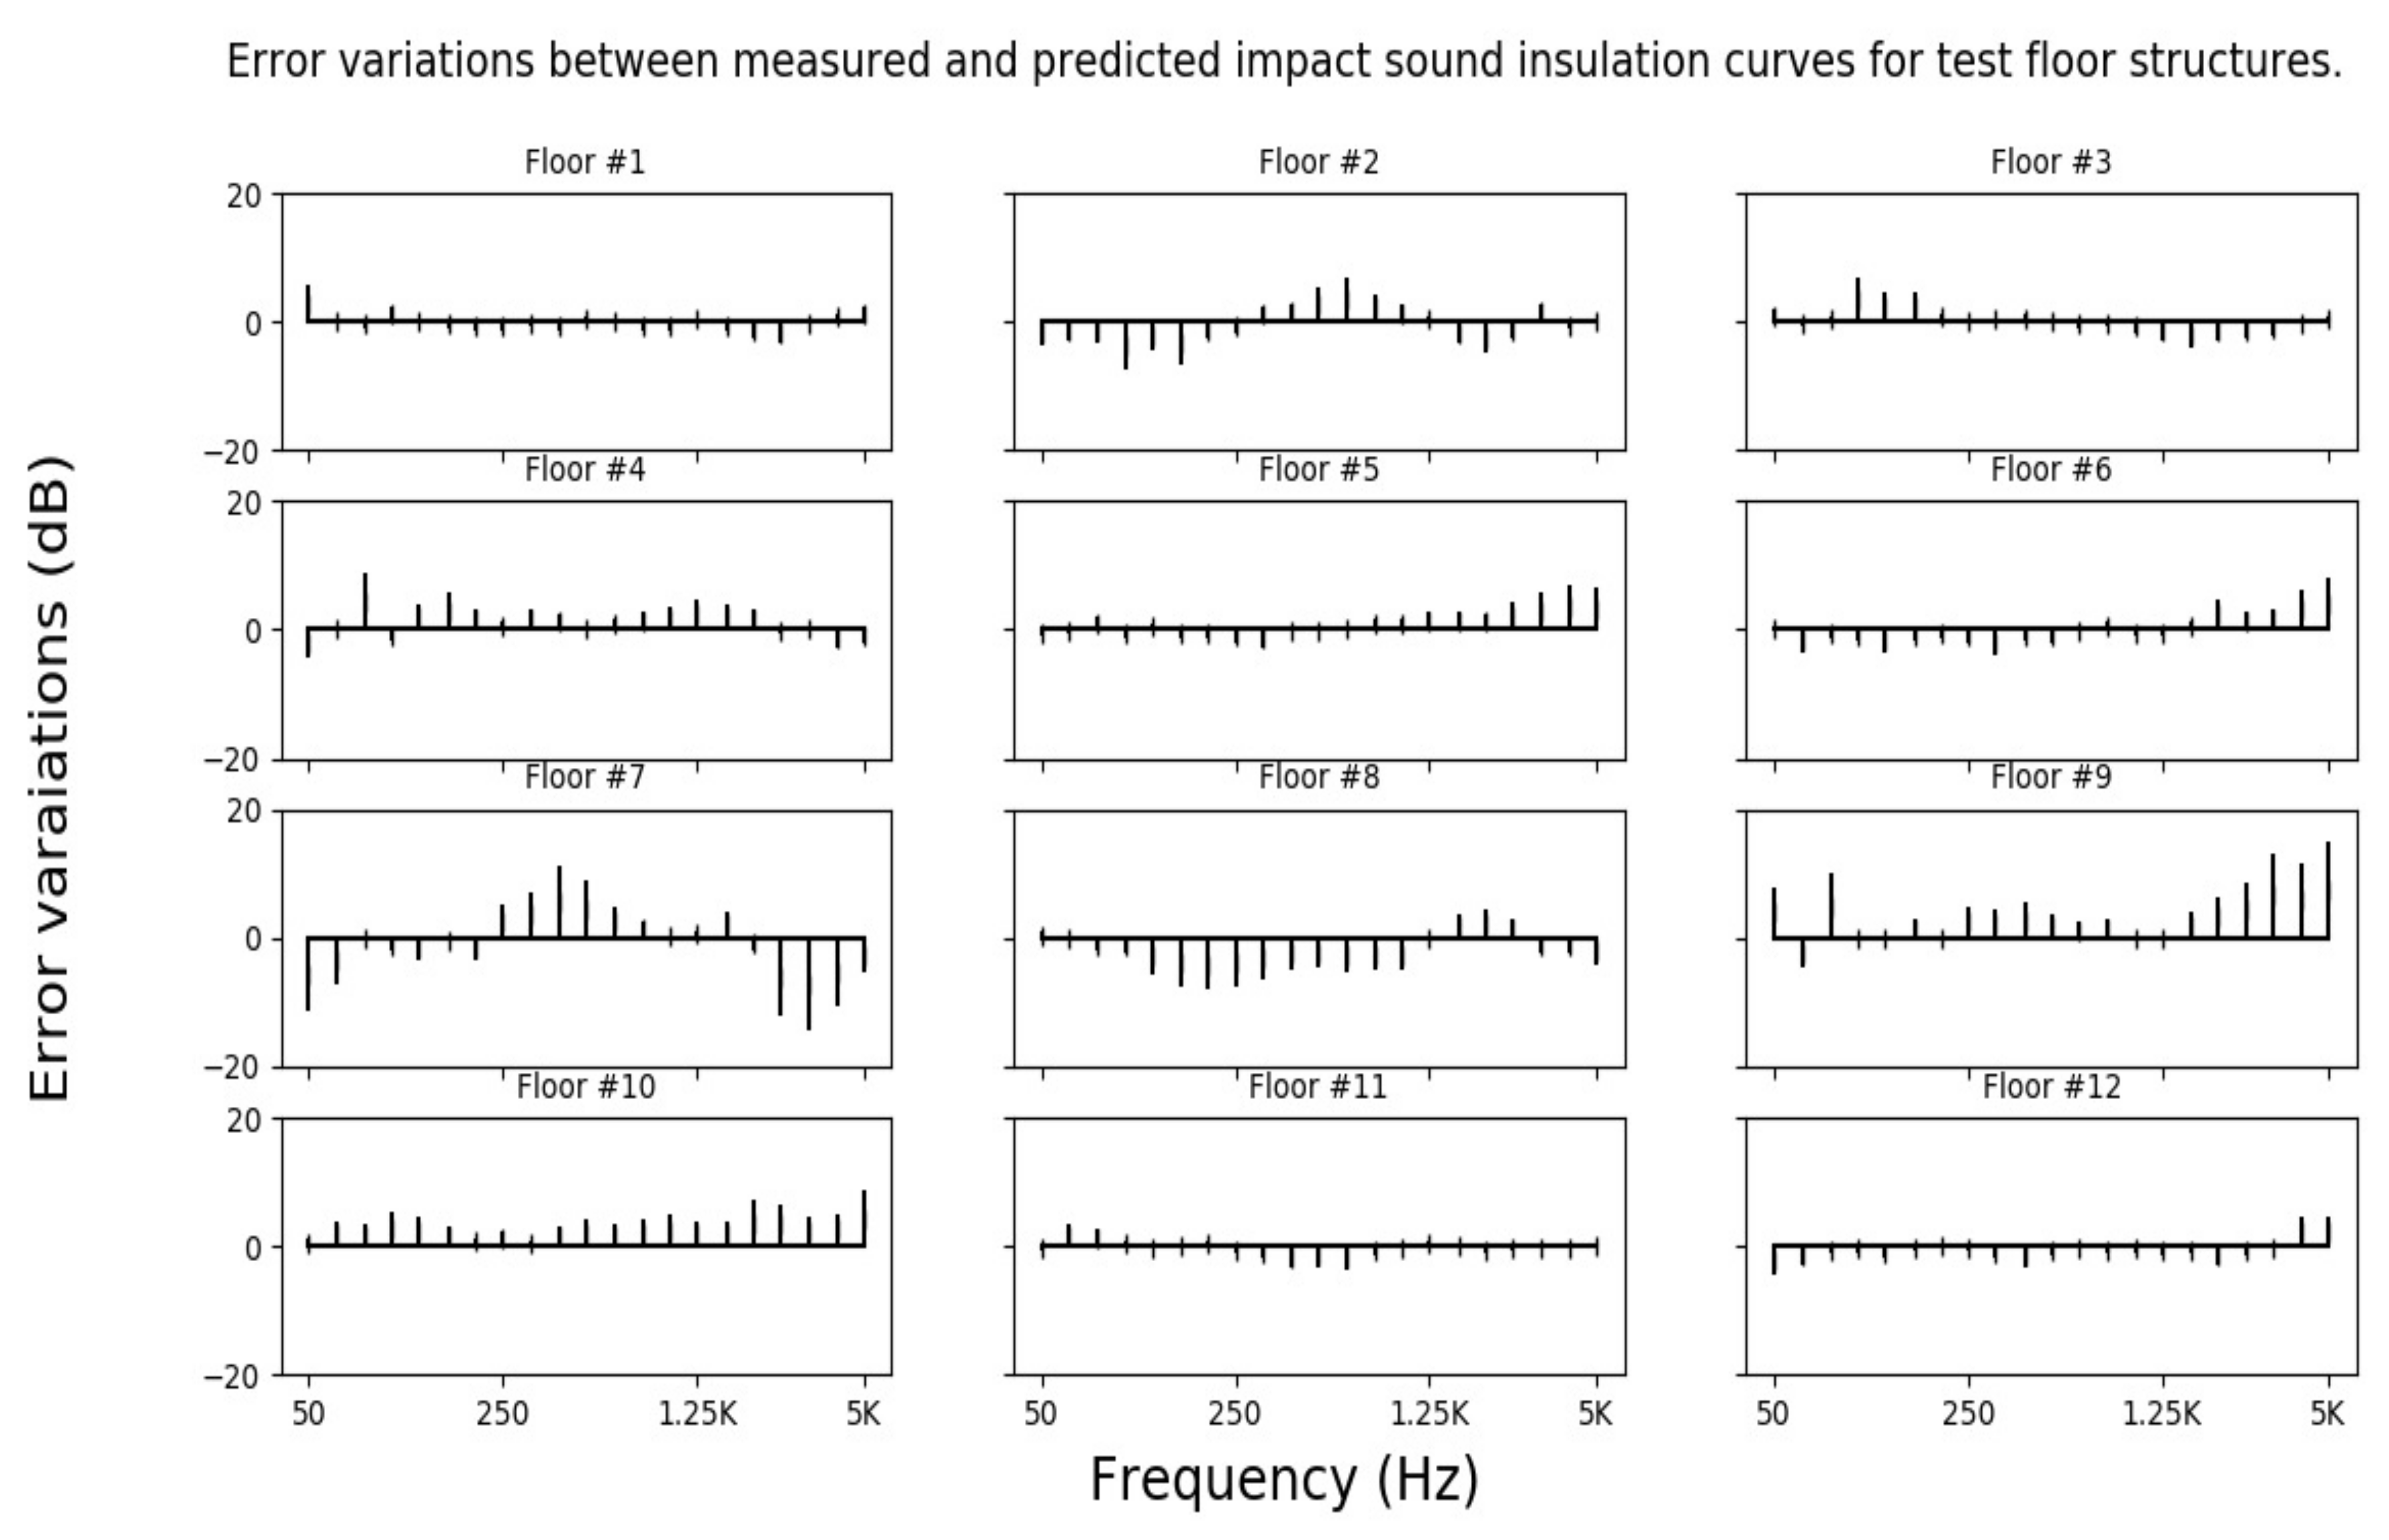
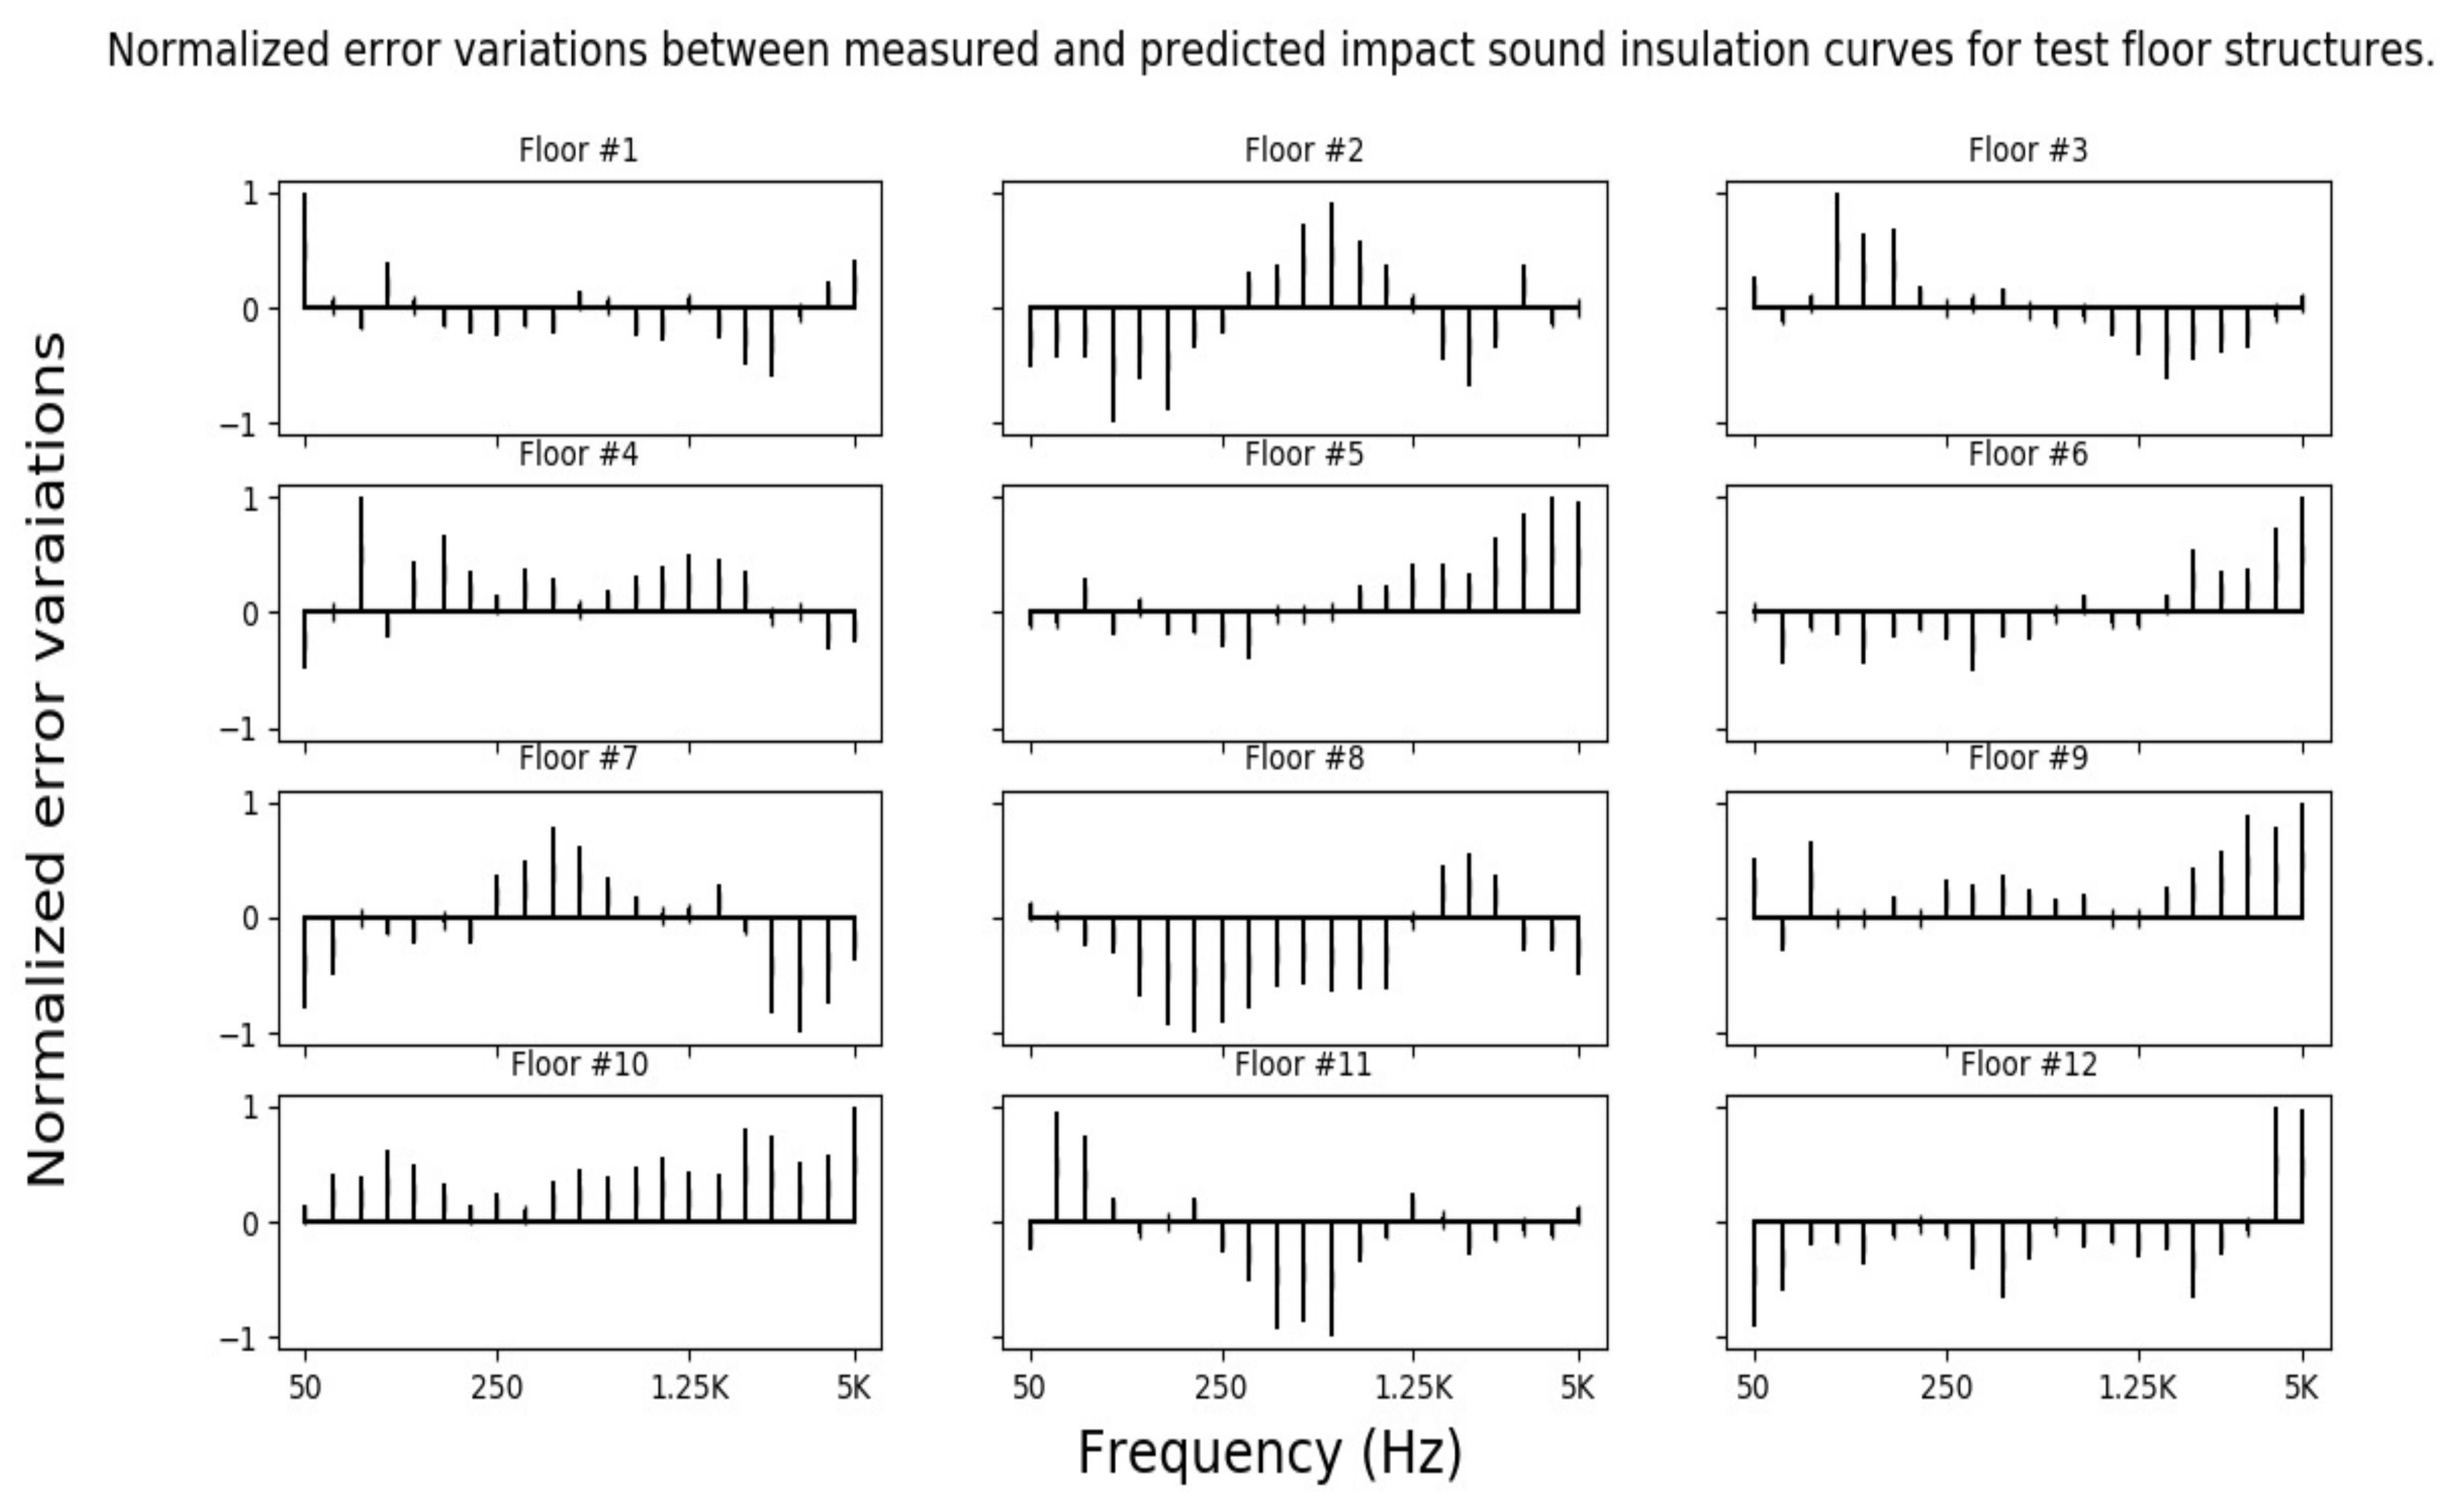
Prediction error and normalized error deviations are illustrated in Figure 7 and Figure 8, respectively. The predicted dB values for impact sound pressure levels in the low-frequency bands are more precise than high frequencies, except for floors #7 and #8. This is significant because low frequencies are usually vital in building acoustics [73,74,75]. It is also known that impact sound curves have important low-frequency content with probably greater measurement uncertainty, because of the laboratory receiving room effects. Those effects rely on the location of the Schröder frequency above which the diffuse field assumptions hold, but below that there can be unpredictable influence from the room’s sound field during measurements [76,77].
Finally, the normalized error distribution across frequency bands seems to be equally random across low-, middle- and high-frequency bands. Hence, for impact sound prediction the ANN model does not show any greater errors in high frequencies, compared to the airborne sound case.
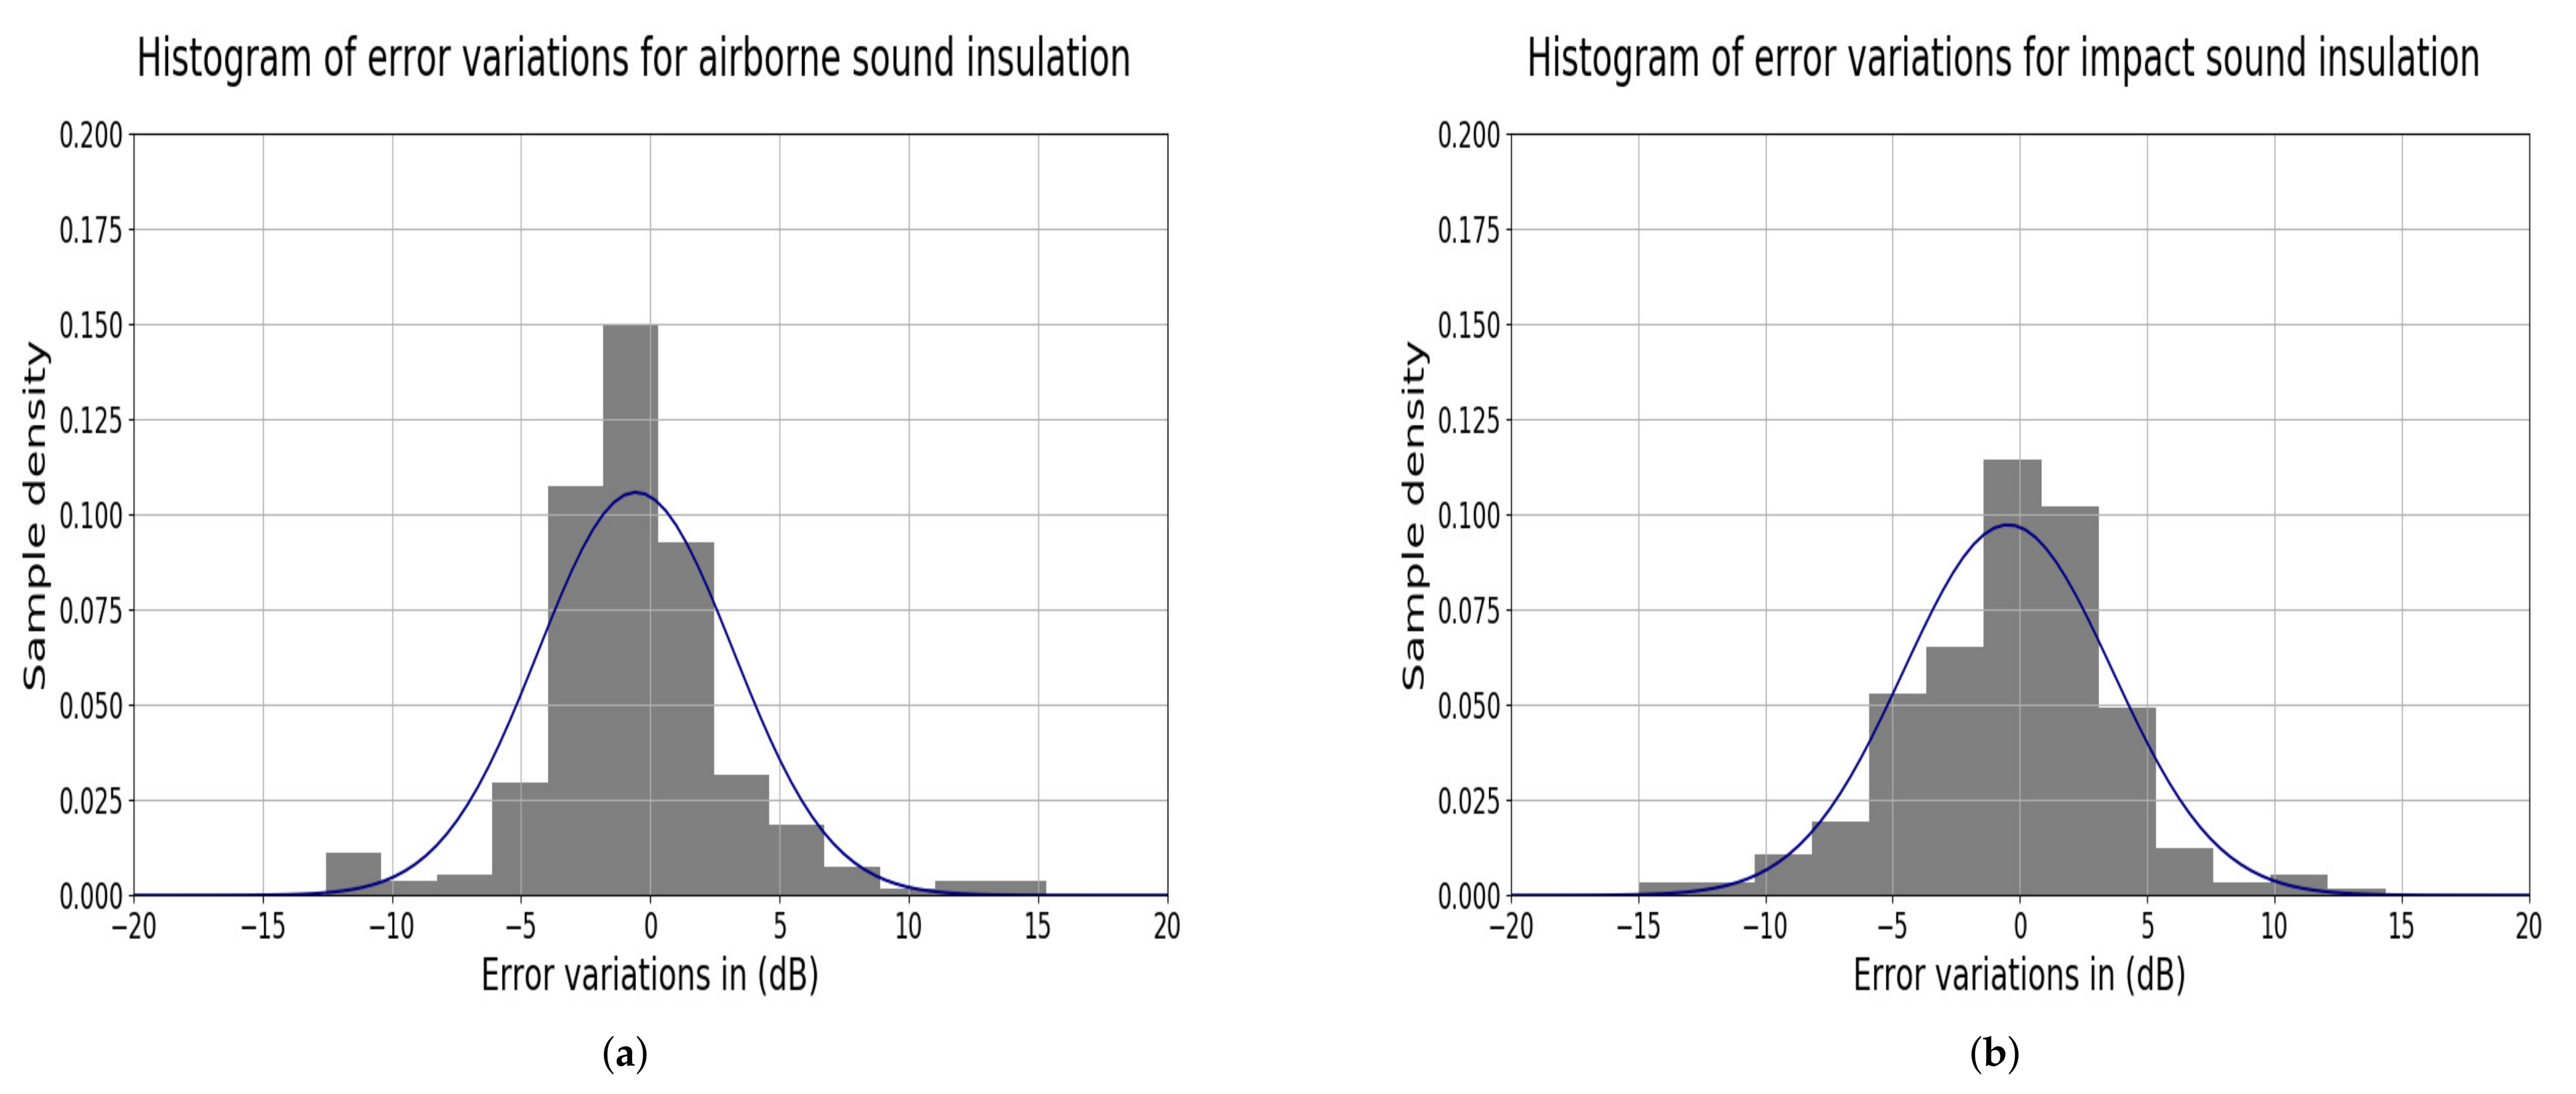
Figure 9 represents the histograms of error variations in prediction airborne sound and impact sound insulation curves for test floor structures in the frequency bands (50–5000 Hz). It can be observed that errors are more dense in the range of (−5, 5) dB for both airborne and impact sound estimation. Figure 9a,b show that the histograms are not symmetric with a higher peak for airborne sound reduction index and a lower one for impact sound pressure levels. They reveal a higher accuracy of forecasting airborne than impact sound insulation curves, which is also reflected in the calculation of single-number quantities ( R w and L n , w ).

3.3. Sensitivity Analysis

A feature attribution analysis is performed to explore the relationships among parameters and how they affect the sound insulation estimations. This analysis is essential for this type of modeling in order to examine the importance of each data set parameter in the prediction. Therefore, feature attributions not only evaluate the significance of different parameters, but also provide an overview of influence in every frequency band.
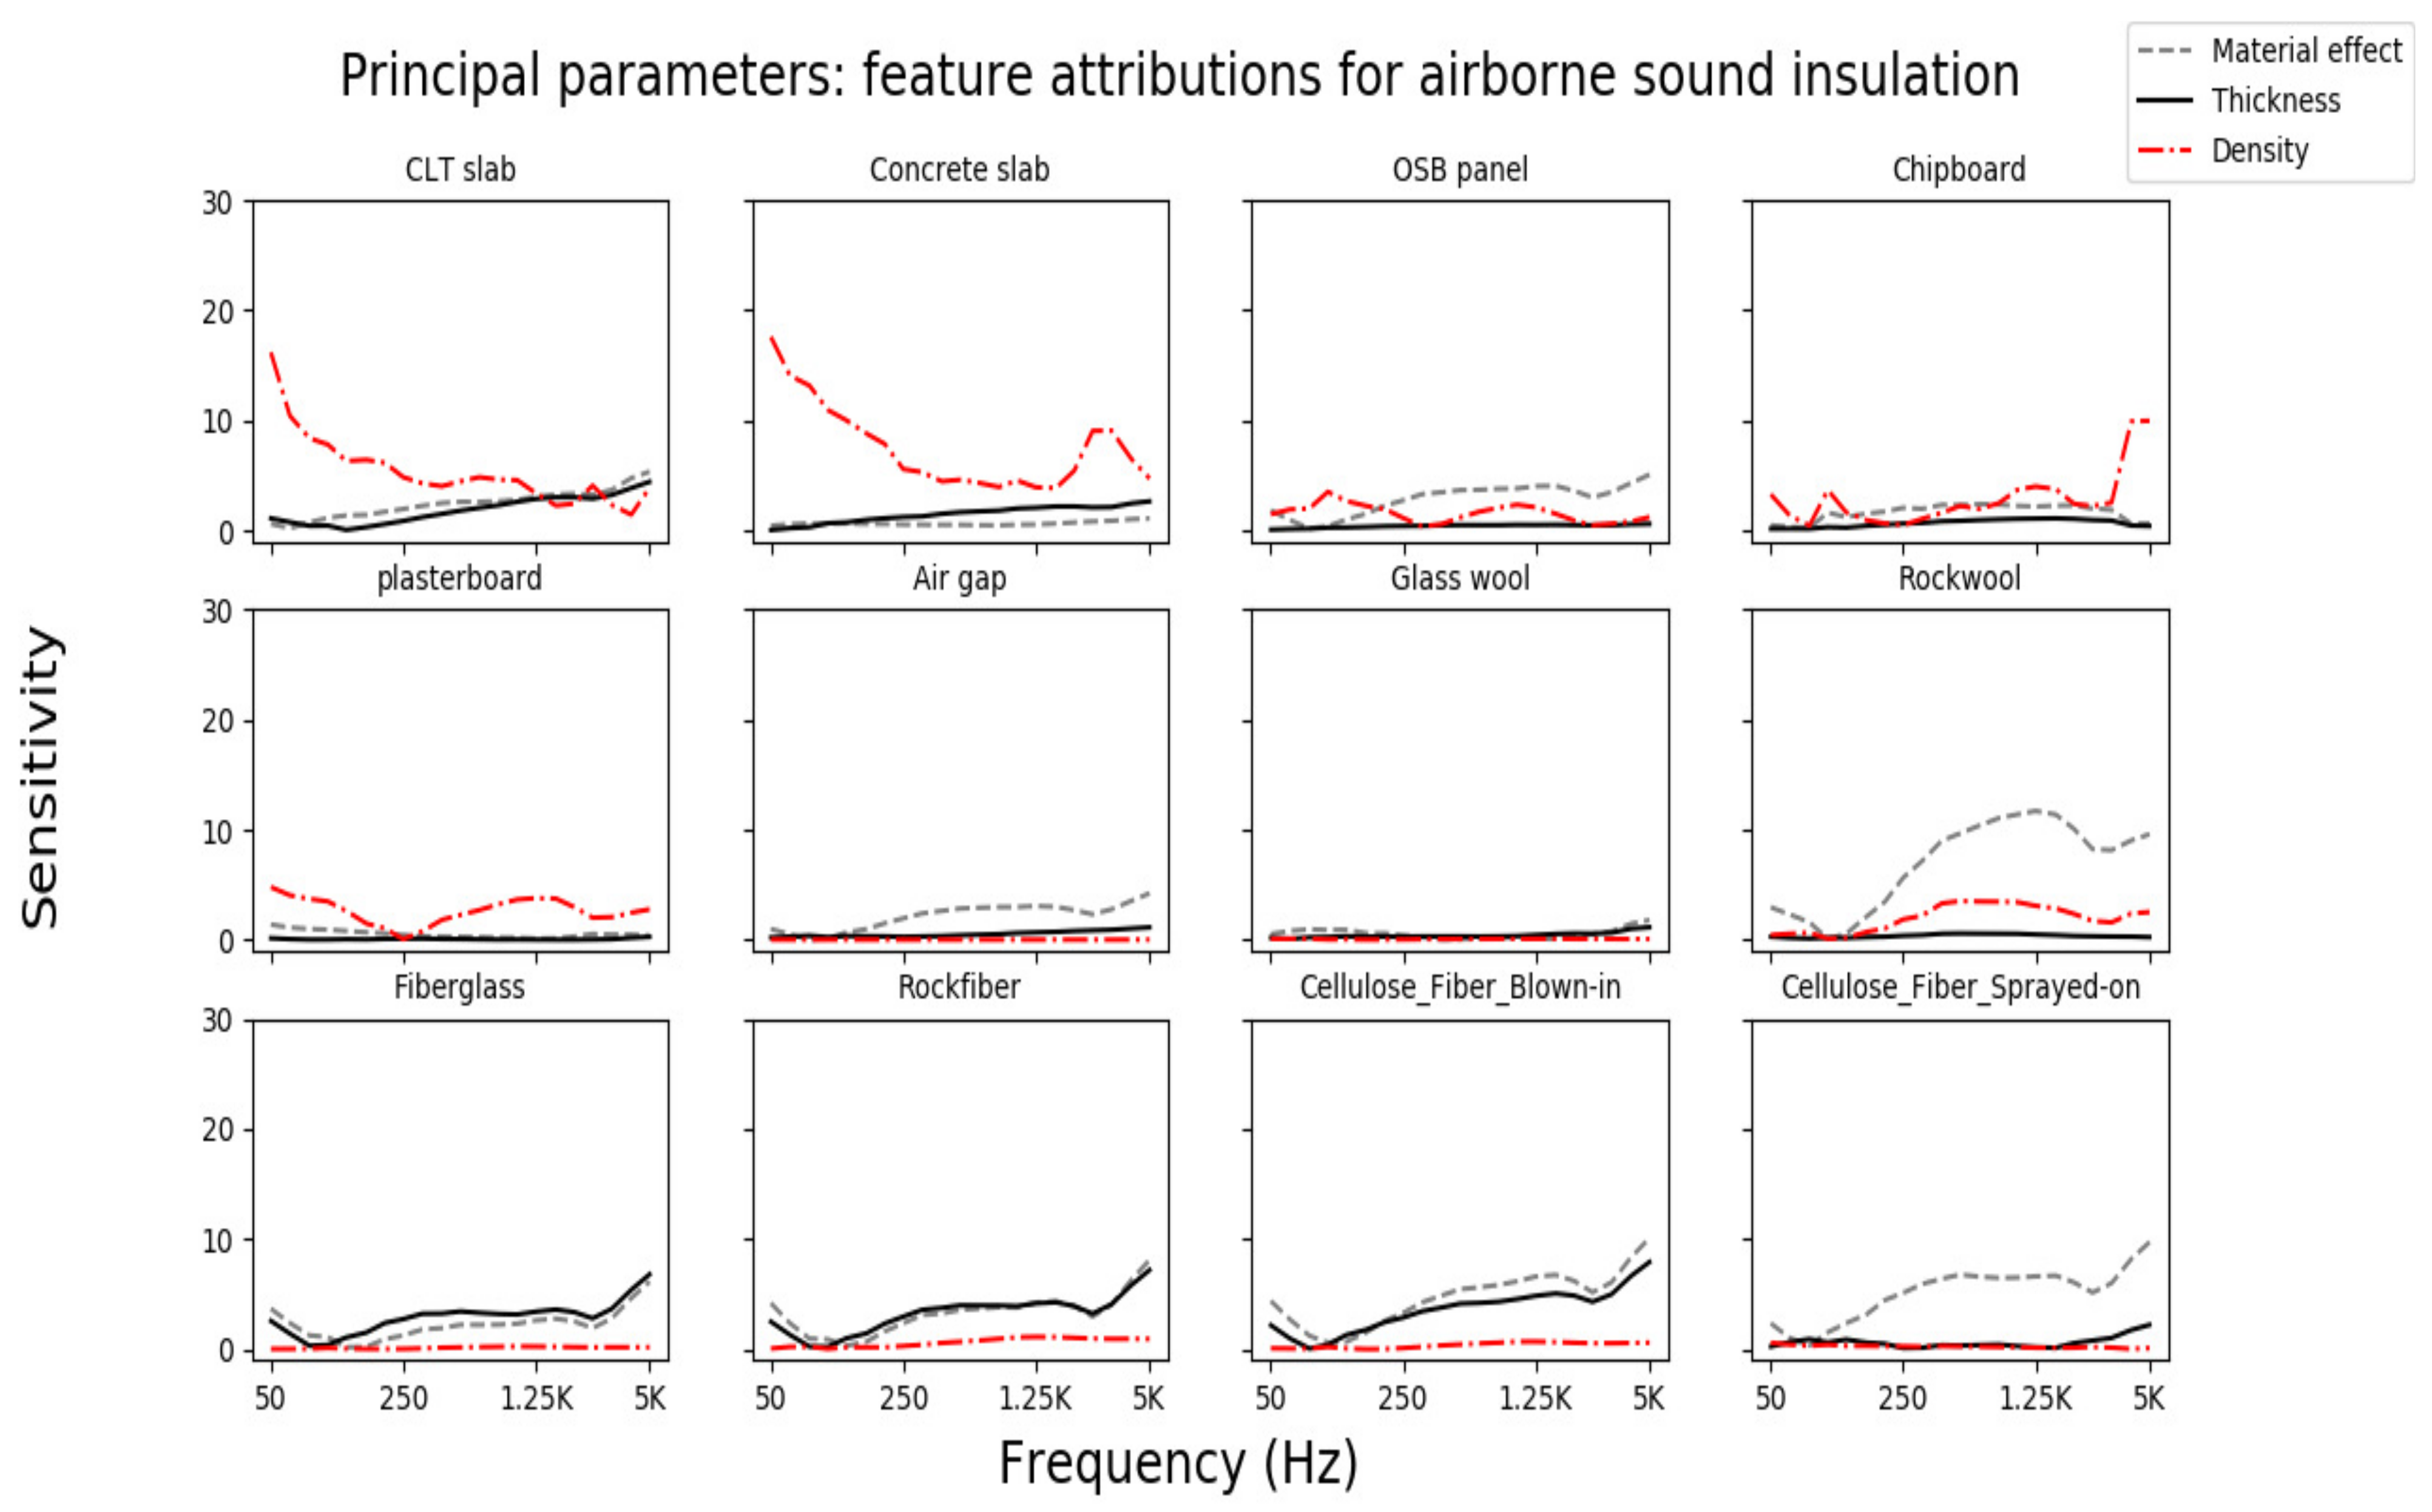
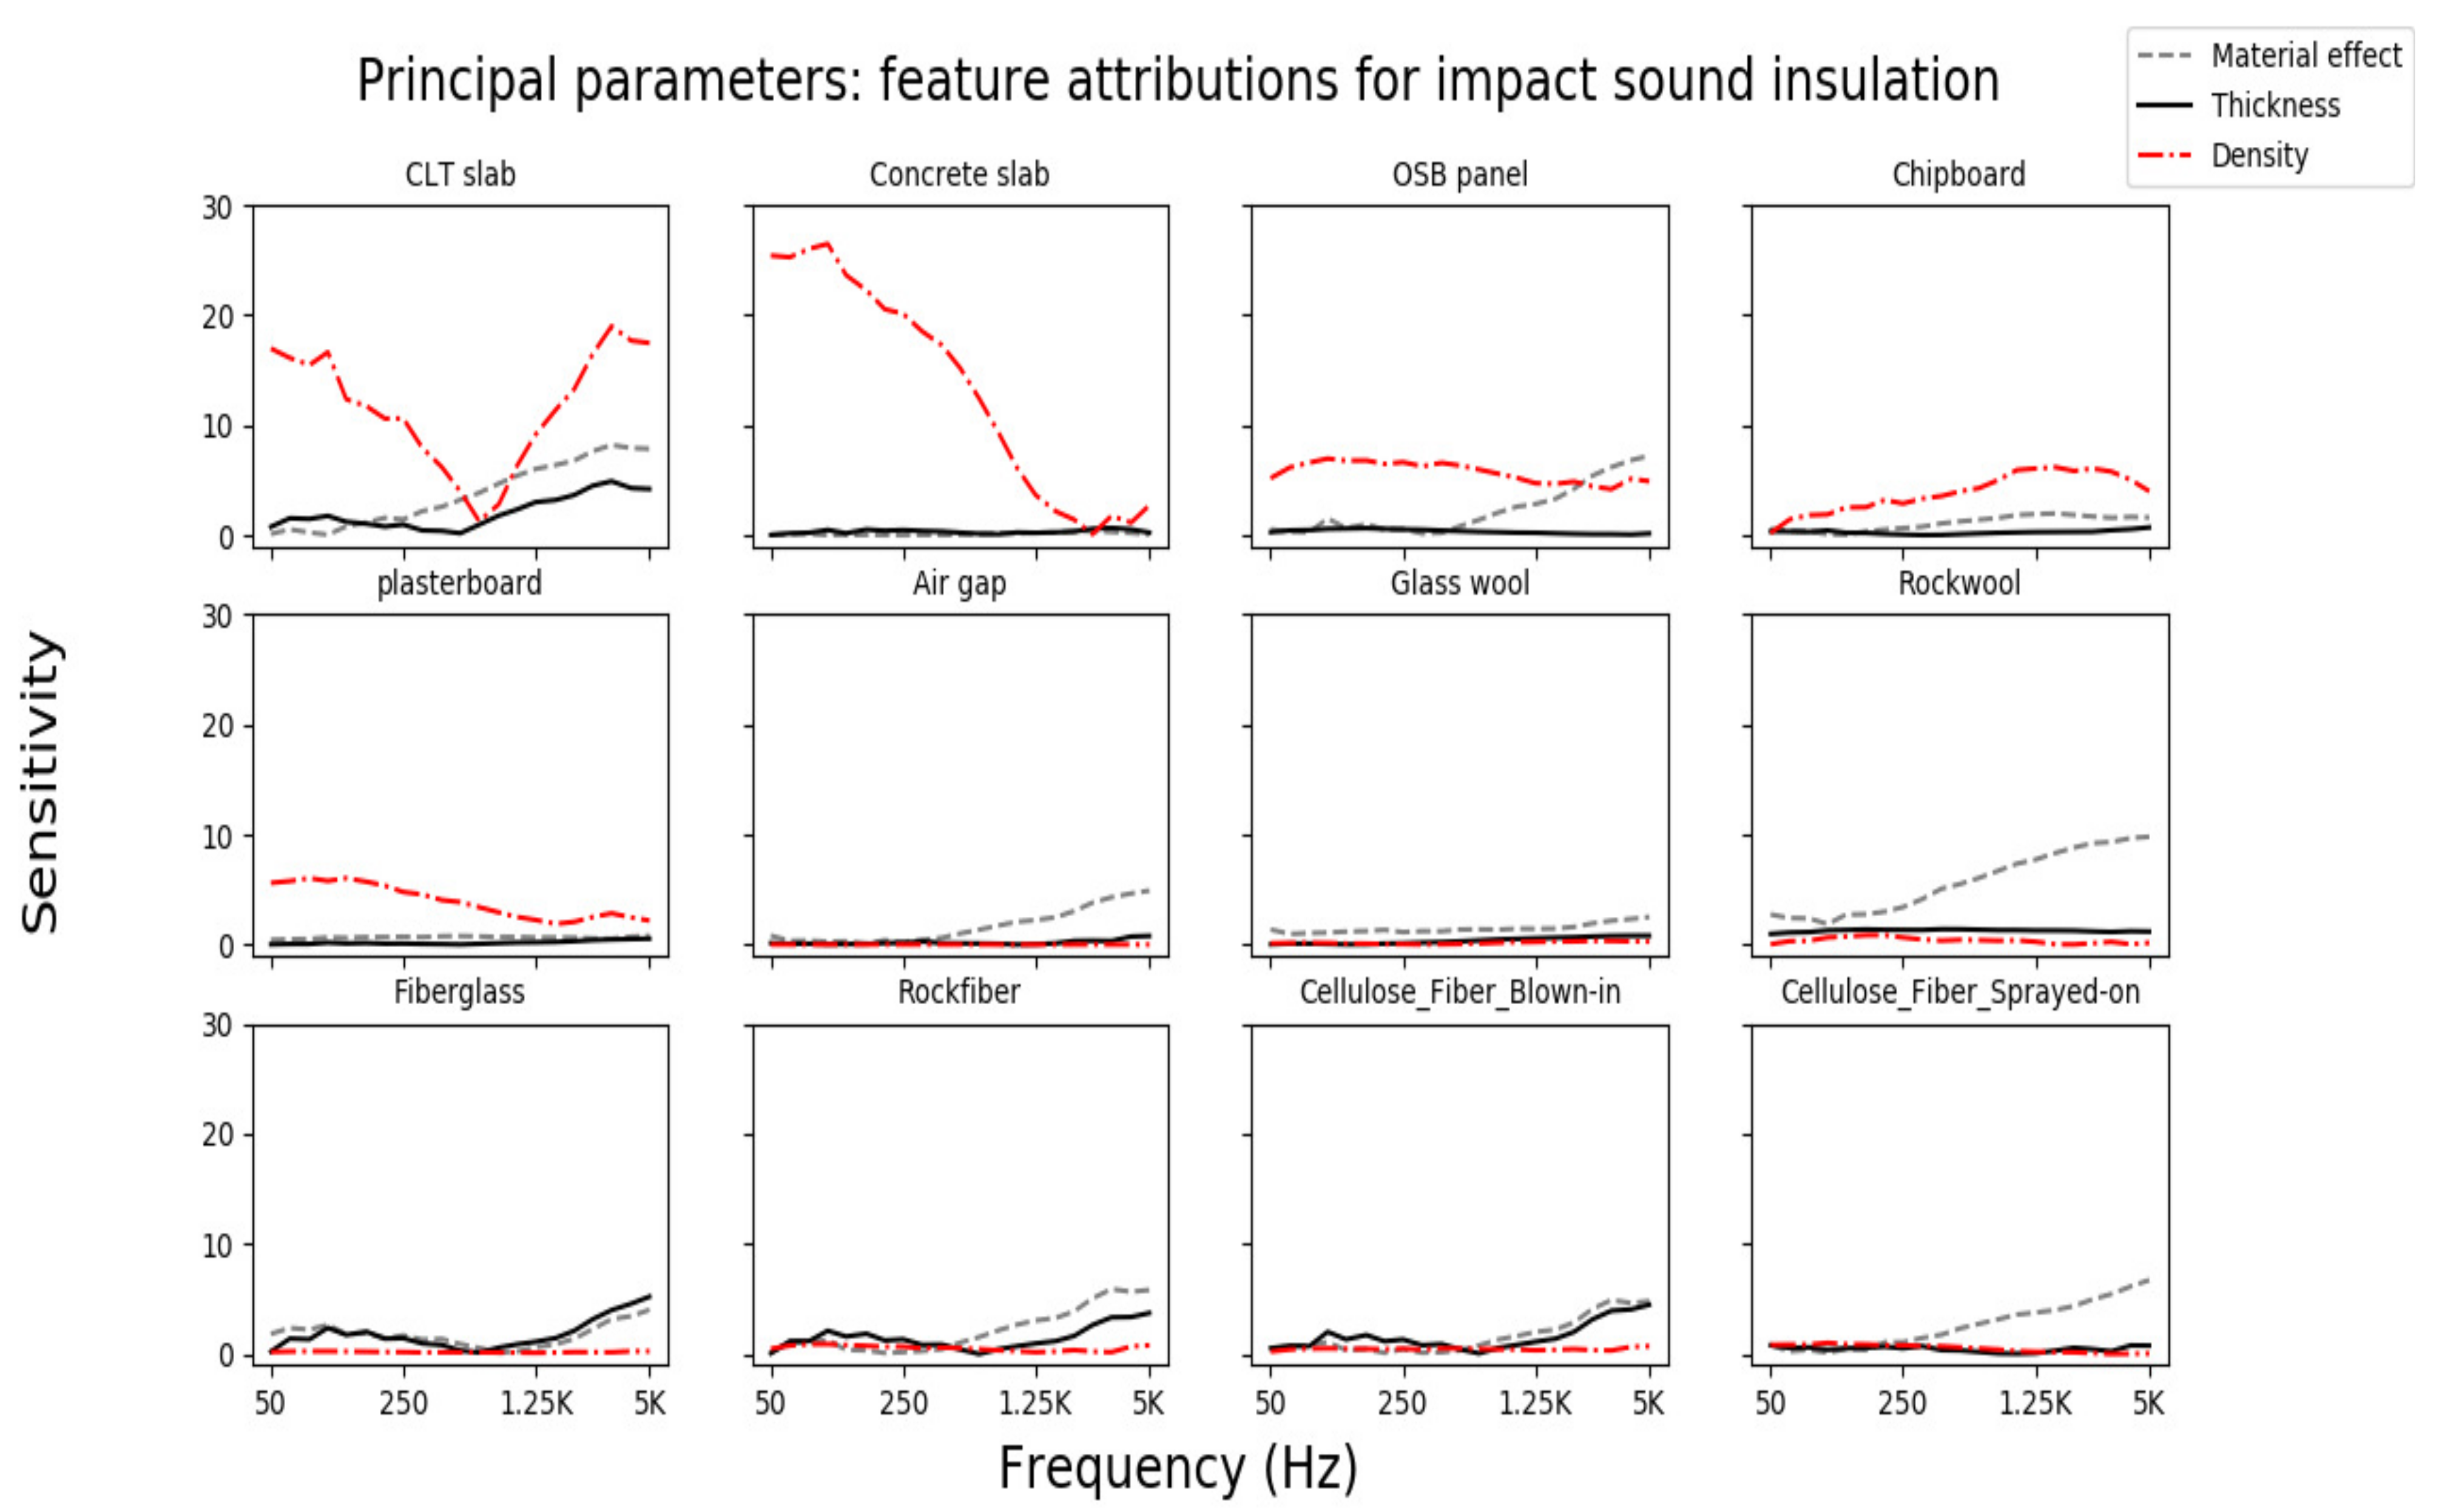
Certain materials have been chosen to analyze their contribution to the sound insulation estimation depending on their most frequent presence in the measurements (Figure 10). The analysis utilized physical parameters, such as: the floor tested area, the volume of the receiving room, thickness and density of upper, main and ceiling parts of floors and other parameters to reveal their effect on the modeling (Figure 11, Figure 12, Figure 14 and Figure 15). In those graphs, a user can evaluate relationships between input and output values as follows: the y-axis represents the effect size, which quantifies the importance of each parameter in the prediction of sound insulation curves. If y values are greater than zero, that indicates a direct relationship between the parameters and the outputs, whereas an amount near zero suggests a weaker relationship. The integrated gradient technique focuses on the importance of each parameter in the prediction [58]. It often produces signed values, which are considered ambiguous in certain applications [54]. The utility of taking the absolute values or not strongly depends on the characteristics of the data set. For this study, taking the absolute value of the gradient could provide better understanding for interpretation of the results, as the goal is highlighting the most significant parameters.
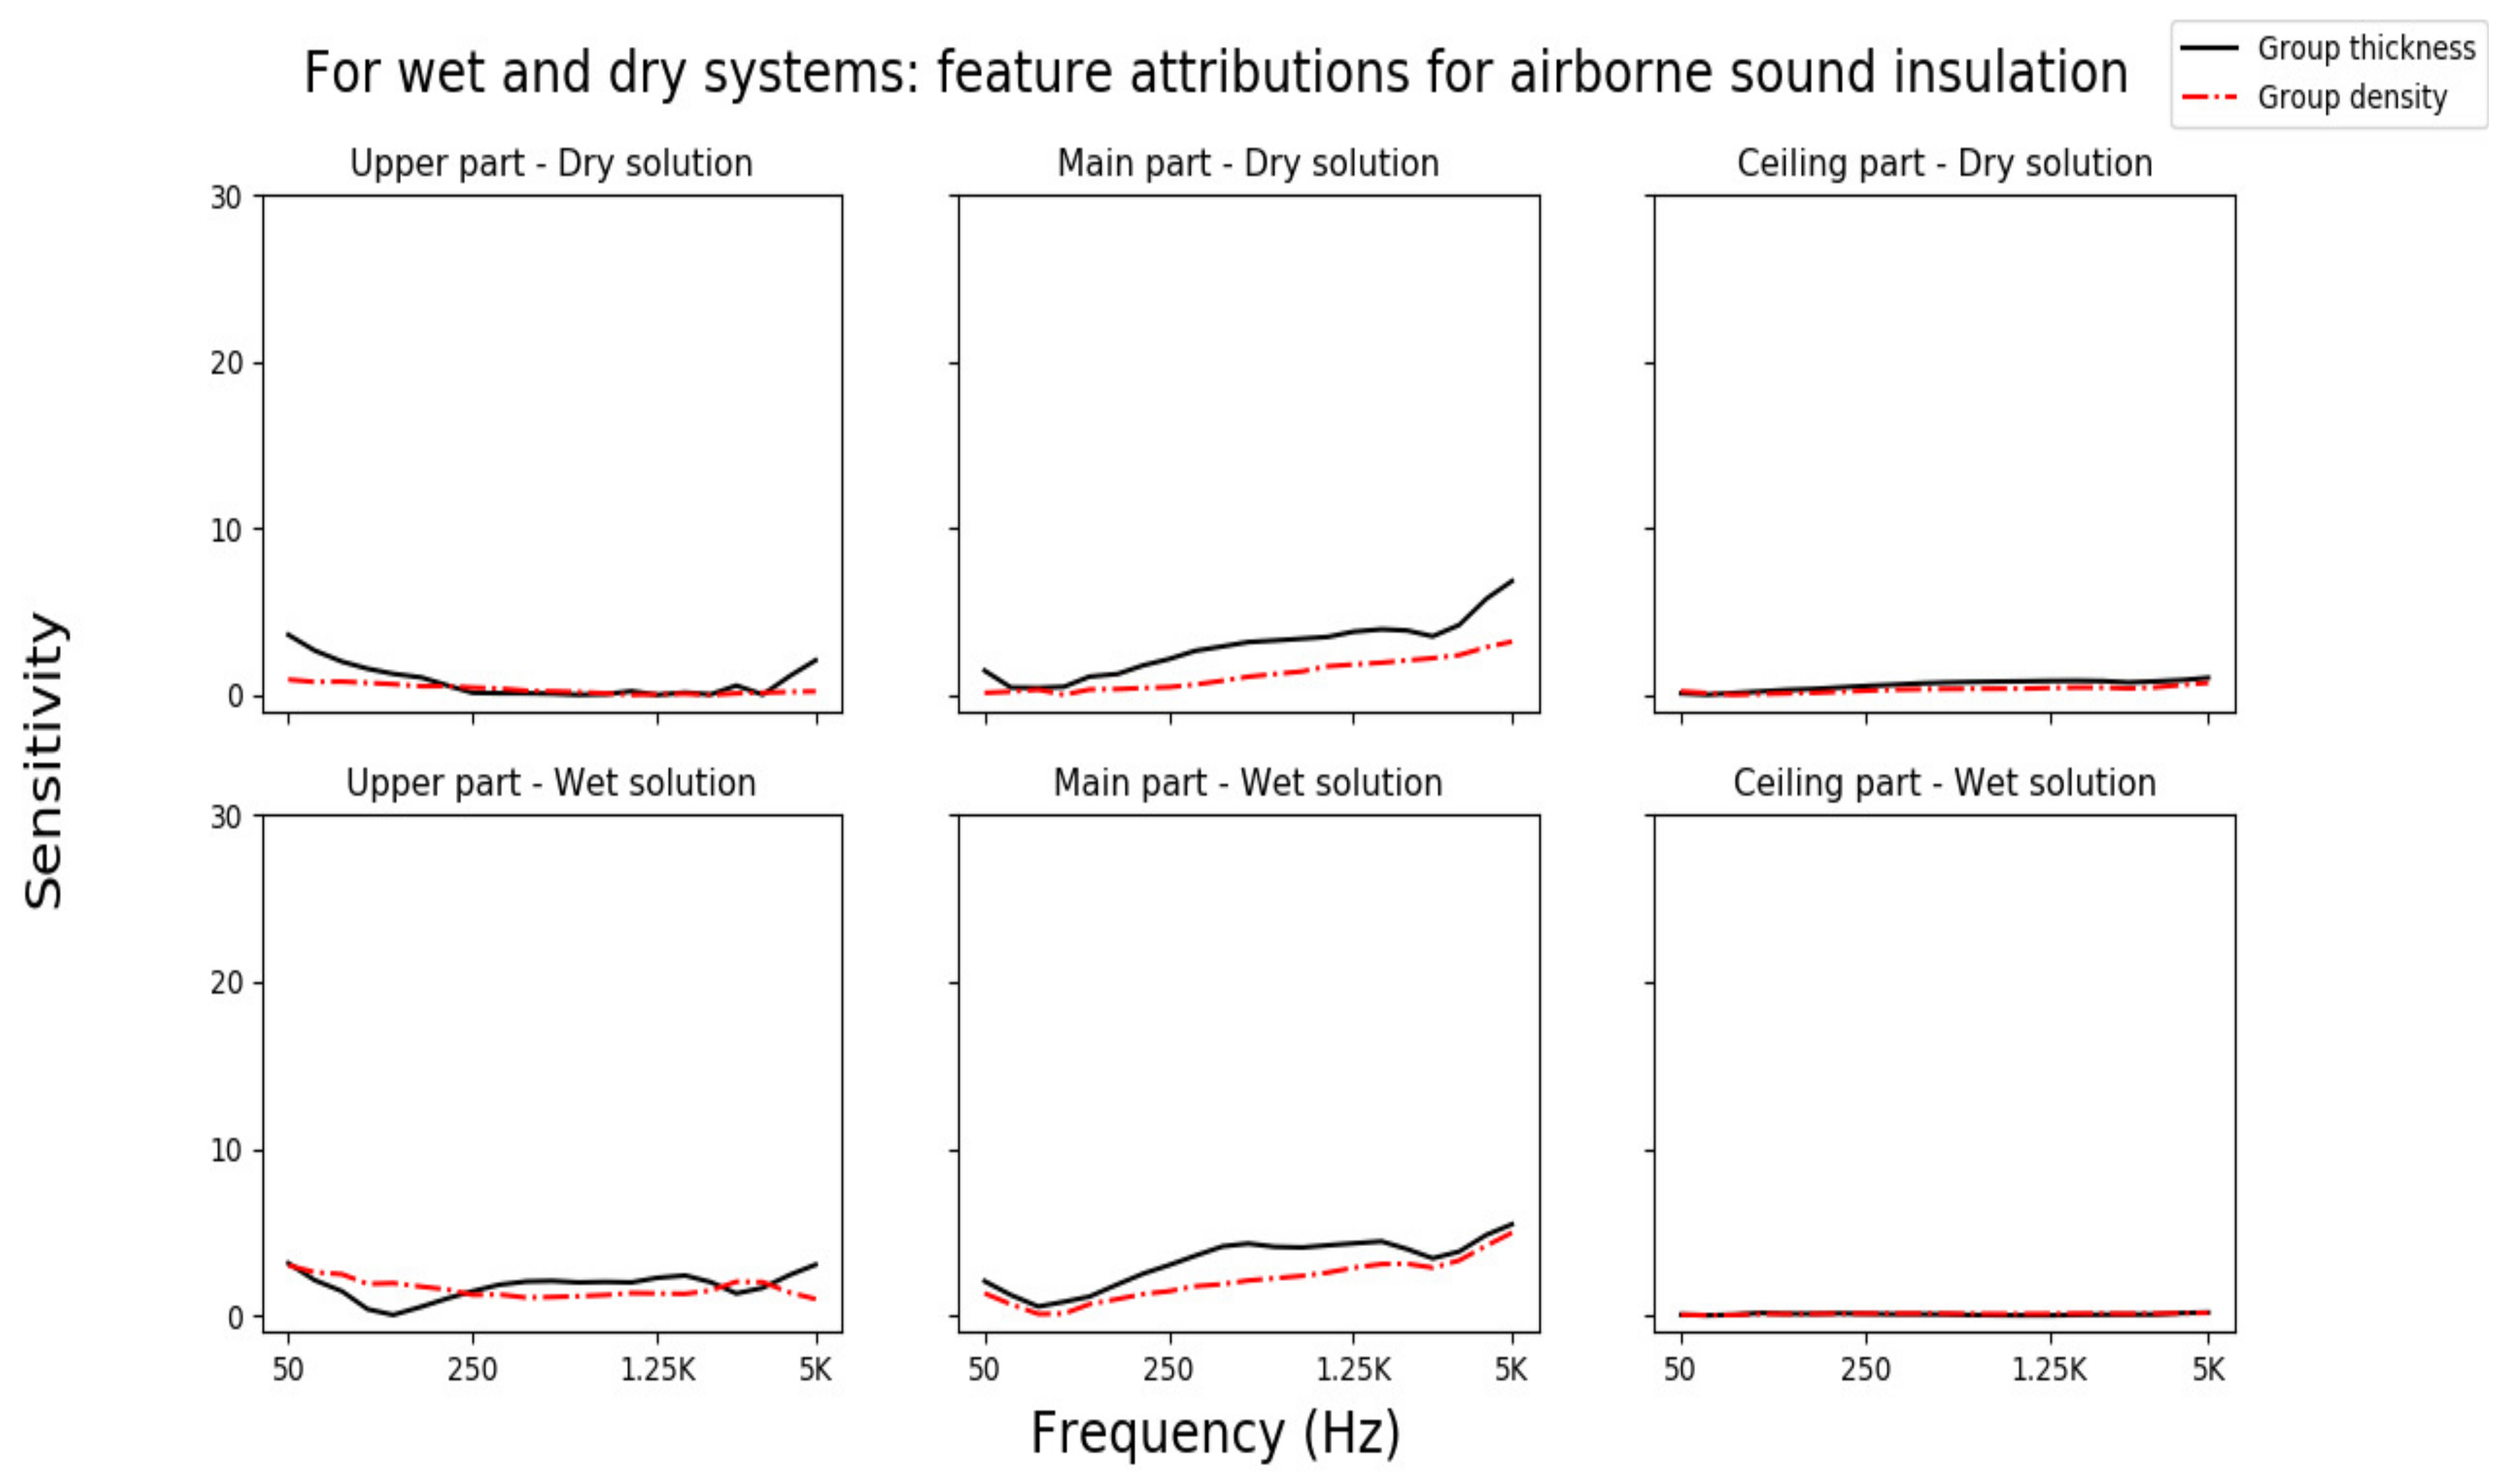
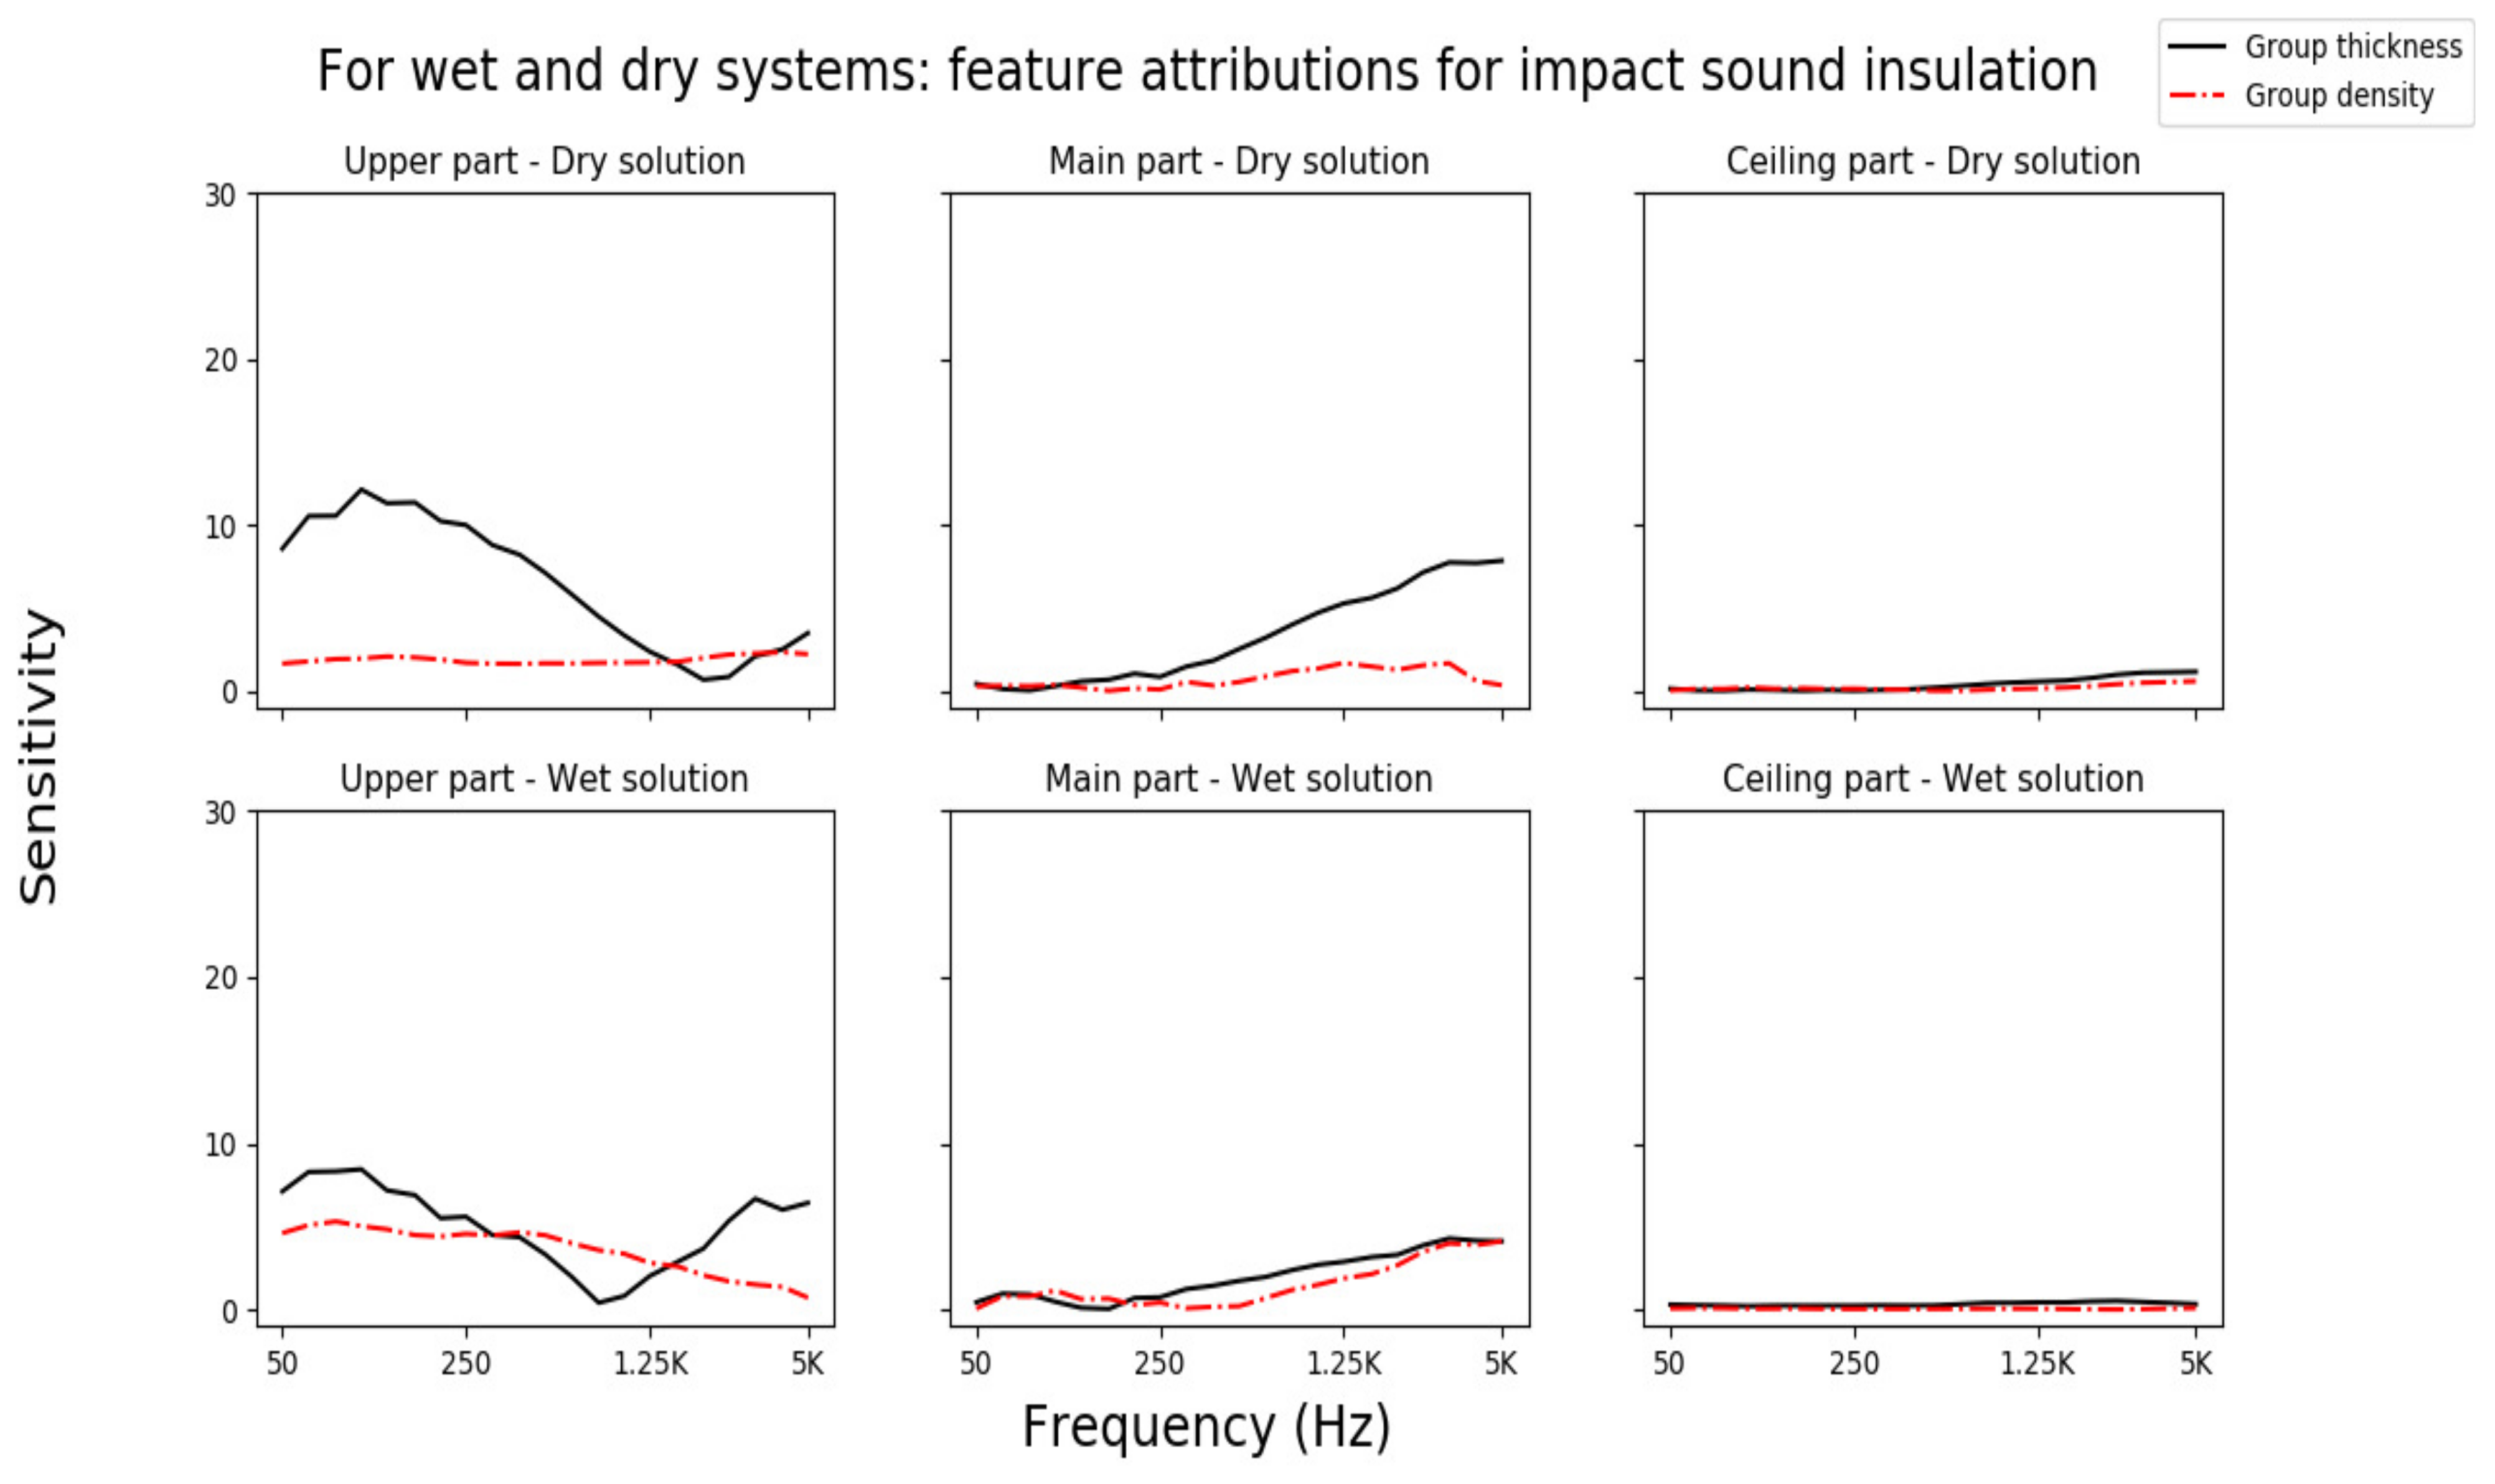
Another classification is applied on the measurements in order to investigate the influence of upper, main and ceiling parts of dry and wet floor solution systems on prediction of sound insulation curves. Wet floor systems can be defined as lightweight wooden floor structures with a light concrete part on top as a floating layer, whereas dry floor systems refer to wooden floors without any concrete layer on the top.

3.3.1. Feature Attributions for Airborne Sound Insulation

Figure 10 depicts the feature attributions of specific materials to airborne sound insulation estimation. It describes the effect of thickness and density of the materials and shows the effect size of the presence of each material. In the low frequencies, the densities of the concrete and cross-laminated timber (CLT) layers have a significant influence on the prediction. In the middle- and high-frequency bands, the sensitivity effect of the density of the concrete layer and CLT panel decreases but remains important. Additionally, the densities of oriented strand board (OSB), chipboard and plaster board layers have non-negligible attributions across all frequency bands.
The thicknesses of some insulation materials (e.g., fiberglass, rockfiber, cellulose fiber) are factors with higher weight in the prediction. Unexpectedly, this is not the case for glass wool and rockwool in the presented ANN model. Contrary to a previous study [78], there are no differences in the sound reduction index with different densities of the rockwool in frequencies above 1.25 kHz. However, the presented ANN model highlights the effectiveness of the rockwool density in the middle frequencies, as is also concluded in [78]. Moreover, the existence (material effect) of some materials has a higher attribution than their thicknesses or densities in the floor components, such as: rockwool, sprayed on cellulose fiber and air gap.
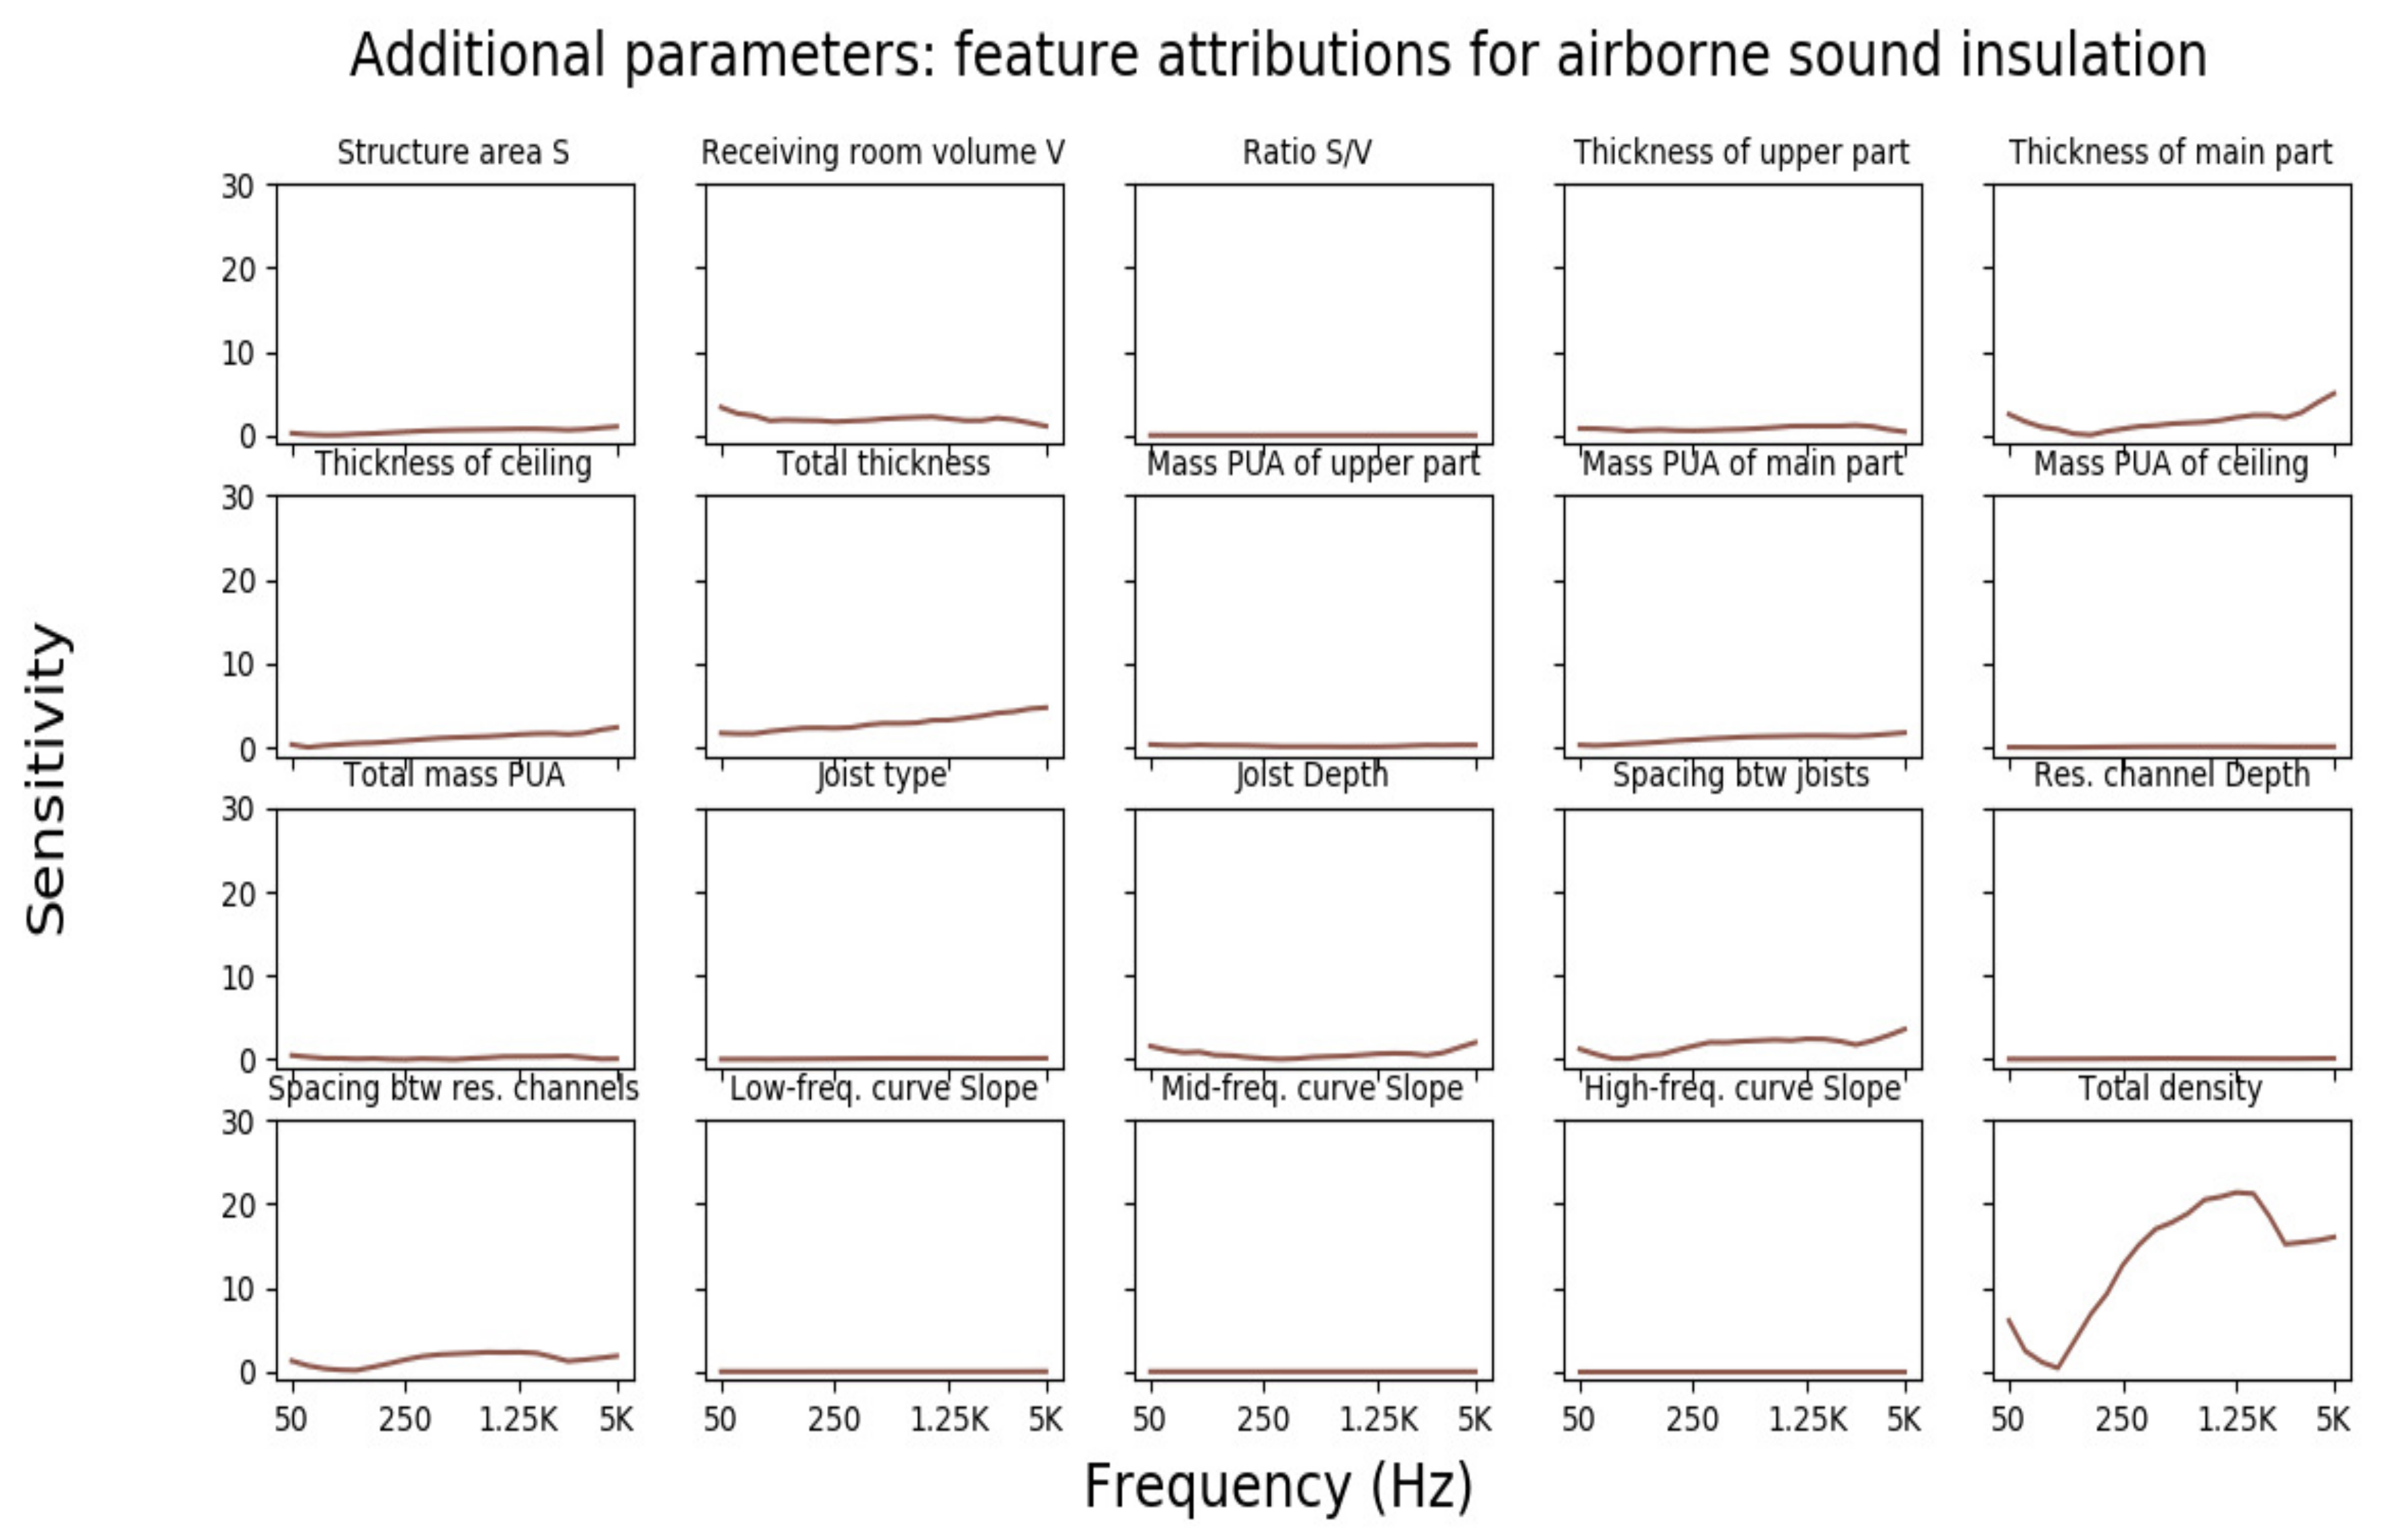
Figure 11 demonstrates that the volume of the receiving room V has an influence in low frequencies, while no remarkable effect appears for the area of the test floor S and the ratio S / V . This finding is also in contrast to other study results that showed important effects for the parameter S and the ratio S / V [79].
In addition, the total thickness parameter and thickness of the main part have an apparent attribution, the higher the frequency bands. Moreover, the spacing (central distance) between joists affects the prediction of airborne sound insulation in the middle and high frequencies. Some influence is found for the spacing between resilient metal channels (in suspended ceilings) on the airborne sound prediction in the middle frequencies. Some parameters, such as the slope of the acoustic spectrum (in low, middle and high frequencies), depth of the joist and resilient channels and the type of the joist, seem to have only minor effects.
Figure 12 reveals the role of the thickness and the density of the upper, main and ceiling parts of dry and wet floor solution systems in prediction of airborne sound insulation. Surprisingly, the effects of the ceiling part appear to be minimal for all floor solutions. For dry floor systems, the thickness of the upper part has some effect only in the very low-frequency and very high-frequency bands. In middle and high frequencies, the effect sizes of the thickness and the density of the main part are evident.
For wet floor systems, the density of the upper part (which contains a concrete layer) influences airborne sound prediction in all frequencies. This result is also confirmed in Figure 10 which shows the effect size of the density of a concrete layer. However, for the dry solutions, the thickness of the main part has a notable attribution in the middle and high frequencies.

3.3.2. Feature Attributions for Impact Sound Insulation

Figure 13 describes the effect of several materials on the prediction of normalized impact sound pressure levels. The thickness of the CLT panel has the same effect size in prediction of impact sound insulation in all frequencies (similar in comparison to Figure 10). In contrast, the effect of the thickness of the concrete layer has a minor weight in the prediction. The density of the CLT slab has significant importance in low and high frequencies, which tends to decrease near the middle frequencies. The density of the concrete layer is a very important parameter in the low and middle frequencies (highest sensitivity of all at 50–250 Hz).
The results show that the thickness of the insulation materials is vital in the higher frequency range (again, especially for fiberglass, rockfiber and cellulose fiber but surprisingly not for glass wool in the ANN model). In addition, no important insulation improvement is achieved when using insulation materials in the low-frequency bands, as commonly observed [80] and assumed [81] based on the force transmissibility theory. The latter theory states that the injected force is transmitted directly to the structure, without possible attenuation at low frequencies [81].
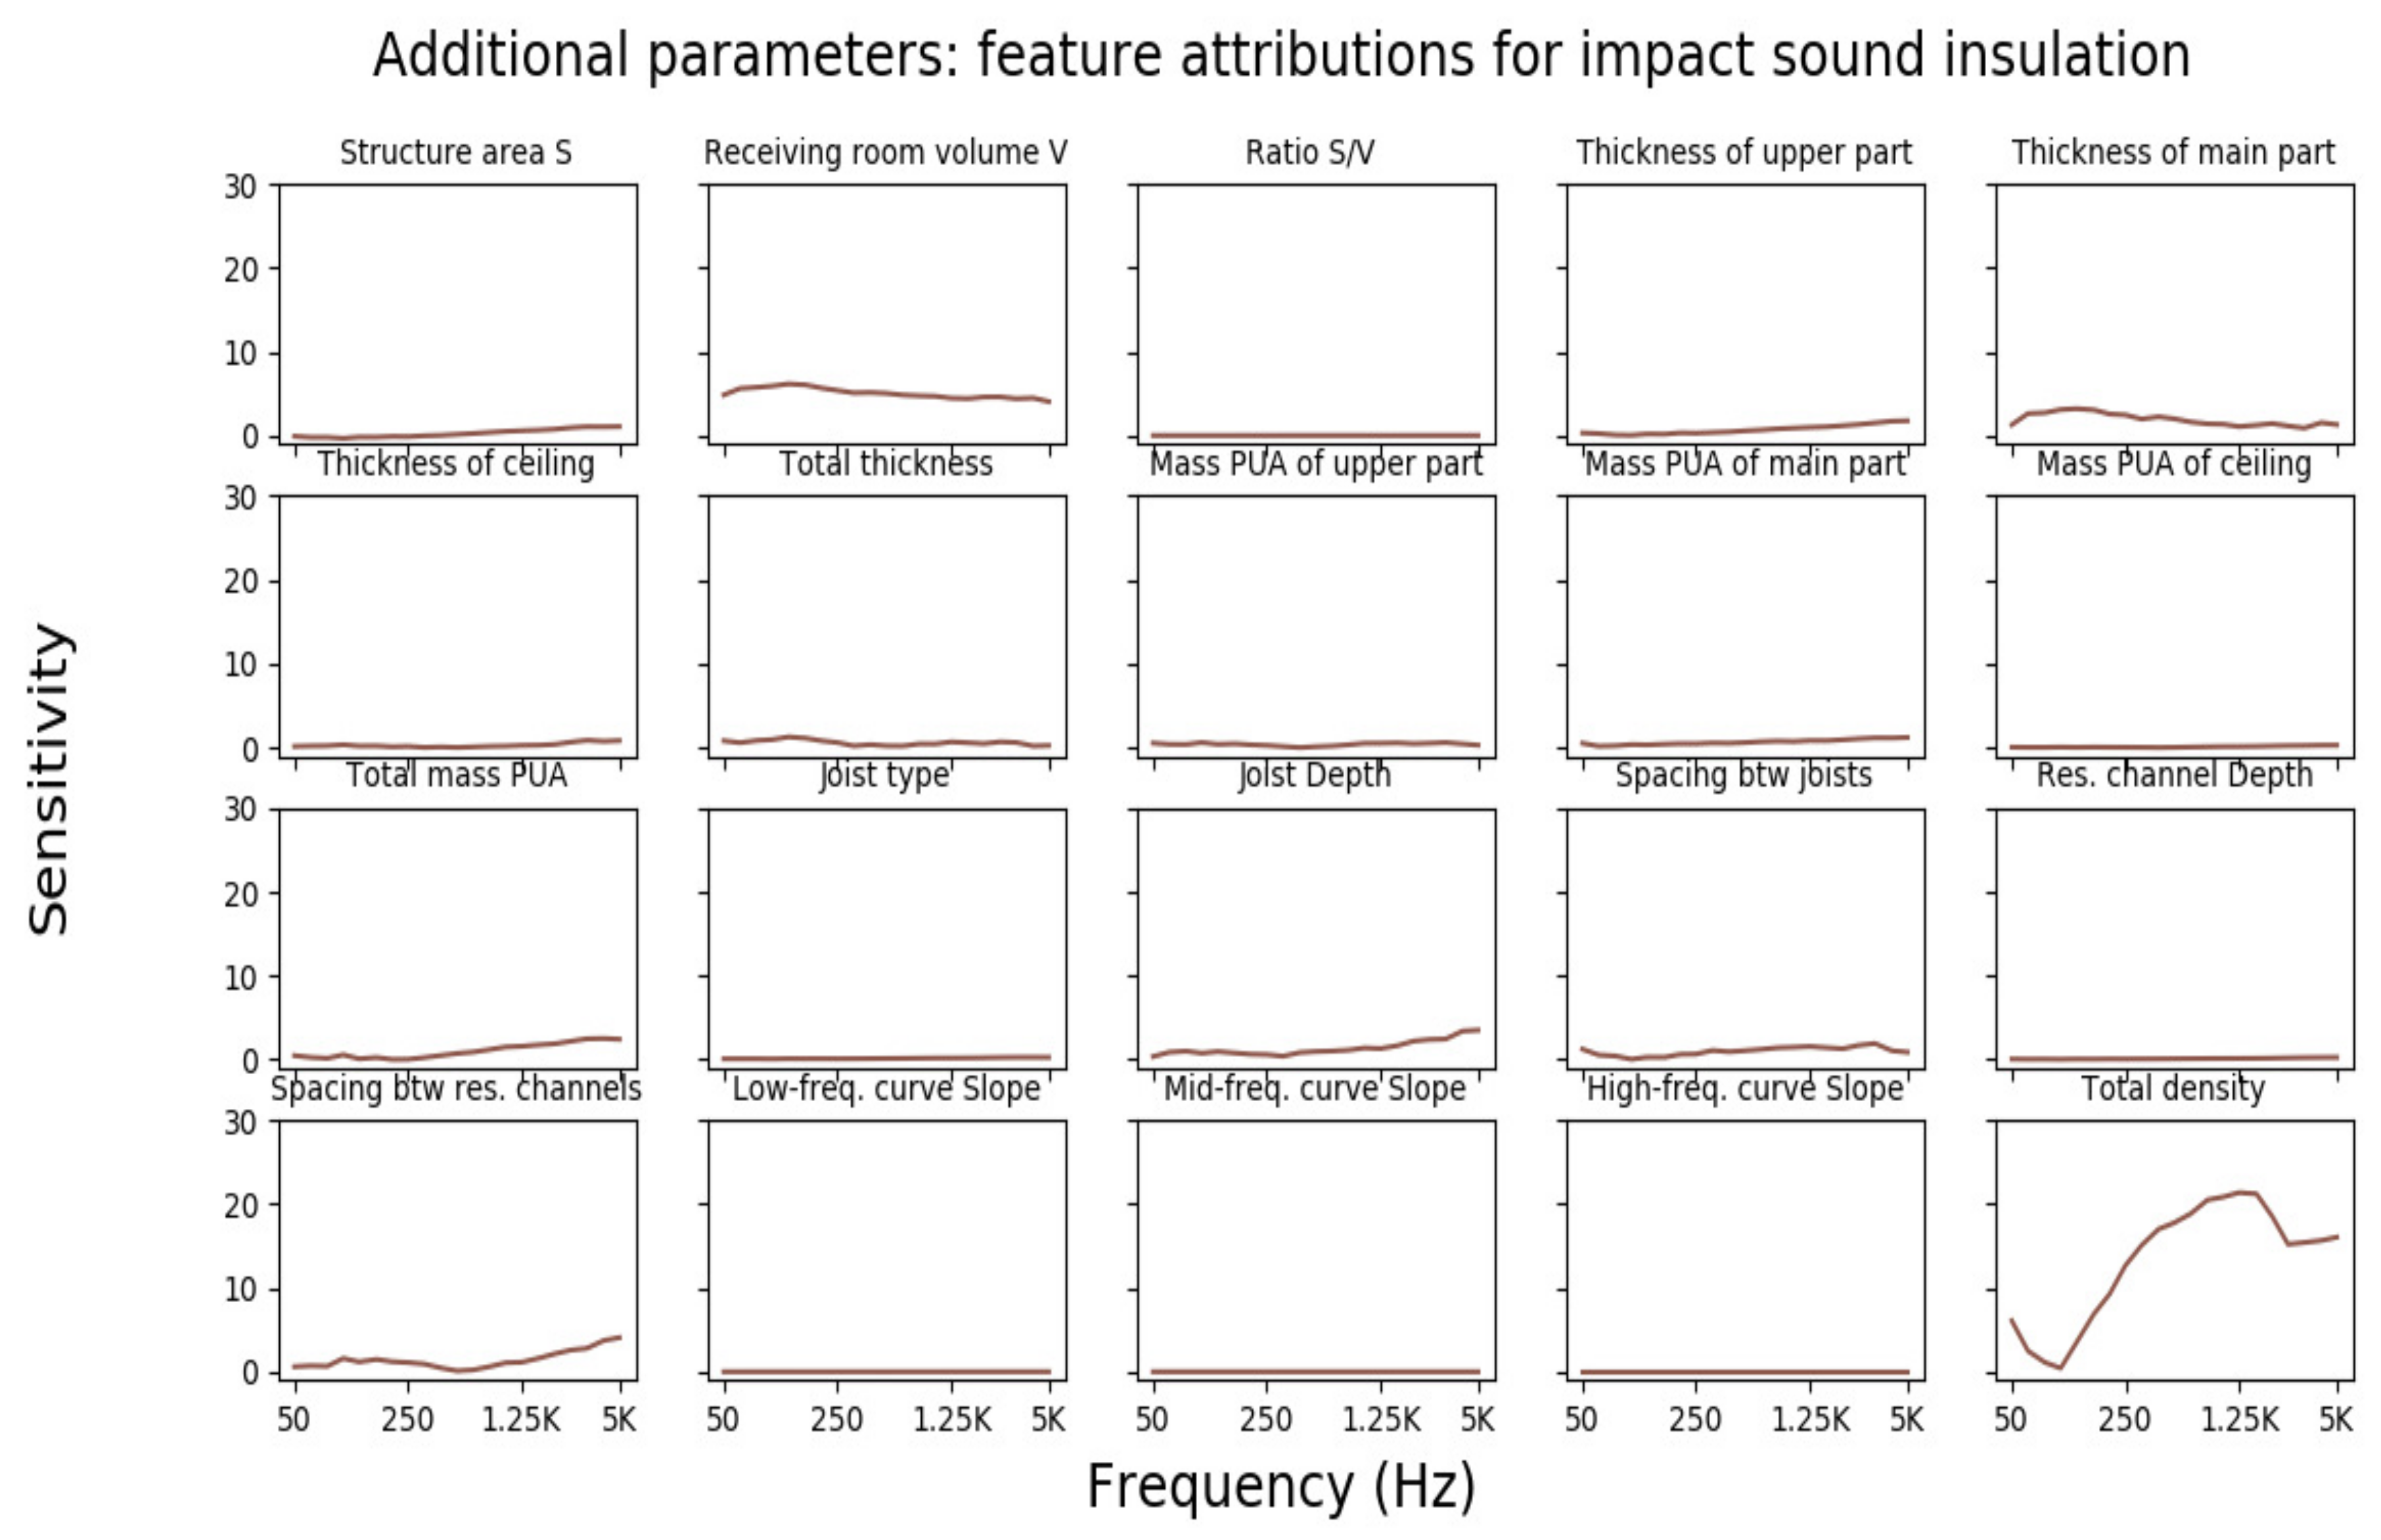
Figure 14 presents additional parameter attributions and indicates that the spacing between joists and the spacing between resilient channels affect the estimation only in high frequencies. The volume of the receiving room V affects the prediction in all frequencies, especially in low-frequency bands, as seen in Figure 14. This result is in contrast to [76], where they concluded that the effect of the volume is not frequency dependent. However, a minor importance in the prediction of impact sound insulation is observed for some parameters such as the slope of the measurement curves, area of the floor, the ratio S / V and the joist type.
The results in Figure 15 yield the attribution of thickness and density of the upper, main and ceiling parts of dry and wet floor systems for impact sound insulation predictions. In dry floor systems, the thickness of the upper part has the strongest link with the impact sound prediction in low and middle frequencies. The main part seems to affect the estimations only in middle and high frequencies. In wet floor systems, exactly the same trends appear for the main part, but to a lower degree in terms of effect size. However, the thickness of the upper part seems to affect the prediction more than the density in low and high frequencies. The ceiling part, again, has negligible effects for both dry and wet floor solutions, as observed for airborne sound.
The data in Figure 15 agree with the classic mass–spring–damping system approach [9]. In low frequencies or a stiffness-controlled region (below the first eigenfrequency), the thickness is the dominant parameter in the impact sound insulation prediction, where the system’s properties are governed by the stiffness. In the middle- and high-frequency bands where the mass-controlled and coincidence-controlled regions are located (separated by the critical frequency), the results confirm a significant increase in the attributions of density and thickness. This conclusion was assumed in previous studies as well [82].

3.3.3. Common Observations for Airborne and Impact Sound Prediction

It can be observed that the biggest deviations between measured and predicted values in the ANN model results (for both airborne and impact sound prediction) are found for the simplest floor configurations, such as floor #4 in Figure 3 and floor #9 in Figure 6. This is probably due to the lack of measurements performed on simple structures in the database, which may affect the estimation accuracy. The results point out that high estimation difficulties for airborne and impact sound insulation curves can be found in high frequencies. One reason is probably the critical frequency locations for the test floors at high frequencies and the values of the standard deviation of the sound insulation curves, which tend to increase above 1 kHz (Figure 1), for both airborne and impact sound predictions. This limitation in the ANN model was also reported by [15]. Similar problems appear at the fundamental frequencies in the low-frequency band estimations.
Often, the ANN model cannot estimate all fluctuations of the measured curves. Therefore, the forecast curves are smoother than the measured ones as can be noticed in floors #4, #7, #8 #9 and #10 in Figure 3 and Figure 6. This can be explained by the statistical approach of neural networks, which depends on the measurements in the database and creates an estimation in a somewhat average trend. The more similar measurements are to test floors in the training set, the higher the probability of accurate estimation of the test floor curves.
Table 5 presents a comparison between the measured and the predicted airborne and impact sound insulation curves split into three different zones: low (50–200 Hz), middle (250–1000 Hz) and high frequencies (1250–5000 Hz). The error variations are calculated again by the root mean square error ( R M S E ) function. The R M S E value in low frequencies for airborne sound estimations is almost equal to the impact sound cases. However, the model’s predictive capability for airborne sound in the middle-frequency range is better than impact sound. In high frequencies, the accuracy is lower than the other zones for both airborne and impact sound forecasts due to the presence of critical frequency. Overall, Table 5 summarizes that the prediction of airborne sound reduction curves is better than impact sound insulation curves, especially in the middle-frequency range.
Figure 11 and Figure 14 indicate that the total density of the floor structures has a strong association with the prediction of airborne and impact sound insulation curves in all frequencies. As mentioned, the volume of the receiving room V has some influence in low frequencies for airborne and impact sound predictions.
The sensitivity analysis showed that the density of concrete layers and CLT panels affects the estimations, especially in the low-frequency range. The material effects (presence) of cross-laminated timber (CLT) and concrete layers, as well as rockwool, play a role in both airborne and impact sound prediction. Similar trends apply for the thickness parameters of certain insulation materials (fiberglass, rockfiber, cellulose fiber) with higher sensitivity in higher frequencies. This is expected as fiber insulation materials have better sound absorption performance in middle and high frequencies.
Regarding the sensitivity comparison between wet and dry floor solutions, the only common conclusion is that the main part has some influence (not in low frequencies) and the ceiling part has minor effects in all cases of airborne and impact sound.

4. Conclusions

The present publication demonstrates the potential of artificial neural networks in prediction of airborne sound reduction index R and normalized impact sound pressure levels L n based on 252 standardized laboratory measurements of different lightweight floor structures. The developed model provides a good accuracy with root mean square error ( R M S E ) values within 1.67–7.63 for estimating the insulation curves of various lightweight floor configurations for the frequency bands 50–5000 Hz. The accuracy becomes better when considering only the single-number quantities: the weighted airborne sound reduction index R w ( R M S E within 0–2 dB) and the weighted normalized impact sound pressure levels L n , w ( R M S E within 0–5 dB).
Overall, the presented model demonstrates a better accuracy for airborne sound than impact sound prediction, and is especially more precise in the middle-frequency bands of 250–1000 Hz. However, the predictions around the fundamental frequencies and the critical frequency in many test cases showed deviations, highlighting the importance of resonance effects for floor structures and the occasional estimation inefficiency of the model.
A sensitivity analysis assisted in estimating the most significant material effects on prediction of sound insulation. The thickness of the insulation materials is an essential parameter in middle and high frequencies. The same applies to the density of the CLT panels and concrete floating floors on top of lightweight floors. In addition, the total density of the floor structure strongly affects the forecasting airborne and impact sound insulation curves.
Comparing wet (concrete layers on the top) and dry solution systems, the thickness of the main part dominates the prediction sensitivity for all cases, in middle and high frequencies. No effects were observed for the ceiling part of the floor structures on the predictions. However, the upper part has significant effects in low frequencies for impact sound (wet and dry cases).
Further research with a bigger collection of measurements would be expected to yield more accurate results, which could pave the way for further prediction on sound insulation curves of walls or façade components.

Author Contributions

Writing—original draft; methodology; validation; formal analysis; investigation, M.B.E.; writing—review and editing, M.B.E. and N.-G.V.; review; supervision; validation, N.-G.V., S.M., D.B.H. and J.-L.K.; project administration; funding acquisition, S.M. All authors have read and agreed to the published version of the manuscript.

Funding

This research was funded by the Natural Sciences and Engineering Research Council (NSERC) of Canada through its IRC and CRD programs (IRCPJ 461745-18 and RDCPJ 524504-18), the Region Nouvelle-Aquitaine (ref. 2017-1R10223) and the industrial partners of the NSERC industrial chair on eco-responsible wood construction (CIRCERB).

Institutional Review Board Statement

Not applicable.

Informed Consent Statement

Not applicable.

Data Availability Statement

Data cannot be provided as they are confidential.

Acknowledgments

The authors are grateful to Lund University, FCBA, FPInnovations and CNRC for providing the acoustic measurement data of sound insulation.

Conflicts of Interest

The authors declare no conflict of interest.

Appendix A

Figure A1. Standardized laboratory measurements for airborne sound reduction index in the data set.
Acoustics 04 00013 g0a1
Figure A2. Standardized laboratory measurements for normalized impact sound pressure levels in the data set.
Acoustics 04 00013 g0a2
Figure A3. Test floor configurations used to evaluate the predictive accuracy of airborne and impact sound insulation curves.
Acoustics 04 00013 g0a3

References

  1. Hassan, O.A. Building Acoustics and Vibration: Theory and Practice; World Scientific Publishing Company: Singapore, 2009. [Google Scholar]
  2. Vardaxis, N.G.; Bard, D.; Persson Waye, K. Review of acoustic comfort evaluation in dwellings—part I: Associations of acoustic field data to subjective responses from building surveys. Build. Acoust. 2018, 25, 151–170. [Google Scholar] [CrossRef] [Green Version]
  3. ISO.140-03; Acoustics–Measurement of Sound Insulation in Buildings and of Building Elements—Part 3: Laboratory Measurements of Airborne Sound Insulation of Building Elements. International Organization for Standardization: Geneva, Switzerland, 1995.
  4. ISO.140-06; Acoustics–Measurement of Sound Insulation in Buildings and of Building Elements—Part 6: Laboratory Measurements of Impact Sound Insulation of Floors. International Organization for Standardization: Geneva, Switzerland, 1998.
  5. ISO.140-2; Acoustics–Laboratory Measurement of Sound Insulation of Building Elements—Part 2: Measurement of Airborne Sound Insulation. International Organization for Standardization: Geneva, Switzerland, 2010.
  6. ISO.16283-1; Acoustics–Field Measurement of Sound Insulation in Buildings and of Building Elements–Part 1: Airborne Sound Insulation. International Organization for Standardization: Geneva, Switzerland, 2014.
  7. ISO.140-3; Acoustics–Laboratory Measurement of Sound Insulation of Building Elements—Part 3: Measurement of Impact Sound Insulation. International Organization for Standardization: Geneva, Switzerland, 2010.
  8. ISO.16283-2; Acoustics–Field Measurement of Sound Insulation in Buildings and of Building Elements—Part 1: Impact Sound Insulation. International Organization for Standardization: Geneva, Switzerland, 2015.
  9. Vigran, T.E. Building Acoustics; CRC Press: Boca Raton, FL, USA, 2014. [Google Scholar]
  10. Beranek, L.L.; Work, G.A. Sound transmission through multiple structures containing flexible blankets. J. Acoust. Soc. Am. 1949, 21, 419–428. [Google Scholar] [CrossRef]
  11. Mulholland, K.; Price, A.; Parbrook, H. Transmission loss of multiple panels in a random incidence field. J. Acoust. Soc. Am. 1968, 43, 1432–1435. [Google Scholar] [CrossRef]
  12. Kang, H.J.; Ih, J.G.; Kim, J.S.; Kim, H.S. Prediction of sound transmission loss through multilayered panels by using Gaussian distribution of directional incident energy. J. Acoust. Soc. Am. 2000, 107, 1413–1420. [Google Scholar] [CrossRef] [PubMed]
  13. Davy, J.L. The improvement of a simple theoretical model for the prediction of the sound insulation of double leaf walls. J. Acoust. Soc. Am. 2010, 127, 841–849. [Google Scholar] [CrossRef] [PubMed] [Green Version]
  14. Van den Wyngaert, J.C.; Schevenels, M.; Reynders, E.P. Predicting the sound insulation of finite double-leaf walls with a flexible frame. Appl. Acoust. 2018, 141, 93–105. [Google Scholar] [CrossRef]
  15. Serpilli, F.; Di Nicola, G.; Pierantozzi, M. Airborne sound insulation prediction of masonry walls using artificial neural networks. Build. Acoust. 2021, 28, 391–409. [Google Scholar]
  16. Garg, N.; Dhruw, S.; Gandhi, L. Prediction of sound insulation of sandwich partition panels by means of artificial neural networks. Arch. Acoust. 2017, 42, 643–651. [Google Scholar] [CrossRef] [Green Version]
  17. Craik, R.; Smith, R. Sound transmission through double leaf lightweight partitions part I: Airborne sound. Appl. Acoust. 2000, 61, 223–245. [Google Scholar] [CrossRef]
  18. Hongisto, V. Airborne Sound Insulation of Wall Structures: Measurement and Prediction Methods; Helsinki University of Technology: Espoo, Finland, 2000. [Google Scholar]
  19. Legault, J.; Atalla, N. Sound transmission through a double panel structure periodically coupled with vibration insulators. J. Sound Vib. 2010, 329, 3082–3100. [Google Scholar] [CrossRef]
  20. Santoni, A.; Davy, J.L.; Fausti, P.; Bonfiglio, P. A review of the different approaches to predict the sound transmission loss of building partitions. Build. Acoust. 2020, 27, 253–279. [Google Scholar] [CrossRef]
  21. Guigou-Carter, C.; Villot, M.; Wetta, R. Prediction method adapted to wood frame lightweight constructions. Build. Acoust. 2018, 13, 173–188. [Google Scholar] [CrossRef]
  22. Buratti, C.; Barelli, L.; Moretti, E. Wooden windows: Sound insulation evaluation by means of artificial neural networks. Appl. Acoust. 2013, 74, 740–745. [Google Scholar] [CrossRef]
  23. Vardaxis, N.G.; Bard, D. Review of acoustic comfort evaluation in dwellings: Part II—Impact sound data associated with subjective responses in laboratory tests. Build. Acoust. 2018, 25, 171–192. [Google Scholar] [CrossRef]
  24. Vardaxis, N.G.; Bard, D. Review of acoustic comfort evaluation in dwellings: Part III—Airborne sound data associated with subjective responses in laboratory tests. Build. Acoust. 2018, 25, 289–305. [Google Scholar] [CrossRef]
  25. Radkau, J. Wood: A History; Polity: Cambridge, UK, 2012. [Google Scholar]
  26. Popovski, M.; Ni, C. Mid-Rise Wood-Frame Construction Handbook; FPInnovations: Vancouver, BC, Canada, 2015. [Google Scholar]
  27. Chatti, S. Production of Profiles for Lightweight Structures; BoD–Books on Demand: Norderstedt, Germany, 2006. [Google Scholar]
  28. Rasmussen, B.; Machimbarrena, M. Building Acoustics throughout Europe Volume 1: Towards a Common Framework in Building Acoustics throughout Europe; DiScript Preimpresion, S.L.: Madrid, Spain, 2014. [Google Scholar]
  29. Vorländer, M. Building acoustics: From prediction models to auralization. In Proceedings of the ACOUSTICS 2006, Christchurch, New Zealand, 20–22 November 2006. [Google Scholar]
  30. ISO.12354-1; Building Acoustics–Estimation of Acoustic Performance of Buildings from the Performance of Elements—Part 1: Airborne Sound Insulation between Rooms. International Organization for Standardization: Geneva, Switzerland, 2017.
  31. ISO.12354-2; Building Acoustics–Estimation of Acoustic Performance of Buildings from the Performance of Elements—Part 2: Impact Sound Insulation between Rooms. International Organization for Standardization: Geneva, Switzerland, 2017.
  32. Chattopadhyay, A.; Manupriya, P.; Sarkar, A.; Balasubramanian, V.N. Neural network attributions: A causal perspective. In Proceedings of the International Conference on Machine Learning, PMLR, Long Beach, CA, USA, 9–15 June 2019. [Google Scholar]
  33. Abdel-Hamid, O.; Deng, L.; Yu, D. Exploring convolutional neural network structures and optimization techniques for speech recognition. In Interspeech; Citeseer: Princeton, NJ, USA, 2013. [Google Scholar]
  34. Thai, L.H.; Hai, T.S.; Thuy, N.T. Image classification using support vector machine and artificial neural network. Int. J. Inf. Technol. Comput. Sci. 2012, 4, 32–38. [Google Scholar] [CrossRef] [Green Version]
  35. Dangeti, P. Statistics for Machine Learning; Packt Publishing Ltd.: Birmingham, UK, 2014. [Google Scholar]
  36. Mohamed, A.R.; Dahl, G.E.; Hinton, G. Acoustic modeling using deep belief networks. IEEE Trans. Audio Speech Lang. Process. 2011, 20, 14–22. [Google Scholar] [CrossRef]
  37. Di Loreto, S.; Serpilli, F.; Lori, V.; Squartini, S. Sound Quality Evaluation of Kitchen Hoods; Elsevier: Amsterdam, The Netherlands, 2020. [Google Scholar]
  38. Serpilli, F.; Lori, V.; Di Loreto, S. Speech recognition assessment in Italian pediatric schools using close-set speech tests: A case of study. In INTER-NOISE and NOISE-CON Congress and Conference Proceedings; Institute of Noise Control Engineering: Reston, VA, USA, 2020; Volume 261. [Google Scholar]
  39. Sak, H.; Senior, A.; Beaufays, F. Long short-term memory based recurrent neural network architectures for large vocabulary speech recognition. arXiv 2014, arXiv:1402.1128. [Google Scholar]
  40. Nagaya, K.; Li, L. Control of sound noise radiated from a plate using dynamic absorbers under the optimization by neural network. J. Sound Vib. 1997, 208, 289–298. [Google Scholar] [CrossRef]
  41. Ma, C.; Chen, C.; Liu, Q.; Gao, H.; Li, Q.; Gao, H.; Shen, Y. Sound quality evaluation of the interior noise of pure electric vehicle based on neural network model. IEEE Trans. Ind. Electron. 2017, 64, 9442–9450. [Google Scholar] [CrossRef]
  42. Wang, Y.; Shen, G.; Xing, Y. A sound quality model for objective synthesis evaluation of vehicle interior noise based on artificial neural network. Mech. Syst. Signal Process. 2014, 45, 255–266. [Google Scholar] [CrossRef]
  43. Iannace, G.; Trematerra, A.; Ciaburro, G. Case study: Automated recognition of wind farm sound using artificial neural networks. Noise Control. Eng. J. 2020, 68, 157–167. [Google Scholar] [CrossRef]
  44. Iannace, G.; Ciaburro, G.; Trematerra, A. Using neural networks to detect wind turbine functioning conditions. Int. J. Autom. Smart Technol. 2020, 10, 145–152. [Google Scholar]
  45. Ciaburro, G.; Iannace, G.; Passaro, J.; Bifulco, A.; Marano, D.; Guida, M.; Marulo, F.; Branda, F. Artificial neural network-based models for predicting the sound absorption coefficient of electrospun poly (vinyl pyrrolidone)/silica composite. Appl. Acoust. 2020, 169, 107472. [Google Scholar] [CrossRef]
  46. Iannace, G.; Ciaburro, G.; Trematerra, A. Modelling sound absorption properties of broom fibers using artificial neural networks. Appl. Acoust. 2020, 163, 107239. [Google Scholar] [CrossRef]
  47. Bader Eddin, M.; Menard, S.; Bard, D.; Kouyoumji, J.L.; Vardaxis, N.G. A Sound Insulation Prediction Model for Floor Structures in Wooden Buildings Using Neural Networks Approach. In INTER-NOISE and NOISE-CON Congress and Conference Proceedings; Institute of Noise Control Engineering: Reston, VA, USA, 2021. [Google Scholar]
  48. Svozil, D.; Kvasnicka, V.; Pospichal, J. Introduction to multi-layer feed-forward neural networks. Chemom. Intell. Lab. Syst. 1997, 39, 43–62. [Google Scholar] [CrossRef]
  49. Graupe, D. Principles of Artificial Neural Networks; World Scientific: Singapore, 2013. [Google Scholar]
  50. Goodfelow, I.; Bengio, Y.; Courville, A. Deep Learning (Adaptive Computation and Machine Learning Series); MIT Press: Cambridge, MA, USA, 2016. [Google Scholar]
  51. Schmidhuber, J. Deep learning. Scholarpedia 2015, 10, 32832. [Google Scholar] [CrossRef] [Green Version]
  52. Nielsen, M.A. Neural Networks and Deep Learning; Determination Press: San Francisco, CA, USA, 2015. [Google Scholar]
  53. Sharma, S.; Sharma, S.; Athaiya, A. Activation functions in neural networks. Towards Data Sci. 2017, 6, 310–316. [Google Scholar] [CrossRef]
  54. Smilkov, D.; Thorat, N.; Kim, B.; Viégas, F.; Wattenberg, M. Smoothgrad: Removing noise by adding noise. arXiv 2017, arXiv:1706.03825. [Google Scholar]
  55. Baehrens, D.; Schroeter, T.; Harmeling, S.; Kawanabe, M.; Hansen, K.; Müller, K.R. How to explain individual classification decisions. J. Mach. Learn. Res. 2010, 11, 1803–1831. [Google Scholar]
  56. Shrikumar, A.; Greenside, P.; Shcherbina, A.; Kundaje, A. Not just a black box: Learning important features through propagating activation differences. arXiv 2016, arXiv:1605.01713. [Google Scholar]
  57. Simonyan, K.; Vedaldi, A.; Zisserman, A. Deep inside convolutional networks: Visualising image classification models and saliency maps. arXiv 2013, arXiv:1312.6034. [Google Scholar]
  58. Sundararajan, M.; Taly, A.; Yan, Q. Axiomatic attribution for deep networks. In Proceedings of the International Conference on Machine Learning, PMLR, Sydney, Australia, 6–11 August 2017; pp. 3319–3328. [Google Scholar]
  59. Ruder, S. An overview of gradient descent optimization algorithms. arXiv 2016, arXiv:1609.04747. [Google Scholar]
  60. Warnock, A. Summary Report for Consortium on Fire Resistance and Sound Insulation of Floors: Sound Transmission and Impact Insulation Data; Institute for Research in Construction, National Research Council Canada: Ottawa, ON, Canada, 2005. [Google Scholar]
  61. ASTM.E90-09; Standard Test Method for Laboratory Measurement of Airborne Sound Transmission Loss of Building Partitions and Elements. ASTM International: West Conshohocken, PA, USA, 2016.
  62. ASTM.E492-09; Standard Test Method for Laboratory Measurement of Impact Sound Transmission through Floor-ceiling Assemblies using the Tapping Machine. ASTM International: West Conshohocken, PA, USA, 2016.
  63. ISO.717-1; Acoustics—Rating of Sound Insulation in Buildings and of Buildings Elements—Part 1: Airborne Sound Insulation. International Organization for Standardization: Geneva, Switzerland, 2013.
  64. ISO.717-2; Acoustics—Rating of Sound Insulation in Buildings and of Buildings Elements—Part 2: Impact Sound Insulation. International Organization for Standardization: Geneva, Switzerland, 2013.
  65. Widenius, M.; Axmark, D.; Arno, K. MySQL Reference Manual: Documentation from the Source; O’Reilly Media, Inc.: Newton, MA, USA, 2002. [Google Scholar]
  66. Géron, A. Hands-On Machine Learning with Scikit-Learn, Keras, and TensorFlow: Concepts, Tools, and Techniques to Build Intelligent Systems; O’Reilly Media, Inc.: Newton, MA, USA, 2019. [Google Scholar]
  67. Aggarwal, C.C. Neural Networks and Deep Learning; Springer: Berlin/Heidelberg, Germany, 2018; Volume 10. [Google Scholar]
  68. Mastromichalakis, S. ALReLU: A different approach on Leaky ReLU activation function to improve Neural Networks Performance. arXiv 2020, arXiv:2012.07564. [Google Scholar]
  69. Xu, J.; Li, Z.; Du, B.; Zhang, M.; Liu, J. Reluplex made more practical: Leaky ReLU. In Proceedings of the 2020 IEEE Symposium on Computers and Communications (ISCC), Rennes, France, 7–10 July 2020; IEEE: Piscataway, NJ, USA, 2020. [Google Scholar]
  70. Kingma, D.P.; Ba, J. Adam: A method for stochastic optimization. arXiv 2014, arXiv:1412.6980. [Google Scholar]
  71. Tato, A.; Nkambou, R. Improving Adam Optimizer. 2018. Available online: https://openreview.net/forum?id=HJfpZq1DM (accessed on 9 November 2021).
  72. Rindel, J.H. Sound Insulation in Buildings; CRC Press: Boca Raton, FL, USA, 2017. [Google Scholar]
  73. Blazier, W.E., Jr.; DuPree, R.B. Investigation of low-frequency footfall noise in wood-frame, multifamily building construction. J. Acoust. Soc. Am. 1994, 96, 1521–1532. [Google Scholar] [CrossRef]
  74. Sipari, P. Sound insulation of multi-storey houses—A summary of Finnish impact sound insulation results. Build. Acoust. 2000, 7, 15–30. [Google Scholar] [CrossRef]
  75. Ljunggren, F.; Ågren, A. Potential solutions to improved sound performance of volume based lightweight multi-storey timber buildings. Appl. Acoust. 2011, 72, 231–240. [Google Scholar] [CrossRef]
  76. Schoenwald, S.; Zeitler, B.; Nightingale, T.R. Influence of receive room properties on impact sound pressure level measured with heavy impact sources. In Proceedings of the Euroregio 2010 Congress on Sound and Vibration, Ljubljana, Slovenia, 15–18 September 2010. [Google Scholar]
  77. Reynders, E.P.; Wang, P.; Lombaert, G. Prediction and uncertainty quantification of structure-borne sound radiation into a diffuse field. J. Sound Vib. 2019, 463, 114984. [Google Scholar] [CrossRef]
  78. Uris, A.; Llopis, A.; Llinares, J. Effect of the rockwool bulk density on the airborne sound insulation of lightweight double walls. Appl. Acoust. 1999, 58, 327–331. [Google Scholar] [CrossRef]
  79. Fora-Moncada, A.; Gibbs, B. Prediction of sound insulation at low frequencies using artificial neural networks. Build. Acoust. 2002, 9, 49–71. [Google Scholar] [CrossRef]
  80. Prato, A.; Schiavi, A.; Ruatta, A. A modal approach for impact sound insulation measurement at low frequency. Build. Acoust. 2016, 23, 110–119. [Google Scholar] [CrossRef]
  81. Hopkins, C. Sound Insulation; Routledge: London, UK, 2012. [Google Scholar]
  82. Graf, R.F. Modern Dictionary of Electronics; Newnes: London, UK, 1999. [Google Scholar]
Figure 1. Mean and standard variation of the standardized laboratory measurements. (a) Standardized measurements for airborne sound reduction index. (b) Standardized measurements for normalized impact sound pressure levels.
Acoustics 04 00013 g001
Figure 2. A description schematic showing the database organization for the floor components.
Acoustics 04 00013 g002
Figure 3. Comparison between measured and predicted values for the tested floor structures for airborne sound reduction index.
Acoustics 04 00013 g003
Figure 4. Error variations between measured and predicted airborne sound reduction index curves ( R ( f ) R ( f ) P r e d i c t e d ) for test floor structures.
Acoustics 04 00013 g004
Figure 5. Normalized error variations (interval of [ 1 , 1]) between measured and predicted airborne sound reduction index curves for test floor structures.
Acoustics 04 00013 g005
Figure 6. Comparison between measured and predicted values for the test floor structures for impact sound pressure level.
Acoustics 04 00013 g006
Figure 7. Error variations between measured and predicted impact sound pressure levels curves ( L n ( f ) L n ( f ) P r e d i c t e d ) for test floor structures.
Acoustics 04 00013 g007
Figure 8. Normalized error variations (interval of [ 1 , 1]) between measured and predicted impact sound pressure curves for test floor structures.
Acoustics 04 00013 g008
Figure 9. Histograms of error variations in the prediction model for airborne sound reduction index and impact sound pressure levels for test floor structures in frequency range 50–5000 Hz in one-third octave bands. (a) Airborne sound reduction index. (b) Normalized impact sound pressure levels.
Acoustics 04 00013 g009
Figure 10. Feature attributions of structure layers and material types for airborne sound prediction.
Acoustics 04 00013 g010
Figure 11. Feature attributions of additional parameters for airborne sound prediction.
Acoustics 04 00013 g011
Figure 12. Feature attributions of upper, main and ceiling part of dry and wet floor solutions for airborne sound prediction.
Acoustics 04 00013 g012
Figure 13. Feature attributions of structure layers and material types for impact sound prediction.
Acoustics 04 00013 g013
Figure 14. Feature attributions of additional parameters for impact sound prediction.
Acoustics 04 00013 g014
Figure 15. Feature attributions of upper, main and ceiling part of dry and wet floor solutions for impact sound prediction.
Acoustics 04 00013 g015
Table 1. Detailed description of the database numbers and their divided sets in the ANN model.
Database ANN Model
Number of
measurements 252 252
airborne impact training set validation set testing set
133 119 204 24 24
Table 2. List of structural parameters used as inputs to train the ANN model.
Parameters Used in the Prediction ModelUnitsClasses
− Material typesi.e., concrete layer, CLT panel, insulation materials, etc.
− Material installation orderfirst/second/etc.
− Material thicknessmm
− Group thicknessmmupper, main and ceiling parts
− Total thickness of the floormm
− Material densitykg/m 3
− Group densitykg/m 3 upper, main and ceiling parts
− Total density of the floorkg/m 3
− Area of the floor structure Sm 2
− Volume of the receiving room Vm 3
− Ratio S / V
− Group mass P.U.Akg/m 2 upper, main and ceiling parts
− Total mass P.U.Akg/m 2
− Joist typemetal/wooden
− Joist depthmm
− Spacing between joistsmm
− Resilient channel depthmm
− Spacing between resilient channelsmm
− Curve slopelow (50–200 Hz), middle (250–1000 Hz), high frequencies (1250–5000 Hz)
Table 3. Comparison between measured and predicted sound reduction indexes for airborne sound insulation in test floor structures.
Floor No. RMSE (dB) R w (dB) C 100 3150 C 50 5000 R w Pred (dB) C Pred 100 3150 C Pred 50 5000
11.65380139−10
23.5961−2−459−2−2
32.0754−2−154E2−1
45.18350037−10
52.3349−4−549−4−5
61.948−3−350−4−5
75.8454−2−254−10
83.31430041−10
97.6357−1−356−2−1
102.2150−3−551−4−5
111.7544 2 −246−4−4
122.6855−3−454−4−5
Table 4. Comparison between measured and the predicted weighted normalized impact sound pressure level for impact sound insulation in tested floor structures.
Floor No. RMSE (dB) L n , w (dB) C I , 100 2500 C I , 50 5000 L n , w Pred (dB) C Pred I , 100 2500 C Pred I , 50 5000
11.9364116400
23.9648265346
32.6853344824
43.5488−4−485−4−4
53.0768036714
63.1666146824
77.0764−2−166−5−2
84.764−106611
96.7464−216001
104.4663156015
111.7660166005
122.2868027003
Table 5. Comparison between measured and predicted airborne sound reduction index R and normalized impact sound pressure levels L n clustered in low, middle and high frequencies by using the R M S E function for test floor structures.
Root Mean Square Errors in dB
Frequency RangeLowMiddleHigh
50–200 Hz250–1000 Hz1250–5000 Hz
R (airborne sound)3.762.554.79
L n (impact sound)3.793.484.97
Publisher’s Note: MDPI stays neutral with regard to jurisdictional claims in published maps and institutional affiliations.