Article

Sound Reflections in Indian Stepwells: Modelling Acoustically Retroreflective Architecture

1
Sydney School of Architecture, Design and Planning, The University of Sydney, Sydney, NSW 2006, Australia
2
Institute of Hearing Technology and Acoustics, RWTH Aachen University, Kopernikusstr. 5, 52074 Aachen, Germany
*
Author to whom correspondence should be addressed.
Acoustics 2022, 4(1), 227-247; https://doi.org/10.3390/acoustics4010014
Submission received: 23 January 2022 / Revised: 25 February 2022 / Accepted: 28 February 2022 / Published: 2 March 2022
(This article belongs to the Special Issue Acoustics, Soundscapes and Sounds as Intangible Heritage)

Abstract

:
Retroreflection is rarely used as a surface treatment in architectural acoustics but is found incidentally with building surfaces that have many simultaneously visible concave right-angle trihedral corners. Such surfaces concentrate reflected sound onto the sound source, mostly at high frequencies. This study investigated the potential for some Indian stepwells (stepped ponds, known as a kund or baori/baoli in Hindi) to provide exceptionally acoustically retroreflective semi-enclosed environments because of the unusually large number of corners formed by the steps. Two cases—Panna Meena ka Kund and Lahan Vav—were investigated using finite-difference time-domain (FDTD) acoustic simulation. The results are consistent with retroreflection, showing reflected energy concentrating on the source position mostly in the high-frequency bands (4 kHz and 2 kHz octave bands). However, the larger stepped pond has substantially less retroreflection, even though it has many more corners, because of the greater diffraction loss over the longer distances. Retroreflection is still evident (but reduced) with non-right-angle trihedral corners (80°–100°). The overall results are sufficiently strong to indicate that acoustic retroreflection should be audible to an attuned visitor in benign environmental conditions, at least at moderately sized stepped ponds that are in good geometric condition.

Graphical Abstract

1. Introduction

In architecture, there are some notable acoustic phenomena that can provide fascinating auditory experiences for a listening visitor. Such phenomena include long echoes, extreme reverberation (e.g., in large, hard-surfaced rooms and cisterns), whispering walls and domes (e.g., Gol Gumbaz’s dome, Bijapur, India) [1]. Steps can be a source of acoustic intrigue, as exemplified by the chirp-like diffraction effects at the Mayan Chichén Itzá pyramid [1,2,3], or the efficient sound transmission over arrays of stepped seats in the Epidaurus theatre [4,5]. These and other acoustic phenomena can take the listener’s spatio-temporal experience beyond the limits of vision, opening up another mode of experiencing space and time as an expression of the architectural form. As well as a source of intrigue for tourists, such experiences provide concrete exemplars of sound propagation phenomena which may have broader applications in architectural acoustics design.
The present paper investigated another step-related acoustic phenomenon in distinctive and sometimes monumental and ancient architecture: acoustic retroreflection in some Indian stepwells. This phenomenon arises in cases where there are many simultaneously visible concave trihedral right-angle corners and has been previously studied in building façades [6,7,8]. It is characterised by a multitude of reflections returning to the source position (Section 1.1). Certain stepwells might have the potential to create stronger retroreflective effects than façades partly because of the sheer number of simultaneously visible corners that partially surround accessible vantage points (Section 1.2). With each corner reflecting to the source location, the result is a cluster of reflections that can sum to yield substantial reflected energy, albeit restricted to the high-frequency range. Retroreflection also means that comparatively little acoustic energy is reflected to locations that are not near the source.
The scope of this study is limited to modelling and simulation. This includes image-source-based calculations, and simulation using finite-difference time-domain (FDTD) modelling. This wave-based simulation technique has been demonstrated to be effective in other studies of retroreflective architectural surfaces [7,8,9], as well as in other stepped monumental architecture [5]. Two sites are taken as exemplars of potentially retroreflective architecture: Panna Meena ka Kund and Lahan Vav.

1.1. Introduction to Acoustic Retroreflection in Architecture

A retroreflector returns the incident sound to the direction from which it came. This is distinct from specular reflections, which only reflect to the incident direction at normal incidence, and it is different to scattered reflections, which reflect to all directions (including the incident direction). Physically, acoustic retroreflectors can be formed by right-angle concave corners (both dihedral and trihedral). In optics, the trihedral retroreflector is often referred to as a ‘cube corner reflector’, ‘corner-cube reflector’ or just a ‘corner cube’. Arrays of corner cubes are used for some optical treatments (e.g., photo-electric sensor reflectors, bicycle reflectors and lunar ranging reflectors [10]), so that the reflected light around the source is intensified as each trihedron in the array reflects back [11,12]—this provides a model for analogous acoustic treatment. An important consideration in audible-range acoustics is that the wavelengths involved can be large, and thus the trihedron size needs to be correspondingly large to perform as a retroreflector. As a rule of thumb, an indicative frequency ( f R ) above which a reflector at normal incidence has little or no diffraction loss can be calculated from the speed of sound (c), distance from the collocated source-receiver to the reflector (r) and the reflector width (d) as per Equation (1) [13,14]. For a square reflector at normal incidence, the denominator is its surface area, S. Below f R / 2 , the diffraction loss slope is 6 dB/octave, and Rindel [14] suggests f R / 2 as a practical frequency above which diffraction loss at normal incidence is of minor importance.
f R c r d 2
Arguably, the simple rectangular room—one of the most-studied forms in theoretical room acoustics—is retroreflective, because every reflection (planar, dihedral and trihedral) is returned to the source location. However, it is only trivially so, since every reflection fills the entire room volume, meaning the source location is not a focus point from retroreflection. For a room to be non-trivially retroreflective, the retroreflectors must be smaller than the room’s basic surfaces (but sufficiently large for a useful f R ), so that the reflected wavefronts are returned to the source without filling the rest of the room. With arrays comprising many retroreflectors, each returning sound to the source, there is an energy focus at any sound source, with comparatively little acoustic energy reflected elsewhere in the room. This phenomenon has been demonstrated physically and computationally using a small specially designed retroreflective room [9]. The audible result is that high-frequency phonemes from one’s own voice are particularly strong, a phenomenon which is envisaged for practical application in room acoustics to influence relaxed voice projection [15]. Considering the scarcity of room acoustics research literature on retroreflection, the question arises as to whether larger-scale pre-existing cases of acoustically retroreflective rooms exist, and how the phenomenon of retroreflection is manifest within them.
While pre-existing cases of acoustic retroreflection in architecture have been identified in building façades [6,7,8], finding pre-existing extensive cases in room acoustics is more challenging. Indoors, candidates for incidental retroreflection could include rooms with simple coffered ceilings (where surfaces are planar and perpendicular) [16]. Retroreflection has been used intentionally in some auditoria to support performers on stage [17,18]. However, such retroreflective treatment does not dominate the room’s acoustic design—which is mostly motivated to provide high-quality sound to the audience.
Steps can provide dihedral and trihedral concave corners, and thus an environment with many steps could be acoustically retroreflective. Indian stepped ponds are some of the most extensive cases of step-based architecture. Furthermore, unlike stepped pyramids, the overall form of a stepped pond is concave—the stepped pond is a type of room. They provide vantage points from which hundreds of trihedral corners are simultaneously visible. In this way, stepped ponds provide potentially rich cases for retroreflective room acoustics, notwithstanding issues such as diffraction loss, atmospheric dissipation, variable wind and geometric deviations that could reduce retroreflectivity. Most importantly, Equation (1) raises the question of whether the steps are just too small for significant acoustic retroreflection over typical distances from vantage points within the frequency range important for humans.

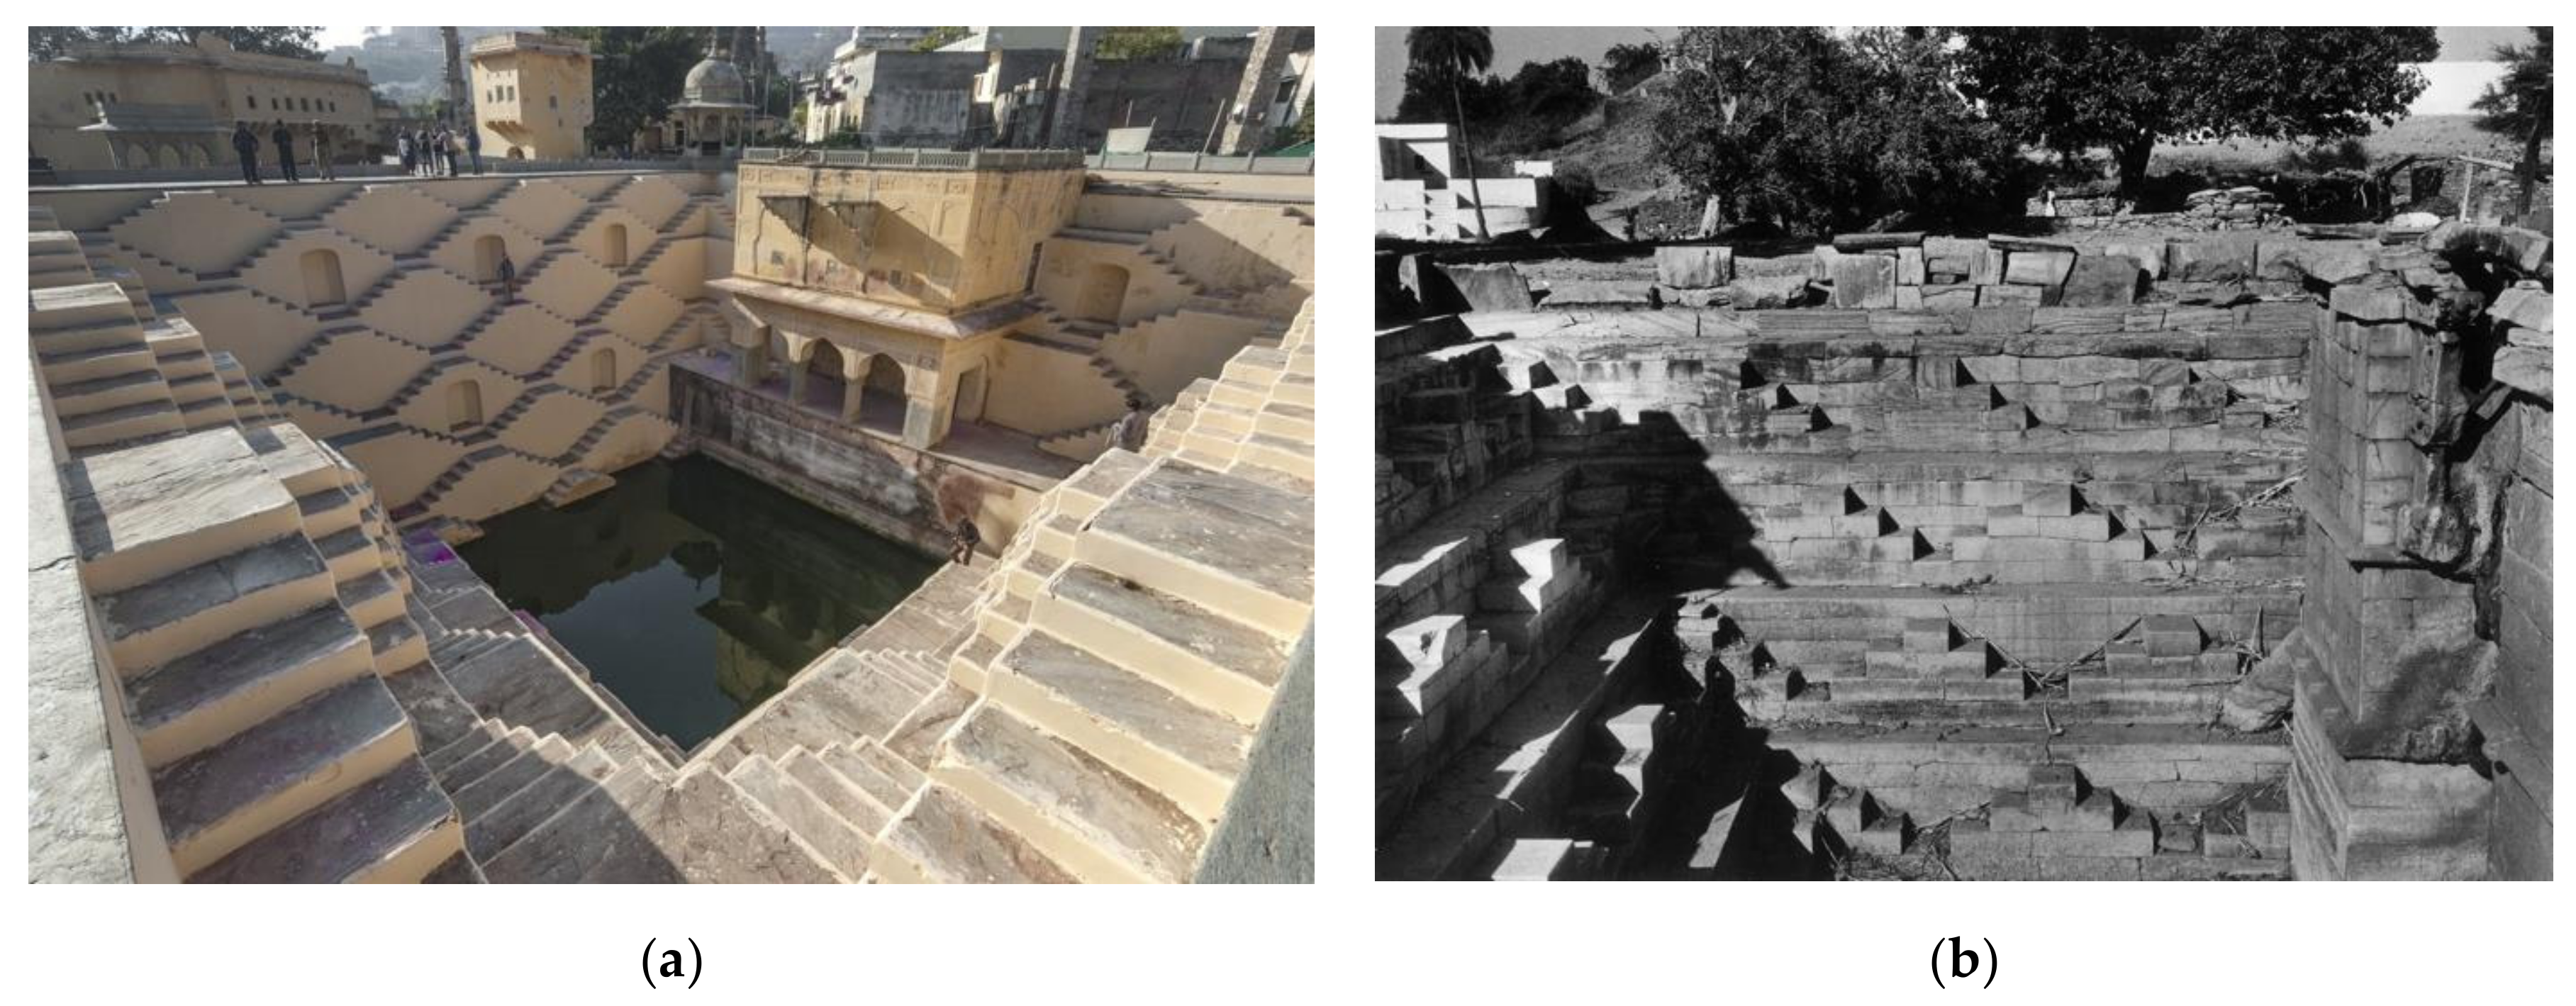
1.2. Introduction to Indian Stepped Ponds

The term stepwell is used for a wide range of architectural forms that are built into the ground with steps leading to water. In northern and western parts of India, where the structures studied in this paper are located, they can be referred to using several terms, which may depend on their history, purpose, colloquial usage, use in the literature, etc. Some common terms include baori/baoli (बावड़ी/बावली in Hindi), vav (વાવ in Gujarati), vapi (वापी in Sanskrit and Hindi), barav (बारव in Marathi) and kund (कुंड in Hindi). It must be noted, however, that these terms are oftentimes interchangeable. Still, a baori/vav/vapi generally refers to an underground building, which, in some instances, is extensive and elaborate, with one or more staircases leading to water [19]. A kund, which is the type of stepwell that this paper is concerned with, is typically a ‘stepped pond’ or ‘stepped tank’, often with many staircases leading to a pool of water, sometimes resembling an inverted pyramid [20]. Kunds have been built for religious reasons (Yagna kund), for medicinal bathing (Brahma kund) and for general bathing (Snan kund), and some may be used for drinking water [20,21,22,23,24]. Some are associated with temples, some are in public places and some are in private residences. Many larger stepped ponds have a rectangular plan with arrays of intersecting steps on three sides, a more vertical structure on the fourth side and a pool at the base. In more elaborate cases, this fourth side may have arched loggias and rooms, and a platform from which the architectural spectacle of the three other sides can be fully viewed. The water level can vary greatly with the season, and thus part of the ingenuity of the design is that the steps lead to the water regardless of its level.
More than 30 stepped ponds that approximately or exactly follow the above form are documented by the main sources referred to in this paper [19,20,21,22,23,24,25], mostly in Rajasthan and Gujarat. Many more are documented in the crowd-sourced Atlas of Stepwells [26]. Their scale varies from intimate to monumental—with Chand Baori (Abhaneri, Rajasthan) being one of India’s largest and best known, dating from around 800 CE. Chand Baori has many hundreds of steps which could contribute to acoustic retroreflection over its three intricately stepped faces, but smaller stepped ponds also have good prospects for acoustic retroreflection—and may be better for retroreflection because of their smaller size. Table 1 provides some examples of stepped ponds for which basic architectural data are documented (the data in the table were extracted from the cited architectural drawings).
Table 1 indicates that there is typically about one step per square metre of top area (ranging from 0.87 at Jaipura Kund to 1.42 at Idar Stepped Pond). This ratio is mostly governed by the horizontal area of individual steps and platforms and the area of the pool (which is the minimum for the Table 1 data). The average step height for the four cases with depth in metres spans the range 0.21–0.28 m (mean 0.27 m). The number of trihedral concave corners in a stepped pond is greater than the number of step horizontal surfaces and includes large trihedra where the main faces intersect. The number of large trihedra depends mainly on the number of levels in the stepwell. Some stepped ponds have extra corners from niches in their walls (e.g., Panna Meena ka Kund). Many of these examples have an approximately constant slope in the stepped surfaces, but the slope of Idar steepens dramatically towards the pond, whereas the slope of Hadi Rani is steepest around its upper part.
This paper investigated Panna Meena ka Kund (Amer, Rajasthan), which is a well-known stepped pond, dating from the 16th century. Not as deep as Chand Baori, it nevertheless is a large and deep stepped pond with hundreds of crisscrossing steps that lead to the pool—including some on the fourth side (Figure 1a). Mostly, the walls are steps, with only one platform near the base of the stepped pond (submerged in Figure 1 photograph). It has 1.31 steps per square metre of top area. The vertical surfaces are rendered with a form of polished plaster [22]. The stepwell is in good condition and potentially provides an excellent case for acoustic retroreflection.
As an instance of a smaller stepped pond, this paper also focused on Lahan Vav (Basantgarh, Rajasthan, Figure 1b)—which is not well known. Dating from 976–999 CE, this stepped pond has bare stone block surfaces, some of which are damaged or displaced. It was chosen because of its smaller size and the availability of architectural drawings, and in its original state, it would be expected to have similar acoustic characteristics to other similarly sized stepped ponds, some of which are in better condition. It has a step-to-area ratio of 1.27.

2. Materials and Methods

2.1. Modelling and Simulation

The main predictive method used in this study was finite-difference time-domain (FDTD) simulation. This approach, which is widely used in architectural acoustics research, inherently accounts for the diffraction and higher-order propagation effects from architectural forms. Its biggest limitation is the size of the calculation, which requires large computational resources when large volumes and/or high frequencies are simulated.
Computer models of the exemplar stepwells were created based on published architectural drawings and photographs [22,25]. Due to limitations in computer resources, simulations of Panna Meena ka Kund were conducted using a partial model of the stepwell (Figure 2a). Simulations of Lahan Vav were conducted using the entire stepwell (Figure 2b). Simulations were also conducted with an anechoic environment the same size as each model for each source position, allowing the direct sound wave to be removed by subtraction. Values for reflected sound energy levels are expressed relative to the free field energy level 1 m from the source.
Omnidirectional point source positions were chosen for a commanding view of the stepwells, at a height of 1.5 m above the tower platforms (Figure 2). Sources were spaced linearly at 0.5 m intervals, with eight positions at Panna Meena ka Kund and six positions at Lahan Vav. The source simulation used a soft source [27], with a Gaussian pulse waveform.
The simulation volume for Panna Meena ka Kund was 18.78   m × 12.64   m × 8.82   m = 2093   m 3 , excluding the perfectly matched layer. It was voxelised with a cubic voxel width ( d x ) of 9 mm, yielding 2.15 × 10 9 voxels. The basic receiver grid was a horizontal plane at source height (extending to the edges of the simulation), spaced at 4 × d x , yielding 151,206 receivers. A sampling rate of 60 kHz was used. Simulations were run for 13,200 time samples (0.22 s).
The simulation volume for Lahan Vav was 12.58   m × 18.12   m × 10.05   m = 2291   m 3 ( 2.35 × 10 9 voxels), excluding the perfectly matched layer. The same d x and sampling rate were used, and the basic receiver plane was designed in the same way as Panna Meena ka Kund (145,326 receivers over a horizontal plane at source height). Basic simulations were run for 12,000 time samples (0.2 s), and longer simulations (30,000 time samples, 0.5 s) were also conducted to include more of the stepwell’s reverberation.
The open parts of the models were surrounded with a 10-voxel perfectly matched layer, as described by Chern [28], providing anechoic boundaries. The simulated stepwell surfaces were hard, with no sound absorption introduced.

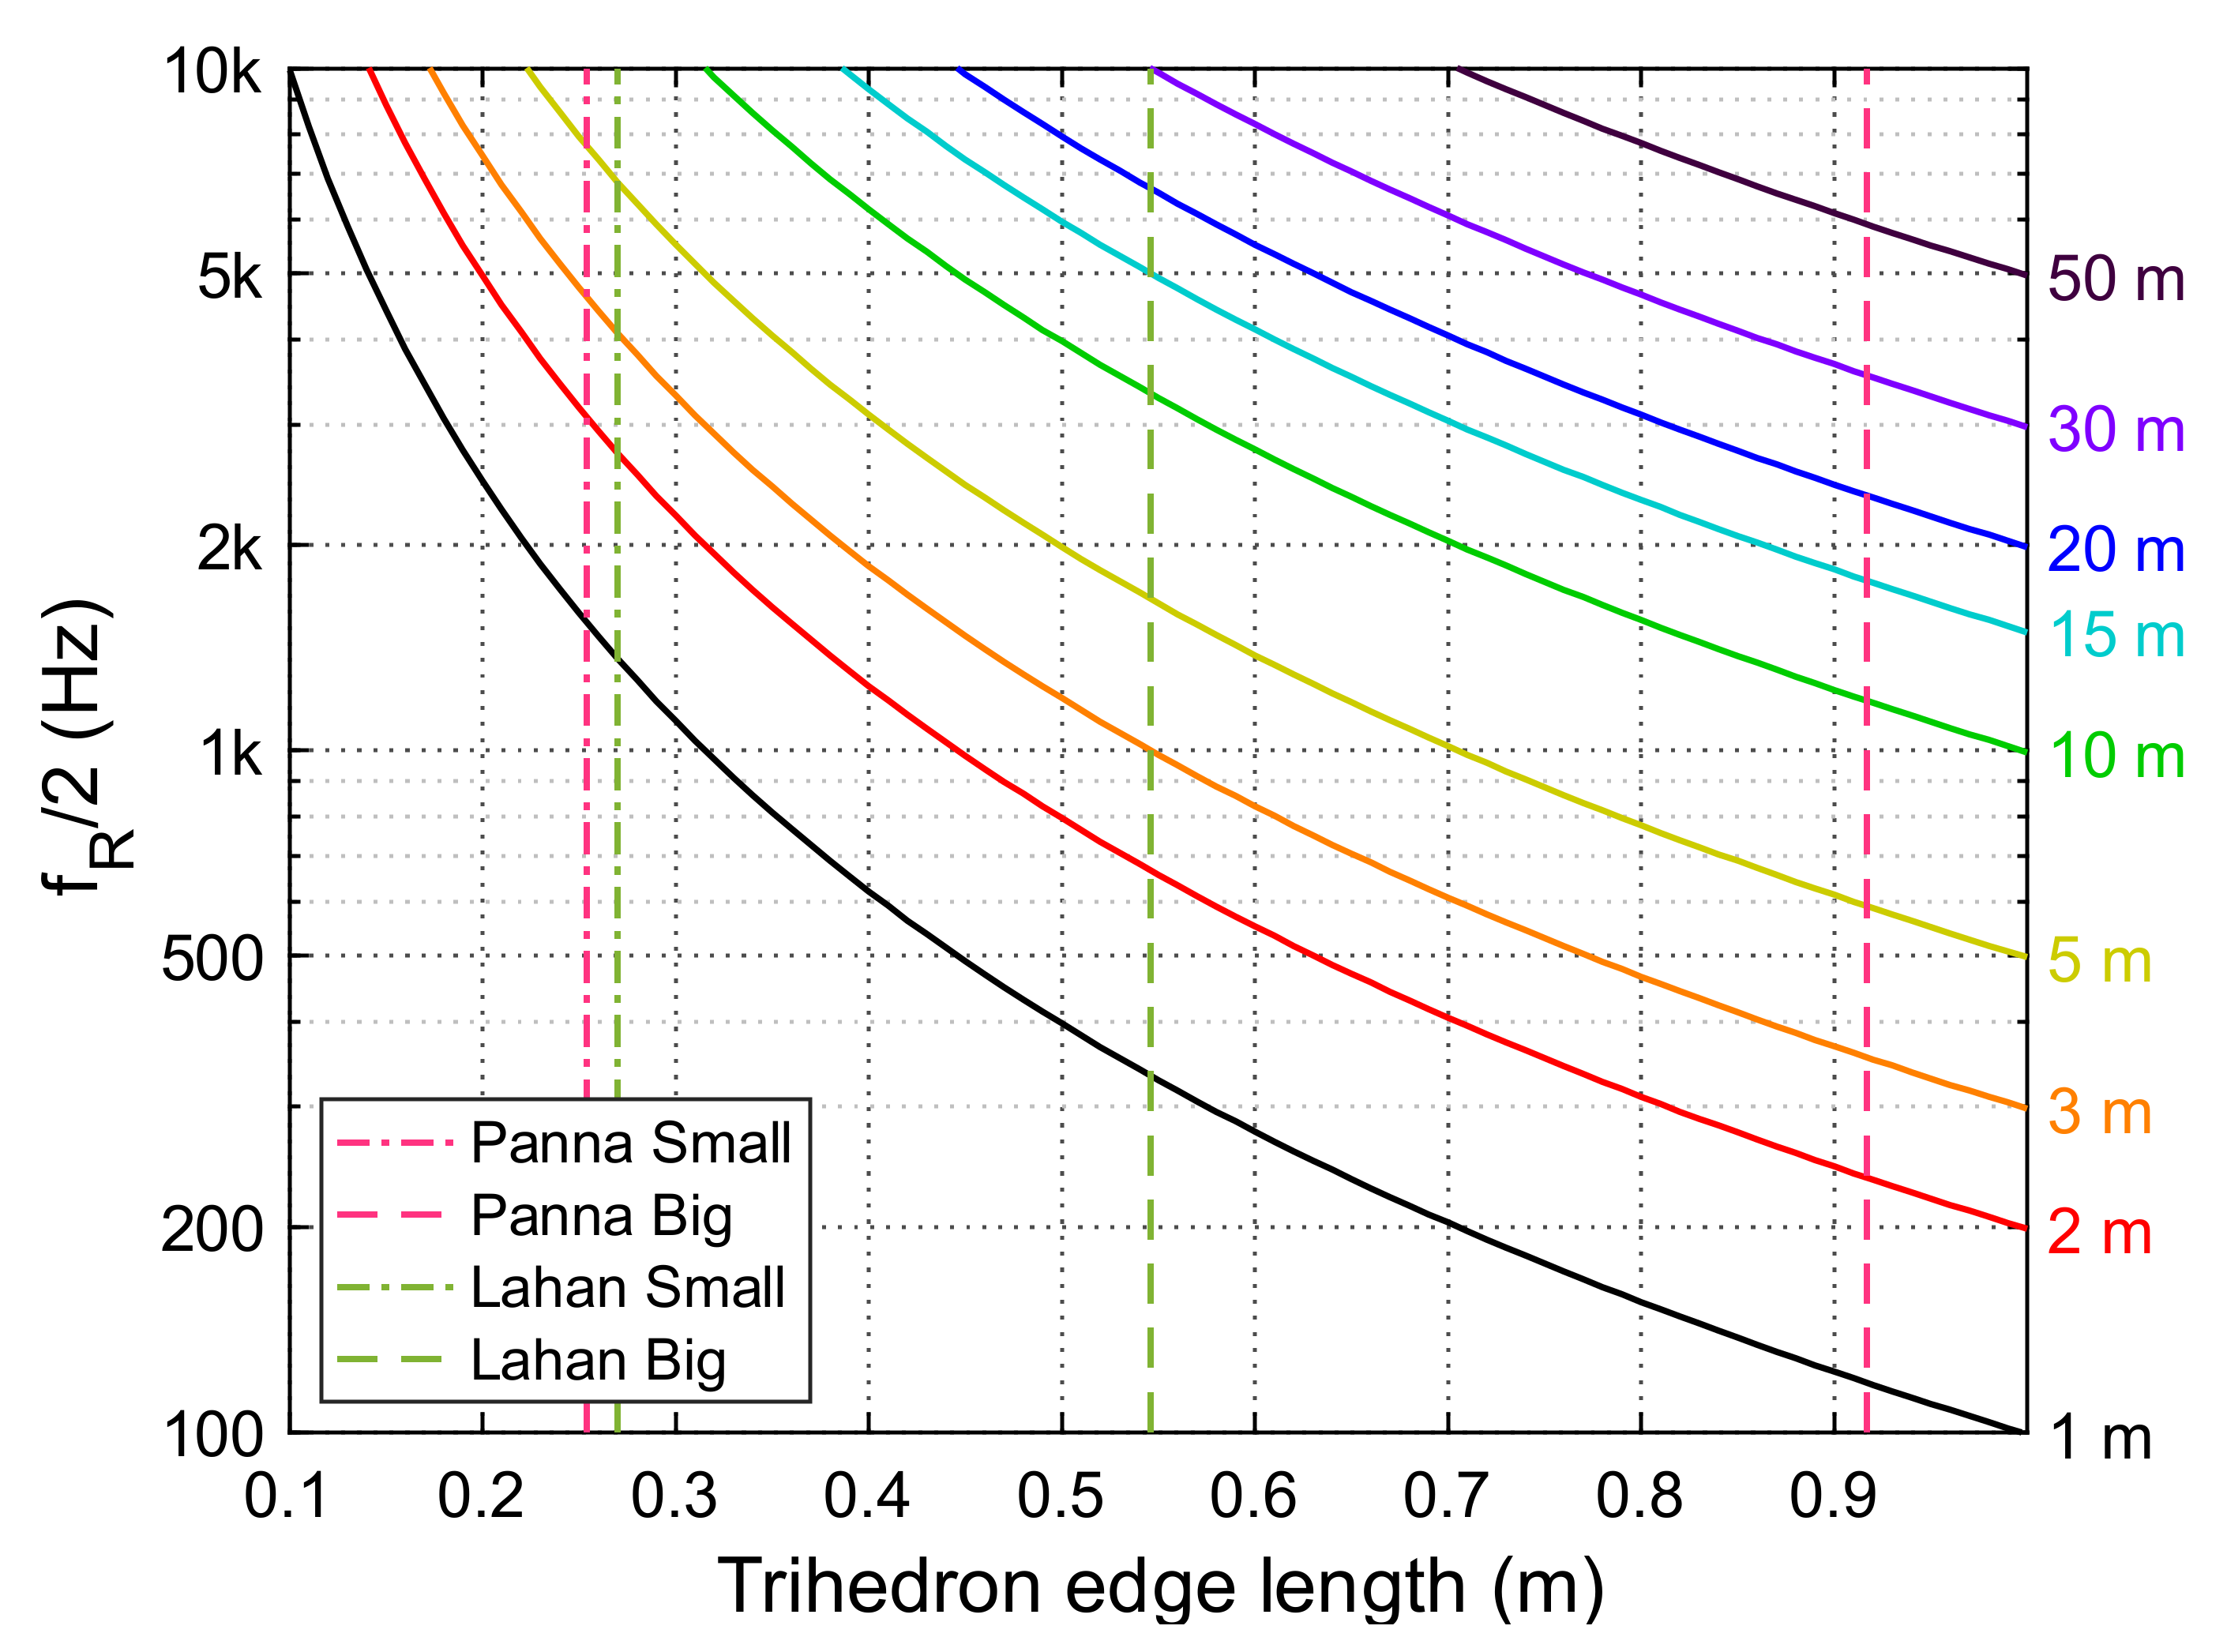
2.2. Prediction of Retroreflected Energy from Trihedral Corners

A simple method to predict the retroreflected sound energy level returned to the source was presented by Cabrera et al. [8]. This method treats each visible concave trihedral corner as an equivalent mirror facing the source and uses first-order image-source calculation accounting for diffraction loss in the frequency domain. The complex transfer function for each reflector depends on geometric dispersion and delay (distance travelled is twice the distance, r , from the source to the reflector; k is the wave number), and the diffraction coefficient, K . The diffraction loss depends on the size and distance of the reflector (as indicated indirectly by Equation (1)) and can be calculated using the Kirchhoff–Fresnel approximation (used here), or alternatively Rindel’s more efficient approximation [14]. The total retroreflected energy level, L retro   re   1   m , is obtained by summing the transfer functions of all n reflectors (Equation (2)). Octave band transfer functions can then be derived from the constituent spectrum components.
L retro   re   1   m = 20 log i = 1 n K i 2 r i e j k 2 r i
This is a simplification of the theory in [8], neglecting the absorption coefficient of the surface and atmospheric loss, to match the FDTD simulation.
For a given source position, the first stage is to identify the visible concave trihedral corners—since occluded corners will not act as retroreflectors. For a given corner with its particular geometry, the size of the equivalent mirror is hard to precisely determine. The simplified approach taken in this study is to start with the boresight shadow of a square trihedron of the same edge length. For diffraction coefficient calculation, an equivalent area square reflector is used, multiplied by the cosine of the incidence angle. For the stepwells, there are many small trihedral corners of individual steps, as well as a smaller number of large corners. For the modelling in this paper, a conservative approach was taken, i.e., the equivalent square trihedron is the largest square trihedron that fits the corner, meaning that the edge length is the minimum edge of the three surface edges. This means that for steps, the step height is taken as the trihedron edge length (step heights of l = 0.254 m for Panna Meena ka Kund and 0.27 m for Lahan Vav). For the large corners, again, the minimum edge length is taken, which is generally the width of the walking surface (l = 0.917 m for Panna Meena ka Kund and 0.546 m for Lahan Vav). The boresight shadow area then is S = 3 × l 2 , which can then be adjusted by the cosine of the incidence angle. It should be borne in mind that trihedral reflections are considerably more complicated than this simplification [29,30], but the point of this model is to provide a simple estimate without the large computational demands of wave-based simulation or higher-order image-source modelling. The model provides a rough theory incorporating diffraction loss that can help interpret simulation results.
This modelling is expected to underestimate the reflected energy for several reasons. It only considers the retroreflected energy from individual reflectors, with no other reflected energy included (e.g., scattered reflections, specular reflections). It does not include dihedral corner reflections. Furthermore, it only includes first-order reflections and has no diffuse reverberation contribution. The effective size of the reflectors remains constant with the frequency, even though small geometric deviations become insignificant at long wavelengths, potentially increasing the reflectors’ effective size. The potential for larger faces to contribute to trihedral retroreflection at oblique angles of incidence [31] is neglected.
Despite these limitations, the modelling allows some analysis of the contribution of various retroreflectors to the sound returned to the source. It is expected to be most useful at high frequencies, where retroreflection is expected to dominate the sound returned to the source.

3. Results

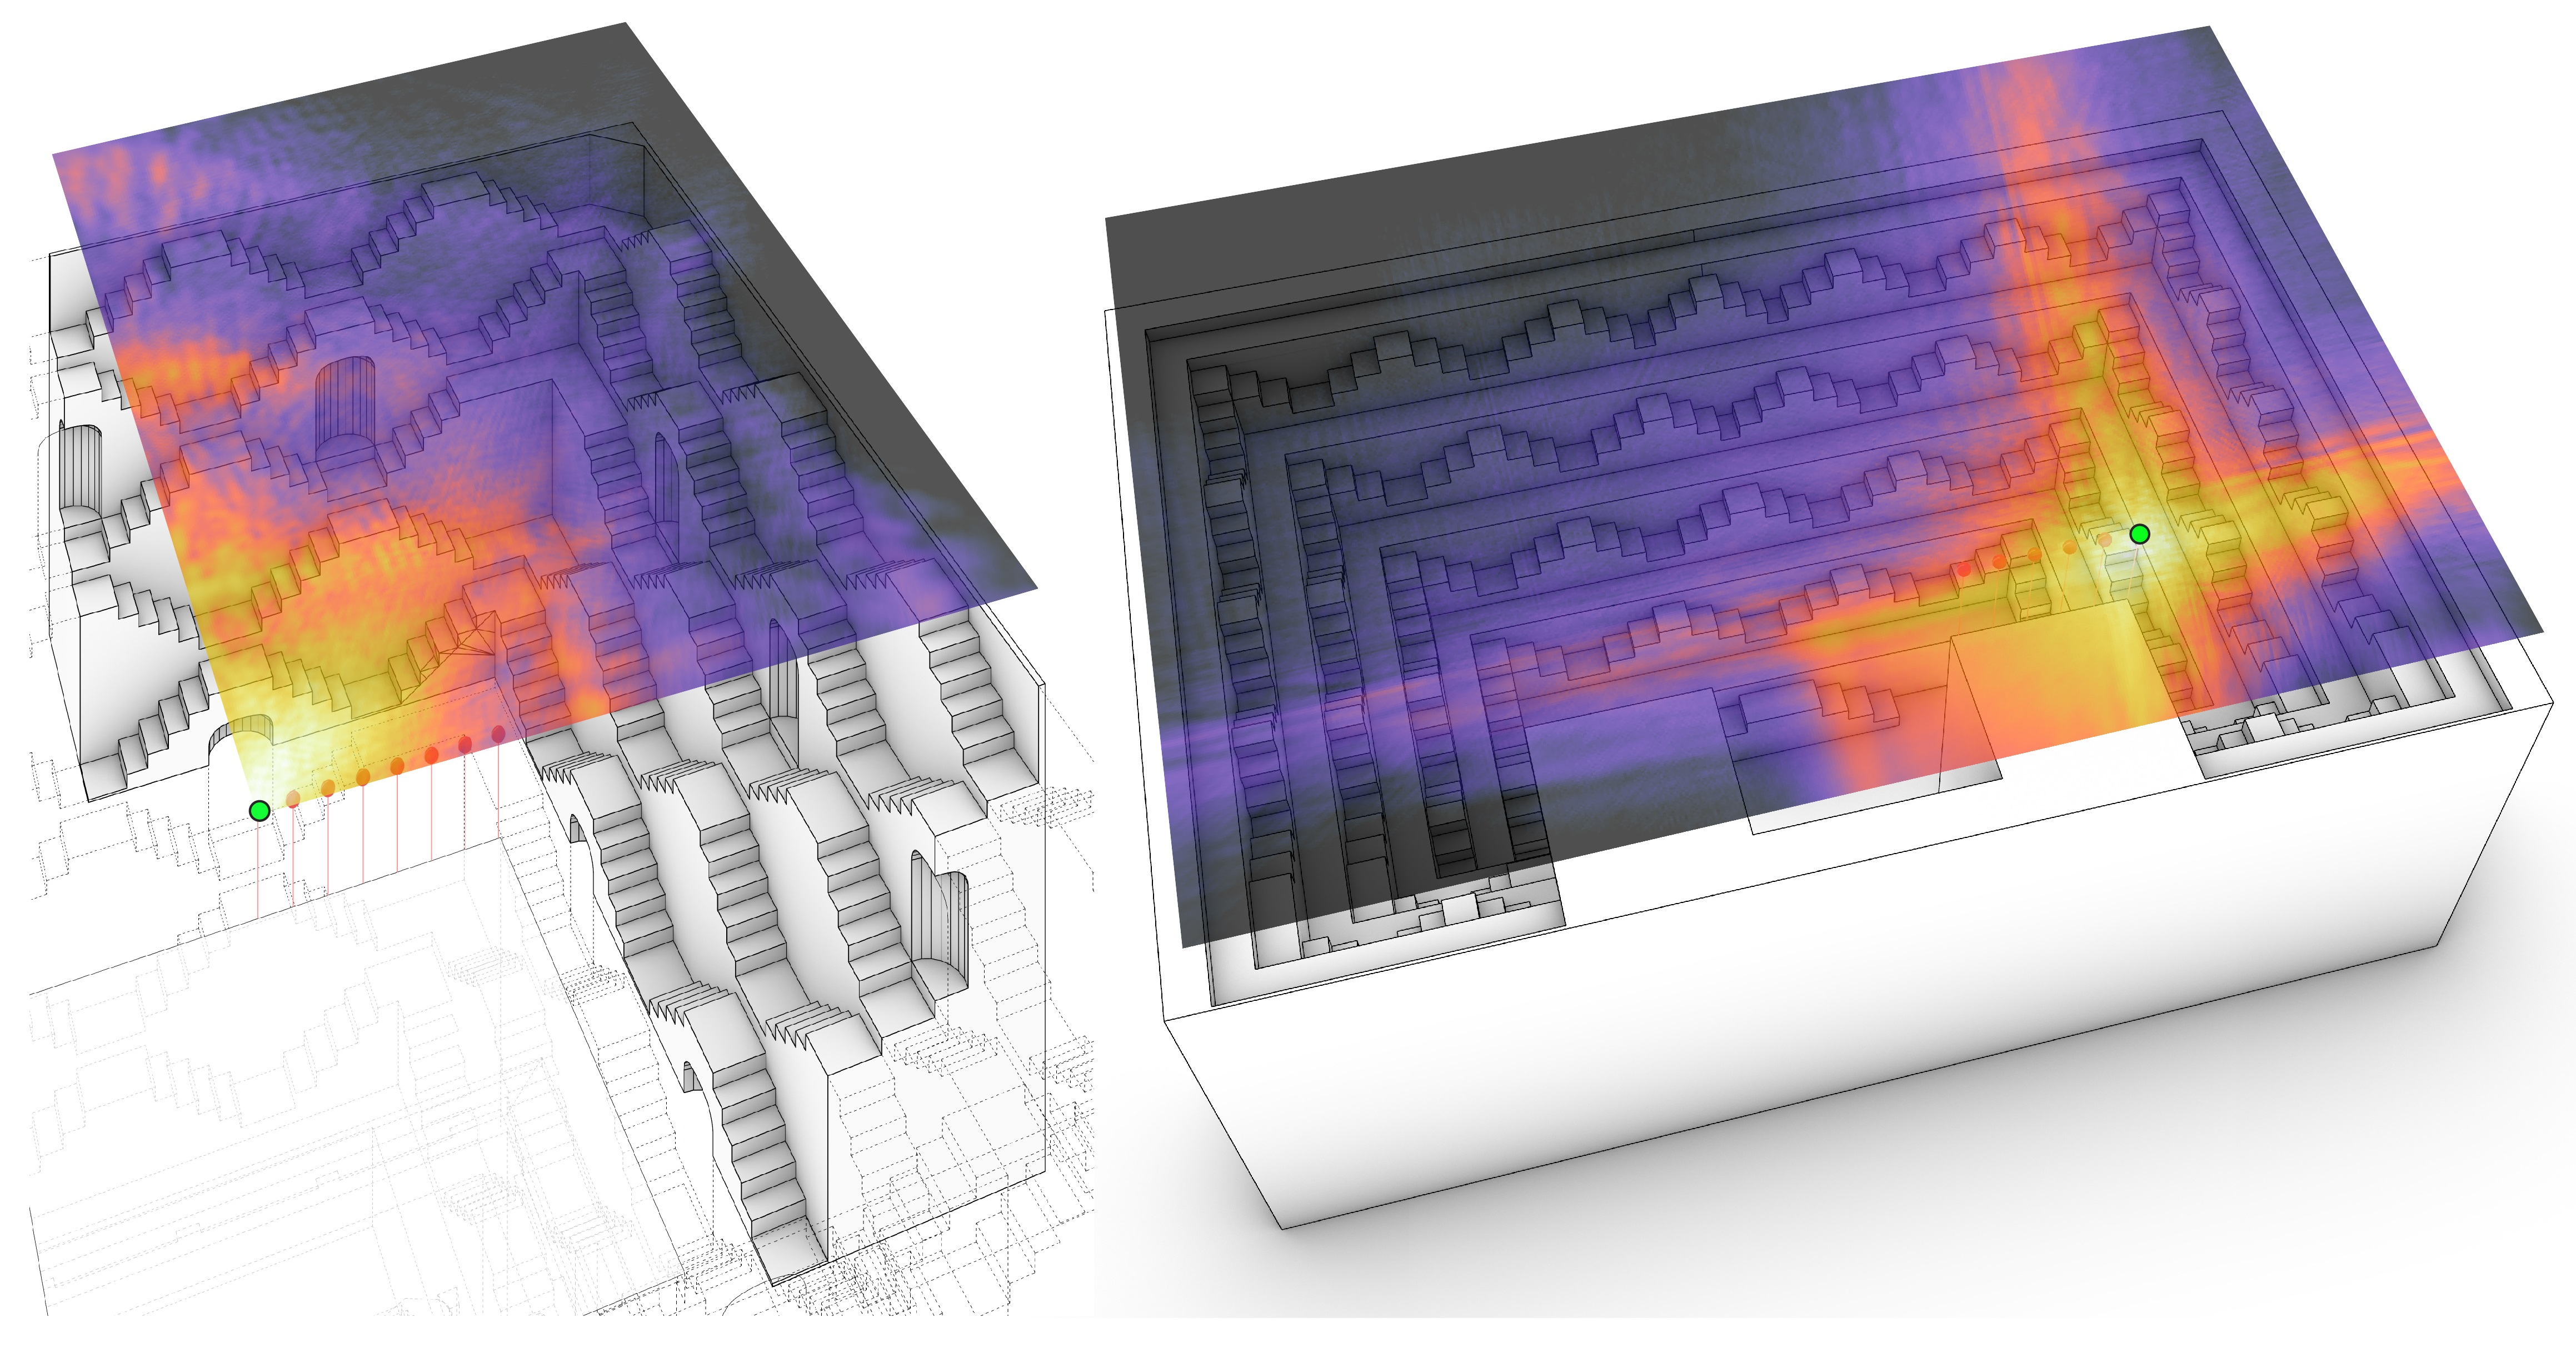
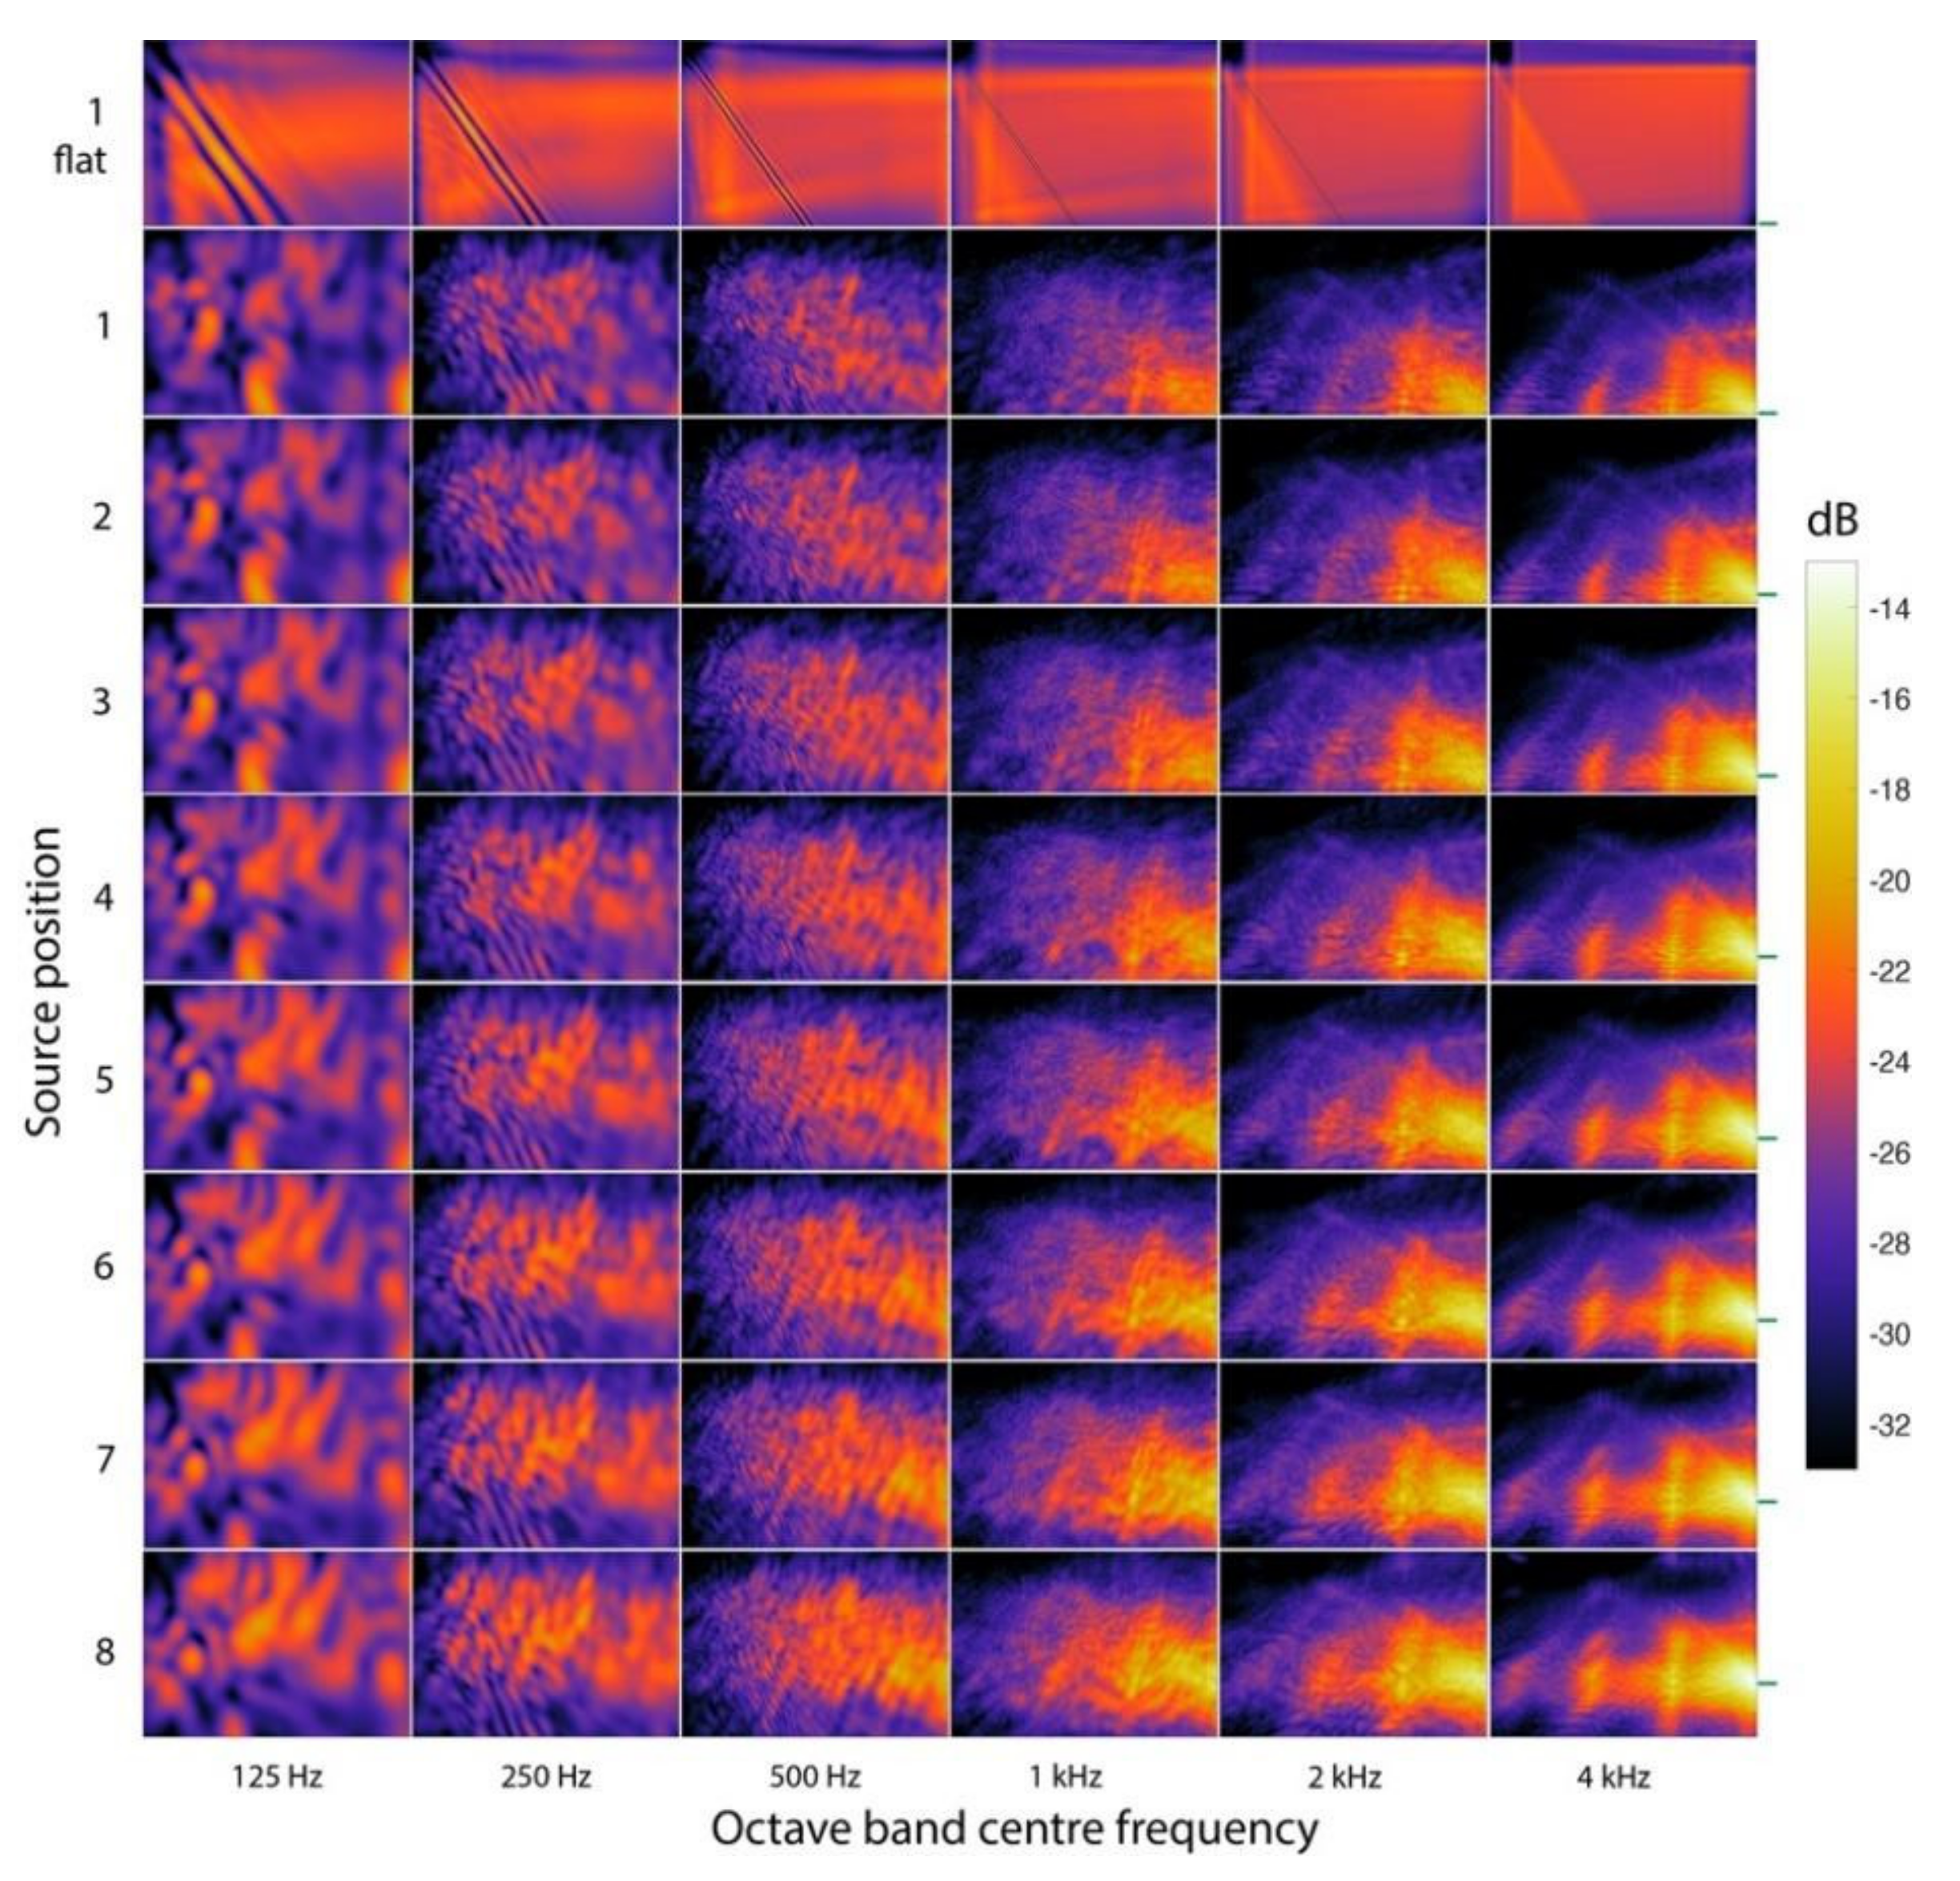
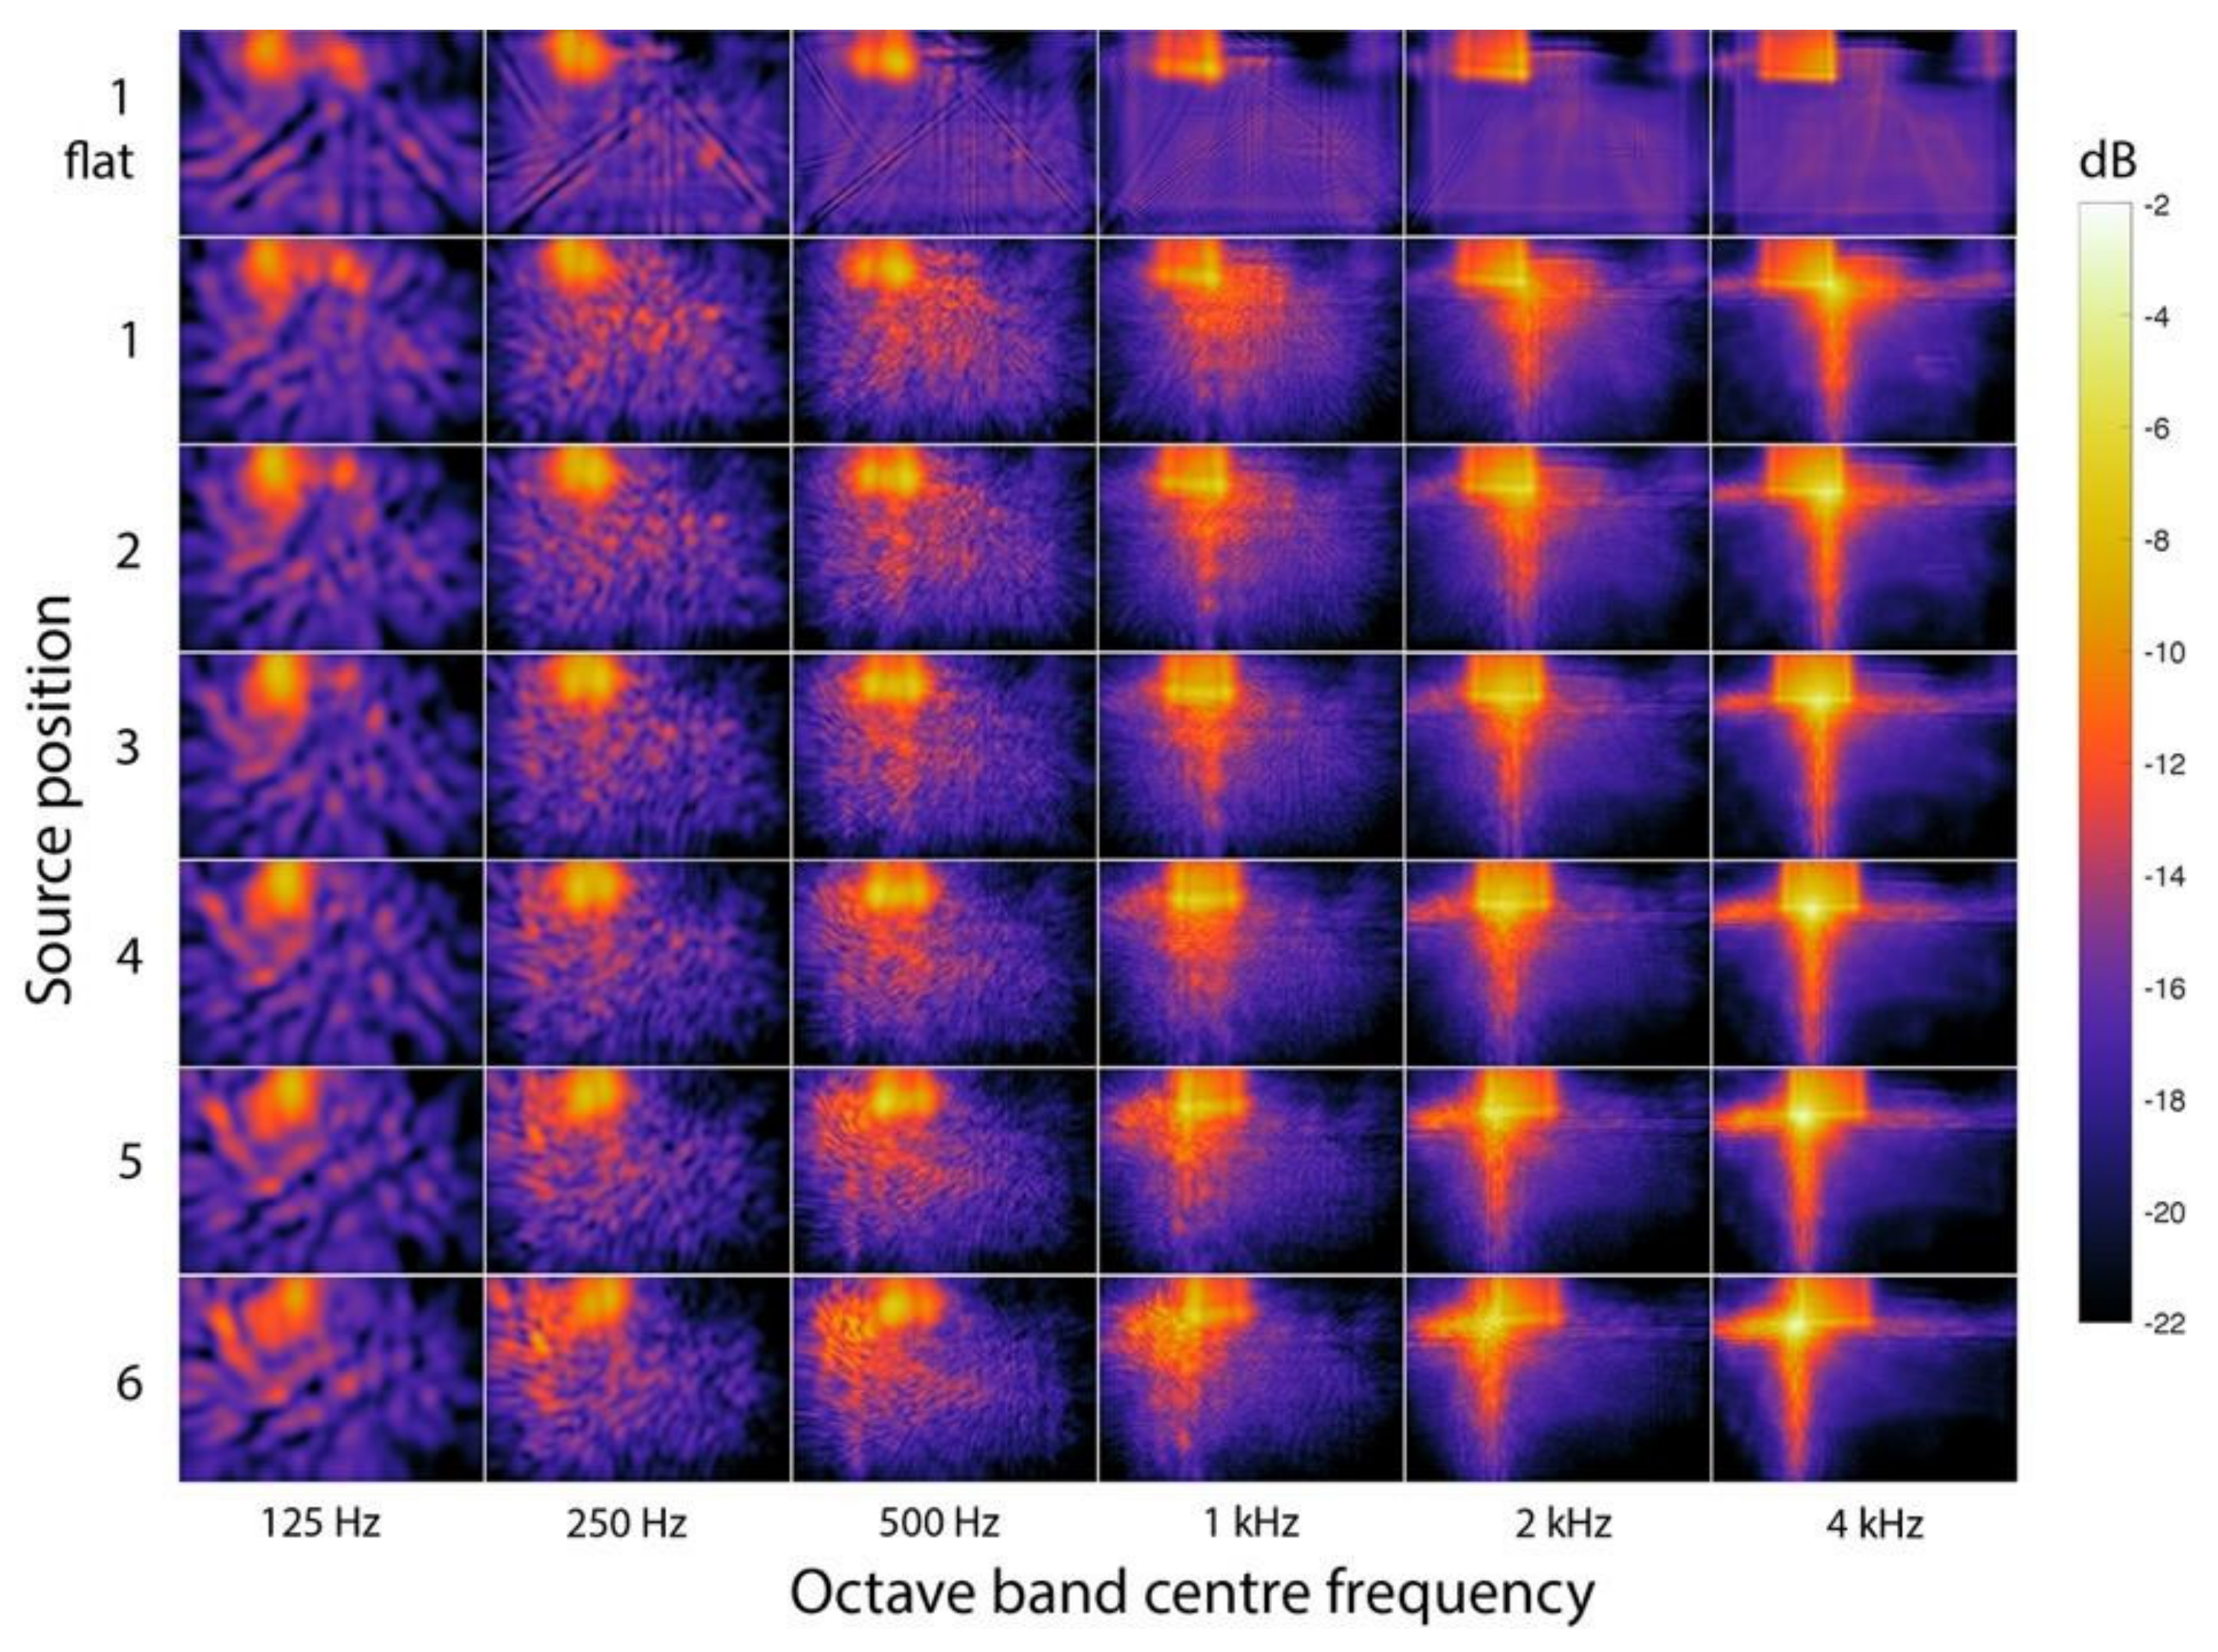
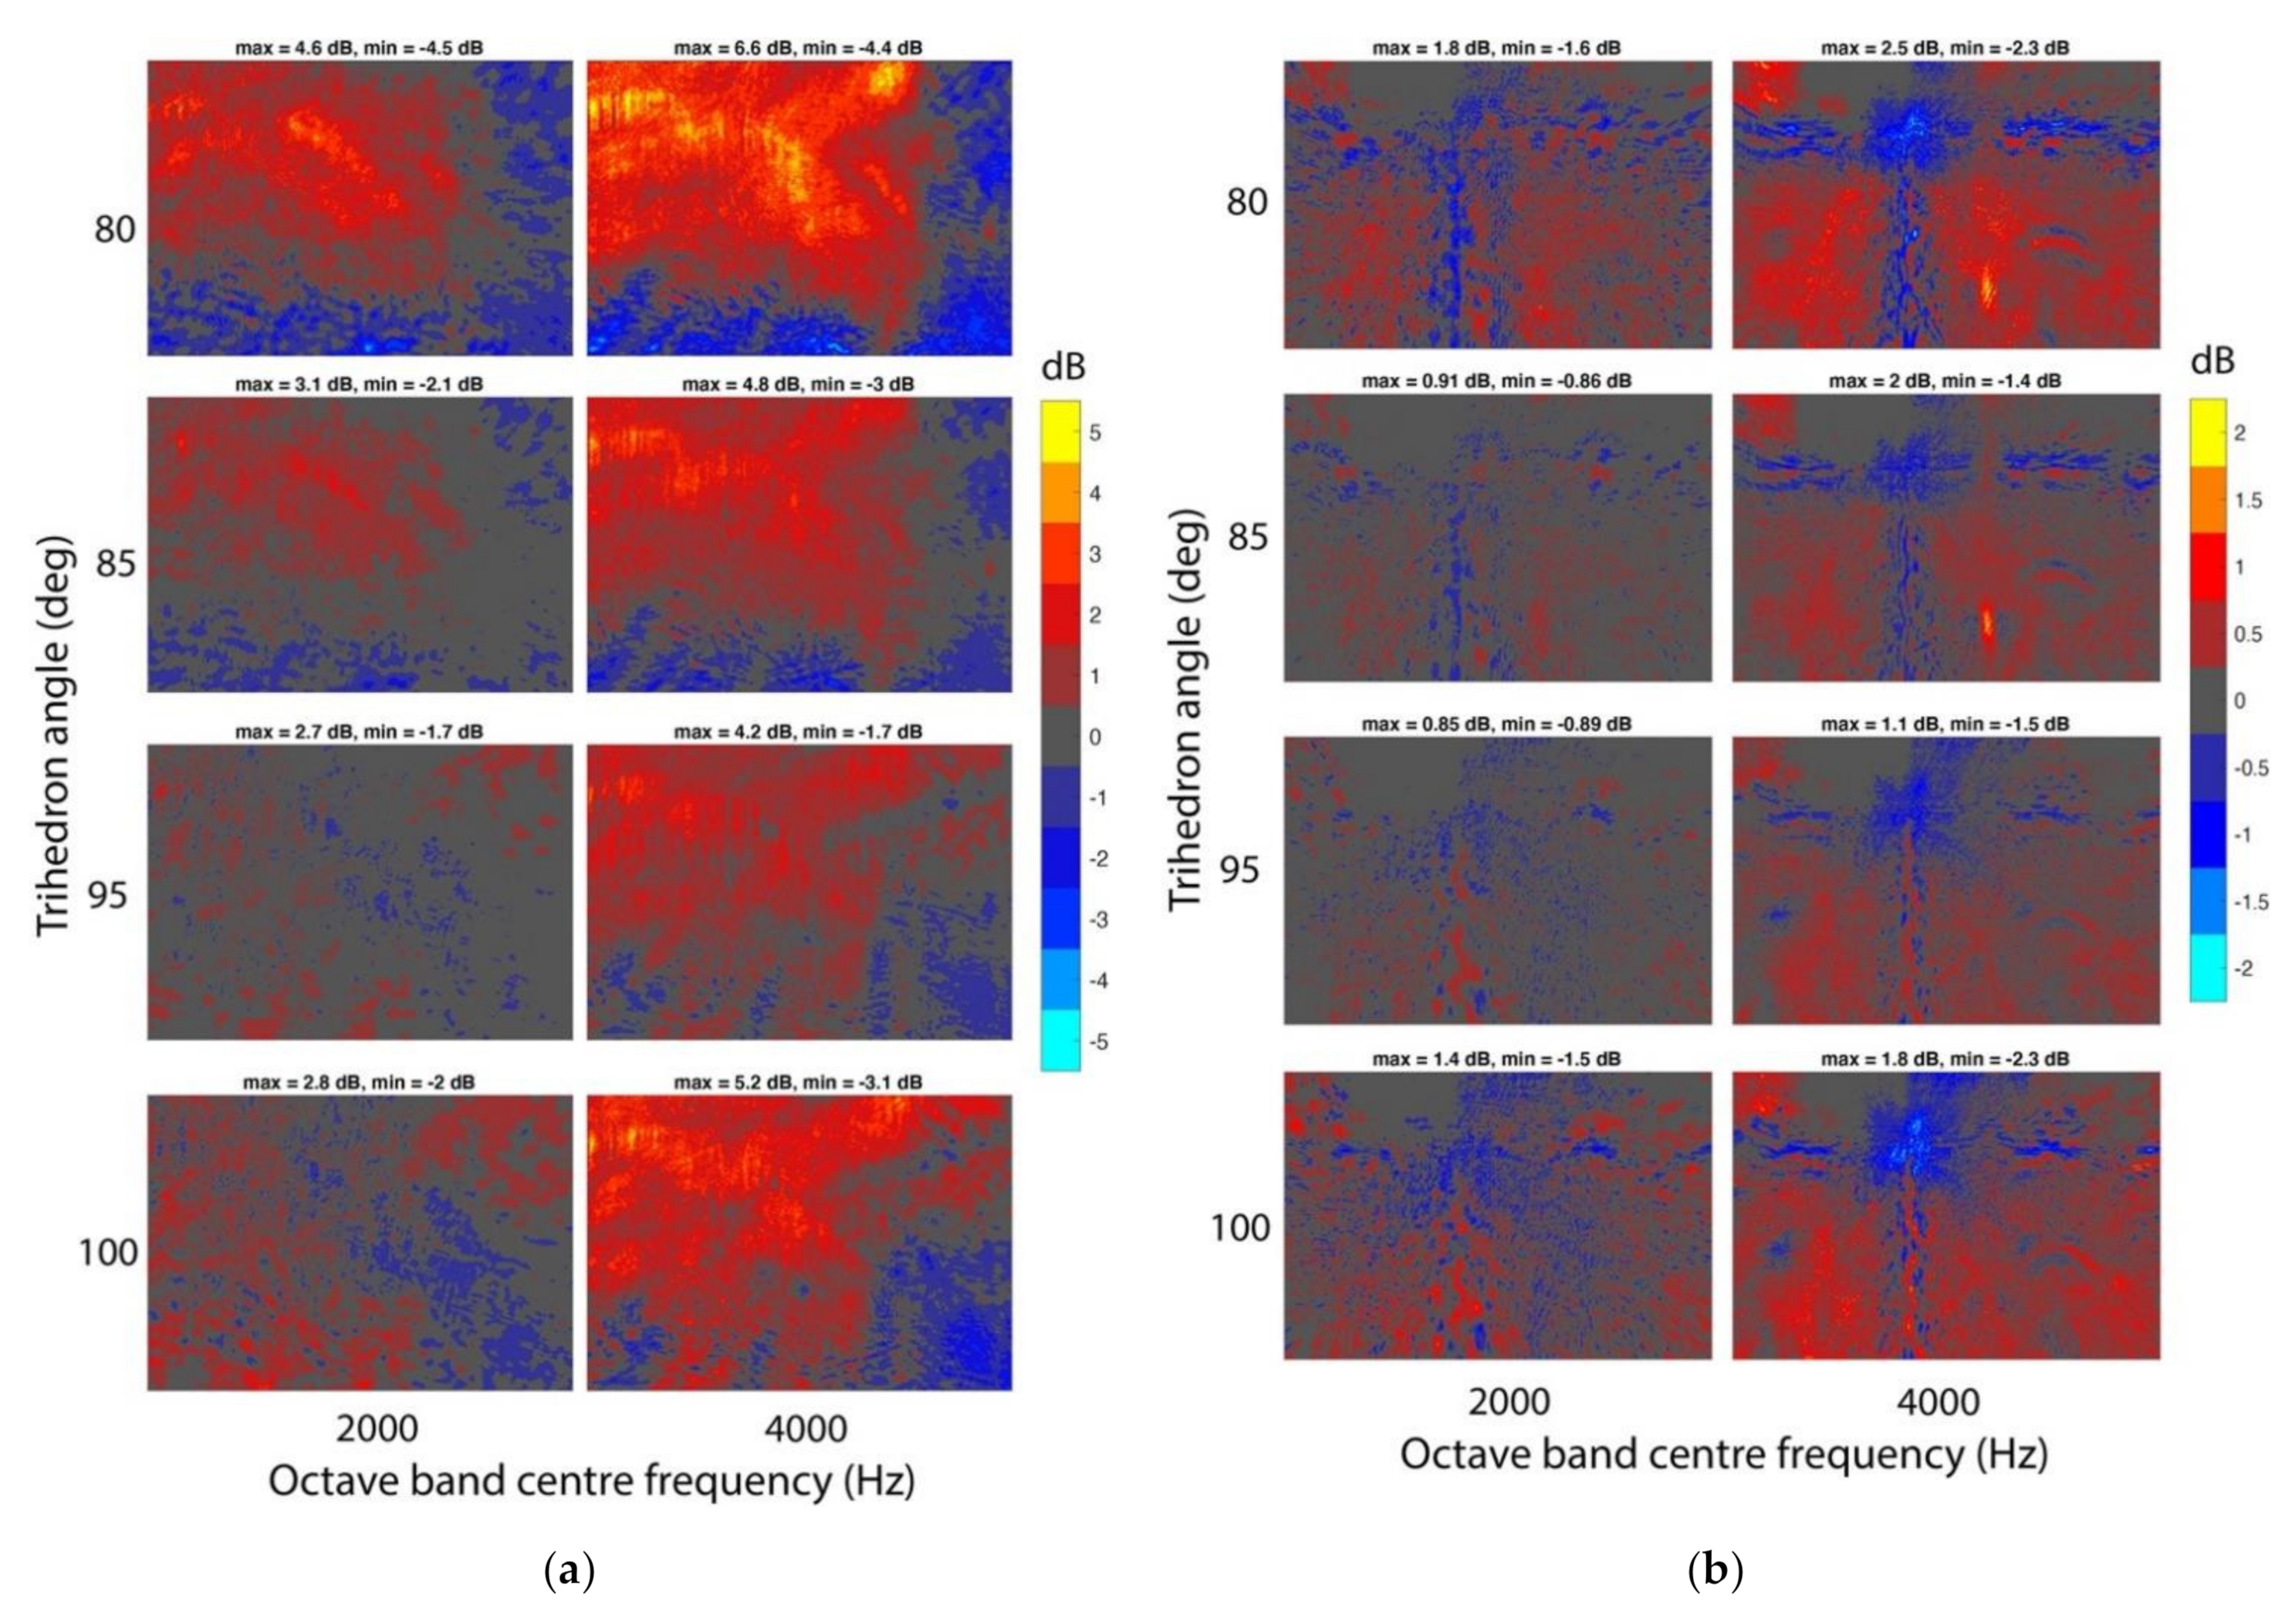
3.1. Spatial Distribution of Reflected Energy

Figure 3 shows the spatial distribution of reflected energy for the eight source positions at Panna Meena ka Kund from the FDTD simulation. Retroreflection is clearly evident in the high-frequency octave bands from the concentration of reflected energy on the respective source position. Retroreflection is clear in the upper three bands evaluated but also more weakly suggested in the 500 Hz and 250 Hz bands. The top row of Figure 3 shows the spatial distribution of reflected energy for a flat-surfaced simplification of the Panna Meena ka Kund partial model, which has energy distributed much more evenly across the receiver plane, and no concentration at the source position.
Figure 4 shows the spatial distribution of reflected energy for the six source positions at Lahan Vav. An important difference between this and the Panna Meena ka Kund visualisation (Figure 3) is that the ground reflection from the tower platform is included—which is clearly evident in many of the subplots. The top row of Figure 4 shows the spatial distribution of reflected energy for a flat-surfaced simplification of Lahan Vav, which helps to disambiguate the ground-reflected energy (seen in all subplots) from the retroreflected energy (seen in the non-flat simulation subplots, especially in the higher-frequency bands). Retroreflection is evident in the 1–4 kHz octave bands, most strongly in the 4 kHz band.

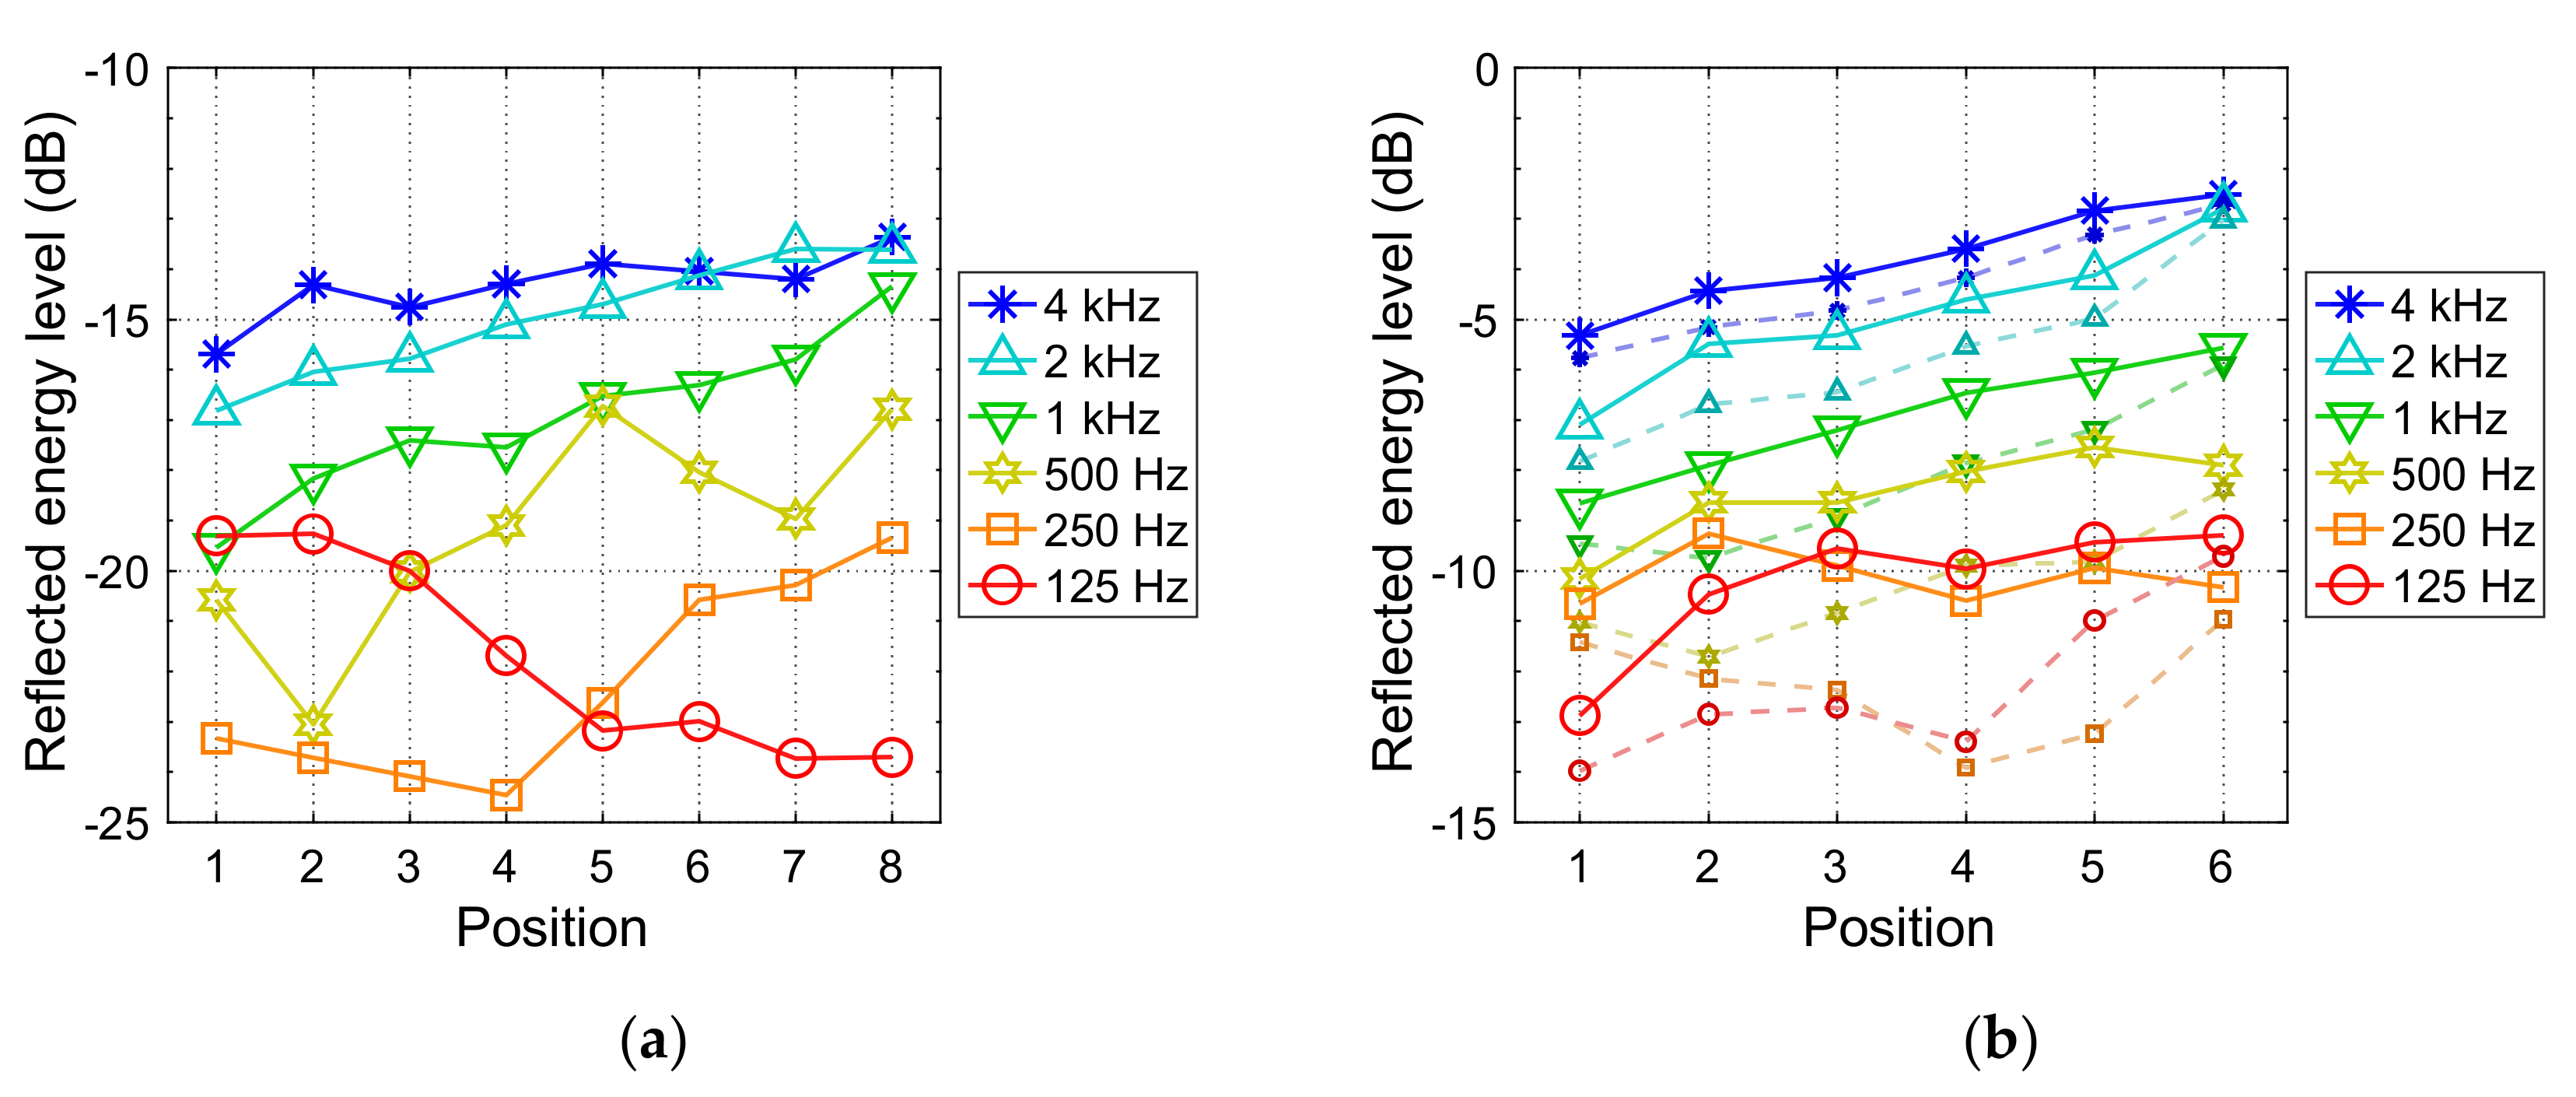
3.2. Reflected Energy at Collocated Source–Receivers

3.2.1. FDTD Simulation Results

Reflected energy levels at the source–receiver positions are shown in Figure 5. Values are greater in the higher-frequency bands for both stepwell models, especially the 2 kHz and 4 kHz bands. Values in these high-frequency bands are about 11 dB greater at Lahan Vav than at Panna Meena ka Kund. At both stepwells, there is a tendency for greater reflected energy levels at lateral positions (higher numbered positions). At both stepwells, this may be influenced by the increased proximity to the side face steps. Another feature of Figure 5 is that it shows the reflected energy levels at Lahan Vav with and without the ground reflection (which was absent at Panna Meena ka Kund). The contribution of the ground reflection is small in the high-frequency bands, for which retroreflection occurs, and larger at lower frequencies. A 3 dB difference would indicate that the ground reflection had equal energy to the subsequent reflections, and some of the positions have differences greater than or equal to 3 dB in the 125 Hz and 250 Hz bands.
The analytically calculated reflection energy level from an extensive ground plane for a source–receiver height of 1.5 m is 20 log 1 / 3 = 9.5 dB. This does not take the edges of the plane into account, which would be relevant for the simulated stepwell vantage points. Nevertheless, many of the Lahan Vav reflected energy levels (including the ground reflection) are similar to this value in the 125 Hz and 250 Hz bands. Values are considerably greater in the upper octave bands. The reflected energy levels in every octave band at Panna Meena ka Kund are all lower than the analytically calculated ground reflection.

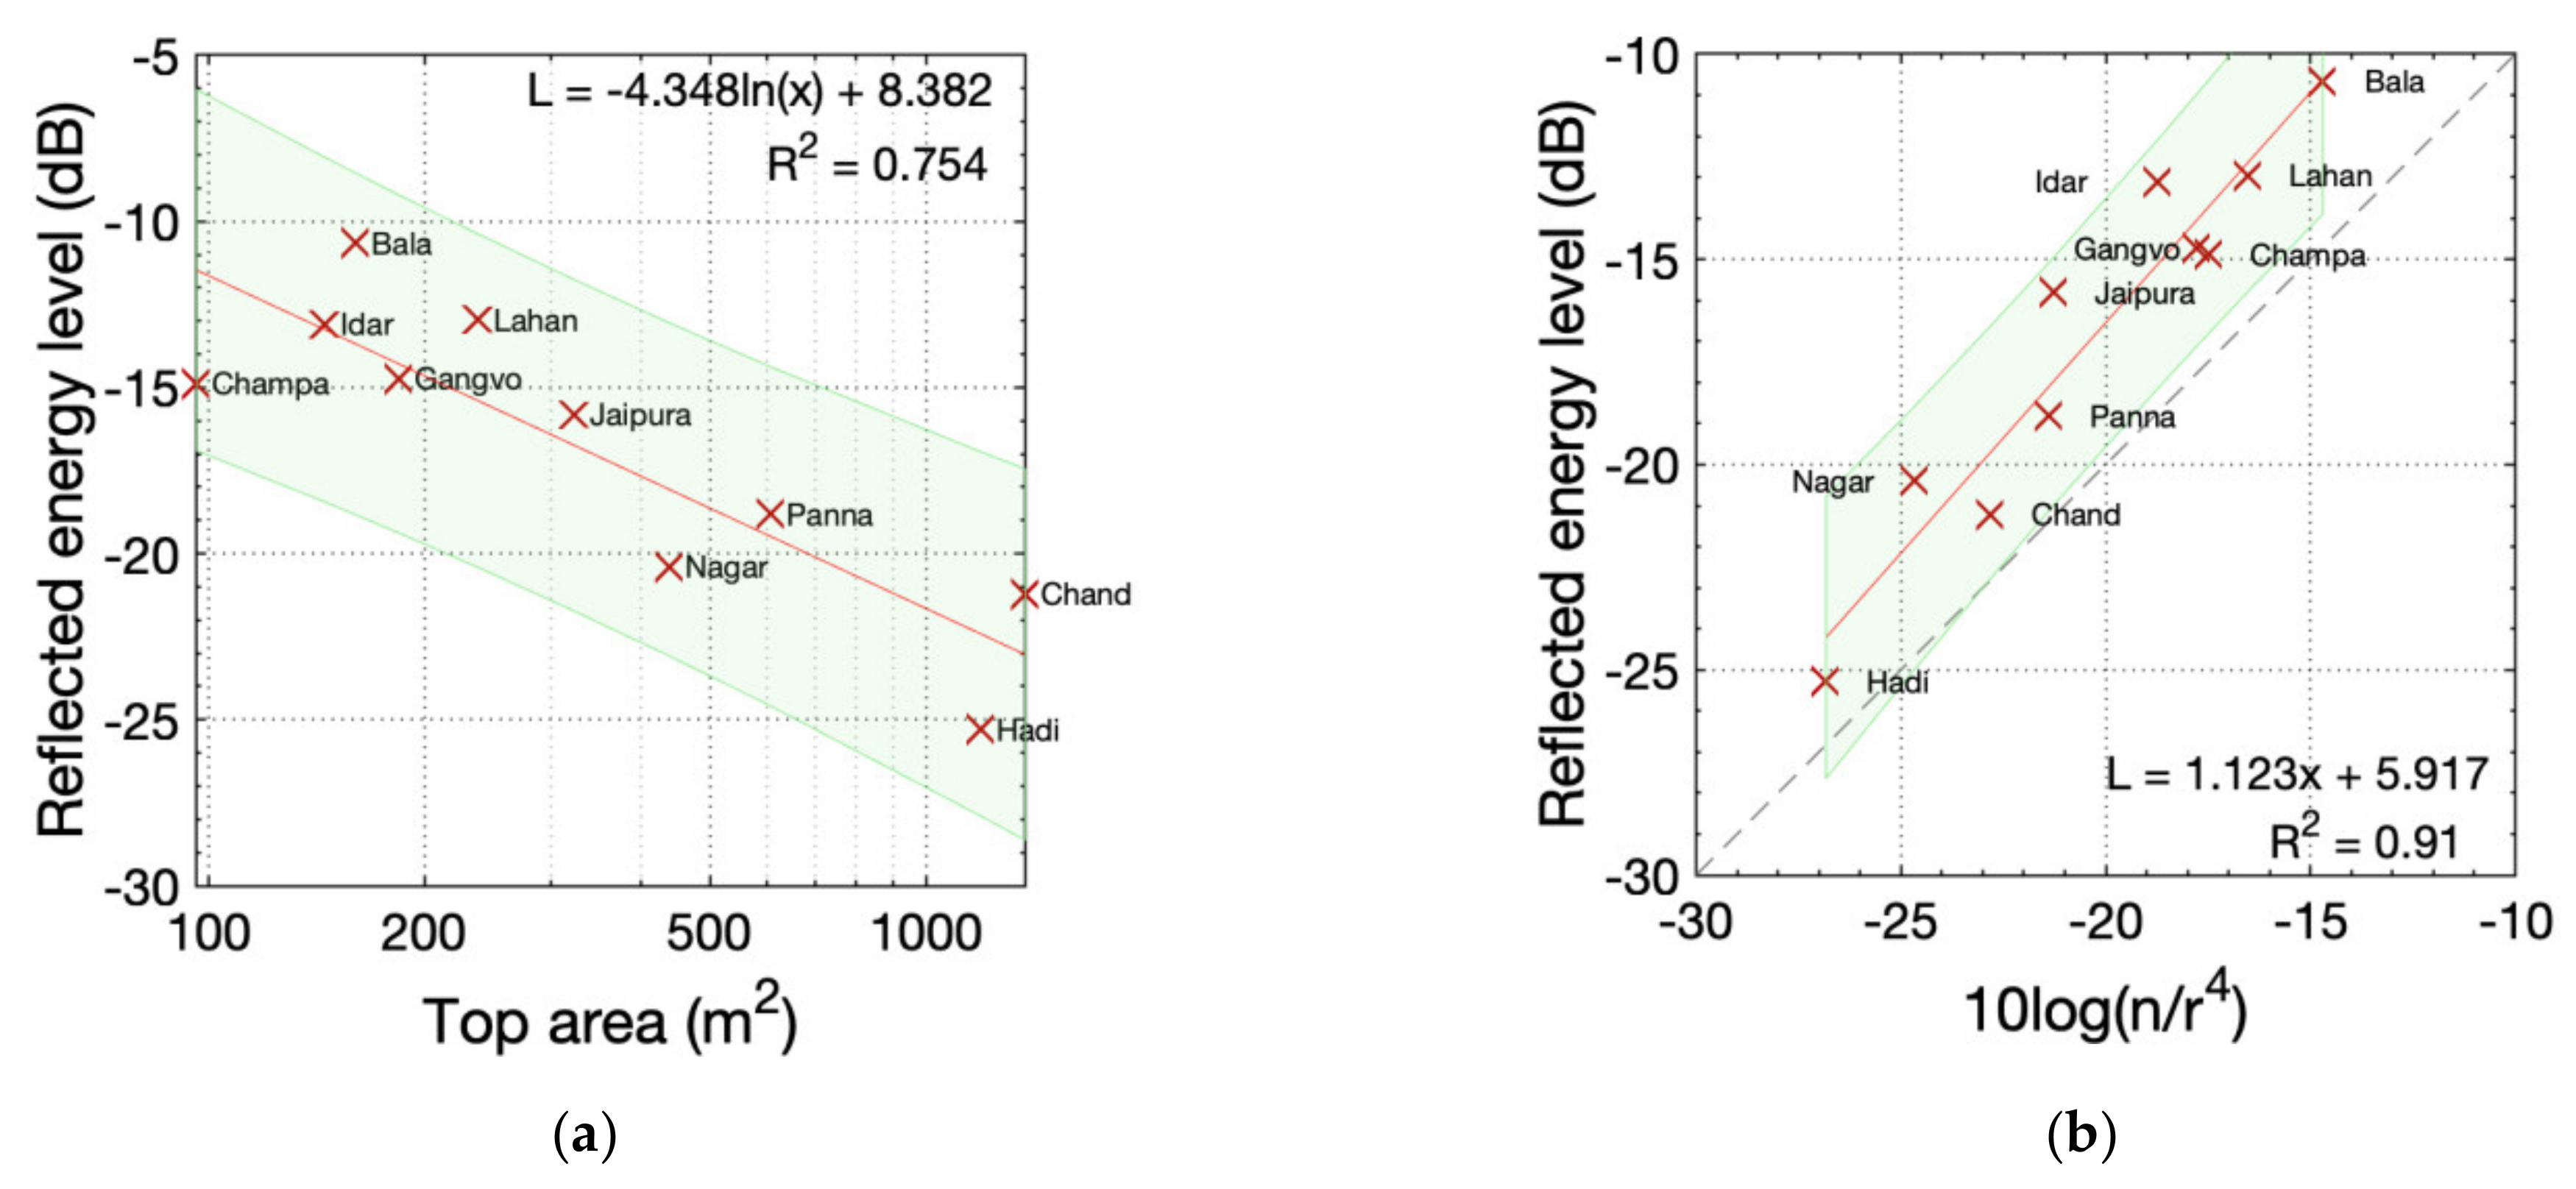
3.2.2. Equivalent Reflector Model Prediction

The results from Equation (2), evaluated as described in Section 2.2 (at a 10 Hz resolution, combined into octave bands), are shown in Figure 6. For Panna Meena ka Kund, the predicted reflected energy levels in the 4 kHz band are greater than the simulated results (Figure 5), which is not surprising considering that a partial model was used for the simulation, while a full model was used for evaluating Equation (2). At Position 1, the reflected energy levels increase due to in-phase summation from symmetry. Reflected energy levels in the low-frequency bands are much lower than the simulation results because the calculation only models first-order retroreflection from the trihedra and neglects all other reflections and reverberation. Bands tend to be spaced at about 6 dB intervals, indicating that diffraction loss is important, and that band frequencies are mostly below f R / 2 of most reflectors.
The calculated values for Lahan Vav are 3–6 dB less than the simulation results in the 4 kHz band but diverge more at lower frequencies. Again, the excessive loss at lower frequencies is expected because only first-order retroreflection is included in the calculation. The calculation does not include the ground reflection because it would obscure the much lower values in the lower-frequency bands. The band results are separated by about 6 dB, reflecting the fact that most bands are below f R / 2 .
This is illustrated directly in Figure 7, which plots the calculated values of f R / 2 for individual reflectors as a function of distance from the source. The large reflectors have low values and hence are expected to have little diffraction loss in the upper octave bands. The small reflectors have some values within or above the 4 kHz octave band at Lahan Vav Position 6, or entirely above the 4 kHz octave band at Lahan Vav Position 1 and at both illustrated positions at Panna Meena ka Kund. For a given distance and reflector size, values vary because of variation in incidence angles.
The 4 kHz band was chosen for further analysis because it is the band with the greatest retroreflection (both modelled and simulated). The energy contribution of individual reflectors is shown in Figure 8 as a function of distance for the two extreme positions in each stepwell, for the 4 kHz octave band only. This highlights the importance of proximity to retroreflectors. The combined effects of diffraction loss and geometric dispersion should yield an individual reflector spatial decay rate of −12 dB per distance doubling for f < f R / 2 , which is seen for the small reflectors. However, more distant reflectors of a given size can be more numerous, and thus their combined spatial decay rate should be less severe. When f > f R / 2 , the spatial decay rate is mainly affected by geometric dispersion (−6 dB per distance doubling)—hence the shallower slopes for the large reflectors. While there is a much smaller number of big reflectors than small reflectors, the big reflectors can make an out-sized contribution, as seen at Panna Meena ka Kund (evident in the cumulative distribution curves). On the other hand, at Lahan Vav, the small reflectors make a greater contribution than the big ones.
The half-energy (−3 dB) distances of the cumulative sums in the 4 kHz band are as follows: Panna Meena ka Kund, 18.2 m for P1 (312 reflections, out of 380) to 10.8 m for P8 (71 reflections, out of 399); Lahan Vav, 8.7 m for P1 (61 reflections, out of 142) to 5.0 m for P6 (20 reflections, out of 155). While the reported values of the half-energy distance are for the 4 kHz band, the half-energy distances are about the same in the other octave bands. For both stepwells, there is a monoclinal transition of the half-energy distance through the intermediate positions (not illustrated). For comparison, the mean distances to open trihedra are as follows: at Panna Meena ka Kund, 16.0 m for P1 and 15.8 m for P8; and at Lahan Vav, 9.3 m for both P1 and P6.

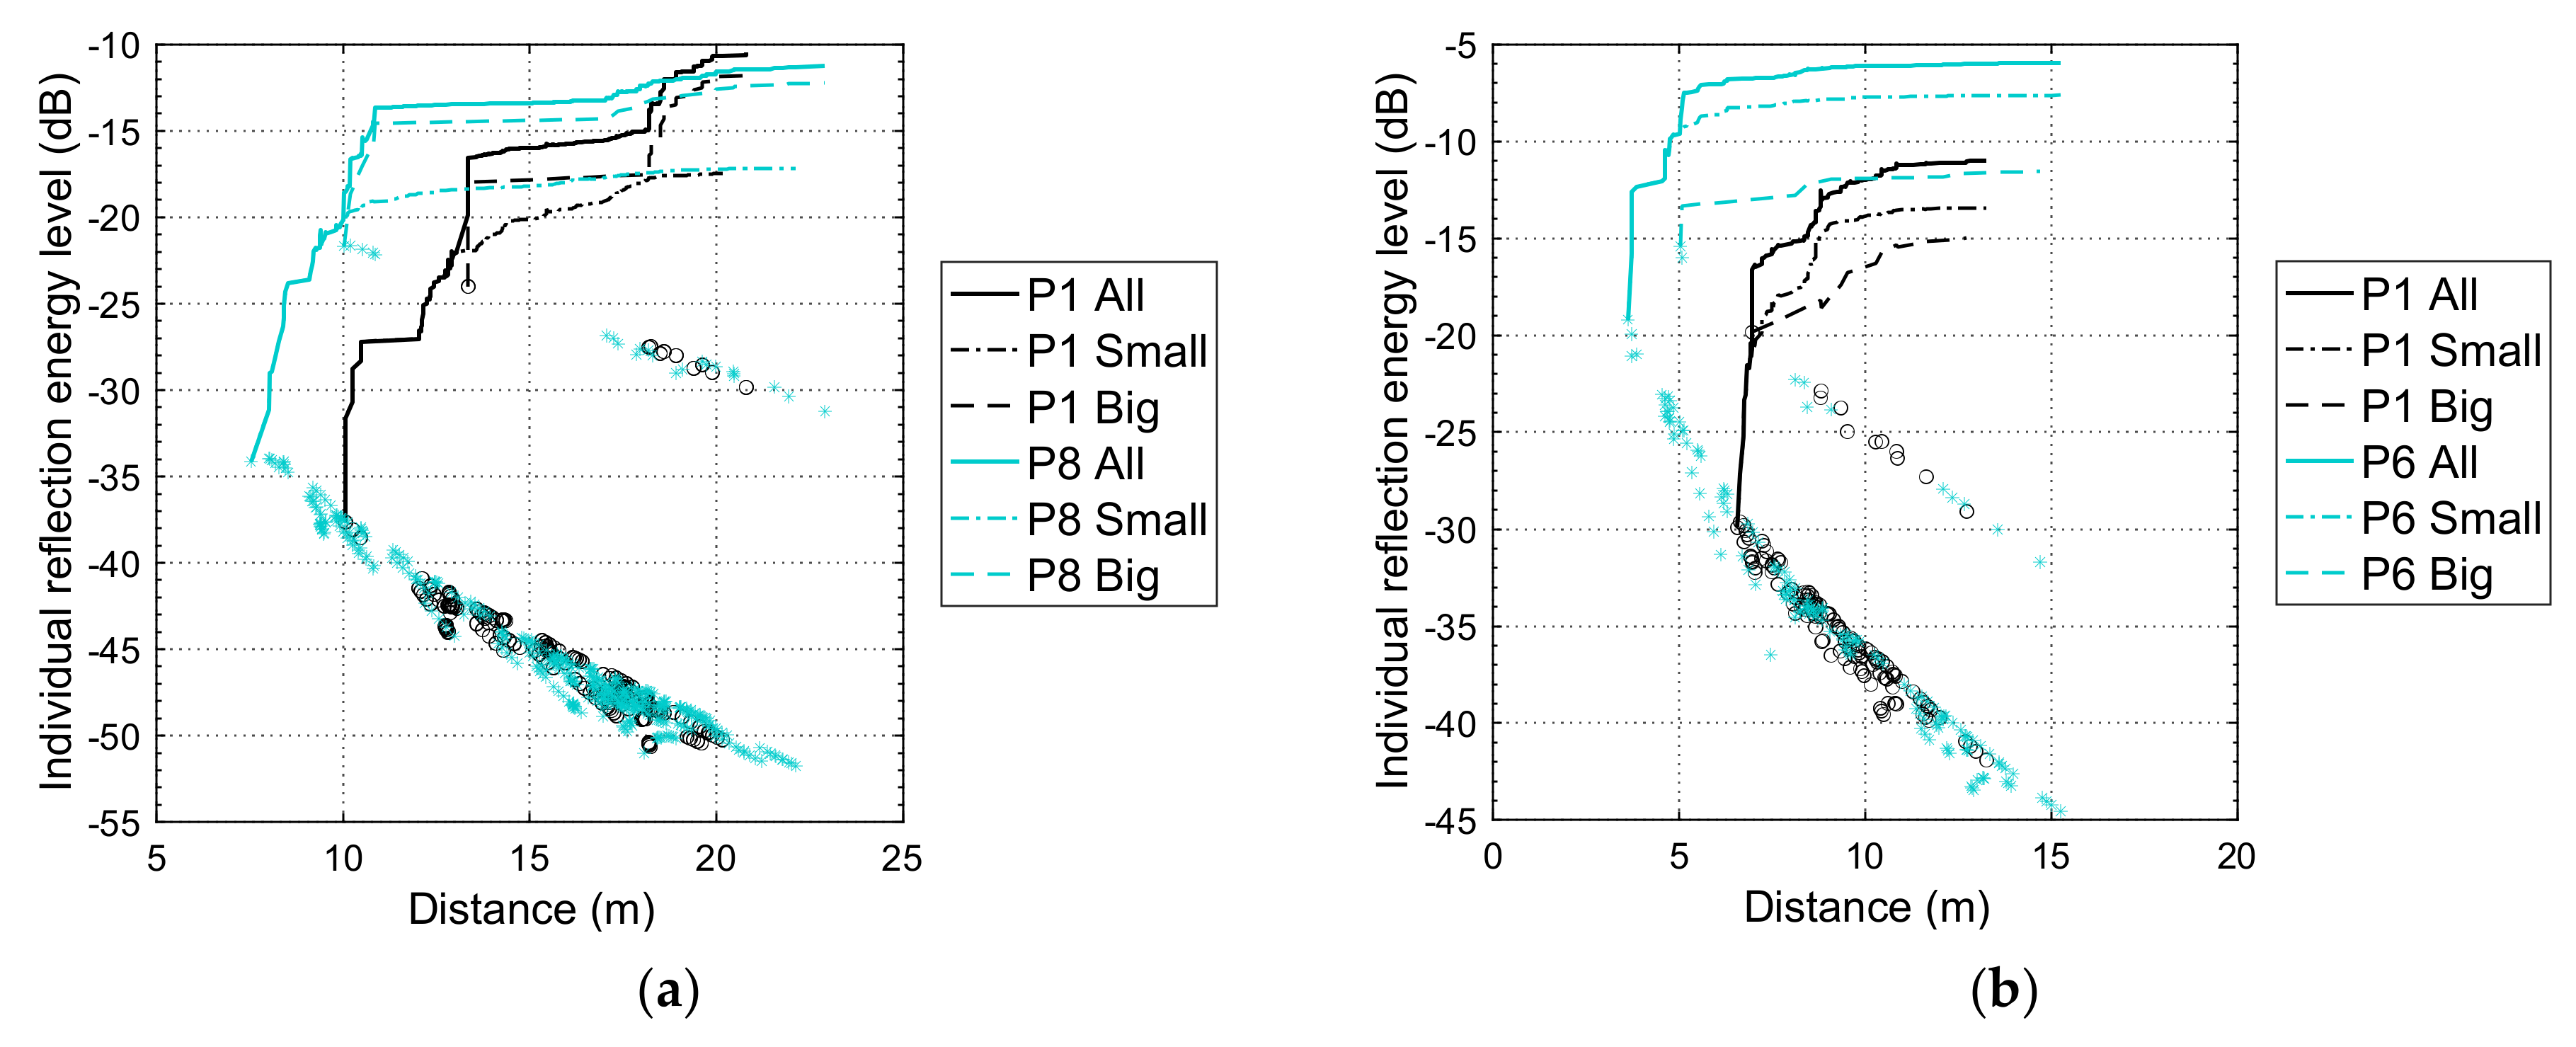
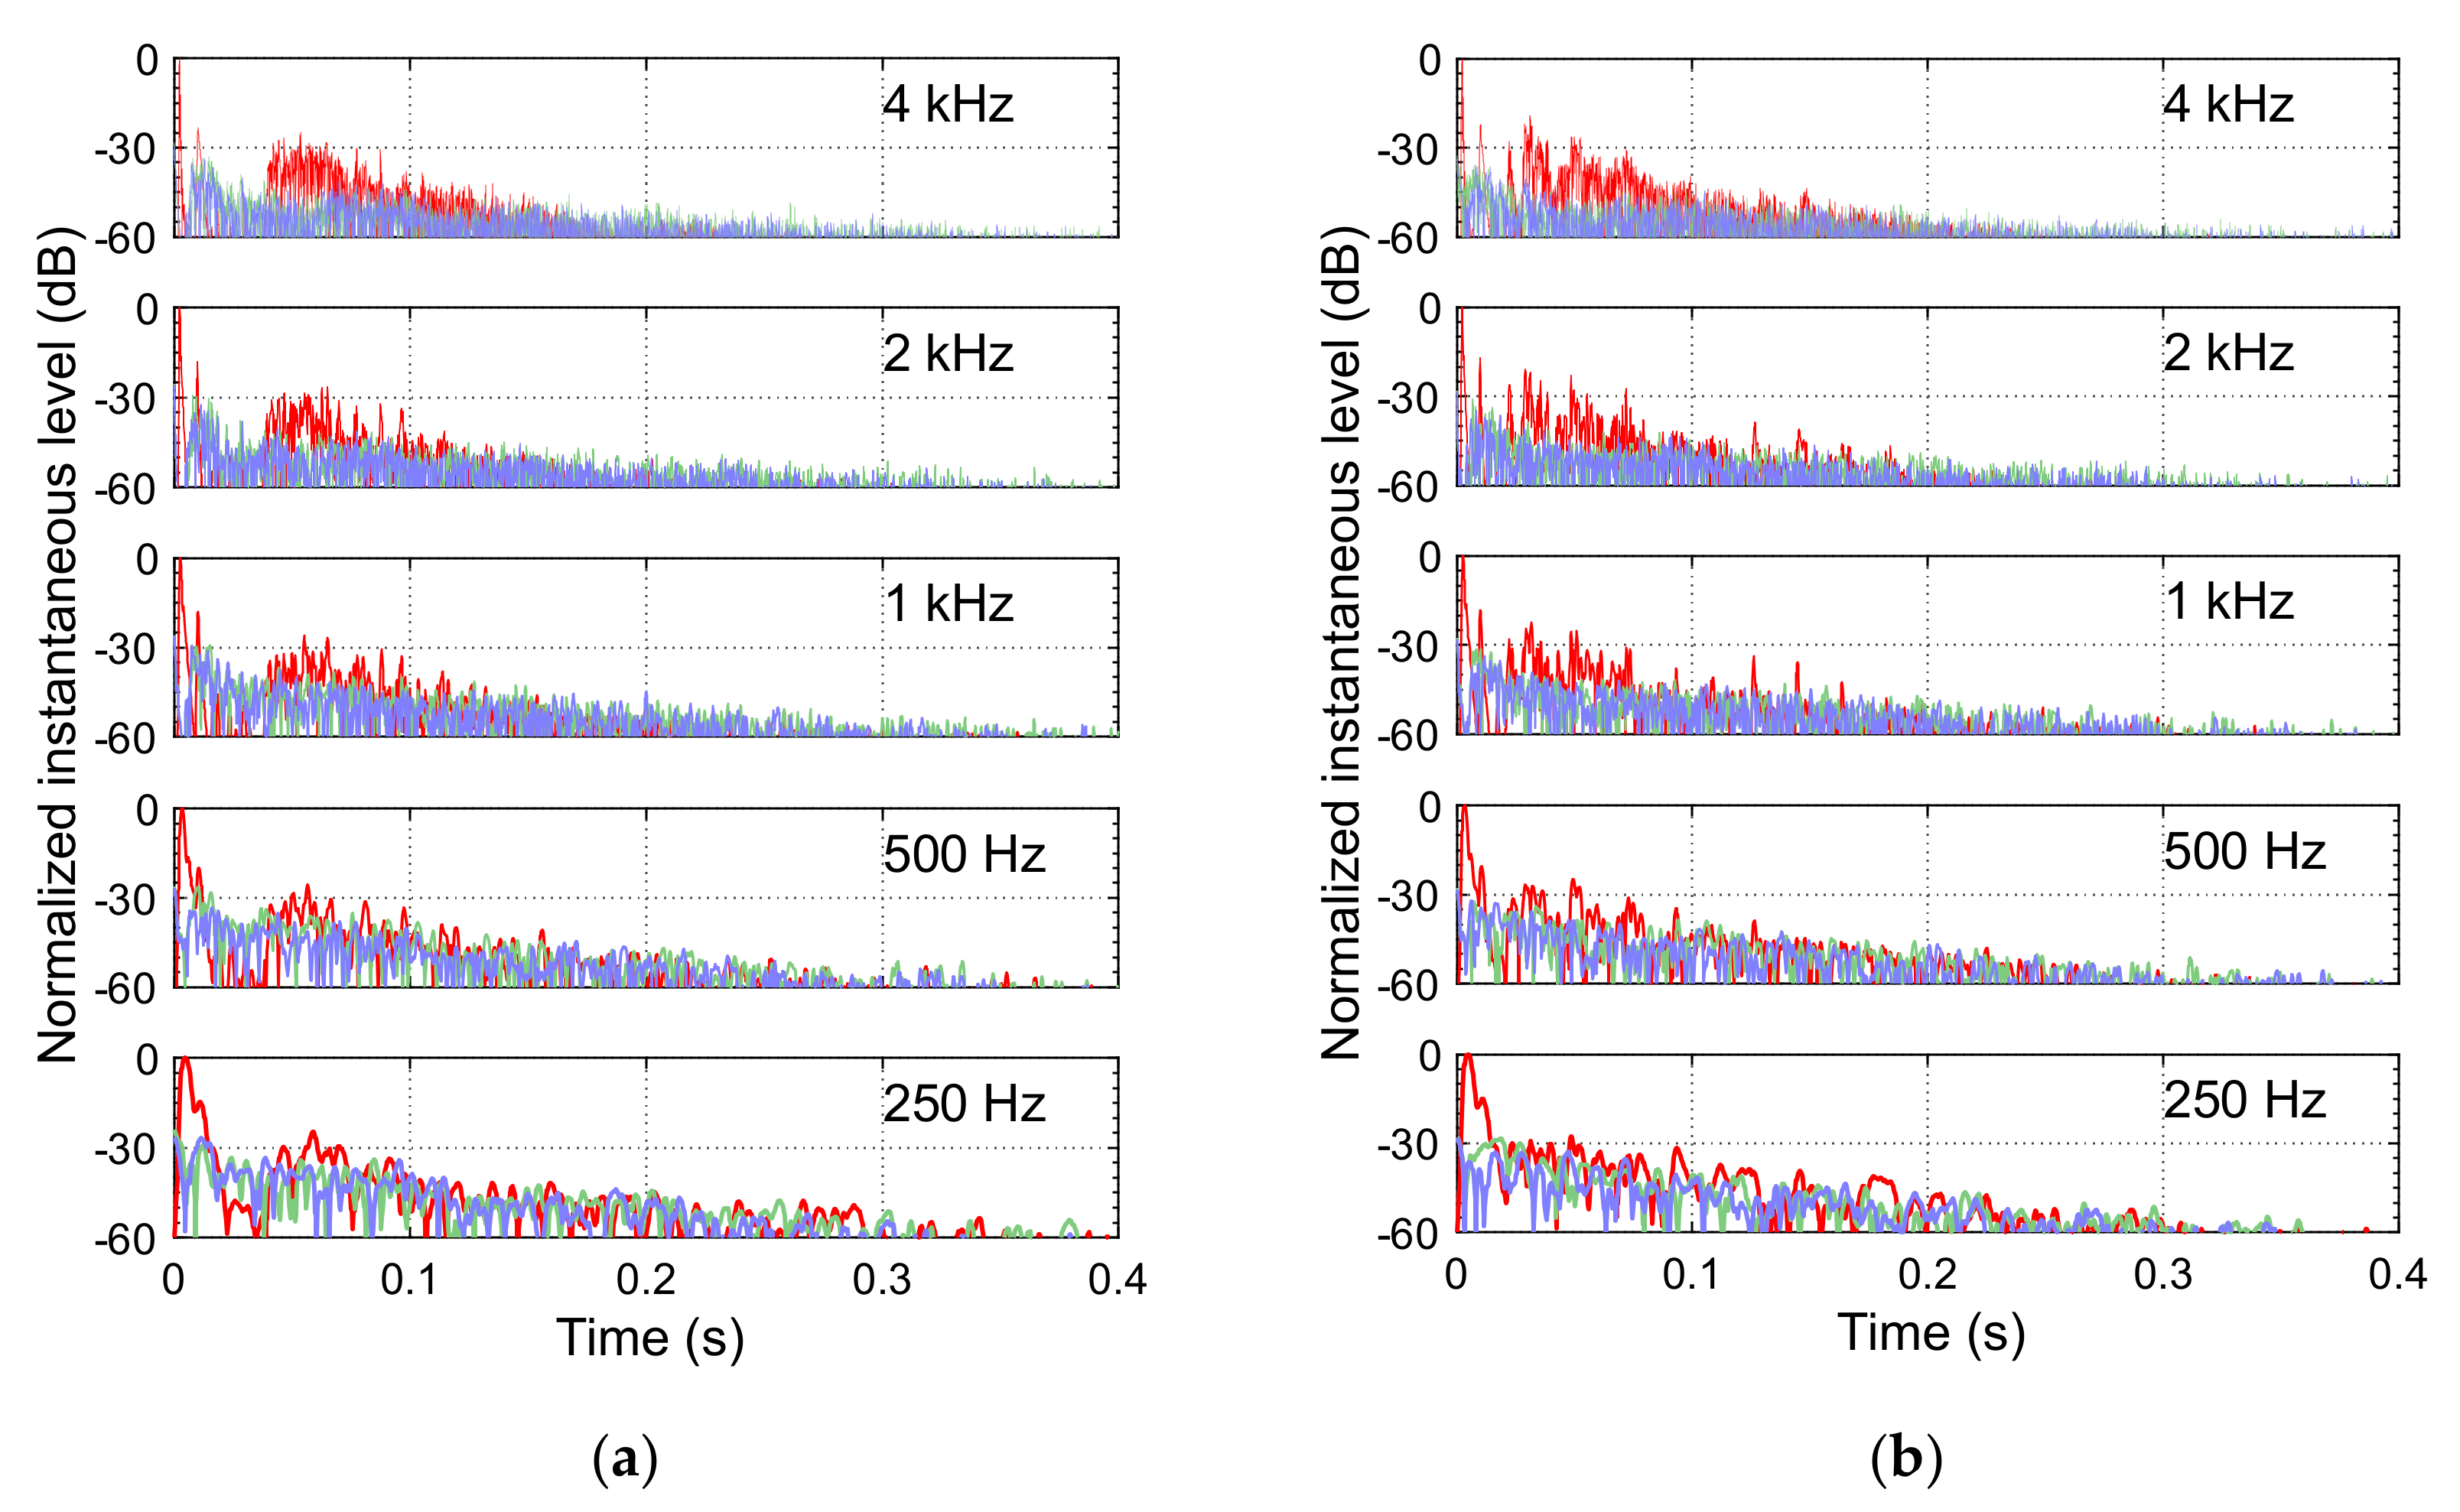
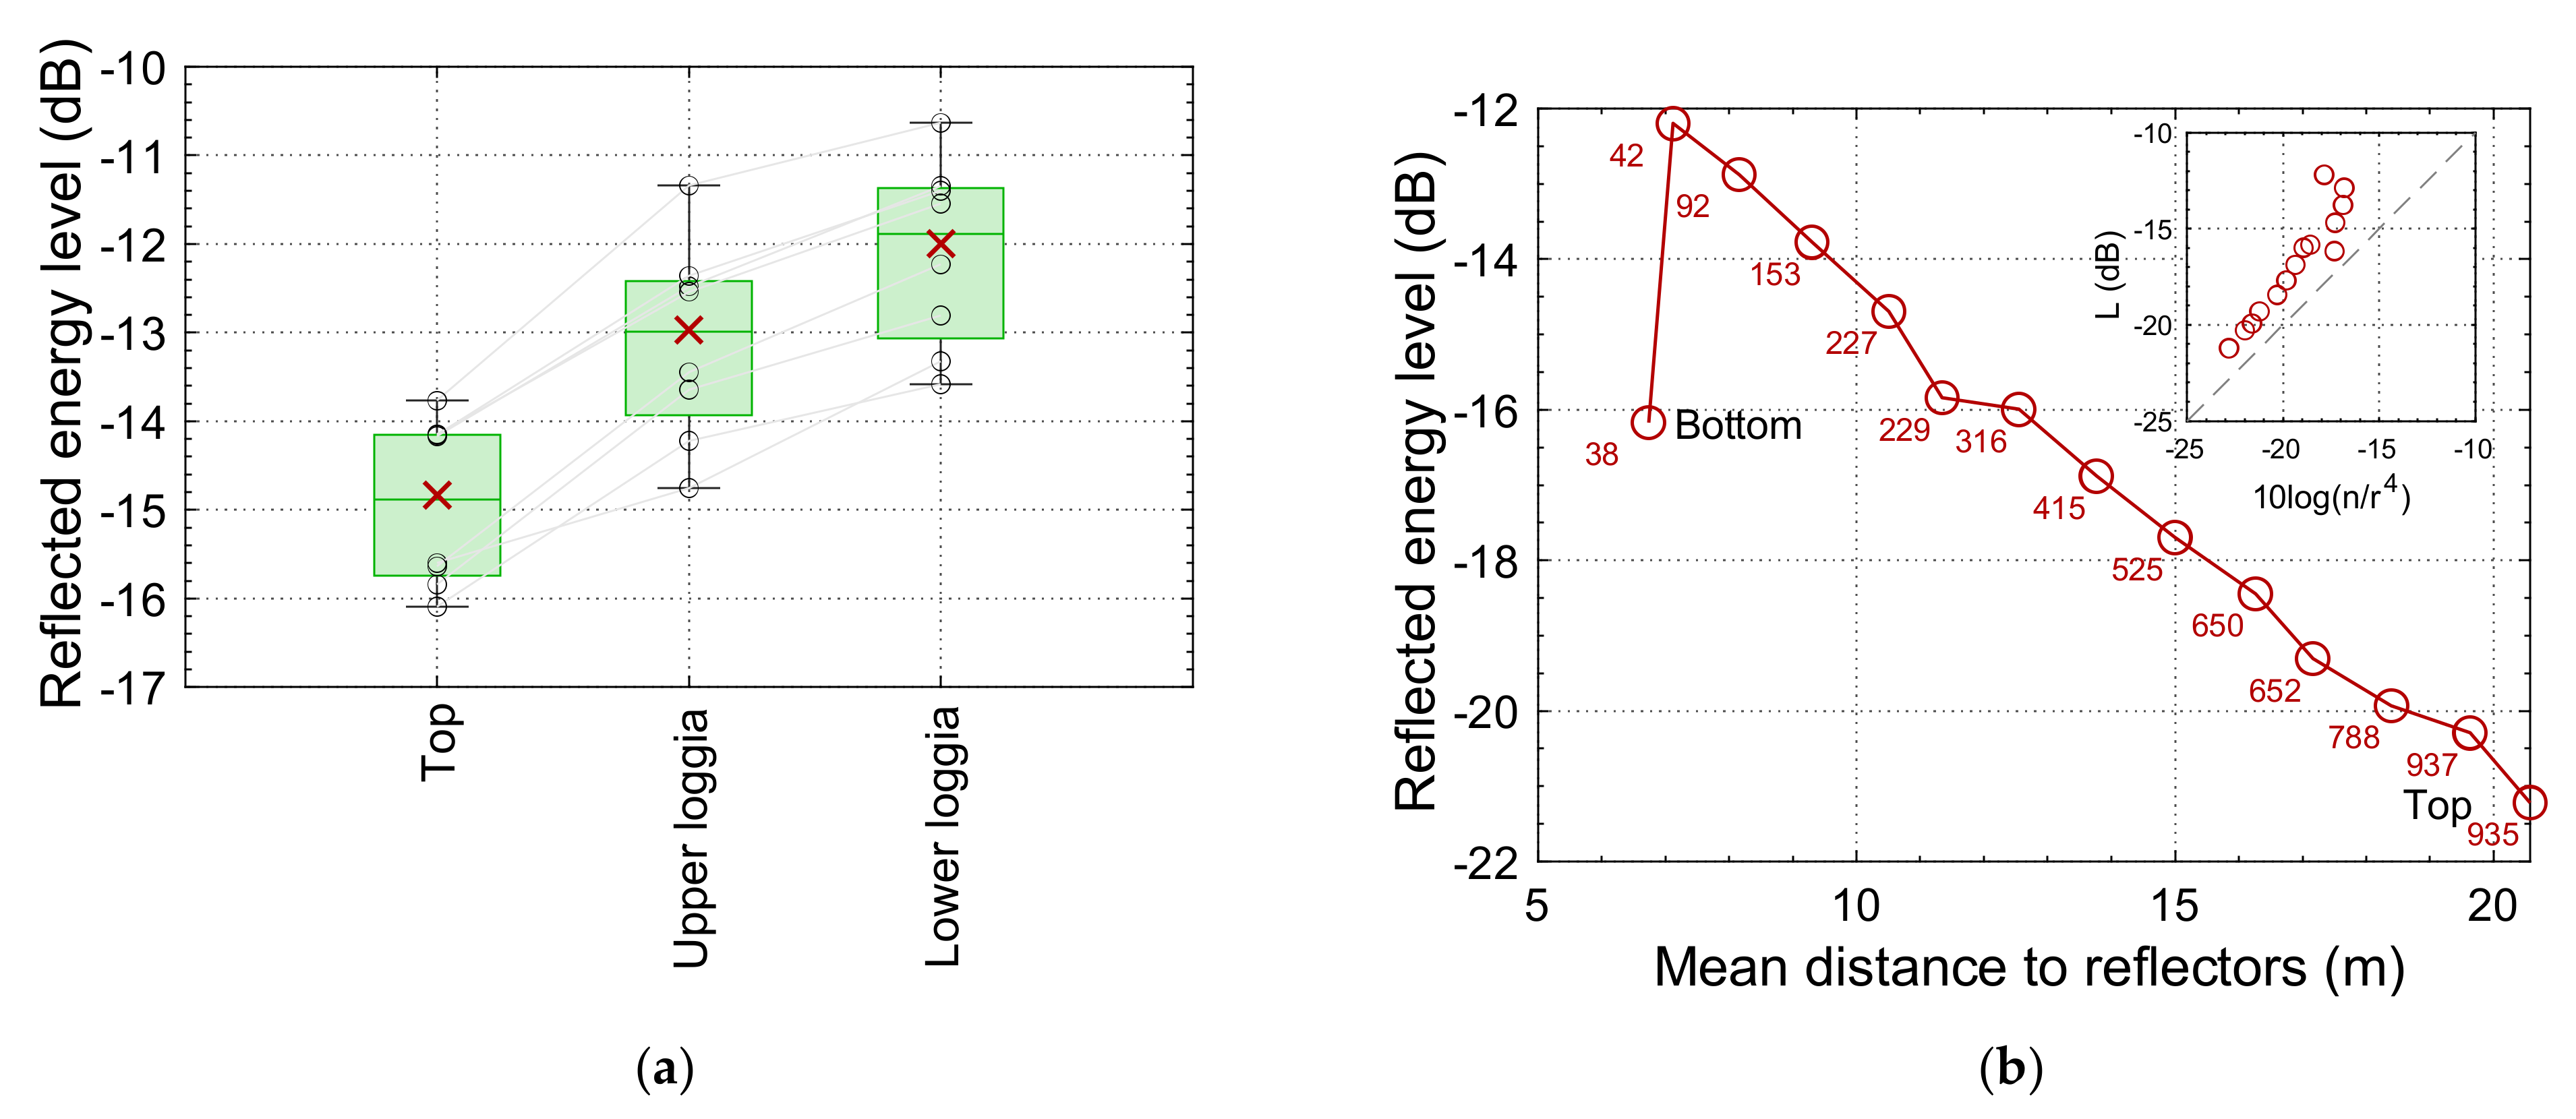
3.2.3. Temporal Characteristics of Impulse Responses at Lahan Vav

Being based on a partial model, the Panna Meena ka Kund simulation lacks many reflections and reverberant decay that would be seen in the full stepwell, and thus this section just focuses on Lahan Vav. Previous studies of retroreflective façades showed a prominent cluster of reflections due to retroreflection in measured and simulated impulse responses for collocated source–receivers. This is also seen at Lahan Vav (Figure 9). With the source at Position 1, the retroreflection cluster starts at 40 ms and is increasingly prominent with the frequency. With the source at Position 6, the retroreflection cluster starts at 22 ms. Based on geometry, the first-order reflections should be finished by 90 ms, and thus subsequent energy is from higher-order reflections (or reverberation). At Position 6, a persistent 19 ms flutter echo (unrelated to retroreflection) is evident, most obviously in the 1 kHz octave band. For comparison, the figure also shows impulse responses for receiver positions distant from the source—these distant positions lack the retroreflection cluster.

3.3. Sensitivity to Geometric Error

The models used for the main simulations were created from perfectly flat planes with exact right-angle corners. Real cases are not that simple, and hence the question arises as to whether retroreflection focusing remains when deviations from the ideal geometry are introduced. The trihedral step corners of the Panna Meena ka Kund and Lahan Vav models were manipulated to angles other than 90°. Simulations were run for the source at Position 1. The results (Figure 10) show the largest effect of angle deviation is at high frequencies, for which deviations from 90° reduce the reflected energy level at the source. In the 4 kHz octave band, the reduction at Panna Meena ka Kund is 2.7 dB for a ±10° deviation; at Lahan Vav, it is 1.6 dB. Reflected energy level reductions from angle deviations are not evident in the bands 1 kHz and below. Even with a ±10° deviation, the values of the reflected energy returned to the source are still much greater than for a flat-surfaced model (shown in the top rows of Figure 3 and Figure 4)—which for 4 kHz is −33.3 dB at Panna Meena ka Kund and −13.2 dB at Lahan Vav.
A more complete picture of the effect of angle deviation comes from examining the sound field across the whole receiver plane (Figure 11). As well as a reduction in the reflected energy around the source position, non-right-angled trihedra result in greater reflected energy at locations that receive relatively little in the corresponding right-angle trihedra model simulations. The effect of angle deviation is considerably greater for the Panna Meena ka Kund model than the Lahan Vav model. Lahan Vav has a maximum positive deviation of 2.5 dB (4 kHz band, 80°), whereas the maximum positive deviation for the Panna Meena ka Kund model is 6.6 dB (4 kHz band, 80°). The smaller changes at Lahan Vav are likely partly attributable to its semi-enclosed form (the Panna Meena ka Kund model being partial).

3.4. Effect of Temperature Gradient

It is frequently observed that the temperature at the base of a stepped pond may be less than the general temperature on a hot day. Reports of a 5 °C reduction are common, even if anecdotal. The authors are not aware of detailed data on this, but similar phenomena have been studied in basins and sinkholes, in which cool air pools at the base [32]. This introduces the possibility of acoustic refraction, as the speed of sound reduces deeper into the well. This should not necessarily degrade retroreflection, because reciprocity still applies (the path from the source to the reflector is the same as the path from the reflector to the source). Conceivably, this may increase the well’s acoustic effect by reducing the amount of sound lost to the sky.
A simulation was conducted using the Panna Meena ka Kund model, with a temperature gradient of 0.5 °C/m for a source at Position 1. The resulting sound returned to the source is essentially the same as the simulation without a temperature gradient. Deviations of the reflected energy level across the receiver plane were < 0.1 dB in all octave bands.

4. Discussion

4.1. The Retroreflective Potential of Stepped Ponds

Stepwells are designed for water access, not for acoustics; they are certainly not designed for optimum acoustic retroreflection. Yet, this study shows that stepped ponds can be good candidate cases of incidentally acoustically retroreflective rooms—at least when the water level is low. In this respect, stepped ponds are very distinctive acoustic environments, considering that predominantly retroreflective rooms are rarely seen in architecture. Steps are designed for people to ascend and descend, but fortuitously, the steps used in these and similar stepped ponds are larger than modern standard steps. Nevertheless, from an acoustics perspective, the steps are undersized for retroreflection, especially in larger stepped ponds such as Panna Meena ka Kund, which, at any vantage point, will have large distances to numerous step trihedral corners. This is indicated by the values of f R , which generally predict large diffraction loss over the important frequency range for humans. Conceivably, a stepped pond smaller than Lahan Vav (with shorter distances) should perform even better as a retroreflective environment for autophonic sound such as speech and clapping. As a guide, Figure 12 shows the calculated values of f R / 2 for steps of various sizes and distances from the source: for example, a somewhat impractical stepped pond with 0.5 m steps and most distances within 10 m would have diffraction loss mostly limited to frequencies below 4 kHz.
Given the above, it is remarkable that retroreflection is strongly evident in the spatial distribution of reflected energy in both stepwell models studied in the 4 kHz and 2 kHz bands and is even seen to a smaller extent at relatively low frequencies (e.g., 500 Hz). Based on Figure 12, the steps at Panna Meena ka Kund are too small for the distances involved. However, considering that the FDTD simulation of Panna Meena ka Kund only included two big trihedra, the simulation results show that the steps nonetheless function as an ensemble of weak retroreflectors.
In Appendix A, simplified models of ten stepped ponds are evaluated (based on the features of those listed in Table 1), suggesting that a smaller top area may be a good simple indicator of a stepped pond’s retroreflective potential. The size disadvantage of a large stepped pond may be overcome at a source position lower into the well, such as at a lower platform or loggia. At lower positions, the number of visible concave trihedra reduces, but this should be more than compensated for by the reduced distance to the remaining reflectors. This concept is developed in Appendix B, which shows an increase in retroreflected energy at lower source positions in models of large stepped ponds.

4.2. Considerations with Real Stepwells

Real stepwells are more complicated than the models used in this paper. Geometric deviations from the ideal modelled surfaces are inevitable and, in some cases, are likely too great for retroreflection. This might be an issue affecting the real Lahan Vav (chosen because of the availability of architectural drawings), which now has somewhat rough and irregular stones. Hence, the modelling and simulation of this case are a representation of the stepped pond’s original acoustics, but not necessarily of its present-day acoustics. The simulation study of sensitivity to geometric error indicates that perfect trihedra are not required for a stepped pond to be significantly retroreflective—with an angular error of 10° causing a focus loss less than 3 dB in the 4 kHz band, and less than 2 dB in the 2 kHz band (Panna Meena ka Kund), and smaller losses for the Lahan Vav simulations.
The simulations and modelling used in this study assume no sound absorption by the surfaces—all sound absorption is by the open space (which is anechoic). The smooth plaster and stone surfaces used in some stepped ponds would absorb little sound and thus would not be expected to be substantially different to the modelling. However, some stepped ponds have surfaces that are expected to absorb and scatter more (e.g., exposed rubble masonry).
Acoustic conditions at real stepwells differ from the models in other ways too. Wind and temperature may affect sound propagation. Based on the simulated case, a simple temperature gradient does not damage the retroreflective quality of a stepped pond. However, turbulent windy conditions would be expected to variably refract, and hence scatter, high frequencies, severely degrading retroreflection. Background noise affects the audibility of a room’s impulse response, including retroreflection. It is obvious that quiet and still conditions would be needed to experience retroreflection on site.
The findings in this study apply to stepped ponds that have about one step per square metre of top area. Generally, this requires that the pool area not be very extensive. Cases with a larger pool (e.g., Roda [22] p. 33) would be expected to have less retroreflection evident.

4.3. Audibility of Retroreflection

The most prominent features observed in this paper are in the 4 kHz octave band. While retroreflection focusing may be theoretically stronger at higher frequencies (e.g., 8–16 kHz bands), higher frequencies are of less interest because atmospheric propagation losses become significant, they are more sensitive to surface roughness and they are towards the upper limit of human sound production and hearing. Even the 4 kHz band is an unusually high frequency range to concentrate on. For people with noise-induced hearing loss, acuity in the 4 kHz band is typically reduced [33], which would limit their potential experience of retroreflective focusing.
The audibility of acoustically retroreflective architecture depends on the acoustic excitation, the retroreflected energy quantity and distributions over time and frequency, the background noise conditions and the listener’s interest in and attentiveness to sound. Experience with other retroreflective environments is varied. In some, handclaps are effective, even though a typical clap has an approximately pink power spectrum [34,35] (whereas a white or high-frequency-dominated spectrum would be preferable). Clapping is most likely to be effective when there is an audibly significant time delay for the retroreflection cluster arrival. Another autophonic excitation method that can make retroreflection obvious is the use of high-frequency phonemes or tongue clicks. The directionality of such excitation may help in suppressing the ground reflection and other unwanted reflections from surfaces near the person. When retroreflection is strong, it may be audible directly from one’s own speech, with the reflections giving an unusual ‘crisp’ quality to the sound [9]. Considering that the partial model of Panna Meena ka Kund yielded quite low reflected energy levels, the noticeability of retroreflection from the vantage points at that site needs further investigation. A positive indicator is that the first-order image-source calculation from equivalent reflectors for Panna Meena ka Kund yielded higher reflection levels because of the full stepped pond being included, with the high frequency values at Position 1 quite close to those for Lahan Vav’s Position 1. Furthermore, the relatively long time delays from the large distances at Panna Meena ka Kund favor audibility. The retroreflection at a stepped pond such as Lahan Vav, but with surfaces in good geometric condition, is expected to be audible considering that the reflected energy levels and distances are similar to those at the previously studied Ainsworth Building, where retroreflection is directly audible [8]. The presence of room reverberation is a difference between the stepped ponds and the previously studied retroreflective building façades.

4.4. Future Study

On-site acoustic measurements for this project have been delayed due to COVID-19 disruption. Future study incorporating in situ measurements (similar to [8]) will be conducted when possible.

5. Conclusions

From an acoustics perspective, the broad research problem addressed by this paper was to find and characterise pre-existing instances of predominantly retroreflective rooms—and it has shown that some Indian stepwells are good candidates for this. While many types of buildings have concave trihedral corners, the stepped pond type of stepwell sometimes takes this to an extreme. As demonstrated in this paper, these sometimes ancient buildings potentially provide intense instances of acoustically retroreflective room acoustics, albeit with an open-sky ceiling in the exemplar cases. With the ravages of time, some sites will have lost their original acoustic characteristics, but wave-based computational acoustics allows their acoustic restoration for analysis. Other sites appear to be sufficiently well preserved to retain their retroreflective characteristics, which should be observable in good environmental conditions to an attuned visitor.
The main findings are as follows:
  • Acoustic retroreflection in stepped ponds can be substantial in the high-frequency range, resulting in reflected sound focusing onto the source position—which is seen as a dense cluster of high-frequency reflections in the early part of the impulse response;
  • Both small trihedral corners (from steps) and large trihedral corners (from wall intersections at each level) contribute to retroreflection, with the balance of them depending on the scale of the stepped pond;
  • Retroreflection is not reduced greatly with angular distortion of trihedra of up to 10°;
  • Smaller stepped ponds tend to be more retroreflective, because the effect of shorter distances is stronger than the effect of the smaller number of reflectors; however, lower positions in a large stepped pond see increased retroreflection.
Overall, the acoustic result of the stepped pond form is distinctively bright and strong reflections to the source position, while positions away from the source receive much less sound from early reflections, especially at high frequencies.

Author Contributions

Conceptualisation, D.C. and M.Y.; methodology, D.C., S.L. and J.H.; software, J.H. and S.L.; formal analysis, D.C., S.L. and J.H.; writing—original draft preparation, D.C.; writing—review and editing, D.C., S.L., J.H. and M.Y.; visualisation, D.C., S.L. and J.H.; funding acquisition, D.C., S.L., J.H. and M.Y. All authors have read and agreed to the published version of the manuscript.

Funding

Fieldwork for this research was funded by the Australian Acoustical Society via its Education Grant scheme. However, the fieldwork is yet to be conducted due to COVID-19 disruption.

Institutional Review Board Statement

Not applicable.

Informed Consent Statement

Not applicable.

Data Availability Statement

The data presented in this study are openly available in the Sydney eScholarship Repository, available online at: https://doi.org/10.25910/npyj-cq27 (accessed on 1 March 2022), item name: ‘Acoustic modelling and simulation of Indian stepwells: Panna Meena ka Kund and Lahan Vav’.

Acknowledgments

Photographs and permission to use them were provided by the American Institute of Indian Studies.

Conflicts of Interest

The authors declare no conflict of interest.

Appendix A

Appendix A.1. Simplified Model of Stepped Pond Retroreflection

A simplified generic model of stepped ponds was constructed to examine the relationship between acoustic retroreflection and architectural parameters. The model assumes that a stepped pond takes the form of an inverted frustrum, with one of its faces steeper or vertical. The other three faces are the stepped surfaces. The ten stepped ponds listed in Table 1 were represented using this simplified modelling approach. Some advantages of the approach are as follows: (i) stepped ponds with incomplete architectural data could be quickly modelled, considering that only plans are available for most cases; (ii) the modelling focuses on the general form without quirks of particular cases; and (iii) the reflector size can be held constant, allowing the effects of larger-scale architectural features to be seen more clearly.
While the exact locations of the steps might be hard to determine, they are numerous and fairly uniformly distributed over the surfaces, and thus, here, the steps are statistically modelled by evenly distributing small retroreflectors across the three ‘stepped’ frustum surfaces, with alternating boresight directions. The number of distributed retroreflectors equals the total number of steps (also derived from the plan, as per Table 1). Then, the visibility of the retroreflectors with respect to a particular source position is determined, and the distance and the incidence angle of each visible retroreflector are calculated. Using these data, the retroreflected energy contributed by each small retroreflector is calculated as per Section 2.2. Similarly, large retroreflectors are also included in the modelling, determined as four per stepwell level, at the four intersections of the stepped surfaces. Their visibility, distance and incidence angle are determined using the same method as the small retroreflectors to calculate their retroreflected energy.
The concept is illustrated in Figure A1. In the modelling reported here, the source–receiver position is placed at the centre of the front edge of the platform, 1.5 m above the ground, as with Position 1 in the Panna Meena ka Kund case (shown in Figure 2a). A trihedron edge length of 0.25 m was used for all small retroreflectors, and 0.7 m was used for big ones.
Figure A1. An example of the generic model. Green: small reflectors; blue: large reflectors; red dot: source position; grey: inverted frustum; yellow: platform. Two small reflectors connected with solid and dotted lines are examples of visible and obscured reflectors, respectively.
Acoustics 04 00014 g0a1
The key parameters used in the estimations, along with the estimated retroreflected energy, are provided in Table A1. Because the model is a general approximation rather than an exact replica of a given stepwell, reflections are summed energetically rather than using complex values. The energetic average of the 1–4 kHz octave bands is used as an indicator of the strength of the retroreflected sound returned to the source. On average, the 1–4 kHz value is 3.3 dB less than the 4 kHz octave band value in these cases (ranging from −2.9 dB for Bala Kund to −3.6 dB for Hadi Rani).
Table A1. Parameters used for simplified retroreflected energy level estimates based on the ten example stepped ponds from Table 1. Symbols: r is the distance of visible retroreflectors, θ is the incidence angle from the trihedron boresight and n is the number of visible reflectors. Subscripts: s denotes small reflectors, and b denotes big reflectors. ‘Levels’ is the number of levels in the well. The table also shows the estimated retroreflected energy level results for the cases (L) averaged over the 1–4 kHz octave bands. Note that the average values of the distance and incidence angle are provided here, but the underlying individual values are used in the estimations of retroreflected energy.
Name r ¯ s ( m ) θ ¯ s   n s Levels r ¯ b ( m ) θ ¯ b n b L (dB)
Bala Kund7.226.4°8647.921.5°10−10.7
Champa Bagh ka Kund7.224.5°4728.719.5°4−14.9
Chand Baori20.526.9°9051323.920.9°30−21.2
Gangvo Kund8.524.2°8439.614.5°6−14.7
Hadi Rani23.826.0°657726.421.7°16−25.3
Idar Stepped Pond9.627.2°109610.925.3°16−13.1
Jaipura Kund11.926.2°143613.224.4°14−15.8
Lahan Vav9.225.9°155510.117.4°12−12.9
Nagar Sagar Kund17.128.8°290719.926.2°16−20.4
Panna Meena ka Kund15.425.8°401818.220.0°18−18.8

Appendix A.2. Simplified Model Predictions

The modelling indicates that the simplified model of Bala Kund has the greatest prospects for retroreflection, followed by Lahan Vav and Idar Stepped Pond (Table A1). The large stepwell models have the weakest prospects, even though they have the greatest number of steps. The results span a wide range of retroreflective conditions and suggest that the Lahan Vav case chosen for detailed analysis represents relatively strong retroreflective conditions.
The physical parameters are mutually correlated—larger-area wells tend to have more steps, a greater depth, more levels, a larger pool, etc. In the following, the architectural parameters are used logarithmically, i.e., the natural logarithm of each parameter is used. This provides more evenly distributed values that have a better linear fit with the reflected sound energy level. Table A2 shows the correlation coefficients between parameters.
Table A2. Correlation matrix for the reflected energy level (L, in decibels) and the logarithm of the architectural parameters (top area, depth in steps, total number of steps, number of levels, pool area). The top right of the table shows pairwise linear correlation coefficients. The bottom left of the table shows p-values.
ParameterLTopDepthStepsLevelsPool
L −0.86−0.76−0.83−0.58−0.80
Top<0.01 0.730.990.850.80
Depth0.010.02 0.760.800.33
Steps<0.01<0.01<0.01 0.890.74
Levels0.07<0.01<0.01<0.01 0.44
Pool<0.01<0.010.340.010.20
The best single architectural predictor of the estimated retroreflective energy level is the stepwell top area. A linear fit of the logarithm of the top area is shown in Figure A2 (R2 0.754, p = 0.001, RMSE 2.4 dB). However, if we were to only consider the six smaller cases (top area 323   m 2 ), there would be no apparent relationship between the top area and estimated retroreflection. Alternatively, the smallest case (Champa Bagh ka Kund) might be considered an outlier, hinting that there might be a small area limit on the negatively sloped relationship between stepped pond size and retroreflection strength.
Figure A2. Estimated reflected energy level (1–4 kHz octave band mean, calculated as described in this appendix) from retroreflection in relation to the top area of the 10 stepped ponds from Table 1: (a) calculated values in relation to the top area of the stepped pond; (b) calculated values in relation to 10 log n / r ¯ 4 for visible reflectors. Regression lines and 95% confidence intervals are shown.
Acoustics 04 00014 g0a2
A further simplified way of understanding the results is that the expected reflected energy level should increase by 3 dB for doubling of the number of reflectors but decrease by up to 12 dB for doubling of the distance (accounting for geometric spreading and maximum diffraction loss). If the average distance is used as the single-number distance, then this is represented by 10 log n / r ¯ 4 , shown in Figure A2b. Although this very simple formulation is only designed to approximate the slope, it returns values not far from the 1–4 kHz reflected energy level values.

Appendix B

Appendix B.1. Retroreflection for Lower Positions in Large Stepped Ponds

While the results in the main paper, together with those in Appendix A, suggest that large stepped ponds have weak retroreflection, this finding applies to source positions at the top of the well. Another way of thinking about a large stepped pond is that it is a small stepped pond extended upwards (except that a larger well may have a larger pool). A source position lower into the well loses visibility of trihedral corners at upper levels, but the distances to the smaller number of visible trihedra should decrease. This trade-off is examined briefly in this appendix by varying the source–receiver height in two large stepped pond examples.
The first example is Panna Meena ka Kund, which was modelled as described in Section 2.2. The eight original source positions were lowered to be 1.5 m above the upper and lower loggias (height reduced by 4 m and 8.2 m, respectively). Note that the upper loggia’s arches are filled in in the present day, but here, we imagine that they are open. The mean numbers of visible concave trihedra on the three levels for the eight positions are: 385 (top level), 331 (upper loggia) and 180 (lower loggia). The mean distances of the visible trihedra are: 15.9 m (top level), 13.9 m (upper loggia) and 11.5 m (lower loggia).
The second example is a generic stepwell model (using the Appendix A method) based on the main features of Chand Baori. The real Chand Baori has a complicated building on its non-stepped face, but for this example, source–receiver positions are simply in a vertical line, with one per stepwell platform level (14 positions at 1.88 m intervals).

Appendix B.2. Results

The results for Panna Meena ka Kund (Figure A3a) are consistent with the hypothesis that lower positions in a large stepped pond have greater retroreflective potential. The mean reflected energy levels are −14.8 dB, −13.0 dB and −12.0 dB for the top level, upper loggia and lower loggia, respectively. Values at the two loggias are similar to those at Lahan Vav in Table A1, and only Bala Kund has a retroreflected energy level greater than that of the lower loggia.
Figure A3. Estimated retroreflected energy level (1–4 kHz octave band energy average) at various heights in the two examples: (a) Panna Meena ka Kund for various heights of a horizontal line of eight source–receiver positions (‘X’ markers show energy average); (b) generic stepwell model based on features of Chand Baori for one position per stepwell platform level, with results shown in relation to the mean distance to visible reflectors (each marker is labelled with the number of visible reflectors). The relationship between the reflected energy level and 10 log n / r ¯ 4 for visible reflectors is inset.
Acoustics 04 00014 g0a3
The results for the simplified Chand Baori calculation (Figure A3b) are also consistent with the hypothesis. Excluding the bottom position, there is a highly linear relationship between the height of the source position and the reflected energy level (r = −0.998), and between the mean distance to visible reflectors and the reflected energy level (r = −0.996). Furthermore, the number of visible reflectors is similarly negatively correlated with the reflected energy level (r = −0.980)—which, of course, is the opposite to what would be expected if all other factors were held constant. Overall, this demonstrates the importance of the distance to reflectors in determining the retroreflected energy level, consistent with the relationship 10 log n / r ¯ 4 , introduced in Appendix A (R2 of 0.88 for all datapoints, or R2 of 0.93 for datapoints excluding the bottom position).
The drop in reflected energy at the bottom position of the Chand Baori approximate model appears to be from the loss of access to big reflectors (six on the level above, two on the bottom level). The mean incidence angle also increases from 26.9° to 39.3° between the level above and the bottom level. The value at the second lowest position is again similar to that at the much smaller Lahan Vav in Table A1.

References

  1. Cox, T. The Sound Book: The Science of the Sonic Wonders of the World, 1st ed.; W.H. Norton & Company: New York, NY, USA, 2014. [Google Scholar]
  2. Lubman, D. Archaeological acoustic study of chirped echo from the Mayan pyramid at Chichén Itzá. J. Acoust. Soc. Am. 1998, 104, 1763. [Google Scholar] [CrossRef]
  3. Declercq, N.F.; Degrieck, J.; Briers, R.; Leroy, O. A theoretical study of special acoustic effects caused by the staircase of the El Castillo pyramid at the Maya ruins of Chichen-Itza in Mexico. J. Acoust. Soc. Am. 2004, 116, 3328–3335. [Google Scholar] [CrossRef] [PubMed]
  4. Declercq, N.F.; Dekeyser, C.S. Acoustic diffraction effects at the Hellenistic amphitheater of Epidaurus: Seat rows responsible for the marvelous acoustics. J. Acoust. Soc. Am. 2007, 121, 2011–2022. [Google Scholar] [CrossRef] [PubMed]
  5. Lokki, T.; Southern, A.; Siltanen, S.; Savioja, L. Acoustics of Epidaurus–studies with room acoustics modelling methods. Acta Acust. United Acust. 2013, 99, 40–47. [Google Scholar] [CrossRef] [Green Version]
  6. Crawford, F.S. Cube corner retroreflectors for sound waves. Am. J. Phys. 1991, 59, 176–177. [Google Scholar] [CrossRef]
  7. Cabrera, D.; Holmes, J.; Caldwell, H.; Yadav, M.; Gao, K. An unusual instance of acoustic retroreflection in architecture–Ports 1961 Shanghai flagship store façade. Appl. Acoust. 2018, 138, 133–146. [Google Scholar] [CrossRef]
  8. Cabrera, D.; Yadav, M.; Holmes, J.; Fong, O.; Caldwell, H. Incidental acoustic retroreflection from building façades: Three instances in Berkeley, Sydney and Hong Kong. Build. Environ. 2020, 172, 106733. [Google Scholar] [CrossRef]
  9. Cabrera, D.; Holmes, J.; Lu, S.; Rapp, M.; Yadav, M.; Hutchison, O. Voice support from acoustically retroreflective surfaces. In Proceedings of the Euronoise 2021, Madeira, Portugal, 25–27 October 2021. [Google Scholar]
  10. Currie, D.; Dell’Agnello, S.; Delle Monache, G. A lunar laser ranging retroreflector array for the 21st century. Acta Astronaut. 2011, 68, 667–680. [Google Scholar] [CrossRef]
  11. Barrett, H.H.; Jacobs, S.F. Retroreflective arrays as approximate phase conjugators. Opt. Lett. 1979, 4, 190–192. [Google Scholar] [CrossRef]
  12. Wang, T.; Wang, W.; Du, P.; Geng, D.; Kong, X.; Gong, M. Calculation of the light intensity distribution reflected by a planar corner-cube retroreflector array with the size of centimeter and above. Optik 2013, 124, 5307–5312. [Google Scholar] [CrossRef]
  13. Jacobs, S.F. Experiments with retrodirective arrays. Opt. Eng. 1982, 21, 212281. [Google Scholar] [CrossRef]
  14. Rindel, J.H. Attenuation of sound reflections due to diffraction. In Proceedings of the Nordic Acoustical Meeting, Aalborg, Denmark, 20–22 August 1986. [Google Scholar]
  15. Rapp, M.; Cabrera, D.; Yadav, M. Effect of voice support level and spectrum on conversational speech. J. Acoust. Soc. Am. 2021, 150, 2635–2646. [Google Scholar] [CrossRef] [PubMed]
  16. Caldwell, H.P. An Investigation into Ceiling Geometries for Acoustic Control: Spatial Configurations for Absorption and Retroreflection. Master’s Thesis, The University of Sydney, Sydney, Australia, 2019. Available online: http://hdl.handle.net/2123/20765 (accessed on 1 March 2022).
  17. Toyota, Y.; Komoda, M.; Beckmann, D.; Quiquerez, M.; Bergal, E. Concert Halls by Nagata Acoustics: Thirty Years of Acoustical Design for Music Venues and Vineyard-Style Auditoria, 1st ed.; Springer Nature: Cham, Switzerland, 2021. [Google Scholar]
  18. Tuominen, H.T.; Rämö, J.; Välimäki, V. Acoustic retroreflectors for music performance monitoring. In Proceedings of the Sound and Music Computing Conference, Stockholm, Sweden, 30 July–3 August 2013; KTH Royal Institute of Technology: Stockholm, Sweden, 2013; pp. 443–447. [Google Scholar]
  19. Jain-Neubauer, J. The Stepwells of Gujarat: In Art-Historical Perspective, 1st ed.; Abhinav: New Delhi, India, 1981. [Google Scholar]
  20. Gupta, D. Baolis of Bundi: The Ancient Stepwells, 1st ed.; INTACH: New Delhi, India, 2015. [Google Scholar]
  21. Jain-Neubauer, J. (Ed.) Water Design: Environment and Histories, 1st ed.; Marg Foundation: Mumbai, India, 2016. [Google Scholar]
  22. Livingston, M. Steps to Water: The Ancient Stepwells of India, 1st ed.; Princeton Architectural Press: New York, NY, USA, 2002. [Google Scholar]
  23. Lautman, V.; Gupta, D. The Vanishing Stepwells of India, 1st ed.; Merrell Publishers Ltd: London, UK, 2017. [Google Scholar]
  24. Bahadur, V.N. Stepwells of Rajasthan, 1st ed.; Shubhi Publications: Gurgaon, India, 2016. [Google Scholar]
  25. Center for Art and Archaeology. Virtual Museum of Images and Sounds. Available online: https://vmis.in (accessed on 10 January 2022).
  26. Earis, P. Atlas of Stepwells. Available online: https://stepwells.org/ (accessed on 10 January 2022).
  27. Botts, J.; Savioja, L. Effects of sources on time-domain finite difference models. J. Acoust. Soc. Am. 2014, 136, 242–247. [Google Scholar] [CrossRef] [PubMed]
  28. Chern, A. A reflectionless discrete perfectly matched layer. J. Comp. Phys. 2019, 381, 91–109. [Google Scholar] [CrossRef] [Green Version]
  29. Eckhardt, H.D. Simple model of corner reflector phenomena. Appl. Opt. 1971, 10, 1559–1566. [Google Scholar] [CrossRef]
  30. Li, S.; Tang, B.; Zhou, H. Calculation on diffraction aperture of cube corner retroreflector. Chin. Opt. Lett. 2008, 6, 833–836. [Google Scholar] [CrossRef]
  31. Doerry, A.W.; Brock, B.C. A better trihedral corner reflector for low grazing angles. Proc. SPIE 2012, 8361, 83611B. [Google Scholar] [CrossRef]
  32. Whiteman, C.D.; Eisenbach, S.; Pospichal, B.; Steinacker, R. Comparison of vertical soundings and sidewall air temperature measurements in a small Alpine basin. J. Appl. Meteorol. Climatol. 2004, 43, 1635–1647. [Google Scholar] [CrossRef]
  33. Le, T.N.; Straatman, L.V.; Lea, J.; Westerberg, B. Current insights in noise-induced hearing loss: A literature review of the underlying mechanism, pathophysiology, asymmetry, and management options. J. Otolaryngol. Head Neck Surg. 2017, 46, 41. [Google Scholar] [CrossRef]
  34. Fletcher, N.H. Shock waves and the sound of a hand-clap—A simple model. Acoust. Aust. 2013, 41, 165–168. [Google Scholar]
  35. Papadakis, N.M.; Stavroulakis, G.E. Handclap for Acoustic Measurements: Optimal Application and Limitations. Acoustics 2020, 2, 224–245. [Google Scholar] [CrossRef]
Figure 1. Photographs of the two stepped ponds used as exemplars in this paper: (a) Panna Meena ka Kund (also known as Panna Mia Kund and Panna Mian Kund); (b) Lahan Vav (also known as Lahini Vapi and Vasantgadh Stepped Pond). Source: American Institute of Indian Studies [25], used with permission.
Acoustics 04 00014 g001
Figure 2. Perspective views of the stepwell models: (a) the partial model of Panna Meena ka Kund, extended with the whole stepwell lightly traced; (b) full model of Lahan Vav. Source positions are indicated by red dots, which are 1.5 m above the platform. Sources are numbered from the one closest to the central plane of symmetry.
Acoustics 04 00014 g002
Figure 3. Spatial distribution of the octave-band reflected energy level for the Panna Meena ka Kund simulation over a horizontal plane of 18.1 m × 12.6 m for the eight source positions. The source position is on the right edge of each subplot, indicated by the marker on the right of the 4 kHz band subplots. Values are expressed relative to the emitted sound energy level at 1 m.
Acoustics 04 00014 g003
Figure 4. Spatial distribution of the octave-band reflected energy level for the Lahan Vav simulation over a horizontal plane of 18.8 m x 12.7 m for the six source positions. The source positions are evident from the maxima, especially in the 4 kHz band (the two towers are at the top of each subplot). Values are expressed relative to the emitted sound energy level at 1 m.
Acoustics 04 00014 g004
Figure 5. Reflected octave-band energy levels returned to the source position from FDTD simulation: (a) Panna Meena ka Kund (partial model, without ground reflection); (b) Lahan Vav (full model)—for which large markers include the ground reflection and small markers (dashed lines) exclude it. Values are expressed relative to the emitted free field energy at 1 m.
Acoustics 04 00014 g005
Figure 6. Retroreflected octave-band energy levels returned to the source position predicted by Equation (2): (a) Panna Meena ka Kund (full model); (b) Lahan Vav. Values are expressed relative to the emitted free field energy at 1 m.
Acoustics 04 00014 g006
Figure 7. Calculated values of f R / 2 based on Equation (1) for individual equivalent reflectors: (a) Panna Meena ka Kund (full model, Positions 1 and 8); (b) Lahan Vav (Positions 1 and 6).
Acoustics 04 00014 g007
Figure 8. Retroreflected octave-band energy levels (4 kHz octave band) returned to the source position of individual equivalent reflectors: (a) Panna Meena ka Kund (full model); (b) Lahan Vav. Markers show the individual reflection values; lines show the cumulative complex sum of reflections as a function of distance. Values are expressed relative to the emitted free field energy at 1 m. Note that all markers for Panna Meena ka Kund P1 are superimposed pairs from symmetry.
Acoustics 04 00014 g008
Figure 9. Lahan Vav octave-band impulse responses: (a) source at Position 1; (b) source at Position 6. The red line shows the impulse response for a receiver 0.5 m from the source; the blue and green lines show impulse responses for receivers about 10 m from the source. Arrivals are time-aligned, and levels are with respect to the red line’s direct sound peak. The visual display is simplified by taking the absolute value of the Hilbert transform.
Acoustics 04 00014 g009
Figure 10. Reflected energy level at the source position (P1 only) from FDTD simulations, for concave trihedral corner angles varied from 80° to 100°: (a) Panna Meena ka Kund (partial model, without ground reflection); (b) Lahan Vav (full model)—for which large markers include the ground reflection and small markers (dashed lines) exclude it. Values are expressed relative to the emitted free field energy at 1 m.
Acoustics 04 00014 g010
Figure 11. Change in reflected energy level over the horizontal receiver plane from trihedron angles other than 90°, with the source at Position 1: (a) Panna Meena ka Kund (partial model, without ground reflection); (b) Lahan Vav (full model). Subplots match the orientation of Figure 3 and Figure 4 (for a and b, respectively).
Acoustics 04 00014 g011
Figure 12. Evaluation of f R / 2 values using Equation (1) for the boresight shadow of square trihedra of various sizes (x-axis) at various distances (lines). Edge lengths of small and large trihedra used for modelling Panna Meena ka Kund and Lahan Vav are shown.
Acoustics 04 00014 g012
Table 1. Ten examples of stepped ponds that follow the form described, with architectural drawing sources cited. Some have alternative names, and in such cases, the name in the table is taken from a recent source, such as [23]. The top plan area is of the basic well opening, excluding surrounds. The number of steps only counts those in the main surfaces, quantified as the number of discrete horizontal walking surfaces.
Name (Location)Top (m2)Pool (m2)DepthSteps
Bala Kund (Bundi) [20] (p. 83)160730 steps179
Champa Bagh ka Kund (Bundi) [20] (p. 87)961428 steps91
Chand Baori (Abhaneri) [22] (p. 41)13765324.5 m, 91 steps1803
Gangvo Kund (Dedadara) [22] (p. 37)1843220 steps170
Hadi Rani (Todaraisingh) [22] (p. 120)119415085 steps1300
Idar Stepped Pond [22] (p. 42)145712.5 m, 61 steps206
Jaipura Kund (Bundi) [20] (p. 86)3232149 steps280
Lahan Vav (Basantgarh) [22] (p. 6)237216.75 m, 25 steps300
Nagar Sagar Kund 1 (Bundi) [20] (p. 84)43915103 steps554
Panna Meena ka Kund (Amer) [22] (p. 110)6088414.25 m, 56 steps798
1 Nagar and Sagar are twin stepped ponds in close proximity.
Publisher’s Note: MDPI stays neutral with regard to jurisdictional claims in published maps and institutional affiliations.

