Article

Use of Ultrasound Microscopy for Ex Vivo Analysis of Acoustic Impedance in Mouse Liver with Steatohepatitis

1
Department of Pediatrics, Jichi Medical University, 3311-1 Yakushiji, Shimotsuke, Tochigi 329-0498, Japan
2
Honda Electronics Co., Ltd., 20 Koyamazuka, Oiwa-cho, Toyohashi, Aichi 441-3193, Japan
3
Department of Environmental and Life Sciences, Toyohashi University of Technology, Hibarigaoka-1-1 Tenpakucho, Toyohashi, Aichi 441-8580, Japan
4
Hirota Surgical Pathology Institute Inc., 3-6-5 Idaimae, Shimotsuke, Tochigi 329-0403, Japan
*
Author to whom correspondence should be addressed.
Acoustics 2021, 3(1), 3-10; https://doi.org/10.3390/acoustics3010002
Submission received: 30 November 2020 / Revised: 17 December 2020 / Accepted: 22 December 2020 / Published: 24 December 2020
(This article belongs to the Special Issue Acoustics in Biomedical Engineering)

Abstract

:
Scanning acoustic microscopy reveals information on histology and acoustic impedance through tissues. The objective of the present study was to investigate whether acoustic impedance values in the liver over time reflect the progression of steatohepatitis through different grades and stages, and whether this approach can visualize histologic features of the disease. Mice were divided into two groups: a control group and a steatohepatitis group prepared by keeping the mice on a methionine and choline-deficient diet for 56 weeks. The hepatic lobe was excised for measurement of impedance and observation of microscopic structure using a commercially available scanning acoustic microscopy system with a central frequency of 320 MHz. Scanning acoustic microscopy revealed that acoustic impedance through liver tissue with steatohepatitis temporarily decreased with the degree of fat deposition and then increased in parallel with the progression of inflammation and fibrosis. However, the acoustic images obtained did not allow discrimination of detailed microstructures from those seen using light microscopy. In conclusion, estimation of acoustic impedance appears to have potential clinical applications, such as for monitoring or follow-up studies.

1. Introduction

Scanning acoustic microscopy (SAM) uses ultrasound at a frequency of 100 MHz or higher for capturing images of cells on a slide by plotting data related to the specimen’s thickness and acoustic properties without staining [1]. Studies of the acoustic properties of biological tissues at high frequencies have recently yielded high-resolution quantitative images, allowing even single cells to be identified in clinical cytology samples [2]. Therefore, it has been suggested that clinical use of ultrasound microscopy could have considerable potential as an aid for the diagnosis or evaluation of various diseases. So far, SAM has been used to investigate the acoustic properties of many organs and disease states, such as cardiovascular disease [3], renal disease [4], and orthopedic disorders [5]. Accumulation of knowledge about the relationship between each disease and its ultrasound microscopic features are considered important.
Nonalcoholic fatty liver disease (NAFLD), due to fat accumulation in the liver, is classified as either nonalcoholic fatty liver (NAFL) or nonalcoholic steatohepatitis (NASH) on the basis of histology. Due to its increased incidence worldwide, NAFLD is considered one of the most prevalent forms of chronic liver disease [6]. NAFL is considered a relatively benign clinical condition, whereas NASH has the potential for future hepatic compensation, which may require liver transplantation. Thus, early diagnosis of NASH and differentiation of NAFL from NASH are essential for the selection of appropriate treatment and medical follow-up. Although MRI is considered to be the most accurate noninvasive imaging modality for the diagnosis of hepatic steatosis [7], it is costly, has several contraindications, and is not universally available. In this context, ultrasound could be used as an alternative [8]. However, ultrasonic imaging for evaluation of NAFLD is highly subjective and has poor sensitivity for liver steatosis, requiring a minimum fat content of 30% [9,10]. Although methods for the diagnosis of fibrosis have been developed (FibroTest, elastography, etc.), it is still difficult to differentiate the early stage of fibrosis because the change in liver tissue from one stage to another is very subtle [11]. Thus, histopathological evaluation by liver biopsy is still the gold standard for diagnosis of NASH based on the degree of fat accumulation, the level of inflammation, and the extent of fibrosis in the liver. However, liver biopsy has several disadvantages, including a risk of serious complications, sampling error, and variability in histologic evaluation among pathologists [12,13,14]. Therefore, it is challenging to differentiate the early stages of NASH, and there is a need to develop noninvasive, repeatable, and accurate techniques for quantitative evaluation of hepatic steatohepatitis. For instance, if a device using the principle of ultrasound microscopy were to be developed, pathohistological findings and acoustic properties would be obtained simultaneously in a few minutes by SAM without any need for liver tissue sampling or special staining.
The objectives of the present study using mice were (1) to assess over time the acoustic impedance in liver tissues in relation to the progression of steatohepatitis of different grades and stages and (2) to evaluate images of liver tissues with steatohepatitis based on acoustic intensity. The findings were then correlated with those of pathologic analysis of the liver specimens the author studied.

2. Materials and Methods

2.1. Animals

Animal experiments were carried out humanely after receiving approval from the Institutional Animal Experiment Committee of Jichi Medical University (No. 17-062), and in accordance with the Institutional Guidelines for Proper Conduct of Animal Experiments and Related Activities in Academic Research Institutions under the jurisdiction of the Ministry of Education, Culture, Sports, Science, and Technology of Japan.
C57BL/6 mice aged 5 weeks were obtained from Charles River Laboratories (Yokohama, Japan). Twelve mice were fed a methionine and choline-deficient diet (MCD, EPS Ekishin Co. Ltd., Tokyo, Japan) for 56 weeks. This type of MCD diet induces steatosis through impairment of VLDL secretion due to a lack of phosphatidylcholine synthesis [15]. Ten controls were fed standard chow (CE-2, Clea Japan, Tokyo, Japan). The animals were housed in standard stainless-steel cages at room temperature and normal humidity with a diurnal 12 h light cycle and provided water ad libitum. At 2, 5, 9, 14, 24, and 56 weeks after the start of diet feeding, mice were euthanatized and their livers were removed.

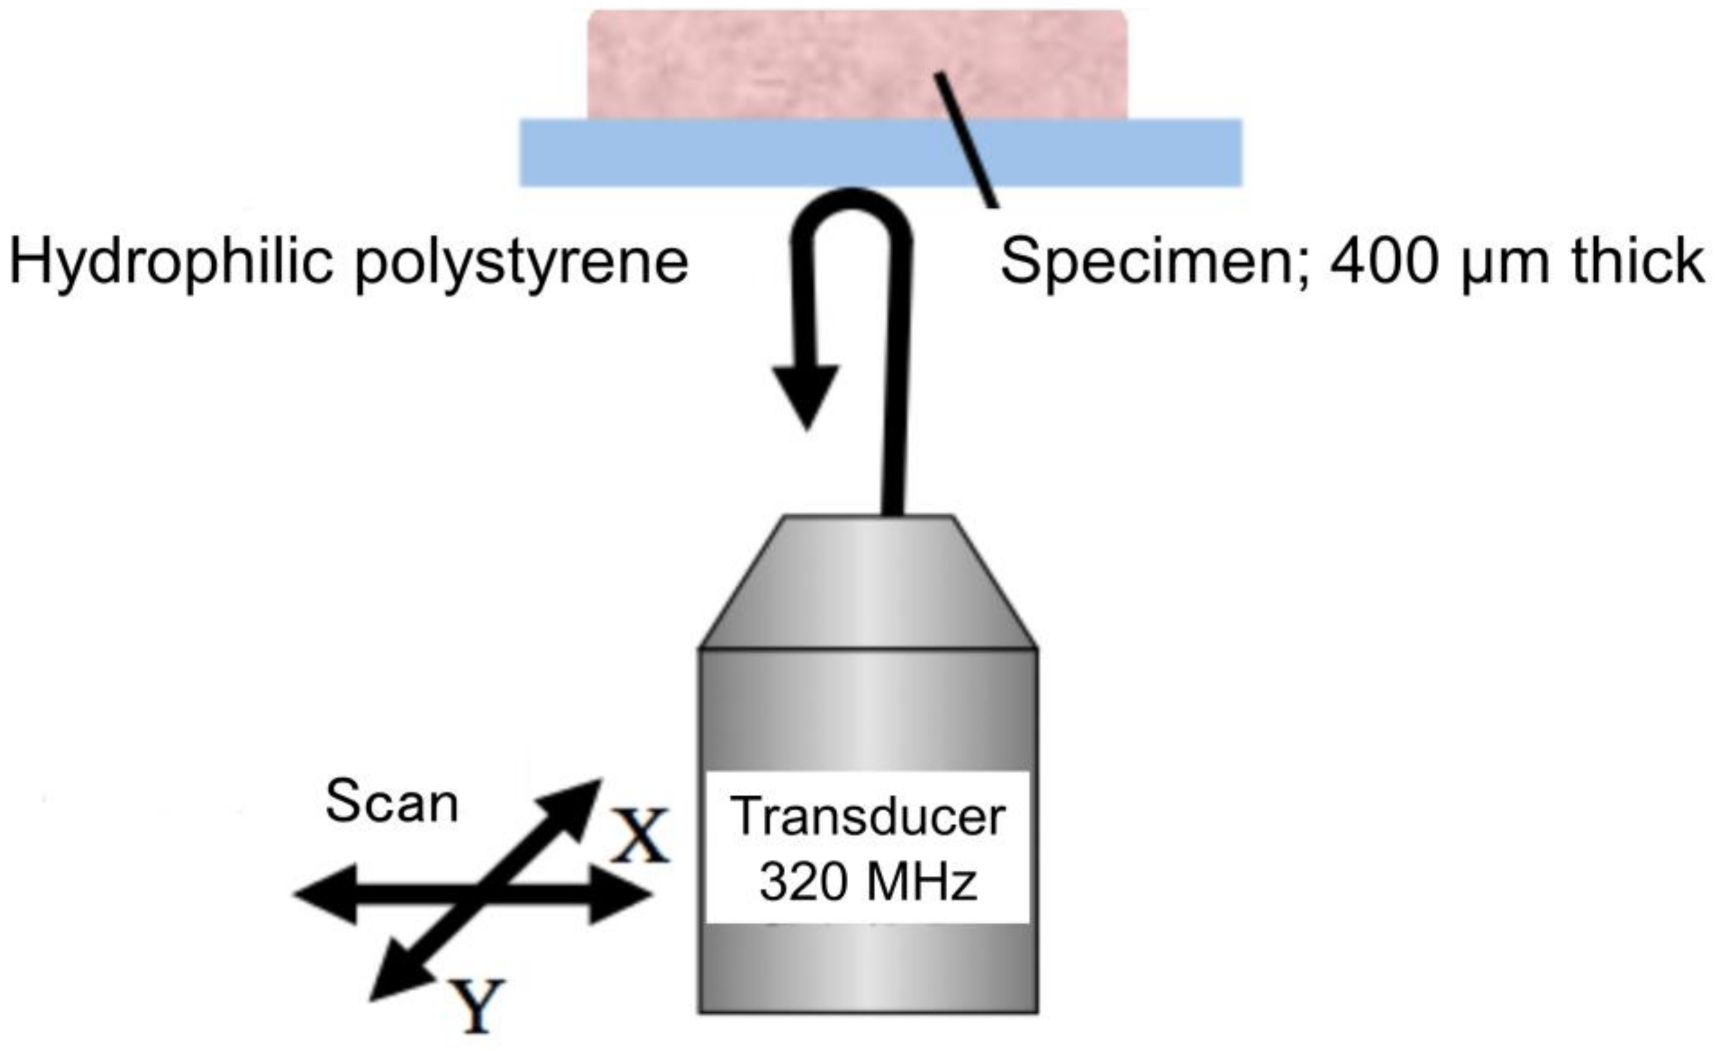
2.2. Methods for Ultrasonic Analysis

The largest left lobe was excised for measurement of impedance and observation of microscopic structure using SAM. The samples were completely submerged in 0.9% degassed saline solution and the temperature of the experimental room was controlled at 25 °C using an air conditioner. The hepatic lobe was then cut into slices 400 µm thick (an area about 12 mm2) using a rotor slicer, and evaluated using a commercially available SAM system (AMS-40SI, Honda Electronics, Toyohashi, Japan) with a central frequency of 320 MHz, lateral resolution of 3.8 µm, and focal spot thickness of 13 µm. Polystyrene coated with a hydrophilic agent was used as the substrate (Menicon Co. Ltd., Nagoya, Japan; Figure 1). The author carefully absorbed all excess water around the specimen. Distilled water was used as the coupling fluid between the transducer and the specimen. The transducer was used for both transmitting and receiving the signal. Reflected waveforms were compared to measure the impedance at each point. A waveform from the polystyrene planar surface without the specimen present was used as the reference waveform. Scanning the specimen with the transducer formed an acoustic image. The mechanical scanner was arranged so that the ultrasonic beam was transmitted at every 8, 4, or 2 µm interval over a width of 2.4, 1.2, or 0.6 mm, respectively. The number of sampling points in one scanning line was 300, and 300 points × 300 points comprised one frame. Each image pixel corresponded to an echo coming from an X–Y coordinate on the specimen. The acoustic impedance of water was 1.50 Pa·s/m3, and that of polystyrene was 2.37 Pa·s/m3. Each received radiofrequency echo signal was processed to calculate the acoustic impedance. Ultrasonic measurements were conducted once with each method within 5 min after extirpation of the liver. All components were controlled by the UM-scope software (Honda Electronics, Toyohashi, Japan). The total areal value of acoustic impedance obtained in five non-overlapping fields (around four corners and a central part) in the specimen was considered. Any impedance values exceeding 1.80 Pa·s/m3 or below 1.30 Pa·s/m3 were excluded from the analysis. The total excluded area in each specimen was about 10–20%.

2.3. Methods for Pathologic Analysis

After the SAM examination, the same specimen was fixed by immersion in a solution of 10% formaldehyde, and then embedded in paraffin. Tissue sections 5 µm thick were then prepared and stained with hematoxylin–eosin and Azan. The author semiquantitatively evaluated necroinflammatory activity and fibrosis with the parenchymal remodeling in the liver specimen according to the Brunt system for NAFLD (steatosis amount grade 0: 0%, grade 1: 0–33%, grade 2: 34–66%, grade 3: > 66%. Inflammation grade 0: lobular 0 foci/20× field; portal none, grade 1: lobular 1–2 foci/20× field; portal mild, grade 2: lobular 2–4/20×; portal moderate, grade 3: lobular > 4/20×; portal severe. Fibrosis stage 0: none, stage 1: zone 3 perisinusoidal, stage 2: 1 + periportal, stage 3: bridging, stage 4: cirrhosis) [16,17].

2.4. Light Microscopy Observation of Sections Examined by SAM

The obtained SAM intensity images were compared with the corresponding images obtained by light microscopy.

2.5. Statistical Analysis

Student’s t test was performed to examine the difference of impedance between samples of steatohepatitis and controls. Differences at p < 0.05 were considered to be statistically significant. A box-plot test was used to study the linear correlation between impedance and biopsy. The mean and standard deviation of the impedance were calculated for each Brunt steatosis grade, inflammation grade, and fibrosis stage, respectively [16,17].

3. Results

3.1. Mouse Liver

Histological images indicated that fat vacuoles had accumulated in the hepatocytes of liver samples until 5 weeks after the start of the experiment. Then, the accumulation of fat vacuoles gradually decreased with a gradual increase in inflammation and fibrosis. Table 1 lists the ultrasonic and pathologic properties of livers from both control mice and mice with steatohepatitis.

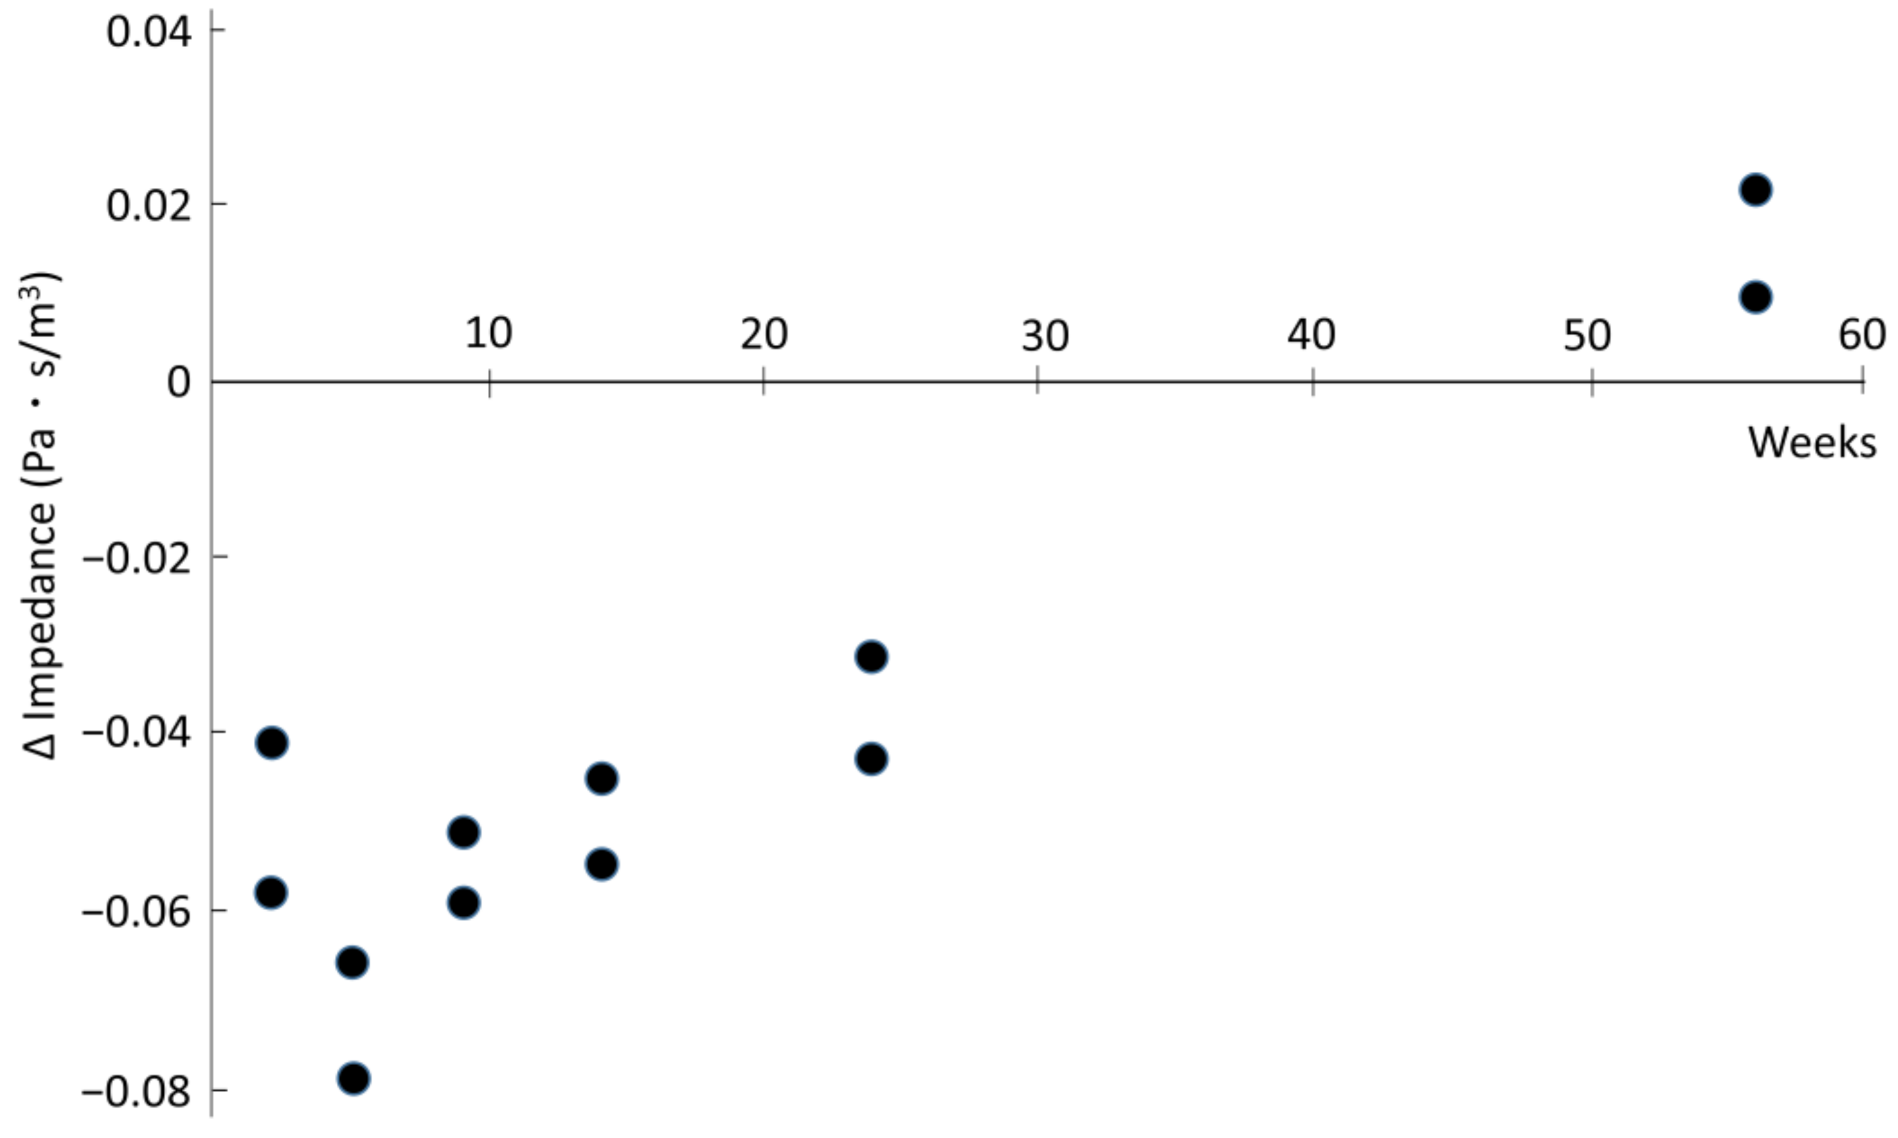
3.2. Temporal Changes in Impedance through a Liver Affected by Steatohepatitis

It was assumed that impedance values in the control group would remain stable during the course of the experiment. However, our results revealed various degrees of variability despite the care taken to ensure that the experimental environment and procedures were uniform. The author measured the ultrasonic properties of livers from three mice (one control and two with steatosis) in one day. It was found that the acoustic impedance tended to be high overall on one day and low on another day, respectively. Therefore, in Figure 2, the author plotted the degree of difference in the impedance between controls and mice with steatohepatitis each time. This revealed that the acoustic impedance showed a temporary decrease with increased fat deposition until 5 weeks after the start of the experiment, and then increased in accordance with the progression of inflammation and fibrosis. The author observed statistically significant differences in impedance values between steatohepatitis mice and controls at every time point after the start of the experiment (p < 0.05).

3.3. Relationship between Acoustic Impedance and the Brunt System

Figure 3A–C shows the distribution of acoustic impedance values for liver specimens in the control group and mice with steatohepatitis based on the Brunt system. The impedance showed a tendency to decrease as steatosis increased (Figure 3A). The acoustic impedance of the liver affected by steatohepatitis remained lower than that in control, but tended to increase with the progression of inflammation or fibrosis (Figure 3B,C).

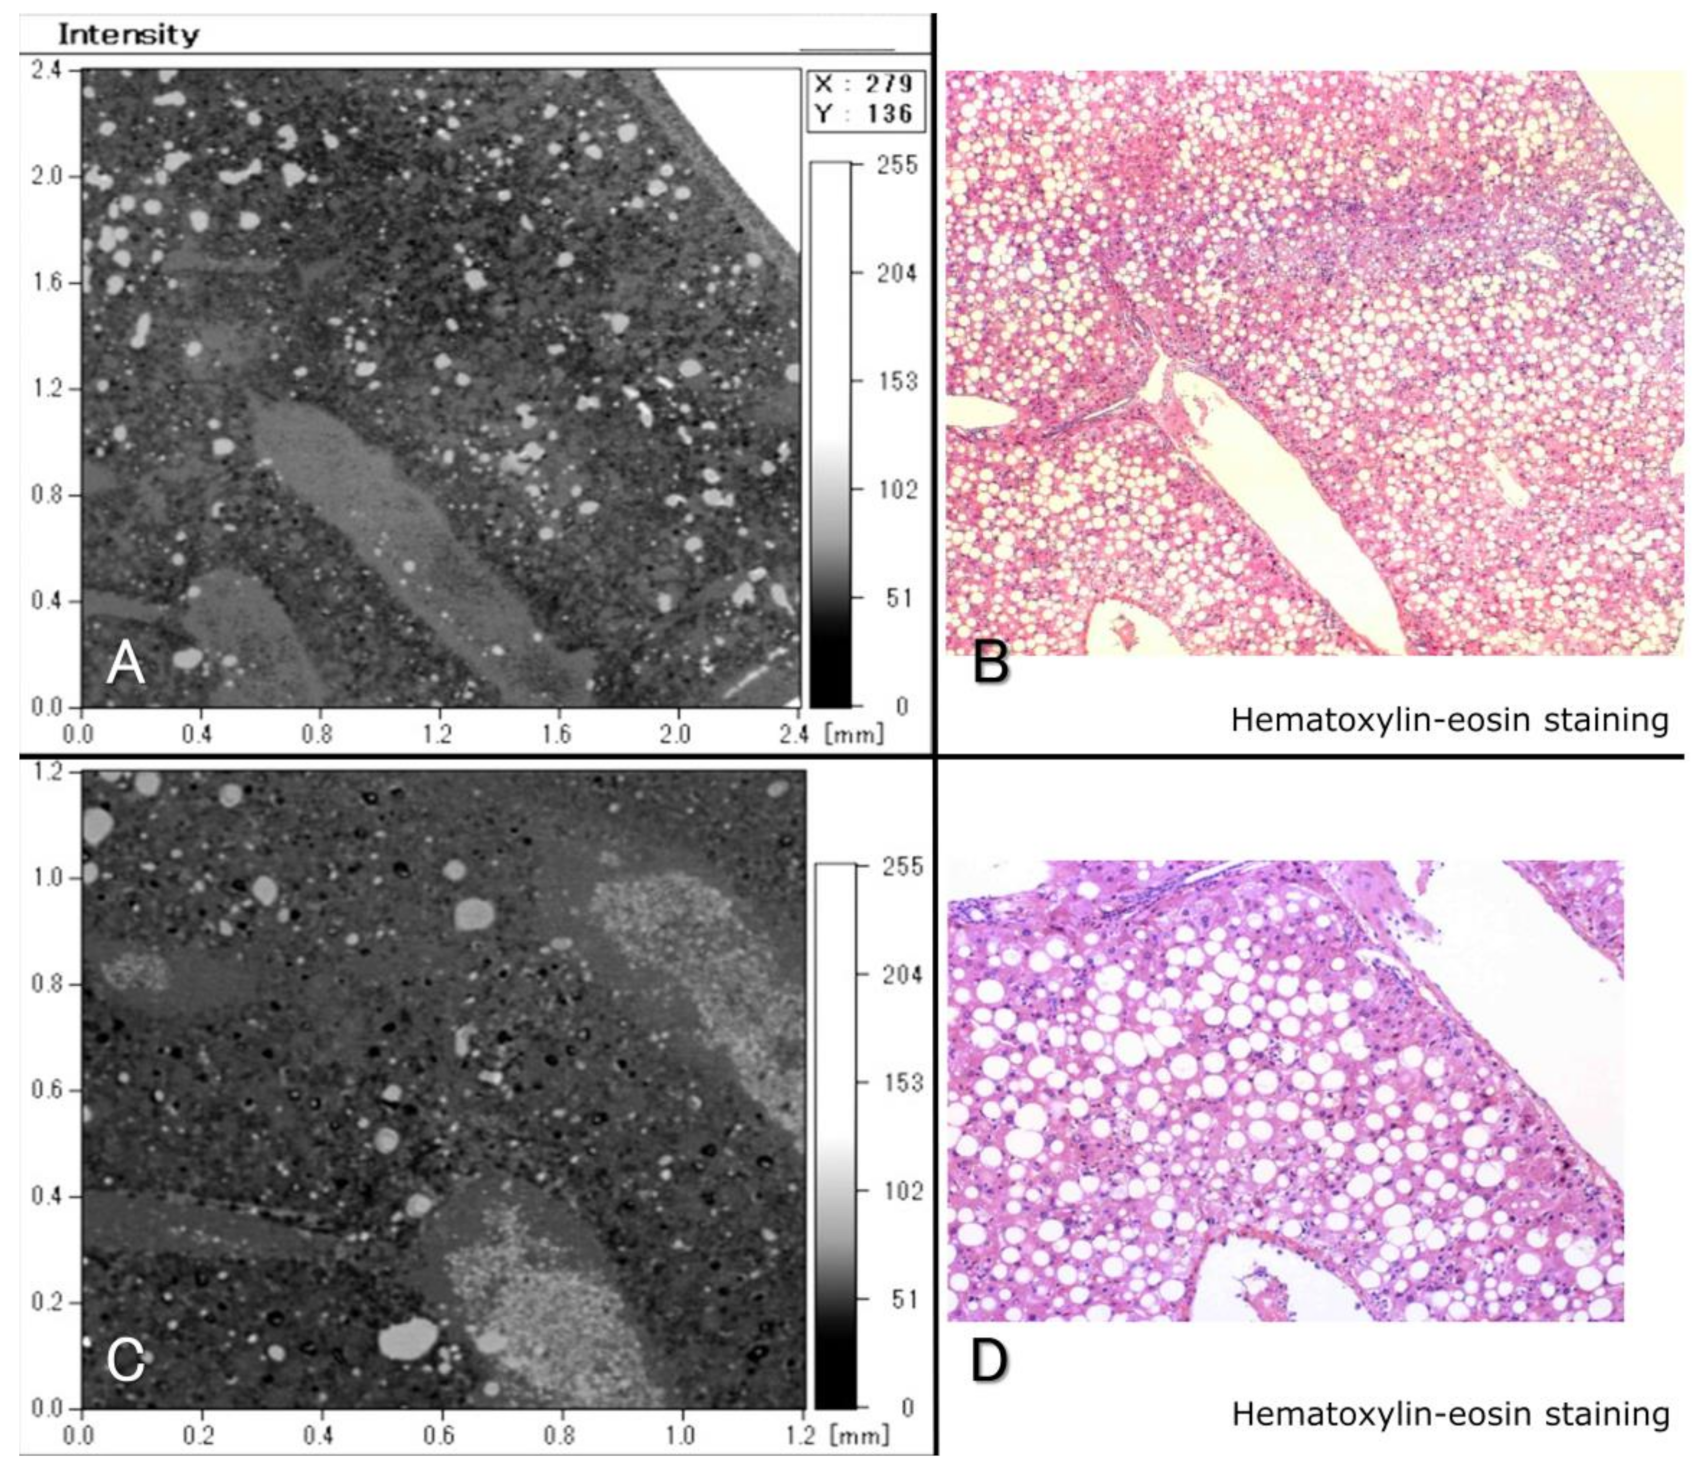
3.4. Ultrasound Microscopic Images Based on Intensity in Liver Tissues

Gross structures, such as vascular architecture, in the liver, were visualized and comparable to those visualized using light microscopy. However, acoustic images obtained using SAM were unable to allow discrimination of features such as fat deposit distribution, individual fat droplet size, infiltration of inflammatory cells, and the extent of fibrosis from those seen using light microscopy (Figure 4).

4. Discussion

In comparison to other conventional tissue characterization methods, the first advantage of SAM for imaging and measuring the acoustic properties of liver specimens is that it is a relatively fast technique that can acquire acoustic intensity images with one frame containing 300 sampling points × 300 sampling points within 90 s. Second, SAM offers micrometer resolution alongside easy-to-perform and direct monitoring. A further advantageous property of SAM is that sample preparation is easy, and the acoustic impedance of liver samples can be measured non-destructively. This avoids any mechanical or chemical changes in the samples associated with a specific sampling process (e.g., fixation or staining) [18].
Our experiment revealed that acoustic impedance in steatohepatitis decreased temporarily with the degree of fat deposition and then increased in accordance with the progression of inflammation and fibrosis. A previous publication has reported that acoustic impedance values in NASH mice were significantly lower than those in other models (untreated mice and mouse models of simple steatosis and cirrhosis) [19]. The results of the present study were in line with the study.
Mice fed the MCD for more than 5 weeks showed a gradual increase of liver impedance. Analyses of sound speed in liver disease have shown that the speed increased with the progression of liver fibrosis. Since acoustic impedance is proportionate to sound speed, the increase of impedance the author demonstrated herein the liver affected by steatohepatitis was thought to be due to progression of fibrosis. On the other hand, the relationship between the degree of histological inflammation and acoustic impedance in liver tissue has been unclear. However, some studies of sound speed have suggested that fatty inflammation might influence liver stiffness [20,21]. Thus, the acoustic impedance in steatohepatitis tissue changes dynamically according to the degree of steatosis, the extent of fibrosis, and perhaps the level of inflammation. For this reason, it would probably be difficult to evaluate the grade and stage of steatohepatitis based on measurement of acoustic impedance alone in the liver at any specific time point. However, monitoring of impedance in the liver of patients with fatty liver could be potentially useful for surveillance or early detection of steatohepatitis and cirrhosis. Furthermore, a combination of multiple parameters, such as the backscattering coefficient or attenuation coefficient, with acoustic impedance may have the potential for differentiating between the stages of fibrosis. In this manner, measurement of acoustic impedance may be clinically applicable for prompt evaluation of steatohepatitis without the need for sample removal and staining. Putative situations that could be considered would include a laparoscopic procedure or at laparotomy, as ultrasound microscopic examination cannot be performed externally.
On the other hand, the acoustic images obtained using SAM were unable to allow discrimination of detailed microstructures, such as the distribution of fat deposits, the size of individual fat droplets, infiltration of inflammatory cells, and the extent of fibrosis, from those seen using light microscopy. For ultrasound microscopy, specimens must be placed under a hydrophilic environment. However, the specimens the author used were fatty liver with an accumulation of lipid microdroplets. These large numbers of lipid microdroplets could have caused the scattering of the ultrasound waves under the hydrophilic environment, and affected visualization of the images. This would suggest that the use of ultrasound microscopy for visualizing the histologic features of steatohepatitis in a clinical setting could be challenging.
The main limitation of this preliminary study was the small number of samples examined. However, the author believes that our approach was acceptable for recognizing temporal changes in the acoustic impedance of liver tissue with steatohepatitis. Another limitation lay in the examination procedure or environment. Temperature is a well-known basic factor affecting the speed of sound [22], and thus acoustic impedance. Although the author paid careful attention to maintaining a uniform liver temperature in our ex vivo experiment, the acoustic impedance values for the control samples were found to be relatively variable.

5. Conclusions

The acoustic impedance in steatohepatitis decreased temporarily with the degree of fat deposition and then increased in accordance with the progression of inflammation and fibrosis. Estimation of the acoustic impedance of steatohepatitis without the need for sampling and staining appears to have potential clinical applications, such as for monitoring or follow-up studies.

Author Contributions

Conceptualization, H.K.; methodology, H.K., K.K., and S.Y.; software, K.K.; formal analysis, H.K. and N.H.; investigation, H.K., K.K. and N.H.; resources, H.K., K.K., and S.Y.; writing—original draft preparation, H.K.; writing—review and editing, K.K., S.Y., K.Y., T.Y.; supervision, K.K. and T.Y.; project administration, H.K.; funding acquisition, H.K. All authors have read and agreed to the published version of the manuscript.

Funding

This research was funded by JSPS KAKENHI, grant number JP26670565 and 17K11519.

Institutional Review Board Statement

The study was conducted according to the guidelines of the Declaration of Helsinki, and ap-proved by the Institutional Review Board of Jichi Medical University (protocol code 17-062, date of approval 7 July 2015).

Informed Consent Statement

Not applicable.

Data Availability Statement

Please refer to suggested Data Availability Statements in section “MDPI Research Data Policies” at https://www.mdpi.com/ethics.

Acknowledgments

The authors acknowledge the technical contributions of Hikari Yamada, Saki Iwamoto, and Rahma H Rahayu.

Conflicts of Interest

The authors declare no conflict of interest.

References

  1. Saijo, Y. Recent applications of acoustic microscopy for quantitative measurement of acoustic properties of soft tissues. In Quantitative Ultrasound in Soft Tissues, 1st ed.; Mamou, J., Oelza, M.L., Eds.; Springer: Heidergerg, Germany, 2013; pp. 291–313. [Google Scholar]
  2. Miura, K.; Yamamoto, S. A scanning acoustic microscopy discriminates cancer cells in fluid. Sci. Rep. 2015, 5, 15243. [Google Scholar] [CrossRef] [PubMed] [Green Version]
  3. Miura, K.; Yamashita, K. Mechanical weakness of thoracic aorta related to aging or dissection predicted by speed of sound with collagenase. Ultrasound Med. Biol. 2019, 45, 3102–3115. [Google Scholar] [CrossRef] [PubMed]
  4. Ito, T.; Kanai, T.; Itoh, K.; Yamagata, T. Ultrasound microscopy through a fine fiber fore renal tissues. Clin. Exp. Nephrol. 2019, 23, 867–869. [Google Scholar] [CrossRef] [PubMed]
  5. Hagiwara, Y.; Saijo, Y.; Ando, A.; Onoda, Y.; Suda, H.; Chimoto, E.; Hatori, K.; Itoi, E. Comparison of articular cartilage images assessed by high-frequency ultrasound microscope and scanning acoustic microscope. Int. Orthop. 2012, 36, 185–190. [Google Scholar] [CrossRef] [PubMed] [Green Version]
  6. Sanyal, A.J. Past, present and future perspectives in nonalchoholic fatty liver disease. Nat. Rev. Gastroenterol. Hepatol. 2019, 16, 377–386. [Google Scholar] [CrossRef]
  7. Leporq, B.; Lambert, S.A.; Ronot, M.; Vilgrain, V.; van Beers, B.E. Quantification of the triglyceride fatty acid composition with 3.0 T MRI: quantification of triglyceride fatty acid composition with MRI. NMR Biomed. 2014, 27, 1211–1221. [Google Scholar] [CrossRef]
  8. Imbault, M.; Faccinetto, A.; Osmanski, B.F.; Tissier, A.; Deffieux, T.; Gennisson, J.; Vilgrain, V.; Tanter, M. Robust sound speed estimation for ultrasound-based hepatic steatosis assessment. Phys. Med. Biol. 2017, 62, 3582–3598. [Google Scholar] [CrossRef]
  9. Mehta, S.H.; Lau, B.; Afdhal, N.H.; Thomas, D.L. Exceeding the limits of liver histology markers. J. Hepatol. 2009, 50, 36–41. [Google Scholar] [CrossRef] [Green Version]
  10. Mehta, S.R.; Thomas, E.L.; Bell, J.D.; Johnston, D.G.; Taylor-Robinson, S.D. Non-invasive means of measuring hepatic fat content. World J. Gastroenterol. 2008, 14, 3476–3483. [Google Scholar] [CrossRef]
  11. Bouzitoune, R.; Meziri, M.; Machado, C.B.; Padilla, F.; Pereira, W.C. Can early hepatic fibrosis stages be discriminated by combining ultrasonic parameters? Ultrasonics 2016, 68, 120–126. [Google Scholar] [CrossRef]
  12. Bedossa, P.; Darger, D.; Paradis, V. Sampling variabilitiy of liver fibrosis in chronic hepatitis C. Hepatology 2003, 38, 1449–1457. [Google Scholar] [CrossRef] [PubMed]
  13. Brunt, E.M.; Tiniakos, D.G. Histopathology of nonalcoholic fatty liver disease. World J. Gastroenterol. 2010, 16, 5286–5296. [Google Scholar] [CrossRef] [PubMed]
  14. Dasarathy, S.; Dasarathy, J.; Khiyami, A.; Joseph, R.; Lopez, R.; McCullough, A.J. Validity of real time ultrasound in the diagnosis of hepatic steatosis: a prospective study. J. Hepatol. 2009, 51, 1061–1067. [Google Scholar] [CrossRef] [PubMed]
  15. Kulinski, A.; Vance, D.E.; Vance, J.E. A choline-deficient diet in mice inhibits neither the CDP-choline pathway for phosphatidylcholine synthesis in hepatocytes nor apolipoprotein B secretion. J. Biol. Chem. 2004, 279, 23916–23924. [Google Scholar] [CrossRef] [Green Version]
  16. Brunt, E.M.; Janney, C.G.; Di Bisceglie, A.M.; Neuschwander-Tetri, B.A.; Bacon, B.R. Nonalcoholic steatohepatitis: a proposal for grading and staging the histological lesions. Am. J. Gastroenterol. 1999, 94, 2467–2474. [Google Scholar] [CrossRef]
  17. Brunt, E.M. Nonalcoholic fatty liver disease: pros and cons of histologic systems of evaluation. Int. J. Mol. Sci. 2016, 17, 97. [Google Scholar] [CrossRef] [Green Version]
  18. Barr, R.J.; White, G.M.; Jones, J.P.; Shaw, L.P.; Ross, P.A. Scanning acoustic microscopy of neoplastic and inflammatory cutaneous tissue specimens. J. Invest. Dermatol. 1991, 96, 38–42. [Google Scholar] [CrossRef] [Green Version]
  19. Ito, K.; Yoshida, K.; Maruyama, H.; Mamou, J.; Yamaguchi, T. Acoustic impedance analysis with high-frequency ultrasound for identification of fatty acid species in the liver. Ultrasound Med. Biol. 2017, 43, 700–711. [Google Scholar] [CrossRef]
  20. Nahon, P.; Kettaneh, A.; Tengher-Barna, I.; Ziol, M.; de Ledinghen, V.; Douvin, C.; Marcellin, P.; Ganne-Carrie, N.; Trinchet, J.C.; Beaugrand, M. Assessment of liver fibrosis using transient elastography in patients with alcoholic liver disease. J. Hepatol. 2008, 49, 1062–1068. [Google Scholar] [CrossRef]
  21. Ogawa, S.; Moriyasu, F.; Yoshida, K.; Oshiro, H.; Kojima, M.; Sano, T.; Furuichi, Y.; Kobayashi, Y.; Nakamura, I.; Sugimoto, K. Relationship between liver tissue stiffness and histopathological findings analyzed by shear wave elastography and compression testing in rats with non-alcoholic steatohepatitis. J. Med. Ultrasonics. 2016, 43, 355–360. [Google Scholar] [CrossRef]
  22. Apfel, R.E. Prediction of tissue composition from ultrasonic measurements and mixture rules. J. Acoust. Soc. Am. 1986, 79, 148–152. [Google Scholar] [CrossRef] [PubMed]
Figure 1. Scanning acoustic microscope. The ultrasound emitted by an acoustic transducer hits or penetrates the tissue and is reflected the surface of the tissue or the hydrophilic polystyrene. It is then returned to the detector.
Acoustics 03 00002 g001
Figure 2. Changes in acoustic impedance in the liver over time. The acoustic impedance of liver tissue in the group fed the methionine and choline diet showed a temporary decrease until 5 weeks after the start of the experiment, and then increased. Solid circles indicate the degree of difference in the impedance relative to that of a control mouse on each occasion.
Acoustics 03 00002 g002
Figure 3. Distribution of acoustic impedance values in the control group and in mice with steatohepatitis based on pathohistologic evaluation of the liver, according to the Brunt system. (A) Steatosis grade (0; n = 6, 1; n = 3, 2; n = 3, 3; n = 6). (B) Inflammation grade (0; n = 6, 1; n = 5, 2; n = 5, 3; n = 2). (C) Fibrosis stage (0; n = 10, 1; n = 2, 2; n = 3, 3; n = 3).
Acoustics 03 00002 g003
Figure 4. Ultrasound microscopic images based on intensity in liver tissues. The acoustic intensity image (A,C) and its corresponding light microscopic image (B,D) with hematoxylin and eosin staining. A–B and C–D are the same sites in the same specimen, respectively.
Acoustics 03 00002 g004
Table 1. Ultrasonic and pathologic properties of livers from both control mice and mice with steatohepatitis.
MouseTime on a Diet (Week)Impedance (Pa·s/m3)Brunt System
SteatosisInflammationFibrosis
Steatohepatitis
S121.535110
S221.552110
S351.515310
S451.528310
S591.543321
S691.551321
S7141.559312
S8141.569222
S9241.561322
S10241.573233
S11561.560233
S12561.572123
Control
C121.593000
C251.594000
C391.602000
C4141.614000
C5241.604000
C6561.550000
Publisher’s Note: MDPI stays neutral with regard to jurisdictional claims in published maps and institutional affiliations.

