Abstract
Although the exponential increase in photovoltaic installations does contribute to mitigating climate change, it has posed the problem of photovoltaic (PV) residue. As PV panels contain strategic metals, their recovery has become a priority. This paper therefore employs a mesoporous carbon impregnated with P507 extractant as adsorbent to selectively recover gallium and indium from solutions simulating the leachate of end-of-life CIGS (Copper Indium Gallium Selenide) cells in a fixed-bed. The previous batch results obtained in our lab show that both metals can be selectively separated by simply adjusting the initial pH, with large adsorption capacities (44.97 mg/g for gallium and 34.24 mg/g for indium). The obtained breakthrough curves were fitted to the Thomas, Yan, Yoon, and HSDM (Homogeneous Surface Diffusion Model) models using a simulation program developed in Python 3.12 obtaining good results in all cases (R2 > 0.9). The estimated parameters were used to predict the experimental breakthrough curve for a different experiment that had not been used for parameter estimation, being the best predictive results the obtained with the HSDM. This is logical, given that unlike the other three models, it is mechanistic.
1. Introduction
One of the most important challenges that modern society is facing nowadays is addressing the issues of global warming and climate change. Renewable energy sources are crucial for mitigating climate change, as demonstrated by the global commitment made at COP28 to triple installed renewable energy capacity by 2030, reaching at least 11 TW. Solar power is expected to play a significant role in achieving this goal, alongside wind power, with projections showing that over 90% of renewable capacity growth will come from these two sources. Photovoltaics (PV) have proven to be a leading solution in tackling these concerns, with installed PV capacity growing exponentially. According to data from the International Energy Agency (IEA), global cumulative PV capacity reached 2247 GW in 2024 [1], while IRENA reported 1865 GW for the same year [2]. Furthermore, the highest growth in annual PV installations was seen in 2024, with a 585 GW increase according to IRENA [2] and 602 GW according to the IEA [1]. Looking ahead, ITRPV [3] forecasts that installed PV capacity could rise to 17.4 terawatts by 2050.
Although most installed PV modules are still crystalline silicon-based, thin-film flexible PV modules such as Copper Indium Gallium Selenide (CIGS) are becoming more popular due to their unique properties. It should be noted that the thickness of the active layer of a crystalline silicon cell is typically between 180 and 350 µm, whereas in the case of thin-film cells it is usually less than 1 µm [4]. Additionally, this technology offers several key advantages. Firstly, flexible modules are better suited to curved surfaces. Secondly, the necessary materials for their production are more affordable. Thirdly, they are as fragile as silicon ones. Additionally, CIGS cell efficiency and stability are comparable to Si solar cells [5]. However, the primary disadvantage associated with this solar cell technology is its comparatively lower level of maturity when compared with silicon technology.
At present, silicon solar cells dominate the market, with a market share ranging from 92% to 95%, depending on the source [6], and flexible thin film technology reaching a 5% market share. However, the rapid increase in PV installed capacity justifies the establishment of a reliable upcycling procedure for these film modules, among which CIGS is the most representative technology. This is illustrated in Figure 1, which presents the projections for PV installations capacity in the European Union.
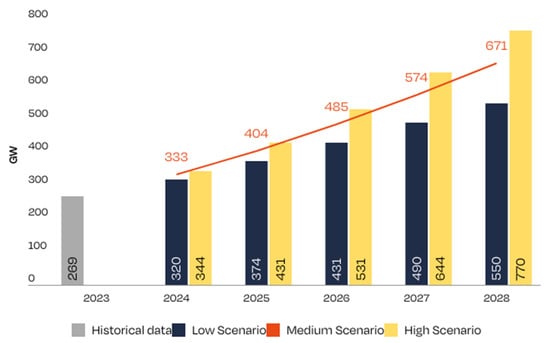
Figure 1.
Forecast EU installed PV panel capacity (GW) [7], orange correspond to orange line in the graph.
To date, CIGS solar cell technology has reached significant maturity, with laboratory efficiencies exceeding 23% and commercial efficiencies approaching 13%. Although not as widely used as silicon, CIGS cells offer advantages such as greater flexibility, lower weight, and the ability to manufacture translucent and flexible solar panels.
The main components of CIGS solar cells are gallium and indium; however, the primary reserves of these metals are scarce, and extraction is largely restricted to a handful of countries, raising concerns about supply security and price volatility. Consequently, initiatives to recover these metals from electronic waste are becoming increasingly important as a means of securing a stable and sustainable supply. Effective recycling and recovery strategies mitigate resource scarcity, contribute to the circular economy, and reduce the environmental impact of conventional mining and refining operations. End-of-life (EoL) CIGS cells, among the electronic waste, could represent a reliable source of gallium and indium. According to Li et al. [8] a CIGS cell contains an average of between 5 and 16% by weight of gallium and between 19 and 45% by weight of indium.
In short, gallium is a valuable metal with significant applications in the semiconductor industry, as well as being a key component in CIGS solar cells. Due to its limited natural abundance and growing industrial demand, it is considered a strategic resource [9]. Gallium does not occur naturally but is obtained as a by-product when aluminium is extracted from bauxite ore. These factors, combined with rising global demand, have increased interest in recovering gallium from secondary sources, such as industrial and electronic waste. Indium is a soft, silvery-white metal with a bright, crystalline appearance. It is usually employed in its metallic form, in alloys, or as indium-tin oxide (ITO). It is used in the manufacture of photoconductors, thermistors, and liquid crystal display (LCD) screens for computers and solar cells [10]. As with gallium, indium cannot be economically extracted directly but is usually obtained as a by-product of zinc processing.
Of the methods available for recovering gallium and indium, adsorption from CIGS solar cells leachates is a reliable option due to the high indium and gallium content of these residues. This technology is favoured over other alternatives due to its many advantages: simplicity, versatility, suitability for low metal concentrations, selectivity, and low cost, depending on the adsorbent used [11]. Focusing on gallium adsorption in particular, various types of adsorbents have been employed in the literature. For instance, Cui et al. [12] and, more recently, Guo et al. [13] have used chitosan-based adsorbents in a batch process, achieving adsorption capacities of up to 130 mg/g and 238 mg/g, respectively. Other authors have also successfully used amidoxime resin [14] or clays such as bentonite [15]; however, carbonaceous [15,16] and zeolitic [17,18,19] materials have shown to be the most effective adsorbents for gallium recovery. For indium adsorption, carbonaceous materials [20] and zeolites [18] have also been successfully used as potential adsorbents. Other alternatives that have been investigated include chitosan [21] and sawdust [22]. Nevertheless, when gallium and indium occur together in a leaching solution, a trustworthy adsorption alternative is the employment of organic extractants impregnated on different supports in two ways: by using one common extractant or two extractants selective for ions of one of these metals [23]. Among them, it is the remarkable work of Wang et al. [24] who employed P507 extractant (2-ethylhexyl phosphoric acid mono-2-ethylhexyl ester) supported on mesoporous carbon as a potential gallium and indium adsorbent. They found that it was capable of selectively removing one or the other simply by changing the pH of the aqueous solution: at pH 1, the extractant loaded mesoporous carbon could selectively adsorb indium ions, while at pH 2 it could retain both indium and gallium.
Most of the previously cited works were carried out in batch mode; however, references to fixed-bed adsorption are rather uncommon. Regarding gallium fixed-bed adsorption, Sáez et al. employed an acidic clinoptilolite [19], Lou et al. [25] employed zirconium phosphate, and Shet et al. employed mesoporous silica microspheres [26]. Concerning indium fixed-bed adsorption, the references are ever scarcer. Liu et al. [27] employed a resin to selectively separate gallium, indium, and zinc, and they found a similar behaviour to that experienced by Wang et al.
For this reason, and due to the increasing demand of gallium and indium as well as the possibility of their recovery from end-of-life CIGS leachates, this paper aimed to use a commercially available mesoporous activated carbon impregnated with P507 extractant for the selective separation of gallium and indium by means continuous fixed-bed adsorption, which has not been conducted before. In previous studies, we used the aforementioned extractant impregnated onto mesoporous carbon for the selective separation of gallium and indium in batch mode [28], achieving a separation coefficient (% indium removed/% gallium removed) of 6.3 at pH 1, using an adsorbent dose of 1 g/L, with initial concentrations of 40 mg/L indium and 20 mg/L gallium. Moreover, for the same solid dose and initial metal concentrations, the maximum adsorption capacities achieved were 44.97 mg/g for gallium and 34.24 mg/g for indium. These are high values that confirm the strong affinity of the solid for both metals.
Furthermore, the other aim of the paper is to develop a Phyton fixed-bed simulation model using the application, Jupyter Notebook 7.4. The simulation model could be extended to other metal-adsorbent systems by modifying input data such as bed and solution properties or equilibrium relationships, which will make it useful for future industrial applications.
The parameters of the models used were obtained by regression, using a part of the experimental data to validate the model, and once its parameters were adjusted, it was used to predict an experimental breakthrough curve that had not been used in the adjustment of the parameters.
2. Material and Methods
2.1. Chemicals
Reagents and chemicals used in the experiment are listed in Table 1.

Table 1.
Reagents used during the experiment.
2.2. Experimental Apparatus
The adsorption experiments were conducted using a fixed-bed column system that was specifically designed to study the dynamic competitive adsorption of cations present in CIGS leachates. A schematic of this process is shown in Figure 2. In this Figure 1 is the aqueous solution of gallium and indium; 2 is a model Dinko 25-V peristaltic pump; 3 is the adsorption column, which consisted of one or two tubes in series, of 0.9 cm in diameter and 10 cm in length each, depending on the type of experiment; 4 is a 3-way valve used to take the sample for the tests; and 5 is a waste storage container. The design of the adsorption columns has been carefully considered to ensure adequate fluid dynamic performance. To this end, the adsorption columns have been designed to fulfil the sizing criteria determined by Vassilis et al. [29]. Proper column design can minimize fluid-dynamic phenomena such as axial and radial dispersion, head loss, and preferential channels, which can hinder the study of process dynamics. The first parameter to be set was the particle diameter, after which the rest of the adsorption column parameters were sized. The values of all these parameters are summarized in Table 2, which also shows how they fulfil the criteria for column dimensioning (DINT/dp and Z/dp relationships), according to the literature [29]. In this table, dp is the particle diameter of the adsorbent, DINT is the internal diameter of the adsorption column, Z is the length of the adsorption column, and L is the bed height. Additionally, the bed was been arranged to ensure uniform porosity with quartz wool used for proper placement and to prevent fines entrainment.
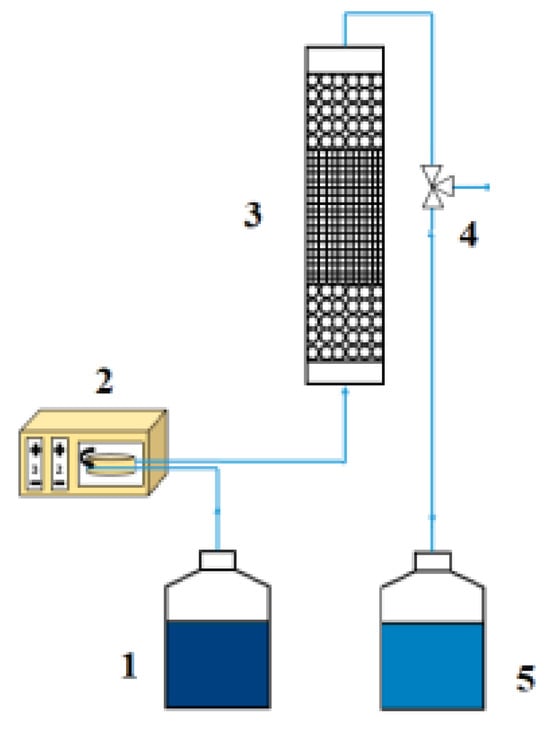
Figure 2.
Experimental setup used for fixed-bed adsorption.

Table 2.
Design parameters of adsorption column used.
Ultimately, it was decided that the indium and gallium solution should flow upwards through the column in order to ensure P507@MAC was completely wetted and the fluid was distributed correctly [30]. In all the tests, a flow of water was passed through the column for around 30 min prior to feeding the aqueous solutions of metals to wet the adsorbent and eliminate any air or bubbles that might form at the beginning of filling. This also ensured a stable flow of the aqueous solutions of metals.
2.3. Experimental Procedure
2.3.1. Sorbent Synthesis
To carry out gallium and indium adsorption experiments in a fixed bed system, the P507@MAC complex must first be prepared to act as an adsorbent. This complex is prepared using mesoporous activated carbon that has undergone an activation process, following the outlined below process, in which the percentage of extractant by weight was quantified by means of thermogravimetric analysis [24]:
Firstly, the activated carbon must be repeatedly washed with deionized water to remove any residues or impurities. This process was repeated as many times as necessary until the collected wash water was clear and free of turbidity. Next, the carbon was boiled to remove any trapped air within its pores. For activation, 10 g of boiled carbon was mixed with 200 mL of dichloromethane and 6 mL of 2-ethylhexyl phosphate (P507) at room temperature for three hours. After this period, the mixture was transferred to a round flask and subjected to vacuum evaporation for an additional two hours until dryness. Finally, the carbon obtained from the rotary evaporator was dried in an oven at 60 °C for 24 h yielding activated carbon P507@MAC.
2.3.2. Sorbent Characterization
Proper adsorbent characterization is crucial to understand its properties and optimize fixed-bed tests for In and Ga removal. Characterization was carried out according to the previous work of the research group [28]. Pycnometry was used to determine the solid density, bulk density, and porosity of the adsorbent, averaging six measurements to account for heterogeneity in particle size and packing. The sphericity and shape of the mesoporous carbon particles was also been determined experimentally. Sphericity was estimated using the three-diameter method developed by Krumbein [31], and particle shape was determined using the Zingg method [32]. Fourier Transform Infrared Spectroscopy (FTIR) was used to identify the functional groups present in the coal structure. The FTIR analysis was carried out at the Spectroscopy and Correlation Unit, which is part of the Research Support Centres (CAIs) of the UCM. A Nicolet iS50 FTIR spectrometer (Waltham, MA, USA) with a maximum resolution of 0.09 cm−1 was used. Scanning electron microscopy (SEM) was performed to observe possible morphological changes on the surface of the mesoporous carbon. The SEM analyses were carried out using a JEOL JSM-6335F microscope at the National Centre for Electron Microscopy ICTS (JEOL, Tokyo, Japan). Finally, thermogravimetric analyses were performed, with a Setaram Labsys EVO apparatus (Lyon, France). The analyses were carried out from 30 °C to 600 °C with a heating rate of 10 °C/min, under inert conditions.
2.3.3. Adsorption Process of Indium and Gallium
Three synthetic solutions simulating leachates from end-of-life CIGS PV cells were prepared for the experiments and further develop the simulation model: a 20 mg/L gallium solution from Ga(NO3)3 salt, a 40 mg/L indium solution from In(NO3)3 salt, and a bimetallic solution of 40 mg/L indium and 20 mg/L. The initial pH was adjusted to 1 or 2, depending on the experiment, with nitric acid 3 M.
Table 3 summarizes all the experiments carried out to determine the parameters modelling the adsorption process of indium and gallium, as well as to validate the selected models using experimental data.

Table 3.
Indium and gallium fixed-bed adsorption tests.
During the preparation of these tests, solutions of the respective metals were passed through the P507@MAC adsorbent-filled column under the conditions explained, and samples of the column effluents were taken periodically to plot the breakage curves for each test.
2.4. Physical-Chemical Analytical Techniques
Atomic absorption Spectroscopy (AAS) using a Shimadzu AA-7000 atomic absorber (Kyoto, Japan) equipped with an air–acetylene flame, and an ASC-7000 autosampler was used to measure metal concentrations. The AAS calibration curves were prepared using single metal standard solutions, and the measurements were carried out at wavelengths of 287.4 nm for gallium and 303.9 nm for indium, where there was no interference from other metals.
2.5. Breakthrough Curve Models
A well-designed continuous adsorption column implies the development of a robust mathematical model capable of accurately representing dynamic adsorption processes and forecast breakthrough curves [33]. In most cases, the following assumptions are made: plug flow with axial dispersion and no radial gradients in mass, heat or velocity. To attain this aim, breakthrough curve modules can be divided into two groups:
- Mechanistic: Those considering the differential mass balance layer by layer inside the column as well as the equilibrium and kinetic relationships [11].
- Analytical: These models have recently received increasing attention because they can provide sufficient fitting accuracy without the need for complex numerical solutions; however, the parameters of these models are largely empirical and exhibit a high degree of sensitivity to changes in process conditions.
In this study four different models (one mechanistic and three analytical) have been employed. Their respective equations are shown in Table 4.

Table 4.
Representative parameters of breakthrough curve models employed.
The first three models are analytical and, although they are capable of reproducing the breakthrough curves, they lack any theoretical basis to support them. Therefore, their use is only valid within the operational limits established by the author.
The Thomas model [34] is probably the most widely used empirical model to describe the behaviour of a fixed-bed adsorption column. Not being mechanistic, it does not account for mass transfer resistances or axial dispersion, although it allows for predicting the fixed-bed adsorption behaviour in systems with Langmuir-type adsorption isotherms that follow the pseudo-second-order kinetic model. In this model, KTH represents the kinetic constant, qTH the maximum adsorption capacity, m the adsorbent mass, and Q the volumetric flow. On the other hand, the Yan [35] and Yoon–Nelson models [36] are simpler models, as they were developed for a single-component system, and they do not require knowing the characteristics of the adsorbate and the adsorbent, or the physical properties of the bed. Despite its simplifications, the Yan model is perhaps more trustworthy than other models because it capable of explaining the entire breakthrough curve with relative precision. In this model, qy are the model parameters, Q is the volumetric flow, m the adsorbent mass, and t is time. Among the main assumptions of this model are plug-flow behaviour, instant adsorption equilibrium, and negligible mass-transfer resistance. Regarding the Yoon–Nelson model, its main assumption is that the probability of each adsorbate molecule to be retained decreases proportionally to the number of already adsorbed molecules. In this model, KYN represents the kinetic constant, and τ the time at which the relative outlet concentration C/C0 reaches 0.5 value.
On the other hand, the Homogeneous Surface Diffusion Model (HSDM) is mechanistic. It considers the differential mass balance layer by layer inside the column (Equation (4) in Table 4), as well as the equilibrium (Equations (8) and (9), Langmuir isotherm, in Table 4), and kinetic relationships (Equations (5) and (6), in Table 4).
2.6. Development of the Simulation Model
The developed simulation model consisted of three tools. The first tool consisted of a program capable of reading and processing the experimental data collected in the tests. With this data, the program determined the parameters that best fit the tests for each of the four models used. It should be noted that this program was designed to be scalable, with the capacity to incorporate new experimental data and expand the program’s library of results, which will be used in the following tools.
To create a flexible program, a modular structure was designed to store the data of each test. This structure can handle any volume of data, flow rate, mass of adsorbent, initial concentration of indium and gallium (0 if one of the metals is absent), dilution factor of the samples (if diluted), metals present in the experiment, and C/C0 (normalized concentration, where C is the concentration at a given time and C0 is the initial concentration). The names and formats of the variables within the module must be the same as shown in Figure 3 for the system to use them.

Figure 3.
Experimental data feed module of the Python program.
Once all the experiments have been entered, the user must indicate to the program the total number of experiments and run the corresponding cell in the Jupyter Notebook. This tool is basically able to calculate the different parameters needed for the four models used in this project which can model the breakage curves of adsorption processes.
For the first three models, the determination of their respective characteristic parameters was carried out through a linearization of their equations, adjusting the experimental data of each experiment to the linearized models following the least square method, and obtaining the characteristic parameters, previously described in Section 2.3, from the slopes and the intercepts.
However, as for obtaining the parameters of the HSDM, the steps followed are more complex. As seen in Table 4, the HSDM requires mainly the intraparticle mass transfer coefficient , the liquid-film mass transfer coefficient (kF), and the axial dispersion coefficient (Db), which are the unknown parameters of the system. Figure 4 summarizes the calculation of these parameters.
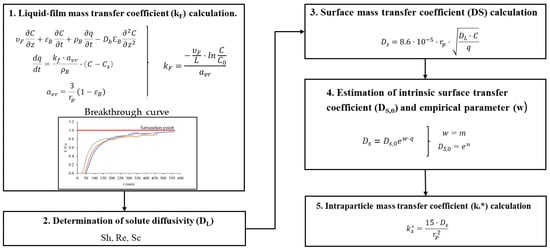
Figure 4.
HSDM parameters calculation scheme.
Calculating the axial dispersion coefficient is straightforward once the other parameters have been determined. It is then only necessary to iterate the solution of the equation with different values of the Db coefficient until a solution that is as close as possible to the validation case is obtained. However, calculating the intra-particle mass transfer coefficient requires a series of prior calculations explained in the following Figure 4.
First, the liquid-film mass transfer coefficient (kF) was calculated in the saturation region of the breakthrough curve (C/C0 ≈ 0.99), as a function of particle radius (see Table 4), assuming negligible axial dispersion and accumulation. Then, the solute diffusivity in the liquid phase (DL) was determined using an empirical correlation involving Reynolds (Re), Sherwood (Sh), and Schmidt (Sc) numbers [24].
Once DL was obtained, the surface mass transfer coefficient (DS) was calculated using particle radius, solute concentration, and adsorbent loading. Since DS depends on time-varying adsorbent loading, an exponential adjustment was applied to extract intrinsic parameters: the intrinsic surface transfer coefficient (DS,0) and the empirical parameter (w), to obtain the surface mass transfer coefficient as a function of time. Finally, using DS,0 and w (obtained from the adjustment) in combination with the HSDM equations, the intraparticle mass transfer coefficient (ks*) was calculated as a time-dependent parameter to improve model accuracy (step 5 in Figure 4). Afterwards, the HSDM was solved using the Phyton ScyPy library, which includes several models for solving partial differential equations, for different axial dispersion coefficients values until minimum value of R2 parameter.
Finally, the parameters of all four models were determined for each experiment, and the predictive capacity of the models was validated. To this end, an additional tool was developed to compare the models’ predictions with those of a previously unused experiment in model development (Experiment 7). Prior to making these predictions, it was essential to estimate the parameters that characterise each model under the specific operating conditions of the chosen experiment. Two different approaches were therefore used for parameter estimation:
Constant parameters: This method has a stronger theoretical basis, assuming that the model parameters are independent of flow rate and bed length. In this approach, the parameters employed for validation were determined as the average values obtained from all experimental trials. While physically meaningful, this method may not provide the best fit for experimental data.
Adjusted parameters: Although not physically rigorous, this approach is widely used for fitting models to experimental data. Here, the parameters employed for validation have been assumed to vary linearly with the flow rate and with the length of the bed.
The simulation program developed is a powerful tool that will allow for the a priori prediction of the behaviour of an adsorption bed, minimizing the number of experiments required. Furthermore, it offers the advantage that, by modifying the input data (bed properties, solution properties, etc.), it can be applied to any other metal-adsorbent system. Although the application of a fixed-bed simulation tool may be constrained by the limitations of the mathematical models employed, its use for reducing experimental workload is of great significance for future industrial applications.
3. Results and Discussion
3.1. Characterisation
The characterisation of P507@MAC solid was extensively performed in previous works [28]. It included the determination of particle density, bulk density, and bed porosity using pycnometry. Particle sphericity and shape were assessed using Krumbein and Zingg diagrams [24,30] while functional groups were identified by FTIR, morphological changes were examined via SEM.
The results obtained from the pycnometry test are presented in Table 5 which will later be used in the design of the adsorbent columns.

Table 5.
Average values from the pycnometry results [28].
Subsequently, according to the Krumbein method the average sphericity obtained was 0.63, and the particles exhibited a discoidal shape. The average particle diameter provided by the commercial activated carbon specifications was 0.8 mm. This particle diameter was used in all subsequent design calculations related to the columns.
Fourier-transform infrared spectroscopy analysis was performed to identify the functional groups present on the surface of both P507@MAC and mesoporous activated carbon (MAC). The results are shown in Figure 5, representing adsorbance as a function of wavenumber.
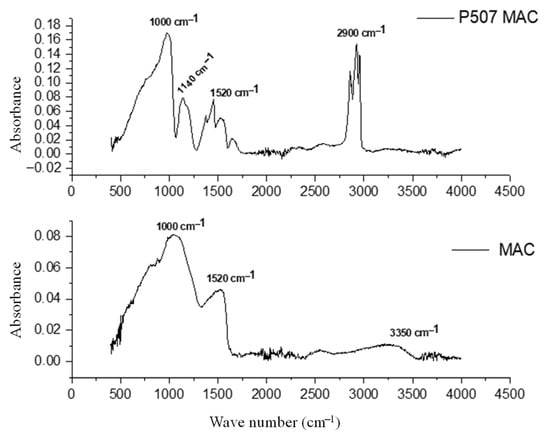
Figure 5.
FTIR of mesoporous activated carbon (MAC) and P507@MAC [28].
As it can be observed in Figure 5, all characteristic bands and peaks of MAC (a band at 1520 cm−1 which can most probably relate to the C = C bonds of the aromatic rings) were also present in the spectra of P507@MAC. Additionally, the C–H bond band (2700–3000 cm−1), the P-O–H vibration peak (1000 cm−1), and the P = O bond band (1140 cm−1) from the P507 were observed in P507@MAC. This confirms that P507 was successfully impregnated into MAC, without its structure being altered. Moreover, the P = O bond band (1140 cm−1) present in the P507@MAC spectrum may be associated with the protonated state of the polar groups in P507 (P = O) and the dense electron cloud due to the high acidity of pure P507 [24]. After impregnation, the protonation of the polar group decreased, and the electron cloud became uniformly distributed due to the neutral MAC carrier.
As stated in the literature [33] Ga3+ and In3+ ions bind to P507@MAC through a P-O–H bond (1000 cm−1 FTIR band), by replacing the proton with the metal ion, while P = O bonds (1140 cm−1 FTIR band) also take place in the adsorption process. This indicates an acidic complexation mechanism in the adsorption process. Previous research confirmed that the spectra of phosphoryl group-metal ion complexes are not significantly different.
To observe possible morphological changes after P507 impregnation SEM micrographs of MAC and P507@MAC materials were carried out and are shown in Figure 6.
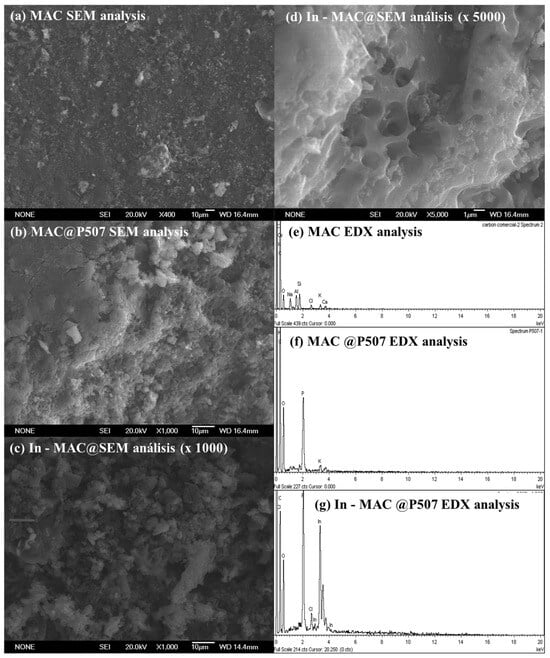
Figure 6.
SEM and EDX analysis of mesoporous activated carbon (MAC) and P507@MAC [28]. SEM micrographs (a–d) and EDX analyses (e–g) [25] correspond to the commercial activated carbon (a,e), the carbon impregnated with P507 (b,f), and the indium load impregnated carbon (c,d,g), respectively.
As observed in Figure 6, a change in the material surface is observed: the activated carbon (a) was transformed into a less rough surface (b), while after the adsorption of In, protrusions appeared on the surface (c). As seen in the EDX spectra (e–g), impregnating the surface with P507 and performing the adsorption of In increased the atomic ratios of the elements P and In, respectively. Elemental mapping (EDX analysis) confirmed that the new elements P and In were uniformly dispersed on the surface of the MAC. These phenomena demonstrated that P507 was uniformly dispersed in the MAC, and P507@MAC successfully adsorbed In3+.
Finally, thermogravimetric analysis was performed under inert atmosphere to assess the thermal stability of the material, confirming that it is thermally stable up to 600 °C, and to determine the extractant loading (13% by weight).
3.2. Breakthrough Curves
Figure 7 represents the experimental breakthrough curves (evolution of relative metal concentration of each metal versus time at the outlet of the fixed bed) corresponding to tests 1–6, as described in Table 3 for (a) gallium and (b) indium. These tests were then fitted to the aforementioned models. These tests studied the influence of bed length and adsorption column feed flow rate. Single solute indicates that only one metal (indium or gallium) is present in the initial solution, while two-solute indicates that both metals (indium and gallium) are present in the initial solution.
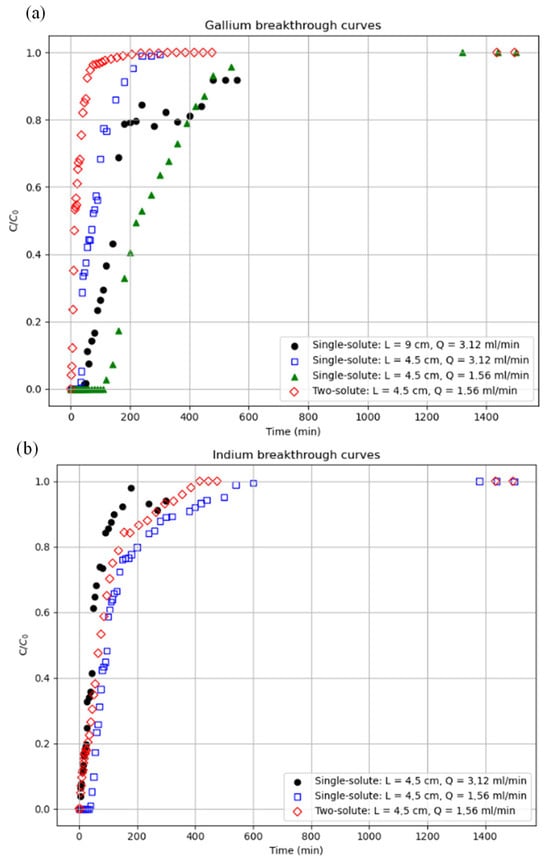
Figure 7.
Results of the experimental breakage curves for (a) gallium and (b) indium, for different volumetric flows (Q) and bed lengths (L). Initial concentrations: Ga, 20 mg/L and In, 40 mg/L.
As can be seen in Figure 7, an increase in bed length results in a longer saturation time (C/C0 ≈ 0.99) for the system. This is because a longer bed length implies a higher adsorbent mass. This translates to a greater number of available active centres; therefore, under the same conditions as the other system parameters, it takes longer to saturate all the adsorbent material.
Regarding the flow rate, as expected, tests show that an increase in flow rate reduces bed saturation time. This is because increasing the flow rate increases the amount of metal in contact with the adsorbent per unit of time. This, in turn, improves mass transfer and results in a shorter saturation time under the same conditions as the other parameters.
Finally, the multicomponent effect of this process was also studied. We observed how the breakage curves of gallium and indium change when the two metals are present in the solution, keeping volumetric flow, bed length, and initial concentrations constant. By comparing the tests, the saturation time of the system is always shorter when both metals are present. Although there is competition between the two metals to occupy the active centres and a higher overall concentration of adsorbates, the time it takes to saturate the bed is shorter than in monometallic systems with the same initial concentrations of both metals. This might be attributed to the higher total metal concentration in the experiment involving both metals.
To further analyse the performance of the bed in gallium and indium adsorption, some characteristic bed parameters have been calculated for experiments 1 to 3, such as breakthrough capacity (qB), saturation capacity (q∞), and the utilised bed fraction (UFB). Breakthrough and saturation capacities allow for the determination of the amount of metal ion that the bed has been able to retain up to the breakthrough and saturation times, respectively, per unit mass. They are calculated with Equations (11) and (12), respectively, in which Q is the volumetric flow, C0 the initial metal concentration, C the metal concentration at time t, VD is the dead volume of the bed (7.7∙10−3 m3), and wsolid is the adsorbent mass (1.85∙10−3 kg). Table 6 summarises the calculated bed parameters.

Table 6.
Average values from the pycnometry results.
As shown in Table 6, there is a considerable increase in adsorption capacity from the breakthrough time to the saturation time. This indicates the adsorption bed’s good performance, except in experiment three for gallium. This behaviour is due to the fact this experiment was carried out at a pH of 1, at which point gallium adsorption should theoretically be negligible. This result confirms the validity of the proposed method for the selective separation of indium and gallium.
Once the effects of the system variables have been analysed, it will be easier to interpret the results obtained from the created tools.
3.3. Simulation Results
Table 7 summarises the parameters obtained by fitting experiments 1 through 6 to the four models. To check the quality of the fits, the regression coefficients are also displayed. It can be observed that in many cases reasonably good fits (R2 > 0.9) were obtained. However, it is important to point out that the best regression coefficients were obtained in the experiments in which both metals were presented in the initial solution. The R2 values are similar to those obtained in the literature; for example, Saez et al. [19] obtained R2 values of up to 0.88 when fitting experimental data of continuous gallium adsorption on clinoptilolite to the Yoon–Nelson model.

Table 7.
Summary table of the Thomas model parameters.
Afterwards, these parameters were used to validate the model and check its capability of predicting the breakthrough curve of an experiment which was not employed to obtain the models’ parameters.
3.4. Validation of the Model
Figure 8 with readjusted parameters for (a) gallium and (b) indium and Figure 9 with constant parameters for (a) gallium and (b) indium illustrates how well the breakage curve for Test 7 of Table 3 aligns with the various models that were examined. In this figure, the black dots represent the experimental data, and the black arrow indicates the line representing the mechanistic model (the other fitting models are empirical). The program is intended to be validated using this data.
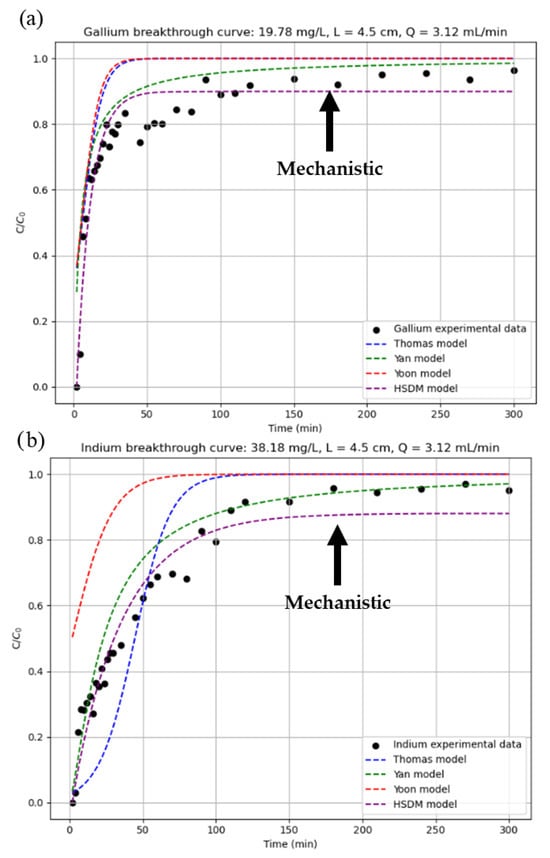
Figure 8.
Prediction of breakthrough curves with readjusted parameters for (a) gallium and (b) indium.
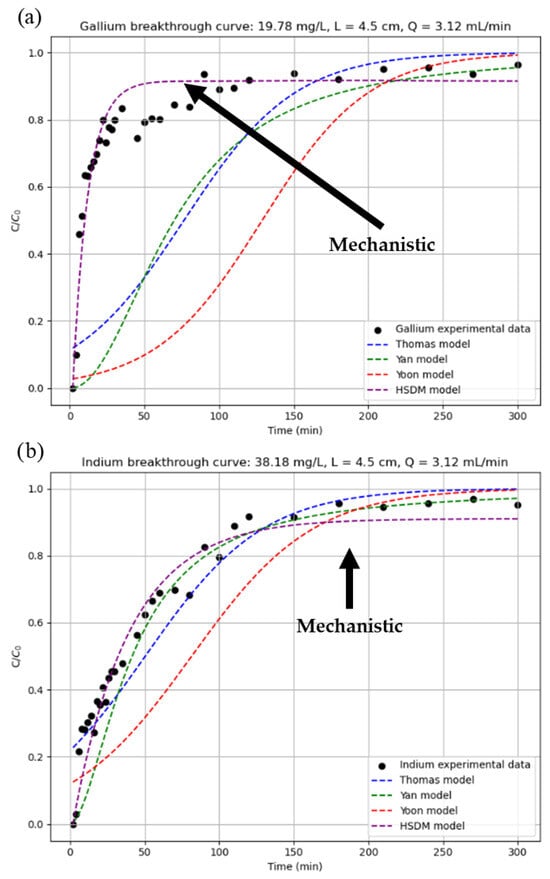
Figure 9.
Prediction of breakthrough curves with constant parameters for (a) gallium and (b) indium.
Significant differences are often visually apparent when applying different models or estimation methods; however, some models cannot be easily compared using graphical representations alone. For this reason, additional parameters such as Root Mean Square Error (RMSE) and the coefficient of determination (R2) are used to evaluate model performance. These parameters are summarised in Table 8 and Table 9. The first table shows the results with a rescaled parameter estimate, and the second table shows the results with a constant parameter estimate.

Table 8.
Summary table with rescaled parameters.

Table 9.
Summary table with constant parameters.
Analysing the results obtained, it can be seen that the estimation with rescaled parameters is noticeably better for the empirical models in the case of gallium, while the opposite is true for indium. In the mechanistic model (HSDM), however, the difference between one estimation method and the other is not remarkable. This similarity in the results of the HSDM can be explained by the physical nature of the model, which is based on theoretical principles and incorporates key mechanisms such as mass balance, equilibrium relationships, external and internal diffusion, and axial dispersion. As a mechanistic model, it offers a more realistic representation of the process. Although it requires more complex resolution and certain assumptions, it can be applied across a wide range of operating conditions without exceeding its validity, unlike empirical models. This makes it a more robust and reliable model. In the end, the difference between rescaled and constant parameters is not very high, so it is to be expected that, as it is a model with a theoretical basis and not an adjustment of experimental data, as the process conditions vary little, similar results will be obtained.
However, empirical models are very susceptible to small variations in the model parameters, since these models have been created and adjusted under specific operating conditions, so that if the data used are not of high quality or if their operating conditions are different from each other, disparate results can be obtained, such as those shown in Figure 8. In fact, it is possible to observe a similar effect in the case of indium, where although the differences are not so noticeable between estimation methods, it is possible to distinguish this difference between the empirical and mechanistic models.
As empirical models are based on numerical correlations based on experimental data rather than physical phenomena, their field of application is limited to the range of operations indicated by the author, and they cannot be considered valid outside this range. Starting from this premise and using the data obtained by the program, it was found that, of the three proposed empirical models, Yan’s model produced the best results for predicting gallium breakage curves, while Thomas’s model produced the best results for indium, closely followed by Yan’s model. This is because, despite being numerical relationships based on experimental data, they attempt to give physical meaning to their equations [19]. Therefore, depending on which mechanisms have been attempted to be reproduced in the model, the results obtained may be better or worse. In the case of the Yan model, the equations governing the Yan model consider internal and external matter transfer mechanisms, as well as equilibrium. In contrast, the Thomas model does not consider such transfers but is well suited to systems with Langmuir-type isotherms and pseudo-second order kinetics, as in this work. For these reasons, the Yan model generally offers the best results, as its equation includes more adsorption mechanisms than the others. Despite being a simpler model, the Thomas model also offers good results due to the operating conditions of the project. Finally, the Yoon model is the simplest of all, not considering any of the mechanisms. It is based exclusively on the decreasing probability of adsorbate adsorption over time. Although it is very simple, the results obtained are poor for a breakthrough curve prediction program.
To summarise, with the current experiments analysed, the models that best predict the breakthrough curves of an adsorption column for the recovery of indium and gallium from CIGS waste using the P507@MAC complex as adsorbent are the HSDM with rescaled parameters for gallium and the HSDM with constant parameters for indium with respective R2 of 0.908 and 0.959.
4. Conclusions
Due to the increasing demand of gallium and indium and the realistic possibility of recovering them from end-of-life CIGS leachates, this study aimed to study their separation from aqueous solutions simulating these leachates, as well as to develop a computational tool capable of modelling breakthrough curves in fixed-bed adsorption processes involving indium and gallium. The adsorbent used was a commercial mesoporous activated carbon impregnated with the P507 extractant. In previous studies carried out by the authors, this adsorbent proved to be effective in the selective separation of Ga and In in aqueous solutions simulating leachates from end-of-life CIGS PV cells by adjusting the initial pH. Indium is selectively adsorbed at an initial pH of 1 and gallium at an initial pH of 2.
To model and predict the adsorption of indium and gallium in the above-described adsorbent, an integrated tool was developed to simulate and analyse the dynamic behaviour of these systems. This tool comprises three independent yet complementary modules: (1) mathematical analysis, (2) parameter estimation and model validation, and (3) breakthrough curve prediction. It processes experimental data to determine adsorption parameters and validates model performance using four models: Thomas, Yan, Yoon, and HSDM. It supports two estimation methods—constant and adjusted parameters—under varying operating conditions.
Due to its mechanistic basis, the HSDM showed the best predictive performance for both indium and gallium, with R2 values of 0.959 and 0.908, respectively. Among the empirical models, the Yan model performed best due to its ability to represent more adsorption mechanisms (R2 = 0.734 for indium and 0.906 for gallium), followed by the Thomas and Yoon models.
The developed simulation program is a useful tool for predicting the behaviour of an adsorption bed in advance, significantly reducing the need for extensive experimental work. Moreover, its flexibility in adjusting input parameters—such as bed and solution properties or surface chemistry—makes it adaptable to a wide range of metal-adsorbent systems, which enhances its validity for industrial purposes.
Author Contributions
V.R.: investigation, data curation; A.V.A.: writing—original draft, investigation, data curation, writing—review and editing; A.J.: investigation, data curation; R.M.: writing—review and editing, conceptualisation; E.D.: writing—review and editing, conceptualisation, supervision, funding acquisition; A.R.: conceptualisation, writing—review and editing, supervision, funding acquisition. All authors have read and agreed to the published version of the manuscript.
Funding
This research was funded by the Spanish International Research Agency and the European Union NextGeneration EU/PRTR, Grant No. TED2021-129624B-C42, the Spanish International Research Agency, Grant No. PID2021-125797OB-I00, the Directorate-General for Research and Technological Innovation of the Community of Madrid (Spain), Grant No. TEC-2024ECO-72 and the Community of Madrid, Grant No. CT19/23-INVM-43.
Data Availability Statement
The original contributions presented in this study are included in the article. Further inquiries can be directed to the corresponding author(s).
Acknowledgments
The authors gratefully acknowledge the financial support from Grant No. TED2021-129624B-C42, funded by the Spanish International Research Agency and the European Union NextGeneration EU/PRTR. The authors also gratefully acknowledge the financial support from Grant No. PID2021-125797OB-I00 funded by the Spanish International Research Agency. Grant No. TEC-2024ECO-72 funded by the Directorate-General for Research and Technological Innovation of the Community of Madrid (Spain) is also acknowledged. Additionally, Arturo Jiménez acknowledges Grant No. CT19/23-INVM-43 of the Community of Madrid. The authors also gratefully acknowledge the contribution of Lucía Ríos Moral.
Conflicts of Interest
The authors declare no conflicts of interest.
References
- IEA. Snapshot of Global PV Markets 2025 Task 1 Strategic PV Analysis and Outreach PVPS; IEA: Dallas, TX, USA, 2025. [Google Scholar]
- International Renewable Energy Agency. Renewable Capacity Highlights 2025; International Renewable Energy Agency: Abu Dhabi, United Arab Emirates, 2025. [Google Scholar]
- Komoto, K.; Lee, J.-S. End-of-Life Management of Photovoltaic Panels: Trends in PV Module Recycling Technologies; International Enery Agency: Redfern, Australia, 2018; ISBN 978-3-906042-61-9. Available online: https://iea-pvps.org/wp-content/uploads/2020/01/End_of_Life_Management_of_Photovoltaic_Panels_Trends_in_PV_Module_Recycling_Technologies_by_task_12.pdf (accessed on 10 August 2025).
- Vinayagamoorthi, R.; Bhargav, P.B.; Ahmed, N.; Balaji, C.; Aravinth, K.; Krishnan, A.; Govindaraj, R.; Ramasamy, P. Recycling of End of Life Photovoltaic Solar Panels and Recovery of Valuable Components: A Comprehensive Review and Experimental Validation. J. Environ. Chem. Eng. 2024, 12, 111715. [Google Scholar] [CrossRef]
- Ramanujam, J.; Bishop, D.M.; Todorov, T.K.; Gunawan, O.; Rath, J.; Nekovei, R.; Artegiani, E.; Romeo, A. Flexible CIGS, CdTe and a-Si:H Based Thin Film Solar Cells: A Review. Prog. Mater. Sci. 2020, 110, 100619. [Google Scholar]
- Photovoltaics Report-Fraunhofer Institute for Solar Energy Systems ISE with the Support of PSE Projects GmbH. Available online: https://www.ise.fraunhofer.de/en/publications/studies/photovoltaics-report.html (accessed on 10 August 2025).
- Forecast EU Installed PV Panel Capacity. Available online: https://www.solarpowereurope.org/insights/interactive-data/total-eu-27-solar-pv-capacity-a-growth-story (accessed on 8 August 2025).
- Li, X.; Ma, B.; Wang, C.; Hu, D.; Lü, Y.; Chen, Y. Recycling and Recovery of Spent Copper—Indium—Gallium—Diselenide (CIGS) Solar Cells: A Review. Int. J. Miner. Metall. Mater. 2023, 30, 989–1002. [Google Scholar]
- Grohol, M.; Veeh, C. Study on the Critical Raw Materials for the EU 2023—Final Report; The European Commission: Brussels, Belgium, 2023.
- Alfantazi, A.M.; Moskalyk, R.R. Processing of Indium: A Review. Miner. Eng. 2003, 16, 687–694. [Google Scholar] [CrossRef]
- Worch, E. Adsorption Technology in Water Treatment; DE GRUYTER: Berlin, Germany, 2012; ISBN 978-3-11-024022-1. [Google Scholar]
- Cui, J.; Cong, X.; Li, X.; Chen, X.; Wang, Y.; Gao, J.; Xiong, Y. Chitosan Derived Layered Porous Carbon and Its Performance on Gallium Adsorption. J. Chem. Technol. Biotechnol. 2023, 98, 1387–1394. [Google Scholar] [CrossRef]
- Guo, Y.; Ma, M.; Gong, Q.; Li, G.; Zhou, G.; Fan, G.; Cao, Y.; Li, P.; Teng, D. Sustainable Gallium Recovery Using Functionalized Chitosan-Based Adsorbents: Comparative Evaluation of Single and Multiple Hydroxamic Acids on Adsorption Capacity and Selectivity. Sep. Purif. Technol. 2025, 366, 132772. [Google Scholar] [CrossRef]
- Zhao, Z.; Li, X.; Chai, Y.; Hua, Z.; Xiao, Y.; Yang, Y. Adsorption Performances and Mechanisms of Amidoxime Resin toward Gallium(III) and Vanadium(V) from Bayer Liquor. ACS Sustain. Chem. Eng. 2016, 4, 53–59. [Google Scholar] [CrossRef]
- Chegrouche, S.; Bensmaili, A. Removal of Ga(III) from Aqueous Solution by Adsorption on Activated Bentonite Using a Factorial Design. Water Res. 2002, 36, 2898–2904. [Google Scholar] [CrossRef]
- Díez, E.; Gómez, J.M.; Rodríguez, A.; Bernabé, I.; Galán, J. Recovery of Gallium from Aqueous Solution through Preconcentration by Adsorption/Desorption on Disordered Mesoporous Carbon. J. Sustain. Metall. 2021, 7, 227–242. [Google Scholar] [CrossRef]
- Nejadshafiee, V.; Islami, M.R. Intelligent-Activated Carbon Prepared from Pistachio Shells Precursor for Effective Adsorption of Heavy Metals from Industrial Waste of Copper Mine. Environ. Sci. Pollut. Res. 2020, 27, 1625–1639. [Google Scholar] [CrossRef]
- Sáez, P.; Díez, E.; Gómez, J.M.; López, C.; Conte, N.; Lobete, M.; Rodríguez, A. Sorbent Selection for the Recovery of Gallium and Indium from Aqueous Solutions: A Sustainable Approach to the Recovery of Strategic Metals from LED Lamps. Environ. Sci. Pollut. Res. 2024, 31, 57748–57764. [Google Scholar] [CrossRef]
- Sáez, P.; Rodríguez, A.; Gómez, J.M.; Paramio, C.; Fraile, C.; Díez, E. H-Clinoptilolite as an Efficient and Low-Cost Adsorbent for Batch and Continuous Gallium Removal from Aqueous Solutions. J. Sustain. Metall. 2021, 7, 1699–1716. [Google Scholar] [CrossRef]
- Díez, E.; Gómez, J.M.; Rodríguez, A.; Bernabé, I.; Sáez, P.; Galán, J. A New Mesoporous Activated Carbon as Potential Adsorbent for Effective Indium Removal from Aqueous Solutions. Microporous Mesoporous Mater. 2020, 295, 109984. [Google Scholar] [CrossRef]
- Calagui, M.J.C.; Senoro, D.B.; Kan, C.C.; Salvacion, J.W.L.; Futalan, C.M.; Wan, M.W. Adsorption of Indium(III) Ions from Aqueous Solution Using Chitosan-Coated Bentonite Beads. J. Hazard. Mater. 2014, 277, 120–126. [Google Scholar] [CrossRef]
- Jeon, C.; Cha, J.H.; Choi, J.Y. Adsorption and Recovery Characteristics of Phosphorylated Sawdust Bead for Indium(III) in Industrial Wastewater. J. Ind. Eng. Chem. 2015, 27, 201–206. [Google Scholar] [CrossRef]
- Kluczka, J. A Review on the Recovery and Separation of Gallium and Indium from Waste. Resources 2024, 13, 35. [Google Scholar] [CrossRef]
- Wang, W.; Xu, X.; Lai, D.; Xu, Q.; Li, J.; Wang, Y. Selective Isolation of Gallium and Indium from Waste Photovoltaic Modules Facilitated by Extractant-Mesoporous Activated Carbon Composites. Sep. Purif. Technol. 2024, 330, 125510. [Google Scholar] [CrossRef]
- Lou, Z.; Yang, F.; Yu, H.; Cui, J.; Feng, X.; Shan, W.; Xiong, Y. Efficient and Selective Adsorption of Strategic Metal In(III) from Discarded Waste Leaching Solution Based on Nanoconfinement-Mediated Zirconium Phosphate. Chem. Eng. J. 2025, 517, 164183. [Google Scholar] [CrossRef]
- She, Y.; Shao, L.; Yi, M.; Fang, Y.; Qin, L.; Liu, Y.; Wang, X.; Wang, K. Efficient and Inexpensive Preparation of Mesoporous Silica Microspheres and Their Highly Selective Adsorption-Cycling Performance for Ga(III) in Acidic Solutions. Chem. Eng. J. 2025, 511, 162007. [Google Scholar] [CrossRef]
- Liu, J.S.; Chen, H.; Chen, X.Y.; Guo, Z.L.; Hu, Y.C.; Liu, C.P.; Sun, Y.Z. Extraction and Separation of In(III), Ga(III) and Zn(II) from Sulfate Solution Using Extraction Resin. Hydrometallurgy 2006, 82, 137–143. [Google Scholar] [CrossRef]
- Jiménez, A. Adsorción Selectiva En Columna de Metales Críticos Procedentes de Lixiviados de Residuos Electrónicos. Master Thesis, University Complutense of Madrid, Madrid, Spain, 2024. [Google Scholar]
- Inglezakis, V. Ion Exchange and Adsorption Fixed Bed Operations for Wastewater Treatment—Part I: Modeling Fundamentals and Hydraulics Analysis. J. Eng. Stud. Res. 2010, 16, 29–41. [Google Scholar]
- Inglezakis, V.J. Ion Exchange and Adsorption Fixed Bed Operations for Wastewater Treatment-Part II: Scale-up and Approximate Design Methods. J. Eng. Stud. Res. 2010, 16, 42–50. [Google Scholar]
- Krumbein, W.C. Measurement and Geological Significance of Shape and Roundness of Sedimentary Particles. J. Sediment. Res. 1941, 11, 64–72. [Google Scholar] [CrossRef]
- Zingg, T. Beitrag Zur Schotteranalyse; ETH Zürich: Zurich, Switzerland, 1935. [Google Scholar]
- Hu, Q.; Yang, X.; Huang, L.; Li, Y.; Hao, L.; Pei, Q.; Pei, X. A Critical Review of Breakthrough Models with Analytical Solutions in a Fixed-Bed Column. J. Water Process Eng. 2024, 59, 105065. [Google Scholar] [CrossRef]
- Thomas, H.C. Heterogeneous Ion Exchange in a Flowing System. J. Am. Chem. Soc. 1944, 66, 1664–1666. [Google Scholar] [CrossRef]
- Yan, G.; Viraraghavan, T.; Chen, M. A New Model for Heavy Metal Removal in a Biosorption Column. Adsorpt. Sci. Technol. 2001, 19, 25–43. [Google Scholar] [CrossRef]
- Yoon, Y.H.; Nelson, J.H. Application of Gas Adsorption Kinetics I. A Theoretical Model for Respirator Cartridge Service Life. Am. Ind. Hyg. Assoc. J. 1984, 45, 509–516. [Google Scholar] [CrossRef] [PubMed]
Disclaimer/Publisher’s Note: The statements, opinions and data contained in all publications are solely those of the individual author(s) and contributor(s) and not of MDPI and/or the editor(s). MDPI and/or the editor(s) disclaim responsibility for any injury to people or property resulting from any ideas, methods, instructions or products referred to in the content. |
© 2025 by the authors. Licensee MDPI, Basel, Switzerland. This article is an open access article distributed under the terms and conditions of the Creative Commons Attribution (CC BY) license (https://creativecommons.org/licenses/by/4.0/).