3.1. [C8C1Im][BF4] Adsorbed on ZnO (0001) at RT and ZnO () at −150 °C
[C
8C
1Im][BF
4] was deposited on the ZnO (0001) substrate at room temperature and then cooled to −150 °C, whereas the ZnO (
) substrate was cooled to −150 °C prior to [C
8C
1Im][BF
4] deposition. The core level XPS of [C
8C
1Im][BF
4] on ZnO (0001) and ZnO (
) are shown in
Figure 2, and a summary of fitted peaks and assignments is shown in
Table 1. On the ZnO (0001) surface, the IL appears to be deposited intact. On the ZnO (
) surface, the XPS results suggest a different species is deposited on the surface. We propose this species is a carbene–borane adduct formed in the evaporator, as discussed further below.
Table 1.
Summary of fitted peaks for [C8C1Im][BF4] on ZnO (0001) and on ZnO ().
Table 1.
Summary of fitted peaks for [C8C1Im][BF4] on ZnO (0001) and on ZnO ().
| Region | BE (eV) (±0.1 eV) | Assignment |
|---|
| | | | |
|---|
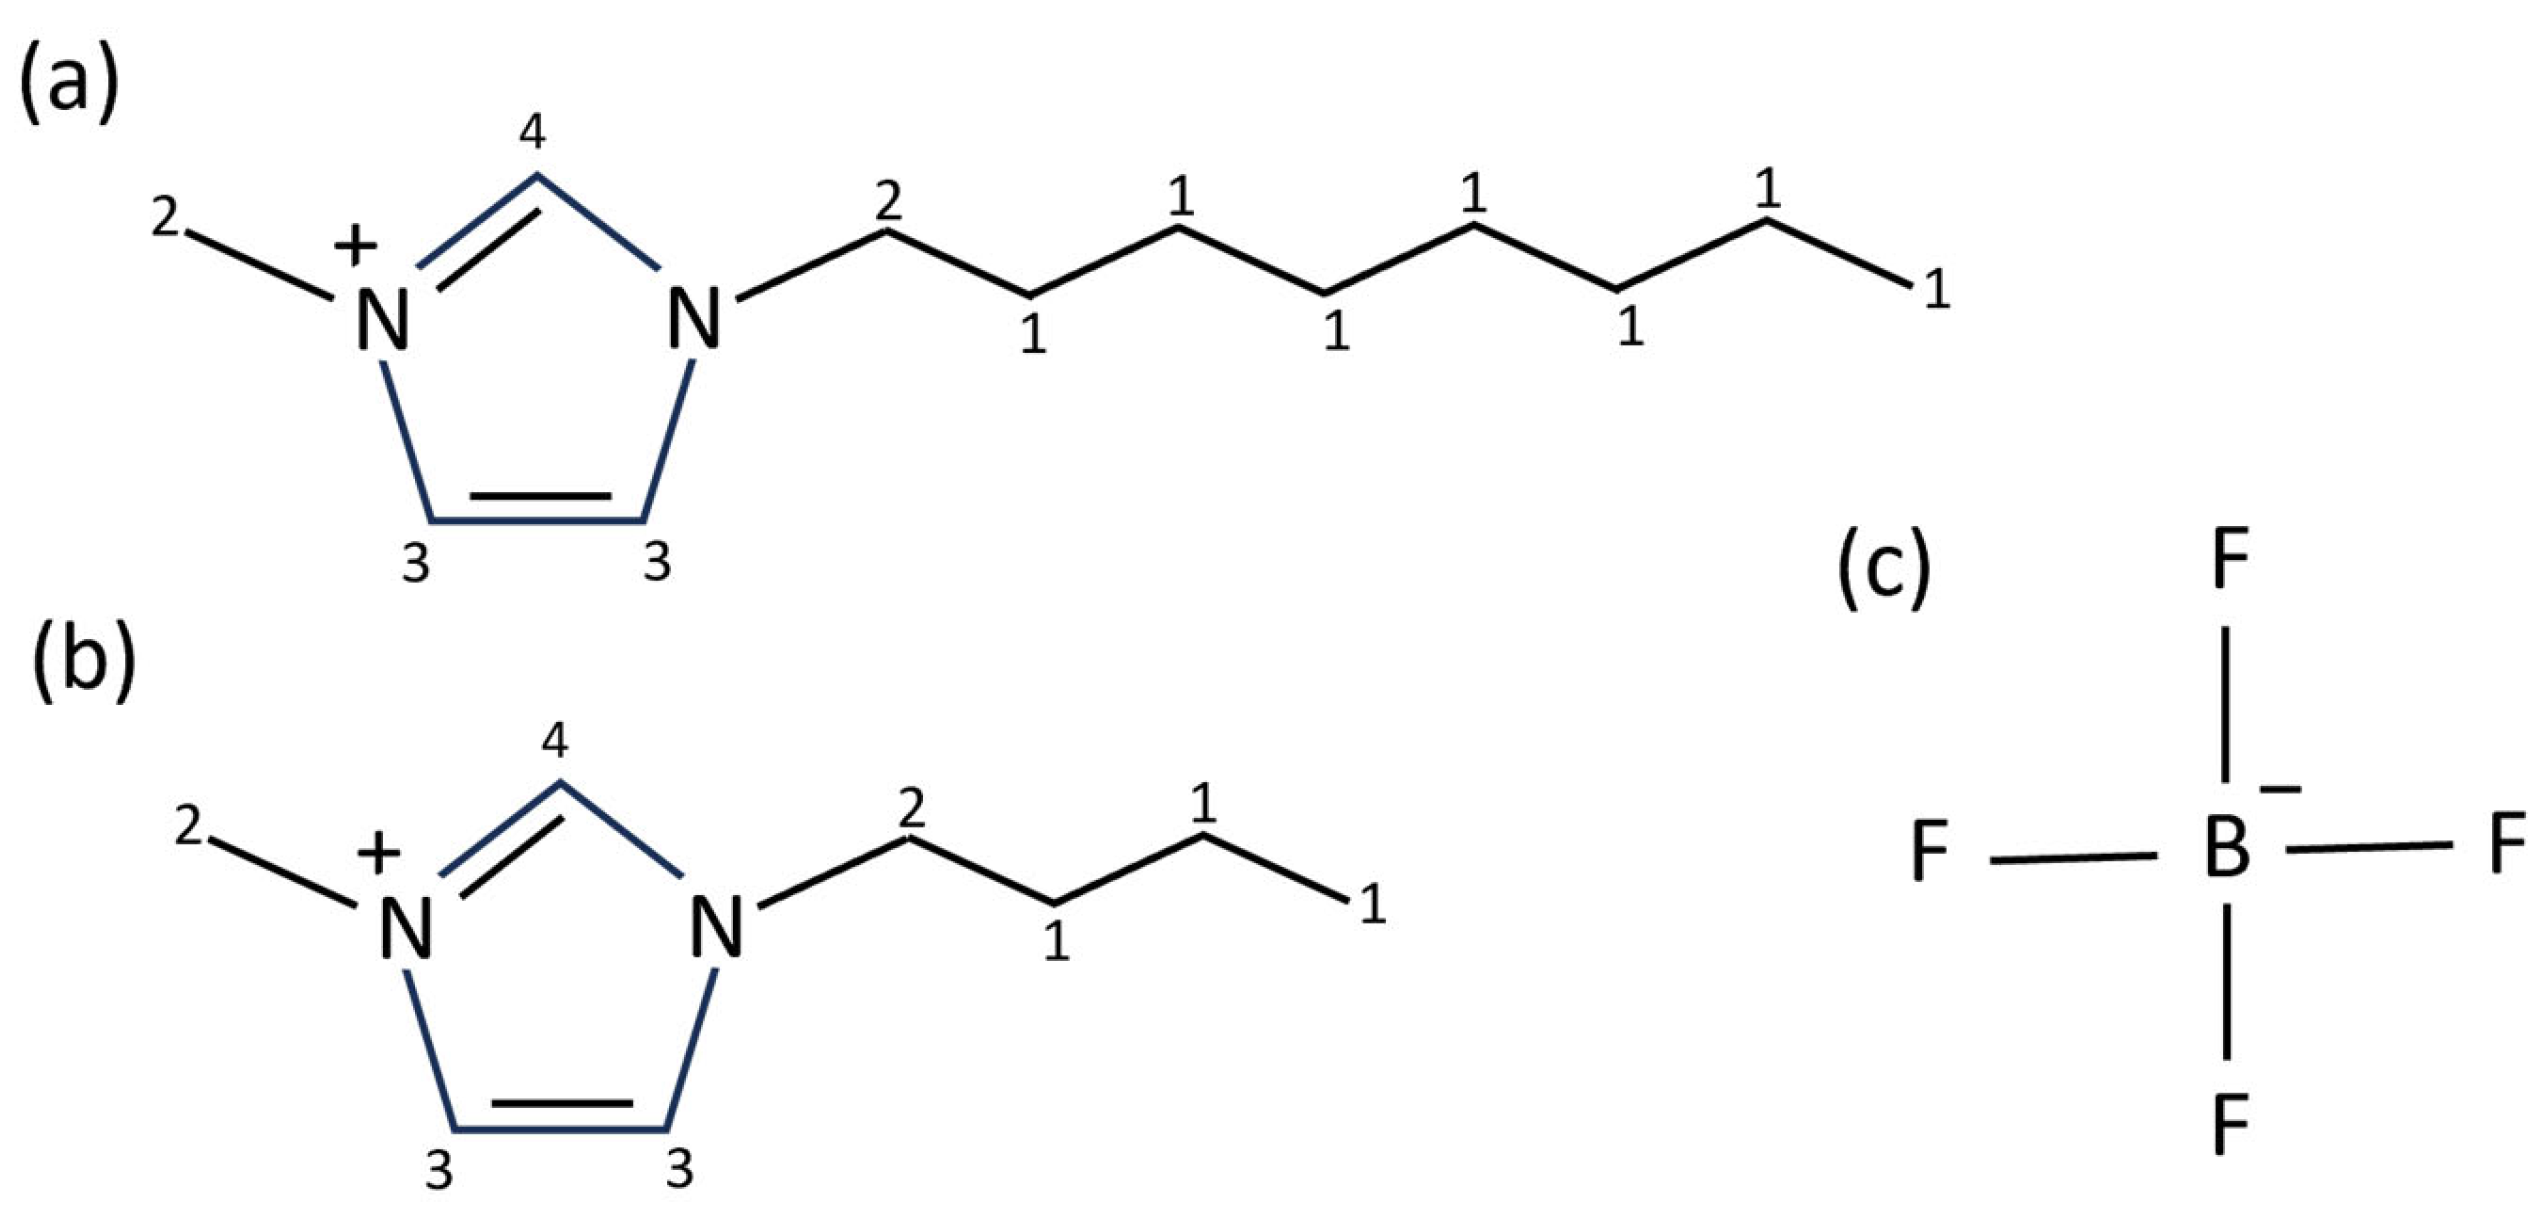
| C 1s | 284.6 | 283.8 | C1 in Figure 1a * |
| 286.2 | 285.1 | C2 + C3 in Figure 1a * |
| 287.8 | 286.5 | C4 in Figure 1a |
| | 288.0 | CO/C attached to BF3 in adduct |
| N 1s | 398.6 | 397.6 | Decomposition/beam damage |
| 399.7 | 398.6 | Decomposition/beam damage |
| 401.6 | 399.8 | N atoms in [C4C1Im]+ cation |
| | 401.5 | Decomposition |
| | 403.2 | Decomposition |
| F 1s | | 684.4 | F atom in BF3 in adduct |
| 685.7 | 685.9 | F atoms in [BF4]− anion |
| B 1s | | 190.6 | Decomposition product |
| | 191.8 | B atom in BF3 in adduct |
| 192.7 | 192.9 | B2O3 |
| 194.3 | 194.3 | B atom in [BF4]− anion |
The C 1s spectra for [C
8C
1Im][BF
4] on ZnO (0001) and ZnO (
) are shown in
Figure 2. For [C
8C
1Im][BF
4] on ZnO (0001), three peaks are fitted at 284.6 eV, 286.2 eV and 287.8 eV. The most intense peak at 284.6 eV is attributed to carbon atoms in the alkyl chain of the imidazolium cation (carbon 1 in
Figure 1a (C1)). The peak at 286.2 eV is attributed to carbon atoms that are attached to one N atom in the imidazolium cation (carbons 2 and 3 in
Figure 1a (C2 + C3)). The peak at 287.8 eV is attributed to the carbon atom between the two N atoms in the imidazolium cation (carbon 4 in
Figure 1a (C4)). The BE of these features are in good agreement with the values in the literature for this IL [
29]. This indicates that the [C
8C
1Im]
+ ion adsorbs intact without dissociation on the (0001) surface. For [C
8C
1Im][BF
4] on ZnO (
), four peaks are required to produce a good fit to the data. These peaks are fitted at 283.8 eV, 285.1 eV, 286.5 eV and 288.0 eV. We assign the peaks at 283.8 eV, 285.1 eV and 286.5 eV to be the same carbon environments described for the ZnO (0001) surface but shifted to lower binding energies. The shift could be due to relaxation effects during photoemission, which will be different for the two surfaces, or it could be that the IL has decomposed into another species (discussed below). The peak at 288.0 eV could be due to CO that adsorbed on the surface when it was cooled prior to deposition or from a decomposition species. For the (
) surface, we also observe an increase in intensity of the higher BE peaks relative to the alkyl chain peak (at 283.8 eV) when compared to the (0001) surface, which could be further indication of a decomposition species on the surface. If there is some intact IL on the surface, it is likely to adopt a different structure on the two surfaces. The IL was deposited at −150 °C on the (
) surface, where the IL is likely to form snow-like layers. The IL was deposited at room temperature on the (0001) surface, where the IL is liquid and can adopt a favourable structure before being frozen. It has been reported in the literature that this IL often orientates with its alkyl chains facing outwards towards the vacuum with the ring part of the cation residing beneath it [
30,
31,
32,
33] (see schematic model in
Figure 4). The fact that the ZnO (0001) surface is polar may affect the ordering of the IL, possibly causing it to self-assemble as it aligns with the electric field of the substrate.
A paper by A.W. Taylor et al. [
34] showed that refluxing [C
4C
1Im][BF
4] or [C
8C
1Im][BF
4] at high temperatures under vacuum for extended periods of time resulted in the formation of a carbene–borane adduct (a borane-substituted imidazol-2-ylidene), in which the acidic H on the imidazole was replaced by BF
3 to produce 1-alkyl-3-methylimidazolium-2-trifluoroborate with elimination of HF (
Figure 3). If this adduct was present on the ZnO (
) surface could explain the difference between the C 1s spectra. The overall carbene–borane adduct is neutral, and this could account for the observed shift to lower binding energies in the ZnO (
) spectra. The carbon atom attached to the BF
3 in the carbene–borane adduct would give rise to a high BE peak, which could explain the additional peak at 288.0 eV fitted to the ZnO (
) spectra. There could be a combination of the carbene–borane adduct and IL contributing to the C 1s spectrum. This adduct could have emanated directly from the evaporator, with the vapour emitted from the evaporator containing a mixture of the IL, adduct and HF. Since the ZnO (
) surface was at −150 °C during deposition, it is more likely the adduct would stick to the surface, whereas the ZnO (0001) surface was at room temperature during deposition, where the adduct is less likely to stick (the adduct has a higher vapour pressure than the IL). In addition, the deposition time for the IL/ZnO (
) experiment was longer than that for the IL/ZnO (0001) experiment, so it may be more likely that the adduct formed in the evaporator and adsorbed on the ZnO (
) surface. Alternatively, it might be possible that the deposited IL reacted with the ZnO (
) surface forming the carbene–borane adduct, whereas it remained intact on the less reactive ZnO (0001) surface. However, the ZnO (
) surface was at −150 °C during IL deposition, so a reaction with the surface is energetically unlikely.
The N 1s spectra for [C
8C
1Im][BF
4] on ZnO (0001) and ZnO (
) are shown in
Figure 2. For [C
8C
1Im][BF
4] on ZnO (0001), three peaks are fitted at 398.6 eV, 399.7 eV and 401.6 eV. The most intense peak at 401.6 eV is attributed to nitrogen atoms in the [C
8C
1Im]
+ cation [
29,
35]. This value is in line with BE values in the literature for analogous ILs [
29]. The [C
8C
1Im]
+ cation consists of two nitrogen atoms, which are chemically equivalent due to resonance [
29], and thus produce one signal in the N 1s region. The smaller peaks at 398.6 eV and 399.7 eV could arise from the decomposition of the IL on the surface. If the carbene–borane adduct is a decomposition product, the N atoms in the adduct are likely to produce a peak at lower binding energy than the N atoms in the IL since they have a relatively more negative charge. Alternatively, these lower BE peaks could arise from beam damage that occurred whilst taking measurements under the X-ray beam. For [C
8C
1Im][BF
4] on ZnO (
), five peaks are fitted to the N 1s spectrum at binding energies of 397.6, 398.6, 399.8, 401.5 and 403.2 eV. Due to the broad nature of the spectrum, it is difficult to fit peaks and make assignments with confidence. In the C 1s spectra, a shift to lower binding energy by approximately 1 eV was observed on the (
) surface relative to the (0001) surface, so one might expect a similar trend with the N 1s spectra. Therefore, the peak at 399.8 eV could be attributed to nitrogen atoms in the [C
8C
1Im]
+ cation, which was assigned at 401.6 eV on the ZnO (0001) surface (although this is a larger shift than observed with the C 1s spectra). On the (0001) surface, the [C
8C
1Im]
+ cation peak was the most intense, but on the (
) surface, its relative intensity is decreased, and the peak at 397.6 eV is the most intense. The number of N environments on the (
) surface suggests that the imidazolium ring could have broken up, with nitrogen atoms possibly attaching to the ZnO surface. If the carbene–borane adduct is present on the surface, there could be a combination of the IL, the carbene–borane adduct and other degradation products contributing to the N 1s spectrum.
The F 1s spectra for [C
8C
1Im][BF
4] on ZnO (0001) and ZnO (
) are shown in
Figure 2. For [C
8C
1Im][BF
4] on ZnO (0001), one peak is fitted at a binding energy of 685.7 eV. The BE of this peak is consistent with F atoms in the [BF
4]
− anion [
29], indicating that the IL is intact on the surface, which agrees with the C 1s data. The F 1s spectrum for [C
8C
1Im][BF
4] on ZnO (
) is broader than for the ZnO (0001) surface. It has been fitted with two peaks of similar intensity at 684.4 eV and 685.9 eV. The peak at 685.9 eV is assigned to the F atoms in the [BF
4]
− anion, as with the (0001) surface. The presence of an additional chemical species on the surface supports the C 1s and N 1s data, and we therefore assign the peak at 684.4 eV to F atoms in the BF
3 environment in the carbene–borane adduct. If the IL has decomposed, the F 1s spectrum could encompass a range of peaks at slightly different BEs, where F atoms could be bonded to C atoms or Zn atoms in the substrate. When the IL converts to the carbene–borane adduct, HF is also produced in the reaction. It is possible that HF impinging on the sample from the evaporator might stick to the surface at −150 °C. It has been shown that HF can adsorb on a Au (110) surface at −173 °C, giving rise to a F 1s peak at higher BE than the [BF
4]
− anion, which can easily desorb upon heating to −100 °C [
36]. We see no evidence of a higher BE peak in our spectra, suggesting that the HF does not stick to the ZnO surface at −150 °C. If HF impinges on the walls of the UHV chamber during dosing, it might displace H
2O and CO from the chamber walls, hence removing HF from the gas phase (resulting in no detectable HF signal on the surface) but increasing the flux of H
2O and CO hitting the surface.
The B 1s spectra for [C
8C
1Im][BF
4] on ZnO (0001) and ZnO (
) are shown in
Figure 2. For [C
8C
1Im][BF
4] on ZnO (0001), two peaks have been fitted at 192.7 eV and 194.3 eV. The most intense peak at 194.3 eV is consistent with the B atom in the [BF
4]
− anion [
29]. We propose that the smaller peak at 192.7 eV arises from dissociation of [BF
4]
− anions where B atoms attach to O
2− ions, which are exposed at step edges of the triangular islands and pits on the ZnO (0001) surface. This binding energy is consistent with B atoms in a B
2O
3 environment [
37]. A reaction of the [BF
4]
− ion with OH groups on the surface might also have occurred, forming HF. However, this would desorb from the surface at room temperature, so it would not be visible in spectra. For [C
8C
1Im][BF
4] on ZnO (
), the spectrum has been fitted with four peaks at 190.6 eV, 191.8 eV, 192.9 eV and 194.3 eV. The peaks at 192.9 eV and 194.3 eV are assigned to B
2O
3 and [BF
4]
−, respectively, as with the ZnO (0001) surface. We assign the intense peak at 191.8 eV to the B atom in the BF
3 environment in the carbene–borane adduct. This B atom has a negative charge, so it will be far more negative than the B atom in the [BF
4]
− anion; therefore, we expect a peak at a lower binding energy. The small peak at 190.6 eV is likely to arise from another decomposition product.
The O 1s spectra for [C
8C
1Im][BF
4] on ZnO (0001) and ZnO (
) are shown in
Figure S4 and summarised in
Table S2 of the Supporting Information. Both spectra are fitted with 3 peaks corresponding to oxygen atoms in the ZnO surface, surface hydroxyl groups (OH) and molecular adsorbed water (H
2O). This is discussed further in the
SI.
In summary, the XPS data show a clear difference in the IL thin films that were deposited on the two ZnO surfaces, as illustrated by a schematic model in
Figure 4. [C
8C
1Im][BF
4] adsorbs mostly intact on the ZnO (0001) surface at room temperature before being cooled to −150 °C for measurement. There is some dissociation of [BF
4]
− anions, resulting in boron atoms attaching to the oxygen atoms in the ZnO surface and forming B
2O
3. H
2O is present in the thin film, which may have adsorbed when the sample was cooled. OH groups are also present, which is typical for ZnO. The deposition of [C
8C
1Im][BF
4] on the ZnO (
) surface at −150 °C resulted in the appearance of more chemical environments in the XPS spectra. We propose that the high temperature of the IL evaporator for an extended period of time caused some conversion of [C
8C
1Im][BF
4] to a carbene–borane adduct, producing a flux of both the IL and adduct vapours, which stuck to the ZnO (
) surface at low temperature. The adduct does not stick to surfaces at room temperature due to its high vapour pressure, so the adduct was not visible in the spectra for the ZnO (0001) surface where deposition occurred at room temperature. Since the ZnO (
) surface was cooled prior to deposition, H
2O, CO and OH species were already present on the surface, and more H
2O is likely to have adsorbed with the IL/adduct film during deposition. As with the ZnO (0001) surface, there is dissociation of [BF
4]
− anions forming B
2O
3 at the surface. In this experiment, measurements were only taken at −150 °C. More information could be obtained from a film that is deposited at a low temperature and heated until the IL desorbs. The subsequent experiment at ASTRID2 synchrotron follows the evolution of an IL film deposited on ZnO (0001) as it is heated from −150 °C to 200 °C.
3.2. Adsorption and Desorption of [C4C1Im][BF4] on Polar ZnO (0001)
A summary of fitted peaks and assignments for the temperature study of [C
4C
1Im][BF
4] on ZnO (0001) is shown in
Table 2. The C 1s spectra at NE and GE for [C
4C
1Im][BF
4] on ZnO (0001) at −150 °C, −80 °C, room temperature (RT), 88 °C and 200 °C are shown in
Figure 5 (NE on left panel, GE on right panel). The inset on the right panel of
Figure 5 shows the NE and GE spectra at each temperature overlaid to highlight differences upon heating (NE solid lines, GE dotted lines). The shape of the region should be similar to that of the analogous [C
8C
1Im][BF
4], but because the [C
4C
1Im]
+ cation has a shorter alkyl chain, the lowest BE peak has a smaller relative intensity [
29,
38]. At −150 °C, for both the NE and GE spectra, the C 1s spectra are fitted with four peaks at binding energies of 284.4 eV, 286.2 eV, 287.0 eV and 288.3 eV. The largest peak at 284.4 eV can be assigned to the alkyl chain of the IL (C1 in
Figure 1b), in agreement with the literature [
29,
35]. The peak at 286.2 eV arises from carbon atoms bonded to a nitrogen atom, C2 and C3 in
Figure 1b. The peak at 287.0 eV arises from the carbon atom between the two nitrogen atoms in the imidazolium ring, C4 in
Figure 1b. There is a small peak at 288.3 eV, which is more intense at NE than GE. This indicates that the C species is beneath the IL layers rather than at the surface since the NE spectra are more sensitive to signals from deeper within the sample. This signal could be due to contaminant CO adsorbed at the IL/ZnO interface. The clean ZnO substrate was cooled to −150 °C prior to depositing IL, and CO tends to adsorb onto oxide surfaces at low temperatures (<−120 °C) [
39,
40]. According to the structure of [C
4C
1Im][BF
4], shown in
Figure 1b, the ratio of the C1 peak to the C2+C3 peak should be 3:4, so we would expect the C2,3 peak to have a larger intensity in the C 1s spectrum. However, the spectra show that the C2,3 peak has a lower intensity than the C1 peak. Due to the short mean free path at this energy, the orientation of a big molecule can lead to attenuation of a lower part of the molecule relative to an upper part. Here, the ring part of the cation is attenuated by other parts of the IL (either the alkyl chain of the cation or the anion). If the deposited layer contained any carbene–borane adduct from the evaporator (discussed in the [C
8C
1Im][BF
4] data, above), the C 1s spectrum would be largely similar, so it would be difficult to distinguish.
Figure S5 in the SI shows the C 1s data at NE prior to normalisation. On heating the sample from −150 °C to −80 °C, the intensity of the C 1s signal increases by over 2 times, implying more C species at the surface. This is consistent with the evaporation of water from the surface, leaving the [C
4C
1Im]
+ cations and [BF
4]
− anions closer together and in contact with a stabilised water layer. At −80 °C, the shoulder at 288.3 eV disappears for both NE and GE. This indicates that the CO has desorbed, presumably escaping through the IL layer to the vacuum. At −80 °C, there is a shift to higher BE of the alkyl C1 peak at NE by approximately 0.2 eV (this shift can be seen clearly in the inset of
Figure 5 by comparing the blue solid line (NE) to the blue dotted line (GE)).
Table S3 in SI shows the BEs of fitted peaks as the sample is heated. This shift could be indicative of a phase transition of the IL from a glassy solid to a liquid and/or the change in interaction with the strongly bound, stabilised water layer. A phase transition to a liquid would allow any CO that was adsorbed at the ZnO surface to diffuse through. At this temperature, the ratio of the C1 peak to the C2,3+C4 peaks changes, with the C2,3+C4 peaks becoming relatively more intense. We propose that at −150 °C, the [BF
4]
− anion is located above the imidazolium rings and attenuates the C2,3+C4 signal, but by −80 °C, the ions have moved, and the imidazolium rings are located above the [BF
4]
− ions, making the C2,3+C4 signal relatively larger. This indicates that the [BF
4]
− ions preferentially move closer to the Zn
2+ ions at the ZnO surface, possibly creating a layered Zn
2+/[BF
4]
−/[C
4C
1Im]
+ structure.
As the sample is heated to room temperature (RT), the C 1s signal decreases (
Figure S5 in SI). This could indicate some desorption of IL from the surface, but this would be a very low temperature for IL to desorb. It is more likely that the IL is coalescing into islands on the surface as it becomes liquid. Islands are formed when the surface energy (surface tension) of the IL is greater than the interfacial energy between the IL and the ZnO surface and a balance is established. Several studies have shown that ionic liquids can form island structures on metal surfaces [
41,
42,
43,
44]. The islands have a smaller footprint on the surface than the layered structure, and since we are still probing the same depth of material, this gives a lower intensity signal. The presence of islands exposes parts of the ZnO surface. It is also likely that the adsorption of [C
8C
1Im][BF
4] on ZnO (0001) at RT forms islands (ANTARES experiments,
Figure 4), and these islands are frozen solid on cooling to −150 °C for analysis. At RT, the C1 peak shifts further to higher BE for both the NE and GE spectra, with the C1 peak now fitted at 284.8 eV for both spectra. The C2,3 peak remains at approximately the same BE. The BE separation between the alkyl peak and the C2,3 peak is reduced by ~0.4 eV compared to the separation at −150 °C. This is consistent with a major structural change on the surface, such as island formation. Similar changes in BE following a phase transition have previously been reported for an imidazolium-based IL on a metal surface [
43]. At RT, there is a significant difference in the relative intensity of the C1 alkyl peak and the C2,3+C4 peaks between GE and NE, with the C1 peak being relatively more intense at GE. Since GE spectra are more surface-sensitive than NE spectra, this is indicative of a preferential orientation of the alkyl chains pointing out towards the vacuum with the ring part of the cation residing beneath it. This has been reported previously for this IL on various substrates [
30,
31,
32,
33].
As the sample is heated to 88 °C, the C 1s signal drops dramatically (
Figure S5 in SI) as the IL desorbs from the surface, along with any carbene–borane adduct. There is a change in the shape of the C 1s region, which evolves from being composed of two distinct features to one asymmetrical feature with maximum intensity at ~284.6 eV. The shape of the spectra at GE and NE are similar. This indicates that the layered structure found at RT (alkyl chains towards vacuum, rings underneath) is no longer present and that some chemical changes have occurred in the remaining material, resulting in new carbon species on the surface. This change in the shape of the spectra suggests there are likely to be several decomposition species present on the surface; therefore, peaks have not been fitted to these spectra. Babucci et al. [
45] demonstrated that [C
4C
1Im][BF
4] in contact with ZnO powder decomposes when the system is kept at a constant temperature of 250 °C for periods of 6, 10 and 24 h, resulting in higher levels of decomposition for the longer time periods. In our data, it appears that at 88 °C, we are already observing decomposition of [C
4C
1Im][BF
4], which suggests the ZnO (0001) surface has a catalytic effect on the reaction.
As the surface is heated to 200 °C, there is a further decrease in intensity of the C 1s signal at NE (
Figure S5 in SI), indicating that more material has desorbed from the surface. There is very little change in the shape of the C 1s spectrum at NE, suggesting that the chemical decomposition on the surface has finished. A possible decomposition mechanism for [C
4C
1Im][BF
4] is C-N bond cleavage at either the methyl or butyl group attached to the imidazolium ring, which causes the IL to break down into a variety of hydrocarbon species [
46]. Combined with decomposition of the anion, various alkylfluoride species (such as 2-propylfluoride and 1-fluorobutane) could also be formed [
47]. However, any small molecules such as these would desorb at this high temperature and not be visible in the spectrum. The organic material remaining on the surface is likely to be polymeric since it is relatively stable at 200 °C. The formation and desorption of such small molecules would explain the continued reduction in C 1s intensity whilst the polymerisation of the remaining surface occurs.
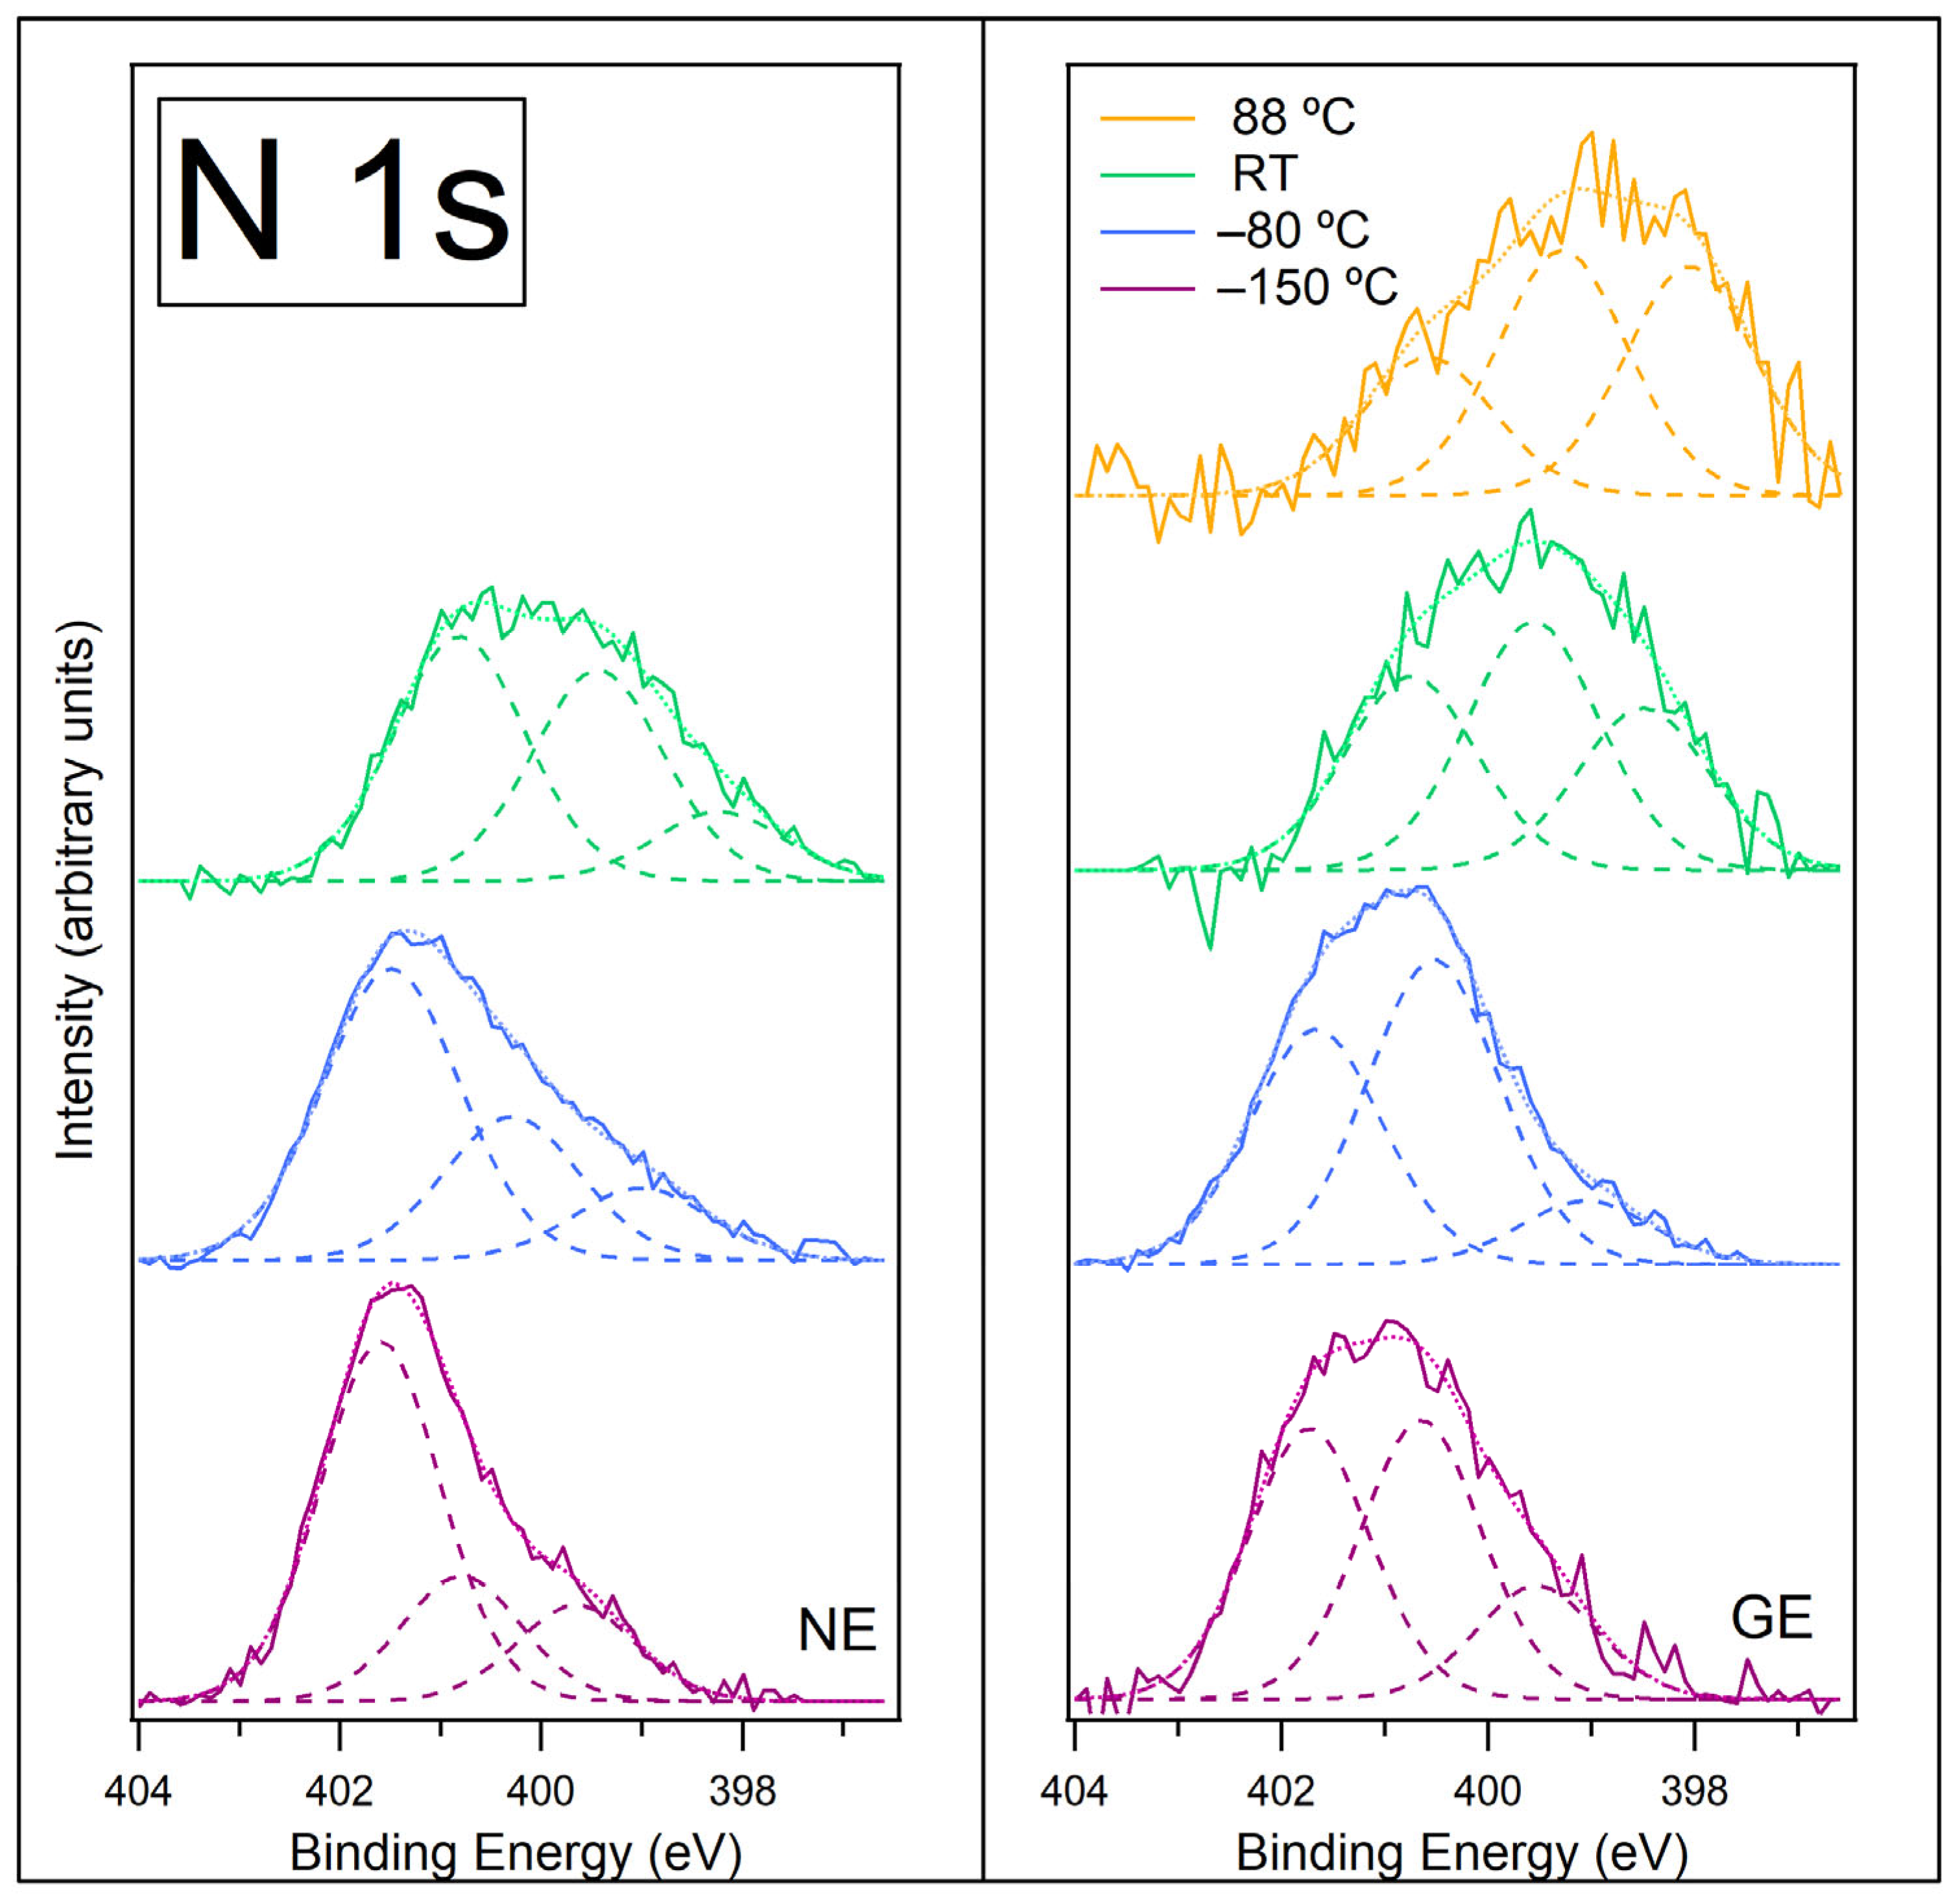
The N 1s spectra at NE and GE for [C
4C
1Im][BF
4] on ZnO (0001) at −150 °C, −80 °C, room temperature (RT) and 88 °C are shown in
Figure 6 (NE on left panel, GE on right panel). At −150 °C, the NE spectrum is fitted with three peaks at 399.7 eV, 400.8 eV and 401.6 eV (GE spectrum is fitted with three peaks at similar BEs; see
Table S4 in SI for a summary of all fitted peaks). The most intense peak at 401.6 eV is attributed to nitrogen atoms in the [C
4C
1Im]
+ cation, which agrees with data presented for [C
8C
1Im][BF
4] on ZnO (0001) and ZnO (
) and with the literature [
29,
35]. The other two peaks suggest that some decomposition of the IL may have occurred. The lower BE peaks are relatively more intense in the GE spectrum, suggesting these species reside in the top-most layers of the IL. Since the IL was deposited at −150 °C, thermal decomposition is unlikely. We suggest these lower BE peaks could arise from beam damage that occurred whilst taking measurements under the X-ray beam. It is also possible that one of these peaks may be due to the carbene–borane adduct adsorbed from the evaporator.
Figure S6 in the SI shows the N 1s data at GE prior to normalisation. On heating from −150 °C to −80 °C, the intensity of the N 1s signal increases by over 2 times, implying more N species at the surface. This is consistent with the evaporation of water from the surface, leaving the [C
4C
1Im]
+ cations and [BF
4]
− anions closer together and in contact with a stabilised water layer. At −80 °C, the shape of the spectra remains similar, but the lower BE peaks become relatively more intense. As with the −150 °C data, the lower BE peaks are relatively more intense in the GE spectrum, suggesting these species reside in the top-most layers of the IL. The increase in intensity of the lower BE peaks could be indicative of further beam damage, or this could be due to beam damage that was previously frozen in position throughout the layer at −150 °C, now diffusing upward to the surface as the IL starts to melt. The peak assigned to N atoms in the [C
4C
1Im]
+ cation is still fitted at the same BE; however, the lower BE peaks have shifted to lower BEs. The shifts in BE could coincide with a phase transition of the IL from a glassy solid to a liquid and/or the change in interaction with the strongly bound stabilised water layer. If one of these lower BE peaks is the adduct, then the shift could be due to the change in chemical environment as most of the water desorbs.
As the sample is heated to room temperature (RT), the N 1s signal decreases significantly (by ~73% of its intensity at −80 °C,
Figure S6 in SI), as observed with the C 1s signal. The spectra also change shape, with lower BE peaks becoming more prominent. This is consistent with the formation of islands on the surface, leaving large areas between the droplets covered in beam damage products. The spectra are difficult to fit with any certainty, but it appears that the peak assigned to N atoms in the [C
4C
1Im]
+ cation at approximately 401.6 eV has shifted to 400.8 eV. This BE shift could be due to the IL going through a phase change and forming islands. The three peaks are now fit at 398.2 eV, 399.4 eV and 400.8 eV (at NE).
Heating to 88 °C (only recorded for GE) causes the N 1s signal to decrease further (a decrease of ~23% of its intensity at RT,
Figure S6 in SI), indicating the desorption of the IL islands and any carbene–borane adduct. The spectrum is shifted to even lower BEs, suggesting there is very little/no IL cation left on the surface. This leaves the ZnO surface covered with degradation products, which are likely to be polymeric. The small change in the N 1s intensity upon heating to 88 °C indicates that the small footprint of the IL islands has little effect on the signal when removed, so the changes observed in the spectrum are primarily changes to the degradation products that cover most of the surface.
The F 1s spectra at NE and GE for [C
4C
1Im][BF
4] on ZnO (0001) at −150 °C, −80 °C, room temperature (RT), 88 °C and 200 °C are shown in
Figure 7 (NE on left panel, GE on right panel). At −150 °C, the NE spectrum is fitted with three peaks at 682.7 eV, 684.4 eV and 685.4 eV (GE spectrum is fitted with three peaks at similar Bes; see
Table S5 in SI for a summary of all fitted peaks). The main feature of the spectrum (centred at ~684.7 eV) looks symmetrical, so one might be inclined to fit just one peak here. However, the full width half maximum (FWHM) of this feature is rather broad, so to be consistent with the FWHM of peaks fitted to other regions, it requires more than one fitted peak. The peaks fit to the C 1s spectrum at −150 °C (where the peak at 285 eV is very clearly defined) have a FWHM of ~1.5 eV, and this is the typical FWHM across the different regions. The three fitted F 1s peaks shown in
Figure 7 have a FWHM of ~1.7 eV, which is slightly larger than the FWHM across other regions but seems appropriate to avoid “over-fitting” the spectrum with more peaks. The peak at 685.4 eV is assigned to F atoms in the [BF
4]
− anion [
29], in reasonable agreement with data presented for [C
8C
1Im][BF
4] on ZnO (0001) in the ANTARES experiment. We believe the [BF
4]
− ions reside in a water layer near the surface of the IL (evidence for this is presented in the B 1s discussion). We assign the peak at 684.4 eV to a decomposition product and/or from the carbene–borane adduct adsorbed from the evaporator. The smallest peak at 682.7 eV is lower in BE than any peaks fit in the ANTARES experiment and on the lower edge of F 1s BEs in the literature. We propose this could be due to a Zn-F bond at the ZnO surface, although the values in the literature for Zn-F are usually found at higher BEs than this.
Figure S7 in the SI shows the F 1s data at NE prior to normalisation. On heating from −150 °C to −80 °C, the intensity of the F 1s signal increases, implying more F species at the surface. This is consistent with the evaporation of water from the surface, leaving the [C
4C
1Im]
+ cations and [BF
4]
− anions closer together and in contact with a stabilised water layer. At −80 °C, the shape of the spectra at NE and GE remain similar, and the same three peaks are fitted to both spectra at similar BEs. This indicates there is very little change in the chemical environments of the F atoms upon heating to this temperature.
As the sample is heated to room temperature (RT), the F 1s signal decreases significantly (by ~55% of its intensity at −80 °C,
Figure S7 in SI), indicating the formation of islands on the surface. The F 1s peak broadens, which could be caused by the IL going through a phase change and forming islands. The F 1s signal decreases by ~55% upon heating to RT, whereas the N 1s signal decreases by about ~73%. This might indicate that island formation is less effective for the F-containing species at RT than it is for the N-containing cation. It is likely the decomposition species/carbene–borane adduct do not form islands and instead they spread out over the surface and lie between the islands of IL. Three peaks are still fitted to both the NE and GE spectra, but now, the lowest BE peak, assigned to a Zn-F bond at the ZnO surface, becomes relatively more intense. This is consistent with the formation of IL islands on the surface, leaving large areas between the droplets covered in Zn-F.
Heating to 88 °C causes the F 1s signal to drop again (a decrease of ~83% of its intensity at RT,
Figure S7 in SI), indicating the desorption of the IL islands and any carbene–borane adduct. There is very little F remaining on the surface at this temperature. The spectrum changes shape, with the lower BE peaks becoming dominant. Further heating to 200 °C causes the F 1s signal to reduce slightly again (
Figure S7 in SI). The peak at 685.4 eV due to F atoms in the [BF
4]
− anion has completely disappeared, indicating that only decomposition products remain on the surface. The peak assigned to Zn-F at the ZnO surface is now the most intense peak. Numerous fluorine-containing species can be formed from the thermal decomposition of [C
4C
1Im][BF
4] [
46,
47]; however, these small molecules would desorb at high temperatures and not contribute to the spectrum. It is difficult to identify what the remaining decomposition species might be.
The B 1s spectra at NE and GE for [C
4C
1Im][BF
4] on ZnO (0001) at −150 °C, −80 °C, room temperature (RT), 88 °C and 200 °C are shown in
Figure 8 (NE on left panel, GE on right panel). Large shifts in BE upon heating caused problems with spectra drifting outside the BE measurement window, and as a result, some spectra were slightly truncated. At −150 °C, both spectra are fitted with one peak at 194.3 eV, consistent with B atoms in the [BF
4]
− anions [
29] and consistent with data presented for [C
8C
1Im][BF
4] on ZnO (0001). The N 1s and F 1s spectra both show clear signs of degradation/beam damage at −150 °C, but the B 1s spectrum does not. The F 1s spectrum is fitted with three chemical environments, so if the [BF
4]
− anions have dissociated to form different F species, one would expect the B 1s spectrum to reflect this. However, if the [BF
4]
− ions reside in a frozen water layer near the surface of the IL, the XPS spectrum is likely to be dominated by a strong signal from the [BF
4]
− ions. There may be other B species throughout the depth of the adlayer, but since the photoelectron energy is low (and therefore very surface-sensitive), we do not detect the buried decomposition material, or alternatively, the BE of these species is very similar to the BE for [BF
4]
−.
Figure S8 in the SI shows the B 1s data at NE prior to normalisation. On heating from −150 °C to −80 °C, the intensity of the B 1s signal decreases, in contrast to the C 1s, N 1s and F 1s signals, which increased when heated to −80 °C. This suggests that at −150 °C, the B atoms were not attenuated by adsorbed water and were located near the vacuum interface. We propose that at −150 °C, the [BF
4]
− anions could reside in a frozen water layer near the surface, giving a relatively stronger intensity. This would involve some of the [BF
4]
− anions moving away from the [C
4C
1Im]
+ cations. This would be a solid-state version of dissolving the IL in water, where each ion moves away from the opposite ion and becomes hydrated. The ions do not have to move far, and the activation energy for diffusion is much lower than chemical reaction, so the [BF
4]
− anions can move even at −150 °C. [BF
4]
− anions that are still associated with [C
4C
1Im]
+ cations may also contribute to the single fitted peak at −150 °C, as the change in environment from [C
4C
1Im]
+ to H
2O is unlikely to affect the B chemical shift in [BF
4]
−. Upon heating to −80 °C, the decrease in intensity is caused by a rearrangement of the ions, implying some [BF
4]
− ions have moved deeper into the adlayer. At this temperature, most of the water has desorbed, and the remaining water is associated with both ions of the IL, forming a stabilised water layer. At −80 °C, the spectra at NE and GE shift slightly to lower BE and become broader towards lower BE. Both spectra are fitted with two peaks at approximately 193.3 eV and 194.2 eV (see
Table S6 in SI for a summary of all fitted peaks). We assign the peak at 194.2 eV to B atoms in the [BF
4]
− anion. The peak at 193.3 eV suggests some decomposition on the surface. The peak at 193.3 eV is relatively more intense in the NE spectra than for the GE spectra, which suggests that this species is more prevalent deeper in the adlayer, closer to the ZnO substrate, rather than at the surface of the IL. This could be a decomposition product, or it could be due to BF
3− in the carbene–borane adduct, which would have a lower BE than [BF
4]
−. If this is due to the adduct (adsorbed from the evaporator with the IL), then the adduct would have mixed with the IL and been overlaid with water. Heating to −80 °C causes a rearrangement in the adlayer, so the adduct could diffuse towards the surface and become more visible. Interestingly, the F 1s spectra showed very little change upon heating from −150 °C to −80 °C, so it is not clear what change is occurring or why the F 1s intensity changes do not match the changes observed for the B 1s.
As the surface is heated to room temperature (RT), the B 1s signal decreases significantly (by ~47% of its intensity at −80 °C,
Figure S8 in SI), in agreement with the decrease observed in the C 1s, N 1s and F 1s signals, indicating the formation of islands on the surface. The % decrease in the B 1s signal is very similar to that seen with the F 1s signal (and much less than the decrease in the N 1s signal), indicating that decomposition species/carbene–borane adducts spread out over the surface and lie between the islands of IL. The spectra broaden further, and three peaks are now required to fit both NE and GE spectra, at approximately 192.8 eV, 193.5 eV and 194.4 eV. The additional peak at 192.8 eV is consistent with the BE of B atoms in a B
2O
3 environment [
37], as we previously assigned for [C
8C
1Im][BF
4] on the ZnO (0001) and ZnO (
) surfaces. This could arise from dissociation of the [BF
4]
− anions where B atoms attach to the O atoms at step edges in the ZnO (0001) surface. The reaction between the ZnO surface and [BF
4]
− produces B
2O
3 and fluorine-containing species, which might be organic or might react with the surface to form Zn-F. The peaks at 194.4 eV and 193.5 eV are again assigned to the [BF
4]
− anion and decomposition/adduct, respectively. The peak at 193.5 eV is more intense at GE, indicating that this species is nearer the surface of the adlayer. If it is the adduct, it may be mixed with the IL and/or between the islands.
Further heating to 88 °C causes the B 1s signal to reduce further (
Figure S8 in SI), indicating the desorption of the IL islands and any carbene–borane adduct. The spectra change shape and shift to lower binding energy. At 88 °C, the component previously assigned to [BF
4]
− (at ~194.4 eV) has completely disappeared, and the peak attributed to decomposition/adduct is reduced in intensity. This indicates that the IL and the adduct have both evaporated from the surface on heating to 88 °C. The peak at ~192.8 eV due to B
2O
3 is relatively more intense. This is most likely due to the removal of the IL overlayer, although some further reaction to produce B
2O
3 may have occurred during heating. A new peak at 192 eV is now visible, which is not easy to identify but is likely to be a decomposition product.
Further heating to 200 °C causes the B 1s signal to reduce further again (
Figure S8 in SI), indicating further desorption of material from the surface. The spectrum is fitted with two peaks at 191.8 eV and 192.8 eV, assigned to decomposition and B
2O
3, respectively.
The most significant changes in the C 1s, N 1s, F 1s and B 1s spectra occur as the surface is heated from room temperature to 88 °C. At 88 °C, all spectra show a reduction in intensity, indicating the desorption of the IL islands and any carbene–borane adduct. The B and F spectra are consistent in showing that the [BF4]− anion of the IL has mostly/completely disappeared at 88 °C. At 88 °C, peaks assigned to degradation products and reactions at the ZnO surface become relatively more intense, indicating that the ZnO surface may catalyse the thermal decomposition of the IL at low temperature.
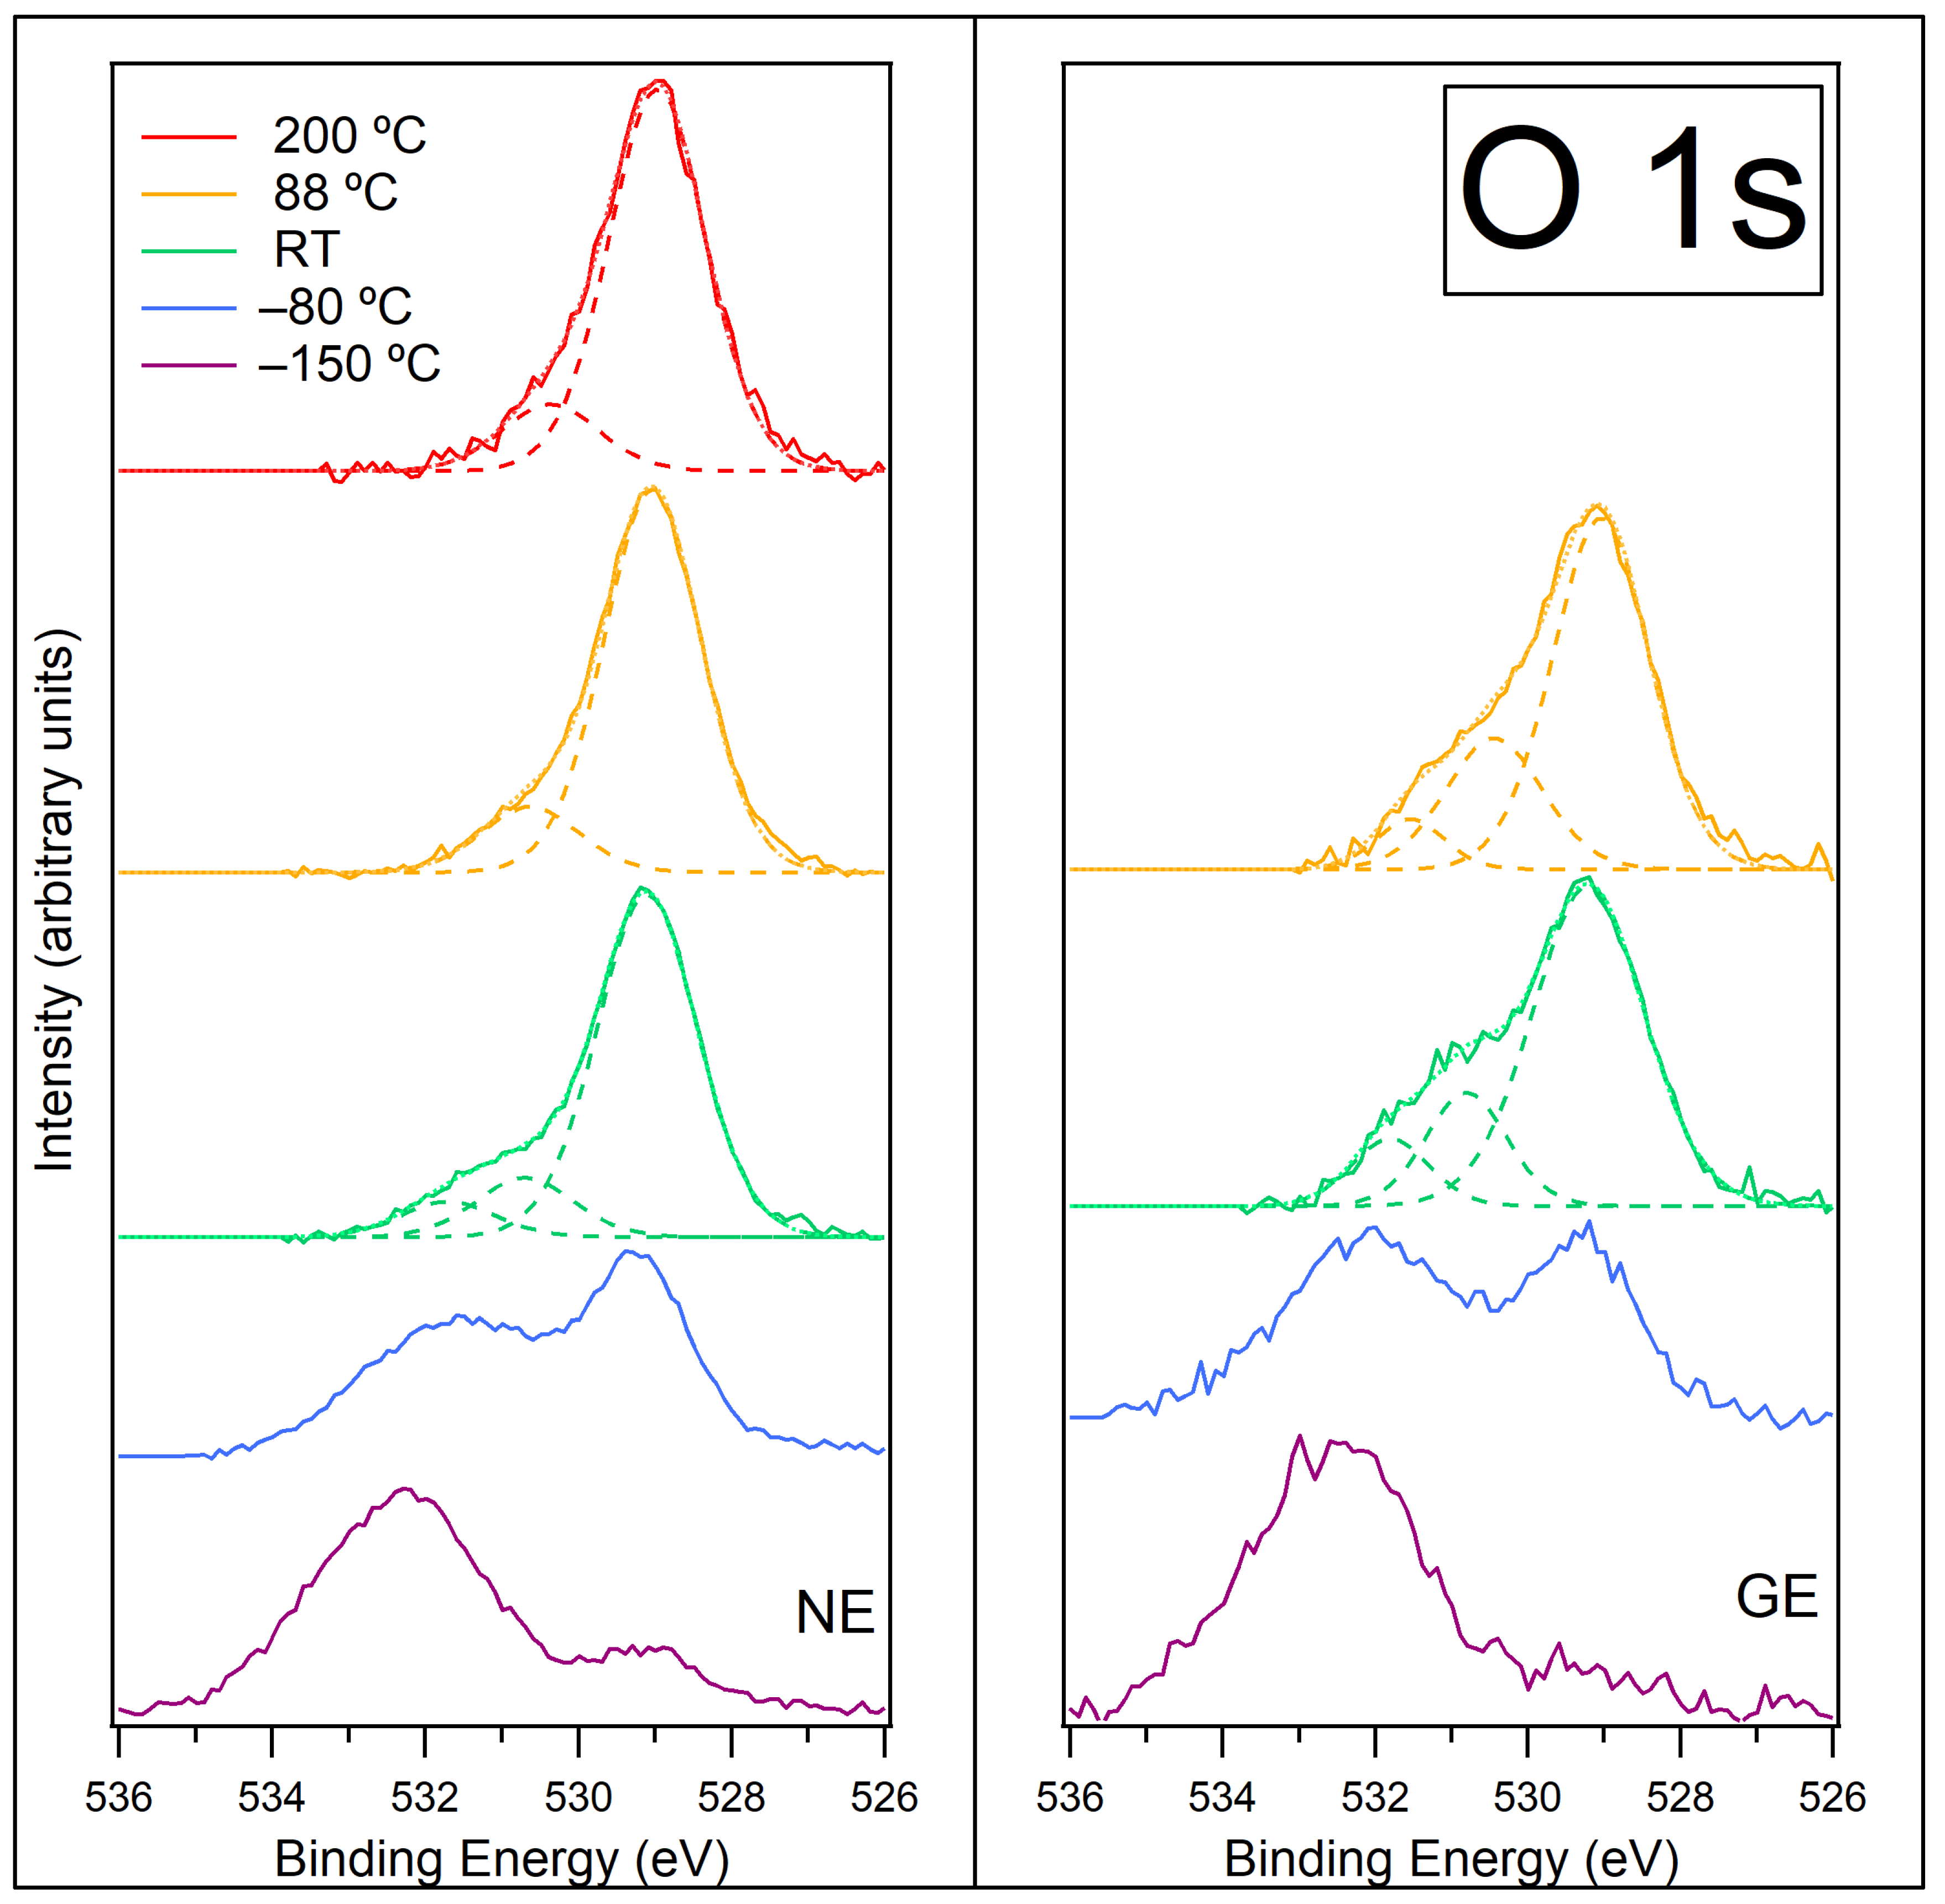
The O 1s spectra at NE and GE for [C
4C
1Im][BF
4] on ZnO (0001) at −150 °C, −80 °C, room temperature (RT), 88 °C and 200 °C are shown in
Figure 9 (NE on left panel, GE on right panel). The spectra at −150 °C and −80 °C are very broad due to several species adsorbing to the surface at low temperatures; therefore, these spectra have not been fitted with peaks.
There are two broad features visible at −150 °C: a large feature at approximately 532.5 eV and a smaller feature at approximately 529 eV. The feature at ~529 eV is assigned to O atoms in the ZnO substrate [
24,
48,
49]. The signal from the ZnO substrate is clearly visible at NE, but the signal is very weak at GE because this measurement does not probe as deep into the adlayer. The feature at ~532.5 eV spans a large BE range and is assigned to overlapping peaks from water and other contaminants, which have condensed onto the surface from the background vacuum during cooling [
50,
51]. The width of this feature makes peak fitting difficult, and it is not clear from the data if the water and other contaminants are located on top of the IL or mixed with the IL. Adsorbed water may be in a variety of chemical states where it is frozen in contact with the [C
4C
1Im]
+ or [BF
4]
− ions in different geometries. This range of different chemical environments will broaden the 532.5 eV feature. We would expect hydroxyl (OH) groups to be present at the ZnO surface, which tend to manifest in the O 1s spectrum at binding energies ~1.4 eV–1.6 eV greater than the substrate O [
48,
49,
50,
52]. However, these are unlikely to contribute much to the 532.5 eV feature as they are low in concentration, and their signal will be attenuated by the overlayer of IL and water (the ZnO signal at 529 eV is very small so the signal from the OH groups attached to the ZnO surface will be tiny). We also expect CO to be adsorbed on the ZnO surface, which typically appears at higher BEs in O 1s spectra [
53,
54,
55]. However, this is also unlikely to contribute much to the 532.5 eV feature because its signal will be attenuated by the overlayer, as with the OH groups. The discussion for the O 1s region of [C
8C
1Im][BF
4] on ZnO (0001) and ZnO (
) (see
SI, Figure S4 and discussion thereof) goes into further details about O 1s assignments. If the IL was deposited at room temperature instead of −150 °C, this would largely eliminate the adsorption of water and other contaminants between the IL layers and would make an interesting comparison to this study.
Figure S9 in the SI shows the O 1s data at NE prior to normalisation. On heating from −150 °C to −80 °C, the feature at ~532.5 eV decreases in relative intensity while the feature at ~529 eV increases in relative intensity. This is due to adsorbed gaseous species desorbing from the surface and O atoms in the ZnO surface becoming more prominent (as they become less attenuated by adsorbed species). This supports the theory of desorption of CO from the ZnO surface as indicated by the C 1s spectrum at −80 °C. Water multilayers are likely to desorb at this temperature, and this will be the main cause of the changes observed in the O 1s spectra [
51,
56]. The absolute intensity of the feature at 532.5 eV is similar to its absolute intensity at −150 °C (
Figure S9 in SI), but it is now shifted to a lower BE. We propose the remaining water is associated with the IL but is now better ordered to the ions, such that the average BE is now lower. Similar behaviour has been previously observed where multilayers of water were found to desorb from an imidazolium-based IL at approximately −90 °C and left a residual monolayer that did not desorb until approximately −30 °C [
56]. At GE, the high binding energy feature is relatively more intense (compared to the ZnO peak) and more defined, which is consistent with the associated water being more abundant in the topmost layers of the IL. It is still unlikely that OH groups or CO will contribute much to the O 1s spectrum at this temperature due to the attenuating overlayer.
As the sample is heated to room temperature (RT), the O 1s signal from the ZnO surface increases further, and the O 1s signal from the adsorbed gaseous species decreases further (
Figure S9 in SI). It now becomes feasible to fit three peaks to the spectra (shown in
Figure 9). The dominant peak at a binding energy of 529.1 eV is assigned to O atoms in the ZnO substrate, and the peak at 530.7 eV is assigned to OH groups. The peak at 531.7 eV could be due to residual H
2O and/or B
2O
3 [
57] (which appeared in the B 1s spectra at RT). The water associated with the IL ions will now be desorbed, so the intensity of the ZnO peak increases as there is less attenuation from the adlayer. In addition, the IL forms islands on the surface at room temperature, which exposes areas of the ZnO substrate. This contributes to the large increase in intensity of the ZnO peak. The formation of islands also exposes the OH groups and B
2O
3, which are adsorbed to the ZnO surface, and they can now be seen in the spectrum as they are no longer attenuated by the overlayer. If any residual H
2O does exist, this could be associated with the ZnO/IL interface, giving a particularly high desorption energy. The OH and B
2O
3/H
2O peaks have a higher relative intensity at GE than at NE, indicating that these species are predominantly present at the shallower probing depth. It is not clear why this would be the case. If the probing depth at GE (~1.0 nm) closely matches the thickness of the film at this temperature, these species might give a relatively more intense peak than at NE, where more of the ZnO substrate is probed.
On heating to 88 °C, the intensity of the signal from the ZnO surface does not change. The IL islands have mostly evaporated from the surface at 88 °C, so the islands must have occupied a small area on the surface for the ZnO intensity to remain unchanged. The signal from the higher BE peaks is reduced further (
Figure S9 in SI). At NE, the peak at 531.7 eV assigned to B
2O
3/H
2O has gone, and the peak assigned to OH has reduced; however, both peaks still remain at GE (
Figure 9). Small amounts of water in ILs are usually removed by heating to ~60–80 °C under UHV [
58,
59], so it is likely the peak at 531.7 eV is now only due to B
2O
3.
On heating to 200 °C, the C, N, F and B peaks all drop to low intensities, indicating that almost the entire adlayer has desorbed. However, the O peak due to the ZnO substrate also drops to about 1/3 of its value at 88 °C (
Figure S9 in SI). This cannot be due to attenuation of the signal, as there is almost no material to attenuate the ZnO substate. Instead, it must be due to a loss of oxygen from the ZnO surface within a mean free path depth. Batyrev et al. studied the ZnO (0001)–Zn terminated surface after reduction at various temperatures using a combination of surface science techniques [
15]. They exposed the clean ZnO surface to 1 × 10
−5 mbar H
2 at temperatures up to 900 K. They found that the electronic structure changed from an n-type semiconductor towards a semi-metallic character. At 227 °C, the subsurface of the ZnO is n-type but with metallic surface states. The authors believe the metallisation of the surface occurred from the reduction of ZnO to metallic Zn and OH. The authors recorded O 1s XPS after reduction in 1 bar H
2 at RT, and this showed a decrease in the intensity of the ZnO substrate peak and an increase in the OH peak. In our study, we did not expose the ZnO surface to H
2 gas, but the decomposed adlayer at 88 °C contained H, C, N, F and B. It is conceivable that O
2− from the ZnO surface could react with the adlayer at high temperature to form H
2O, CO and NO, and all three would desorb, leaving a Zn rich surface. Batyrev et al. proposed that the net effect of OH formation during reduction and the removal of water during annealing caused 25% of the ZnO surface to reduce to metallic Zn [
15]. In our O 1s spectra, there is a reduction in the ZnO substrate intensity by 2/3 upon heating from 88 °C to 200 °C, which could be caused by the loss of O atoms from the surface region. The O 1s spectra at 200 °C are still fitted with a small peak at a higher BE, which could be the remaining B
2O
3. A schematic model showing the proposed behaviour of [C
4C
1Im][BF
4] on ZnO (0001) as the sample is heated is shown in
Figure 10.


 ,
, 


