1. Introduction
Today, the evolution of technology—such as cameras with higher-resolution sensors and computer systems integrating processors and graphics cards with greater computing power—combined with the emergence of a larger number of specialized software solutions, has made 3D reconstruction easier. This advancement enables a deeper understanding of artifacts and their evolution over time [
1].
Close-range photogrammetry, a well-established technique, can be employed to document and monitor geometric deformations in cultural heritage artwork and decorations [
2]. These techniques have proven to be valuable tools for the conservation and restoration of architectural heritage, allowing for comprehensive analyses of monumental complexes based on their shape, size, materials, conservation status, identification of critically damaged areas, and other key aspects [
3,
4].
Ensuring the integrity and accuracy of architectural heritage data collection is a critical challenge for the future [
5]. Accuracy in the 3D reconstruction of historic objects is paramount, even for creating customized packaging that secures and preserves cultural relics during transport [
6]. The availability of 3D models offers significant advantages for various aspects of the heritage value chain, including research, restoration, and dissemination [
7].
This paper focuses on the 3D reconstruction of the Roman site of Sierra Aznar (Arcos de la Frontera, Cádiz, Spain) and quantitatively assesses the fidelity of the model to the real structure.
1.1. The Great Cistern of Sierra Aznar
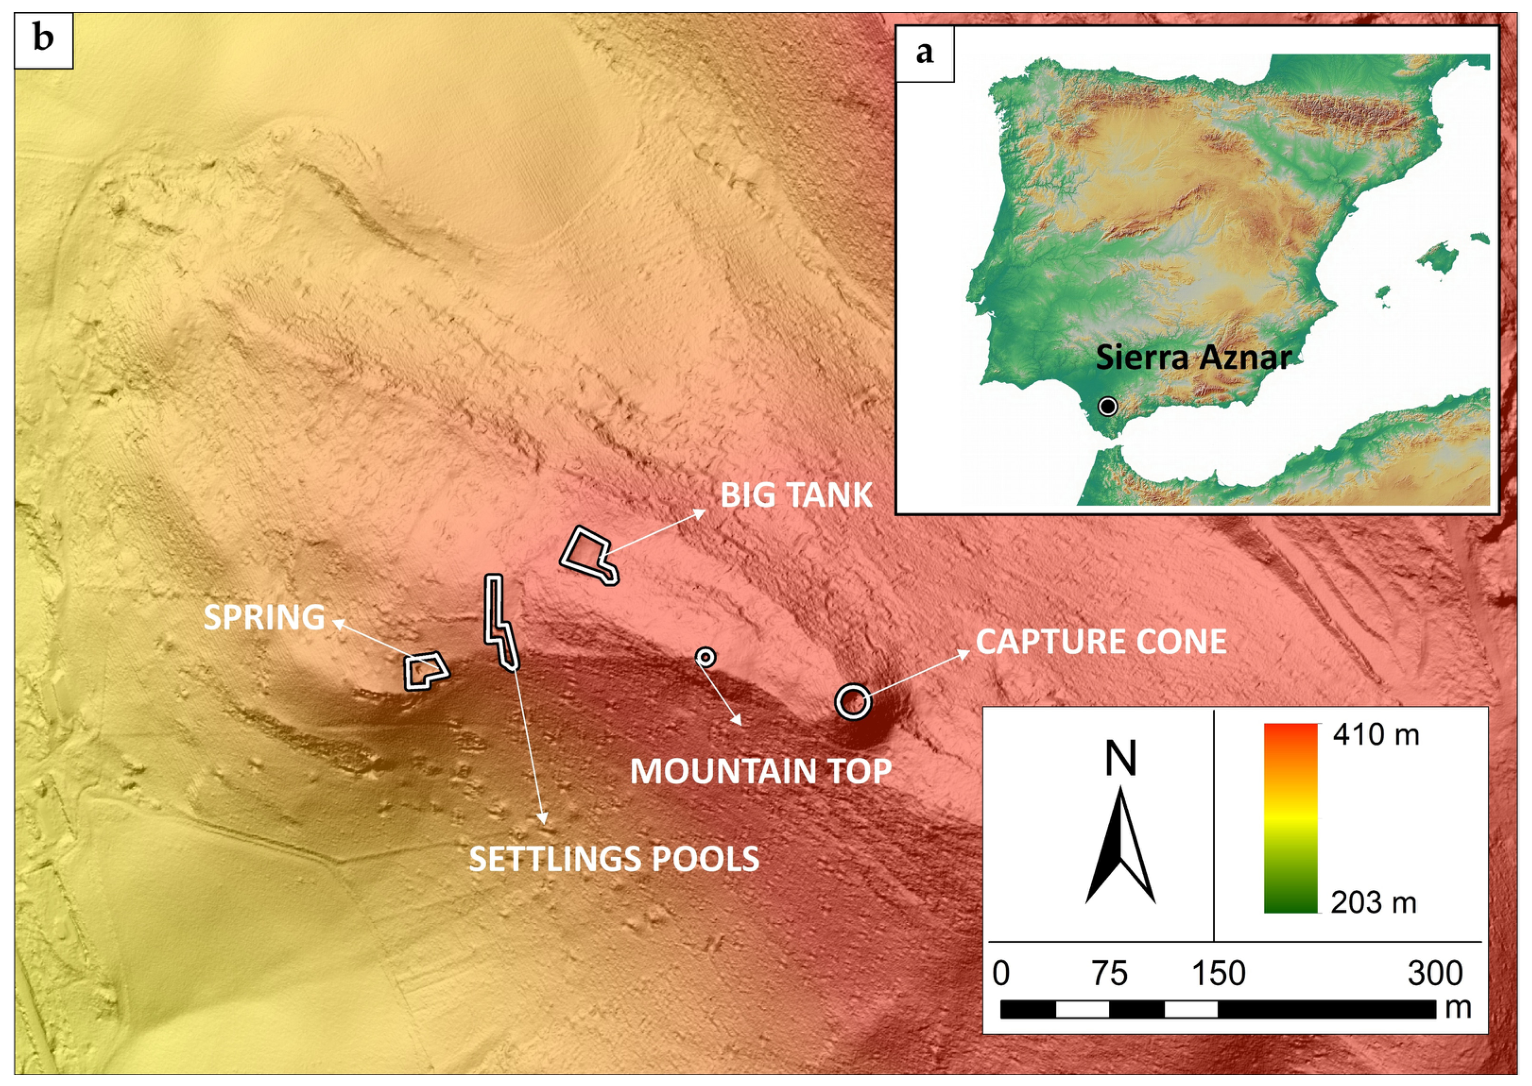
The Roman site of Sierra Aznar is located in the municipality of Arcos de la Frontera (Cádiz), specifically in the areas known as Sierra Aznar and Cerro del Moro (
Figure 1). The site consists of large exposed archaeological structures situated on the western slope, though it also extends into the surrounding countryside. Sierra Aznar reaches an elevation of 405 m, while the adjacent slopes descend to 200 m. The elements that comprise the site are strategically arranged to optimize water distribution among them, taking advantage of the natural topography.
The location known as Sierra Aznar may be identified as Calduba, the settlement mentioned by Ptolemy in the 2nd century. This identification aligns with its characterization as a small town, where water played a pivotal role as the primary cultural force [
8]. In fact, the hydraulic system of Sierra Aznar, along with the aqueduct to Gades, represents one of the most monumental and complex examples of water engineering designed by imperial power for the organization of the conventus Gaditanus [
9,
10].
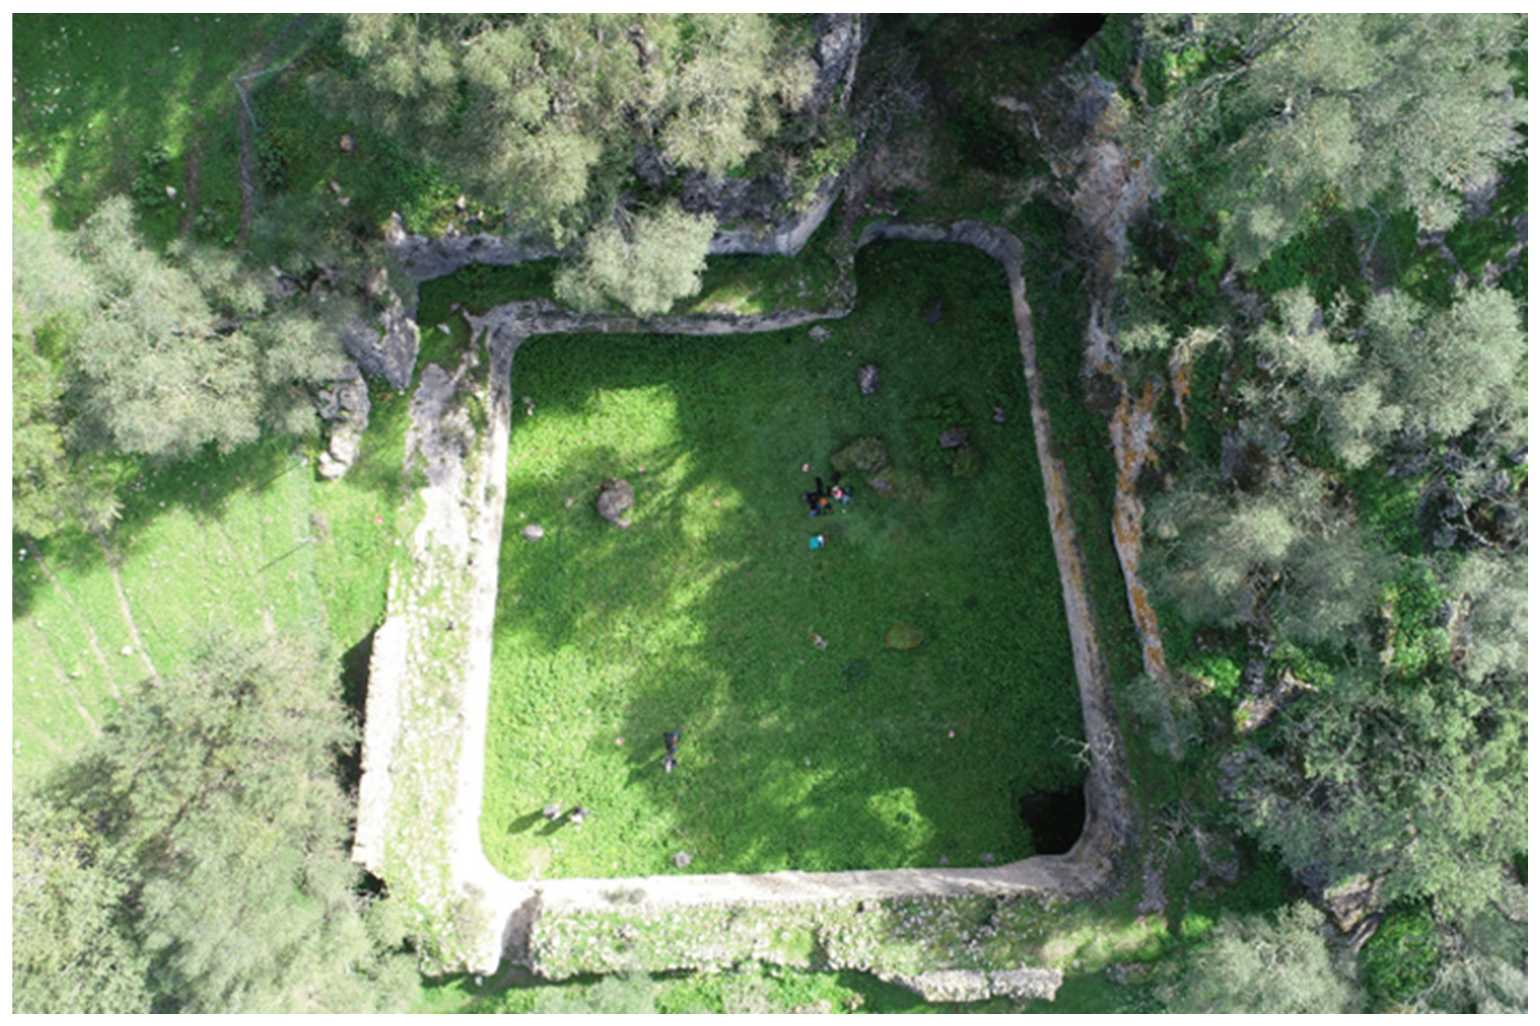
This hydraulic system is composed of several sectors, each serving a different function: water collection, decantation, and distribution. The cistern is the largest element of this hydraulic complex (
Figure 2). Dating from the 1st century AD, it is located at an altitude of 355 m. The structure has an asymmetrical geometry with an almost quadrangular floor plan (20 m × 19.10 m), with one of its walls attached to the rocky surface, adapting to the topography of the terrace where it is situated. The cistern is approximately 5 m deep, with rounded corners, one of which features a slight bend, likely designed to allow water to cascade down in the form of a waterfall.
Regarding its purpose, several hypotheses remain to be confirmed. Some researchers have proposed a connection with the aqueduct of Gades [
11], while others suggest that the water was used for agricultural purposes [
12]. More recently, two additional perspectives have emerged: one posits a possible link between the water system and an iron mine [
13], while the other suggests that Sierra Aznar may have primarily served as a place of worship for aquatic and primordial divinities [
14]. Several studies have interpreted the hydraulic complex of Sierra Aznar within a broader territorial and symbolic framework, emphasizing the integration between water-management infrastructures, terraced urban planning, and the mountainous landscape of ancient Calduba [
15].
In addition to the Great Cistern, the hydraulic complex of Sierra Aznar includes other water-related structures, such as sedimentation basins and a fountain, whose spatial relationships and functional integration remain poorly understood.
Beyond its architectural scale, the Great Cistern appears to have played a central role within the broader hydraulic landscape of Sierra Aznar, associated with water capture, storage, and sedimentation structures distributed across the plateau. Its elevated position and considerable storage capacity suggest that it may have functioned as a key element in the management and redistribution of water resources within the Roman settlement and its surrounding territory.
At present, the structure is no longer used for water storage or hydraulic purposes. Nevertheless, the cistern and its associated hydraulic elements remain significant archaeological features within the landscape, preserving valuable evidence of ancient water-management strategies adapted to the environmental conditions of the region.
1.2. Data Acquisition
The adoption of image-based 3D modeling offers a crucial advantage by significantly improving the quality of recordings compared to traditional methods. Additionally, high-resolution geometric information facilitates straightforward data quantification, providing a more detailed and accurate representation [
16].
Photogrammetry is often compared to laser scanning, with the choice between the two methods depending on the nature of the object and specific circumstances. The preference for one technique over the other varies by application, as different technologies are more suitable for different purposes [
17]. Both methods are applicable to large structures and allow measurements with millimeter-level accuracy or better. Moreover, they enable data collection from a significant distance between the target and the measuring device, expediting the model creation process.
There is some debate regarding the accuracy of these techniques. In certain cases, laser scanning yields better results [
18,
19,
20], whereas classical photogrammetry produces more accurate data in others [
21,
22]. For the purposes of this study, both methodologies are analyzed to compare their performance and evaluate their respective benefits.
Through digital processing of the collected data, it becomes possible to develop intervention proposals and operational hypotheses, enhancing the capacity to analyze and address structural integrity issues in buildings [
23]. The combination of photogrammetry and laser scanning proves effective in modeling structures under challenging conditions with sub-centimeter accuracy [
24].
Advancements in digital photography have positioned photogrammetry as a valuable alternative for measuring large constructions. It offers accuracy comparable to traditional methods involving total stations and laser meters while significantly reducing measurement time [
25].
Although laser scanning is a more modern technology than photogrammetry, both techniques are comparable. In the early 2000s, with the rapid expansion of Terrestrial Laser Scanning (TLS), photogrammetry appeared to lose ground, leading to divided opinions among surveyors [
26]. The main advantages of laser scanning include measurement accuracy, scanning speed, and the ability to generate detailed three-dimensional models for various applications. In some cases, [
27], laser scanning has even been used as a reference technique to evaluate the accuracy of other instruments, employing color-coded error maps that represent Euclidean distances between scanner-provided data and the point cloud obtained from another device.
The total station is a surveying instrument that combines the functions of a theodolite with an electronic distance meter (EDM) to measure distances and angles with high precision, enabling detailed and accurate surveys [
28]. Conventionally, a total station is used with a prism to center it or to observe ground control points. When integrated with the Global Navigation Satellite System (GNSS), it enhances georeferencing by combining local and global data, improving accuracy over large areas and reducing fieldwork time. This makes total stations essential for terrain analysis, structural surveys, and applications in land surveying, engineering, and architecture.
2. Materials and Methods
Integrated photogrammetric and terrestrial laser scanning workflows for the documentation of complex archaeological and architectural heritage structures [
29]. Unmanned aerial vehicle (UAV)-based studies have likewise highlighted the growing importance of geometrically reliable three-dimensional documentation workflows for the analysis and preservation of complex archaeological remains [
30]. Following this approach, the present study combined image-based photogrammetry, terrestrial laser scanning, and topographic control in order to achieve a geometrically reliable reconstruction of the Great Cistern of Sierra Aznar. To this end, three main devices were employed: a Nikon D800 camera (Nikon Corporation, Tokyo, Japan) for photogrammetry, a Leica BLK360 laser scanner (Leica Geosystems AG, Heerbrugg, Switzerland), and a Leica TS06 Plus total station (Leica Geosystems AG, Heerbrugg, Switzerland).
The Nikon D800 camera, equipped with a Sigma Art 50 mm F1.4 DG HSM prime lens (Sigma Corporation, Kawasaki, Japan), was selected for terrestrial photogrammetry due to its sharp image quality, low distortion, and suitability for photogrammetric modeling [
31]. All photographs were acquired in both Raw image file format (RAW) and Joint Photographic Experts Group (JPG) formats. During image acquisition, the camera was configured with an aperture of f/13, ISO 100, and automatic shutter speed operating in aperture-priority mode in order to ensure consistent depth of field and image sharpness throughout the survey.
The Leica BLK 360 G1 laser scanner was used for its capability to capture 360,000 points per second within a range of 60 m, with an accuracy of 6–10 mm. This device enables rapid and dense data collection, making it ideal for 3D reconstructions.
To compare the models generated by the camera and the scanner, the Leica TS06 Plus total station was employed to establish Check Points (ChPs) with high accuracy (2 mm + 2 ppm without a prism).
A total of 28 targets were homogeneously distributed across the structure, including 5 Ground Control Points (GCPs) for georeferencing and scaling, and 23 Check Points (ChPs) for accuracy comparisons. The positioning strategy ensured reliable evaluations, particularly on curved and linear surfaces [
32]. The coordinates of the ChPs were obtained using Reality Scan v2.1.1 (Epic Games, Cary, NC, USA) for photogrammetry and Leica Cyclone Register 360 (Leica Geosystems AG, Heerbrugg, Switzerland) for laser scanning.
2.1. Photogrammetry Reconstruction
Photogrammetric reconstruction is based on the use of photographic equipment mounted on a tripod and a monopod, positioned in pre-planned locations to ensure full coverage of the structure. The first stage of the process, data acquisition, is of paramount importance, as the subsequent stages rely heavily on the quality of the photographic captures [
33].
Before conducting a photogrammetric project, it is essential to perform a pre-processing step known as camera calibration to correct distortions caused by the camera during data acquisition. The calibration process involves determining the geometric parameters (coordinates of the principal point and focal length) and physical parameters (radial and tangential distortion) of the camera [
34,
35]. In this study, the Reality Scan 2.1.1 software applied the Brown3 lens distortion model by default. This mathematical model, based on the polynomial expansion of distortion, is widely used in camera calibration to correct geometric distortions inherent in the optical system. These distortions are classified into two main components: radial and tangential distortion. The Brown3 model specifically includes the first three radial distortion coefficients, considering a total of five main parameters: three radial distortion coefficients (k1 = −0.006612, k2 = 0.103441, k3 = −0.190005) and two shifts of the optical center (x0 = −0.120075, y0 = 0.171764) [
36].
A total of 513 photos were taken during the fieldwork. Throughout the entire photographic capture process, a tripod was used for images taken from the first and second levels, minimizing vibrations and consequently reducing noise [
37]. It was necessary to walk the perimeter of the interior of the structure three times: first with the tripod at its lowest height, then with the tripod at its highest setting, and finally using a custom-built monopod to reach a height of 3 m. To obtain a homogeneous point cloud, the distance between captures (0.8–1 m) and the distance from the structure (6 m) were defined.
To ensure color fidelity in the images, the widely adopted X-Rite ColorChecker color chart (X-Rite Inc., Grand Rapids, MI, USA), used in both professional photography and scientific applications, was employed. This allowed for the creation of a color profile that was subsequently applied to the rest of the photographic shots using Adobe Photoshop Lightroom Classic 9 (Adobe Inc., San Jose, CA, USA).
After image alignment in Reality Scan 2.1.1, all 513 selected photographs were successfully registered, generating 1,917,057 tie observations. The georeferenced bundle adjustment yielded sub centimetric root mean square errors of 0.006 m in X, 0.003 m in Y, and 0.006 m in Z. Reprojection error statistics further showed strong internal consistency of the photogrammetric block, with approximately 88.4% of observations below 1 pixel residual error and 97.2% below 1.5 pixels. These results indicate a robust internal adjustment and reliable image network geometry.
The checkpoint values presented later in the study should be interpreted separately from the internal adjustment statistics of the photogrammetric model. Whereas reprojection and control-point residuals assess the consistency of image orientation and bundle adjustment, checkpoint comparisons evaluate the final metric agreement of the entire workflow, including georeferencing, target marking, topographic control, and coordinate extraction.
2.2. Laser Scanning Reconstruction
The laser scanning technique produced a point cloud from 11 scan setups, 7 on the inner perimeter of the structure and 4 from the top, using Leica Cyclone Register 360 software. The BLK360 scanner is capable of capturing 360,000 points per second. Its accuracy depends on the distance to the object being scanned; at a distance of 10 m, the BLK360 achieves an accuracy of 6 mm under ideal conditions.
The data processing in the laboratory followed a similar approach to that used for the data obtained by the camera, utilizing the same software: Reality Scan v2.1.1 and CloudCompare v2.14. Based on the processed data, a mesh was generated to create the final textured solid. As a result of using the laser scanner, a three-dimensional representation of the complete structure was obtained.
The alignment of the eleven scan setups in Leica Cyclone REGISTER 360 was based on 21 valid links between overlapping scans, with an average overlap of 58%, and yielded a global residual of 0.009 m, indicating a coherent and internally consistent scan network. This value reflects the quality of the cloud-to-cloud registration process and the geometric redundancy of the scan configuration.
The checkpoint discrepancies reported later do not solely reflect the scan-registration quality. They represent the final positional differences obtained after the complete terrestrial laser scanning process, including network alignment, georeferencing, target recognition, and coordinate measurement within the registered point cloud. Considering the size of the cistern and the presence of vegetation, irregular surfaces, and partial occlusions, some increase with respect to the internal registration residual is expected under field conditions.
Fieldwork was carried out under complex acquisition conditions due to the dimensions of the structure, irregular wall geometry, partial vegetation cover, and varying illumination inside the cistern. Photogrammetric acquisition required multiple capture heights using both a tripod and a custom monopod in order to ensure homogeneous image coverage and minimize occluded areas. In contrast, terrestrial laser scanning required eleven scan setups distributed between the upper platform and the interior perimeter of the structure to maximize overlap and reduce shadow zones within the point cloud. The complete field acquisition process, including topographic control measurements, photographic capture, and laser scanning, was completed over approximately four hours.
Photogrammetry and terrestrial laser scanning were employed as complementary techniques in order to overcome the limitations associated with each individual method. Photogrammetry provides high-resolution texture information, flexibility in image acquisition, and efficient coverage of large surfaces. However, its performance may be affected by variable lighting conditions, shadows, vegetation, and difficulties in maintaining homogeneous image geometry in complex archaeological environments such as the Great Cistern.
In contrast, terrestrial laser scanning enables the rapid acquisition of dense and metrically consistent point clouds, largely independent of ambient lighting conditions. Nevertheless, the technique is more sensitive to occlusions caused by irregular geometry and vegetation and requires multiple scan positions to ensure complete coverage of large structures.
Based on the field experience obtained during this study, the integration of both techniques proved particularly effective for documenting a large and geometrically complex archaeological structure, combining the geometric robustness of laser scanning with the high level of visual detail and acquisition flexibility provided by photogrammetry, in agreement with recent methodological approaches proposed for heritage documentation workflows [
38].
3. Results
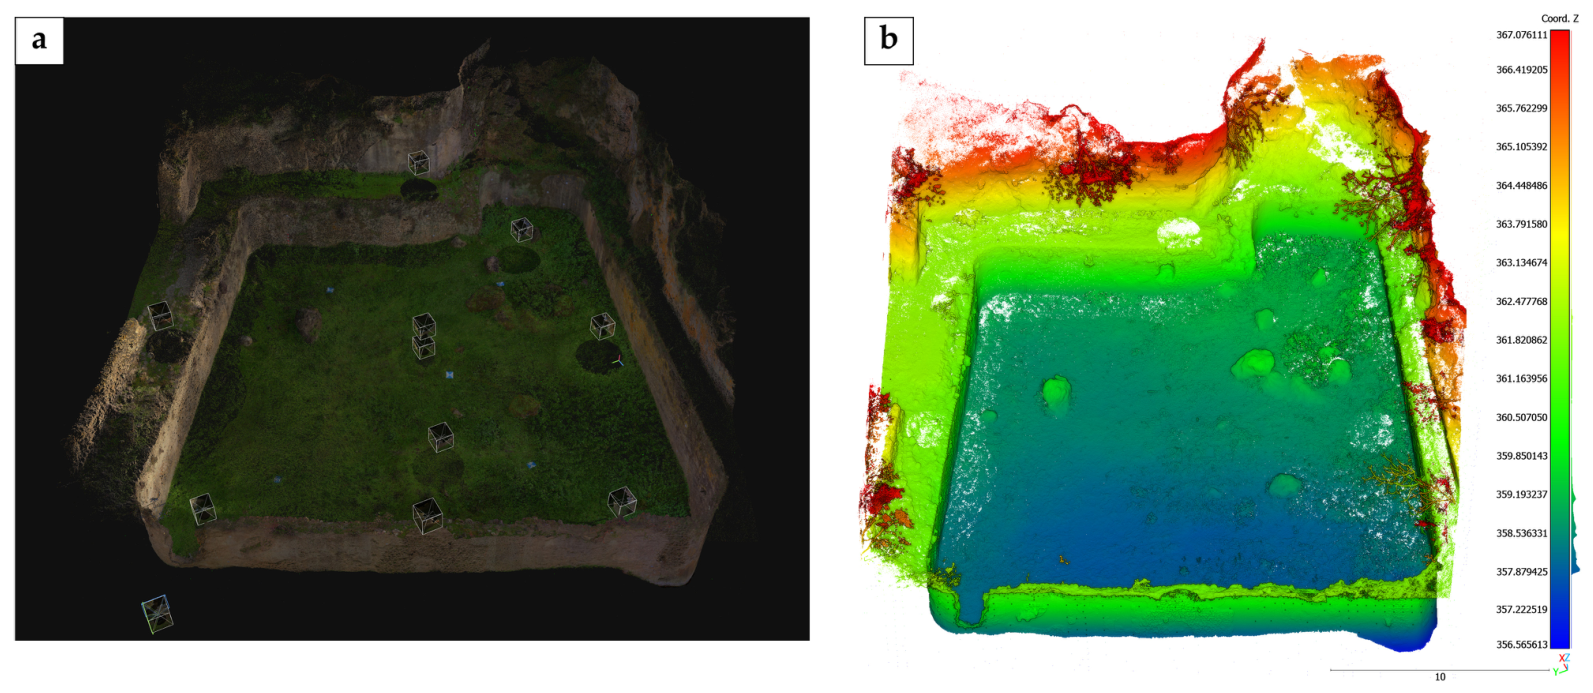
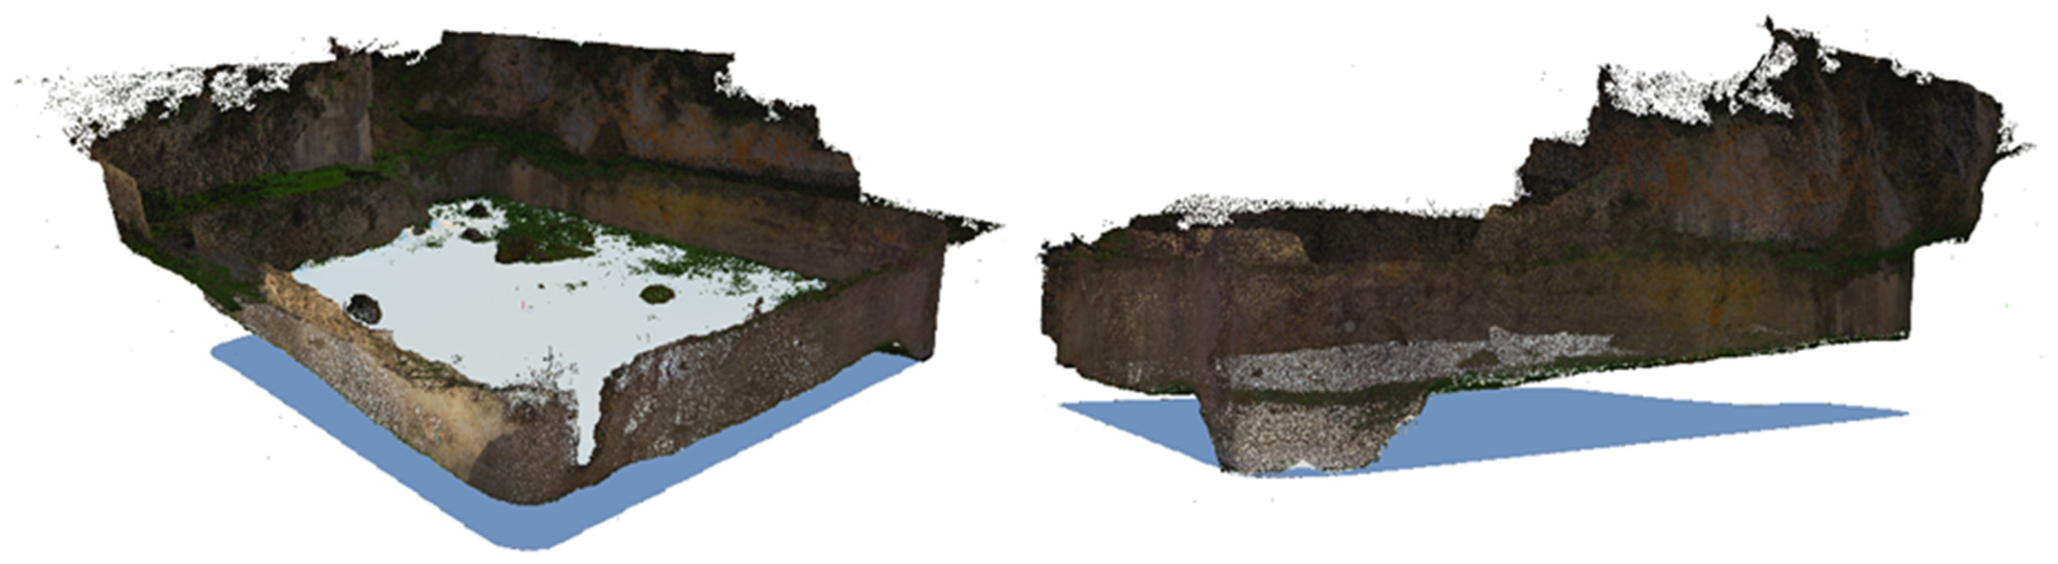
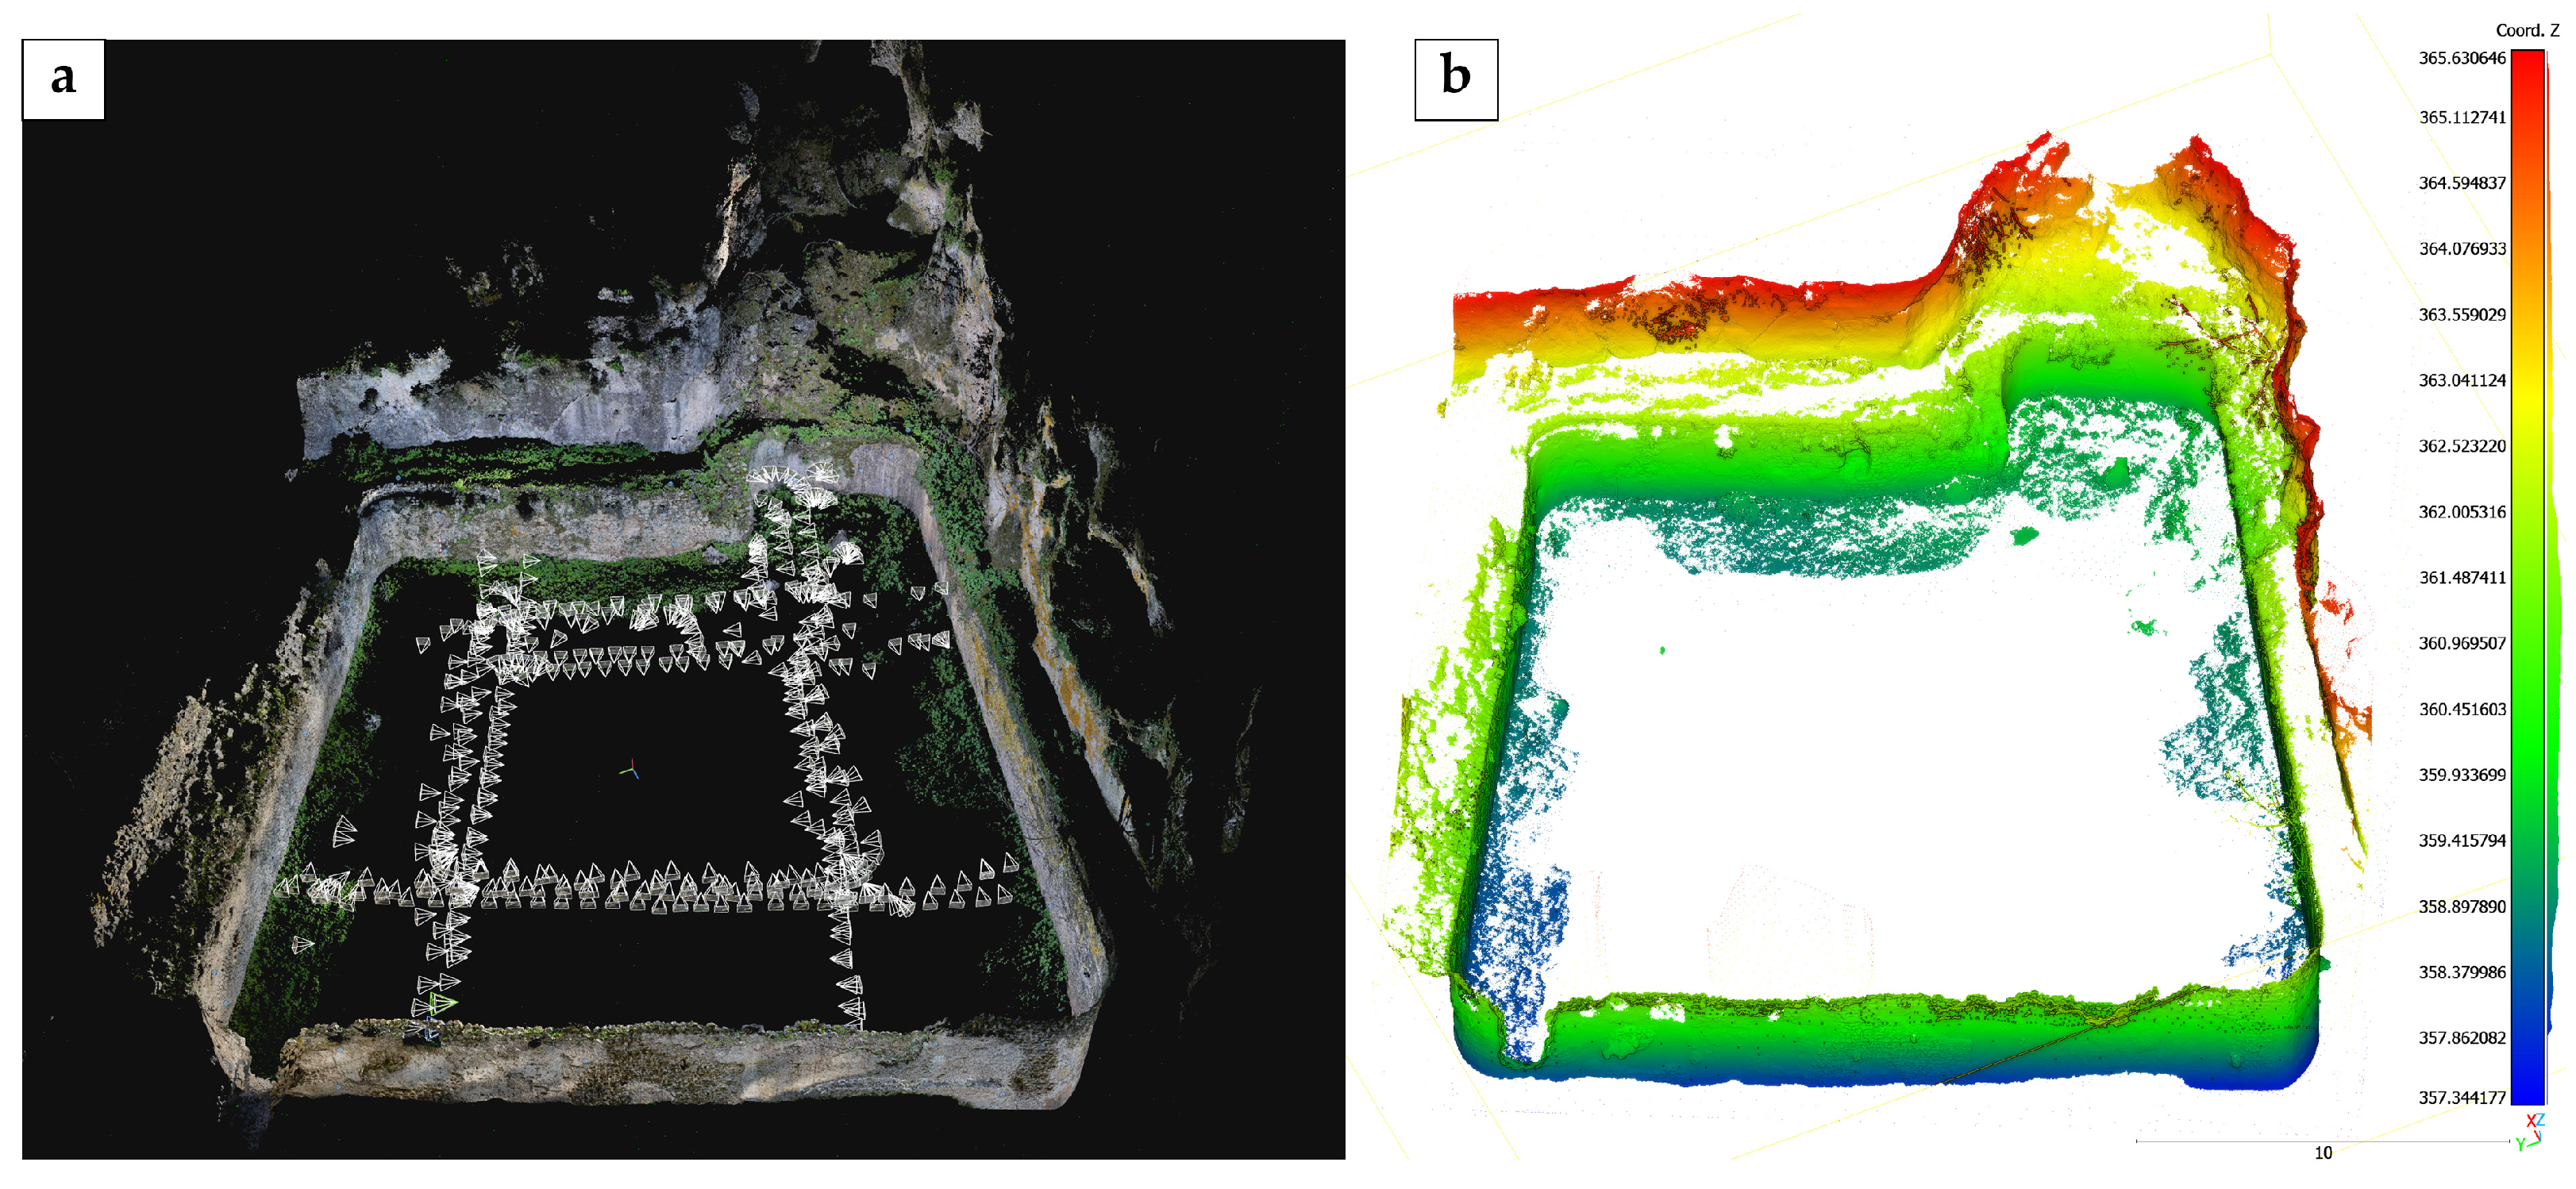
Two three-dimensional point clouds were generated during the survey of the Great Cistern, one derived from image-based photogrammetry and the other from terrestrial laser scanning, providing a detailed geometric representation of the structure (
Figure 3 and
Figure 4). Together, these datasets capture both the overall morphology of the cistern and its local geometric details, including curved walls, corners, and variations in depth.
These point clouds were subsequently integrated to obtain a complete and spatially consistent three-dimensional model of the structure, which constitutes the basis for the quantitative and interpretative analyses presented in this study. To ensure the metric reliability of the reconstructed geometry, a set of signalized targets was distributed across the inner surface of the cistern. Five targets were used as Ground Control Points (GCPs) for georeferencing and scaling the model, while an additional 23 targets were employed as independent check points to assess the geometric consistency of the reconstruction.
Points measured directly in the field using a total station are referred to as Measured Check Points (MChPs). These points provide highly accurate three-dimensional coordinates within a known reference system and serve as an external benchmark for validating the spatial accuracy of the reconstructed model. Corresponding points identified within the reconstructed three-dimensional dataset whether obtained from photogrammetric processing or terrestrial laser scanning are referred to as Calculated Check Points (CChPs). Their coordinates were extracted directly from the point clouds and may exhibit small deviations with respect to the MChPs due to factors related to image matching, sensor resolution, or geometric reconstruction processes.
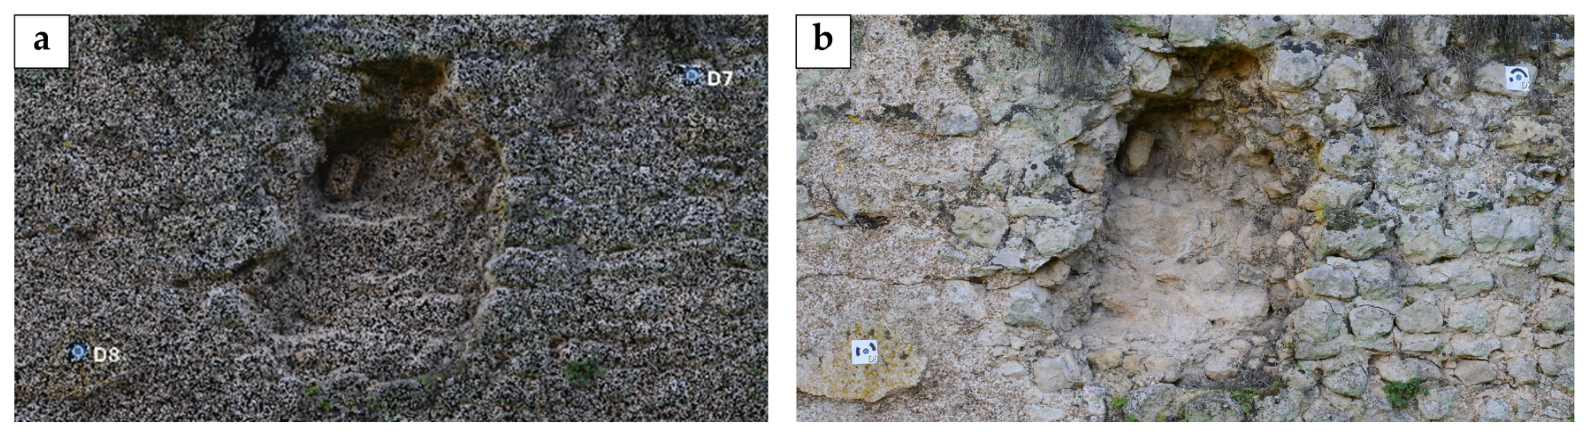
To verify the reliability of the final 3D model, the spatial coordinates of 23 check points were compared with their independently measured counterparts (
Figure 5). For each point, the Euclidean distance between the measured and reconstructed positions was computed, providing a quantitative assessment of the geometric consistency of the model and confirming its suitability for subsequent planimetric, volumetric, and interpretative analyses.
The coordinates of the Calculated Check Points (CChPs) were extracted from the reconstructed three-dimensional models using control point tools available in the processing software. Target centers were manually identified on the images (photogrammetry) and on the georeferenced panoramic views (laser scanning), and their coordinates were compared with independently measured values obtained from the total station.
For each check point, discrepancies between measured and reconstructed coordinates were computed along the X, Y, and Z axes, and the corresponding three-dimensional Euclidean distance (e3D) was calculated as a global indicator of spatial error.
The results for the photogrammetric model (
Table 1) show deviations generally within sub-centimetric to low-centimetric ranges, confirming a high level of geometric consistency suitable for detailed planimetric and volumetric analysis.
The laser scanning dataset (
Table 2), processed following the same validation procedure, presents larger deviations, typically within low- to mid-centimetric ranges. These differences are mainly related to local geometric complexity and acquisition conditions, but remain compatible with the accuracy requirements of the study.
Overall, both datasets provide geometrically reliable representations of the structure. However, the photogrammetric model shows slightly higher precision, while the laser scanning data contributes to improving geometric completeness, particularly in areas of limited visibility or complex morphology.
3.1. Assessment of Geometric Reliability of the Reconstructed Model
To evaluate the geometric reliability of the reconstructed three-dimensional dataset, discrepancies between Measured Check Points (MChPs) and the corresponding Calculated Check Points (CChPs) extracted from both the photogrammetric and laser scanning components were analysed. Coordinate differences were computed along the X, Y, and Z axes, and the three-dimensional Euclidean distance was calculated to provide a synthetic measure of spatial deviation.
The magnitude of these discrepancies was characterised using standard statistical indicators, including minimum and maximum deviations, mean error, mean absolute error, and Root Mean Square Error (RMSE). In addition, dispersion metrics such as standard deviation and mean absolute deviation were calculated in order to evaluate the variability of the residuals. The resulting values are summarised in
Table 3 and
Table 4.
The analysis shows that the photogrammetric component presents lower residual values overall, with deviations generally remaining within the low-centimetric range. The laser scanning component exhibits a wider dispersion, particularly along the X and Y directions, which can be attributed to local surface geometry and acquisition conditions. Nevertheless, the magnitude of these discrepancies remains compatible with the accuracy requirements of architectural and archaeological documentation.
The distribution of spatial discrepancies, confirms that the majority of residuals are concentrated around the mean, with only a limited number of higher deviations. For the photogrammetric dataset, total spatial deviations do not exceed approximately 25 mm, while the laser scanning component ranges between approximately 15 and 50 mm.
Overall, the combined dataset provides a level of geometric reliability sufficient to support the planimetric, volumetric, and interpretative analyses developed in the following sections.
3.2. Metric Reliability of the Integrated 3D Model
The overall metric reliability of the reconstructed three-dimensional model was assessed by jointly analyzing the spatial discrepancies observed within the dataset and the consistency of distances measured between reference points. This evaluation aims to verify that the integrated model provides a coherent and stable geometric framework for quantitative archaeological analysis.
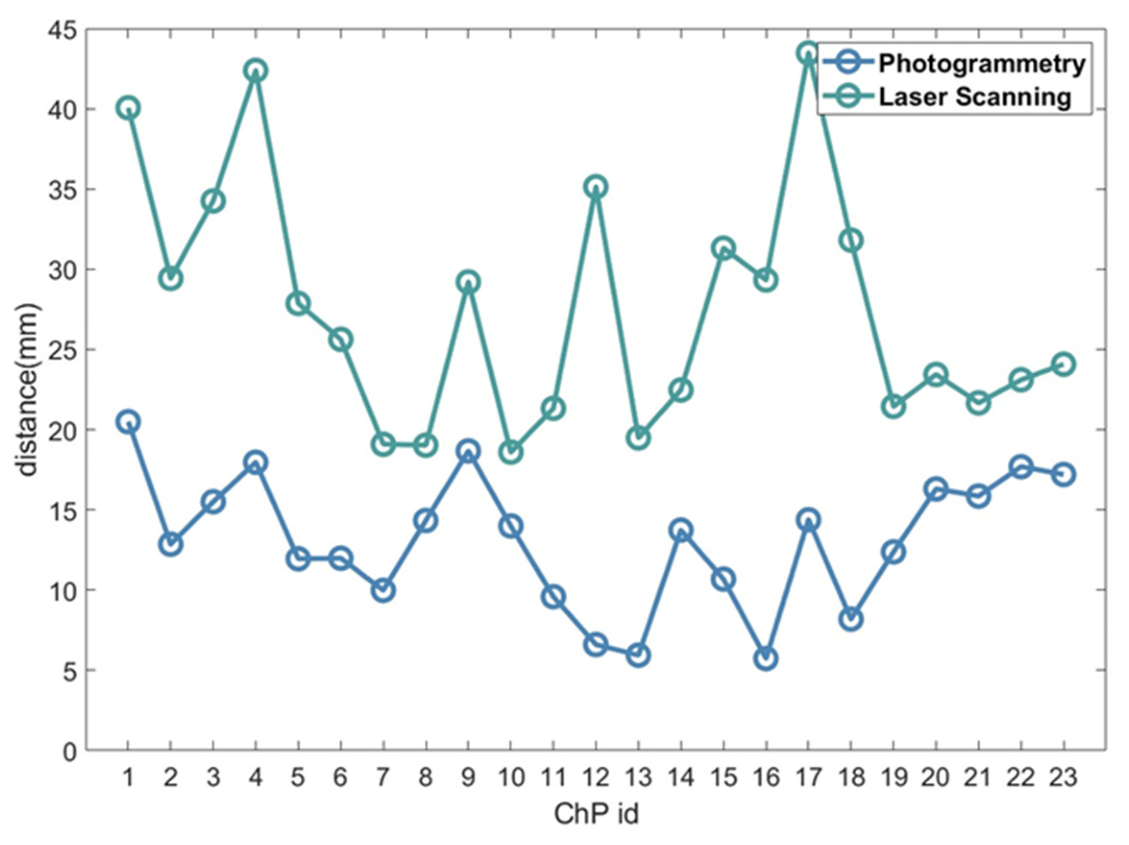
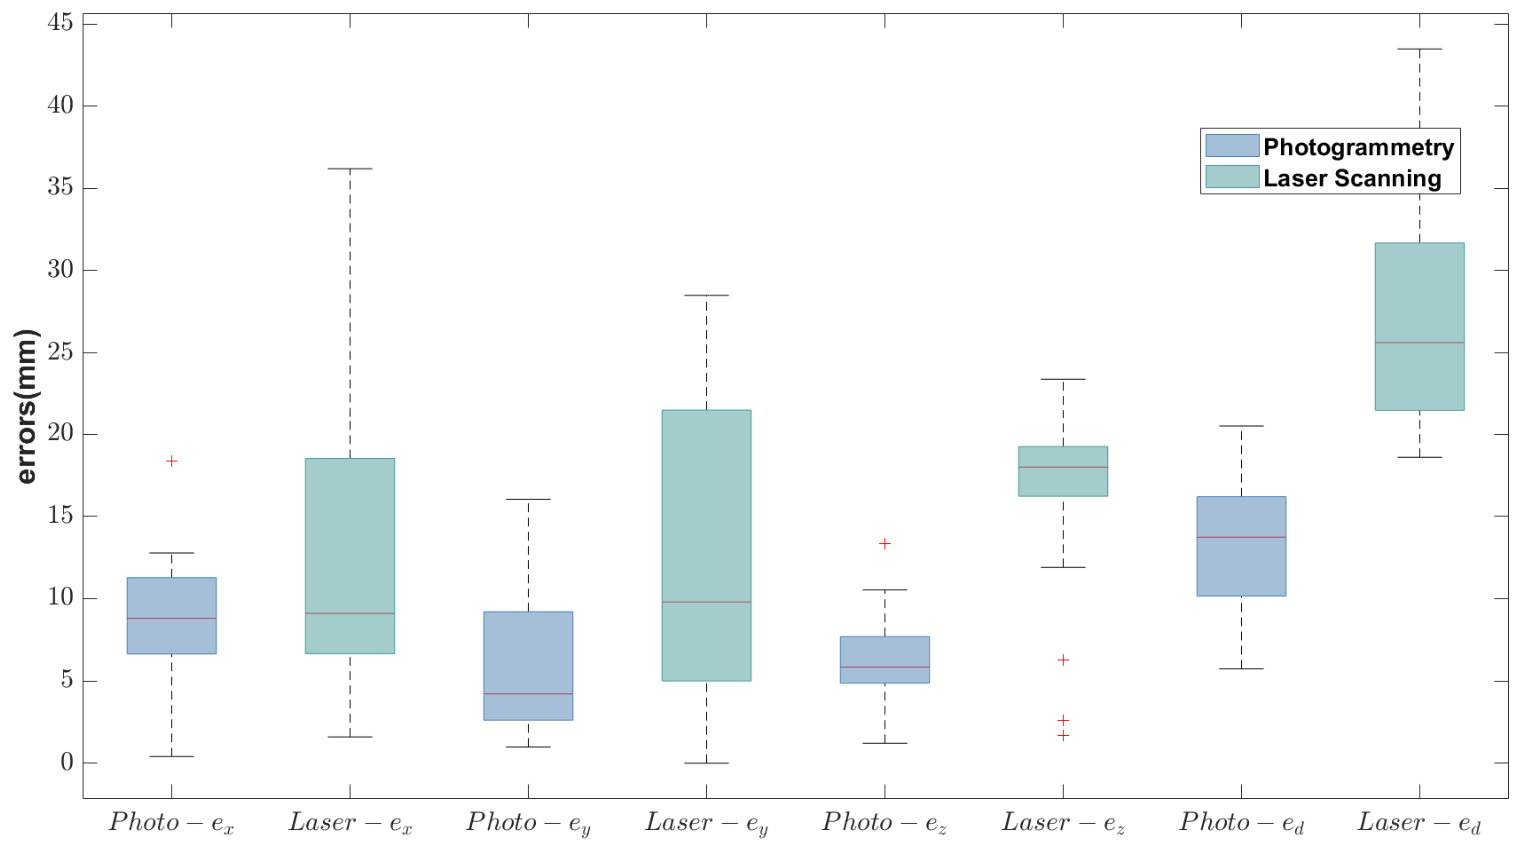
The coordinate discrepancies along the X, Y, and Z axes, as well as the corresponding three-dimensional Euclidean distances, are illustrated in
Figure 6 and
Figure 7.
Figure 6 shows the distribution of errors for each check point, highlighting the variability between photogrammetric and laser scanning datasets across the surveyed area.
Figure 7 provides a statistical summary of these discrepancies through boxplot representations, allowing a direct comparison of their dispersion and central tendency.
The results indicate that photogrammetry consistently exhibits lower error magnitudes and reduced variability, while laser scanning shows higher dispersion, particularly in the vertical component and in the three-dimensional distance. Despite these differences, the deviations for both datasets remain within low- to mid-centimetric ranges, confirming the overall geometric reliability of the reconstructed models for subsequent analysis.
Overall, this global assessment demonstrates that the integrated three-dimensional model achieves a level of metric reliability compatible with the objectives of the study, providing a robust basis for the analysis of storage capacity, sediment accumulation, and the functional interpretation of the Great Cistern.
A one-tailed Wilcoxon signed-rank test was conducted to compare the paired residuals obtained from photogrammetry and terrestrial laser scanning for each coordinate component (Δx, Δy, Δz) and for the 3D Euclidean error magnitude. The null hypothesis (H0) was stated as the median of the paired differences (photogrammetry − laser scanning) being equal to zero. The alternative hypothesis (H1) was stated as directional: the median of the paired differences is less than zero, indicating that photogrammetry yields systematically lower residuals than terrestrial laser scanning.
For the X component, the test yielded px = 0.7531, indicating that the null hypothesis cannot be rejected at the 5% significance level. Therefore, there is no statistical evidence that photogrammetry produces lower errors than laser scanning in the X direction. In contrast, statistically significant differences were detected for the Y and Z components. For ΔY, the test resulted in py = 0.0060, and for ΔZ, pz = 6.75 × 10⁻⁴. Since the test was one-tailed, these results indicate that the median residuals in Y and especially in Z are significantly lower for photogrammetry. The strongest improvement is observed in the vertical (Z) component.
Regarding the 3D Euclidean error magnitude, the test yielded p3D = 1.4 × 10⁻⁵, providing strong statistical evidence that photogrammetry produces lower overall positional errors than terrestrial laser scanning. This confirms a significant improvement in total 3D accuracy under the acquisition conditions considered.
3.3. Capacity Estimation of the Great Cistern Based on 3D Reconstruction
The final 3D reconstruction was generated by combining the point clouds obtained from photogrammetry and terrestrial laser scanning. First, a photogrammetric point cloud was created and georeferenced in Reality Scan v2.1.1 using five control targets: three Leica laser targets (BLK1, BLK2, and BLK3) and two printed targets. Subsequently, a second point cloud was generated from the laser scanner data in Leica Cyclone REGISTER 360, using the same control targets for georeferencing. The laser scanning point cloud was then exported in PTX format and imported into Reality Scan v2.1.1, where both datasets were aligned within the same coordinate system.
Once integrated, the combined dataset followed the standard stages of a photogrammetric reconstruction workflow, including dense point cloud optimization, mesh generation, mesh cleaning, hole filling, texture mapping, and final geometric validation. This process enabled the generation of a geometrically complete and metrically reliable three-dimensional model of the structure.
An accurate 3D reconstruction of any architectural historical structure can be used to estimate other measures of interest. Accuracy is crucial for the historical–archaeological study of water flow within the hydraulic system and for understanding its functioning. In this study, it was possible to estimate the capacity, in cubic meters, that can be stored inside this hydraulic structure, which is not symmetrical, has curved walls, and was built to adapt to the complex orography.
To do this, first, from the 3D reconstruction and using Reality Scan v2.1.1 software, a cross-section of the 3D point cloud was made, which determines a section that defines the outline of the contour.
Secondly, this section with the cross-section was imported into Computer-Aided Design (CAD) software Autocad 2023.1.4 (Autodesk Inc., San Rafael, CA, USA), making it possible to draw the outline of the large cistern with a polyline on the plan view of the section. This polyline was then extruded to create the 3D model. Once this new model was created, the software allowed the volume of water in liters to be calculated at different filling levels. At present, the structure is partially filled with sediment accumulated over time. To determine the depth of the structure, the level reached in the only archaeological excavation conducted to determine the bottom of the cistern was used [
39].
From the Cloud Compare v2.14 program (Open Source Project, GPL software), the point clouds generated by both instruments were imported for comparison. The photogrammetric point cloud has a total of 50,031,303 points, and the LiDAR 3D point cloud has 49,956,713 points. First, the cloud generated from the photographic equipment was imported. Secondly, the cloud generated from the laser scanner was imported. To quantitatively compare the distances between the two point clouds, they were first placed in the same reference system, and then, using the corresponding CloudCompare tool, the distance between them was calculated.
For this purpose, the LiDAR 3D point cloud was taken as the reference, as it has captured the largest surface of the archaeological structure. We calculated the distance between clouds and selected those points whose distance is less than 3 cm, resulting in a new cloud containing 45,650,447 points, i.e., 91.24% of the points.
To conclude this section, an estimate was made of the volume of sediment accumulated over the years inside the Great Cistern. This calculation was based on the only archaeological excavation carried out to date, where the actual floor of the cistern was uncovered. This excavation was carried out in one of the corners, specifically the southwest corner.
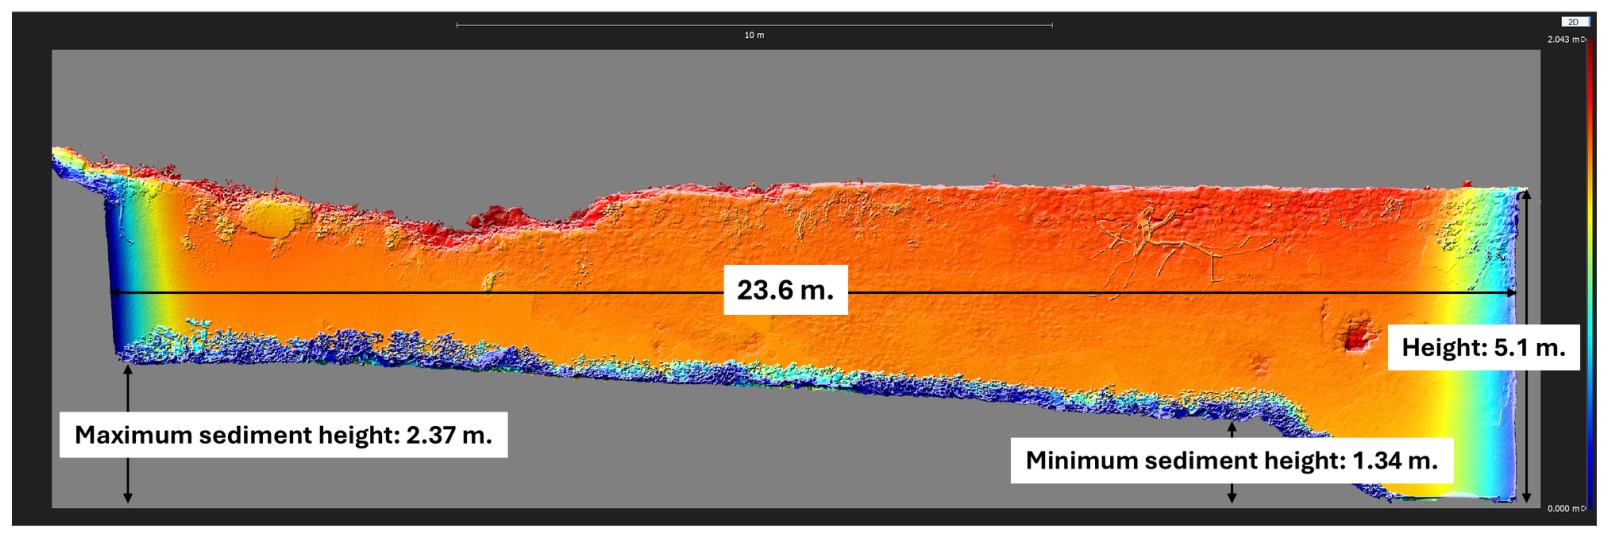
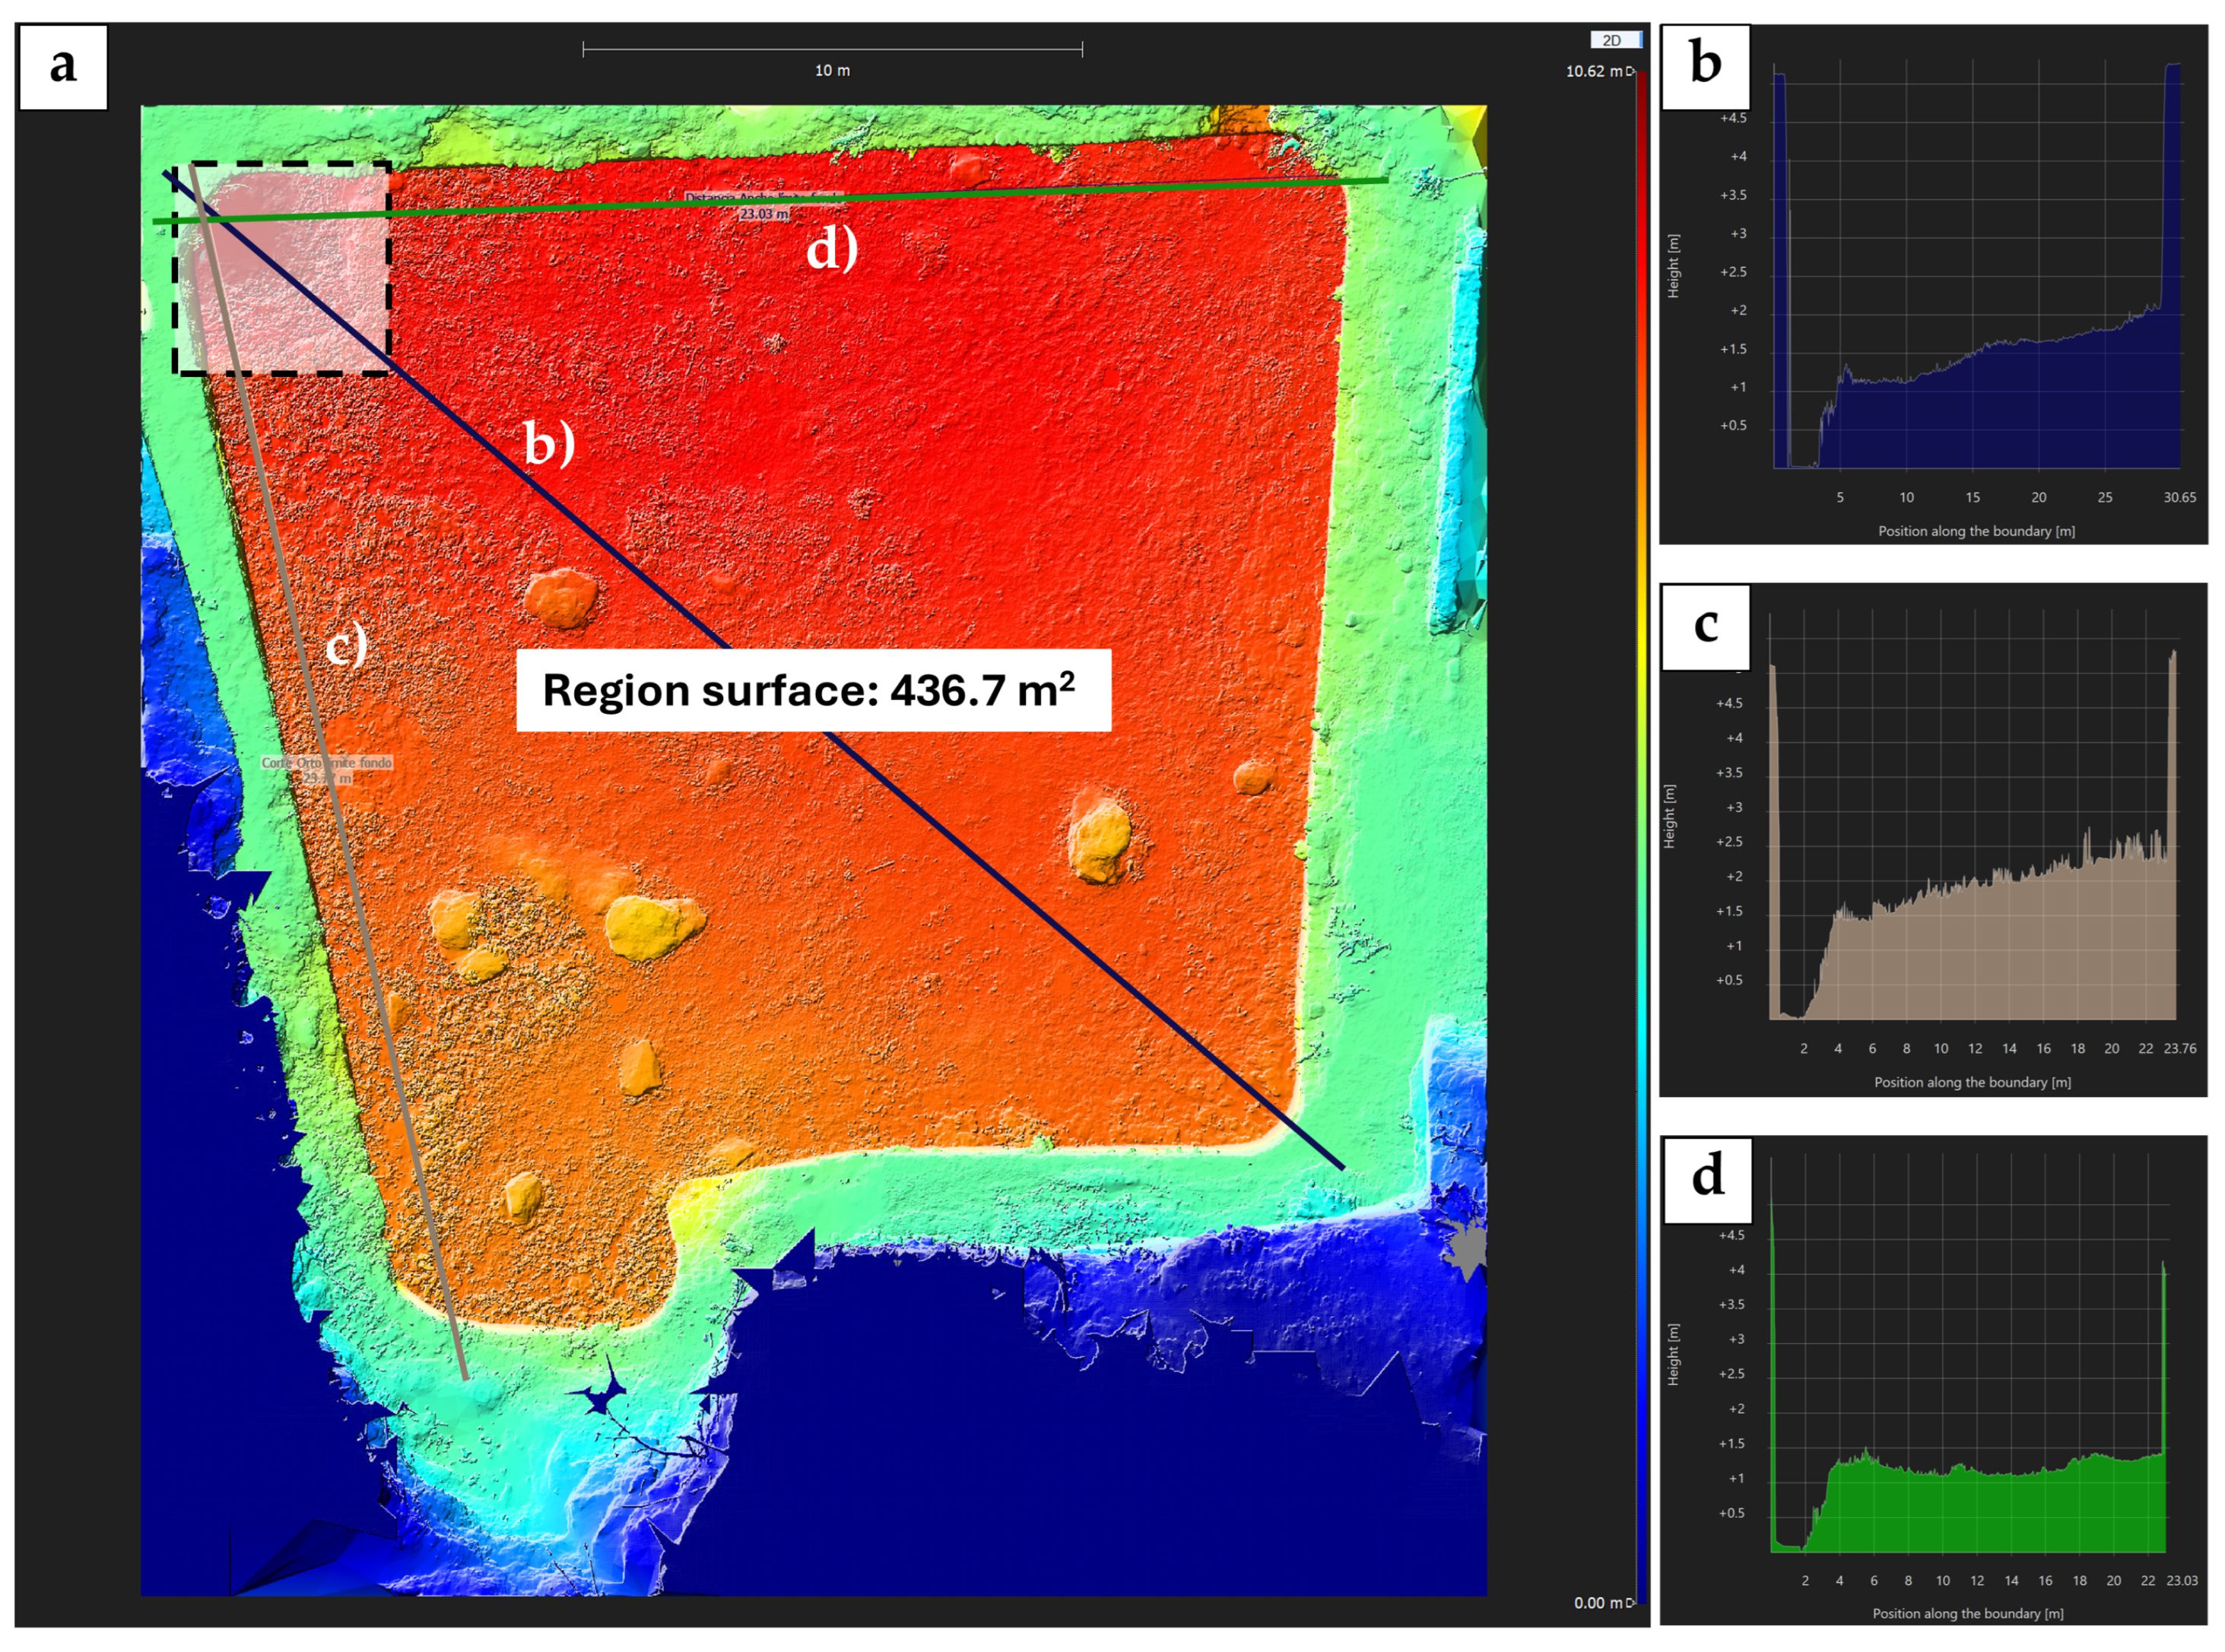
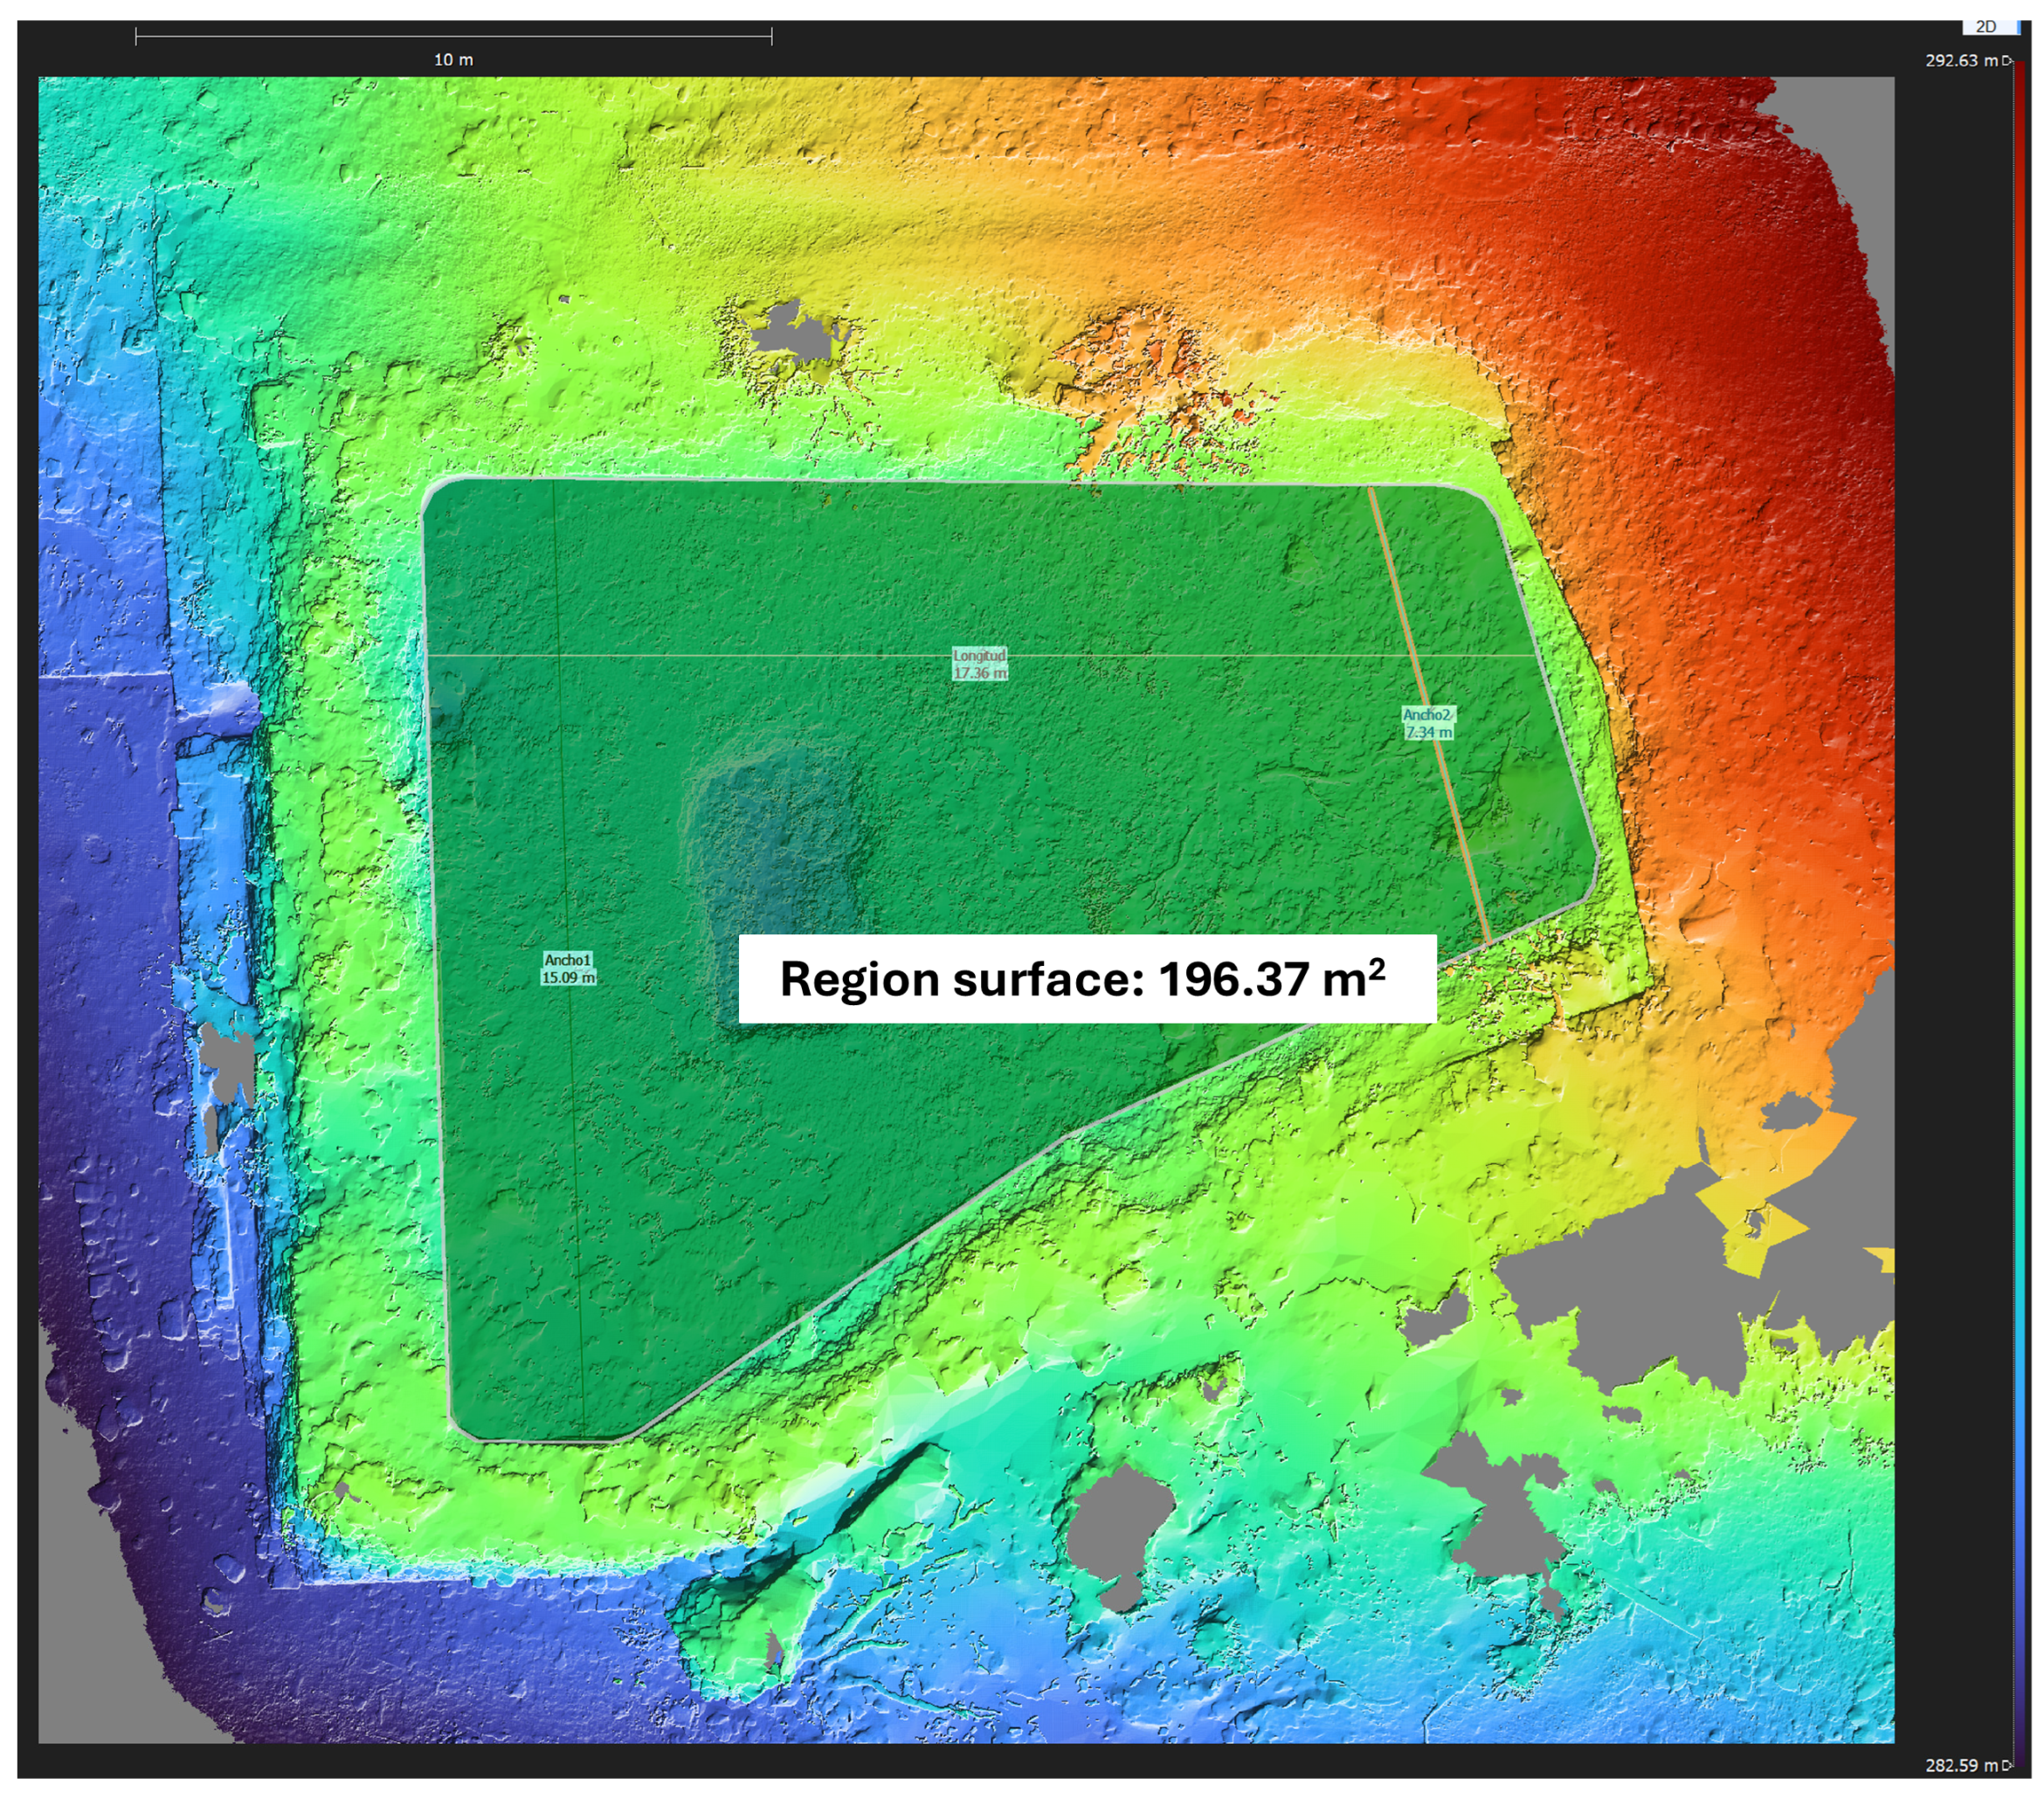
First, to compile and evaluate the data used to estimate the volume of sediment, a series of terrain profile graphs obtained from the ortho-projection of the Great Cistern 3D reconstruction are shown below. These profile graphs were taken longitudinally, transversally, and diagonally, allowing us to evaluate and quantify the real depth of the cistern in a small area (
Figure 8).
The surface area of the Great Cistern was also calculated as 436.7 m
2 (
Figure 8). The volume obtained at a 5 m depth of the solid created in CAD is 2183 m
3 (2,183,000 L). To do this, the ortho-projection was used as a basis, and a region was created that covers the entire surface of the Great Cistern based on the definition of its contour. The following figures show the defined contour and the created region. The program used to perform both the surface calculation and generate the profile graphics was Reality Scan v2.1.1.
The uncertainty in the measurement has been estimated using the Monte Carlo method [
40] with 100,000 iterations, assuming the uncertainty in the point measurement in X, Y, and Z as derived from the Mean Absolute Error, as described in
Table 4. Therefore, the surface of the cistern has been estimated to be [429.6882 m
2 ± 0.1728 m
2], and the volume has been estimated to be [2148.4409 m
3 ± 4.7535 m
3].
For the implementation of this work, it was necessary to formulate an initial hypothesis: that the depth of the entire cistern is the same as that obtained in the archaeological test. Once the initial hypothesis had been defined, the following procedure was used to calculate the volume of sediments:
Firstly, a plan is obtained showing the current surface of the floor of the Great Cistern, as well as a second “imaginary base” plan at the lowest level of the cistern (
Figure 9). This level corresponds to the point where the excavation was carried out until the actual floor of the Great Cistern was reached. This point is at an elevation of 356.78 m above sea level. From these two planes, a solid model can be obtained using a CAD tool, which will allow its volume to be computed.
The sediment volume calculation process involves importing the Great Cistern’s point cloud into CloudCompare, where the 2D POLYGON tool generates two graphic entities: a polyline outlining the base and a polygon representing its surface, both exported as DXF files. Using AutoCAD 2023.1.4, the DXF file of the current ground surface contour is imported, and a polyline of the sediment base is generated by duplicating the contour and adjusting its Z-axis elevation to the survey’s lowest level (356.78 m). The SOLEVATION tool creates a surface between the two 3D polylines, and the ESCULPIR tool is then used to form a 3D solid model. This model, representing the sediment volume, is exported as an STL file for re-import into CloudCompare v2.14. Initially, we only had the point cloud corresponding to the Great Cistern in CloudCompare v2.14, but we can now add the solid model generated from AutoCAD 2023.1.4.
The sediment volume calculated from the generated solid model is estimated at 819.858 m3. Considering that the maximum volume that can be accommodated by the Great Cistern at a height of 5 m is estimated at 2180 m3, the calculated volume of sediment (819.858 m3) represents 37.5% of its total volume. In other words, approximately one-third of the capacity of the Great Cistern is currently occupied by sediment.
Finally, it has also been possible to quantify that the height of the sediments in the lower part reaches approximately 1.3 m, and in the upper part, it is around 2.3 m (
Figure 10).
3.4. Spatial Organization of the Hydraulic Structures
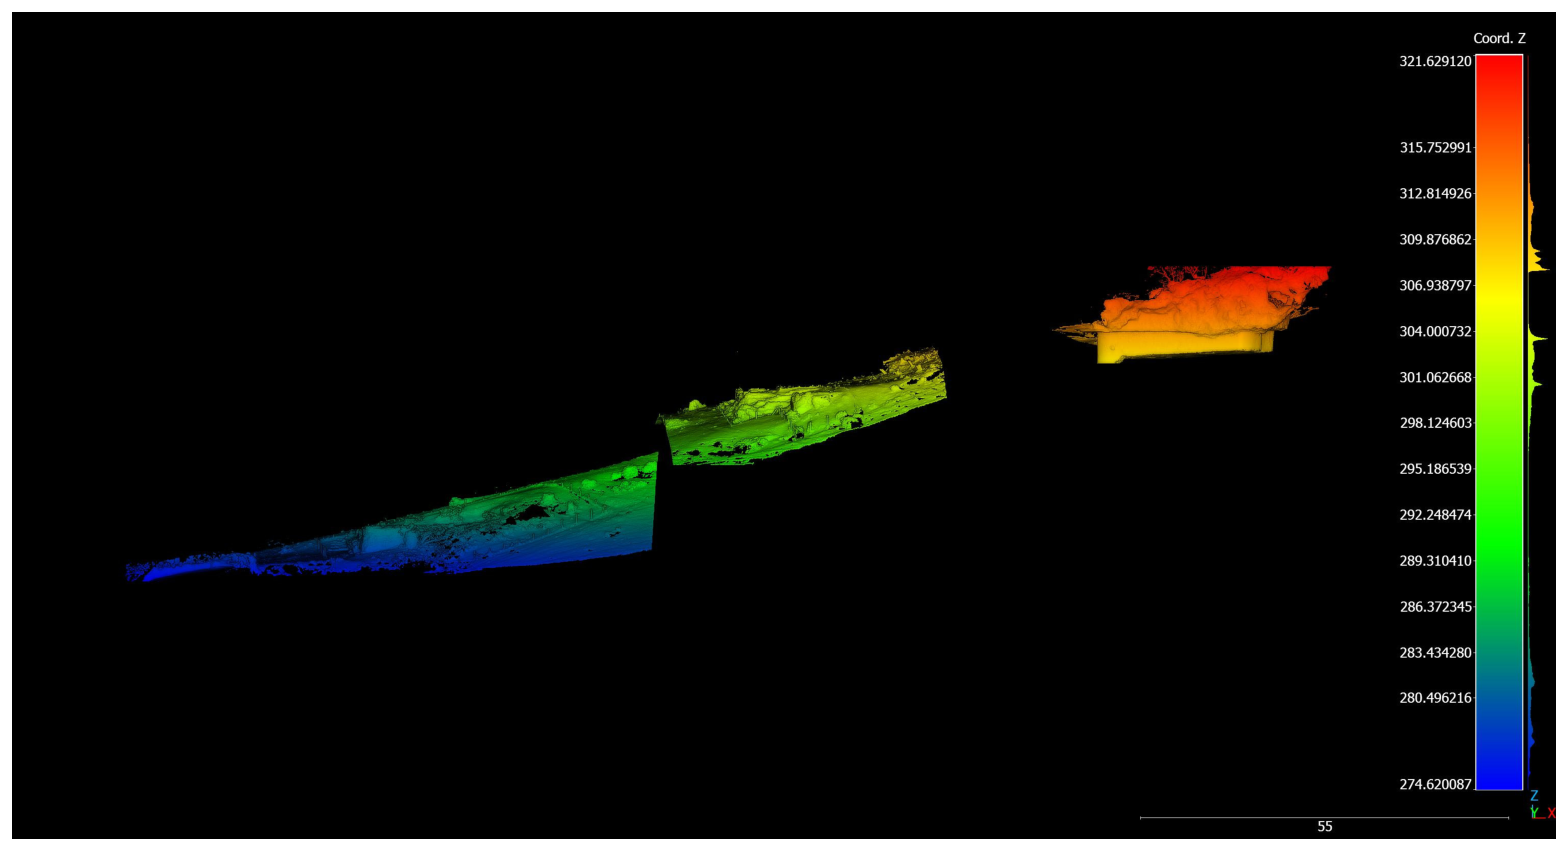
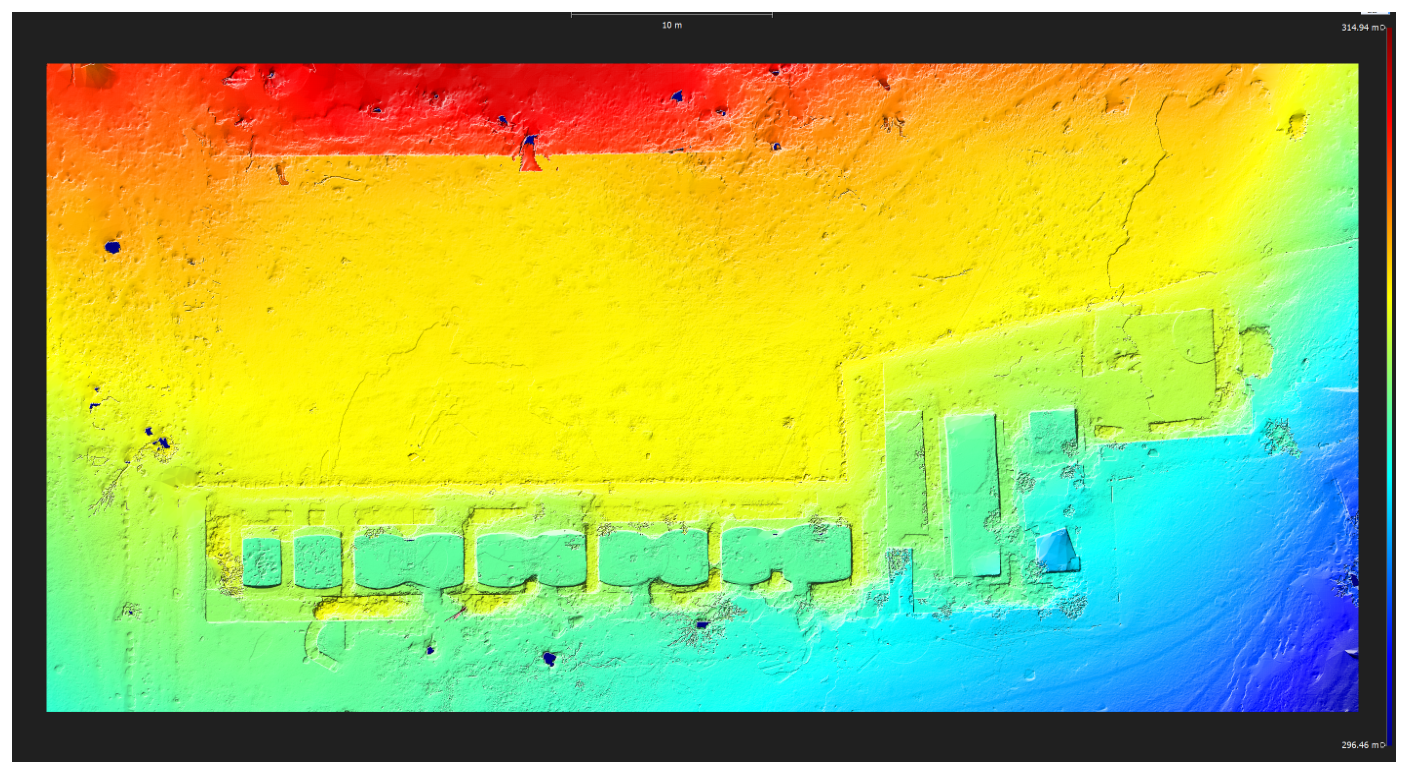
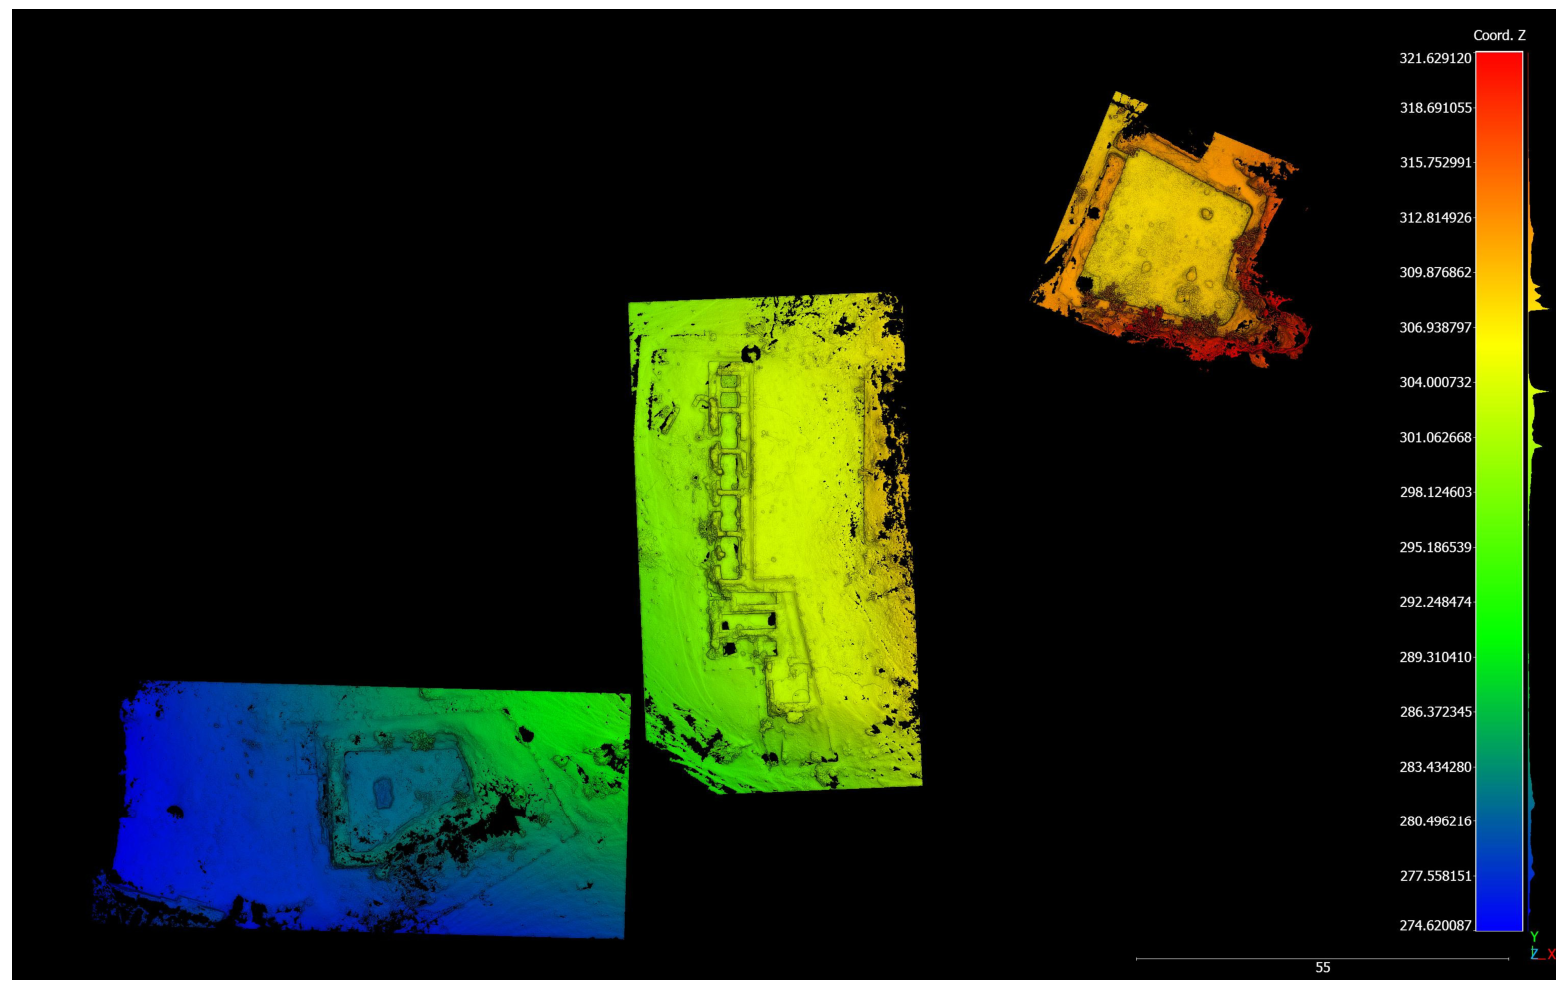
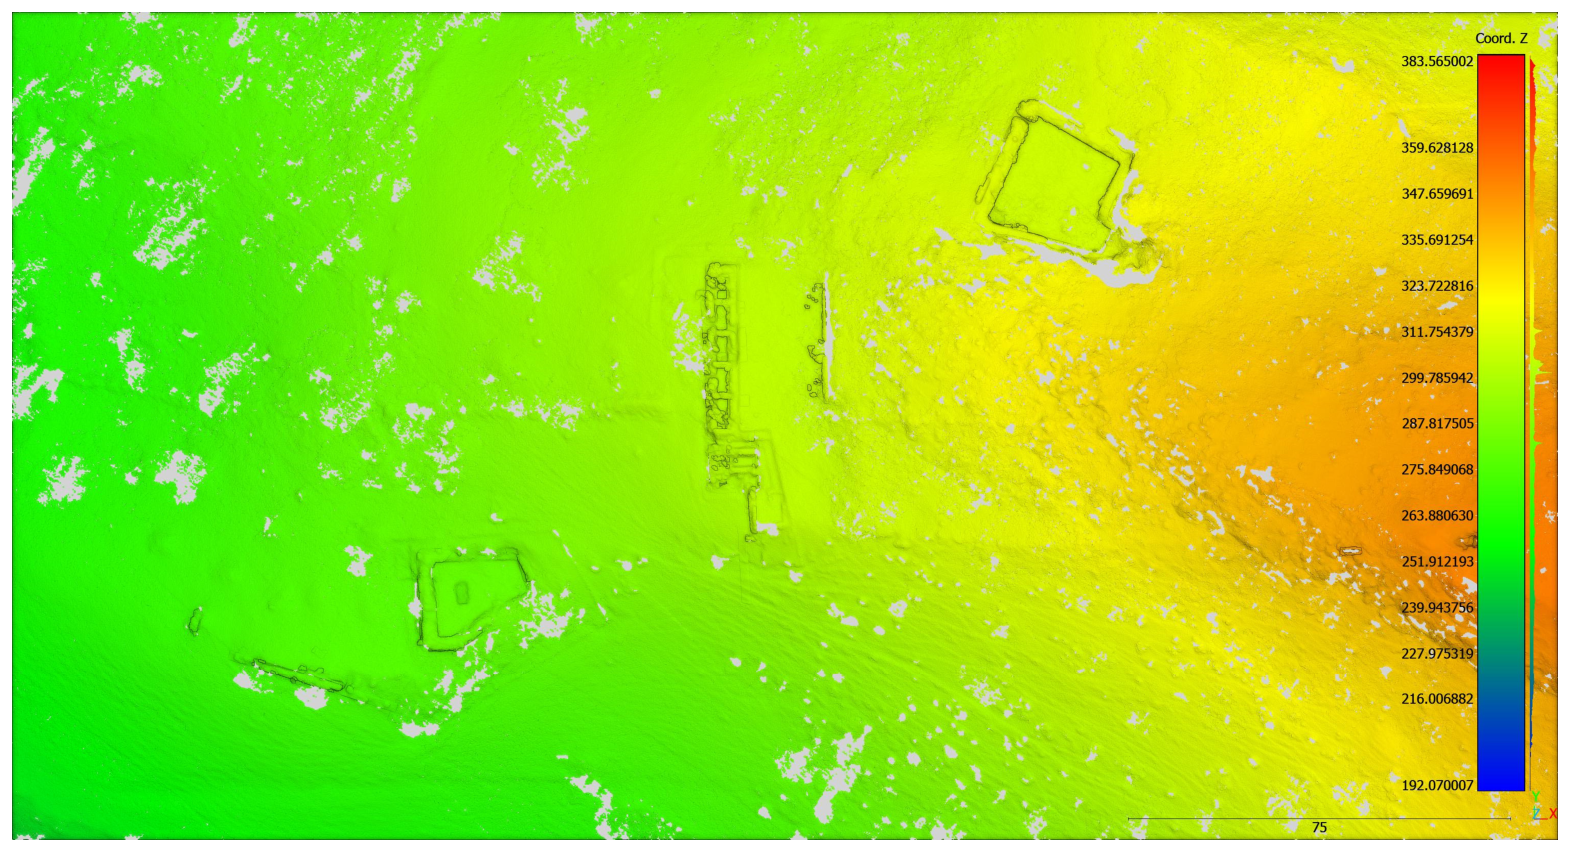
The plan view reveals a non-random spatial arrangement, with the sedimentation basins located between the Great Cistern and the fountain. The elevation view highlights a clear altimetric gradient across the complex, with the Great Cistern positioned at the highest elevation, followed by the sedimentation basins and, finally, the fountain at the lowest level.
In addition to the Great Cistern, two further hydraulic structures were documented and modeled: a set of sedimentation basins (piscinae limariae) and a fountain. All three structures were reconstructed as georeferenced and scaled three-dimensional point clouds, allowing their spatial relationship to be assessed in a common reference system (
Figure 11 and
Figure 12).
4. Discussion
Within 3D reconstruction, the evaluation of accuracy is a crucial indicator for representing the performance and quality control of a measurement system [
41]. Furthermore, the accuracy specifications for the required models are becoming increasingly demanding, including in large-scale modeling [
25]. On the other hand, more research is focusing on analyzing and comparing the potential of classical photogrammetry versus laser scanning for 3D data acquisition [
18,
19]. However, studies assessing the geometric resolution and accuracy of large-scale 3D data sets are less common. If the approach is applied to historical heritage, references become even scarcer [
20,
22,
27,
42], as most studies focus on accuracy in 3D reconstruction applied to industry or architecture [
21,
43].
Metrology is the science that studies measurements, their results, uncertainty, and their applications. To achieve this, it is essential not only to obtain and express the value of any physical quantity using appropriate instruments but also to determine the quality of this value by establishing the potential dispersion or variation in specific parameters [
44].
In the context of photogrammetry and laser scanning, all notions of measurement and uncertainty estimation are applicable. International bodies such as the International Organization for Standardization (ISO) and the International Organization of Metrology, among others, have developed the Guide for the Expression of Measurement Uncertainty (GUM) [
45]. This guide is the most comprehensive and widely used source for expressing measurement uncertainty.
It is important to highlight the differences in accuracy observed between three-dimensional point clouds generated by both techniques. Laser scanning has traditionally been considered the more accurate measurement method, even being used as a reference in some studies. However, with advancements in photographic equipment technology and the evolution of photogrammetric processing software, the generation of 3D point clouds now achieves a quality previously only feasible with laser scanning [
46]. This article demonstrates that photogrammetry can produce 3D models with higher detail resolution and geometric accuracy. While laser scanning is less affected by light conditions, photogrammetry captures surface textures and colors with a higher level of detail and quality [
47]. These findings are consistent with studies where photogrammetry yields more accurate results than laser scanning [
21,
22]. This difference may be due to photogrammetry’s ability to capture texture information with greater fidelity, resulting in more detailed and realistic models in specific scenarios.
This study compares the geometric discrepancies obtained from photogrammetric and terrestrial laser scanning datasets acquired using Nikon photographic equipment and a Leica laser scanner. Under the field conditions of this survey, photogrammetry produced lower external checkpoint discrepancies than terrestrial laser scanning. Similar centimetric discrepancies between photogrammetric, terrestrial laser scanning, and topographic datasets have been reported in complex heritage environments and large architectural structures [
48]. Likewise, Wilkinson et al. [
49] reported comparable discrepancies between TLS and Structure from Motion datasets acquired under real outdoor field conditions. Recent comparative studies have further demonstrated the growing applicability of Structure-from-Motion approaches for the documentation of architectural heritage under complex field conditions [
50].
The sediment volume calculated from the solid model is estimated at 819.858 m3, representing 37.5% of the total volume of the Great Cistern, which has a maximum capacity of 2180 m3 at a height of 5 m. This suggests that approximately one-third of the cistern’s capacity is currently occupied by sediment.
Functional Interpretation of the Hydraulic System
The three-dimensional documentation of the Great Cistern, the sedimentation basins (piscinae limariae), and the fountain allows the hydraulic complex of Sierra Aznar to be interpreted as a coherent system rather than as a set of isolated structures. Although no direct physical connections between these elements have been archaeologically identified, their spatial arrangement, relative distances, altimetric relationships, and volumetric contrasts provide a consistent basis for exploring functional hypotheses regarding water management at the site.
From a planimetric perspective, the three structures are located at relatively short distances from one another (
Figure 13).
Centroid-based measurements indicate that the Great Cistern is separated from the sedimentation basins by approximately 77 m, while the basins themselves lie approximately 60 m from the terminal cistern (
Table 5). These distances indicate a clear spatial association between the three structures and suggest functional proximity rather than independent or unrelated constructions. The intermediate position of the sedimentation basins between the cistern and the fountain is particularly significant, as it corresponds to the spatial logic typically observed in Roman water systems designed to regulate and condition water prior to its redistribution.
Altimetric analysis further reinforces this interpretation (
Figure 14). The base of the Great Cistern is situated at an elevation approximately 13.6 m higher than that of the sedimentation basins, while the basins themselves lie approximately 16.6 m above the terminal cistern, resulting in a total vertical drop of about 30 m across the system. This stepped elevation profile defines a clear and progressive vertical gradient, fully compatible with gravity-driven water circulation. Importantly, the moderate nature of these gradients suggests a system designed for controlled transfer and regulation rather than rapid evacuation, and does not require the assumption of continuous flow or permanently active conduits. Instead, it indicates that water could be conveyed between structures when needed, following the natural topographic slope and the functional requirements of each element.
Volumetric relationships between the structures also point to functional differentiation (
Table 6). The Great Cistern represents the dominant storage element within the system, with a calculated capacity of approximately 2180 m
3. In contrast, the sedimentation basins exhibit a significantly smaller combined capacity, estimated at approximately 95 m
3, while the fountain displays an estimated storage capacity of approximately 443 m
3. This pronounced contrast in storage capacity suggests a system in which water was accumulated and regulated at a large scale in the cistern, subsequently conditioned or clarified in the sedimentation basins, and finally released or accessed in a controlled manner at the terminal structure. The fountain, whose capacity represents roughly one-fifth of the Great Cistern, likely operated as a secondary regulating reservoir within the hydraulic sequence.
The proportional relationship between storage capacities and the stepped altimetric configuration of the structures suggests a system designed for graduated regulation of water resources, in which large-scale accumulation, intermediate clarification, and controlled redistribution were spatially organized along the natural slope of the landscape.
The estimated sediment accumulation within the Great Cistern, amounting to approximately 37.5% of its total capacity, further supports a long-term, multifunctional use of the system rather than a strictly domestic or potable water function. Periods of reduced maintenance or shifting functional priorities may have altered the role of individual elements within the complex over time, a pattern commonly documented in Roman hydraulic infrastructures following changes in settlement dynamics or administrative organization.
Taken together, the spatial configuration, altimetric hierarchy, and volumetric differentiation observed among the three structures are consistent with a deliberately organized hydraulic system in which storage, clarification, and distribution were functionally separated. Within this framework, the Great Cistern likely acted as a large-scale regulating reservoir, the sedimentation basins as intermediate treatment or control elements, and the terminal cistern as a point for controlled release or localized use.
While the absence of preserved conduits prevents the reconstruction of a definitive hydraulic circuit, the three-dimensional data demonstrate that the system was architecturally and topographically prepared to operate as an integrated whole (
Figure 15). This interpretation emphasizes the value of spatial and volumetric analysis derived from three-dimensional documentation for advancing system-level understanding of Roman hydraulic landscapes, even in contexts where direct structural evidence of connectivity is incomplete or no longer preserved.
5. Conclusions
This study presents a comprehensive three-dimensional documentation and quantitative analysis of the Great Cistern of Sierra Aznar, contributing to the understanding of one of the largest Roman hydraulic structures identified in the region. The integration of photogrammetry, terrestrial laser scanning, and topographic control enabled the generation of a geometrically reliable model suitable for planimetric, volumetric, and morphometric analyses under complex archaeological field conditions.
The geometric validation performed during the study confirmed the metric consistency of the reconstructed model, with low-centimetric discrepancies considered appropriate for the analytical objectives of the research. This level of reliability provided a robust basis for the quantitative assessment of the structure and for the interpretation of its spatial relationships within the broader hydraulic landscape of Sierra Aznar.
Based on the reconstructed geometry, the storage capacity of the Great Cistern was estimated at approximately 2,180,000 L (2180 m3) at a water depth of five meters, confirming the exceptional scale of the structure within the archaeological context of the site. In addition, the estimated sediment accumulation of approximately 819.9 m3, corresponding to nearly one-third of the total capacity, offers valuable evidence regarding post-depositional processes and the long-term evolution of the cistern.
Beyond the analysis of the cistern itself, the combined study of the sedimentation basins (piscinae limariae), the fountain, and the Great Cistern revealed a coherent spatial and altimetric organization consistent with a gravity-driven water-management scheme. Although direct hydraulic conduits are not currently preserved, the observed elevation hierarchy and volumetric relationships support the interpretation of these structures as functionally differentiated components of an integrated hydraulic landscape.
Overall, the results demonstrate the value of high-resolution three-dimensional documentation for the study and preservation of large archaeological hydraulic structures. In this context, the Great Cistern of Sierra Aznar constitutes a representative case study showing how quantitative spatial analysis can contribute to archaeological interpretation, conservation planning, and future research on Roman water-management systems. Future investigations may further refine the functional interpretation of the site through additional archaeological evidence and hydraulic modelling approaches.