1. Introduction
Rural spaces, particularly those located in natural settings far from large urban areas, have traditionally received limited attention within tourism research. Unlike urban or coastal destinations, where problems of overcrowding and conflicts with the local population are widely documented, tourism has generally been perceived in these territories as an opportunity for economic development and demographic revitalization, rather than as a source of social or territorial tensions.
However, various studies have highlighted the structural difficulties that condition the development of less dynamic rural spaces [
1]. These territories are characterized by the persistent accumulation of socio-economic disadvantages that limit their capacity for growth, hinder population retention and restrict equitable access to services, resources and opportunities. The interaction of these factors generates negative feedback dynamics that intensify disadvantage and reduce the possibilities of territorial transformation.
In this context, the demographic dimension takes on a central role. Continued population loss, marked ageing, low birth rates and negative migratory balances—especially among young people—are defining features of these spaces [
2,
3]. Depopulation is not only a consequence of disadvantage, but also acts as a factor that perpetuates it, by weakening the social base needed to drive innovation and development processes.
Rural disadvantage has been widely addressed in the literature, both from conceptual approaches [
4,
5,
6,
7] and from applied perspectives focused on the relationship between inland tourism, sustainability and local dynamics in disadvantaged areas [
8,
9,
10,
11,
12]. Likewise, relevant contributions have been made regarding the classification and conceptualization of rural spaces affected by crisis and depopulation processes [
13,
14,
15].
Within this framework, the cultural landscape concept has acquired growing relevance as an analytical category. Since its incorporation into the scientific sphere in the nineteenth century, it has evolved towards approaches that integrate dimensions such as sustainability, heritage and the geosystem. Understood as the result of historical and current interactions between society and nature, cultural landscapes are recognized by international bodies such as UNESCO, International Union for Conservation of Nature, and the Council of Europe. Instruments like the European Landscape Convention (2000) and Spain’s National Plan for Cultural Landscape (2012) reflect their importance, particularly as assets for tourism developed in rural spaces. The El Paular Valley, located in the Sierra de Guadarrama National Park, exemplifies such a landscape, where monastic history, traditional paper milling, forestry, and modern conservation coexist within a mountainous environment of high ecological value.
The rise of inland tourism is partly explained by the saturation of traditional destinations, the implementation of sustainable tourism policies and the revaluation of natural and cultural heritage. In this sense, its development in protected areas and mountain areas potentially contributes to economic revitalization and the mitigation of rural disadvantage, as underlined by various authors [
16,
17,
18].
The analysis of tourism mobility has been transformed in recent years by the incorporation of new data sources based on Information and Communication Technologies (ICT). Geolocated Big Data offers high spatial and temporal detail, large volume, and rapid updating [
19,
20]. Among these sources, mobile phone data have demonstrated significant potential for tourism studies, enabling the observation of spatial and temporal visitor patterns with a granularity unattainable by traditional surveys [
21,
22,
23,
24]. In particular, mobile phone data make it possible to obtain detailed information on the spatial and temporal patterns of visitors, overcoming some of the limitations of traditional data sources. Other advantages of using mobile phone data include greater spatial penetration that allows analysis in isolated or sparsely populated areas, a much higher temporal frequency enabling the downloading of updated data, and low cost due to the availability in many cases of such data free of charge on open platforms such as the Experimental Statistics portal of the National Statistics Institute (INE) [
25,
26,
27].
National statistical institutes have been exploring these data sources for official tourism measurement. Ref. [
28] documented early experiments at Statistics Netherlands, while [
29] proposed a methodological framework for producing national tourism statistics from mobile positioning data in Estonia based on previous works [
21,
22]. In Germany, ref. [
30] explored the opportunities and limits of passive mobile data for destination management. In recent years, a growing body of research has applied mobile phone data to analyze natural areas, although in most cases the studies are based on urban parks [
26,
31,
32,
33,
34,
35].
Regarding the use of geolocated Big Data for the study of mobility in natural parks, previous literature has used social media data such as Twitter or Instagram [
36,
37,
38]. However, mobile phone data are increasingly preferred over social media due to their more systematic population coverage. Thus, ref. [
39] used mobile phone data to quantify spatiotemporal changes in visitation to Japanese conservation areas during the COVID-19 pandemic. Ref. [
25] demonstrated the economic valuation of coastal tourism under climate change scenarios using nationwide mobile network data in Japan. In South Korea, ref. [
40] studied the mobility flows of tourists travelling to Jeju Island. In Spain, ref. [
27] studied tourism characteristics in a depopulated rural area, Las Merindades (Burgos), using the same INE experimental data source employed here.
Despite its advantages, mobile phone data present significant limitations. The INE’s experimental statistics exclude intra-provincial flows, meaning that for destinations like Rascafría—located within the province of Madrid—the dominant visitor segment (day-trippers from the metropolitan area) is entirely absent from the dataset. These structural conditions bias all subsequent spatial and volumetric analyses, a factor that has been acknowledged only marginally in prior work and which this study places at the center of its methodological inquiry.
In this context, the principal research question is as follows: To what extent do available experimental data sources allow for the accurate demonstration of short-radius trajectories (proximity visitor dynamics) in protected areas? From this central question, three operational sub-questions are derived:
To what extent do mobile phone data reproduce the temporal structure of visitor flows captured by official Park sources?
What is the spatial structure of non-metropolitan tourist demand for Rascafría?
What is the level of tourist pressure on the municipality in relation to its resident population?
The first objective of this study is to analyze the spatiotemporal characteristics of tourism in Rascafría, a rural inland municipality exhibiting dynamics of demographic and economic decline, yet located within a protected cultural landscape of high environmental and heritage value. The second objective is to evaluate the complementarity between traditional data sources (official statistics and administrative records) and new geolocated sources (mobile phone data) for studying tourism dynamics in a rural area proximate to a major metropolitan center.
The originality of this research, compared to prior studies, lies in two aspects. First, it offers an in-depth case study that exposes the specific methodological tension produced when a proximity-dominated destination is analyzed with a data source that systematically excludes the primary local market. Second, it incorporates a broader suite of indicators—including tourism pressure, seasonality, and tourism market indices, as well as a distance-decay regression model—that directly address questions of sustainability and spatial friction. Rather than merely characterizing tourist flows, the study explicitly tests the complementarity and divergence of data sources, positioning the methodological lesson as its primary contribution.
2. Study Area
The Sierra de Guadarrama National Park, located in the northwest of the Community of Madrid and declared a National Park in 2013, is the second most visited in Spain, after Teide (Tenerife). Visitor numbers reached 2.2 million in 2024, according to the Autonomous Agency for National Parks, confirming the Park’s crucial role as an accessible nature destination, especially for residents of Madrid and nearby regions.
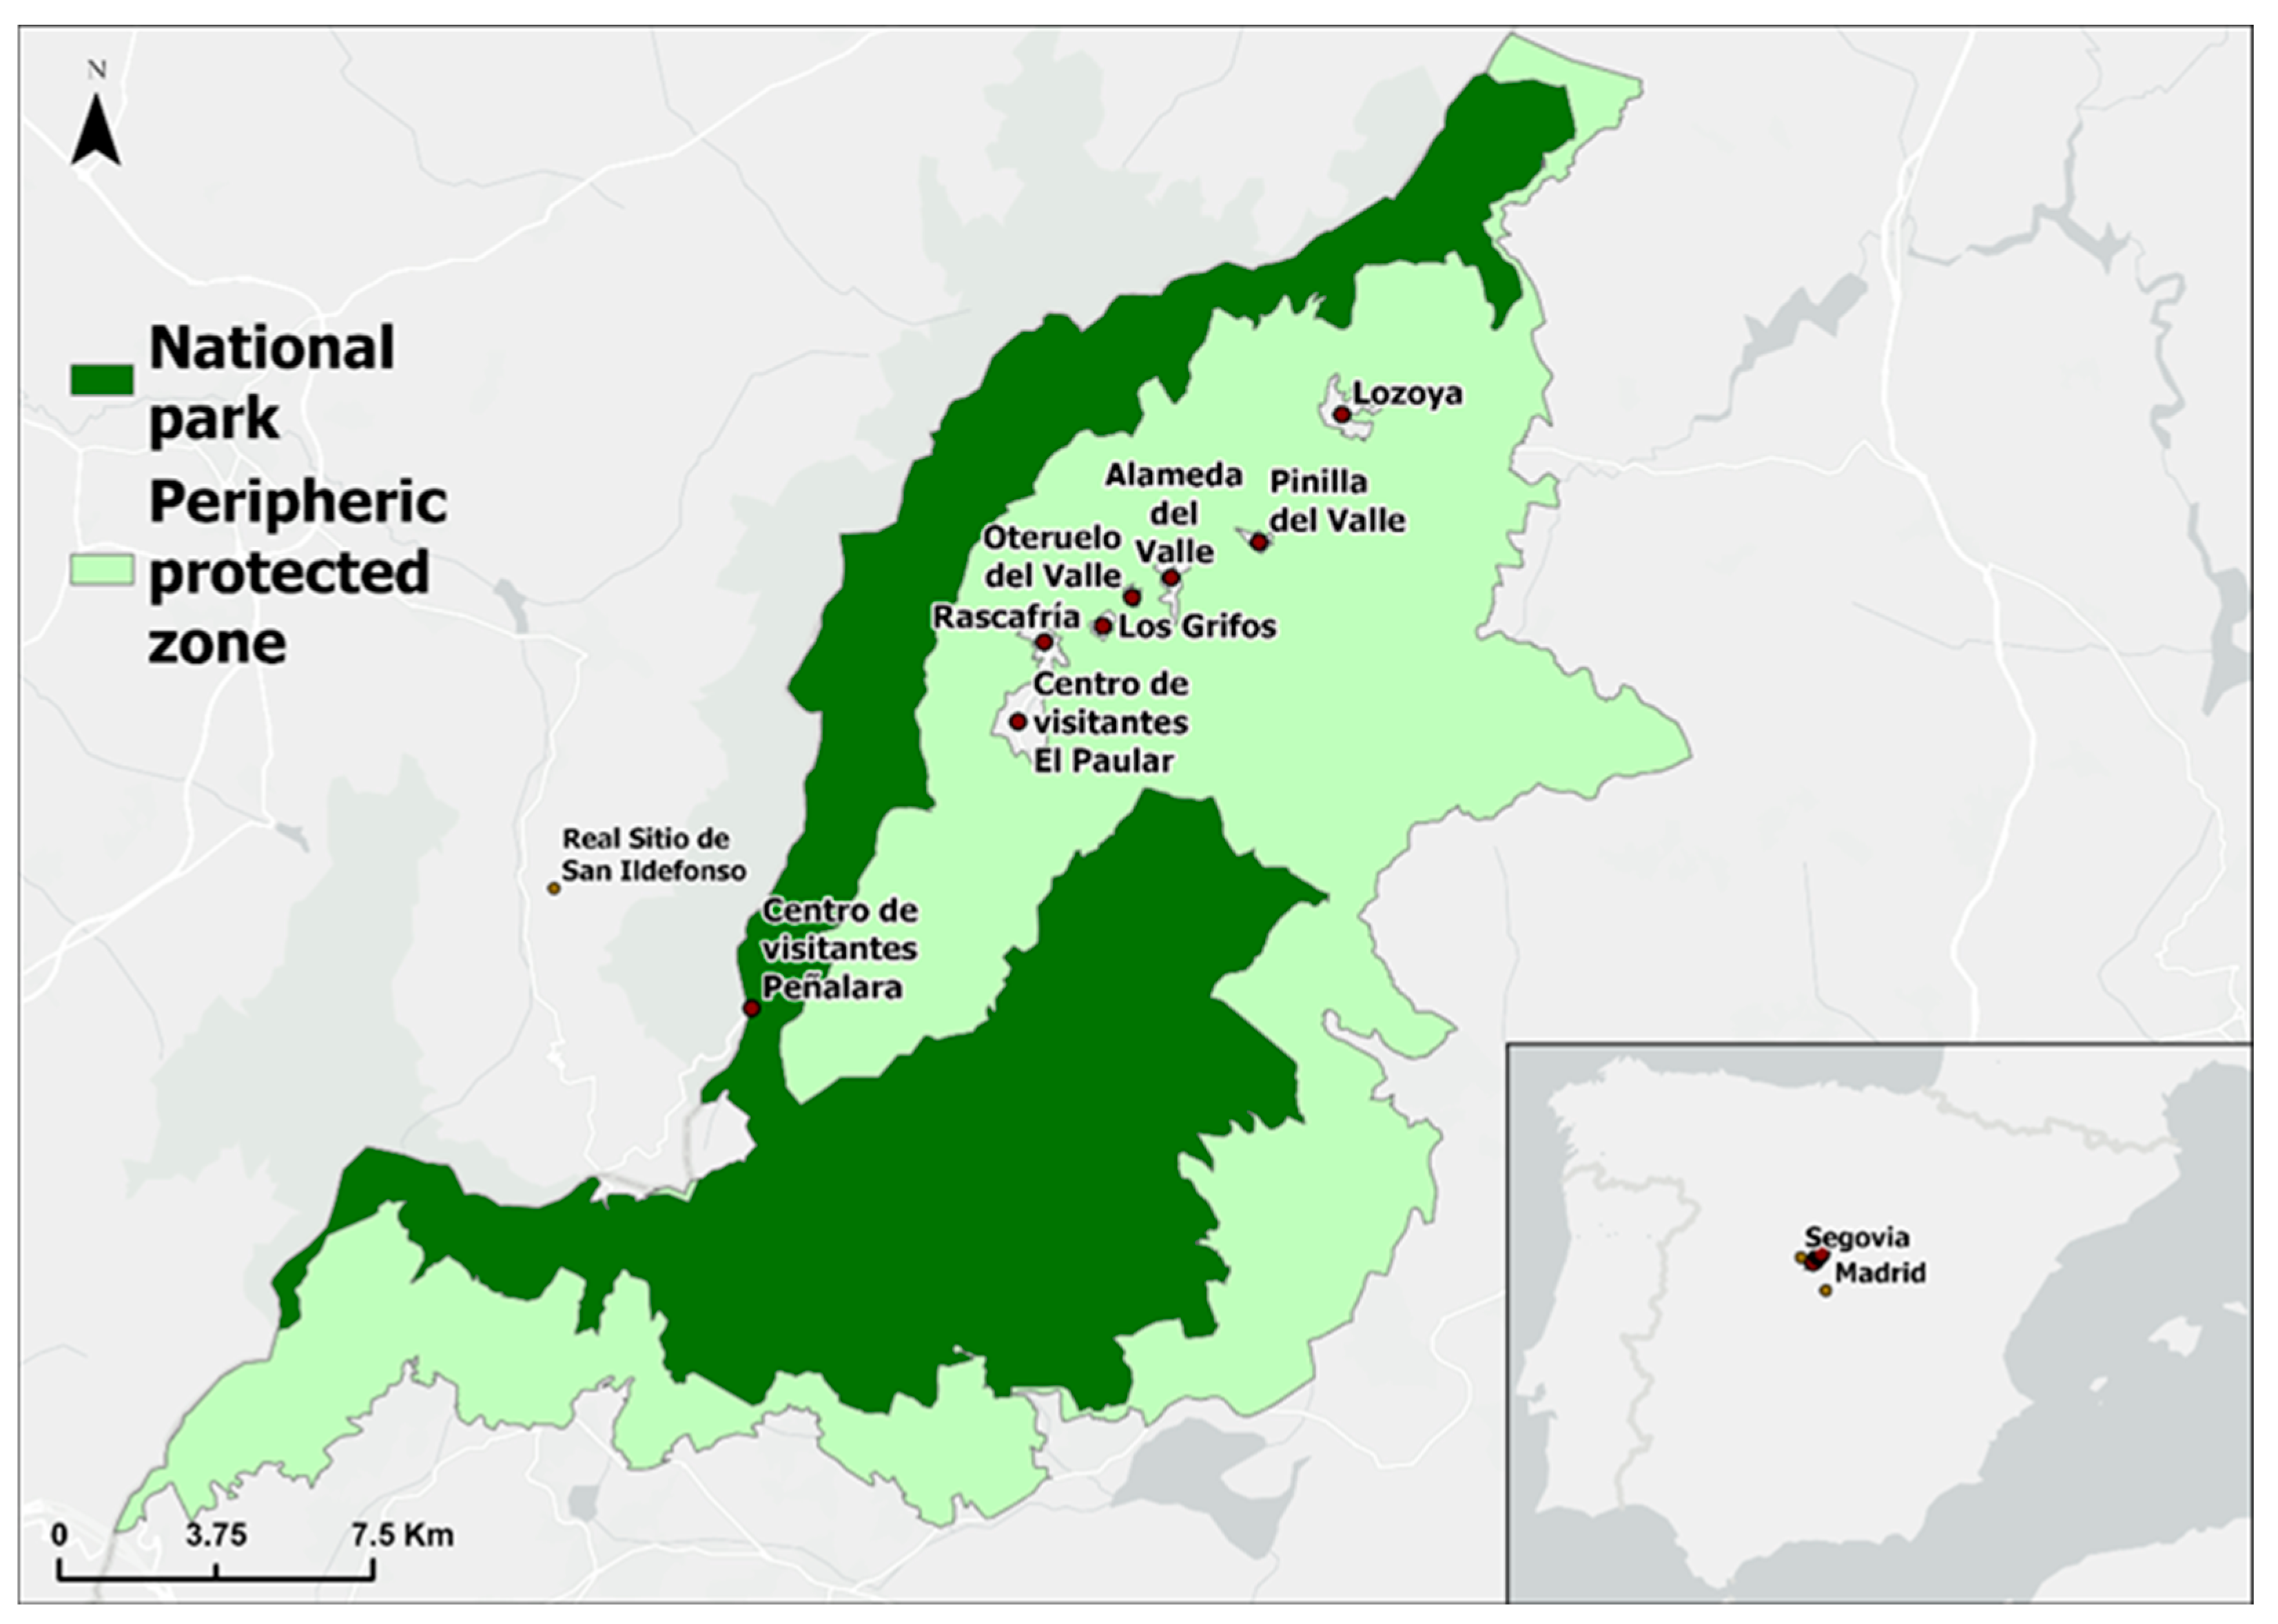
The El Paular Valley lies in the northeastern sector of the National Park (
Figure 1). Its landscape results from the interaction of natural features—mountainous relief, dense pine and oak forests, and glacial lagoons—and a long history of human occupation that has left a sustainable footprint integral to the area’s visual and heritage richness [
41,
42,
43,
44].
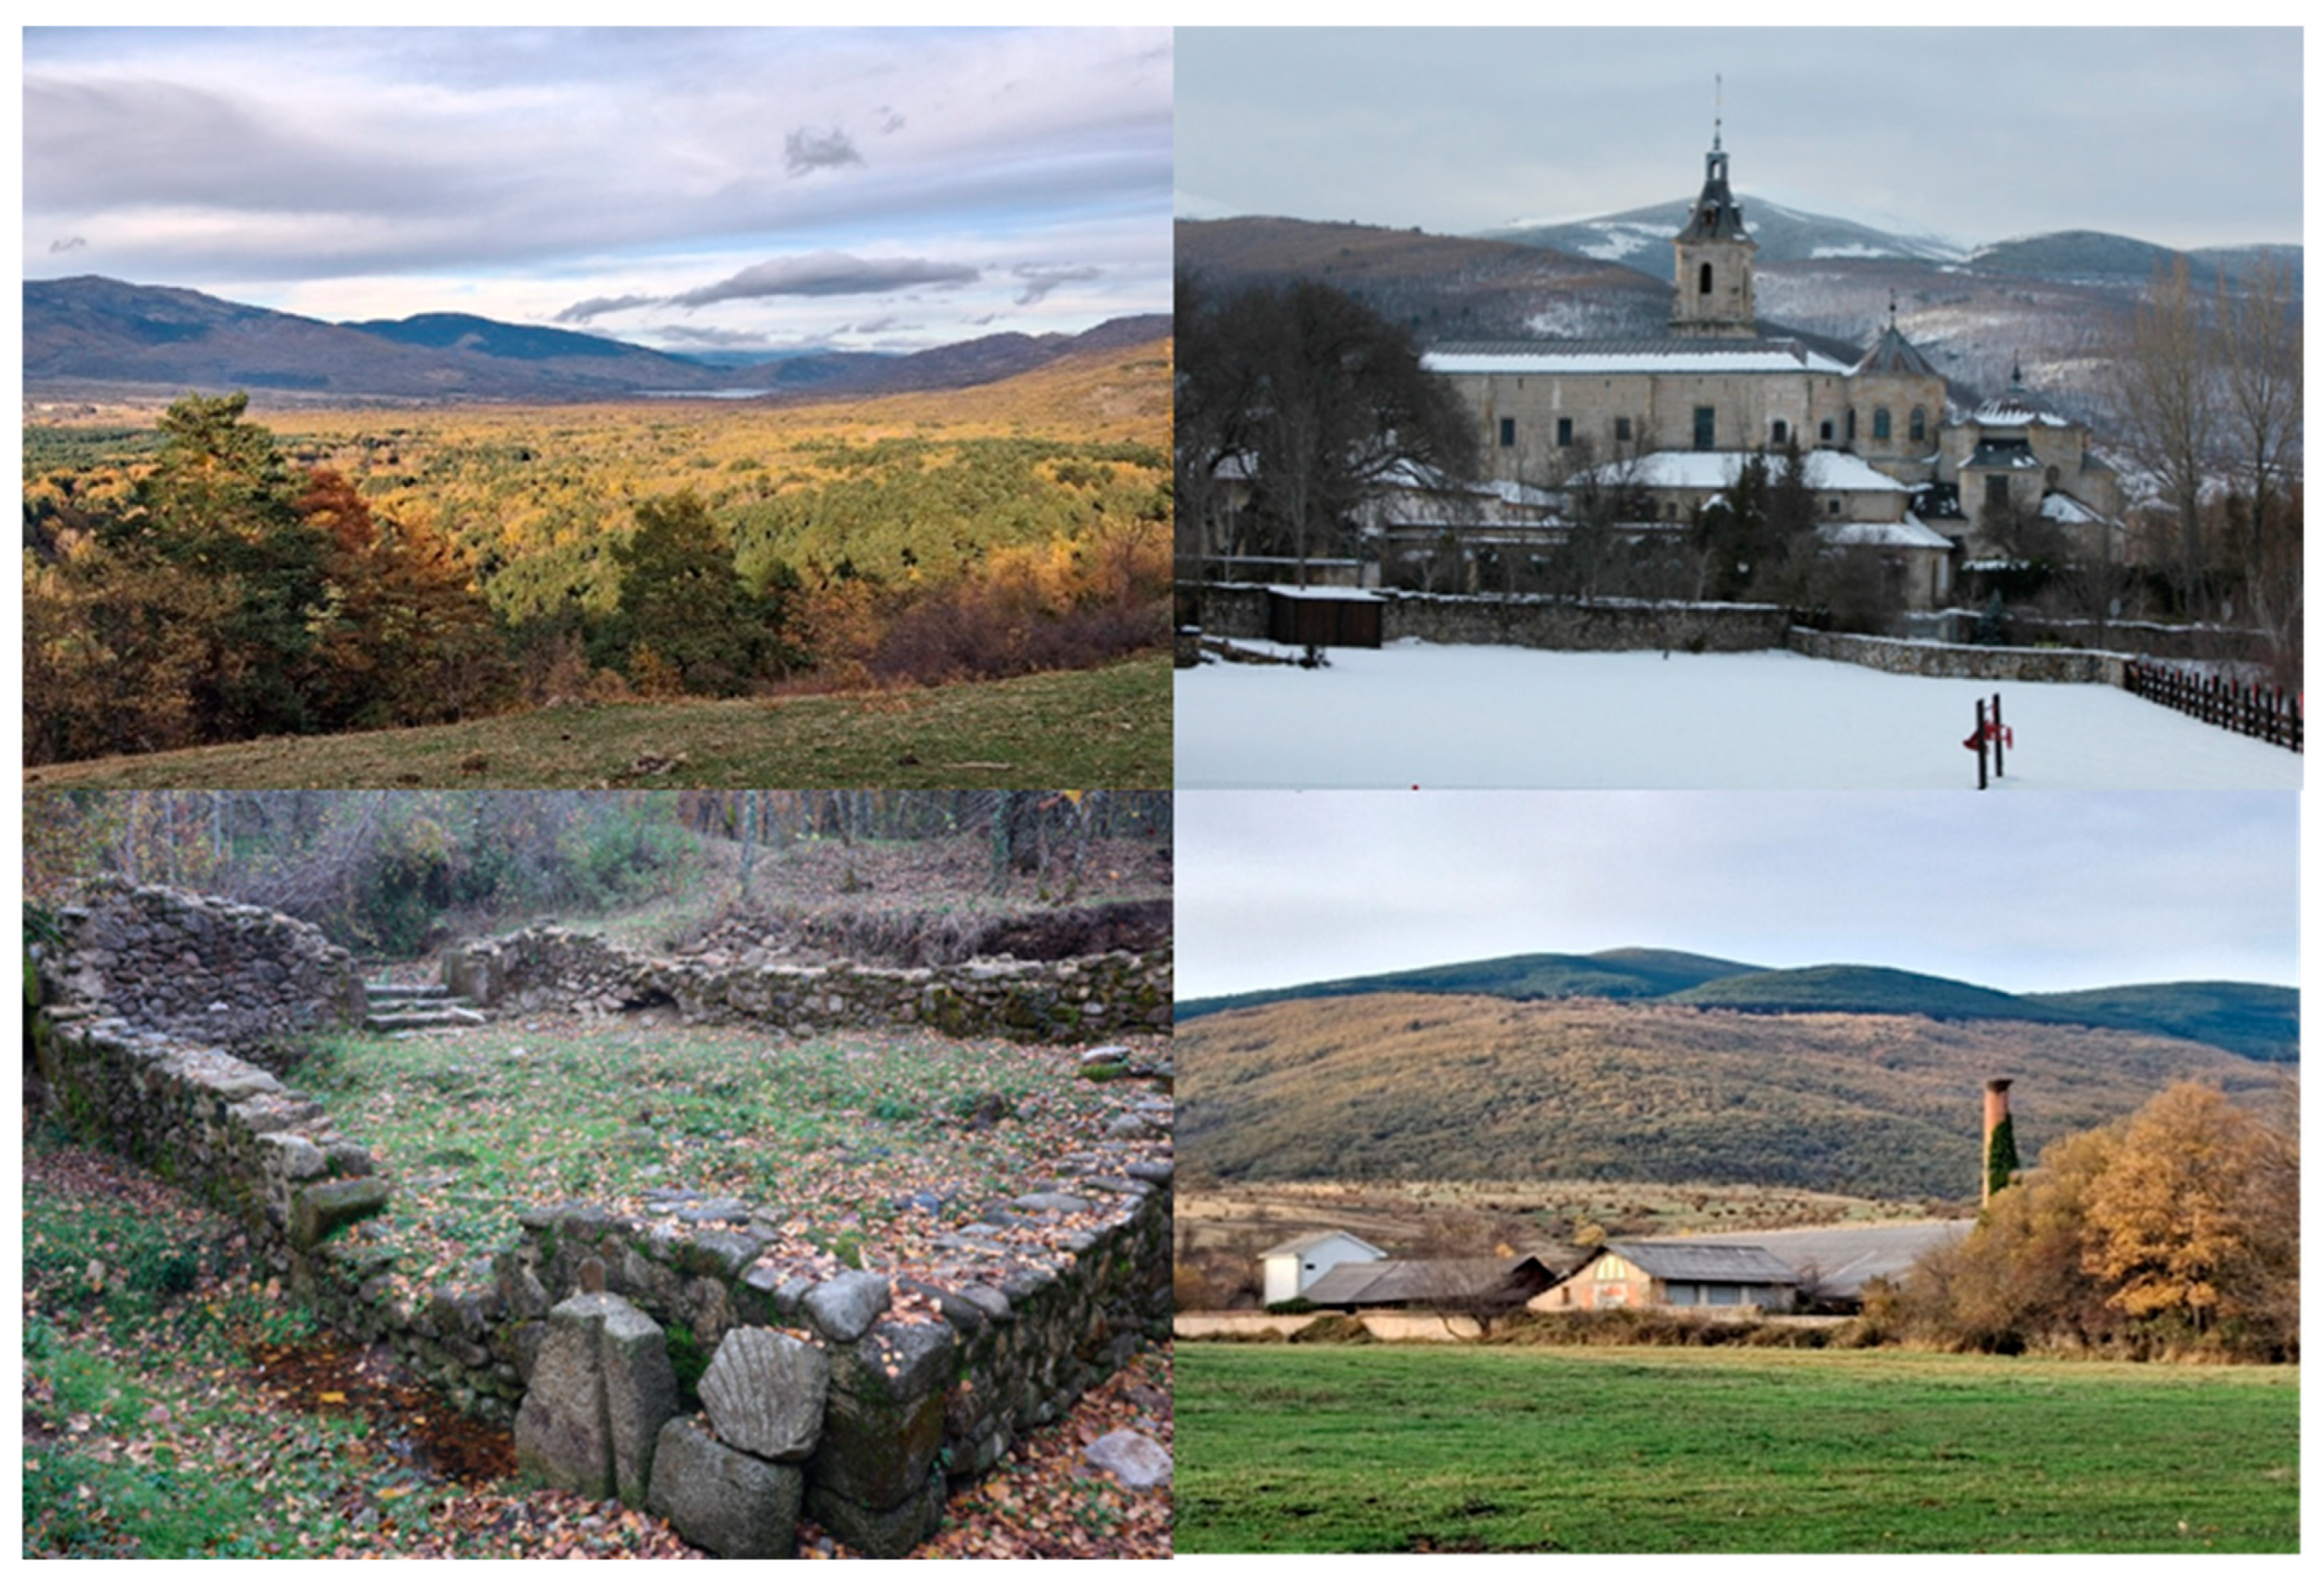
The cultural elements of this landscape are determining factors in its character (
Figure 2). Beyond the discovery of Neanderthal remains near Rascafría, the valley has been a historically strategic enclave due to its geographical isolation and orographic defense. During the Middle Ages, settlement by inhabitants from Segovia initiated agricultural and livestock activity. The pivotal milestone was the foundation of the El Paular Monastery in 1390, in what is now the municipality of Rascafría, which became a factor of territorial control, local economic dynamization, and promotion of art and pilgrimage, eventually giving its name to the entire valley.
The monastery reached its zenith in the 16th and 17th centuries with the construction of roads, bridges, a sawmill, and several paper mills (batanes) that used the waters of the Lozoya River for cellulose extraction. For centuries, a notable equilibrium existed between monastic life, livestock farming, forestry, and paper manufacturing, contributing to the conservation of the natural environment. During the Mendizábal confiscations of 1835–1836, the monastery was expropriated, initiating a period of heritage decline. However, the area gained new prominence at the end of the 19th century as a place of rest, excursion destination, and focus for landscape painters, attracted by its artistic, natural, and symbolic values.
The demand for conservation of the Sierra de Guadarrama extended throughout the second half of the 20th century, culminating in the declaration of the National Park in 2013. The zone became a protected space with limits on urban development and resource exploitation, and a reinforced destination for sustainable tourism and environmental education [
45,
46,
47].
The total area of the municipalities comprising the El Paular Valley is 259.07 km2, with a low population density of approximately 10 inhabitants per km2. According to the 2025 Population Census, the total population is 2787 inhabitants. Rascafría, with 1764 inhabitants, represents 63% of the total. The population over 65 years of age constitutes approximately one-quarter of the total, indicating significant demographic vulnerability and the configuration of the valley as a fragile space.
This research focuses on Rascafría because it is the only municipality in the valley for which mobile phone data are available for the entire temporal study period. Furthermore, Rascafría is a territorially extensive municipality that concentrates a high number of culturally significant heritage resources and a large surface area integrated within the National Park.
3. Materials and Methods
3.1. Materials
The primary experimental data source is the Experimental Statistics on Tourism Measurement based on mobile phones, published by the Spanish National Statistics Institute (INE). This source uses aggregated, anonymized data provided by the three major mobile phone operators in Spain (Movistar, Vodafone, and Orange) to estimate inter-municipal and international tourist flows for the reference year 2024. Through the signaling of mobile phones picked up by telephone antennas (mobile geolocation), it has been possible to know, in an aggregated and tabulated form, without any type of individual information, the origin of tourists, both residents and foreigners, who have visited the study area. The data have been published by the INE from mid-2019 to the present, allowing for the establishment of a significant trend in registered movements and the geographical origin of visitors. It is a very useful analysis tool, termed experimental due to its recent publication and its novelty compared to traditional sources, with outstanding geographical granularity, or detail of the information provided, as information is published at the level of Autonomous Community, province, and municipality regarding tourist destination and origin.
Specifically, the records of inbound tourism and provincial domestic tourism for the year 2024 have been used. These records include the number of tourists visiting a specific destination municipality during a month, and the municipality, country, or continent of origin. Compared to the traditional source of the Resident Tourism Survey (ETR), published by the INE and used complementarily in this study, the experimental statistics based on mobile geolocation expand the set of individuals about whom the operators have information, much larger than the sample size of the ETR, making the estimation of trips more precise. Geographical disaggregation, on the other hand, is broader: the information provided in the ETR is at the Autonomous Community level, while the experimental statistics reach the province and municipality level. This, in itself, constitutes a significant advantage concerning the objectives of this research. Finally, another notable advantage is that, unlike the ETR, whose results are published quarterly, the experimental survey provides monthly results.
In any case, it is also important to highlight that the information from mobile geolocation does not allow us to know qualitative variables about the trips or visitors, such as the reason for the trip, means of travel organization, activities, etc. It must also be taken into account that measuring tourists with this system is subject to operational limitations, so it should be noted that the statistics identify a resident in Spain as a traveler in another province through the position of their mobile device. It is easy to understand that if the same person travels with two or more terminals, they may be counted more than once, or if they keep it disconnected throughout the trip, they would not be detected by the operator.
Furthermore, it is essential to state explicitly that these data exclude intra-provincial mobility. For a municipality within the province of Madrid, this means that visitors from the city of Madrid and the rest of the province are not captured. This limitation conditions the interpretation of all subsequent spatial results and is treated as a central methodological theme rather than a marginal observation.
These experimental data are complemented by traditional sources: the 2024 Annual Report of the Sierra de Guadarrama National Park, which provides official visitor counts at Park centers; the Geographical Gazetteer of Municipalities and Population Entities; the INE Annual Population Census (2025 data); the Municipal Labour Market Bulletin (Ministry of Labour, 2025 data); the Data Observatory of the Community of Madrid; and the Strategic Tourism and Sustainable Development Plan of Rascafría (2025–2030).
Table 1 provides a structured inventory of each data source, the specific indicator(s) it informs, its temporal coverage, and the responsible organization.
3.2. Methods
The methodological strategy of the research is based on the case study technique of an area selected as a sample for testing the methodological complementarity of data sources in a context where proximity tourism is known to dominate. Therefore, the selection of Rascafría is based on two main criteria: an intrinsic criterion, based on the premise that the area is a unique cultural landscape near a large urban center, i.e., the city of Madrid; and a tourism criterion, based on the idea that the sources consulted, and specifically the experimental statistics based on mobile geolocation, make it possible to detect a wide variety of circumstances in the global and partial recording of visits, above all driven by both natural heritage factors, associated with the landscape, and cultural factors, motivated by the presence of an important monumental legacy. This area is understood as a case study with which to achieve results on tourist movements referring to an inland space with profound cultural connotations.
The method followed in this research has been approached through a dual pathway: documentary research and statistical research. Documentary research is based on the use of a series of secondary sources: technical documents, specialized bibliography in the field of heritage tourism, and traditional and experimental statistical sources. Extensive documentary review has always been carried out according to the research theme and objectives, creating an indispensable reference framework that has facilitated the recognition of the different existing perspectives and the variety of approaches and methods.
The National Park has a total of five visitor centers (two of which are in the municipality of Rascafría) and two information points. In each of these centers, information on in-person visitors and telematic queries received is recorded, compiled, and studied monthly to monitor the service offered and prepare an Annual Report with a wide range of parameters on the public use of the protected area.
The Annual Report, prepared by the governing body of the National Park, is based on a combination of direct and indirect methods. One of the data collection methods is through automatic counting sensors installed at main access points and strategic trails, which allow for continuous and comparable estimates of visitor numbers over time. This count, which serves to characterize visitors, is complemented by studies of data from telephone companies that help to estimate the number of visitors to the National Park in a more realistic way.
Furthermore, to typify visitors, surveys are conducted, collecting information on their profile, motivations, level of satisfaction, and knowledge of the National Park’s rules. On the other hand, understanding that social networks and the web are the most instantaneous and direct means of communication with the public, interaction statistics are also studied, and there is constant work on reviewing and improving content. Therefore, access to this extensive documentation constitutes a fundamental pillar in the analysis carried out in this study, with data from both traditional and experimental sources providing highly significant tourism information.
Data processing involved downloading the 2024 INE mobile phone data, filtering records with Rascafría as the destination, and storing the resulting tables in a PostGIS 3.6.4. version spatial database. The resulting table contains the name of the municipality or country of origin, the name of the destination municipality, the month in which the trips were made, and the number of tourists who made that trip in that month.
The analytical protocol comprised three stages: (1) temporal analysis—calculation of monthly tourist volumes, seasonality indices, and Spearman correlation between mobile data and official Park visitor records; (2) spatial analysis—construction of an origin-destination matrix using municipal centroids, calculation of market concentration indicators (Herfindahl–Hirschman Index, primacy index, effective number of source markets, coefficient of variation), weighted average distance, and a log-log distance-decay regression; and (3) pressure and market analysis—calculation of tourism pressure indices (daily tourist intensity as a percentage of resident population) and a tourism market index (proportion of foreign tourists).
The selection of these specific indicators is justified by their established use in tourism geography for characterizing market structures and sustainability pressures in rural and protected areas. The Herfindahl–Hirschman Index quantifies market concentration and resilience to demand shocks using the following formula [
48,
49]:
where
is the proportion of tourists from each municipality relative to the total number of tourists, and
is the sum of these values squared. Subtracting 1 minus the
value also yields the effective number of emitting centers.
The primacy index identifies dominance by a single source market. In this metric, the number of tourists from the municipality with the highest value was divided by the sum of the values of the four municipalities with the highest number of tourists (including the first). The weighted average distance and distance-decay model provide empirical evidence of spatial friction, grounding the analysis in distance-decay theory [
50,
51]. This model was calculated using the following formula:
where
T is the number of tourists from each municipality
i and
d is the distance between the centroid of that municipality and the centroid of the municipality of Rascafría.
The seasonality and tourism pressure indices, adapted from [
52] and the Indicator Framework for Sustainable Tourism [
53,
54] offer standardized measures of temporal concentration and visitor load relative to the host population. The Spearman rank correlation was chosen, given the non-normal distribution of monthly visitor data and its robustness to outliers, to test the alignment of temporal structures between the two sources. The regression coefficient between the number of tourists and distance was also calculated using a logarithmic model:
The seasonality index was calculated for each month by dividing the number of tourists obtained in each month by the monthly average of tourists. The following step consisted of measuring the average tourism pressure based on a daily percentage of tourist intensity, where the average number of tourists was divided by 30 and then by the number of inhabitants of Rascafría, multiplying the result by 100, and daily percentages of tourist intensity for each month based on dividing the number of tourists for each month again by 30 and by the municipality’s population. The annual and monthly tourist market index was also calculated by dividing the average and monthly number of foreign tourists by the average and monthly number of total tourists.
As noted above, the critical methodological limitation—the exclusion of intra-provincial flows—was integrated into the research design from the outset and constitutes the central axis of the results interpretation.
4. Results
4.1. Demographic and Visitor Results from Documentary Sources
Tourist activity holds primacy in the tertiary sector in the study area and is a direct factor in job creation in the El Paular Valley. According to the 2025 Municipal Labor Market Bulletin (2024 data), economic activities linked to tourism are those that concentrate the highest number of employment contracts and Social Security affiliations, representing 39% in Lozoya and 47% in Rascafría. The most prominent occupations are in restaurant and accommodation services, followed by commerce and recreational activities. These are highly significant results demonstrating the role tourism plays in the two most important localities in the study area.
For both genres, participation rates in hiring are mainly recorded among people aged 25 to 45 (41% in Rascafría and 47% in Lozoya). At the end of 2024, unemployment affected 87 people, especially among those over 45 years of age, of whom 41 were men (47.1%) and 46 women (52.9%). Considering the registered unemployment rates for some groups of interest for employment, the average figures for the two municipalities are as follows: women (54.5%); young people under 30 (13%); those over 45 (60.8%); and long-term unemployed (35%).
The total visitor record indicates that the majority group is family and friends, both at the El Paular center and at the Peñalara center. This group represents around 86% of the total in both cases, followed by educational groups (8%) and individual visits (6%). Regarding the type of activity for which visitors request information, hiking stands out first, followed by short walks and recreational stays, which together account for almost 93% of the requests attended.
Analyzing the origin of web server queries in 2024, 68% came from Maps and 32% from Google in the case of the Peñalara visitor center, while the percentages at El Paular are 57% and 43%, respectively. Telematic queries made by telephone, email, and web mail have also been numerous, especially in the spring and summer months concerning hiking and swimming areas (such as the Las Presillas natural pools) at the El Paular visitor center, and in the winter months at the Peñalara center concerning snow and ski-related activities. At this latter visitor center, queries also stand out during the spring and autumn months about the Laguna Grande de Peñalara area (of glacial origin) and the Zabala refuge, indicating a clear link during these two periods of the year with hiking activities.
In any case, it should be noted that the three types of telematic queries have decreased in recent years, as has happened for all visitor centers throughout the National Park. According to those responsible for the two centers located in Rascafría, this downward trend may coincide with the improvement of web information and through social networks, which makes telematic queries less necessary.
4.2. Temporal Results from Documentary Sources
The Sierra de Guadarrama National Park receives around 2.2 million visits annually. The Madrid part of this protected area, where the study zone and particularly Rascafría are located, records more than 600,000 visits in the three summer months, a figure that exceeds what many National Parks in Spain receive in a year. Its proximity to the city of Madrid makes it a very accessible destination for short getaways, day trips, weekends, or short holiday periods. In 2024, the number of visitors attended to at all visitor centers was 65,777 people, representing a decrease of almost 9000 visits (11.87%) compared to 2023 (
Table 2).
The monthly breakdown for these two years confirms that there were two months in which recorded visits were much higher in 2023 compared to 2024 (April and October), being only slightly higher in the remaining months. Being a mountain area, weather conditions are a natural determinant for visits, whether group, family, or individual, which causes some variability between months and years. Of the total visitors recorded in 2024 (65,777 visitors), the center with the highest number of attendances was El Paular (Rascafría), with 19,706 (30% of the total), followed by Fuenfría (Cercedilla), with 17,897 visitors (27%), and Peñalara (Rascafría), with 11,568 (18%). That is, the municipality of Rascafría stands out for the number of visitors to the National Park centers, becoming a tourist reference point for the entire protected area.
The location of visitor centers, the available public service staff, opening hours, the location of parking lots or recreational areas nearby (such as the Las Presillas natural pools in relation to the El Paular visitor center) are explanatory factors in the variability of the recorded numbers (
Table 3).
4.3. Temporal Results from Mobile Phone Data
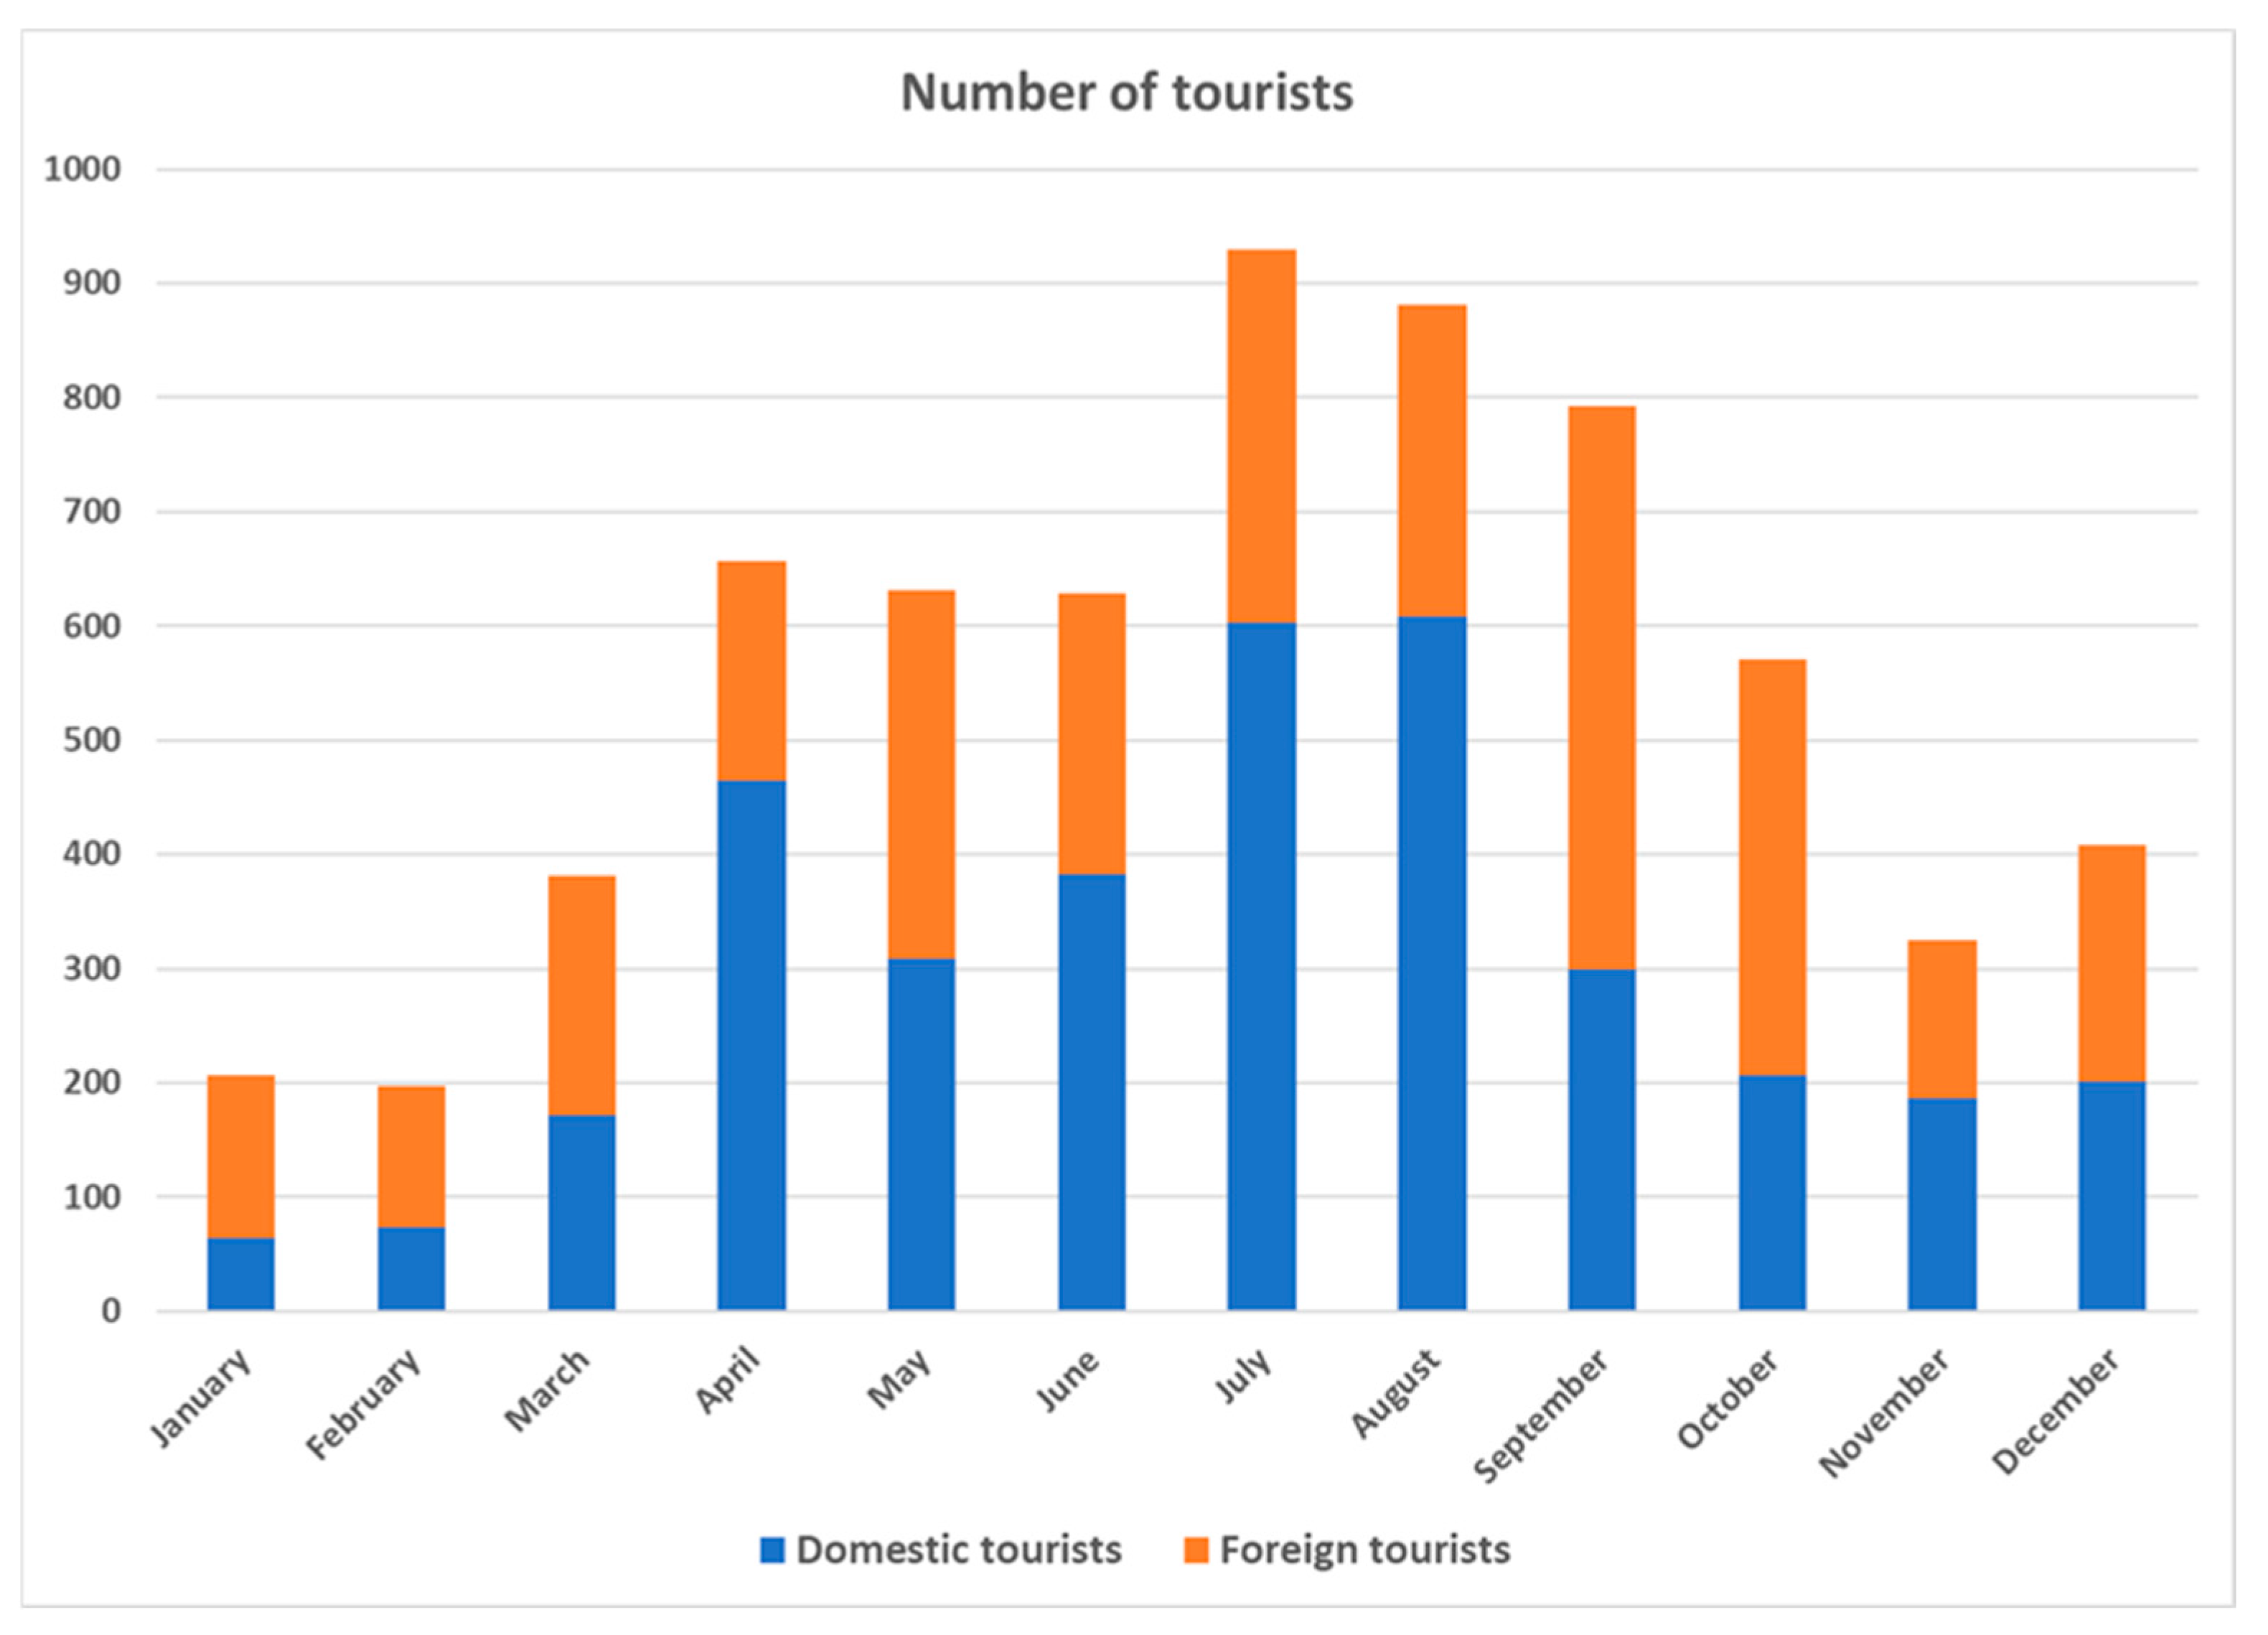
The 2024 mobile phone data record a total of 6609 tourists in the municipality of Rascafría (equivalent to 10.04% of the number of tourists compiled in the 2024 Annual Report of the Sierra de Guadarrama National Park). This substantial volumetric discrepancy is the first expression of the “absent Madrid” bias: day-trippers and excursionists from the province of Madrid, who dominate official counts, are entirely missing from the mobile dataset. The obtained results indicate the municipality of Rascafría follows the usual tourist profile in Spain, with a higher number of tourists in the summer months (July, August, September) and a lower number of tourists in winter. The data indicate an average value of 550 tourists per month, and a median of 600 tourists, which, along with the standard deviation value of 248.48, indicates that most months of the year have values above average, although with a wide dispersion in the concentration of tourists and the presence of outliers that pull the average down, corresponding to the months of November, January, and February (
Figure 3).
Despite the volumetric gap between mobile phone data and the 2024 Annual Report, the Spearman correlation coefficient between the number of tourists (r = 0.64) indicates a positive and moderate-high relationship between both data sources and shows that the phone data capture correctly the temporal structure of Rascafría’s tourist flow. However, this correlation must be interpreted with caution. A moderate r value in the presence of a tenfold volumetric difference suggests that the temporal alignment is largely driven by a shared seasonal pattern—a summer peak and winter trough—that is characteristic of any Mediterranean mountain destination, rather than by a close reproduction of the actual flow structure. The correlation confirms that mobile data capture when tourism occurs, but not at what scale or who is visiting.
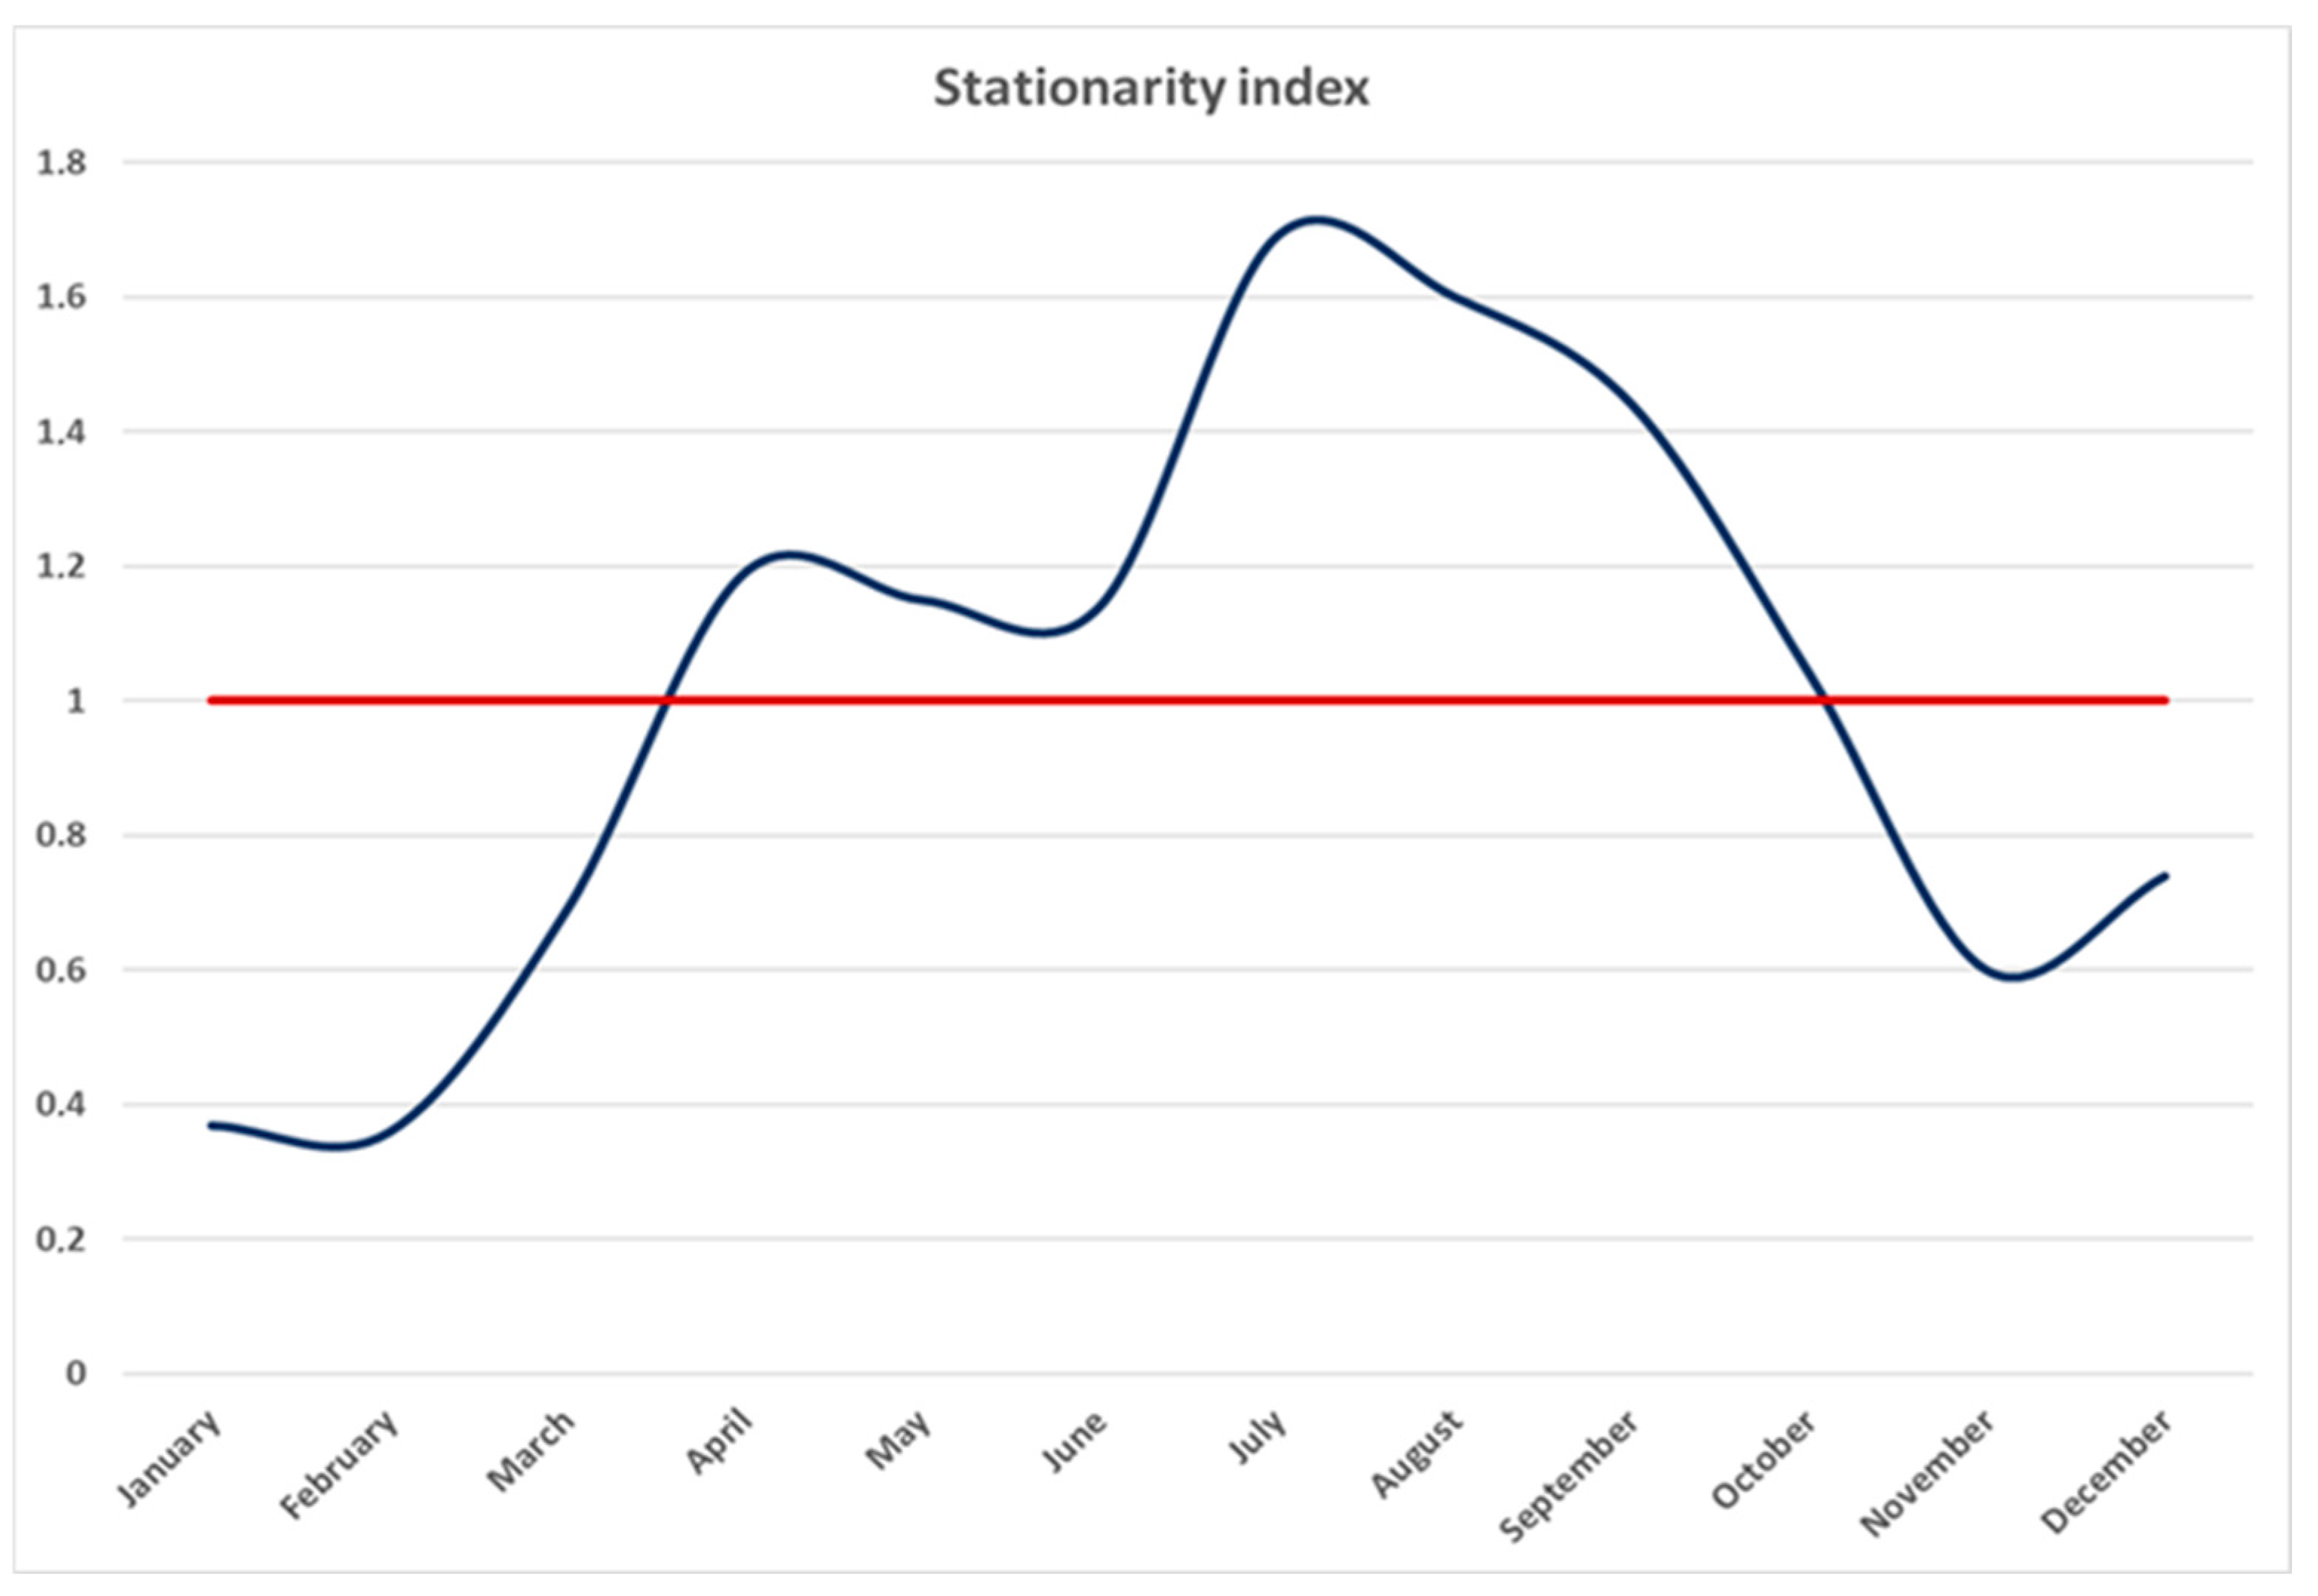
The seasonality index calculated from the number of tourists each month and the average value shows more clearly the temporal variation of the tourist impact in Rascafría throughout the year, indicating a high tourist season from April to October (index > 1), with a 69% increase in tourists above the average in July. The low season, from November to March, has its lowest seasonality index in February, with a 64% reduction compared to the average (
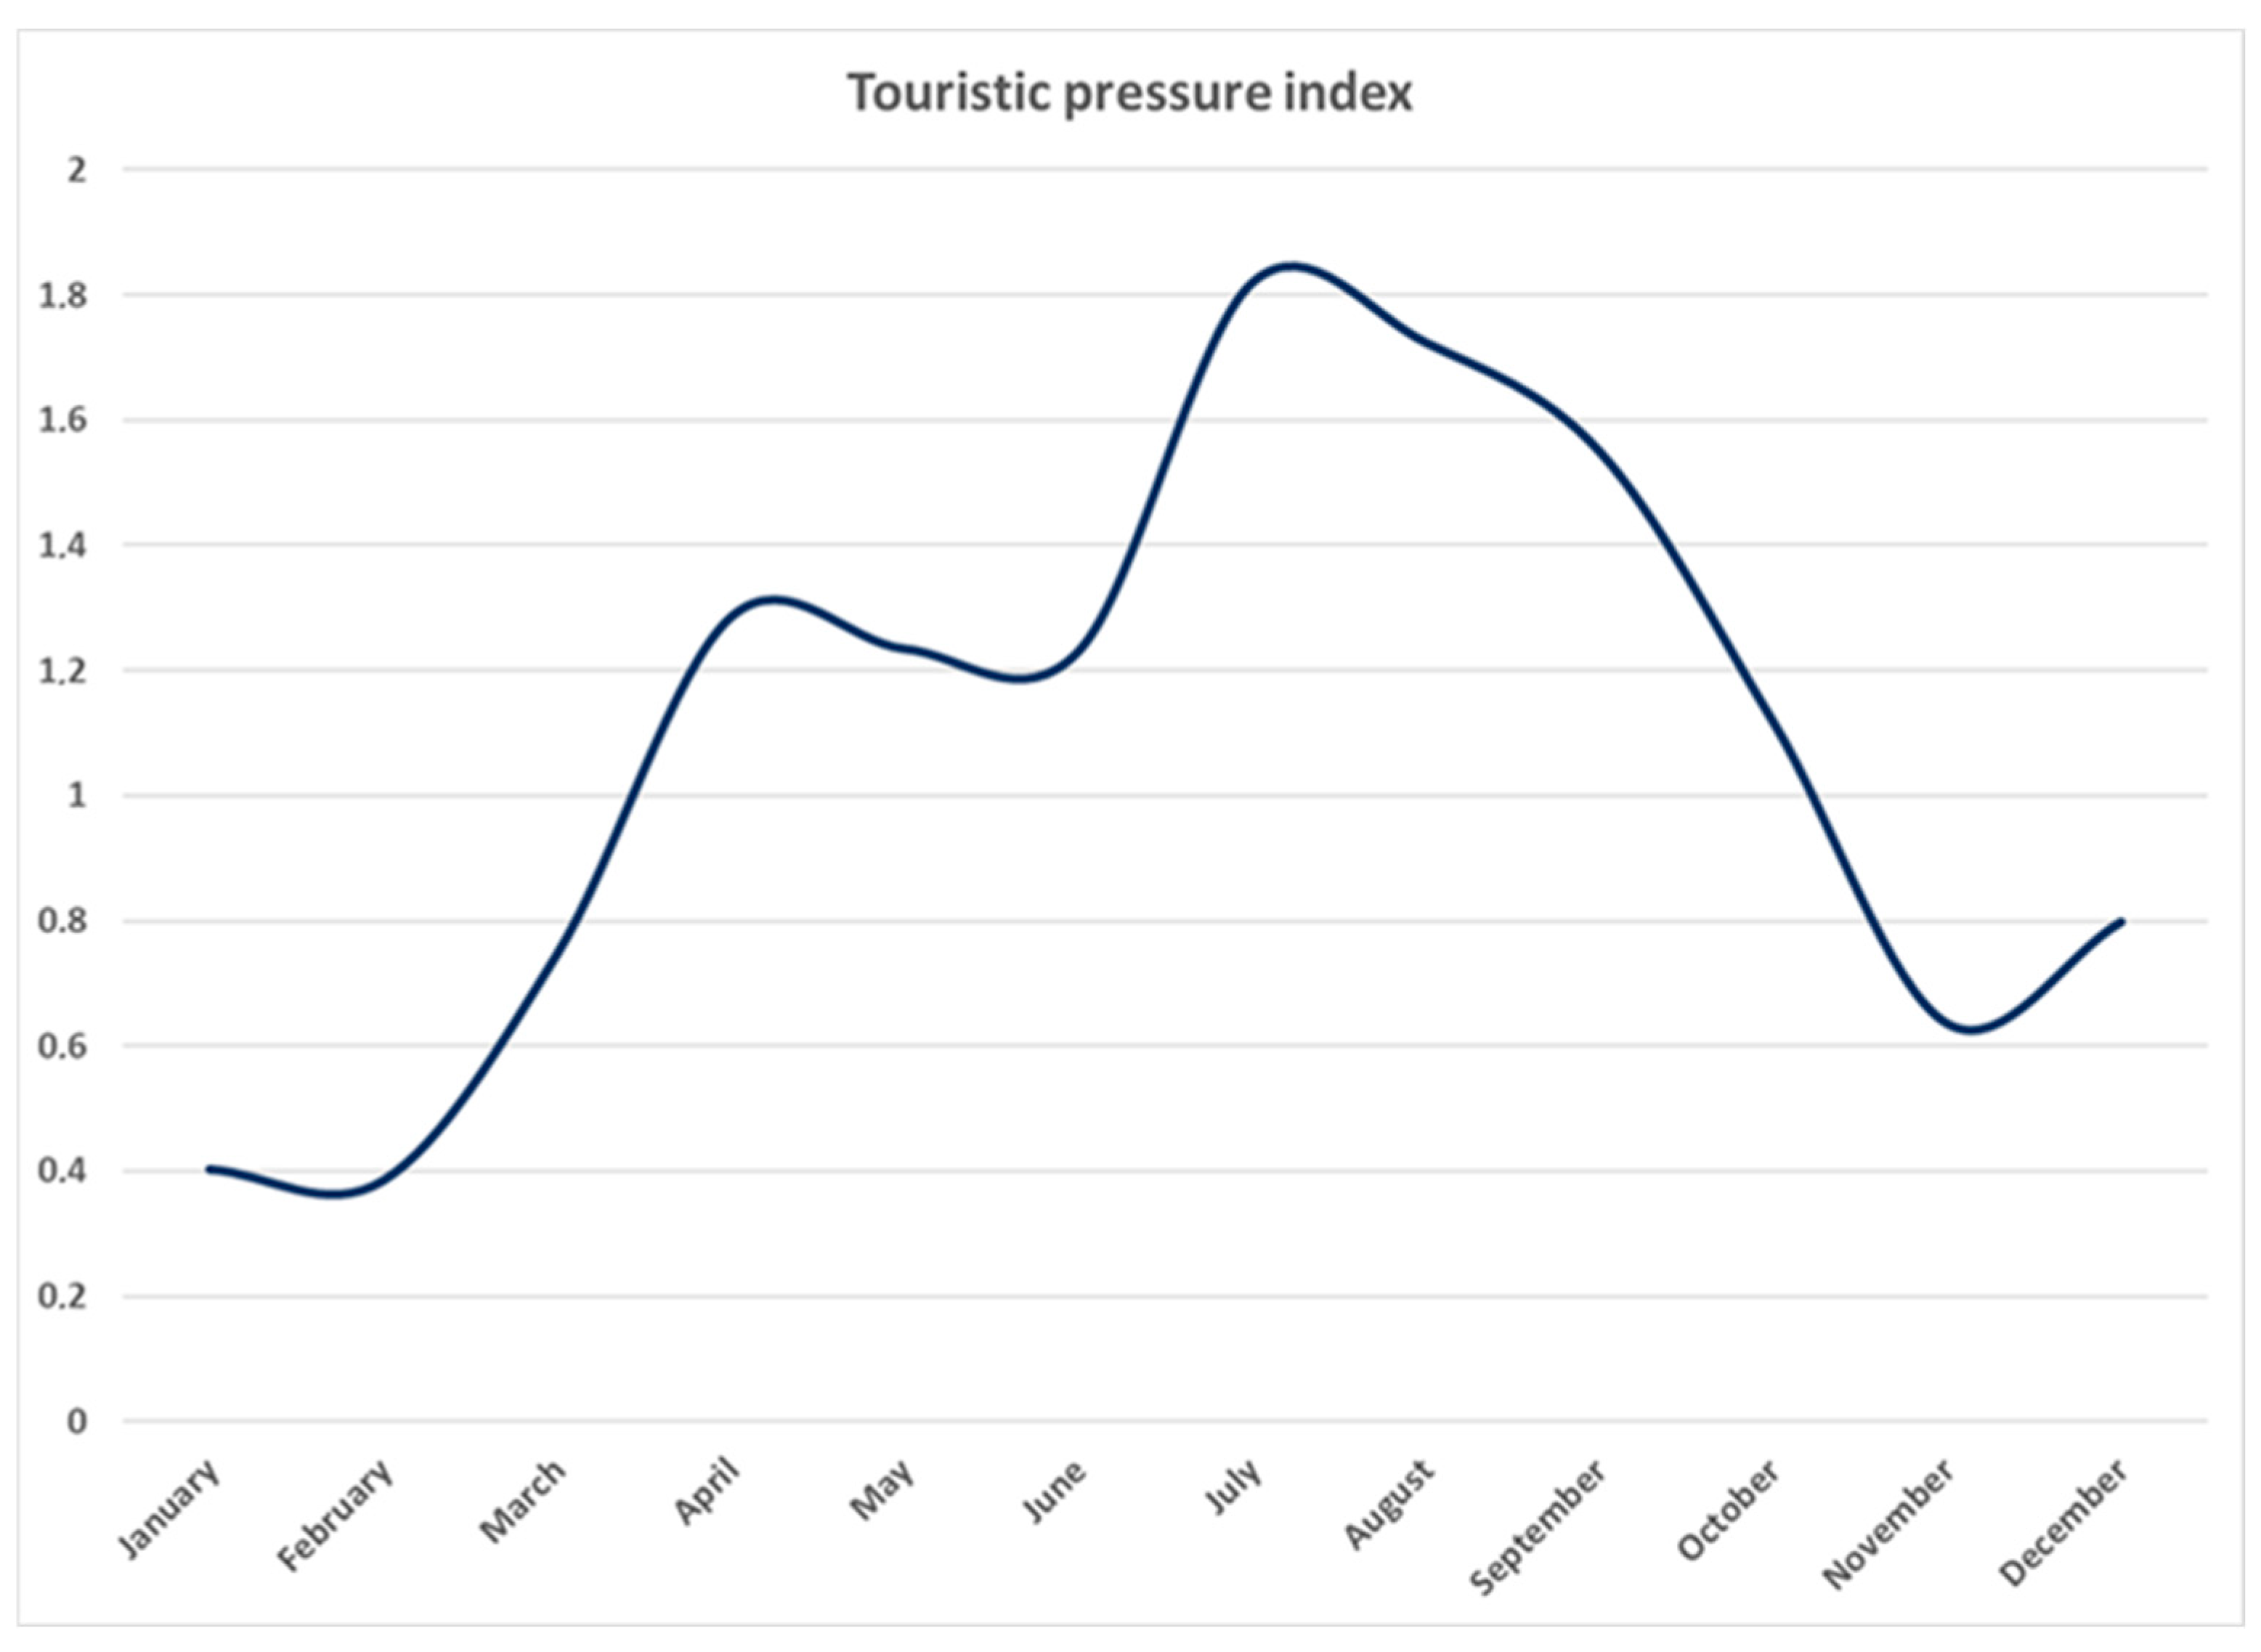
Figure 4). The average daily percentage of tourist intensity in Rascafría is 1.0%, indicating a very low tourist load in Rascafría. Monthly, this index remains low throughout the year, with the month of highest impact (July) corresponding to a daily tourist load percentage of 1.81% of the total municipal population (
Figure 5). It is crucial to state that these pressure figures would increase considerably if day-visitors from Madrid were included. The current indices are highly skewed downward because they exclude the primary visitor segment.
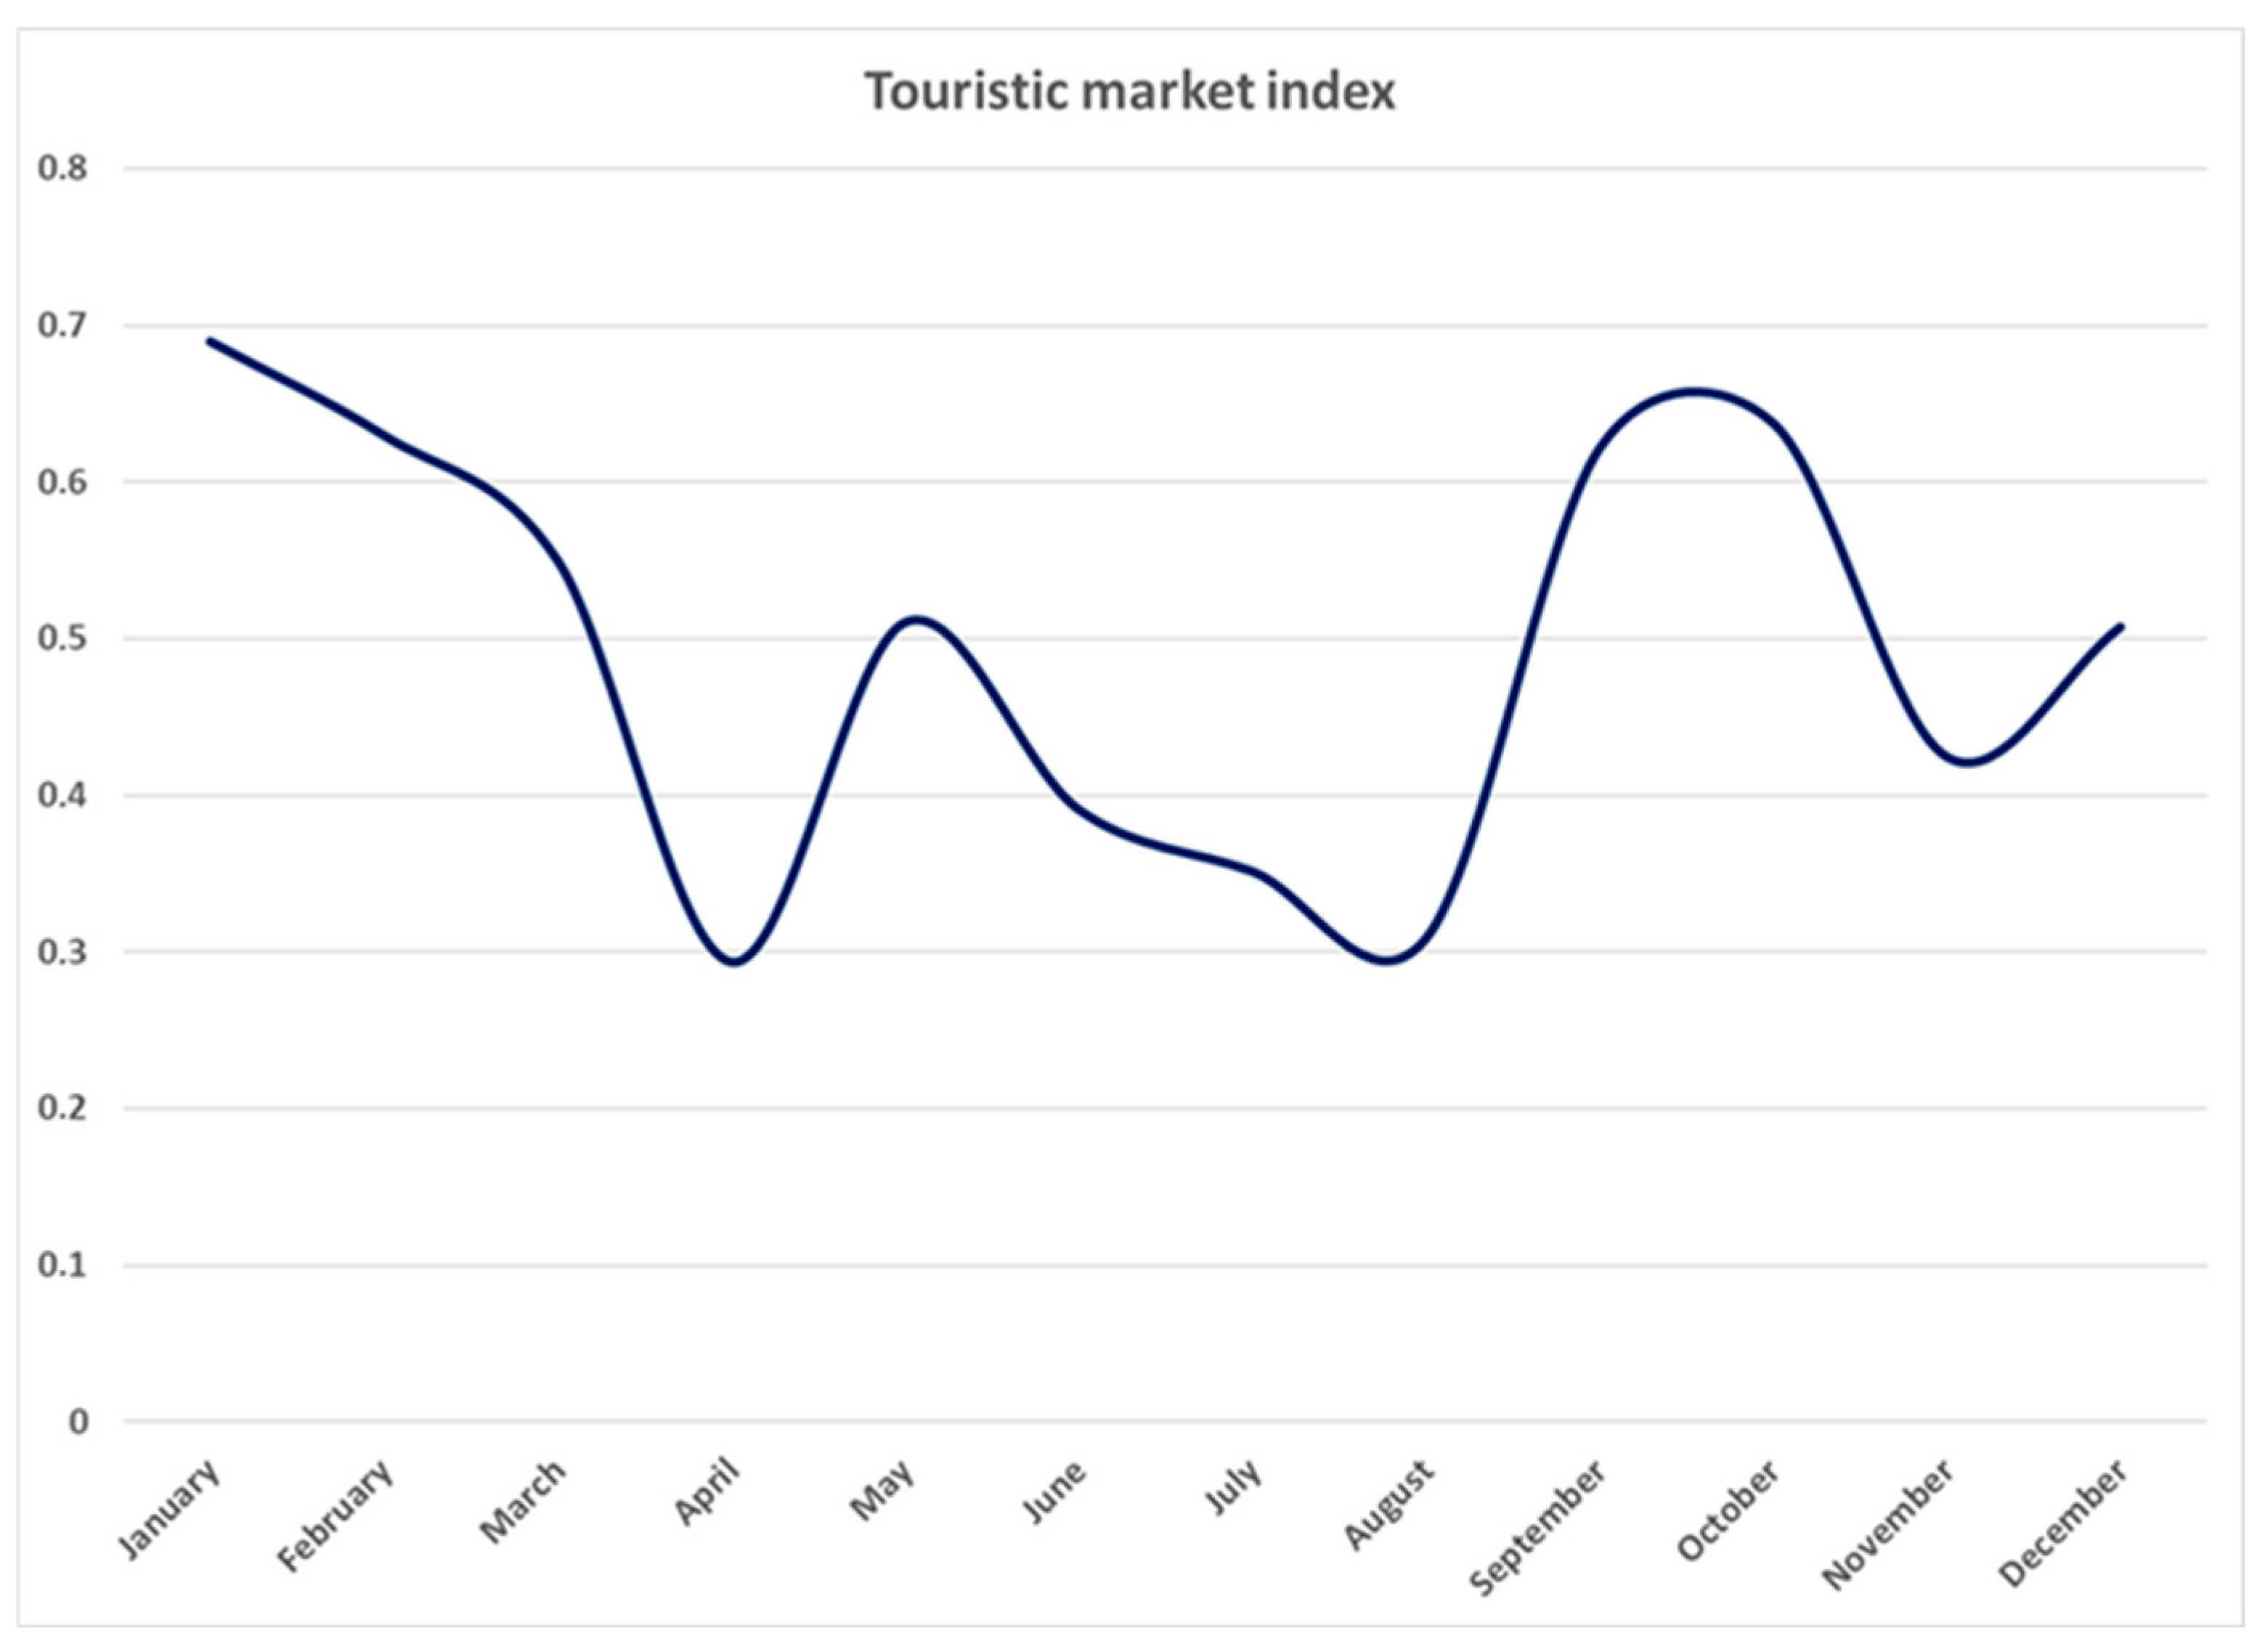
The average tourist market index for Rascafría is 0.46, indicating, as previously mentioned, that 46% of tourists visiting the municipality are of foreign origin. January, September, and October are the months with the highest percentage of foreign visitors, reaching values around 70% of total tourist mobility in the first month mentioned. Conversely, April and August are the months with the lowest influx of foreign tourists, with their percentage dropping to values below 30% (
Figure 6).
4.4. Spatial Results from Both Data Sources
According to the 2024 Annual Report of the Sierra de Guadarrama, the vast majority of visitors to the two centers located in the municipality of Rascafría in 2024 came from the province of Madrid (78%), with 50,341 visitors residing in the municipality of Madrid counted, and a large difference compared to the rest of the country’s provinces (Segovia, with 951 visitors, Toledo with 663 visitors, and Valladolid with 629 visitors). Regarding visits by foreigners, those from France, the United States, the United Kingdom, and Germany predominate.
Of the 6609 tourists obtained from the 2024 mobile phone data in the municipality of Rascafría, 3037 (45.95%) are of foreign origin and 3572 (54.05%) come from Spain. A total of 85.61% of foreign tourists were of European origin, with the Netherlands and France standing out particularly as countries of origin (
Table 4). It must be considered again that these data do not include intra-provincial tourism, so no data are available on visitors from the province of Madrid itself. However, by not having the province that accounted for the largest percentage of tourist weight, the remaining mobility flows can be observed more clearly.
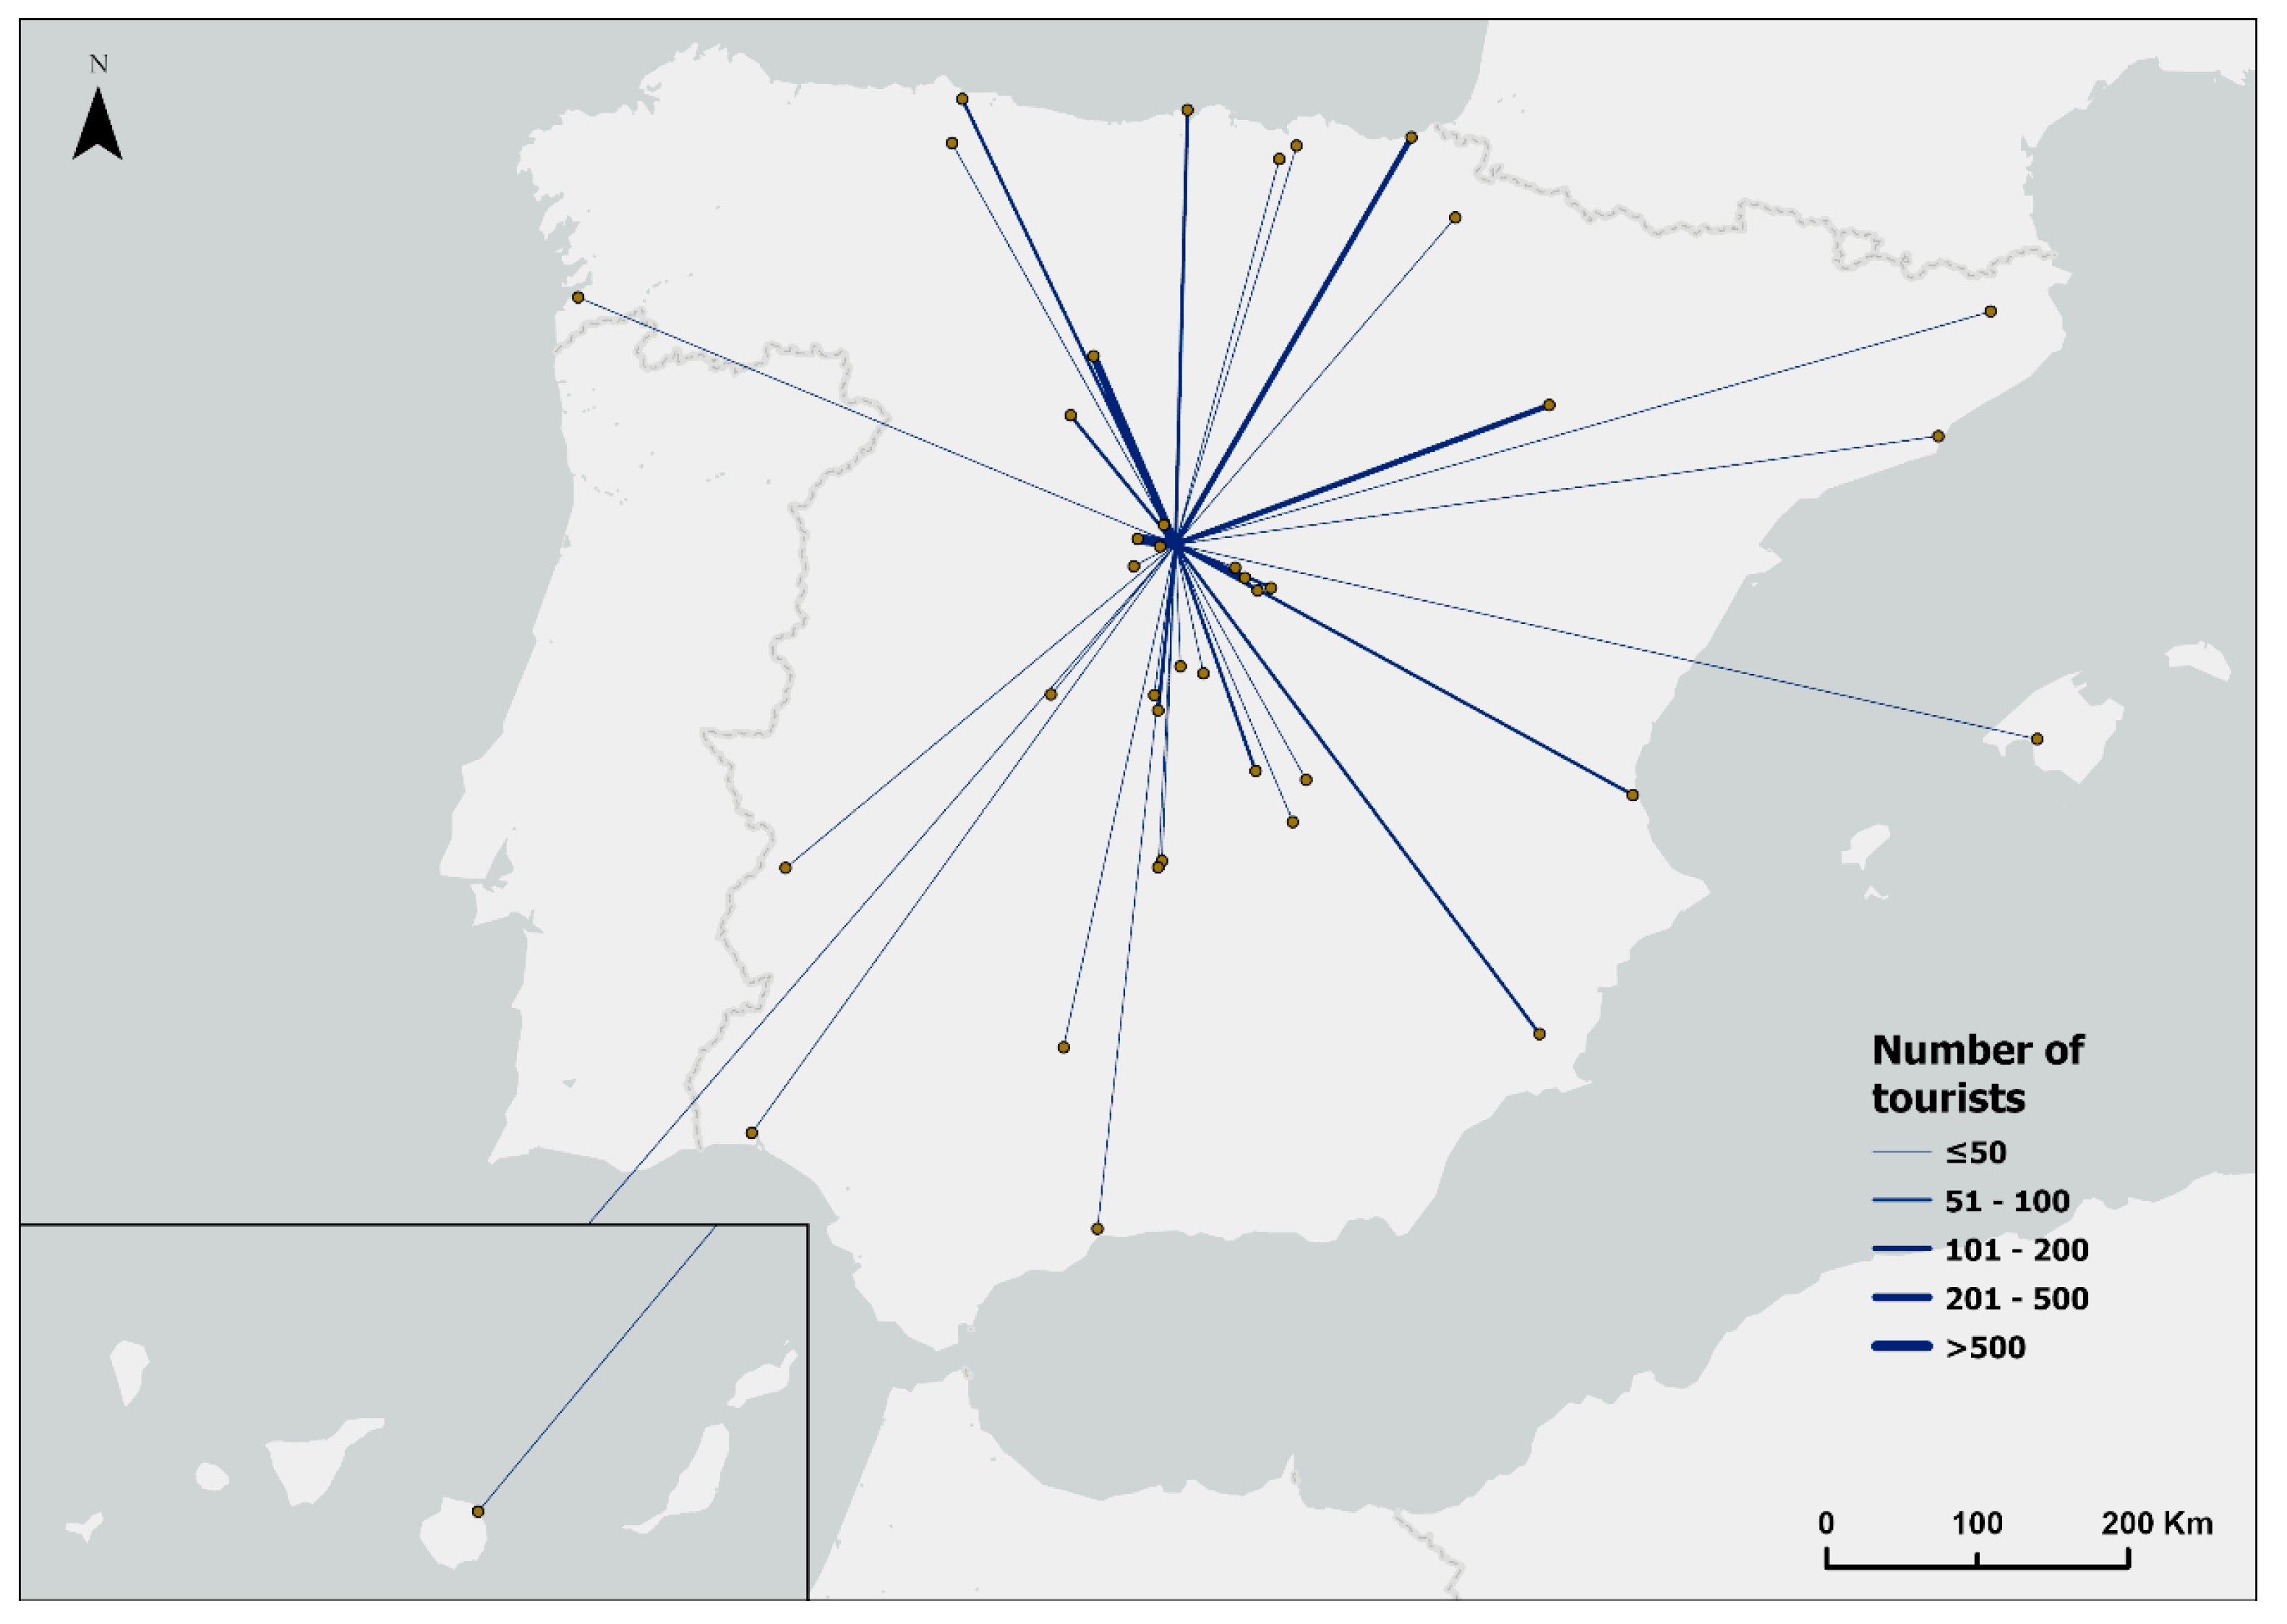
The average number of visitors per municipality is 92 tourists, while the median is 41 tourists, which, together with a standard deviation value of 151.41, indicates great heterogeneity with the presence of a few municipalities with a very high number of tourists that raise the average. Particularly noteworthy are the nearby municipality of Torrecaballeros (Segovia) with 807 visitors, and the municipality of Segovia with 603 tourists. Other municipalities with a strong tourist presence in Rascafría are Palencia (214 tourists), San Sebastián (161 tourists), Torrejón del Rey (Guadalajara, 135 tourists), and Zaragoza (101 tourists). To a lesser extent, Alovera (Guadalajara), Santander, Murcia, Valencia, Valladolid, and Las Palmas de Gran Canaria can be named as municipalities with a higher number of visitors compared to the median. In general terms, a greater flow of tourists is observed from provinces bordering Madrid (Guadalajara, Segovia, Cuenca, Toledo), and to a lesser degree from provincial capitals that have good connections with the province of Madrid (Valladolid, Zaragoza, Ciudad Real, Valencia, Murcia, Córdoba), and from municipalities located in the north of the country (San Sebastián, Bilbao, Santander, Gijón) (
Figure 7).
The Herfindahl-Hirschman Index (0.09) confirms the great diversification of origins and the presence of resilience against changes in a specific market, as there is no excessive dependence on a few municipalities. The coefficient of variation (1.63) indicates high relative dispersion: some municipalities contribute many tourists, while most contribute few. The primacy index indicates that the municipality with the most tourists (Torrecaballeros) contributes 45% more than the other municipalities combined. This municipality and Segovia are the two key municipalities in the tourist market, but they do not constitute the entire tourist offer of Rascafría either, as the market remains diversified. This is confirmed by the effective number of emitters, which indicates that, in terms of concentration, the Rascafría tourist market behaves as if there were 11 municipalities with equivalent contributions.
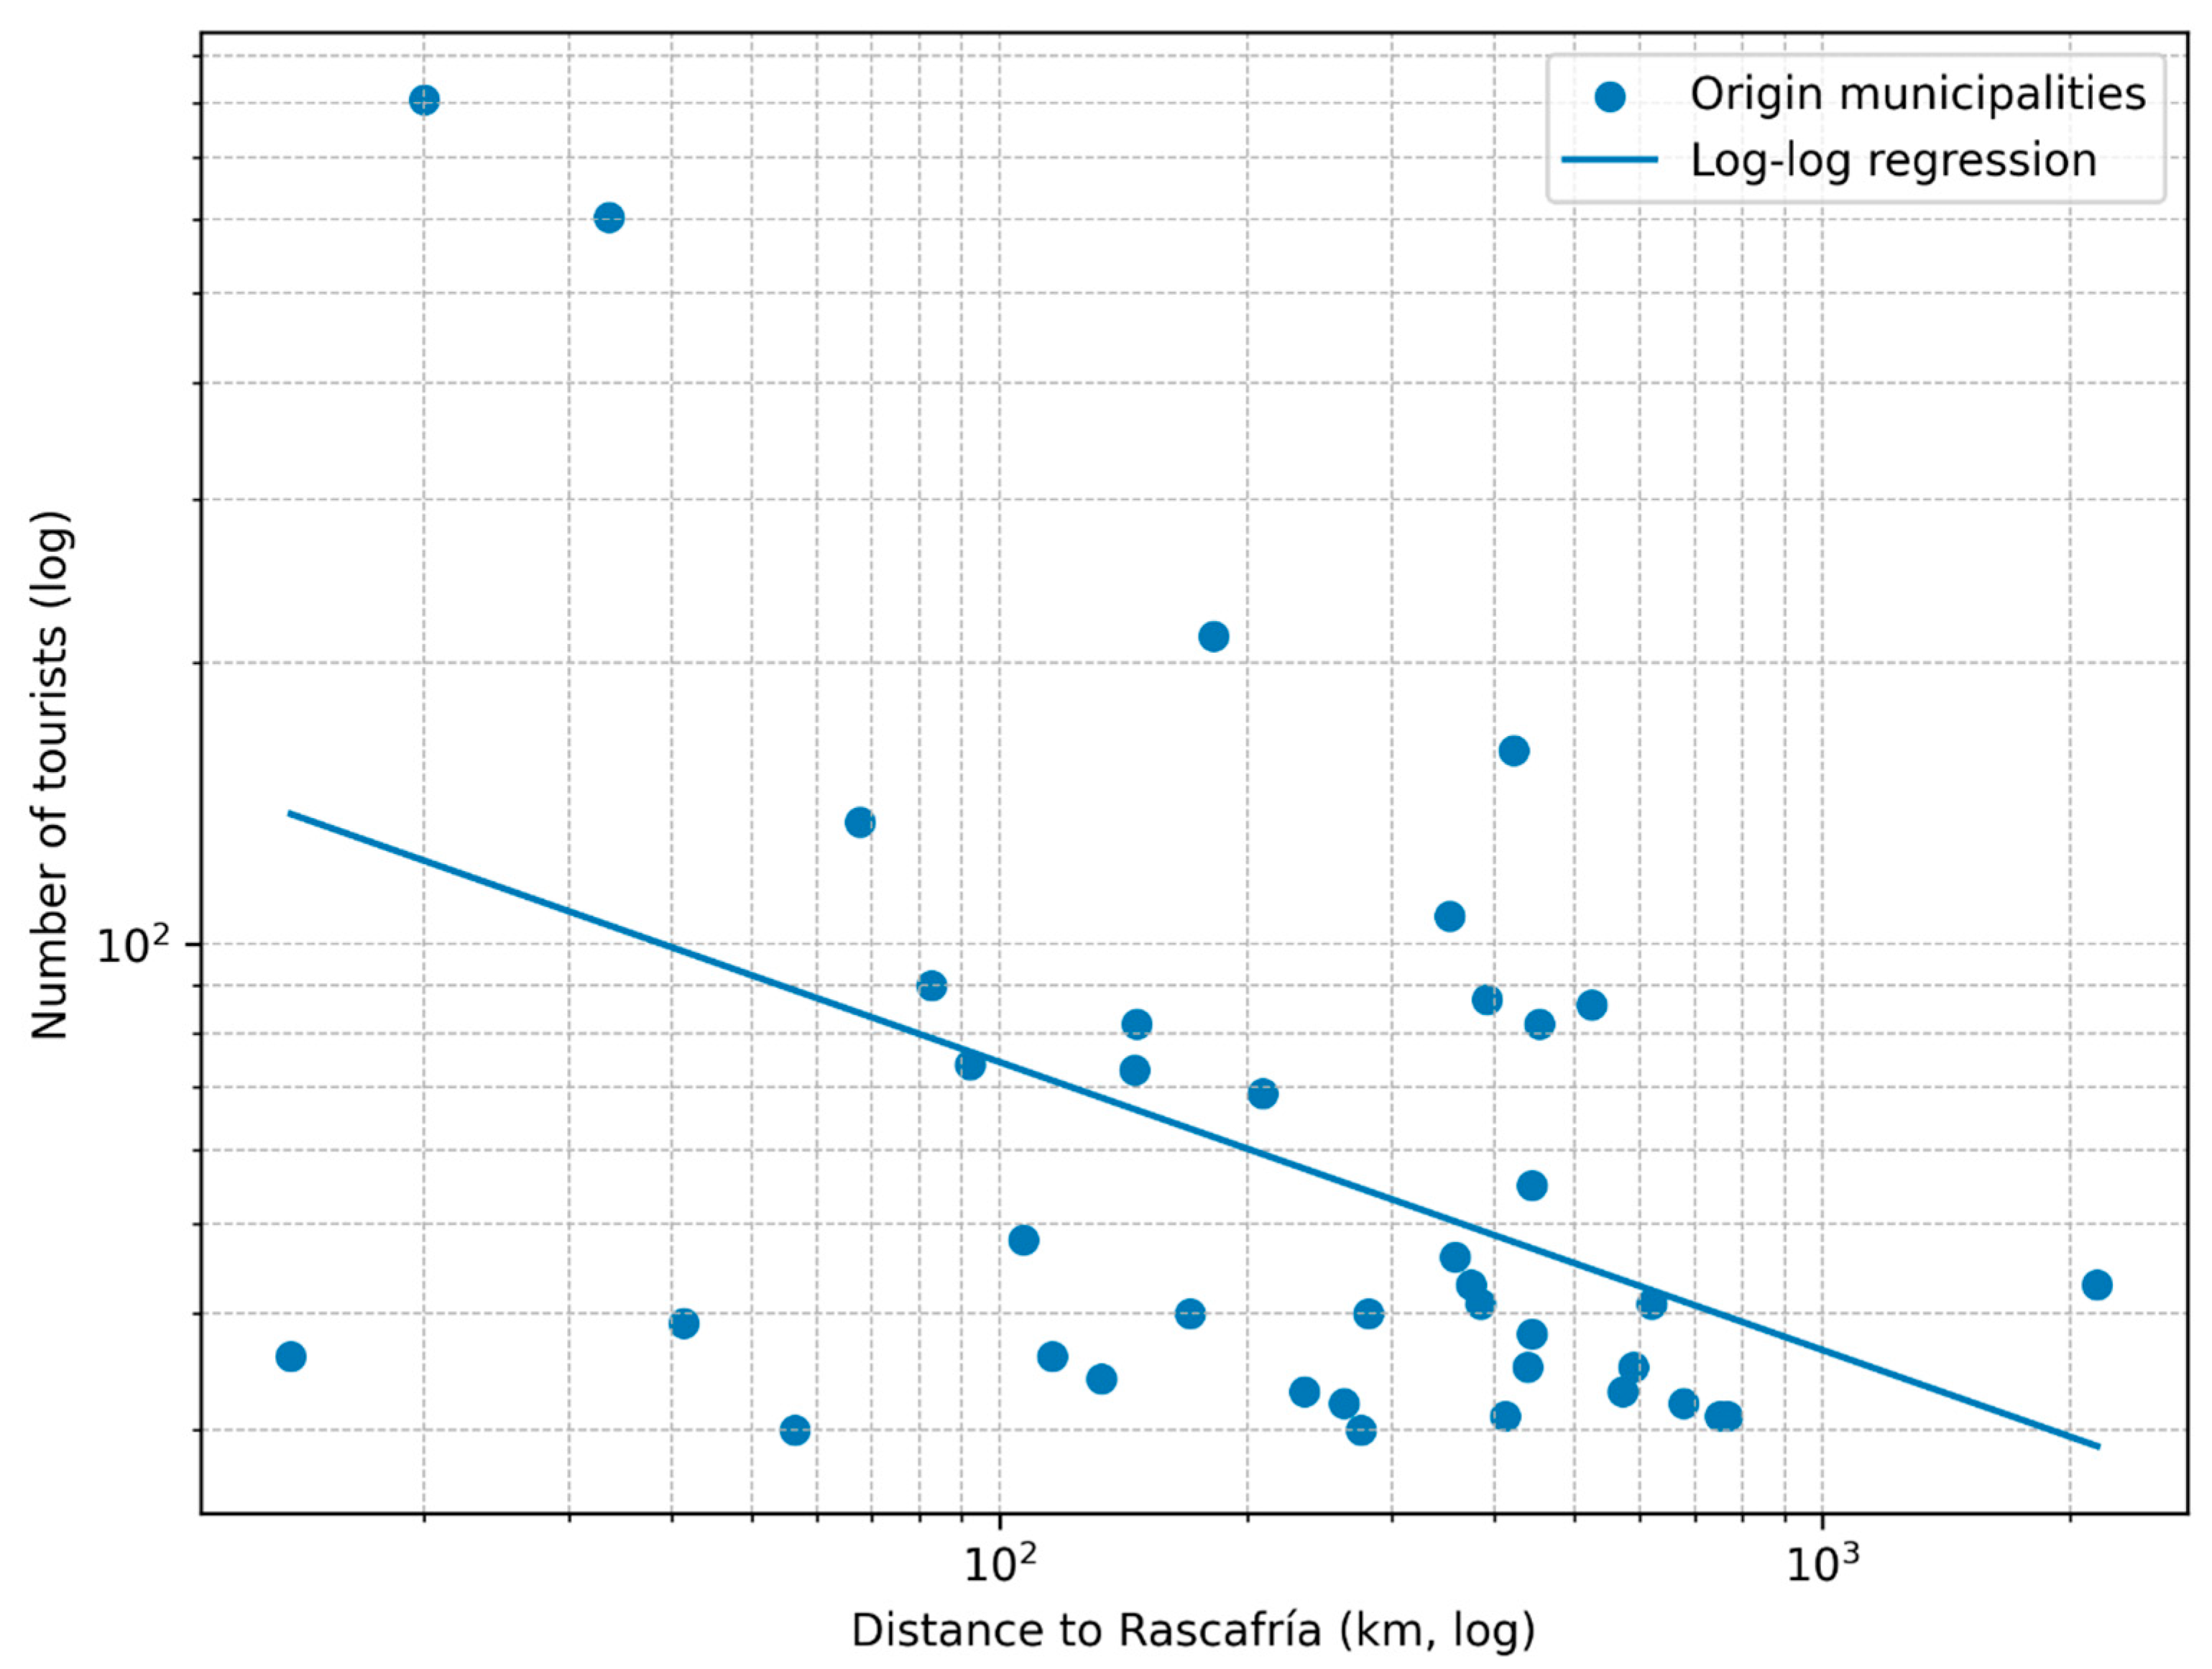
The weighted average distance indicator (211.39 km) corroborates that the non-metropolitan tourism received by Rascafría is nationally diversified. The logarithmic regression coefficient between the number of tourists and the distance traveled (−0.31) indicates a moderate spatial friction in which, although greater distance corresponds to fewer tourists, this decrease is not very steep (
Figure 8). The
p-value of 0.006 indicates that this result is statistically significant. However, the R
2 value (0.18) reflects that, although distance is relevant, it is not a factor that has a major influence, meaning there are other factors to consider—such as second-home ownership, historical ties, or transport corridors—when studying Rascafría’s attraction as a tourist destination.
5. Discussion
The results obtained allow for a deeper understanding of the role played by the El Paular Valley—and particularly the municipality of Rascafría—as a tourist destination within the Sierra de Guadarrama National Park, as well as an assessment of the usefulness of mobile phone data for analyzing tourist mobility in protected natural areas. The discussion focuses on three main aspects: the territorial and socioeconomic significance of tourism in the area, the spatial and temporal structure of tourist flows, and finally, the methodological implications derived from the use of new data sources.
Firstly, the results confirm the structural importance of tourism as an economic activity in the El Paular Valley. Labor market data show that tourism-related activities concentrate a very high proportion of contracts and Social Security affiliations, reaching values close to half of employment in municipalities like Rascafría. This pattern coincides with that observed in numerous protected natural areas where tourism has become one of the main economic alternatives to the decline of traditional primary activities [
45,
46,
47]. In mountain territories with low population density and demographic aging processes, as is the case in the El Paular Valley, tourism acts as a factor of economic diversification and maintenance of the resident population, as pointed out by various studies on rural development and nature tourism [
55,
56].
Secondly, the results highlight the close relationship between the valley’s landscape and heritage appeal and the predominant forms of tourism that develop in the area. The high proportion of visitors who come in family or friendship groups, together with the predominance of hiking and recreational walks among the most demanded activities, confirms that the main tourist resource is the cultural and natural landscape of the territory. This fact is consistent with the conceptual framework outlined in the introduction, which indicates that the cultural landscape constitutes a synthesis between the natural and human elements that structure the territory [
56,
57,
58]. In the case of the El Paular Valley, this interaction manifests itself in the combination of natural values associated with the Sierra de Guadarrama—mountainous relief, forests, and glacial lagoons—with heritage elements of great historical relevance, such as the Santa María de El Paular Monastery or the old paper mills. The presence of these elements reinforces the identity character of the landscape and contributes to its tourist valorization, in line with the heritage and sustainable approaches to landscape developed in contemporary geography [
55,
56,
59].
Another relevant aspect is the marked seasonality of tourist activity. Mobile phone data show a high season extending approximately from April to October, with a peak in July. This temporal distribution is characteristic of nature tourism destinations in Mediterranean regions, where climatic conditions significantly influence the practice of outdoor activities [
45,
46]. At the same time, the presence of certain winter moments associated with snow activities in nearby areas, such as Peñalara, highlights the existence of a certain seasonal diversification of the tourist offer. However, seasonality remains a dominant feature, which coincides with the results of previous studies on Spanish national parks, where a strong concentration of visits is observed in the spring and summer months [
47].
The analysis of tourist intensity reveals, nevertheless, an interesting aspect: despite the high overall number of visitors to the Sierra de Guadarrama National Park, the direct tourist pressure on the municipality of Rascafría is relatively low. The average daily tourist intensity index stands at around 1% of the population, even in the months of greatest influx. This result suggests that, from a strictly quantitative point of view, tourism has not yet reached saturation levels comparable to those observed in other highly touristified natural or cultural destinations. However, these data should be interpreted with caution, since tourist pressure in natural areas does not depend solely on the number of visitors in relation to the resident population, but also on the spatial concentration of flows in certain sensitive enclaves. In the case of the El Paular Valley, places such as the Las Presillas natural swimming pools or the accesses to hiking trails may experience episodes of occasional saturation, especially during weekends and holiday periods [
46].
The tourism pressure indicator must be qualified in two respects. First, as repeatedly noted, the numerator excludes Madrid day-trippers, so the true value is certainly higher. Second, even if calculated with complete data, a municipal-average indicator is an inappropriate denominator for a National Park context where visitor impact is overwhelmingly concentrated in a few hotspots—Las Presillas natural pools, the monastery environs, and the Peñalara access points. Future work should develop spatially disaggregated pressure metrics that reflect this concentration.
The spatial structure of visitor origins also yields interesting results. Mobile phone data show a relatively diversified tourist market, as indicated by the low value of the Herfindahl-Hirschman Index. Although some municipalities have a greater presence of visitors—such as Torrecaballeros or the city of Segovia—the tourist market is characterized by a wide variety of emitting locations. This type of distribution is relatively common in nature destinations located near large metropolitan areas, where proximity flows combine with others coming from more distant territories [
12,
60].
However, the analysis must consider the fundamental methodological limitation of the data: the absence of visitors from the province of Madrid itself, which constitutes the main real tourist market for the area according to the official statistics of the National Park. Precisely this limitation helps explain one of the most striking results of the study: the relatively high weighted-average distance and the conclusion that tourism is not proximity tourism. Although mobile phone data suggest the existence of a nationally sourced tourist market, this interpretation must be qualified considering information from other sources. National Park statistics indicate that most visitors come from the province of Madrid, confirming the metropolitan and excursionist nature of tourism in the area, prolonging an excursionist tradition dating back to the late 19th and early 20th centuries [
45].
The moderate Spearman correlation (r = 0.64) between the two data sources is interesting but should not be overinterpreted. The shared Mediterranean mountain seasonality—a summer peak and winter trough—is a pattern common to virtually all nature-based destinations in southern Europe. The correlation suggests that mobile data reproduce this generic template, but the tenfold difference in volume reveals that the underlying visitor composition is fundamentally different. For a manager seeking to understand peak-load pressures, the INE data alone would dramatically underestimate the scale of weekend and holiday influxes from Madrid, leading to potentially misguided decisions.
Despite these limitations, the use of mobile phone data proves to be a valuable tool for analyzing tourist mobility in rural areas. The positive and relatively high correlation between the phone data and official visitor records indicates that this source adequately captures the temporal structure of tourist flows. This result coincides with recent research that highlights the potential of Big Data from mobile devices to study mobility patterns, especially in areas where traditional statistics have limitations or lack sufficient spatial and temporal disaggregation [
19,
20,
39]. In the case of the El Paular Valley, phone data allow for more precise identification of visitor origin and analysis of their spatial distribution, providing a complementary perspective to official statistics.
The management context of the Sierra de Guadarrama adds further complexity. The Park is divided between two Autonomous Communities (Madrid and Castilla y León), creating “internal borders” that complicate coherent visitor management [
61]. In this setting, reliable data on visitor volumes, origins, and spatial behavior are essential. The study demonstrates that neither traditional nor experimental sources are sufficient in isolation. Official records provide accurate volumes for attended centers but lack continuous spatial coverage across the wider landscape. Mobile data offer continuous spatial coverage and market diversification metrics but exclude the primary user group. An integrated monitoring system would triangulate on-the-ground counts, mobile data, and possibly vehicle counter data at key access points.
The comparison with previous studies like the one performed in Las Merindades [
27] is instructive. In that case, located far from major metropolitan centers, the intra-provincial exclusion bias had a less distorting effect because the destination genuinely serves a broader national market. The present study’s originality lies in exposing the specific vulnerability of this data source for proximity-dominated destinations, a common situation for many protected areas near large cities.
6. Conclusions
This research makes three primary contributions. First, it provides a high-value methodological assessment of the complementarity and divergence between experimental mobile phone data and traditional visitor statistics in a protected cultural landscape context. The findings obtained in this work serve as a cautionary yet constructive guide for heritage managers: geolocated data sources are powerful for understanding long-distance tourism structures but are limited by the data providers themselves, who decide what data to share and require heavy supplementation with on-the-ground counting to accurately reflect proximity-based heritage consumption.
Second, the study advances beyond prior works by shifting from a descriptive application of mobile data to a diagnostic test of their strengths and limitations. In addition to the spatial detail, the use of mobile phone data presents other important advantages compared to the other documentary sources used in the study, such as a broader sample reach, continuous data updating, easy and rapid acquisition, and being free of charge. However, a series of biases and limitations must be considered, such as the lower density of mobile phone antennas associated with the smaller population inhabiting rural areas, which results in lower sample representativeness compared to urban areas. The suite of indicators employed—including a distance-decay model explicitly linked to theoretical literature, and spatially sensitive but critically interpreted pressure indices—offers a template for future methodological evaluations in other destinations.
Third, the results have concrete, actionable implications for the Rascafría Strategic Tourism and Sustainable Development Plan 2025–2030. The Plan should: (a) formally integrate traditional visitor center records as the primary volumetric baseline; (b) use mobile data to characterize the structure of non-metropolitan and international overnight markets; (c) invest in complementary counting methods—such as vehicle counters at main access roads and weekend user surveys—to fill the “absent Madrid” gap; and (d) develop pressure indicators at the hotspot scale rather than relying on municipal averages, allowing for early detection of saturation episodes at sensitive sites like Las Presillas.
Several limitations of this study must be acknowledged. The INE experimental data exclude not only intra-provincial flows but also potentially underrepresent demographic groups with lower mobile device usage (older adults, minors) and are subject to double-counting when individuals carry multiple devices. The single-year (2024) temporal frame limits trend analysis. Future research should pursue multi-year comparisons as more data become available, explore methods for fusing mobile data with traditional surveys to estimate total visitation including day-trippers, and replicate this methodological test in other proximity-dominated protected areas to assess the generality of the findings.