


Abstract
This study presents the first integrated magnetic and electromagnetic (EMI) survey of the Pianabella Basilica (Ostia, Italy), combining high-resolution magnetic gradient measurements with EMI mapping. The site, characterized by late-antique Christian architecture and funerary structures, provides a complex environment for testing non-invasive geophysical techniques. Magnetic data were acquired using the MagEx system (v.1.2.2558), a new prototype based on Micro-Fabricated Atomic Magnetometer (MFAM) technology, marking its first field deployment in archaeological prospection. Simultaneously, EMI measurements using the CMD-Mini Explorer provided data on apparent conductivity and in-phase components across three depth levels (0.5–1.8 m). The magnetic gradient map successfully delineated the Basilica’s planimetric outline, revealing anomalies (~20 nT/m) corresponding to masonry and internal enclosures. A significant anomaly (50–60 nT/m) north of the Basilica suggests a basalt-paved Roman road leading toward Porta Laurentina. EMI results corroborated these findings, with low-conductivity zones outlining walls and in-phase responses highlighting reused Roman building materials. Despite significant urban noise from a nearby railway and fences, this integrated approach enhanced interpretability and reduced ambiguity. These findings demonstrate the efficacy of next-generation magnetic gradiometry and EMI for high-resolution archaeological investigations, providing a new methodological benchmark for cultural heritage prospection.
1. Introduction
At the end of the Republican era (1st century BC), the southern suburb of Ostia, an area known by the modern name of Pianabella, was defined by five parallel roads and used for productive and farming purposes [1]. Starting in the 1st century AD, the entire area was gradually occupied by funerary buildings, mainly along the roads near the town, until it became the city’s main burial site [2,3]. At the beginning of the 5th century AD, a large Christian Basilica (43.30 × 16.20 m2) was built in one section of this cemetery, on the top of previous funerary buildings and was entirely built with materials taken from previous buildings in the city, a very common practice in late antiquity [4]. The single-nave church featured an internal burial enclosure, capable of accommodating around a hundred graves: the Christian community buried their dead in this building and celebrated ritual banquets called “refrigeria” on their graves.
The Basilica continued to host new burials until the 9th century, when the last restoration work was carried out [5]. In the 10th–11th centuries, the building was abandoned and stripped of all its furnishings and structural elements, especially the roof tiles. Subsequently, the longitudinal walls collapsed towards south; the building was even forgotten, until its fortuitous discovery in 1976 following an illegal excavation. From an archaeological point of view, the way in which the building was integrated into the landscape, which at the time was already occupied by several structures, proved to be of particular interest. A series of funerary buildings, probably already abandoned by their owners or purchased by the Christian community for the construction of the church, were used like a basement for the building. The building rests on the north side of this row of previous structures, while on the south side, massive earthworks were necessary to level the ground. The northern side of the basilica overlooks a paved road, which has been investigated by a couple of excavation probes conducted in previous excavations (now covered). The road could run alongside the Basilica towards the east, then curving sharply northwards towards Porta Laurentina, one of the three gates leading into the city. Ongoing research aims to investigate the path of this road, checking for any possible intersections or deviations from the route. Around the basilica, there are other burial structures, some of which have been investigated in previous excavation campaigns, and several tombs have been explored and then covered on the northern side of the road. In contrast, the area to the east of the basilica and south of the road is still largely unexplored: geophysical surveys conducted in this work will help to reveal the presence of buried structures in these areas, guiding future archaeological surveys and investigations.
Geophysical surveys provide a practical and widely adopted solution, especially in archaeological contexts, allowing for the exploration of buried cultural heritage with high precision and without disruption [6,7,8,9,10,11]. Among the most commonly used approaches, Magnetic and ElectroMagnetic Induction (EMI) techniques have become essential tools for non-invasive subsurface investigations, providing rapid, high-resolution information about subsurface features without disturbing the cultural context [12,13,14].
Magnetometry detects variations in the Earth’s magnetic field caused by natural or human-made features, and is particularly effective for identifying structures such as walls, ditches, and kilns, as well as metallic artifacts [15,16,17,18]. In particular, archaeological prospections usually require the use of vertical magnetic gradient, by measuring the difference in magnetic intensity between two sensors placed at different elevations [19]. This is especially useful for the detection of near-surface archaeological remains, enhancing the response of shallow sources while attenuating the influence of deeper or regional anomalies [20]. In addition, the vertical gradient improves the effective resolution of the survey, enabling the discrimination of closely spaced sources that might otherwise overlap in total-field data [21]. This enhanced resolving power is crucial when mapping complex archaeological sites, where small structures are shallow and close to each other. The last important advantage is the insensitivity of vertical gradient measurements to external magnetic fields, such as diurnal variations, since both sensors experience nearly the same influence from regional or external fields [22].
Unlike Magnetic surveys, which detect variations in the magnetization of buried materials, EMI methods are primarily sensitive to contrasts in electrical conductivity and, to a lesser extent, magnetic susceptibility [23]. The basic principle relies on the induction of eddy currents in the ground by a controlled primary electromagnetic field; the resulting secondary field, measured at the surface, provides information about subsurface properties [24]. The sensitivity of EMI surveys to conductivity makes them particularly effective in detecting anthropogenic features that modify soil moisture, porosity, or compaction [25]. For example, filled ditches, pits, or trenches often retain higher moisture content and thus exhibit enhanced conductivity relative to the surrounding matrix. Conversely, stone foundations or walls may appear as zones of reduced conductivity [26]. In addition, EMI instruments can provide measurements at different depths depending on coil configuration and operating frequency, allowing for a degree of depth discrimination in archaeological contexts [27,28].
A magnetic survey was conducted using the Geometrics Micro-Fabricated Atomic Magnetometer (MFAM) sensor. This type of miniaturised device was originally designed with drone-based applications in mind (MagArrow II UAV-Enabled Magnetometer—Geometrics), as its lightweight, compact architecture makes it particularly suitable for aerial deployment. Recent research efforts have focused on adapting MFAM technology for gradient applications, demonstrating the feasibility of constructing a vertical gradiometer [29,30,31,32]. This configuration enabled the design of a custom housing capable of hosting two separate sensors in a vertical configuration, thereby enabling successful testing of gradient measurements for both drone-based and ground-based surveys. In this study, we acquired gradiometric data at an archaeological site for the first time using a new prototype designed by Geometrics. This instrument is an upgraded version of the commercial MagEx Portable Exploration Magnetometer, as it was conceived from the outset as a vertical gradiometer. Its use at Pianabella thus provides a unique opportunity to evaluate its potential under real field conditions.
To complement the magnetic survey, EMI measurements were carried out with the CMD-Mini Explorer, manufactured by GF Instruments (http://www.gfinstruments.cz/ accessed on 1 February 2026), thereby enabling a combined analysis of magnetic and conductivity contrasts.
The geophysical survey was therefore designed with a dual objective. The first is the detection and mapping of previously unexcavated structures both within the main body of the Basilica and in its surrounding area, contributing to the understanding of the site’s architectural layout and road path alongside the Basilica. The second is performing the first field test of the MagEx prototype in vertical gradiometer configuration, with the aim of assessing its performance, resolution, and reliability. The integration of these two complementary approaches strengthened the robustness of the results and highlighted the potential role of next-generation magnetic gradient systems in advancing archaeological prospection.
2. Materials and Methods
2.1. Archaeological Background
The first archaeological investigations surrounding the Basilica of Pianabella took place in 1975–1976 as a consequence of illegal excavation, which affected the area of the funerary buildings to the east of the church. From there, the investigations extended to the tombs on the north side of the road and to the basilica itself, with the discovery of the burial enclosure and part of the furnishings, including a circular marble table used for the ritual blessing of food, dating back to the 5th century AD, and two tuff pillars decorated with a gemmed cross motif, dating back to the 8th century AD. In 1988–1989, archaeological investigations were resumed to fully uncover the Christian place of worship: during the excavation, the two longitudinal walls of the church were found, both collapsed towards south, a circumstance that suggested damage caused by a seismic event, now questioned on the basis of more recent studies [33]. During the same excavation campaign, several tests were carried out along the Roman road, bringing to light the paving and all the subsequent layers of growth. Based on this data, it was possible to establish that the road was used at least until the 7th century AD, with periodic raising of the road surface using rubble and compacted ceramic fragments [34]. At the end of this campaign, the area was fenced off to protect it from theft and illegal excavation, a scourge that unfortunately still plagues the area. Finally, in 1998, the last excavations were carried out in the tombs north of the road, which were covered again after the investigations to ensure their preservation. This last excavation revealed interesting grave goods relating to burials from the 1st–2nd centuries AD.
2.2. Geophysical Survey
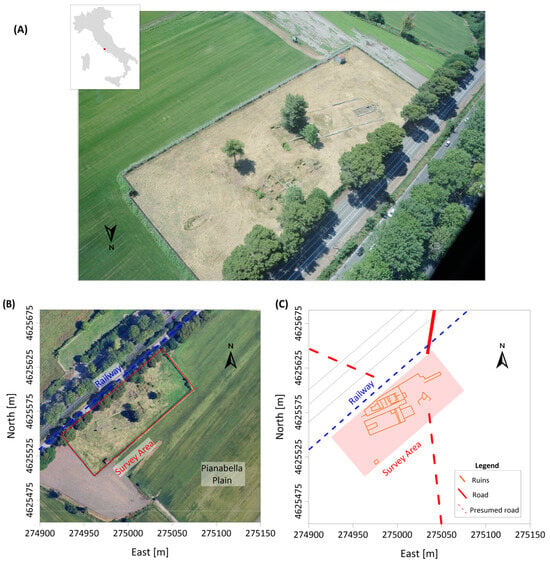
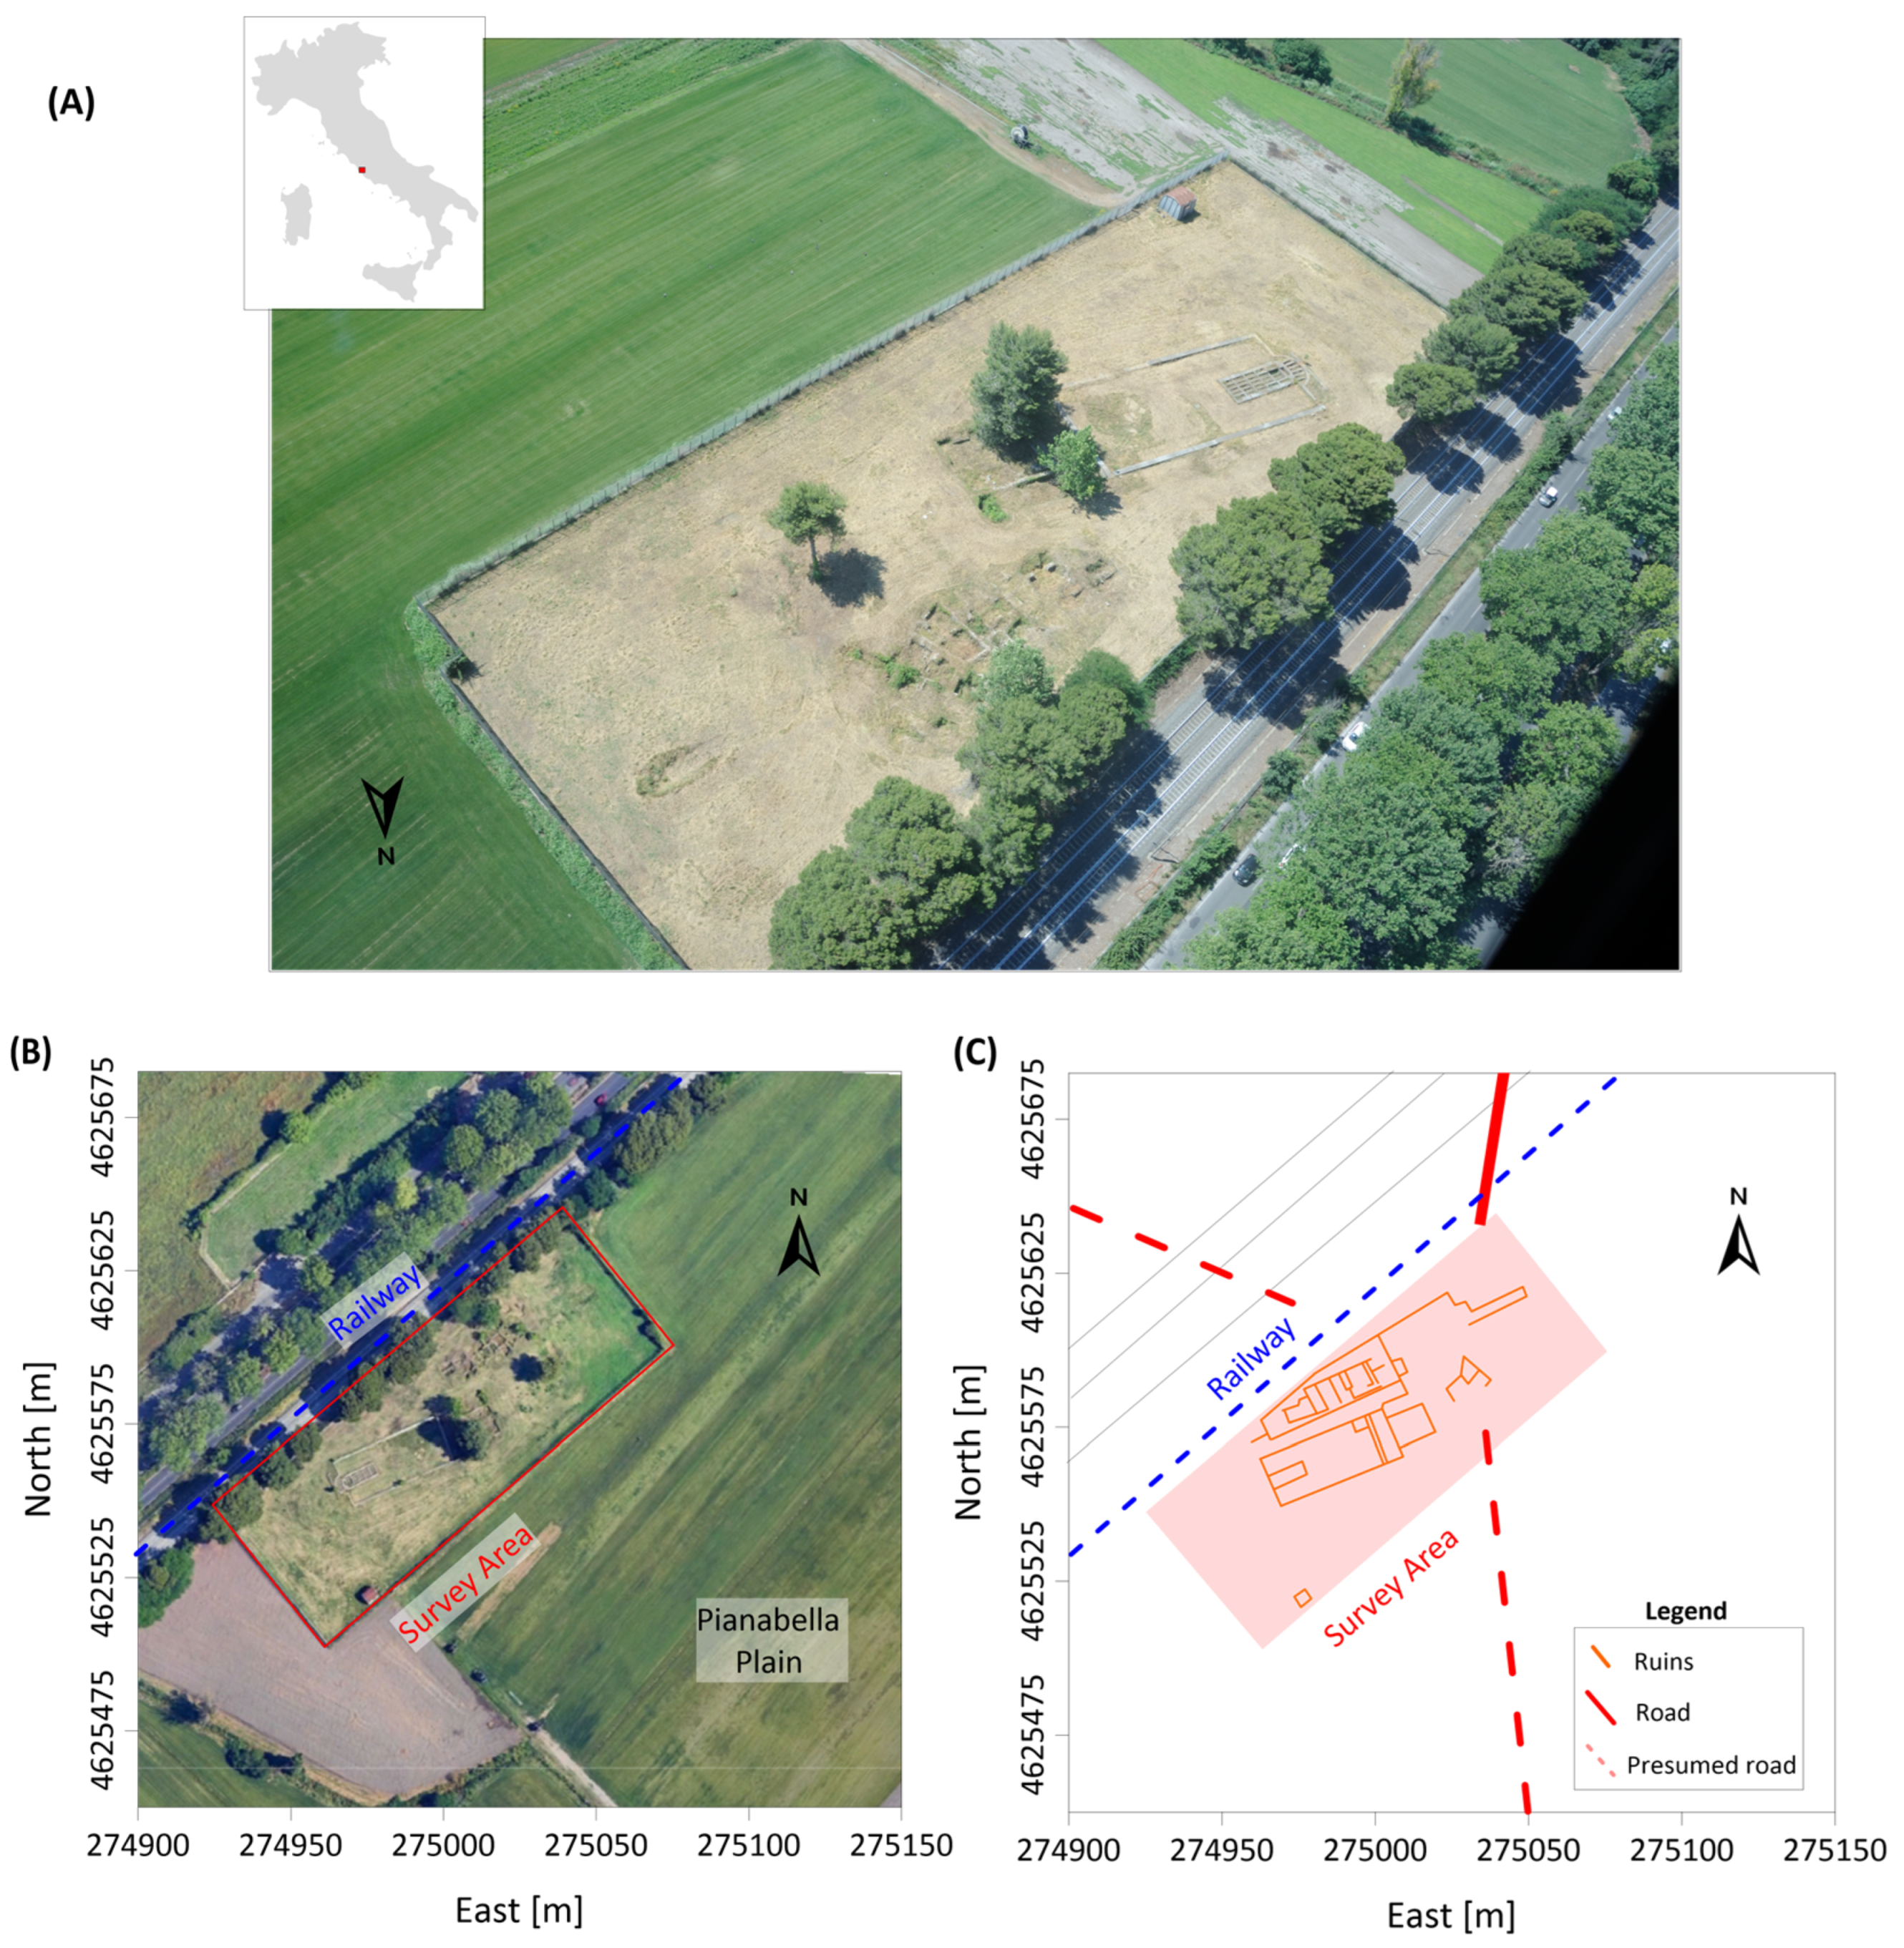
The surveyed area location is reported in Specifically, geophysical investigations were carried out within the area marked by red dashed lines in Figure 1B, covering a rectangular sector of approximately 145 m × 55 m. This survey area encompasses both excavated portions of the Basilica complex and adjacent zones that have not yet been investigated archaeologically. The integration of explored and unexplored areas within the same survey framework provides a valuable opportunity to test the geophysical response of known structures and, at the same time, to identify potential new features in the surrounding context. The survey area is enclosed by iron fences, which constitute a significant source of magnetic noise (red dashed lines in Figure 1B). This issue is particularly critical in small-scale investigations, where external disturbances may overshadow the weak signals generated by shallow archaeological remains.
Figure 1.
Survey area. (A) Drone photo of the study area; the inset indicates the location of the region at Italian national scale. (B) View of the Ostia Pianabella archaeological site from Google maps showing the Basilica ruins, the surveyed area delimited by a metal fence (red dashed lines) and the railway (blue dashed lines). (C) Planimetry of Ostia Pianabella archaeological site from excavation campaign (redrawn from [3]).
Figure 1C shows the archaeological plan of the Basilica and its surroundings, where excavated remains (orange and red solid lines) are reported together with presumed structures (red dashed lines), including possible road traces. This cartographic evidence provides a crucial interpretative framework for the geophysical results, since it allows comparing the anomalies detected by the instruments and with known archaeological features. At the same time, the indication of presumed remains highlights areas where geophysical data can play a decisive role in confirming or rejecting archaeological hypotheses, thus bridging the gap between previous excavation evidence and unexplored portions of the site.
Finally, we specify that some sectors of the survey area were inaccessible for the presence of trenches or fences. These undetected areas will appear as “data blank zones” in the results presented below.
2.3. Magnetic Data Acquisition
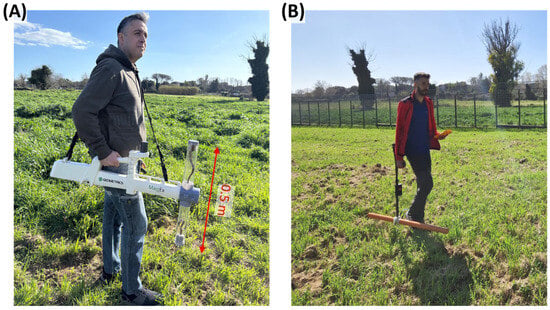
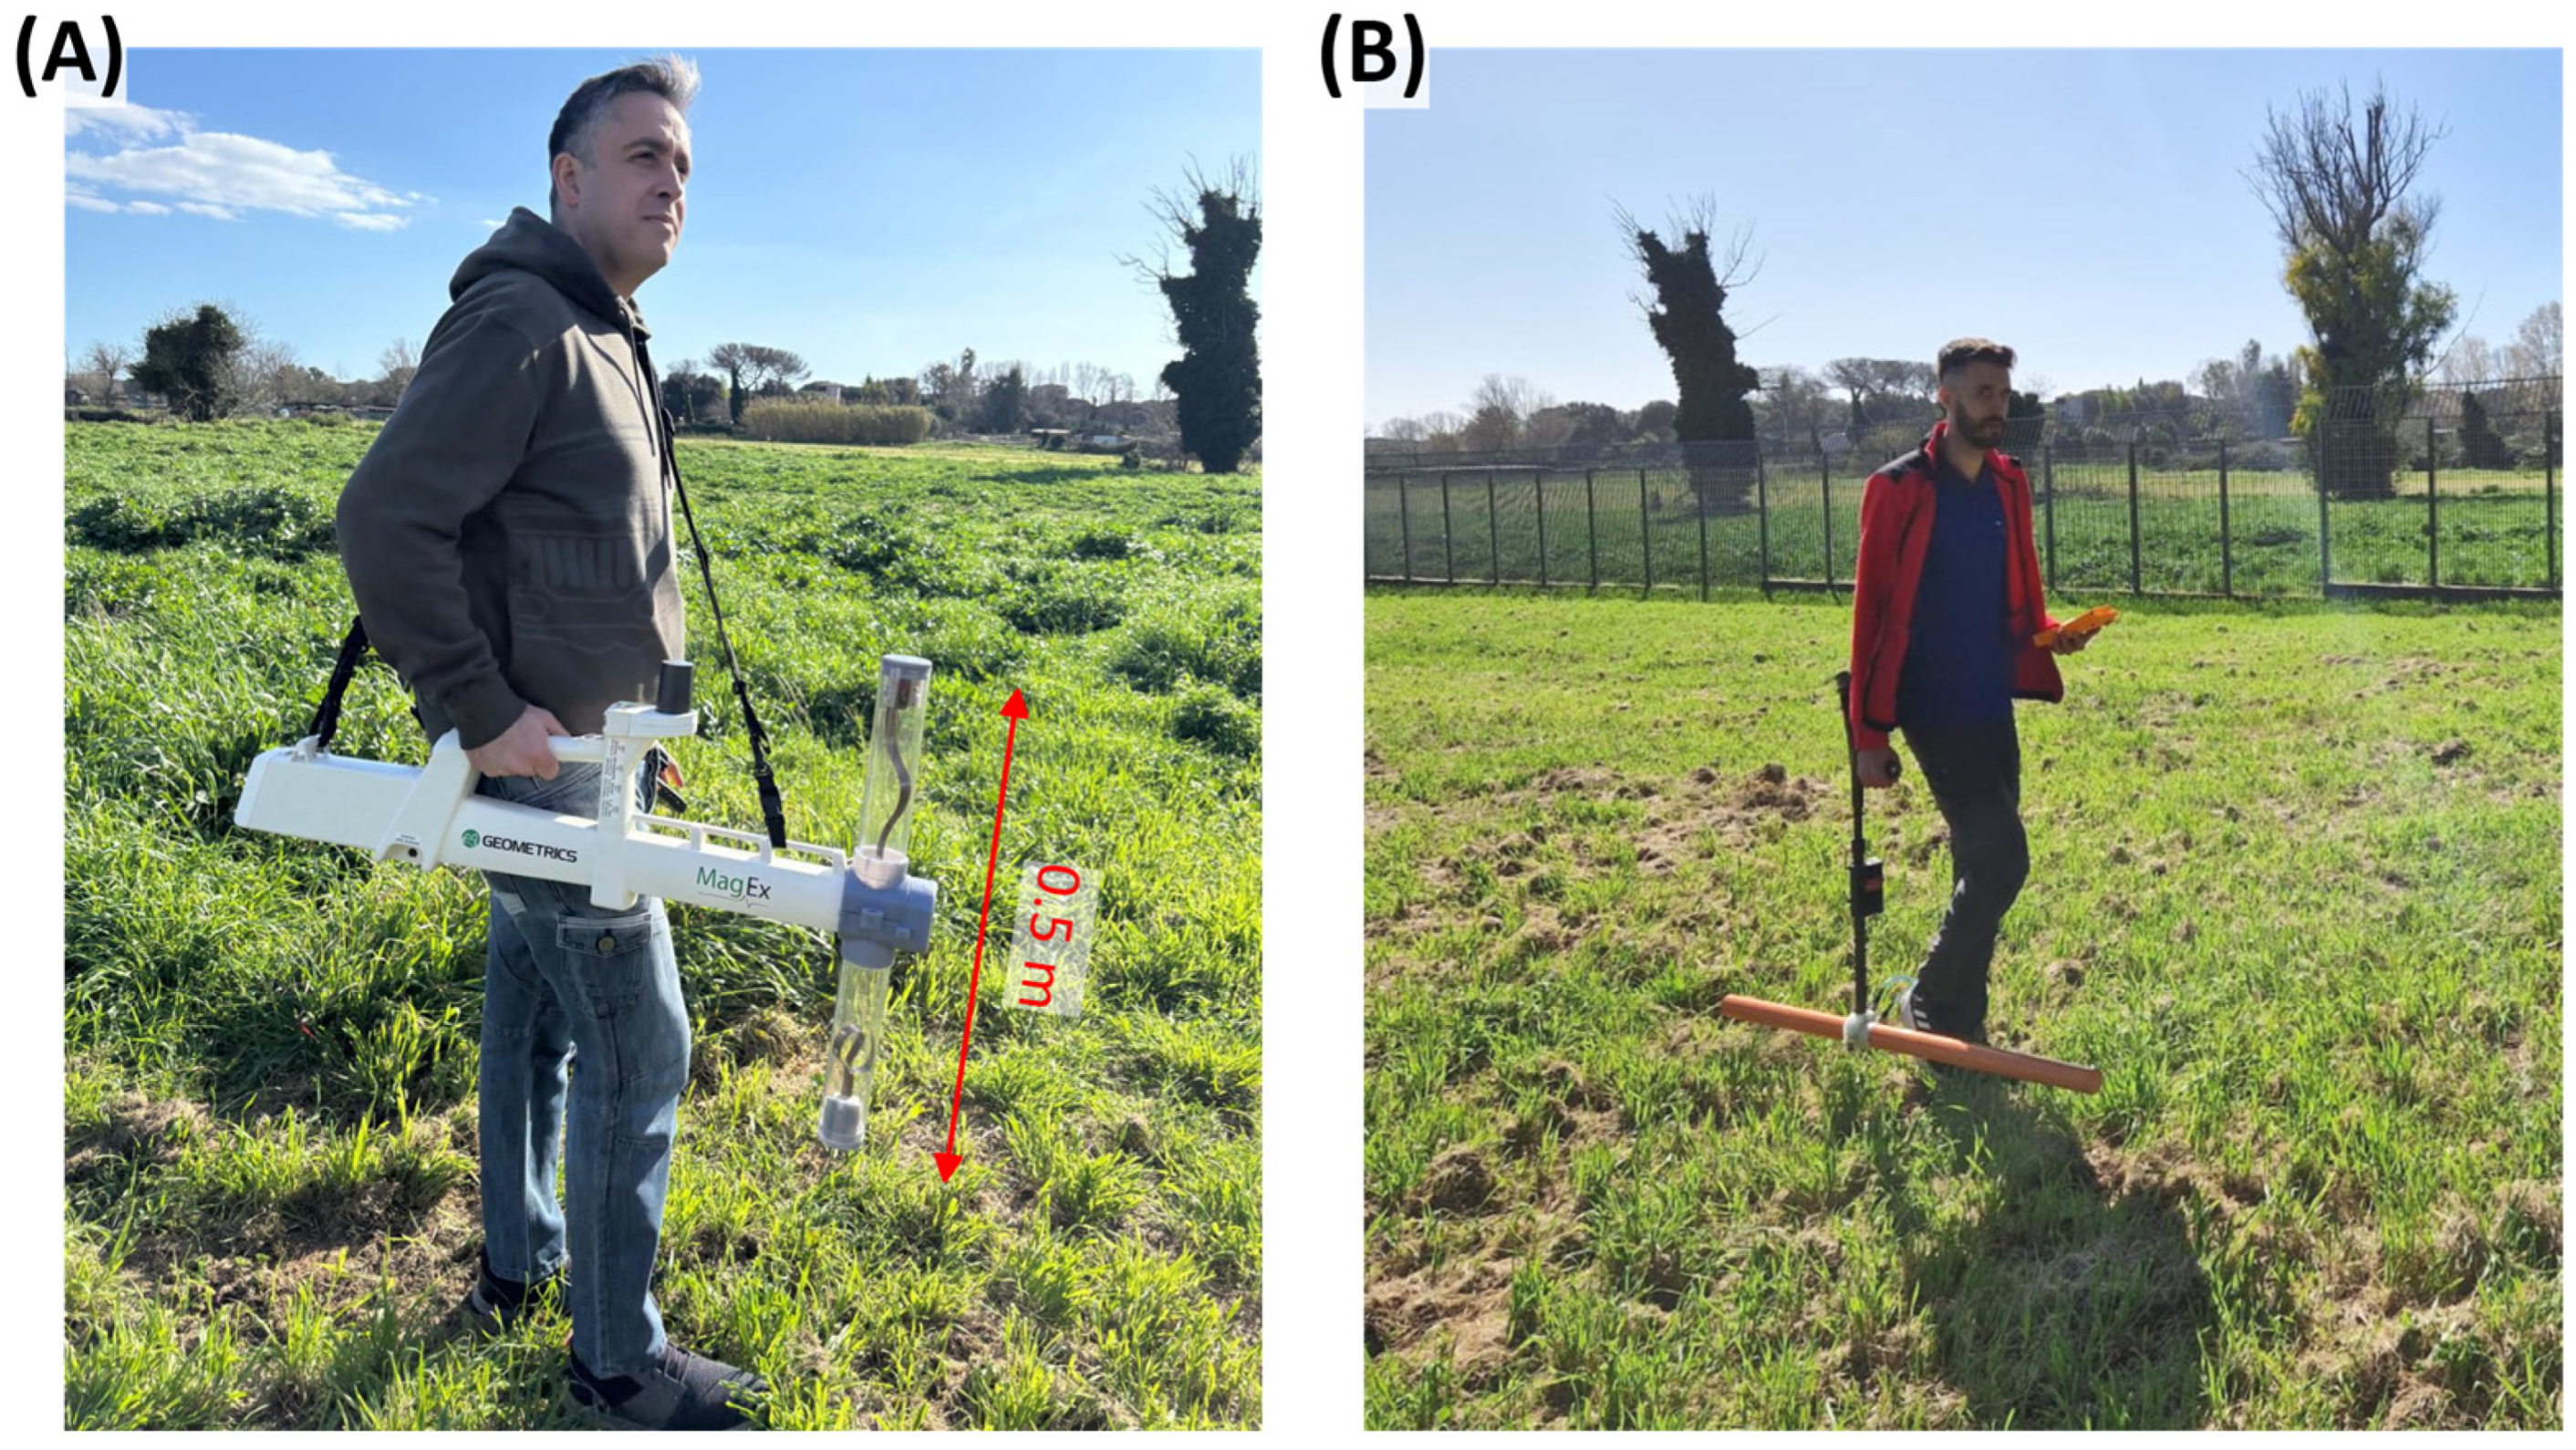
For the magnetic survey, we employed a Geometrics Micro-Fabricated Atomic Magnetometer (MFAM) sensor that is a laser-pumped atomic magnetometer equipped with two alkali-vapor cesium sensors (Figure 2A). The instrument is characterized by a very high sampling rate (1000 Hz), which allows unaliased measurements of 50 Hz fields and ensures a reliable identification of high-frequency magnetic noise (MFAM Module—Geometrics: Geometrics) (Table 1). A Global Navigation Satellite System (GNSS) receiver is integrated in the sensor “bird” providing position information at 1 Hz during magnetic data acquisition. The measurement lines were laid out in a northwest–southeast direction, orthogonal to the main exposed archaeological structures, with an interline spacing of 1 m. While MFAM technology was initially designed for lightweight UAV applications (e.g., Geometrics MagArrow), its ground-based commercial version, the MagEx, (Geometrics, San Jose, CA, USA) currently lacks a gradiometer configuration. Building on recent research that demonstrated the feasibility of custom vertical gradiometers using MFAM development kits [29,30,31,32], this study presents the first field results obtained with a new, non-commercial Geometrics prototype (Figure 2A). Unlike previous adaptations, this instrument was engineered specifically as a native vertical gradiometer, representing a significant upgrade in portability and precision for archaeological prospection. The configuration consists of two MFAM sensors vertically aligned with a fixed baseline of 0.5 m. During the survey, the magnetic sensor closest to the ground was maintained at an elevation of 0.70 m, while the second sensor was then positioned 1.20 m above the ground. The choice of baseline length is a critical parameter in the design of hand-held magnetic gradiometers. In general, baselines typically range between a minimum of 0.25 m and a maximum of 1 m, depending on the target depth and the survey conditions. A key requirement is to maintain a baseline shorter than the depth of the shallowest sources of interest, ensuring that the gradient signal is not artificially reduced. For archaeological investigations, where targets are generally shallow, shorter baselines provide higher sensitivity and better resolution of closely spaced anomalies. Conversely, in cases involving deeper targets or surveys conducted at higher altitudes, the distance between the two sensors should be increased to optimize the gradient measurement. This newly developed prototype therefore offers a tailored solution for archaeological prospection, combining the advantages of atomic magnetometer technology with the improved resolution and robustness of vertical gradient measurements.
Figure 2.
Geophysical equipment. (A) Geometrics Micro-Fabricated Atomic Magnetometer gradiometer prototype and (B) GF Instruments CMD-Mini Explorer electromagnetic conductivity meters. Red arrow indicates the distances between the magnetic sensors.
Table 1.
Specification list of the used geophysical equipment.
To address weak signals generated by shallow archaeological remains challenge, a careful data processing workflow is required, and, importantly, the use of vertical magnetic gradient measurements becomes fundamental, as it suppresses uniform external fields while enhancing the signal from buried sources. In addition, just outside the north-western boundary of the survey area, a railway line runs parallel to the site (blue dashed line in Figure 1B). Both the presence of the track and the circulation of trains represent potential sources of strong magnetic disturbances. Such noise can severely affect the quality of total-field data, further reinforcing the importance of employing gradient techniques to mitigate external contributions and to improve the detectability of near-surface archaeological anomalies.
The acquired and raw data were imported in ASCII format into Matlab (R2023a) for processing and visualization.
2.4. ElectroMagnetic Induction (EMI) Data Acquisition
An EMI survey was conducted in the study area using the CMD-Mini Explorer (GF Instruments, Brno, Czech Republic) (Figure 2B), a portable, multi-coil conductivity meter specifically designed for high-resolution near-surface geophysical investigations. The instrument operates with three fixed coil separations (0.32, 0.71, and 1.18 m), enabling simultaneous measurements at multiple effective depths, approximately 0.5 m, 1.0 m, and 1.8 m in high mode (Table 1). By transmitting a low-frequency electromagnetic field and recording the secondary response induced in the ground, the CMD-Mini Explorer measures both the apparent electrical conductivity and the in-phase component, sensitive to the magnetic susceptibility contrasts, providing a single-pass assessment of the conductivity structure and magnetic response of subsurface features. The measurement lines were laid out in a northwest–southeast direction, orthogonal to the main exposed archaeological structures, with an interline spacing of 1 m.
Key advantages of this system include its lightweight and robust design, rapid sampling rate (10 Hz), GNSS integration for georeferenced data collection (1 Hz), and full compatibility with mapping and inversion software. These characteristics make it particularly well-suited for archaeological prospection, where it can detect variations related to soil moisture, lithology, and buried structures such as walls, ditches, pits, or foundation remains, even under challenging environmental conditions. The survey was carried out along NW-SE-oriented parallel lines spaced 1 m apart, and the acquired data were imported in ASCII format into Seequent’s Oasis Montaj software (2025.2.1) for processing and visualization.
3. Results
3.1. Magnetic Result
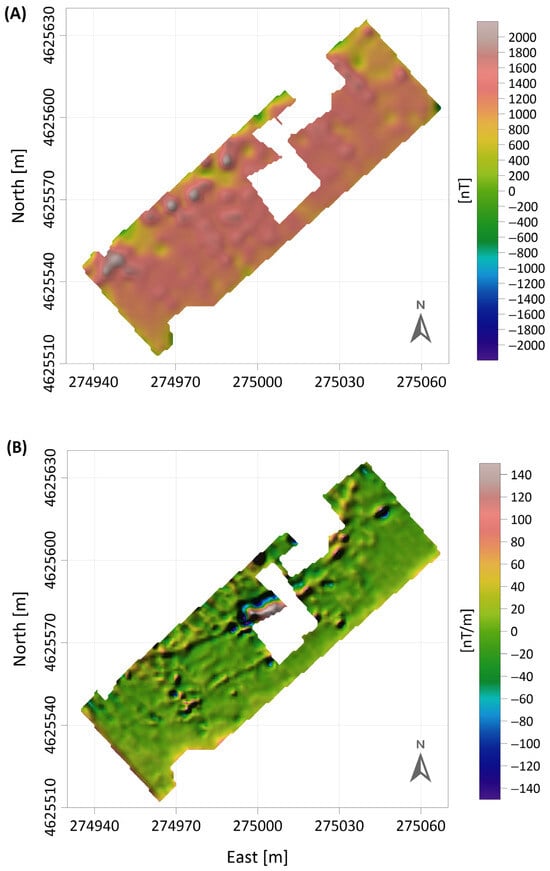
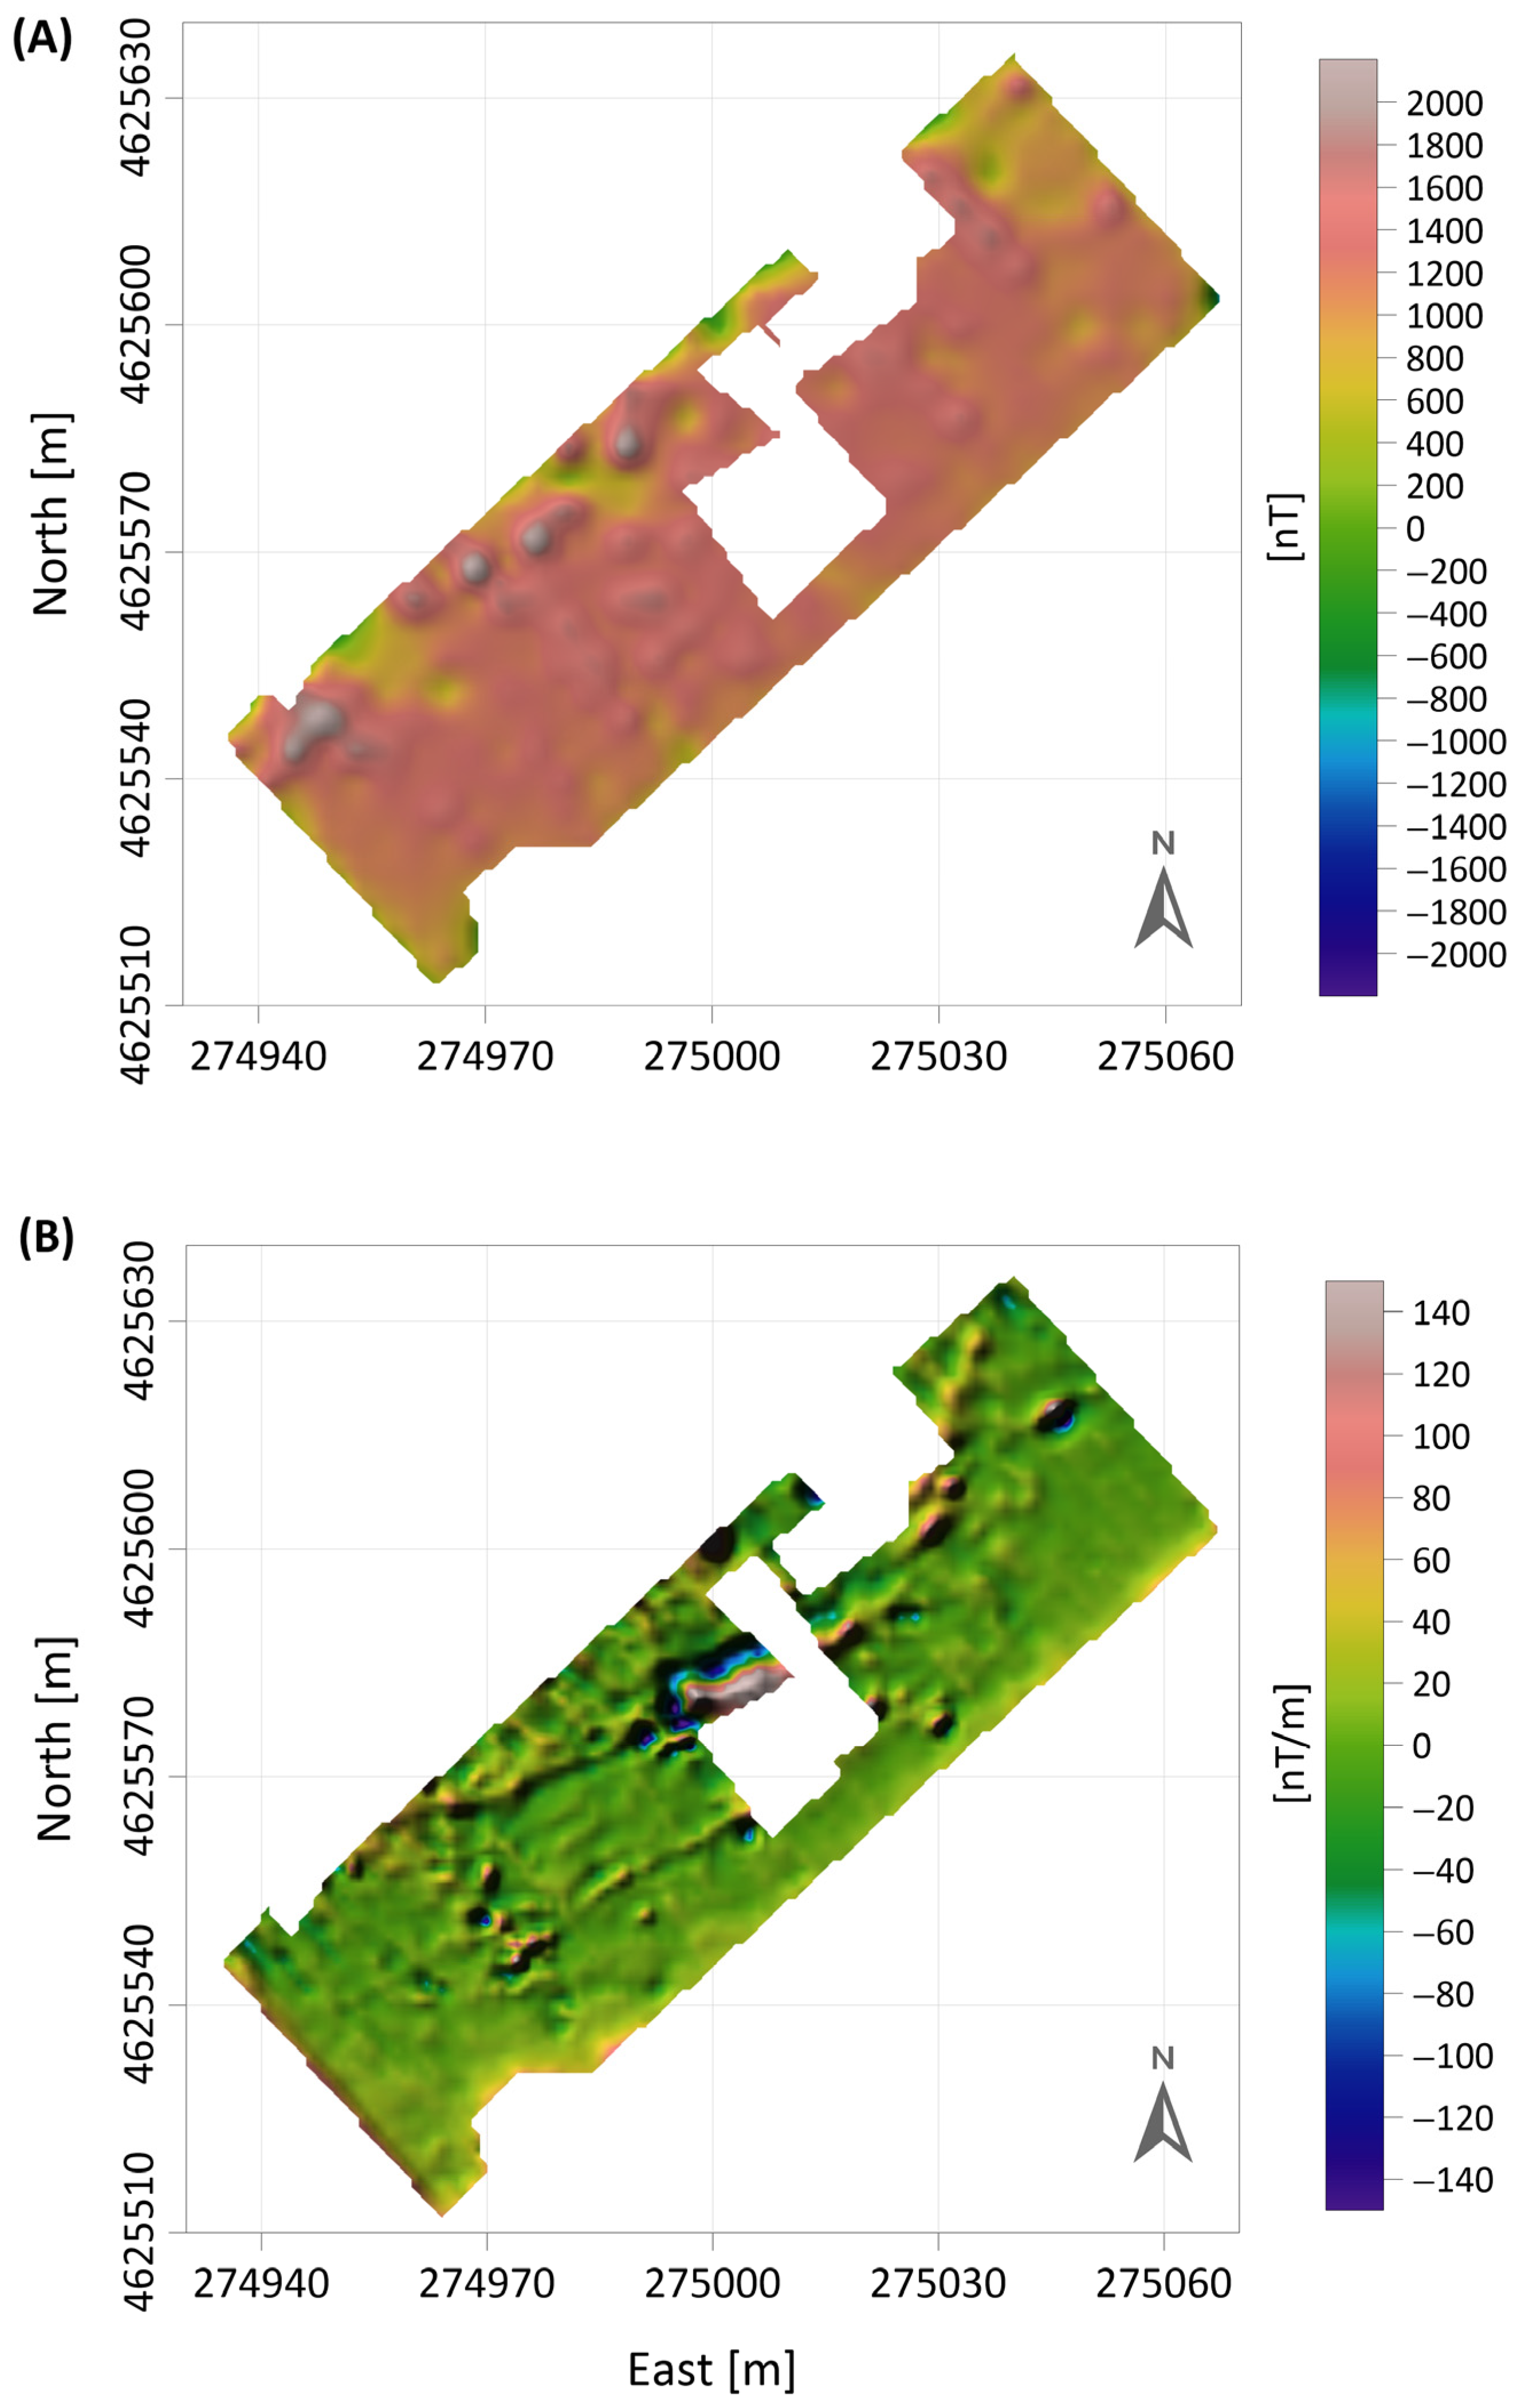
Figure 3 shows the filtered results of the magnetic survey in terms of the Total-Field Anomaly (TFA) at the lower sensor (Figure 3A) and vertical gradient (Figure 3B) maps. The TFA map was obtained after subtracting a constant value corresponding to the International Geomagnetic Reference Field (IGRF) for the study area, whereas the vertical gradient map was computed as the difference between the lower and upper sensors divided by their baseline.
Figure 3.
Filtered magnetic dataset. (A) Total-Field Anomaly filtered map acquired by the lower sensor. (B) Filtered vertical gradient map.
The raw data were initially affected by directional noise typical of bi-directional acquisition. This effect, commonly referred to as “heading error”, arises because the relative geometry of the instrument–operator system changes when the operator traverses adjacent survey lines in opposite directions. As a consequence, maps display striping artifacts associated with small but systematic shifts in the mean magnetic values between consecutive lines. Traditionally, this effect can be mitigated by equalizing the mean value of each line, or alternatively by performing one-way surveys that avoid sensor rotation, albeit at the expense of significantly longer acquisition times.
In this study, we adopted a more robust approach based on the Discrete Wavelet Transform (DWT), which allows the effective removal of linear artifacts without compromising the integrity of the anomaly patterns [35]. This method proved particularly effective in suppressing striping while preserving the resolution of archaeological-scale anomalies.
Furthermore, since the maps also showed contamination by high-wavenumber noise, we applied a mild low-pass filter. This step was essential to attenuate disturbances at around 50 Hz, most likely caused by nearby power lines, while retaining the main anomaly signals of archaeological interest.
As already described above, the vertical gradient measurements are particularly effective in enhancing the signal from near-surface, small-scale sources while simultaneously suppressing the influence of regional or external disturbances. Such a property is crucial in archaeological contexts, where the buried structures of interest are often shallow, closely spaced, and masked by various sources of cultural and environmental noise. Although the gradient map is not free from limitations, most notably the presence of internal gaps caused by practical survey constraints such as standing obstacles (excavation trenches, vegetation, or small trees), as well as the exclusion of a peripheral strip affected by the strong interference of surrounding metallic fences, it nevertheless provides a coherent and interpretable image of the subsurface. In the central portion of the survey area, a rectangular feature can be clearly observed, expressed as alternating maxima and minima with amplitudes of approximately ±20 nT/m (Figure 3B). This anomaly correlates well with the planimetric outline of the exposed Basilica, thus confirming the sensitivity of the method to architectural remains already documented archaeologically. Immediately north of this structure, a set of sub-vertical linear trends emerges. These trends appear consistent with wall-like features, comparable to those excavated further to the east, in correspondence with the data gap visible in the map and partially exposed in situ. A high-amplitude anomaly is also remarkably noted, reaching values in the order of ±140 nT/m. This anomaly develops parallel to the northern wall of the Basilica, where the first sector of the road is very shallow. Following the anomaly, which curves moving toward the north (Figure 3), the related intensity becomes lower (up to ±50 nT/m), hypothesizing a larger depth of the suspected road, which in this area is covered by soil. These features, oriented approximately southwest–northeast, are consistent with the expected location of the ancient Roman road that historically connected the site with the settlement of Ostia Antica. Finally, the gradient map displays a background pattern of small-scale oscillations, expressed as a sequence of localized maxima and minima spread throughout the surveyed area. Nevertheless, their overall distribution does not obscure the main archaeological signals, which remain clearly distinguishable in the enhanced gradient product.
3.2. EMI Results
The results of the EMI survey are presented separately for the apparent conductivity and the in-phase components, each acquired at three distinct investigation depths of approximately 0.5 m, 1.0 m, and 1.8 m.
Initial gridding procedures produced preliminary maps for the three depth levels of apparent conductivity and their corresponding in-phase responses. A subsequent quality assessment identified potential sources of electromagnetic interference, mainly from metallic fences and the adjacent railway line. Data segments affected by such disturbances were excluded to enhance the reliability of results. After data refinement, new grids were generated. The residual dataset exhibited excellent quality and coherence, rendering further filtering unnecessary. Finally, the processed grids were integrated within a geospatial framework, and thematic maps were produced to illustrate the spatial distribution of both apparent conductivity and in-phase components across the three investigation depths.
3.2.1. In-Phase Component
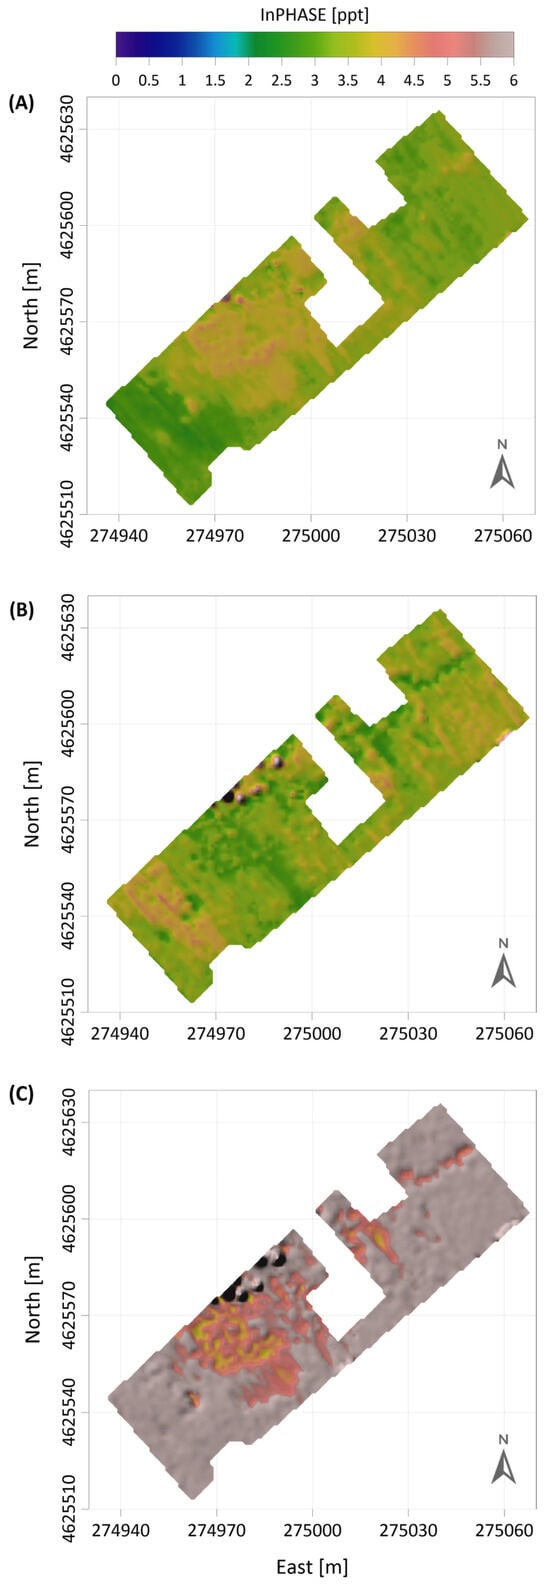
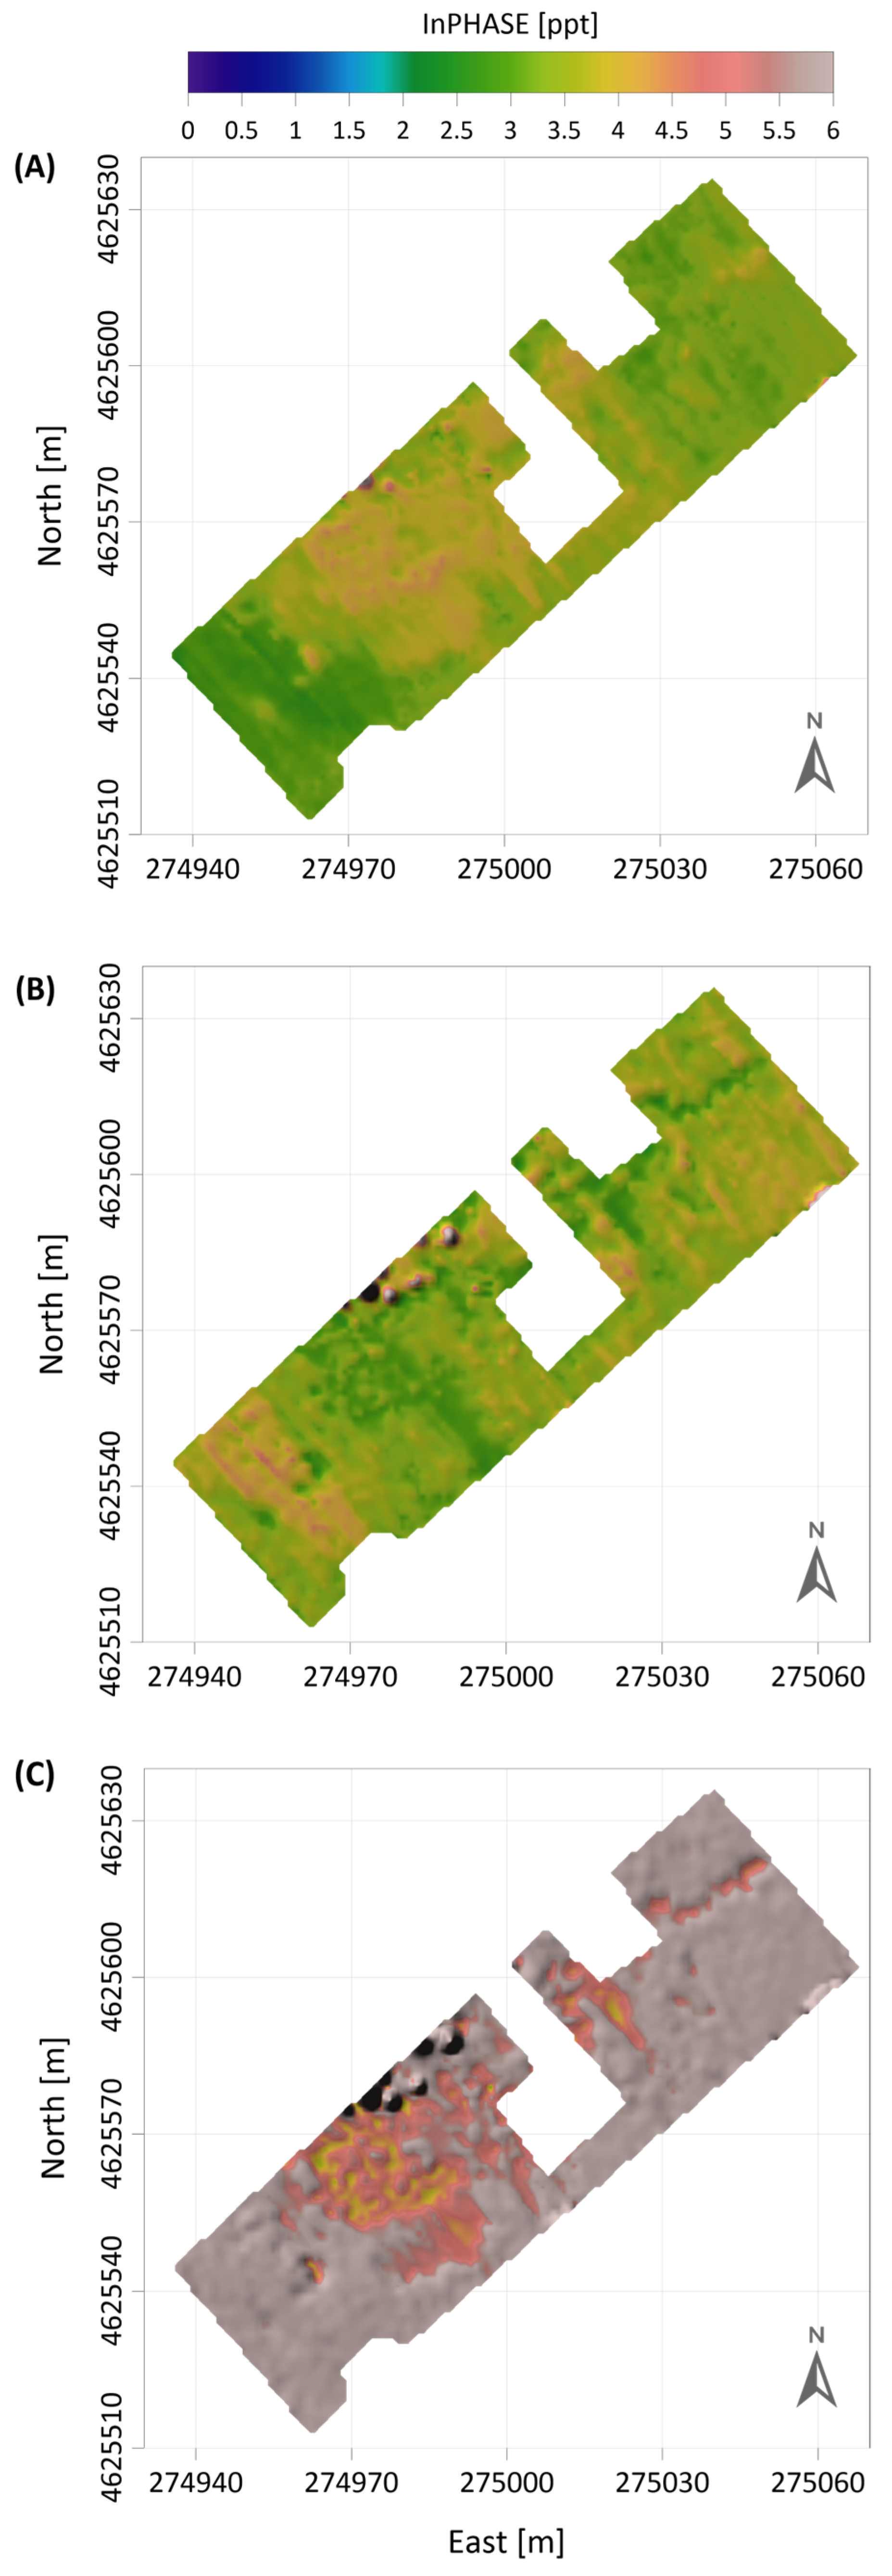
The in-phase data, representing the magnetic response of the subsurface, exhibit a distinct pattern compared to conductivity. At the shallowest level (≈0.5 m, Figure 4A), higher in-phase values are concentrated within the central portion of the area, corresponding to the ruins of the Basilica and the associated tombs, while lower values are observed along the periphery.
Figure 4.
EMI results 1. Electromagnetic InPhase maps associated with (A) 0.5 m, (B) 1.0 m and (C) 1.8 m of depth.
At the intermediate level (≈1.0 m, Figure 4B), a marked shift in the spatial distribution of the in-phase values becomes clear, diverging from the pattern observed at the surface. This trend is further accentuated at the deepest level (≈1.8 m, Figure 4C), where lower in-phase values are now observed over the archaeological remains, whereas higher values are concentrated toward the boundaries of the surveyed area.
3.2.2. Apparent Conductivity
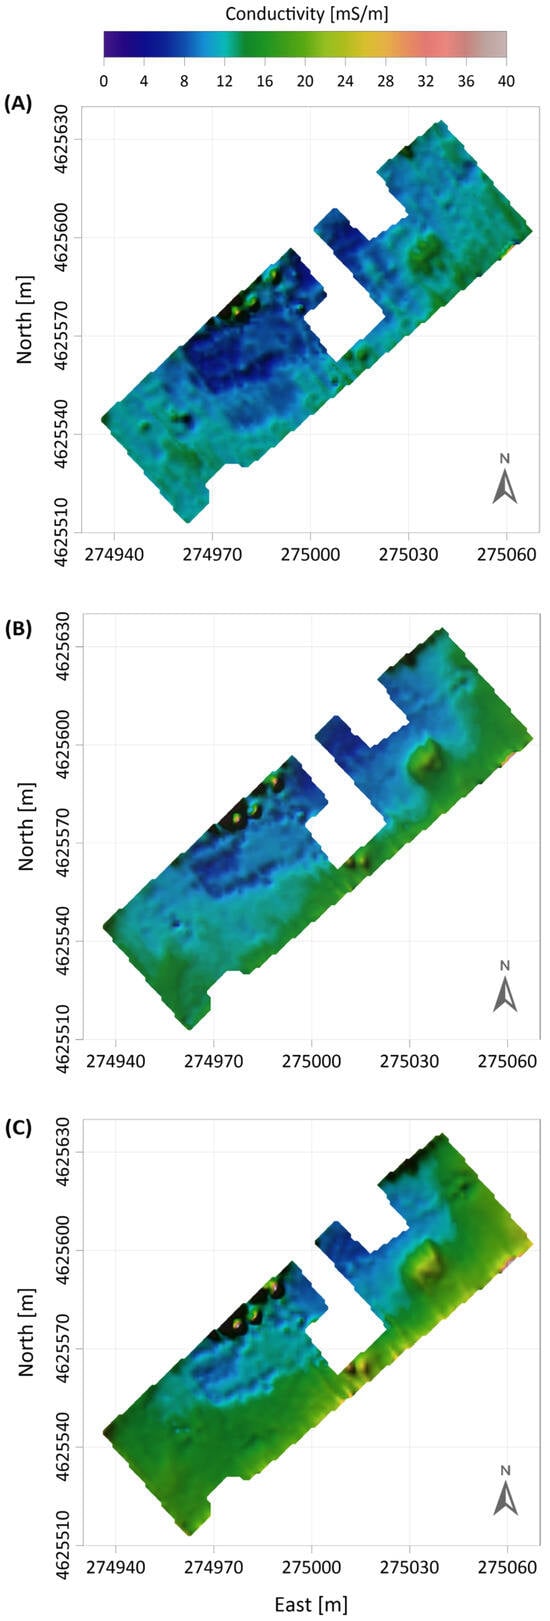
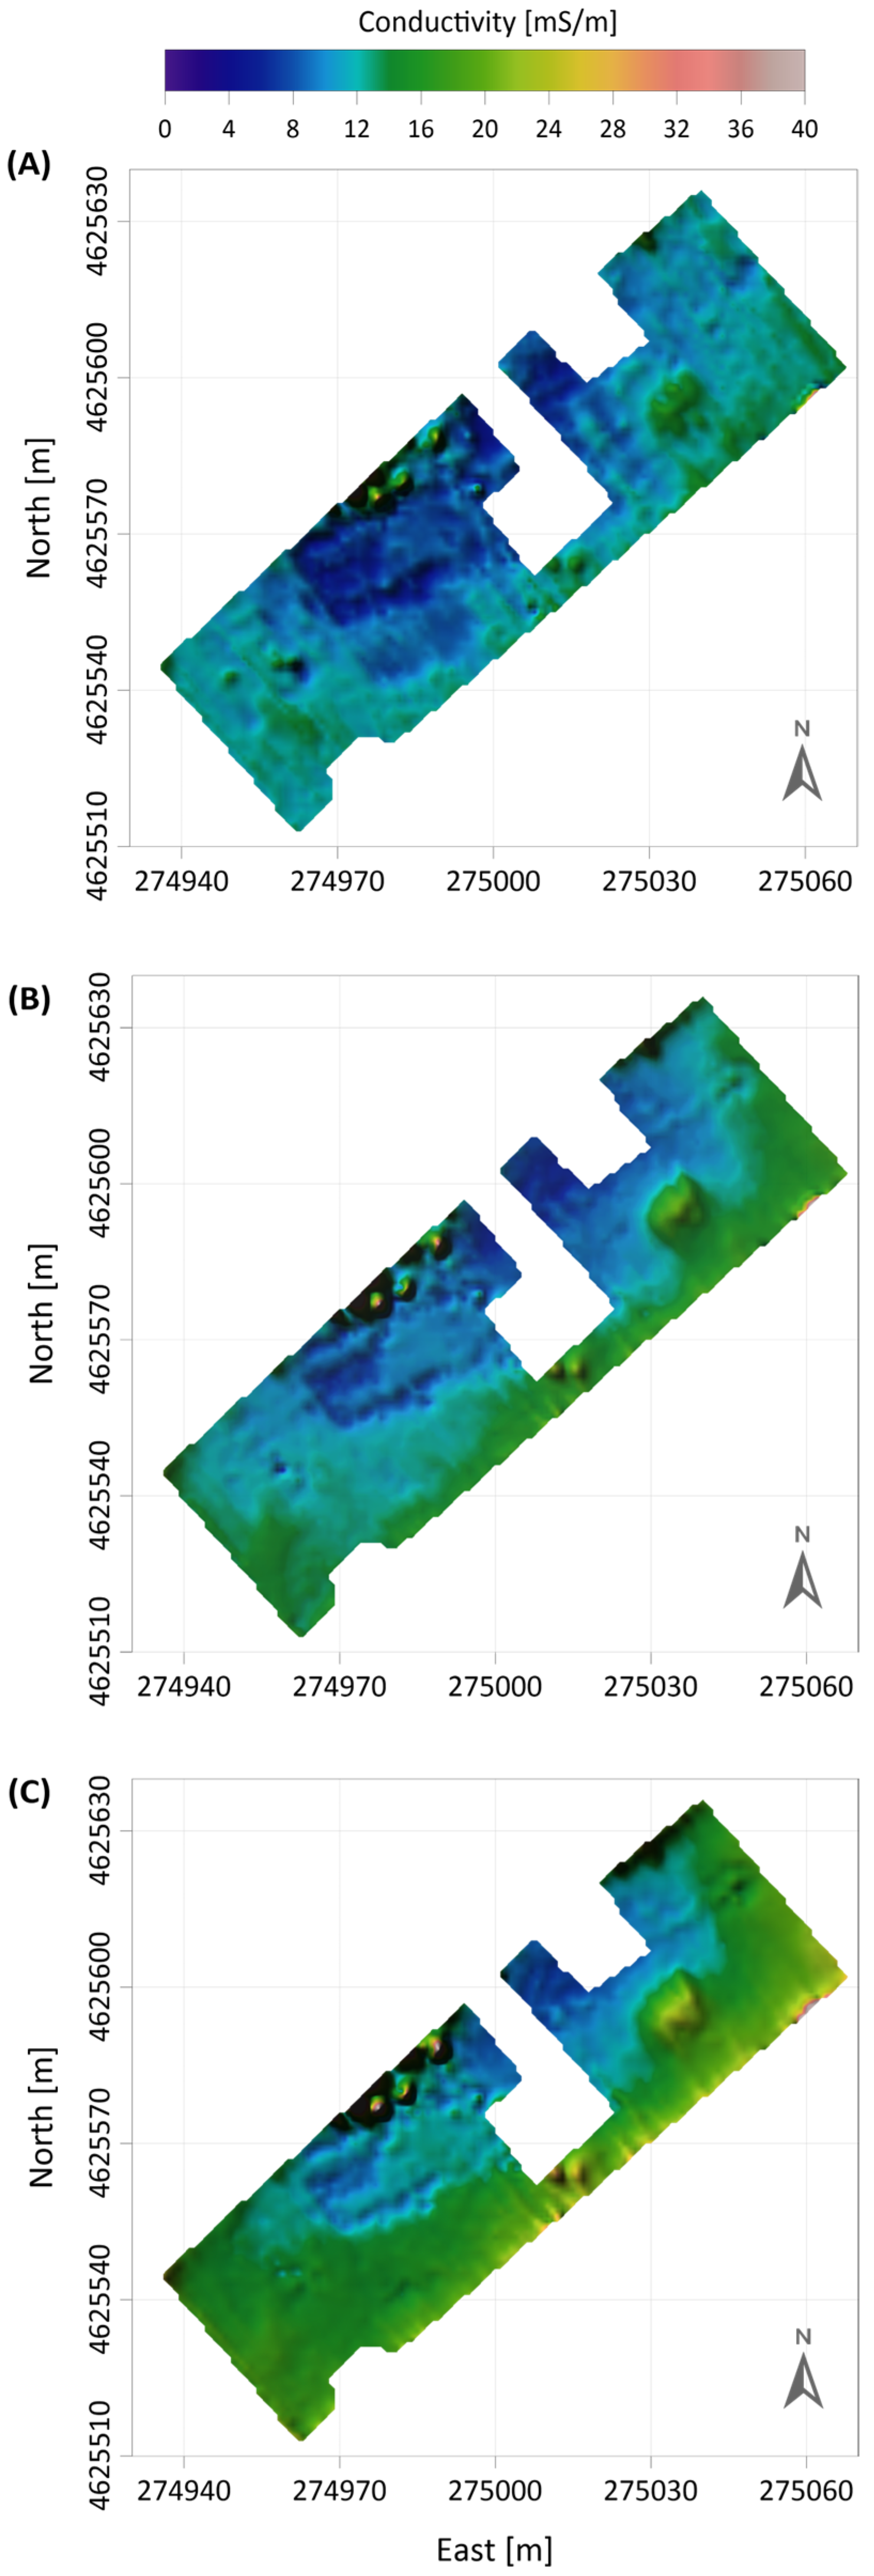
At the shallowest level (≈0.5 m), the apparent conductivity map (Figure 5A) reveals higher values along the outer margins of the surveyed area and lower conductivity values coinciding with the walls of the Basilica, effectively outlining its perimeter. Similarly, low-conductivity anomalies are observed in correspondence with areas identified as burial features. An additional localized zone of elevated conductivity appears in the southeastern sector, where no surface evidence is visible. Comparison with recent aerial and photographic documentation indicates the past presence of a large tree, suggesting this anomaly is likely associated with the residual root system or its remnants.
Figure 5.
EMI results 2. Electromagnetic Apparent conductivity maps at (A) 0.5 m, (B) 1.0 m and (C) 1.8 m depth.
At the intermediate depth (≈1.0 m, Figure 5B), the same general distribution of conductivity values is maintained, though the contrasts between low and high values become more pronounced, indicating increased signal stability and clearer differentiation of subsurface features.
At the deepest level (≈1.8 m, Figure 5C), the previously identified structures remain visible, while a new, elongated anomaly becomes evident to the north of the basilica remains. The elongated anomaly is most likely connected to the soil being disturbed by excavations carried out in the 1980s.
4. Discussion
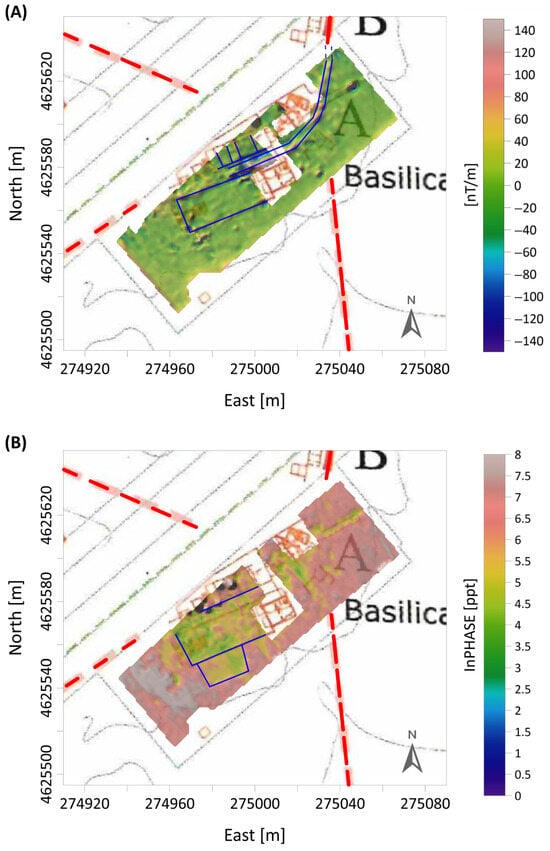
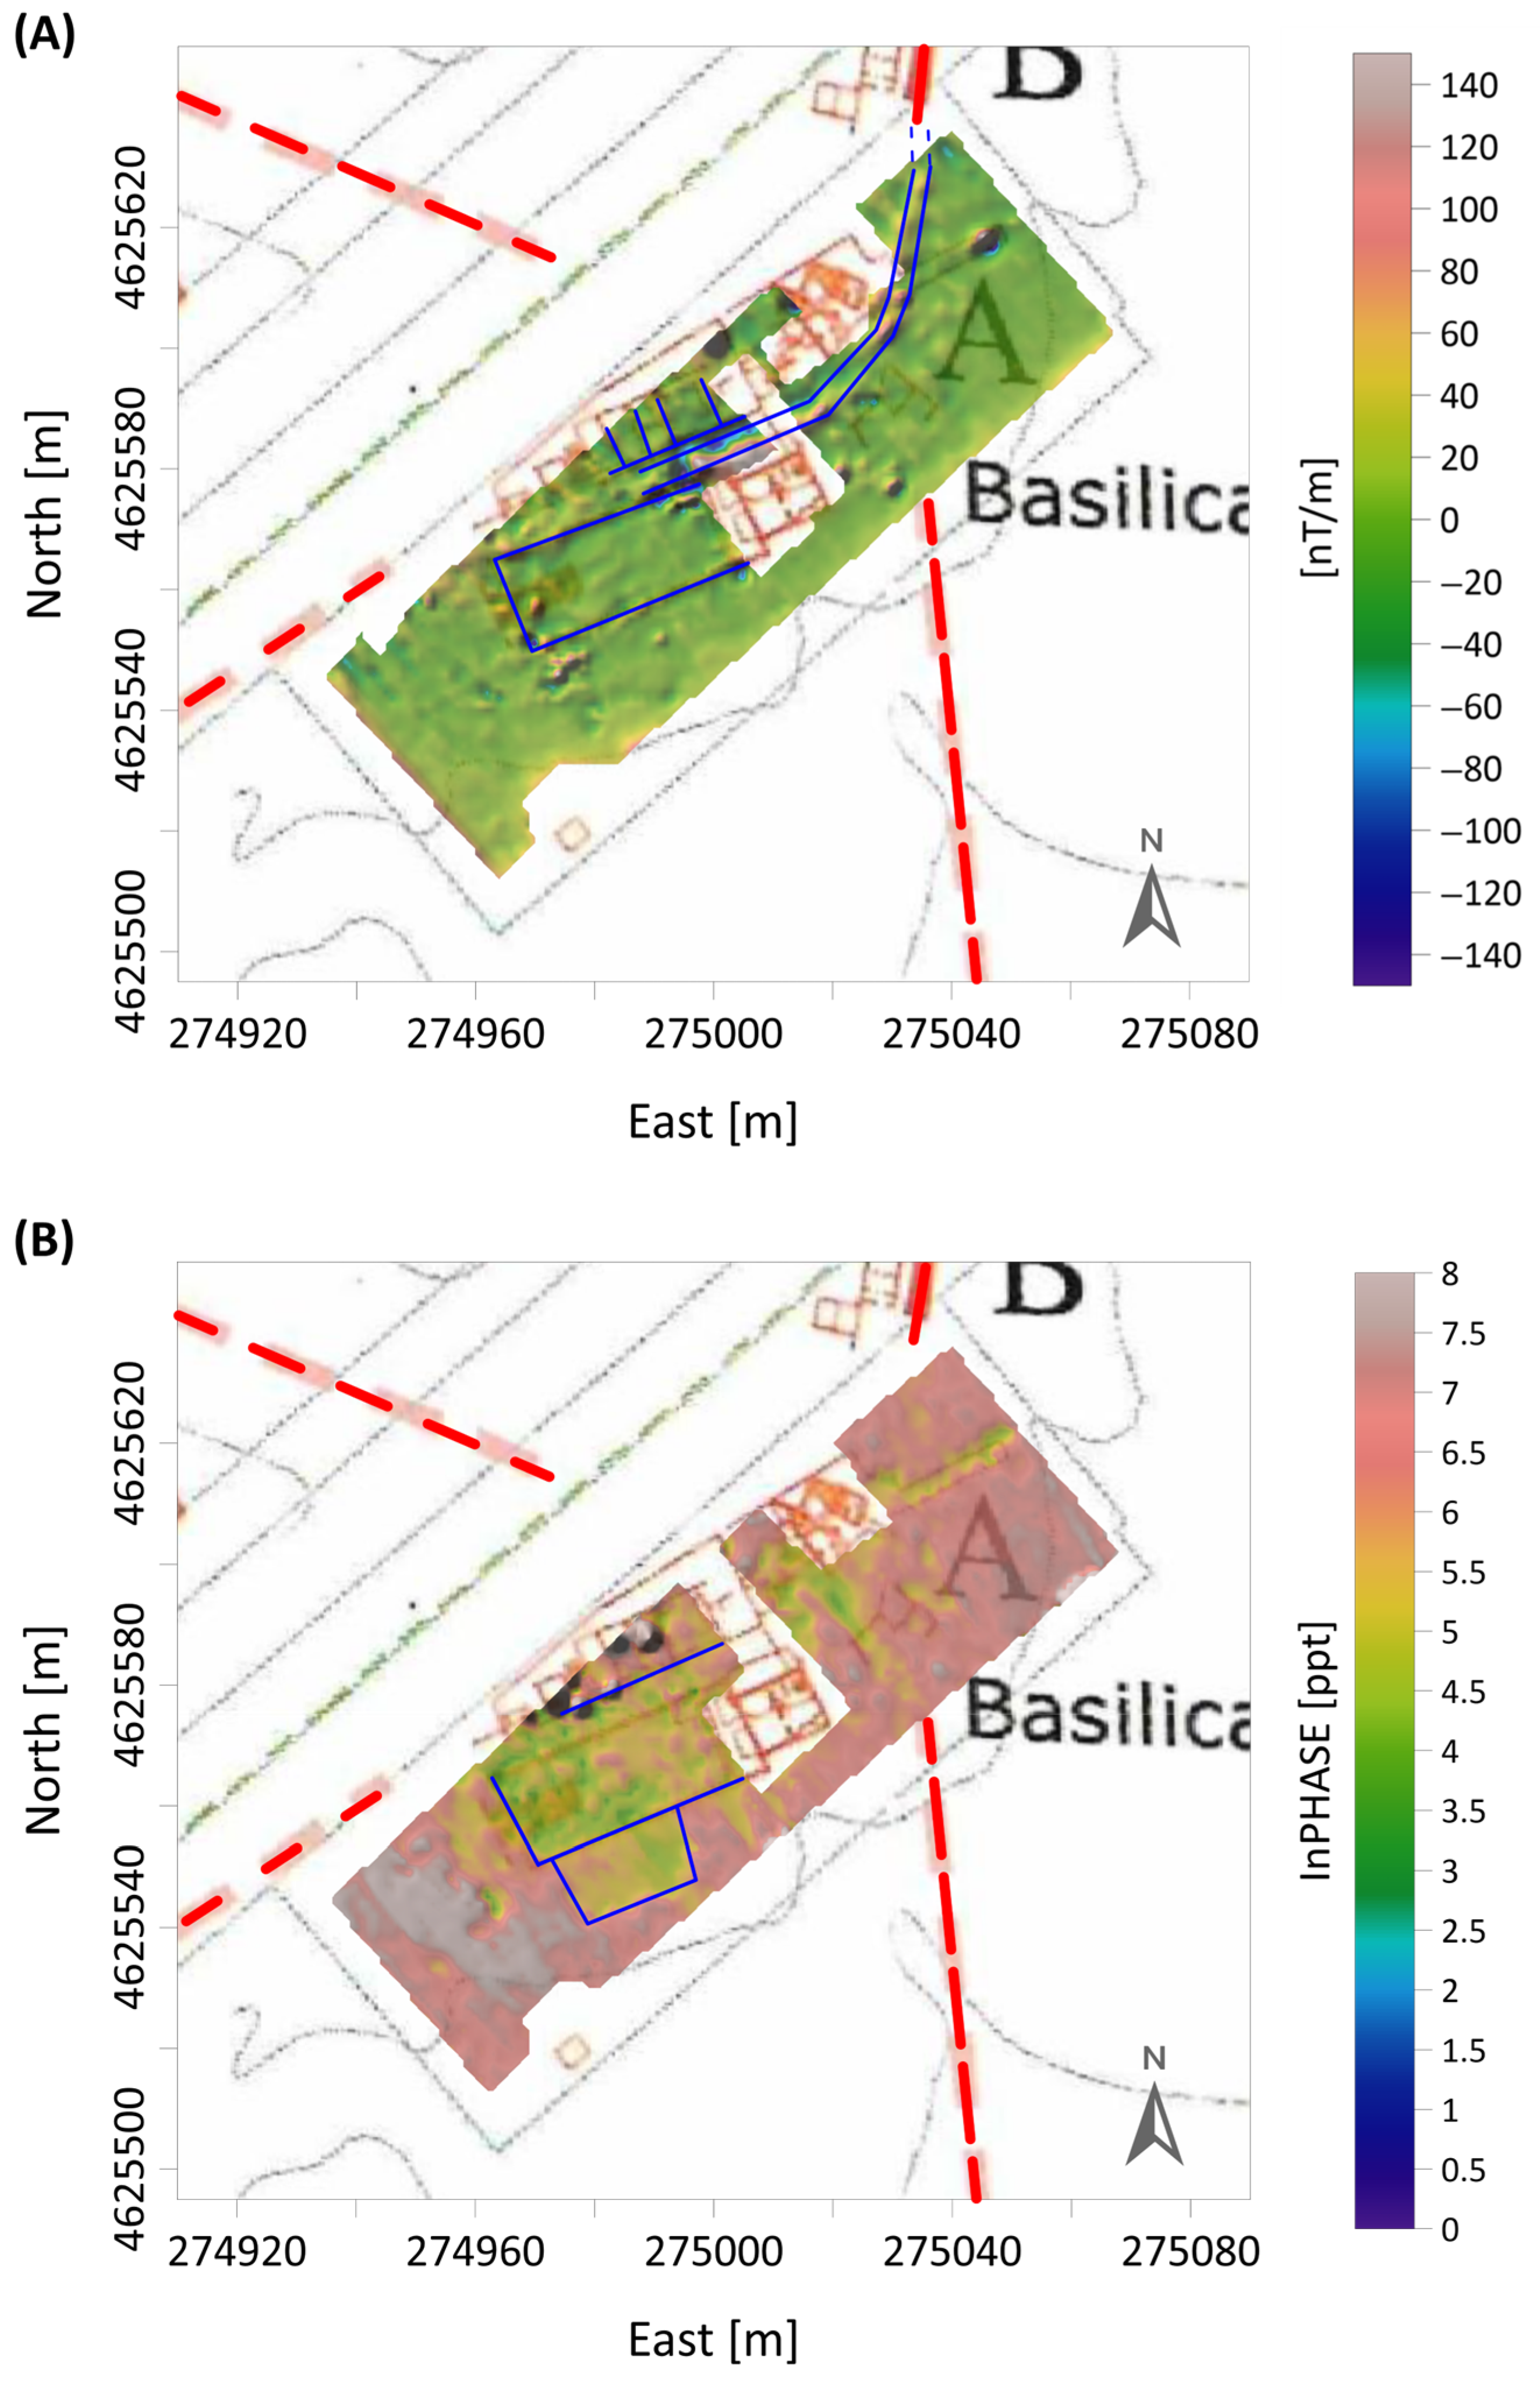
The combined magnetic and ElectroMagnetic Induction (EMI) investigations carried out at the Basilica of Pianabella have provided new insights into both the archaeological interpretation of the site and the methodological evaluation of next-generation geophysical instrumentation, like the new MaxEx prototype. Despite the presence of strong external disturbances and field constraints, the integrated results highlight the robustness and complementarity of the two approaches, confirming their potential for guiding future archaeological exploration in complex environments such as Ostia’s suburban necropolis. In particular, analyzed data from geophysical surveys conducted for this work confirm the presence of the paved road on the northern side of the basilica, allowing its route to be traced with greater precision (Figure 6). In fact, the road runs parallel to the north side of the Basilica, curving north-east towards Porta Laurentina, one of the three gates leading into the ancient city of Ostia, located about 200 m from this point. On the north side of the road, there were several funerary buildings from the Middle Imperial period (1st–2nd century AD), which were probably already abandoned at the time of the Basilica’s construction. Considering the extent of the anomaly recorded by the instruments at this point, it is possible that these funerary buildings collapsed onto the road, causing accumulations of building materials that were clearly detected by the instruments. The conditions of the ground and interference from the metal fence and the nearby railway line did not allow anomalies to be detected in the central part of the Basilica, under which there must have been some funerary buildings from an earlier period, some of which had already been investigated in the 1970s and 1980s. In this sense, the geophysical surveys carried out will provide useful elements of comparison for future non-invasive analyses and help to locate future investigative tests.
Figure 6.
Anomalies interpretation (A) Vertical gradient and (B) InPhase maps superimposed on the planimetry of the Pianabella Ostia site. Blue lines highlight the archaeological features interpreted from the detected anomalies, while the red continuous and dashed lines on the planimetry map [3] indicate the road and presumed road, respectively.
4.1. Geophysical Performance and Methodological Assessment
From a methodological standpoint, the survey represents the first field deployment of the new Geometrics MagEx vertical gradiometer prototype based on Micro-Fabricated Atomic Magnetometer (MFAM) technology. The system demonstrated excellent sensitivity and stability even under severe magnetic interference from the iron fences and railway line bordering the site. The implementation of a Discrete Wavelet Transform (DWT) filter effectively removed directional striping (heading errors) without compromising the integrity of small-scale anomalies, while a low-pass filter attenuated the residual 50 Hz noise from power lines. As expected, the TFA (Total Field Anomaly) map contained no diagnostic features due to external contamination, whereas the vertical gradient product provided a coherent and interpretable image of near-surface archaeological sources. These results confirm the theoretical advantages of gradient measurements, namely, the enhancement of short-wavelength features and suppression of long-wavelength noise, making this configuration particularly suitable for cultural heritage prospection in magnetically noisy environments.
The CMD-Mini Explorer survey complemented the magnetic dataset by detecting conductivity contrasts associated with buried walls and backfilled areas. Although its spatial resolution is inherently lower than that of the magnetic gradient data, the EMI measurements provided valuable confirmatory evidence and a means to discriminate between structural and pedological anomalies. The simultaneous acquisition of conductivity and in-phase components at multiple depths enabled a three-dimensional assessment of the subsurface, supporting the magnetic interpretation and offering additional clues about the physical properties of the underlying deposits.
4.2. Archaeological Interpretation
The vertical magnetic gradient map clearly delineates the planimetric outline of the Basilica, corresponding to the known archaeological remains uncovered during previous excavations. The alternating positive and negative anomalies, with amplitudes of approximately ±20 nT/m, match the structural remains of the church walls and the internal funerary enclosures, demonstrating the high sensitivity of the MagEx prototype in detecting shallow-buried masonry elements. Immediately north of the Basilica, the gradient data reveal a set of linear anomalies trending E-W and NW-SE, of lower intensity but consistent with wall-like structures similar to those excavated in the eastern sector. The main high-amplitude anomaly (50–60 nT/m), in contrast, follows the northern wall of the Basilica and then curves northward, suggesting the presence of a substantial buried feature, most likely a basalt-paved road. Indeed, the continuation of this anomaly towards the northeast corner is coherent and appears to merge with the planimetric layout shown in Figure 1B. All the anomalies described above are clearly indicated in Figure 6A.
The electromagnetic survey confirms several of these observations and adds some interesting features that warrant further investigation. The apparent conductivity maps (Figure 5A–C) reproduce the general perimeter of the Basilica as low-conductivity zones across all investigation depths (≈0.5–1.8 m), in agreement with the magnetic signatures of the walls. Conversely, the higher conductivity values observed at the site margins are interpreted as being related to soil moisture accumulation and local surface alterations rather than to buried anthropogenic structures. Another anomaly, located to the east of the Basilica, appears to correspond to a former tree root system. Immediately north of this anomaly, a linear feature with a NE–SW orientation coincides with a previously excavated and subsequently backfilled trench. Although both sources are unrelated to archaeological remains, they are responsible for locally disturbed soil conditions and, consequently, for enhanced conductivity responses.
The in-phase component (Figure 4A–C and Figure 6B), representing the magnetic susceptibility response, shows increased values over the Basilica area, particularly at shallow depths, confirming the presence of building materials with higher magnetic response (e.g., fired bricks, reused Roman debris). With increasing depth, the pattern reverses, showing decreased in-phase amplitudes over the Basilica and elevated values near the site boundaries. This inversion is attributed to edge effects and electromagnetic interference induced by the surrounding metallic fences and the nearby railway line—factors that progressively dominate with depth within the limited survey domain. An additional rectangular anomaly of interest emerges just beneath the southern edge of the Basilica. According to the archaeologists, its shape and dimensions correspond well to a portion of the ancient basilica wall that was later demolished. A future goal is the numerical integration and fusion of the retrieved magnetic and EMI results in order to develop a quantitative analysis from the archaeological prospections [36].
5. Conclusions
The integration of the magnetic and EMI datasets allowed a comprehensive reconstruction of the Basilica’s plan and the identification of previously unrecorded features along its northern boundary. The strong correspondence between magnetic anomalies and lower values of conductivity validates both the archaeological interpretation and the reliability of the geophysical measurements. Moreover, the multi-sensor approach has proven particularly effective in differentiating anthropogenic structures from natural or modern disturbances, despite the presence of numerous obstacles (excavation trenches, vegetation, metallic fences) that locally interrupted data acquisition and produced edge-related artifacts.
These findings demonstrate that the combined use of magnetic and electromagnetic surveys can substantially improve the accuracy and confidence of archaeological interpretations, even in constrained field conditions. In particular, the successful performance of the MagEx vertical gradiometer underscores the potential of compact atomic magnetometers as next-generation tools for high-resolution, non-invasive archaeological prospection. The results obtained at Pianabella not only refine the understanding of this late-antique Christian Basilica and its surrounding funerary landscape but also provide a methodological benchmark for future applications of integrated geophysical techniques in archaeologically sensitive environments.
Author Contributions
Conceptualization, F.A., A.B. and R.C.; methodology, F.A., A.B., R.C. and N.F.C.; validation, D.D.; investigation, F.A., A.B., R.C. and N.F.C.; data curation, F.F., N.F.C., F.A. and R.C.; writing—original draft preparation, F.A. and A.B.; writing—review and editing, F.A., A.B., N.F.C., F.F., D.D., P.T. and R.C.; visualization, N.F.C., D.D. and R.C.; supervision, R.C., P.T. and D.D. All authors have read and agreed to the published version of the manuscript.
Funding
This research received no external funding.
Data Availability Statement
Research data are available by contacting the corresponding authors.
Acknowledgments
The authors N.F.C. and F.F. would like to acknowledge Becky Bodger for the support in improving the data processing workflow in Seequent’s Oasis Montaj software. All the authors would also like to acknowledge the project EU—Next Generation EU Mission 4, Component 2—CUP B53C22002150006—Project IR0000032—ITINERIS—Italian Integrated Environmental Research Infrastructures System, which supported the data collection and publishing activities.
Conflicts of Interest
The authors declare no conflicts of interest.
References
- Heinzelmann, M. Beobachtungen zur suburbanen Topographie Ostias. Ein orthogonales Straßensystem im Bereich der Pianabella. Römische Mitteiungen 1998, 105, 175–225. [Google Scholar]
- Carbonara, A.; Pellegrino, A.; Zaccagnini, R. Necropoli di Pianabella, vecchi e nuovi ritrovamenti. In Culto dei Morti e Costumi Funerari Romani. Roma, Italia Settentrionale e Province Nord-Occidentali Dalla Tarda Repubblica All’età Imperiale (Palilia: 8); Dr. Ludwig Reichert: Wiesbaden, Germany, 2001; pp. 139–148. [Google Scholar]
- Pannuzi, S.; Carbonara, A. Il suburbio sud-orientale di Ostia antica: La trasformazione del territorio in età imperiale e tardo-antica secondo le più recenti ricerche archeologiche. In Necropoli Ostiensi, lo Scavo Archeologico per la Costruzione Della Linea Elettrica a 150 kV in Cavi Interrati Lido Vecchio-Casal Palocco; Pannuzi, S., Ed.; Soprintendenza per i Beni Archeologici di Ostia: Roma, Italy, 2007; pp. 4–16. [Google Scholar]
- Nuzzo, D. Note sulla basilica cristiana di Pianabella a Ostia. Römische Abt. 2016, 122, 367–386. [Google Scholar]
- Daffara, D.; Rossi, P.F. Le sepolture altomedievali della basilica di Pianabella: Sintesi e casi studio. Mélanges L’école Française Rome-Antiq. 2024, 136-1, 193–210. [Google Scholar] [CrossRef] [Scilit]
- Wynn, J.C. A review of geophysical methods used in archaeology. Geoarchaeology 1986, 1, 245–257. [Google Scholar] [CrossRef] [Scilit]
- Maio, R.D.; Fedi, M.; Manna, M.L.; Grimaldi, M.; Pappalardo, U. The contribution of geophysical prospecting in the reconstruction of the buried ancient environments of the house of Marcus Fabius Rufus (Pompeii, Italy). Archaeol. Prospect. 2010, 17, 259–269. [Google Scholar] [CrossRef] [Scilit]
- Catapano, I.; Gennarelli, G.; Ludeno, G.; Soldovieri, F. Applying Ground-Penetrating Radar and Microwave Tomography Data Processing in Cultural Heritage: State of the Art and Future Trends. IEEE Signal Process. Mag. 2019, 36, 53–61. [Google Scholar] [CrossRef] [Scilit]
- Capozzoli, L.; Catapano, I.; De Martino, G.; Gennarelli, G.; Ludeno, G.; Rizzo, E.; Soldovieri, F.; Uliano Scelza, F.; Zuchtriegel, G. The Discovery of a Buried Temple in Paestum: The Advantages of the Geophysical Multi-Sensor Application. Remote Sens. 2020, 12, 2711. [Google Scholar] [CrossRef] [Scilit]
- Martorana, R.; Capizzi, P.; Pisciotta, A.; Scudero, S.; Bottari, C. An Overview of Geophysical Techniques and Their Potential Suitability for Archaeological Studies. Heritage 2023, 6, 2886–2927. [Google Scholar] [CrossRef] [Scilit]
- Milano, M.; Bianco, L.; La Manna, M.; Fedi, M.; Russo, V. Microgravimetric and GPR surveying for the detection of building foundations: The case of the “Basilica dello Spirito Santo” in Naples (Italy). J. Appl. Geophys. 2026, 244, 106010. [Google Scholar] [CrossRef] [Scilit]
- Piro, S.; Sambuelli, L.; Godio, A.; Taormina, R. Beyond image analysis in processing archaeomagnetic geophysical data: Case studies of chamber tombs with dromos. Near Surf. Geophys. 2007, 5, 405–414. [Google Scholar] [CrossRef] [Scilit]
- Bigman, D.P. The Use of Electromagnetic Induction in Locating Graves and Mapping Cemeteries: An Example from Native North America. Archaeol. Prospect. 2012, 19, 31–39. [Google Scholar] [CrossRef] [Scilit]
- Cella, F.; Fedi, M. High-Resolution Geophysical 3D Imaging for Archaeology by Magnetic and EM data: The Case of the Iron Age Settlement of Torre Galli, Southern Italy. Surv. Geophys. 2015, 36, 831–850. [Google Scholar] [CrossRef] [Scilit]
- Fedi, M.; Cella, F.; Florio, G.; Manna, M.L.; Paoletti, V. Geomagnetometry for Archaeology. In Sensing the Past; Masini, N., Soldovieri, F., Eds.; Geotechnologies and the Environment; Springer: Cham, Switzerland, 2017; Volume 16. [Google Scholar] [CrossRef] [Scilit]
- Florio, G.; Cella, F.; Speranza, L.; Castaldo, R.; Pierobon Benoit, R.; Palermo, R. Multiscale techniques for 3D imaging of magnetic data for archaeo-geophysical investigations in the Middle East: The case of Tell Barri (Syria). Archaeol. Prospect. 2019, 26, 379–395. [Google Scholar] [CrossRef] [Scilit]
- Cutaneo, C.; Vitale, A.; Fedi, M. Unsupervised boundary analysis of potential field data: A machine learning method. Geophysics 2023, 88, G57–G65. [Google Scholar] [CrossRef] [Scilit]
- Stele, A.; Kaub, L.; Linck, R.; Schikorra, M.; Fassbinder, J.W.E. Drone-based magnetometer prospection for archaeology. J. Archaeol. Sci. 2023, 158, 105818. [Google Scholar] [CrossRef] [Scilit]
- Hood, P.; McClure, D.J. Gradient measurements in ground magnetic prospecting. Geophysics 1965, 30, 403–410. [Google Scholar] [CrossRef] [Scilit]
- Accomando, F.; Barone, A.; Catalano, N.; Daffara, D.; Dupuy, B.; Florio, G.; Lee, M.D.; Pepe, S.; Tizzani, P.; Castaldo, R. Magnetic Survey Solutions for Archaeological Purpose. In Proceedings of the NSG 2025: 31st Meeting of Environmental and Engineering Geophysics, Naples, Italy, 7–11 September 2025; Volume 2025, pp. 1–5. [Google Scholar] [CrossRef] [Scilit]
- Blakely, J.R. Potential Theory in Gravity and Magnetic Applications; Revised edition; Cambridge University Press: Cambridge, UK, 1996; ISBN 0-521-57547-8. [Google Scholar]
- Hood, P. Gradient measurements in aeromagnetic surveying. Geophysics 1965, 30, 891–902. [Google Scholar] [CrossRef] [Scilit]
- Cella, F.; Paoletti, V.; Florio, G.; Fedi, M. Characterizing Elements of Urban Planning in Magna Graecia Using Geophysical Techniques: The Case of Tirena (Southern Italy). Archaeol. Prospect. 2015, 22, 207–219. [Google Scholar] [CrossRef] [Scilit]
- Ernenwein, E.G. Geophysical Survey Techniques. In Handbook of Archaeological Sciences; Pollard, A.M., Armitage, R.A., Makarewicz, C.A., Eds.; John Wiley & Sons: Hoboken, NJ, USA, 2023. [Google Scholar] [CrossRef] [Scilit]
- Witten, A. Handbook of Geophysics and Archaeology, 1st ed.; Routledge: Oxford, UK, 2006. [Google Scholar] [CrossRef] [Scilit]
- Benech, C.; Lombard, P.; Rejiba, F.; Tabbagh, A. Demonstrating the contribution of dielectric permittivity to the in-phase EMI response of soils: Example from an archaeological site in Bahrain. Near Surf. Geophys. 2016, 14, 337–344. [Google Scholar] [CrossRef] [Scilit]
- Saey, T.; De Smedt, P.; Meerschman, E.; Islam, M.M.; Meeuws, F.; Van De Vijver, E.; Lehouck, A.; Van Meirvenne, M. Electrical Conductivity Depth Modelling with a Multireceiver EMI Sensor for Prospecting Archaeological Features. Archaeol. Prospect. 2012, 19, 21–30. [Google Scholar] [CrossRef] [Scilit]
- De Smedt, P.; Van Meirvenne, M.; Saey, T.; Baldwin, E.; Gaffney, C.; Gaffney, V. Unveiling the prehistoric landscape at Stonehenge through multi-receiver EMI. J. Archaeol. Sci. 2014, 50, 16–23. [Google Scholar] [CrossRef] [Scilit]
- Accomando, F.; Fedele, A.; De Natale, G.; Somma, R.; Troise, C.; Florio, G. Vertical gradient measurements using MFAM in a UAV-borne magnetic survey. In Proceedings of the 84th EAGE Annual Conference & Exhibition, Vienna, Austria, 5–8 June 2023; European Association of Geoscientists & Engineers: Bunnik, The Netherlands, 2023; Volume 2023, pp. 1–5. [Google Scholar] [CrossRef] [Scilit]
- Accomando, F.; Florio, G. Drone-borne magnetic gradiometry in archaeological applications. Sensors 2024, 24, 4270. [Google Scholar] [CrossRef] [Scilit]
- Accomando, F.; Barone, A.; Mercogliano, F.; Milano, M.; Vitale, A.; Castaldo, R.; Tizzani, P. Advances in Magnetic UAV Sensing: A Comparative Study of the MagNimbus and MagArrow Magnetometers. Sensors 2025, 25, 6076. [Google Scholar] [CrossRef] [Scilit]
- Mercogliano, F.; Accomando, F.; Vitale, A.; Castaldo, R.; Barone, A.; Tizzani, P. ITINERIS Geophysical Technologies @CNR-IREA: Drone-Based Tests at Altopiano di Verteglia, Avellino (Southern Italy). In Computational Science and Its Applications–ICCSA 2025 Workshops; Gervasi, O., Murgante, B., Garau, C., Karaca, Y., Lago, M.N.F., Scorza, F., Braga, A.C., Eds.; Lecture Notes in Computer Science; Springer: Cham, Switzerland, 2025; Volume 15899. [Google Scholar]
- Daffara, D.; Coccia, S.; Galadini, F. 2025, Did Ostia tremble in the Middle Ages? Review of a hypothesis on the collapse of the Christian Basilica at Pianabella. In Hazard and Disaster Risk in Ostia (BAR S3210); Pecchioli, L., D’Alessio, A., Meneghini, R., Holmes, D.A., Eds.; BAR Publishing: Oxford, UK, 2025; pp. 201–211. [Google Scholar]
- Coccia, S.; Paroli, L. Ostia antica, loc. Pianabella, la basilica cristiana. Boll. Archeol. 1990, 2, 214–217. [Google Scholar]
- Fedi, M.; Quarta, T. Wavelet analysis for the regional-residual and local separation of potential field anomalies. Geophys. Prospect. 1998, 46, 507–525. [Google Scholar] [CrossRef] [Scilit]
- Eppelbaum, L.V. System of Potential Geophysical Field Application in Archaeological Prospection. In Handbook on Cultural Heritage Analysis; D’Amico, S., Venuti, V., Eds.; Springer: Berlin/Heidelberg, Germany, 2022; pp. 771–809. [Google Scholar]

Disclaimer/Publisher’s Note: The statements, opinions and data contained in all publications are solely those of the individual author(s) and contributor(s) and not of MDPI and/or the editor(s). MDPI and/or the editor(s) disclaim responsibility for any injury to people or property resulting from any ideas, methods, instructions or products referred to in the content. |
© 2026 by the authors. Licensee MDPI, Basel, Switzerland. This article is an open access article distributed under the terms and conditions of the Creative Commons Attribution (CC BY) license.