Article

Experimental Assessment of Post-Fire Residual Material Properties of Marlstone

1
Department of Architectural Engineering, Faculty of Civil Engineering, Czech Technical University in Prague, Thákurova 2077/7, 166 29 Prague, Czech Republic
2
Department of Geotechnics, Faculty of Civil Engineering, Czech Technical University in Prague, Thákurova 2077/7, 166 29 Prague, Czech Republic
3
Department of Geomatics, Faculty of Civil Engineering, Czech Technical University in Prague, Thákurova 2077/7, 166 29 Prague, Czech Republic
*
Author to whom correspondence should be addressed.
Heritage 2026, 9(2), 76; https://doi.org/10.3390/heritage9020076
Submission received: 24 December 2025 / Revised: 9 February 2026 / Accepted: 14 February 2026 / Published: 16 February 2026

Abstract

Marlstone, widely used in Romanesque and Gothic architecture across Central Europe, is a common component of heritage structures whose post-fire behavior is critical for preservation. This study examines fire-induced changes in marlstone to support post-fire assessment and conservation. Cylindrical specimens (35 mm diameter, 70 mm height) were heated to 620 °C, 870 °C, and 1100 °C, then subjected to uniaxial compression tests to determine residual strength, strain, and Young’s modulus compared with unheated controls. Both natural and quenched cooling regimes were evaluated. Complementary XRF and petrographic analyses identified mineralogical and microstructural changes, while CIELab color measurements quantified temperature-induced visual alterations. Results show temperature-dependent changes in mechanical performance, accompanied by transformations in silica and calcite phases, along with measurable color changes. Variability in response reflects the inherent heterogeneity and anisotropy of marlstone. These findings provide essential insight into the thermal vulnerability of historic marlstone masonry and offer practical guidance for conservation, restoration, and post-fire evaluation of heritage stone structures.

1. Introduction

Ensuring fire safety in historic buildings represents a significantly more complex challenge than in modern structures, where protective measures are incorporated already at the design stage. Heritage architecture frequently relies on traditional materials, particularly natural stone, whose performance under fire exposure remains difficult to predict. This uncertainty has driven extensive international research focused on understanding the thermal behavior of natural stones and its implications for the structural resilience of historical constructions.
Studies demonstrate that elevated temperatures can alter the physical, mechanical, and mineralogical properties of natural stones. Variations in density, porosity, strength, and elasticity are often accompanied by microstructural processes such as crack initiation, propagation, and phase transformations. These effects may be further influenced by pre-existing conditions, including heterogeneity, anisotropy, or mechanical pre-loading. The magnitude and character of such changes are strongly dependent on the stone type, underlining the importance of material-specific evaluation.

2. State-of-the-Art Review

Numerous studies have demonstrated the influence of fire on the mechanical and physical properties of rocks. Rong et al. [1] investigated fine-grained marble from Pignan City, Fujian Province, China. Two homogeneous blocks (1000 × 300 × 150 mm) were tested, and cylindrical specimens of four different diameters (25, 50, 75, and 100 mm) were prepared. X-ray diffraction showed the material consisted of 96% dolomite, 3.6% calcite, and 0.4% albite, with grain sizes of 0.5–1.0 mm. The specimens were heated to 200, 400, and 600 °C (10 °C/min, 4 h holding). Results indicated a sharp decrease in P-wave velocity (to ~20% of reference at 600 °C) and increasing microcrack density (from 0.6 mm−1 at room temperature to 3.8 mm−1 at 600 °C). Mechanical testing revealed reductions in UCS and Young’s modulus with temperature, while peak strain increased. Larger-diameter specimens showed lower strength.
Zhang et al. [2] studied Laizhou dolomite marble. Cylindrical specimens (50 × 100 mm) were heated to 200–800 °C (2 °C/min, 2 h holding). The density of specimens remained stable below 600 °C but decreased at higher temperatures, accompanied by significant mass loss (0.5% at 600–12.6% at 800 °C). P-wave velocity dropped to 18.9% of the reference value at 800 °C. Color darkening, thermal cracking (from 400 °C), and surface spalling (at 800 °C) were observed. UCS decreased by ~24% up to 400 °C, slightly recovered at 600 °C, and then dropped by 59% of the reference value at 800 °C. Strain markedly increased between 400 °C and 800 °C, while both Young’s and deformation moduli declined steadily with temperature.
Li et al. [3] examined the effect of temperature on phyllite from Ankang City, Shaanxi Province. Cylindrical specimens (25 × 50 mm) were heated to 25–900 °C, held for 4 h and furnace-cooled. P-wave velocity decreased gradually up to 500 °C, sharply at 600 °C, and remained nearly unchanged up to 900 °C, reaching 85∼89% loss. Mass loss followed an opposite trend, gradual to 400 °C, rapid to 800 °C, and stable thereafter. Compressive strength remained stable up to 500 °C, dropped sharply at 600 °C, and then increased again, reaching 1.71 times the reference value at 900 °C. Stress–strain behavior indicated brittle failure below 500 °C, more ductile compaction at 600 °C, and a return to brittle failure at higher temperatures.
Wu et al. [4] investigated sandstone from Xinjiang, China. Cylindrical specimens (50 × 100 mm) were heated to 200–1200 °C, held for 2 h and air-cooled. The color changed from grey–white to yellow–brown at 400 °C, red–brown between 600 and 1000 °C, and black–brown at 1200 °C. P-wave velocity and mass decreased with temperature, with the largest reductions observed between 400 and 600 °C. UCS increased up to 600 °C and then decreased for higher temperatures, up to 1200 °C.
Wang et al. [5] examined limestone from coral islands in the South China Sea. Cylindrical specimens (50 × 100 mm) were heated to 12 temperatures between 100 and 1200 °C at 10 °C/min, held for 3 h, and air-cooled. Physical properties such as volume, density, P-wave velocity, and thermal conductivity were measured before and after heating. The color changed from yellow to grey–blue at 400 °C, and a white powder appeared on the surface at 600 °C. Samples were completely white at higher temperatures, accompanied by surface cracks. Mass and volume remained nearly unchanged up to 400 °C, then mass sharply decreased, reaching a 50% loss at 1100 °C. Volume increased significantly between 300 and 700 °C, then stabilized. P-wave velocity dropped sharply between 200 and 400 °C, remaining roughly 40% of the reference value at 1000 °C. Porosity increased with temperature, remaining below 3% up to 400 °C and reaching 34% at 1200 °C.
Beyond mechanical and physical properties, high temperatures also impact mineralogy and microstructure. Tripathi et al. [6] studied Barkar sandstone, examining microscopic and mineralogical changes using cross-polarized light microscopy and SEM. Cross-polarized photomicrographs showed that heating below 400 °C had minimal impact on grains, but microcracks began forming at 400 °C. The α-to-β quartz phase transformation at 573 °C caused significant crack development at 600–800 °C. SEM images revealed quartz grain fragmentation at higher temperatures, indicating structural degradation, while the matrix showed increasing damage, compromising rock integrity. Mass loss increased with temperature: up to 400 °C due to evaporation of free and chemically bound water, sharply between 400 and 600 °C, and more moderately from 600 to 800 °C. Mechanical testing showed a slight increase in static strength at 200–400 °C, followed by a sharp decline at 600 °C and a smaller reduction at 800 °C. Dynamic strength followed an increasing trend with higher strain rates at all temperatures, increasing at 200–400 °C but decreasing at 600–800 °C.
Mohamed Elgharib Gomah et al. [7] investigated Egyptian granodiorite. Cylindrical specimens (55.5 × 120 mm) were heated at 5 °C/min to 200–800 °C, held for 2 h, and furnace-cooled. SEM analysis showed almost no microcracks in reference samples; at 400 °C intergranular and some transgranular cracks appeared, expanding further at 600 °C. At 800 °C, inter- and intragranular cracks grew extensively, leading to granular disintegration. Mass remained nearly unchanged up to 400 °C, then decreased sharply. Porosity increased from 0.54% at room temperature to 0.83% at 200 °C and 1.36% at 400 °C, further rising with temperature, indicating microcrack formation. P-wave velocity decreased by 39% at 400 °C and 85% at 600 °C, reflecting crack development. Compressive strength slightly increased at 200–400 °C to 73 MPa, then dropped sharply to 28 MPa at 600 °C and 2.8 MPa at 800 °C. Young’s modulus decreased by ~11% at 200 °C, 37% at 400 °C, and 81% at 600 °C.
Jodry et al. [8] studied limestone from Guzdak, Azerbaijan. The material is shelly and oolitic, with grains smaller than 1 mm bound by calcite cement. Cylindrical specimens (25 × 60 mm) were heated to 100–800 °C. Optical microscopy revealed the formation of intragranular cracks at 400 °C, increasing at 600 °C. At 800 °C, spontaneous disintegration occurred due to decomposition of CaCO3 into CaO and CO2; subsequent hydration of CaO to portlandite caused volumetric expansion and failure of the specimens. Connected porosity increased with temperature, while P-wave velocity decreased, with major changes above 400 °C. Thermal conductivity, diffusivity, and specific heat capacity also declined notably above 400 °C. UCS and Young’s modulus decreased with increasing temperature.
Some studies considered the effect of pre-loading and cyclic stress on temperature-induced damage. Shen et al. [9] investigated red sandstone from Qiannan, Guizhou Province, China. Cylindrical specimens (50 × 100 mm) underwent cyclic pre-loading in four groups: reference (no loading), 1–20–1 MPa, 20–40–20 MPa, and 40–60–40 MPa, each for 20 cycles. Specimens were then heated to 200–800 °C and air-cooled. P-wave velocity decreased with increasing temperature. The 1–20–1 group had P-wave velocity loss similar to reference samples; the 20–40–20 group showed slightly larger reductions from 200 to 600 °C, and the 40–60–40 group exhibited the largest decrease between 400 and 600 °C. Surface cracks and color changes were also observed. Stress–strain curves indicated that compressive strength was highest for the reference samples and decreased with increasing pre-loading. The lowest strength occurred in the 40–60–40 group. The decrease in strength was consistent across all loading levels. Deformation increased with temperature for all specimens.
Cooling methods significantly affect the mechanical and physical behavior of rocks after heating. Verma et al. [10] studied sandstone from Jodhpur, India, heated to 25–1000 °C and cooled in a furnace, air, or water. Two cylindrical specimen sizes were used: 43 × 86 mm for compressive tests and 54 × 108 mm for ultrasonic wave velocity measurements. Color changes were observed after heating, from grey–pink at 25 °C to dark pink at 500 °C and to white–pink at 1000 °C due to the migration of CaCO3 to the surface. SEM images showed a clear correlation between increasing temperature and the formation and propagation of cracks, which were particularly severe in water-cooled specimens. Porosity increased with temperature, with the highest increase in water-cooled samples. Ultrasonic P- and S-wave velocities decreased with temperature, with the largest reduction in water-cooled specimens. UCS showed a decreasing trend for furnace-cooled samples, with a mild decrease up to 500 °C and a faster decline at higher temperatures. Air-cooled samples followed a similar trend, with a slightly higher reduction at 500 °C. The most significant strength loss occurred in water-cooled samples.
Martínez-Ibáňez et al. [11] investigated limestone specimens (63 mm diameter, slenderness ratio 2.5) heated to 200–600 °C and cooled either slowly in a furnace or rapidly in water. Open porosity decreased after heating to 200 °C but increased again when heated to 400 °C; after heating to 500 °C, water-cooled samples showed a threefold increase compared to reference values. UCS decreased with temperature, reaching ~20% of the original at 600 °C. Stress–strain curves of air-cooled samples showed little change up to 300 °C, followed by increased ductility at 400–500 °C. Water-cooled specimens exhibited a more progressive rise in ductility. The elastic modulus decreased to ~25% of the original in air-cooled samples and to ~11% in water-cooled samples at 600 °C.
Srinivasan et al. [12] studied granite from Jalore, India, comparing slow furnace cooling and fast water cooling after heating to 200–600 °C. Heating significantly affected appearance, surface microcracking, and color. Surface thermal cracking became noticeable in water-cooled samples from 300 °C and in slowly cooled samples from 400 °C. P-wave velocity decreased with temperature for both cooling methods (84% slow-cooling, 82% fast-cooling at 600 °C). UCS decreased with temperature. After heating to 600 °C, slow-cooled specimens retained ~38% of reference strength, while fast-cooled specimens retained ~21%. Brazilian tensile strength decreased with temperature in fast-cooled samples, while slow-cooled samples showed a slight increase after heating to 300 °C compared to 200 °C. Young’s modulus decreased with increasing temperature, with a more pronounced reduction in water-cooled specimens, except at 400 °C. Fracture characteristics, including crack development and damage thresholds, followed similar trends in both cooling types.
Beyond studies focusing on temperature-induced changes in rock properties, petrographic and multi-analytical approaches have been widely applied in architectural stone research to investigate material provenance, quarrying sources, construction practices, and conservation-related issues. For example, in Oviedo (Spain), more than 100 building-stone samples were classified into lithotypes and linked to specific geological formations and quarry sources using petrographic analysis [13]. In Oderzo (Italy), a multi-analytical strategy combining optical microscopy, XRF, and XRD was employed to determine the provenance of Roman architectural stones [14]. Similarly, dolostone samples from a 13th-century church in Segovia (Spain) were characterized by POM, XRD, and SEM-EDX to confirm historical quarry sources [15]. Incorporating such studies provides a broader heritage-science context for the present research, situating the investigation of thermally induced mineralogical changes within the established field of architectural stone characterization.
Although recent studies have examined the behavior of natural stone at elevated temperatures, knowledge in this area is still far less developed than for engineered materials such as concrete. Existing research primarily addresses fundamental mechanical and physical properties, including uniaxial compressive strength, tensile strength, porosity, and density. The extent to which these properties change considerably varies between stone types, reflecting differences in mineralogy and geological provenance. Consequently, stones from different regions must be investigated individually to enable reliable evaluation of their performance after fire exposure. Furthermore, there is currently no dedicated international or national standard or regulation that specifies how to assess post-fire residual material properties of natural stone (such as mechanical strength or mineralogical transformation) in a standardized way.
Table 1 summarizes the reviewed literature, materials and temperatures studied, methods and tests used and the main outcomes.

3. Materials and Methods

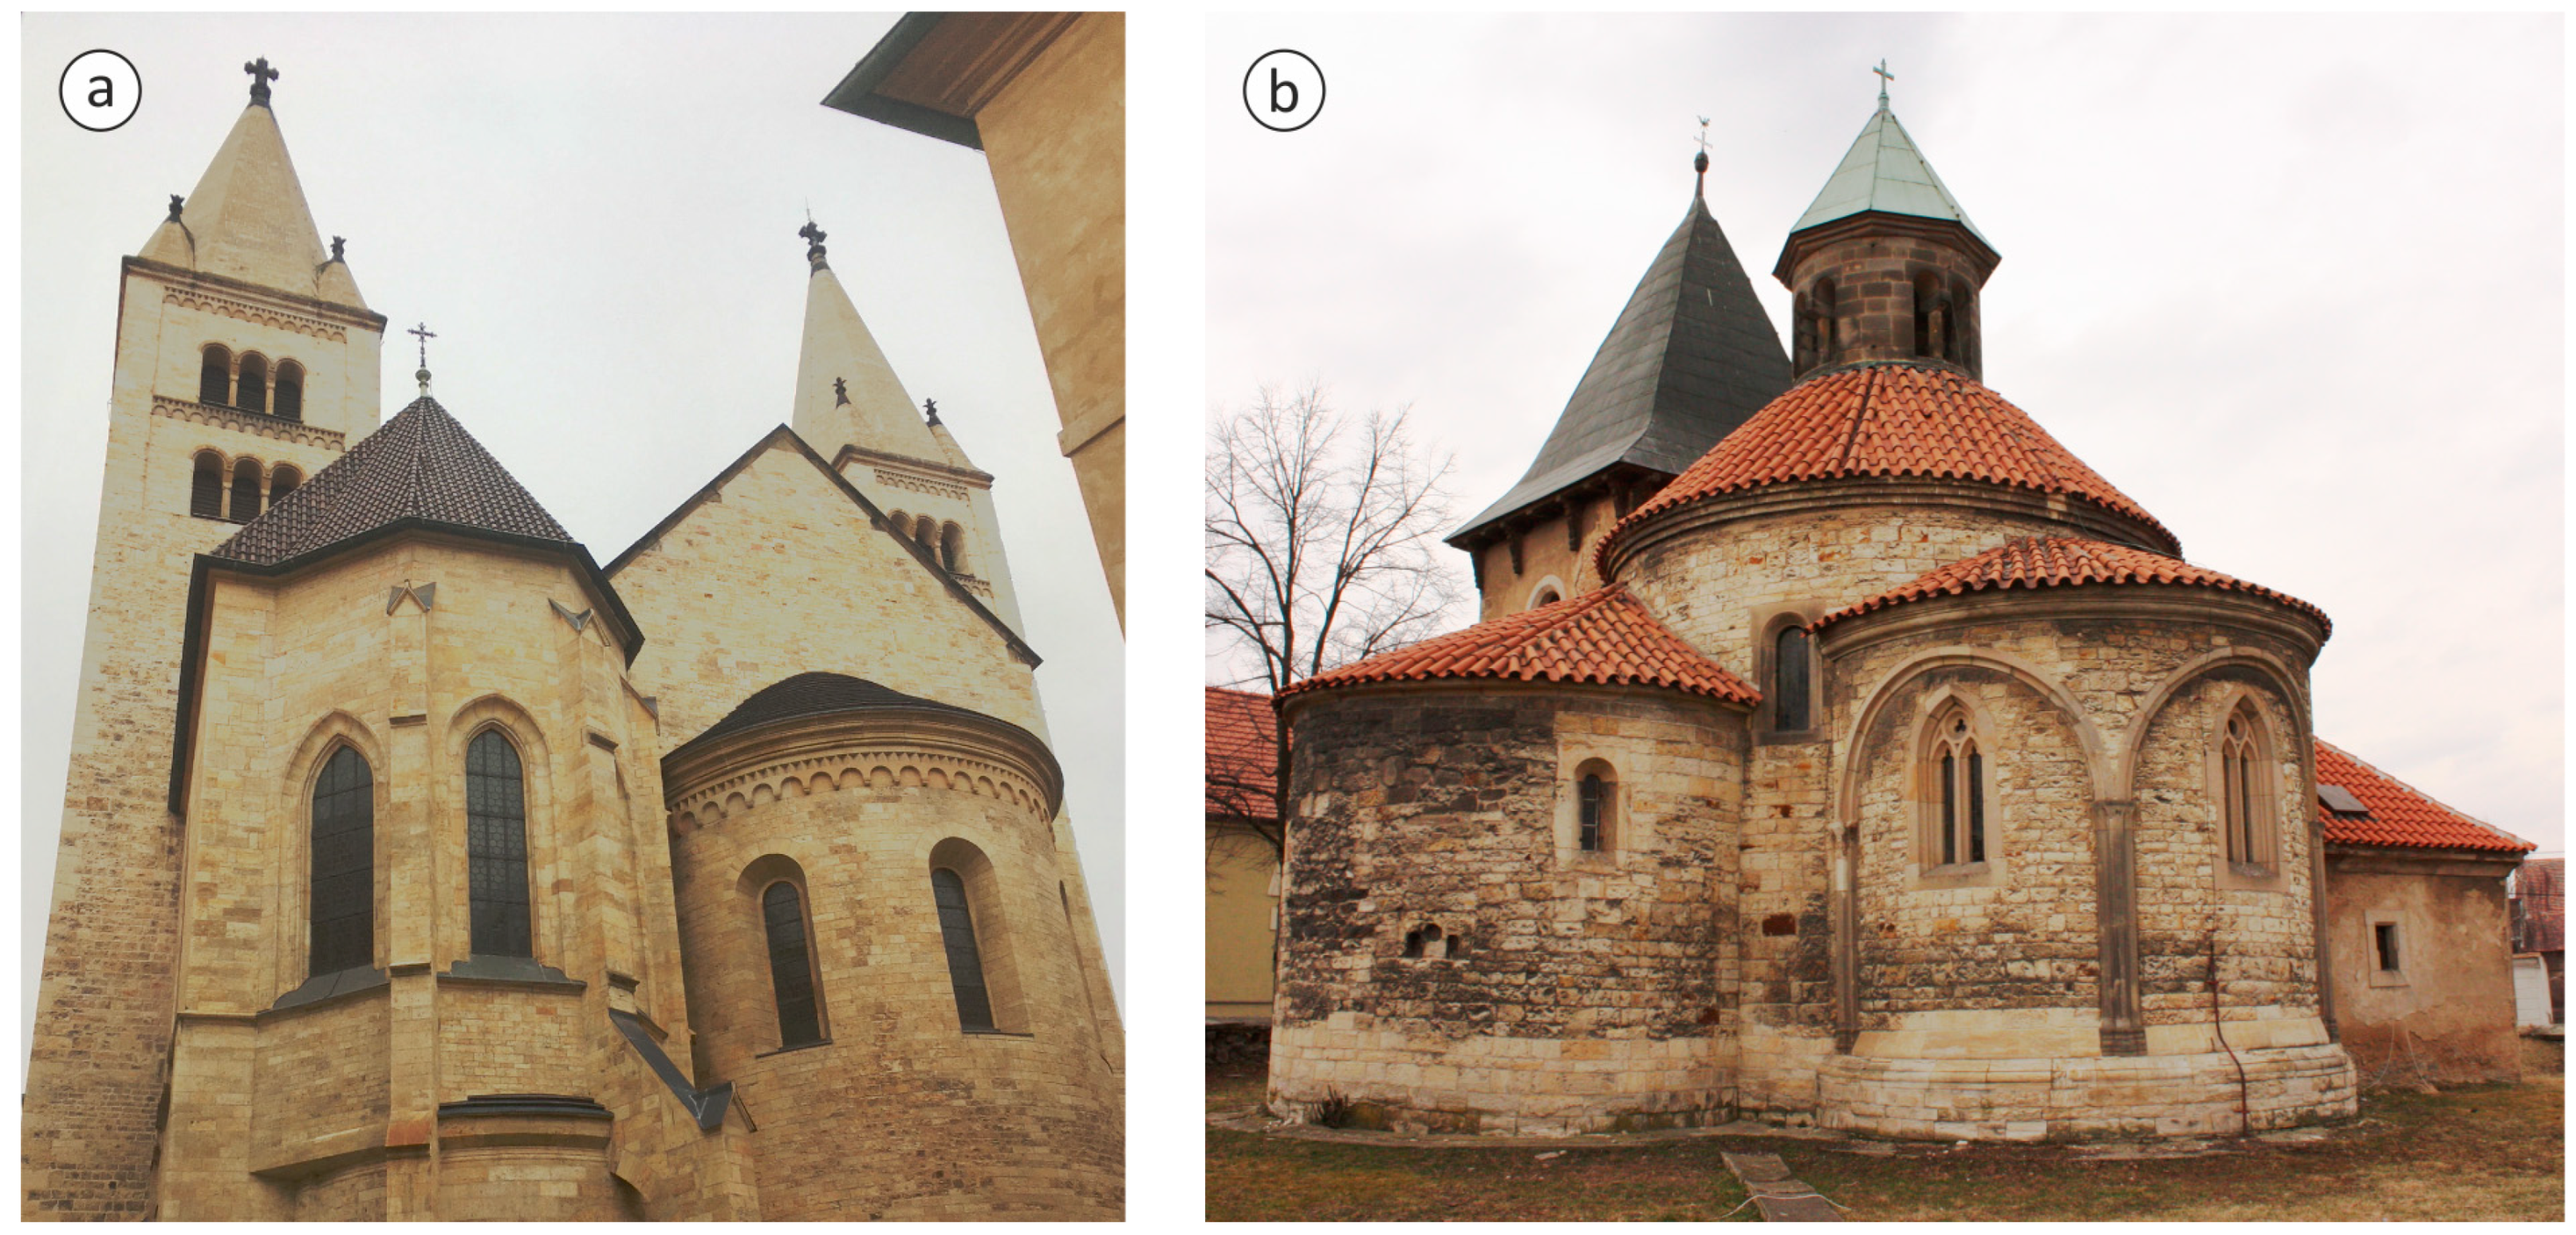
Marlstone is a clastic sedimentary rock of Cretaceous age and has been one of the most important building and sculptural stones in the Czech lands since the 9th century, particularly in Bohemia, Moravia, and Silesia. Owing to its local abundance and ease of working with simple tools, marlstone was widely used in the Middle Ages for masonry elements, and it formed the primary construction material for many Romanesque and early Gothic ecclesiastical and burgher buildings (Figure 1). Its use began to decline at the end of the 14th and the beginning of the 15th centuries, when it was gradually replaced by sandstone. Historically significant deposits include the Prague and Džbán marlstones, as well as quarries at Přední Kopanina near Prague, Přibylov near Skuteč, and the Třeboc–Džbán area, each yielding stones with distinct visual and mechanical characteristics.
Petrographically, marlstones range from marls to spongillites, typically exhibiting aleuritic to psammitic textures. They are composed of dusty grains of detrital quartz, feldspar, and detrital mica and a clay matrix with carbonate residues and recrystallized spongia spicules and destroyed microfossils. Silica occurs in several forms, including opal, chalcedony, cristobalite, and microcrystalline quartz, often derived from recrystallized spicules of siliceous marine sponges. Minor constituents such as glauconite and limonite are common, the latter imparting characteristic yellow to golden-brown coloration. Marlstone formed through the deposition and subsequent lithification of very fine clayey, calcareous, and sandy sediments on the sea floor approximately 93–89 million years ago. Its color varies from white and grey to yellow, ochre, orange, and brown, depending on mineralogical composition and diagenetic processes [16,17].
The physical and mechanical properties of marlstone are closely linked to its pore structure, mineral composition, and degree of decalcification. Porosity typically ranges from 15 to 40%, but may locally reach up to 60%, particularly in decalcified varieties where calcium carbonate has been leached. These stones are highly porous, lightweight, and absorbent, though some retain relatively good compactness and strength. Mechanical strength generally increases with higher SiO2 content and decreases with increasing porosity and CaCO3 content. Marlstones containing minimal micritic calcite tend to be weaker and less dense, whereas those enriched in diagenetic calcite exhibit higher strength. Easily soluble epigenetic calcite may migrate within the rock, further increasing porosity and water absorption. High equilibrium moisture content, largely due to clay minerals, makes marlstone sensitive to drying by elevated temperatures or unsuitable solvents, which can induce mechanical damage [16,17].
Marlstone is characterized by low capillary absorption, pronounced heterogeneity, and significant anisotropy, with properties strongly dependent on orientation relative to sedimentary bedding planes. Its durability under normal atmospheric conditions is limited. Polluted air and precipitation enriched in SO2, CO2, Cl, and NOx accelerate surface degradation, promote salt crystallization, and lead to internal microcracking [18]. In aggressive urban environments, the service life of marlstone masonry—especially near-surface layers—may be less than 50 years, with flaking and spalling of outer zones commonly observed. Mineralogical variability, stratification, low thermal conductivity, and volumetric heterogeneity contribute to temperature gradients between the surface and interior, fostering cracking and delamination. Chemical corrosion is driven primarily by sulfur and nitrogen oxides, while fire exposure further compromises integrity through rapid heating and cooling, resulting in randomly distributed contraction cracks [16,17].
Among the most notable varieties is the so-called “golden marlstone” from Přední Kopanina, historically prized for restoration work in the historic center of Prague due to its relatively high strength (around 49 MPa), low water absorption (below 10%), and moderate porosity (~20%). Other important types include the marlstones from Přibylov, distinguished by their greyish-yellow to bluish-grey coloration and comparatively better mechanical performance and weathering resistance, and the light, porous white marlstones with iron staining from the Džbán area. Together, these materials illustrate the wide variability of marlstone and explain both its historical importance and its inherent vulnerability as a building stone [16,17].

3.1. Experimental Samples

This study focuses on marlstone from the Džbán quarry near Prague, which is regarded as one of the most historically significant quarry sites. Džbán marlstone quarry at Hředle lies within the outcrop area of the Upper Cretaceous Turonian-stage Bílá hora Formation, which forms part of the broader Cretaceous region of the Bohemian Cretaceous Basin.
According to Valečka and Zelenka [19], Džbán marlstones are characterized by their variable composition and petrographic nature, even within a single locality and position. This variability results from different degrees of silicification associated with decalcification. The CaCO3 content of marlstones can be estimated at 30 to 35%, with silicification manifested only by local compression of the clayey-micritic groundmass or by the presence of quartz in bioclasts, mainly silicispongia spicules.
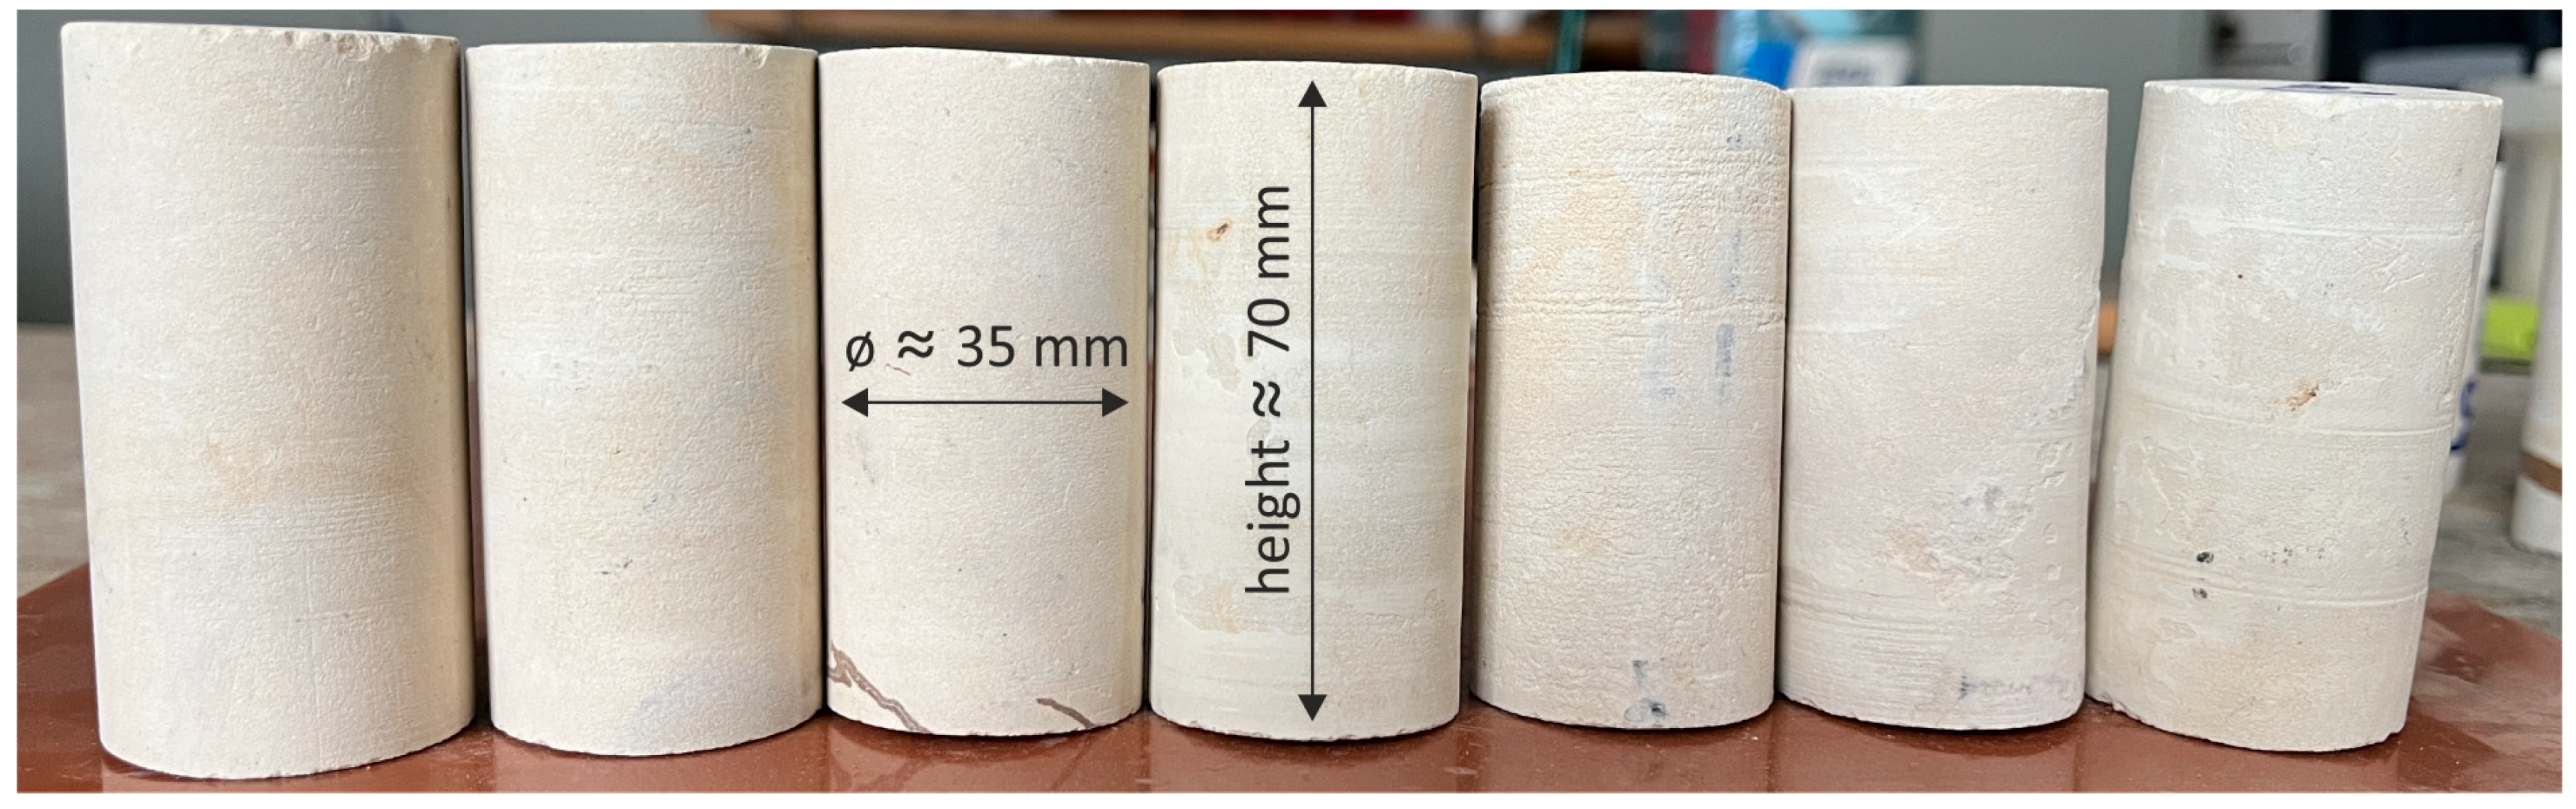
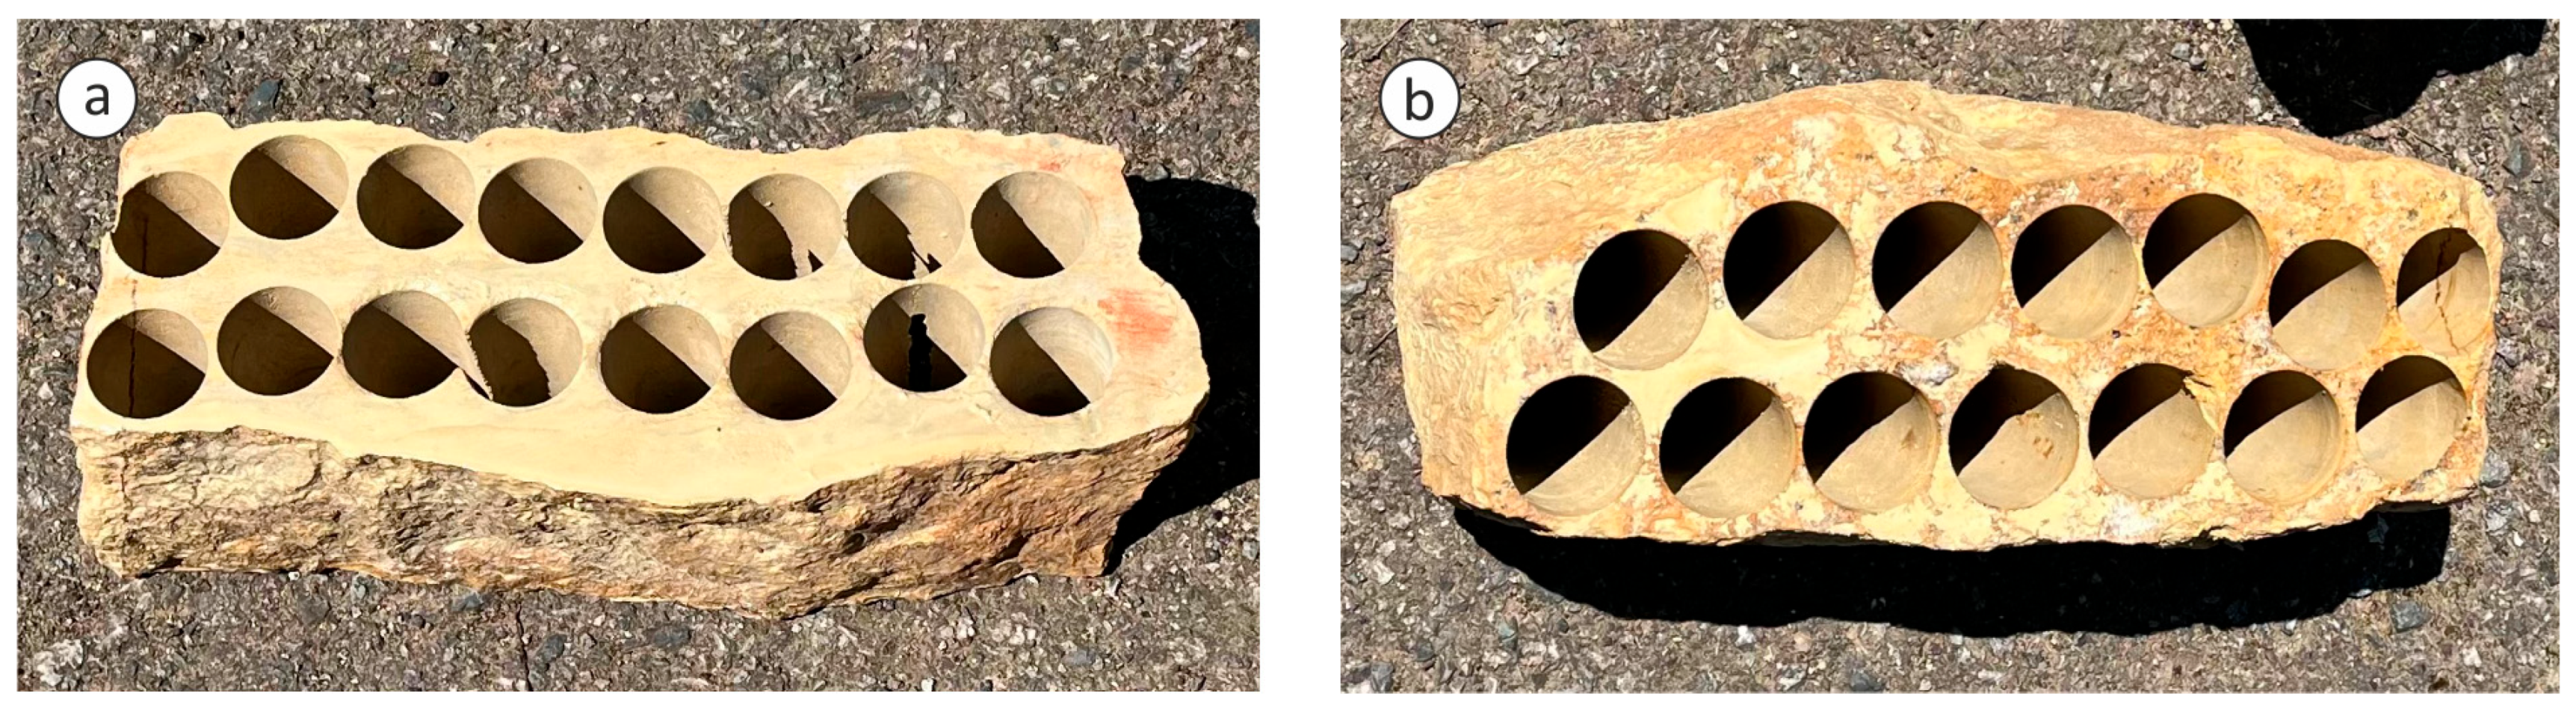
The influence of elevated temperatures on the mechanical and physical properties of marlstone was studied on cylindrical specimens with a diameter of approximately 35 mm and a height of about 70 mm (Table 2 and Table 3). Two sample sets, referred to as M1 (Marlstone Group 1) and M2 (Marlstone Group 2), were included in this study (Figure 2). To minimize the effect of material heterogeneity, each set originated from a single stone (Figure 3).

3.2. Experimental Procedures and Settings

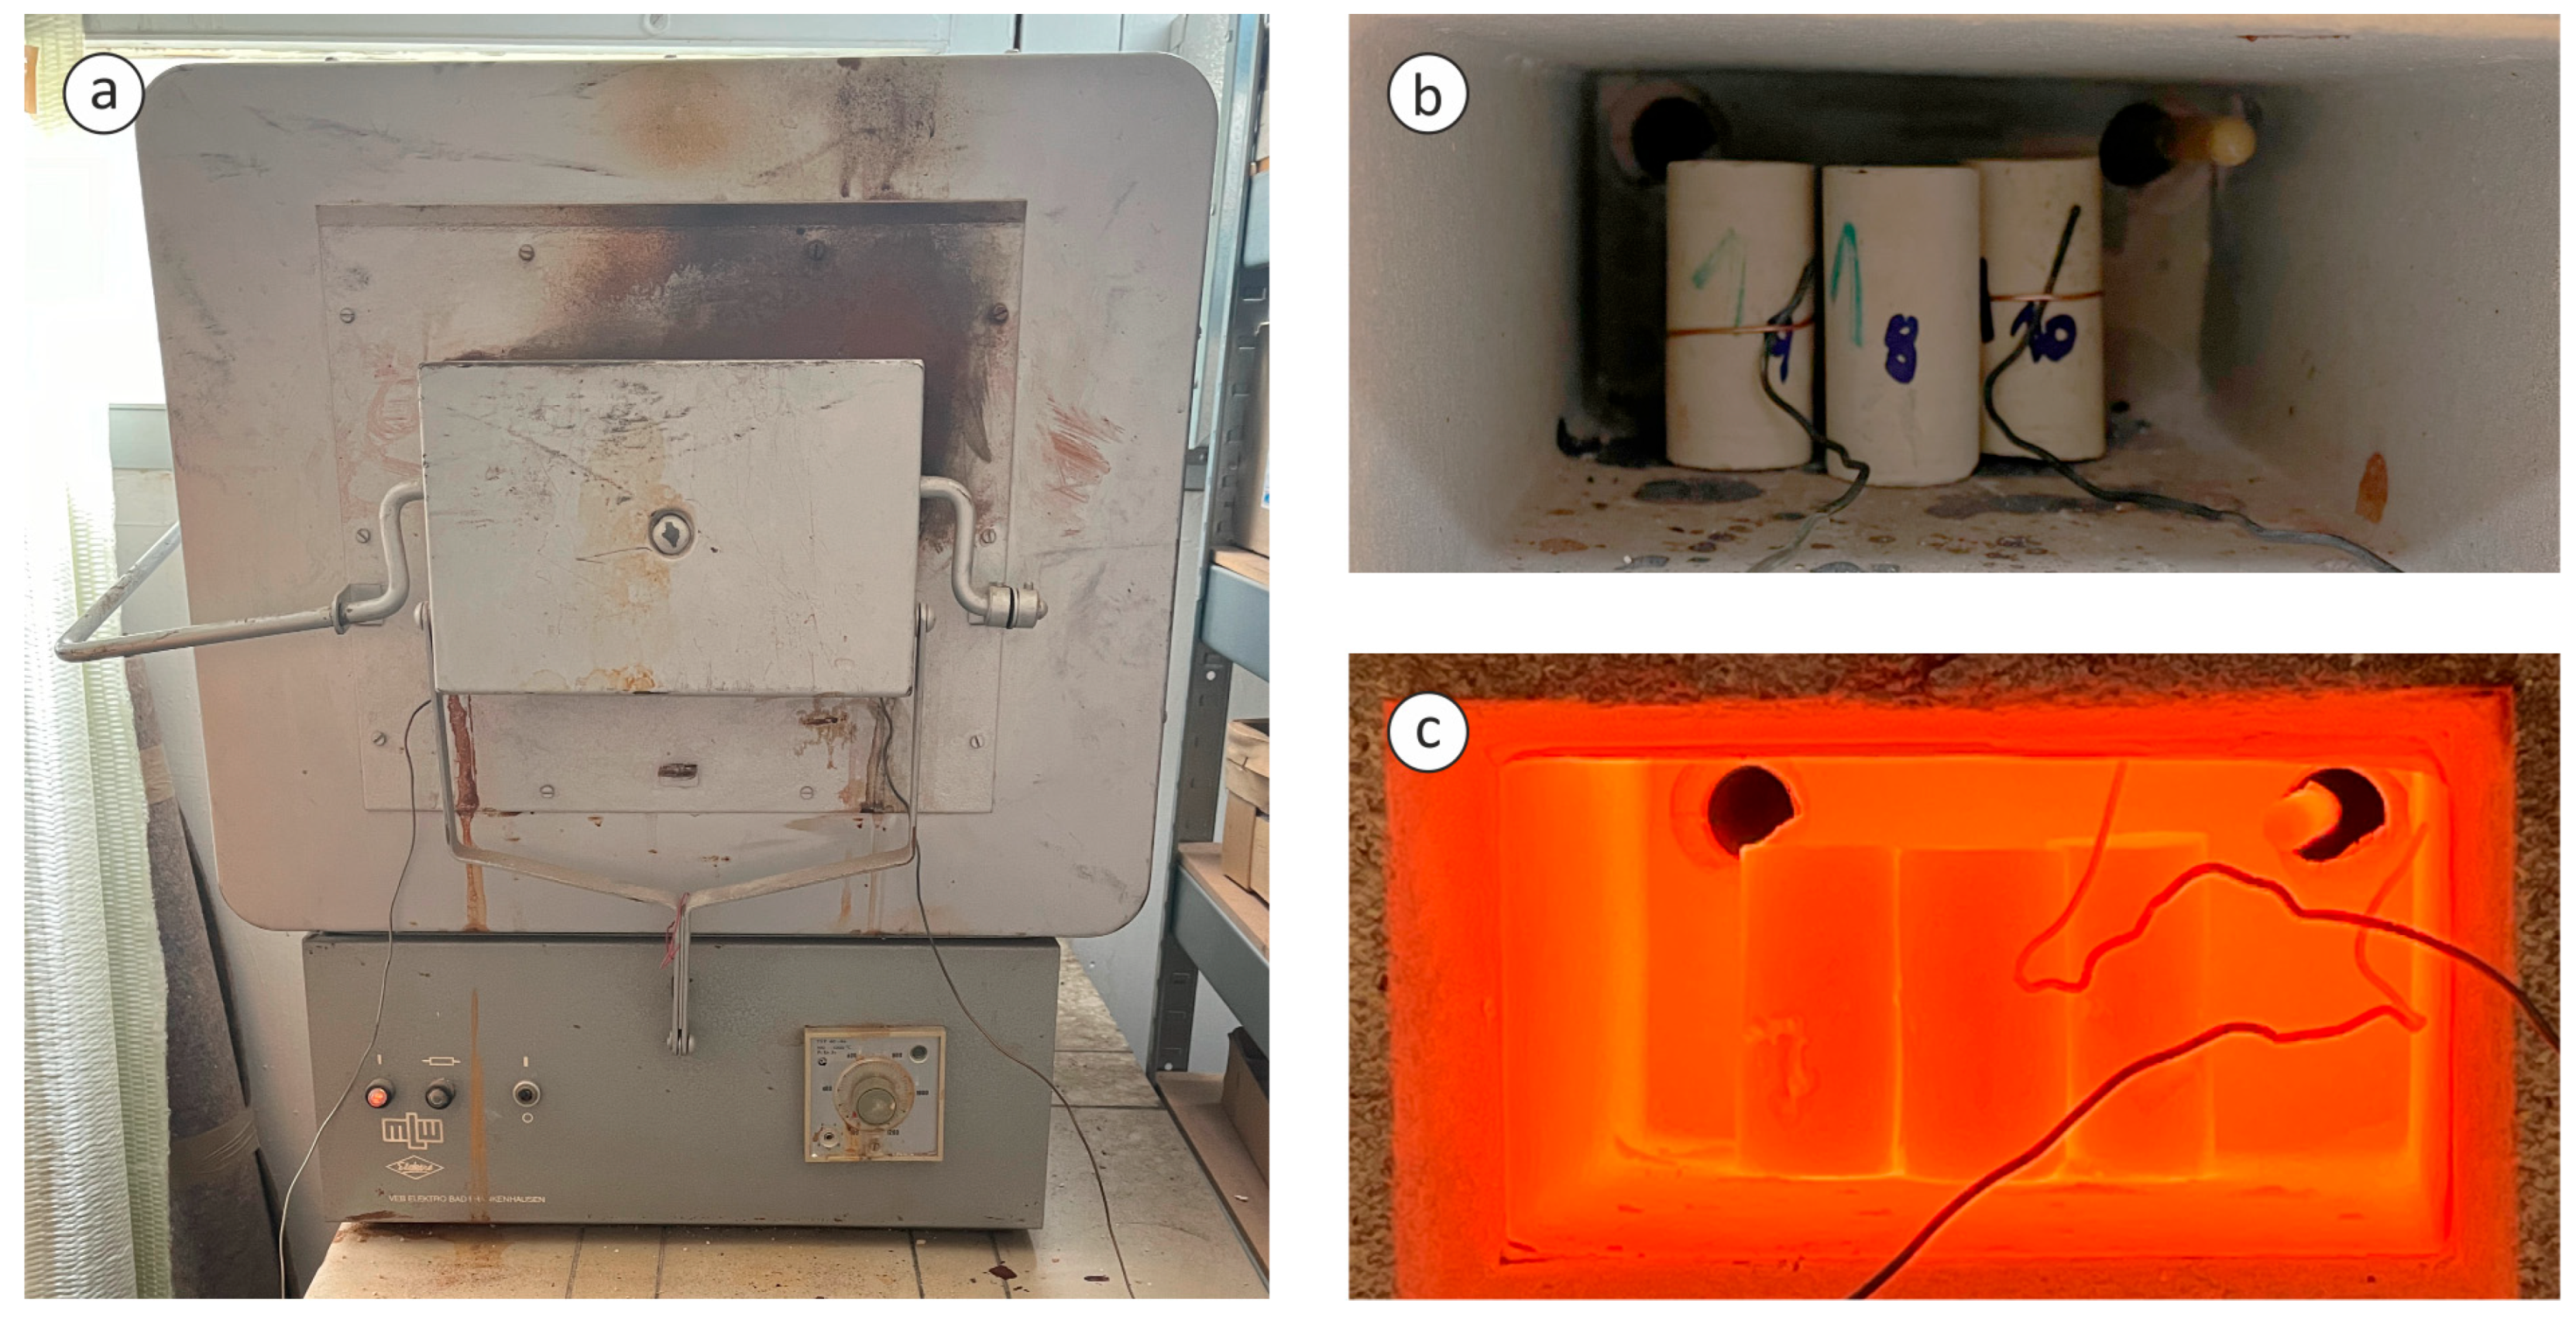
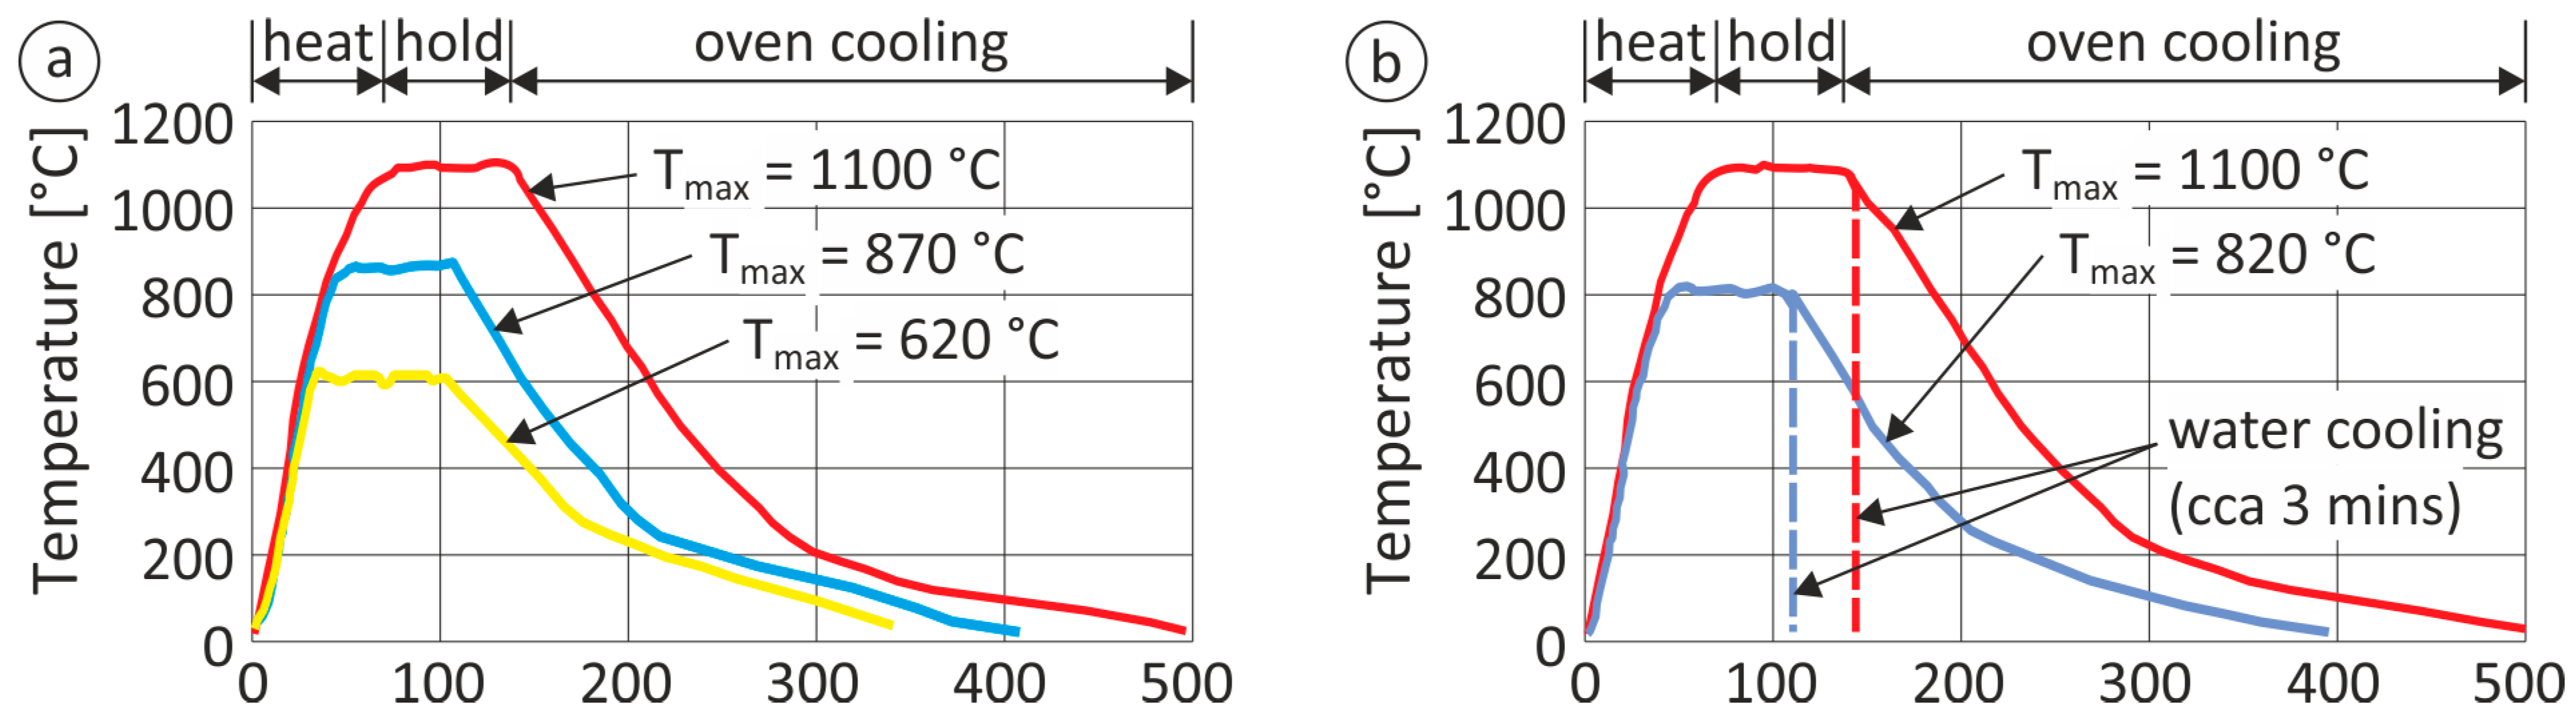
The heating protocol followed a three-stage procedure to ensure uniform thermal exposure. Initially, the specimens were heated in an electric muffle furnace (Figure 4) to the desired target temperature at the rate of approximately 13–16 °C min−1. Upon reaching this temperature, the specimens were held at the target temperature (±50 °C) for approximately 1 h to allow thorough and homogeneous heating. The final stage involved cooling, naturally in the oven and by rapid water quenching in the case of the Marlstone Group 2 set. Temperatures were continuously monitored using a pair of thermocouples to guarantee accurate control.
To systematically assess the thermal effects, two distinct sets of specimens were prepared. The first set (M1) contained 16 specimens heated to 620 °C, 870 °C and 1100 °C (Figure 5). The second set (M2) contained 14 specimens heated to 820 °C and 1100 °C.
The selected experimental temperatures (620 °C, 870 °C, and 1100 °C) were chosen based on previous experimental observations indicating that changes in marlstone at lower temperatures are limited. The applied temperature range therefore focuses on conditions under which significant mineralogical and structural transformations are expected, allowing a clearer assessment of the material response to elevated thermal exposure.
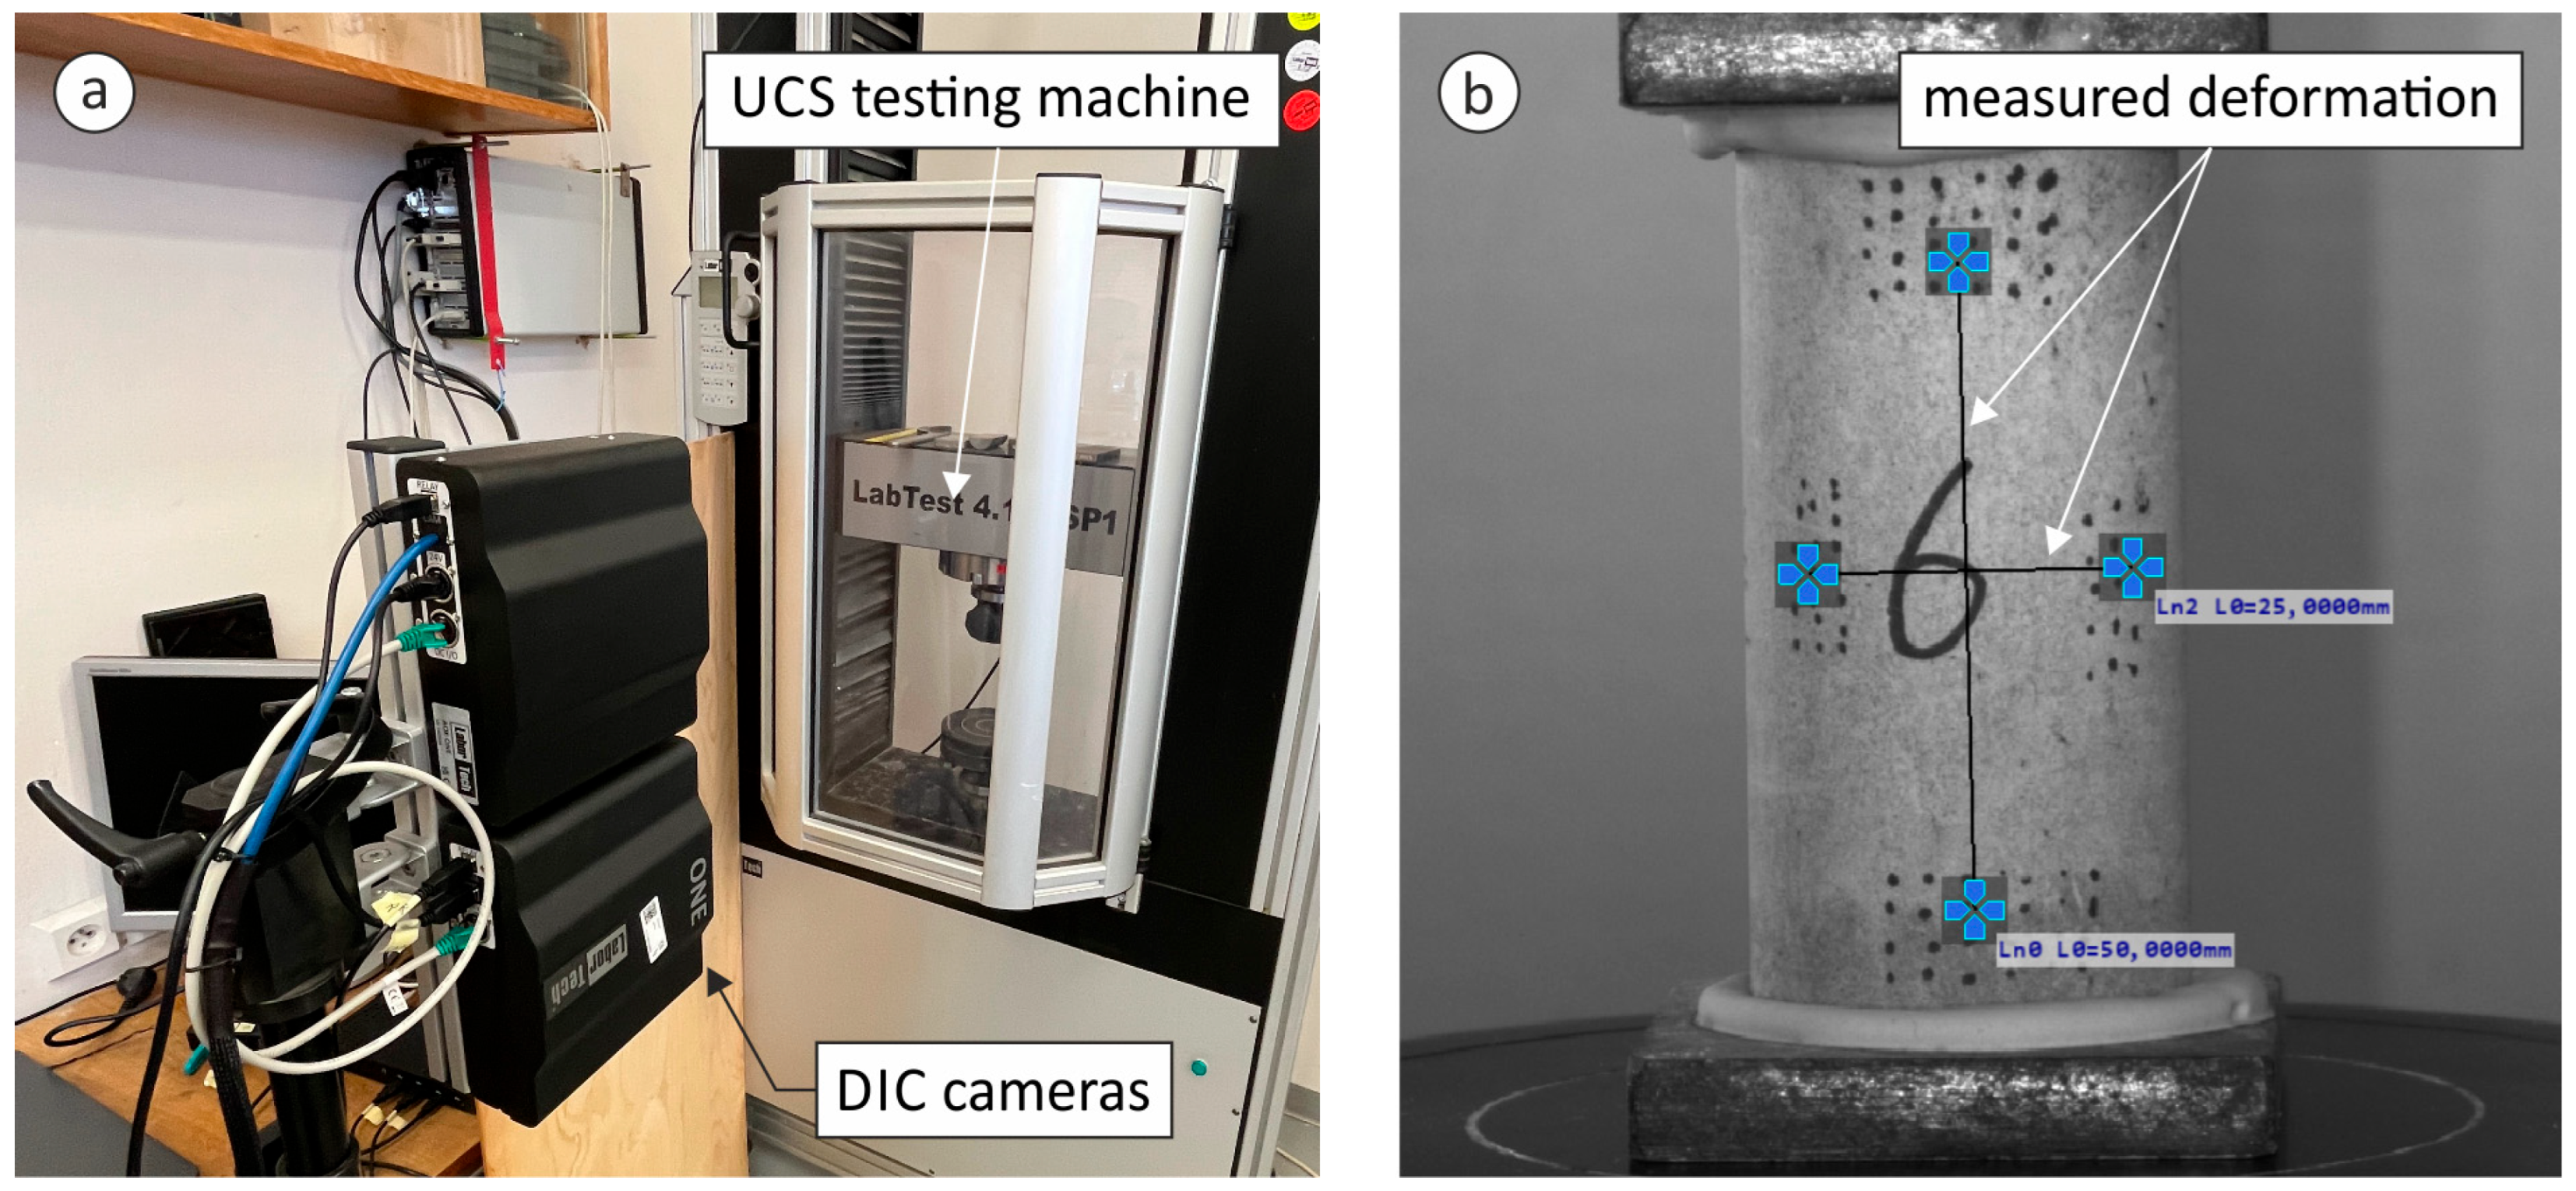
After cooling, the mechanical response of all specimens was evaluated through uniaxial compression testing using a LabTest 4.100.SP1 universal testing machine (LaborTech s.r.o., Opava, Czech Republic), with a maximum load capacity of 100 kN (Figure 6), under displacement control at a loading rate of 0.25 mm/min. To capture detailed deformation behavior, digital image correlation (DIC) technology was employed, enabling the measurement of relative strains and displacements. The DIC setup included a LaborTech AOX-ONE camera (LaborTech s.r.o., Opava, Czech Republic) with a 5 Mpx (2448 px × 2048 px) Blackfly BFS-U3-51S5M sensor (Teledyne FLIR, Thousand Oaks, CA, USA) and a 16 mm lens, complying with EN ISO 9513 [21] accuracy class 0.5 and ASTM E 83: Class A [22]. Illumination was provided by blue monochromatic LED lighting with a wavelength corresponding to the highest sensitivity of the camera chip. Recorded data were analyzed by the Alpha® software (version 1.0.377).
All measured data were analyzed to assess the effect of temperature and other experimental factors on the respective parameters. For most samples, one-way analysis of variance (ANOVA) was performed to evaluate the influence of temperature. When significant differences were found (p < 0.05), post hoc comparisons were carried out using Tukey’s HSD (honestly significant difference) test to identify which groups differed significantly, with statistical analyses conducted in JASP. For the Marlstone Group 2 samples, which involved two different cooling methods, one-way ANOVA was first conducted for each cooling type individually. Subsequently, a two-way ANOVA was performed to evaluate the combined effects of temperature and cooling method on the measured parameters.
Mass loss was recorded for the sample sets. Each sample was weighed prior to heating and subsequently after heating and cooling. Water-quenched Marlstone Group 2 samples were placed in the cooling furnace for gradual drying and were weighed only once when fully dry. This parameter provides an indirect indication of moisture release, decomposition of mineral phases, and other thermally driven processes affecting the material.
In this study, the temperature-induced color changes of the specimens were systematically monitored. As no colorimeter was available for color measurements, an alternative image-based method using a digital camera was employed. Images were acquired using a Canon EOS 60D camera (Canon Inc., Tokyo, Japan), with illumination provided by two diffused lights calibrated to a color temperature of 5000 K, matching the camera’s white balance to ensure uniform lighting. For each sample, four regions of interest (ROIs) of 100 × 100 px were selected, and the CIELab values were determined for each ROI and subsequently averaged to obtain a representative color for the sample. Color variations were quantified using the L*, a*, and b* parameters of the CIELab color space, representing lightness (L*) and chromatic axes (a* = red–green, b* = blue–yellow). The color difference ΔE* was calculated relative to the reference temperature (26 °C), and higher temperatures are compared against this reference to quantify the color change induced by heating [23]. To help evaluate the changes in mechanical properties, mass loss and color changes that occurred due to the heating of samples, basic petrographic analysis using a PM 2805 polarizing microscope (Motic, Wetzlar, Germany) before and after thermal treatment was performed.
In addition, reflectance spectroscopy was used to determine the changes in the stone samples after their heating. Clark [24], for instance, provides a detailed explanation of the principles underlying this approach. Since each material reflects and absorbs electromagnetic radiation differently based on its chemical composition and texture, this method is particularly useful for identifying both the physical and chemical properties of materials [25]. The non-invasive measurement of selected marlstone samples was conducted with the OceanOptics NIR Quest 512 spectrometer (Ocean Insight, Duiven, The Netherlands). The NIRQuest 512-2, 5 from Ocean Optics/Ocean Insight works in the 900–2500 nm spectral range. In this range, 512 spectral bands are detectable. The averaging is done via operating software. Outlying data are manually excluded from the measurements and the data processing itself. After further verification and methodological refinement, of which this study is a part, reflectance spectrometry has the potential to become a fast and efficient tool for evaluating mineral transformations in rocks.
To further support the discussion and evaluation of results, elemental concentrations in the samples were determined using the Xepos XRF analyzer (Xepos, Spectro Analytical Instruments, Kleve, Germany). Prior to analysis, the samples were dried at 105 °C to constant weight and subsequently homogenized. The homogenized material was analyzed as loose powder, without pelletization. Measurements were carried out using a helium flush to enhance the detection of light elements by reducing X-ray absorption in air. The obtained elemental concentrations were normalized to 80% in order to minimize matrix effects and variations related to residual moisture content. All samples were prepared and measured under identical conditions to ensure analytical reproducibility.

4. Results and Discussion

4.1. Mass Loss

Mass loss after heating was calculated to quantify material changes induced by elevated temperatures.
For Marlstone Group 1 (Table 4), heating to 620 °C resulted in an average mass loss of 3.72 g (2.99%), with individual losses ranging from 3.52 g to 3.95 g (2.85–3.18%). After heating to 870 °C, the samples showed an average mass loss of 8.03 g (6. 43%), ranging from 7.59 g to 8.78 g (6.10–6.85%). Following heating to 1100 °C, the average mass loss was 9.24 g (7.49%), with values ranging from 8.27 g to 10.49 g (6.60–8.59%).
For Marlstone Group 2 (Table 5), heating to 820 °C followed by furnace cooling resulted in an average mass loss of approximately 9.02 g (7.44%), ranging from 8.91 g to 9.12 g (7.22–7.59%). When cooled in water, the average mass loss at 820 °C was 7.86 g (6.49%), ranging from 7.61 g to 8.29 g (6.21–6.77%). After heating to 1100 °C and furnace cooling, the average mass loss was 9.72 g (8.14%), ranging from 9.36 g to 9.94 g (7.71–8.36%). When cooled in water, the average mass loss at 1100 °C was 9.31 g (7.64%), with values ranging from 8.82 g to 9.91 g (7.27–8.07%).

4.2. Mechanical Properties

4.2.1. Marlstone Group 1

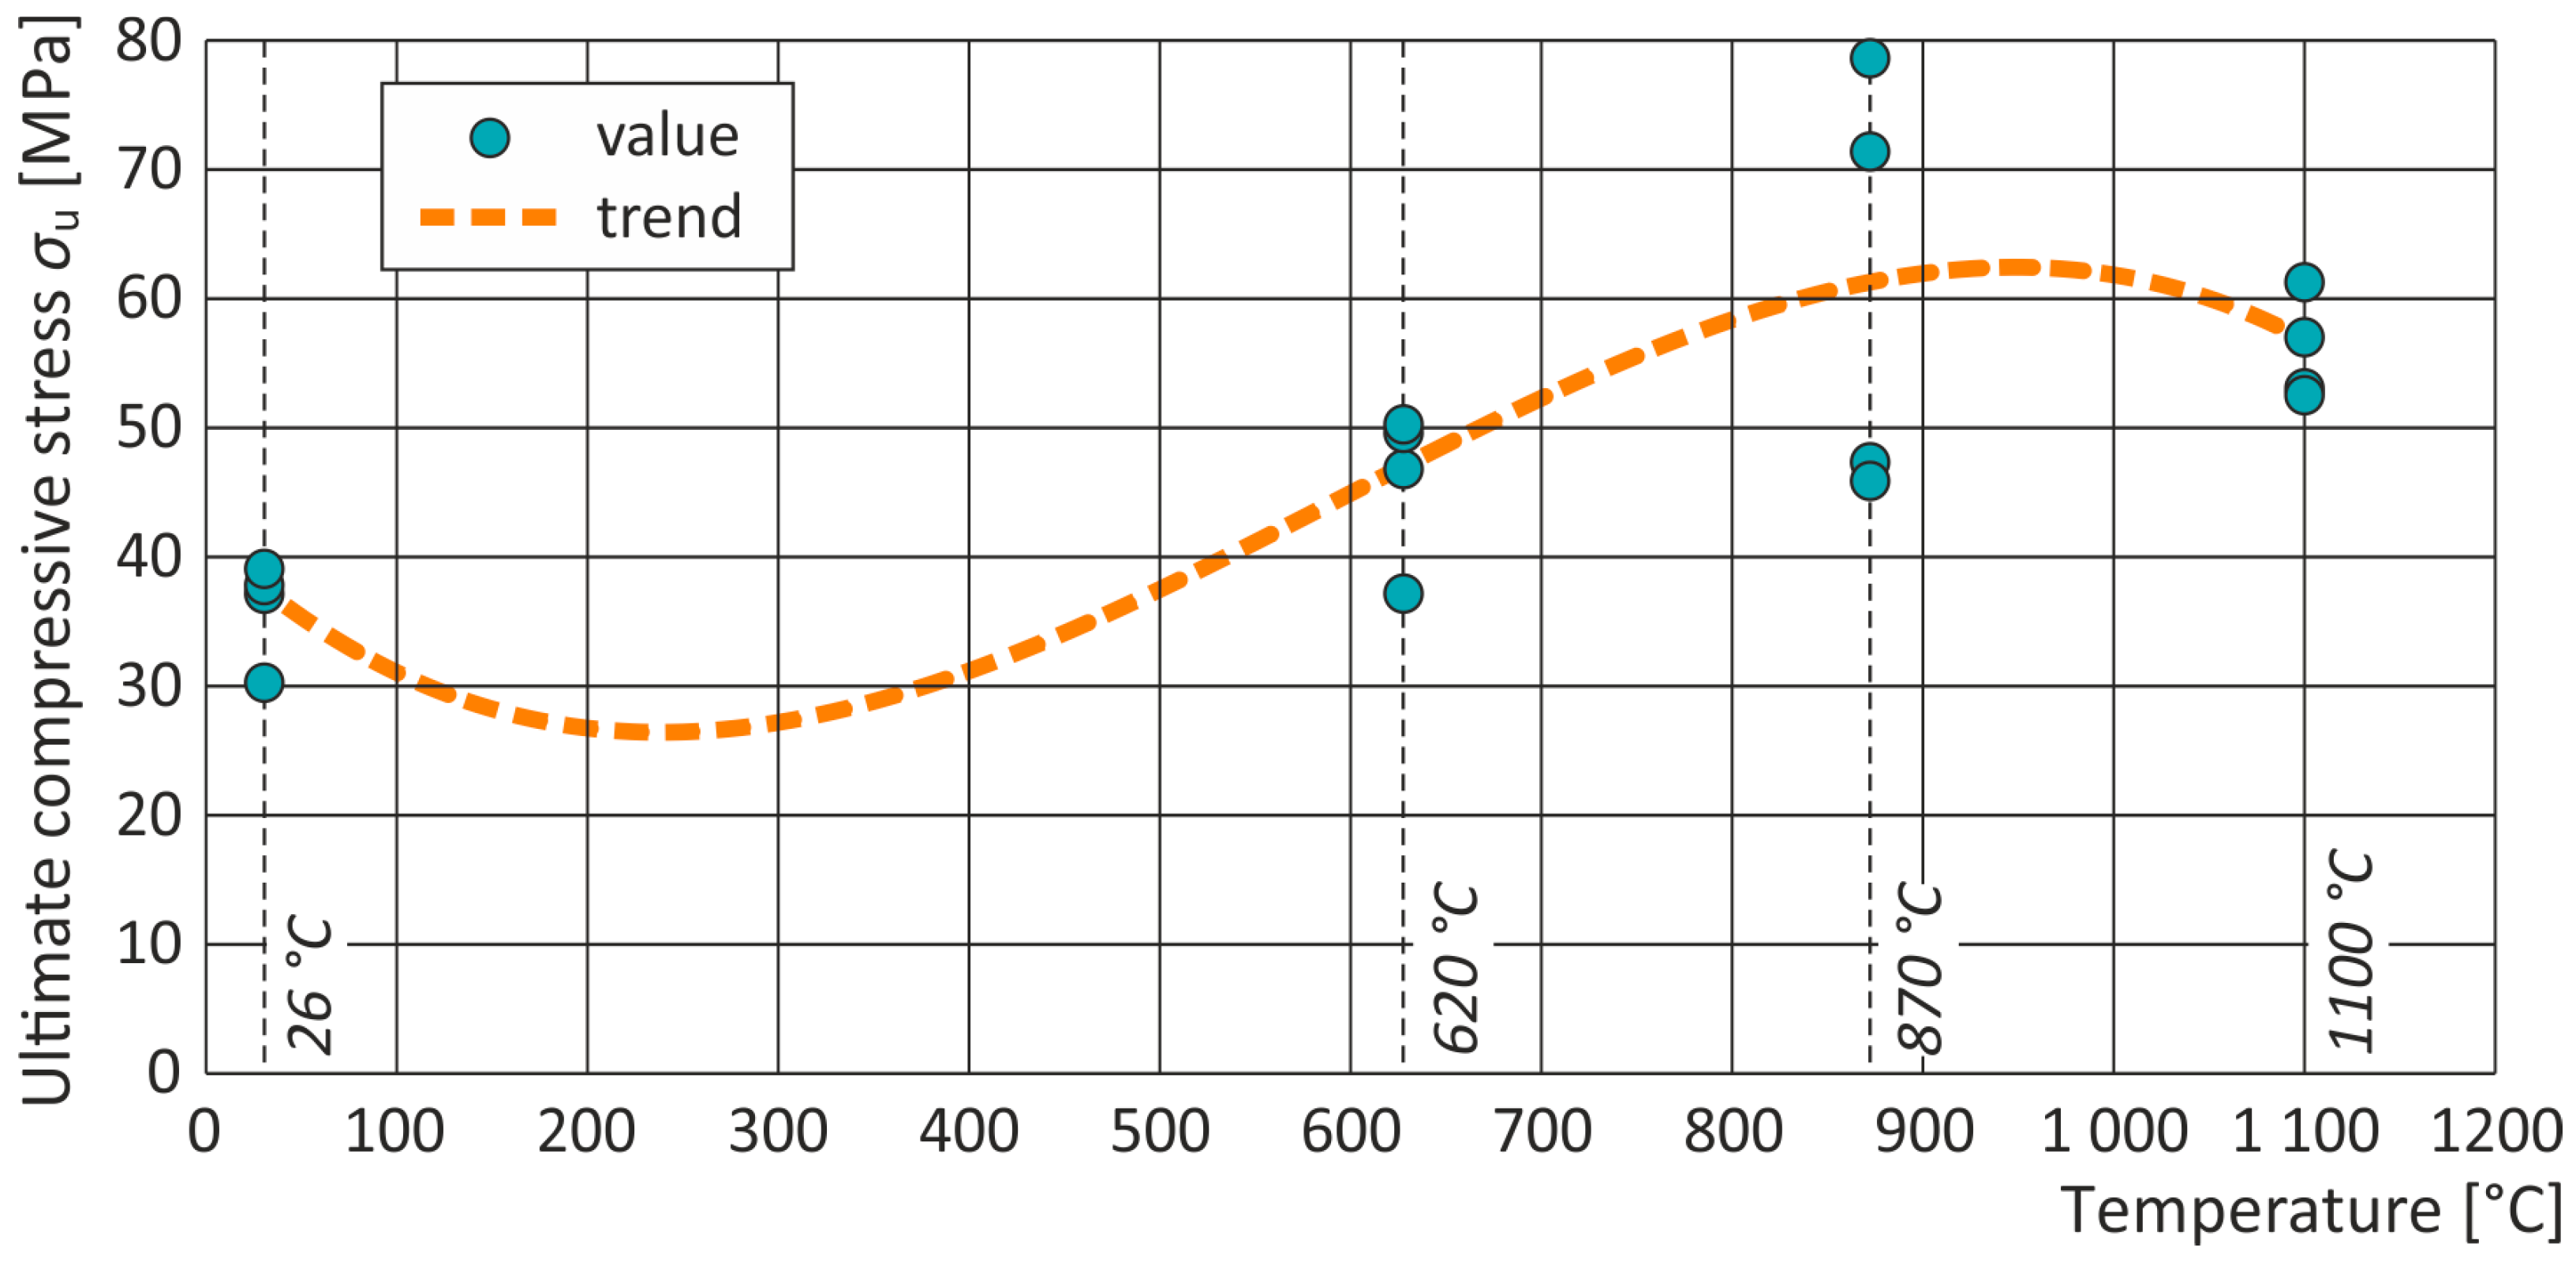
Marlstone Group 1 samples exhibited a clear temperature dependence in compressive strength (Figure 7). Reference samples averaged 34.5 MPa (100%), ranging from 27.8 to 37.9 MPa (81–110%). At 620 °C, strength increased to 45.7 MPa (133%), within 35.5–50.8 MPa (103–147%). At 870 °C, strength rose further to 60.5 MPa (176%), spanning 45.0–78.6 MPa (130–228%). At 1100 °C, strength remained high at 55.8 MPa (162%), within 52.1–61.7 MPa (151–179%).
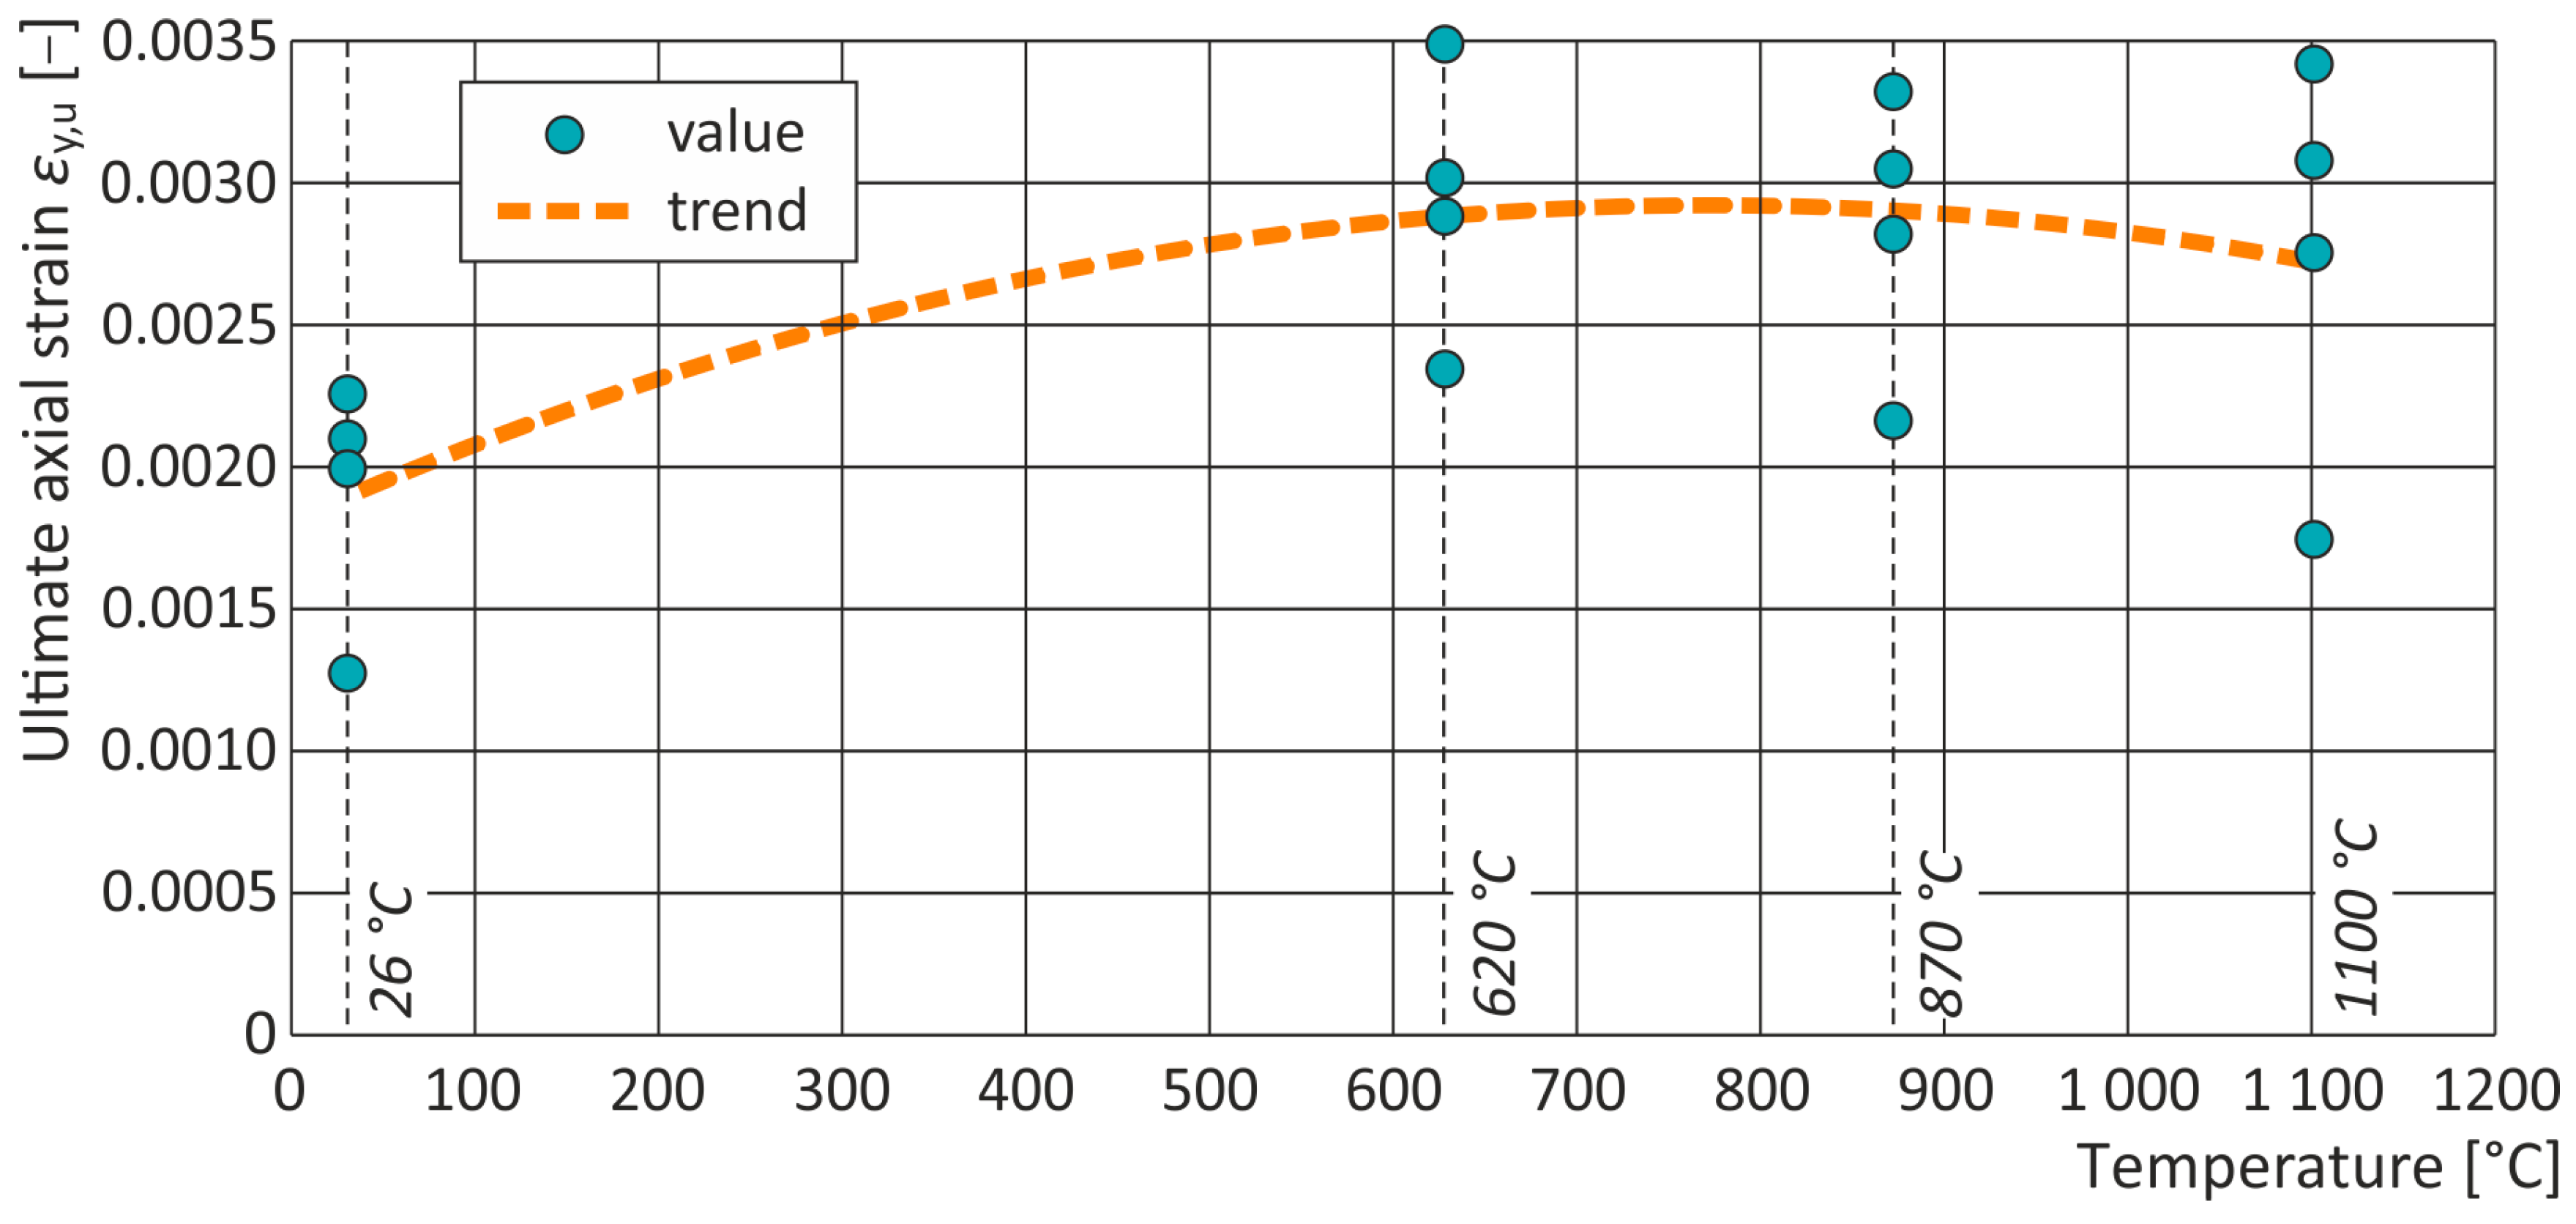
The reference strain averaged 0.001908 (100%), ranging from 0.00126 to 0.00225 (66–118%). At 620 °C, strain increased to 0.00293 (154%), within 0.00234–0.00349 (123–183%). At 870 °C, strain averaged 0.002833 (148%), spanning 0.00215–0.00331 (113–174%). At 1100 °C, strain slightly decreased to 0.00275 (144%), within 0.00176–0.00342 (92–179%). The results are illustrated in Figure 8.
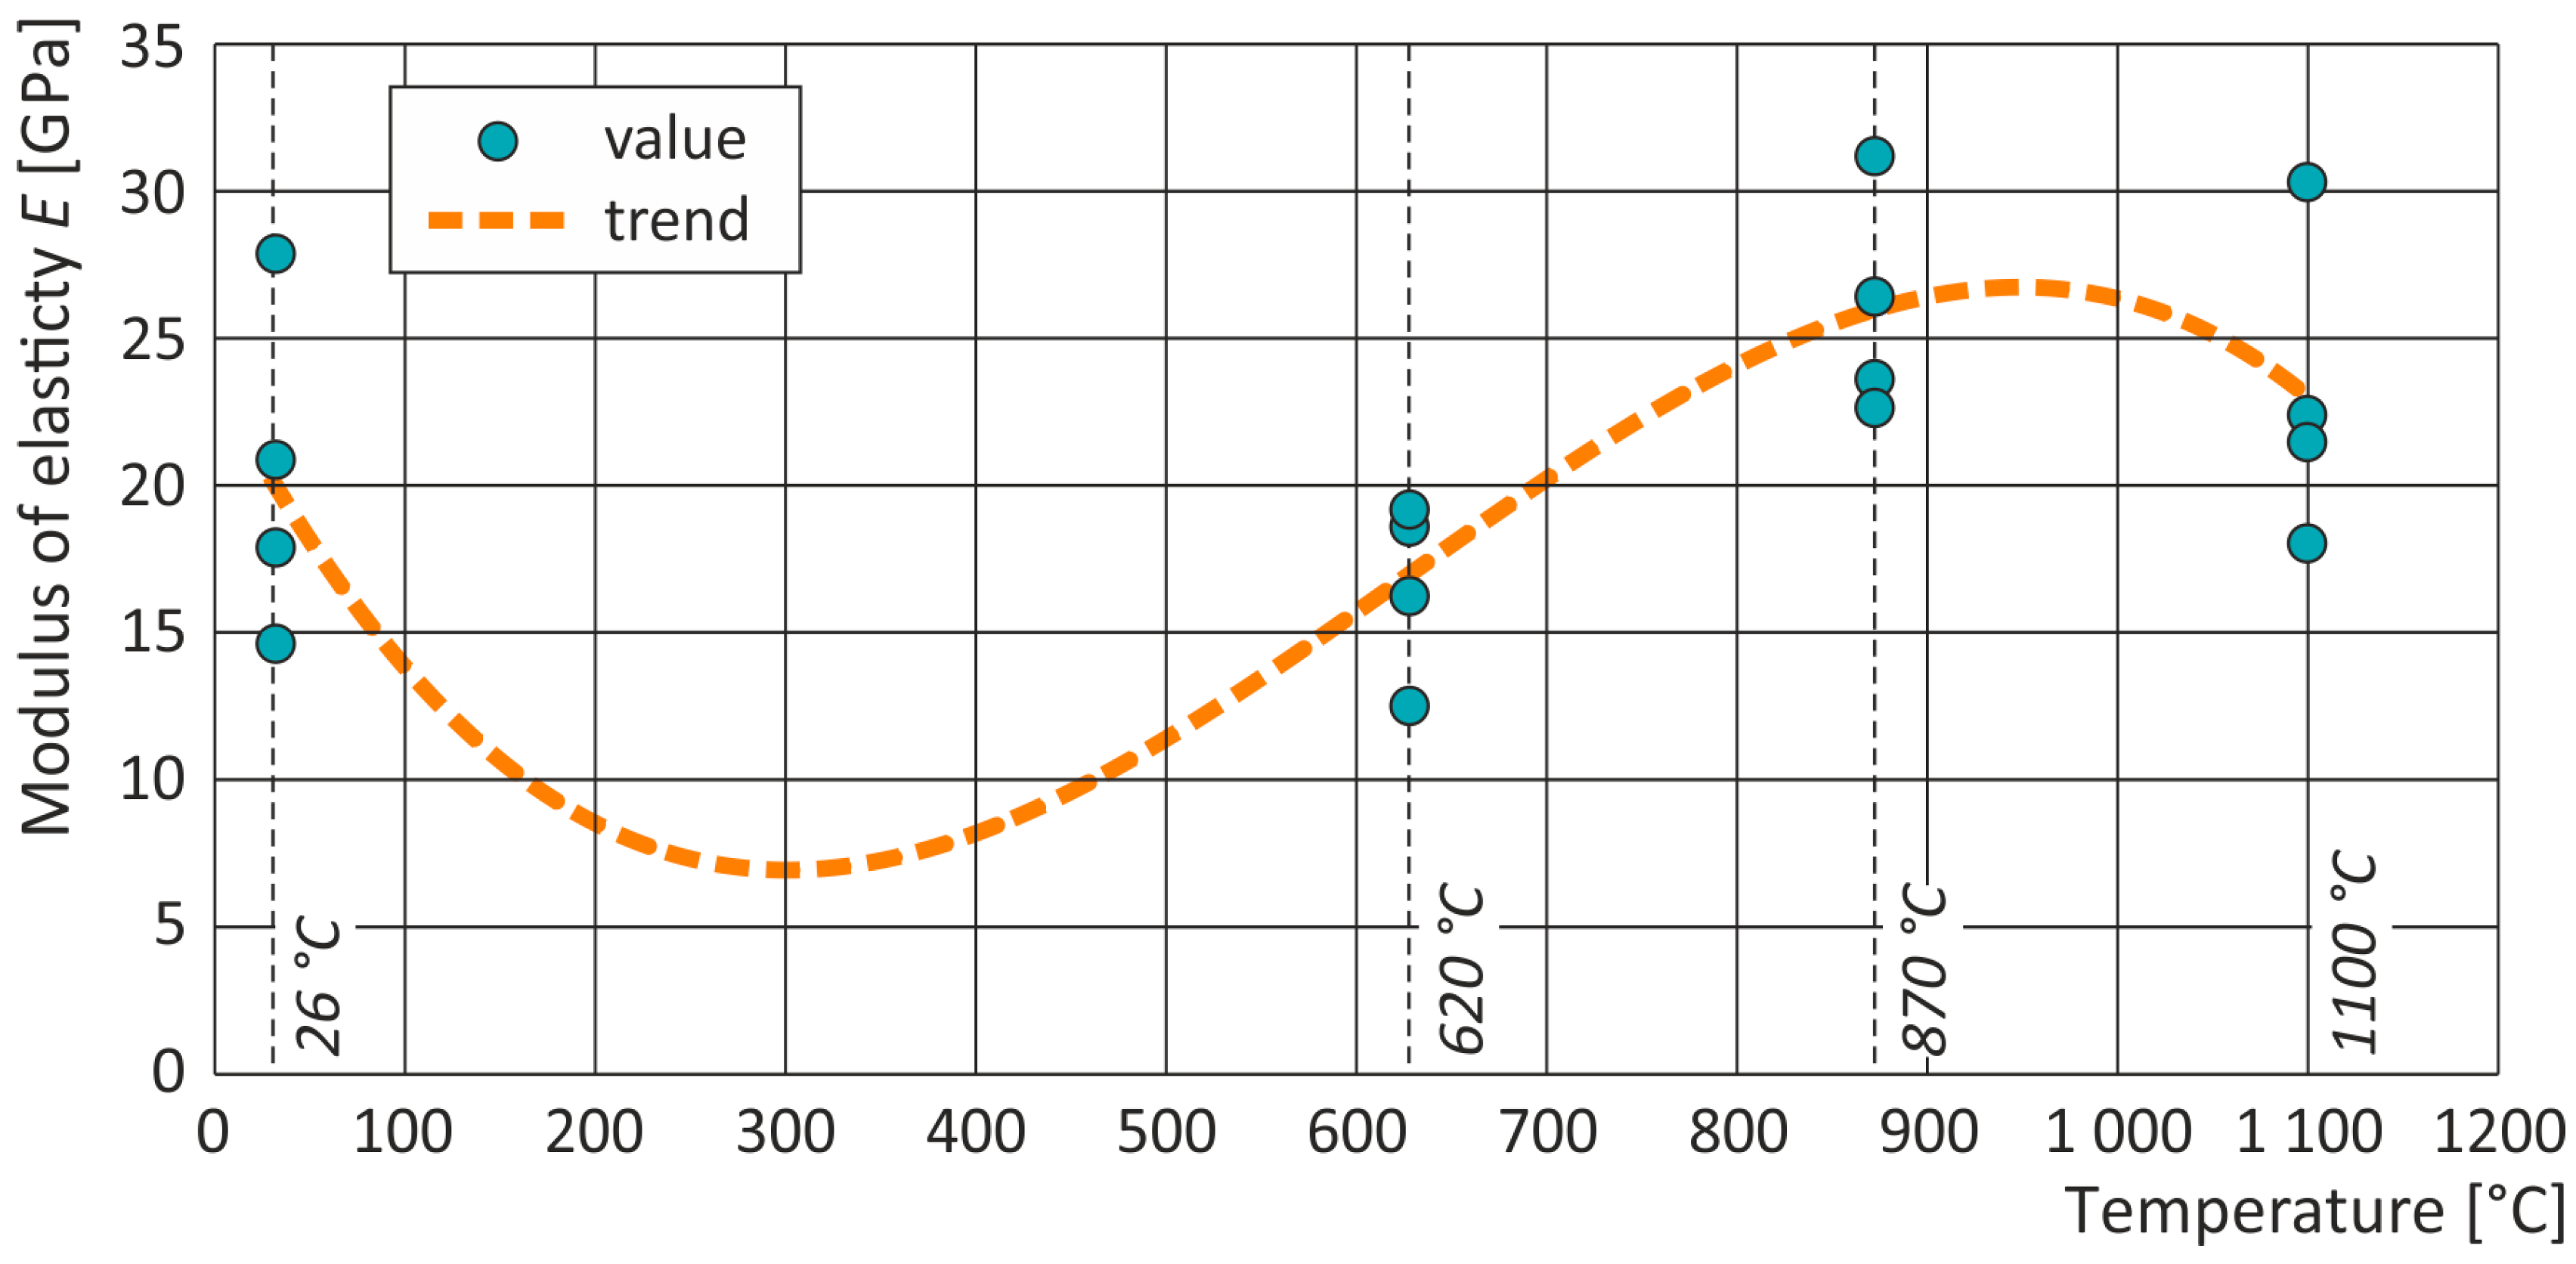
The Young’s modulus of unheated specimens averaged 20.2 GPa (100%), with values ranging from 14.5 to 27.7 GPa (72–137%). At 620 °C, modulus decreased to 16.6 GPa (82%), within 12.4–19.1 GPa (61–94%). At 870 °C, it increased sharply to 25.8 GPa (128%), ranging from 22.5 to 31.0 GPa (111–154%). At 1100 °C, modulus declined slightly to 22.9 GPa (113%), within 17.9–30.1 GPa (89–149%). The dependence of Young’s modulus on temperature is presented in Figure 9.
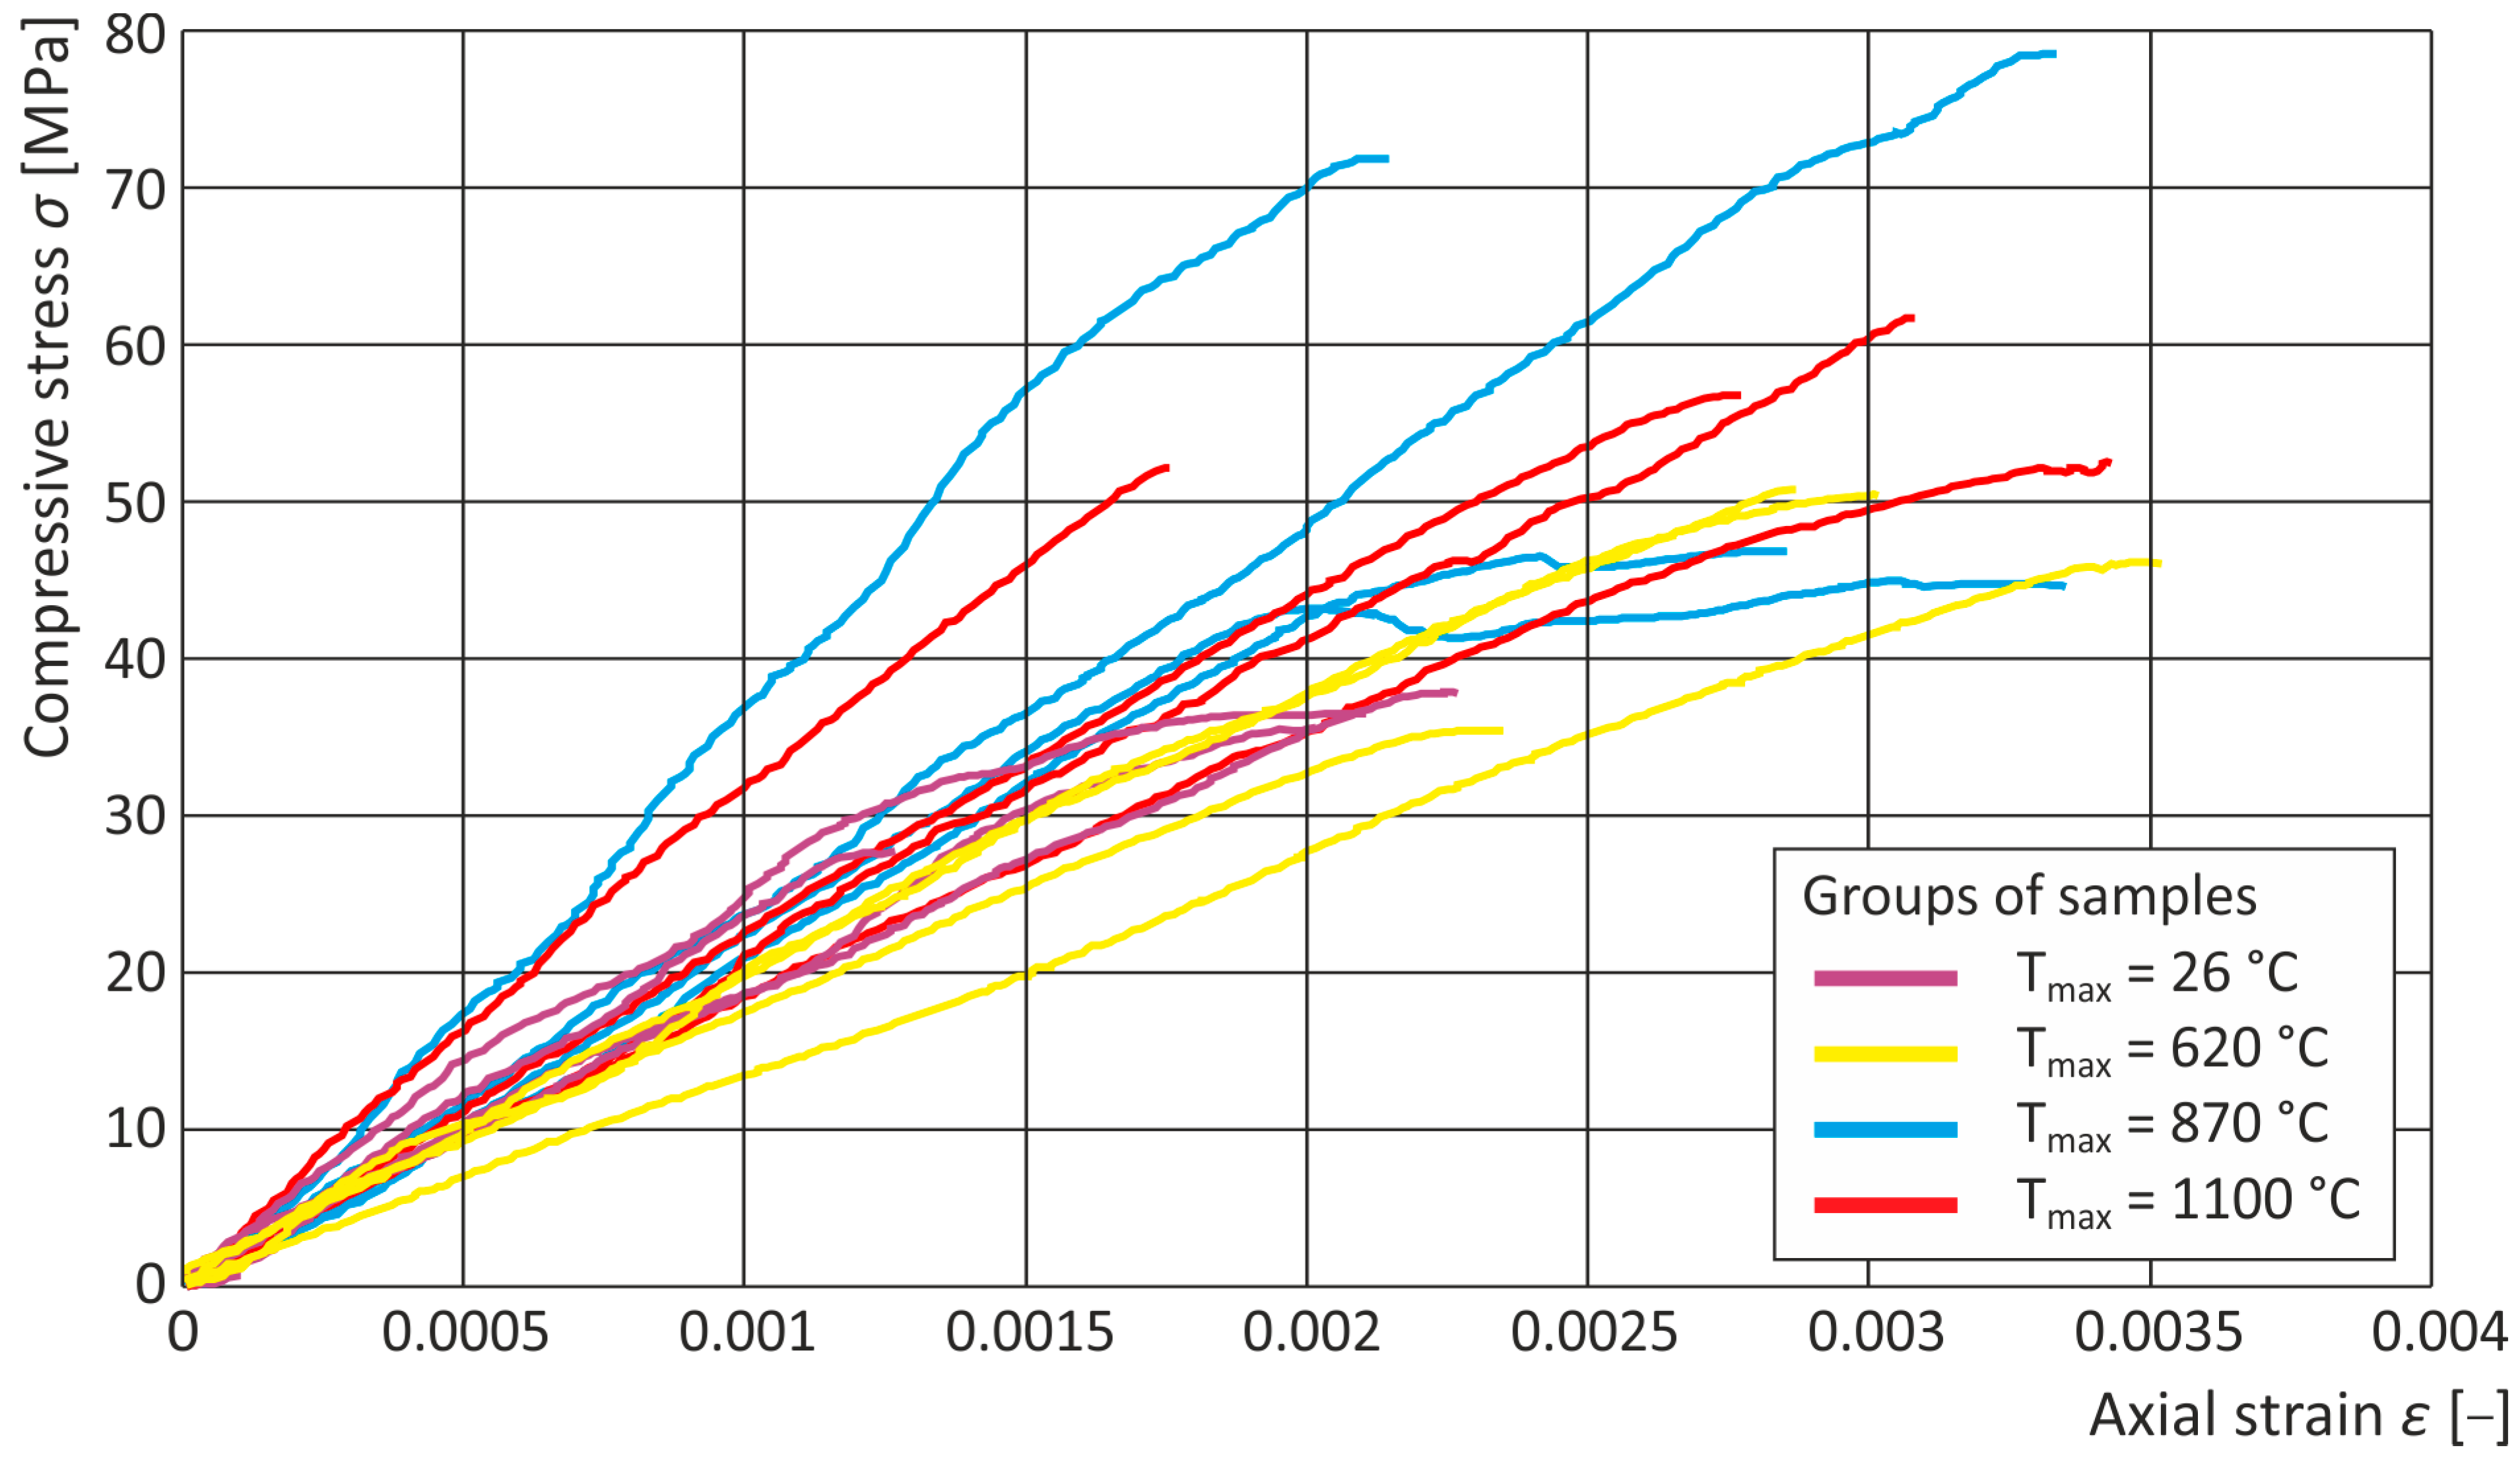
Table 6, Table 7 and Table 8 present the experimentally obtained values of compressive strength, axial strain, and Young’s modulus for Marlstone Group 1 specimens, together with their basic statistical evaluation. The tables summarize the measured results and highlight the variability of the mechanical response within the tested sample set. The stress–strain curves for individual specimens are illustrated in Figure 10, providing a visual comparison of behavior under load.

4.2.2. Marlstone Group 2

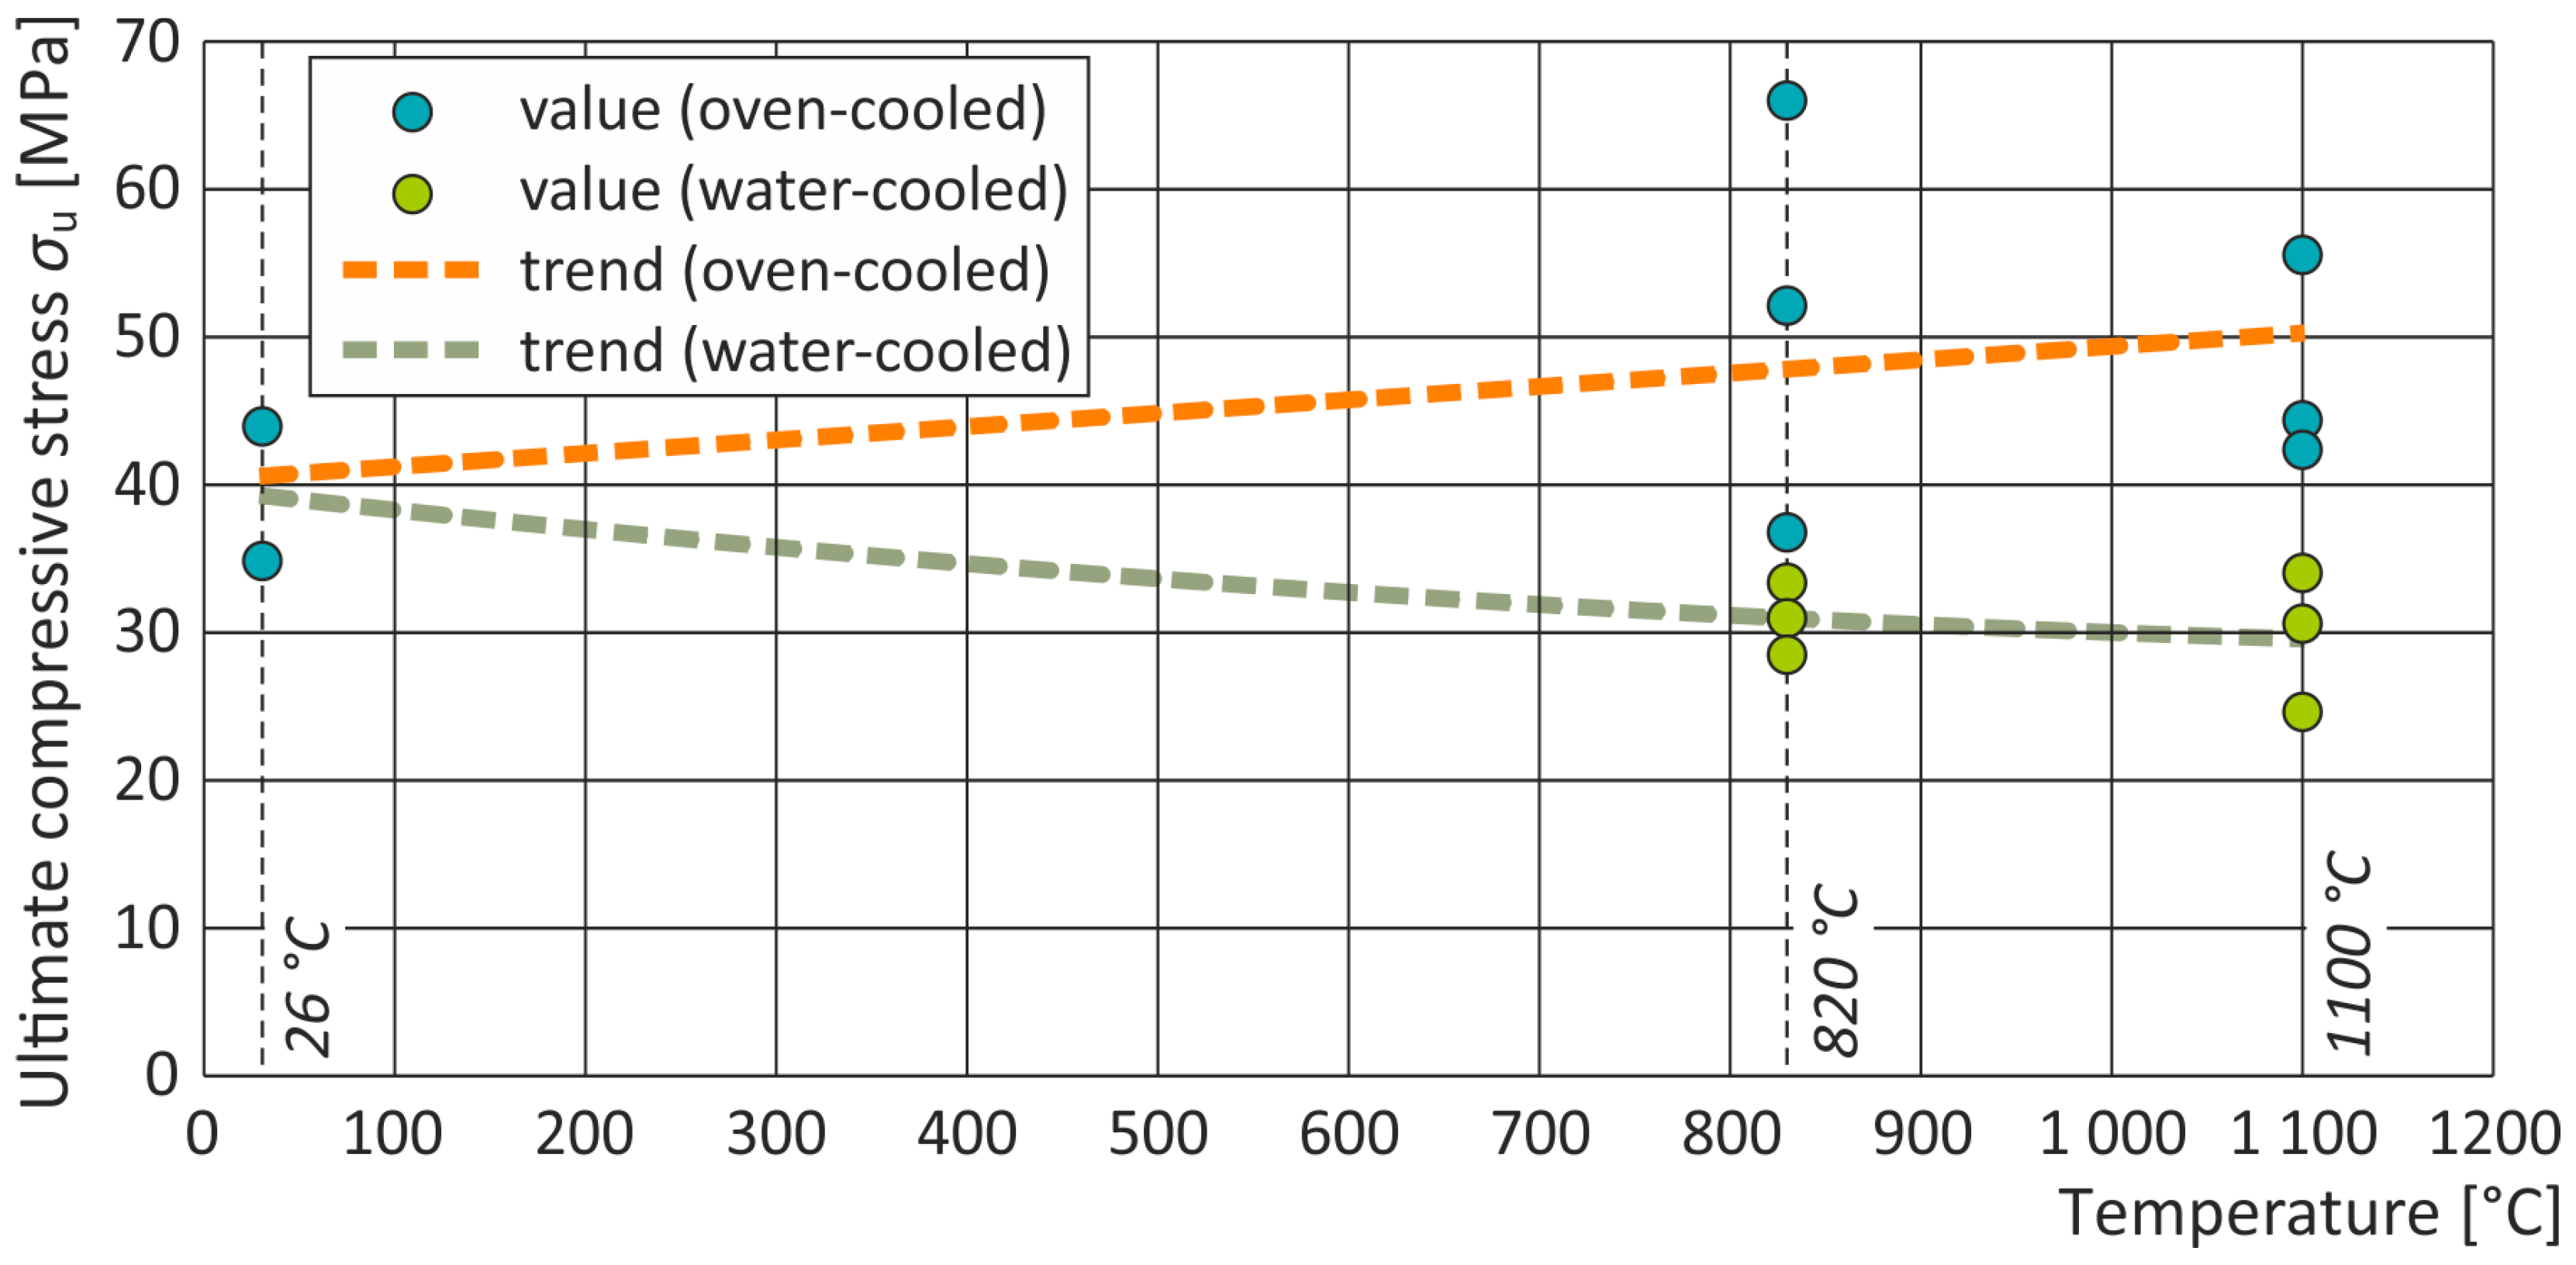
The unheated Marlstone Group 2 specimens exhibited an average compressive strength of 39.36 MPa (100%), ranging between 34.85 MPa and 43.87 MPa (89–111%). After heating to 820 °C and furnace cooling, the strength increased to approximately 51.72 MPa (131%), with values from 37.20 MPa to 66.01 MPa (95–168%), whereas rapid water cooling reduced it to around 31.00 MPa (79%), spanning 28.56 MPa to 33.68 MPa (73–78%). At 1100 °C, furnace-cooled samples reached 47.42 MPa (120%), ranging between 42.67 MPa and 55.19 MPa (108–140%), while water-cooled specimens achieved approximately 29.74 MPa (76%), within 24.74 MPa to 33.83 MPa (63–78%). The results are illustrated in Figure 11.
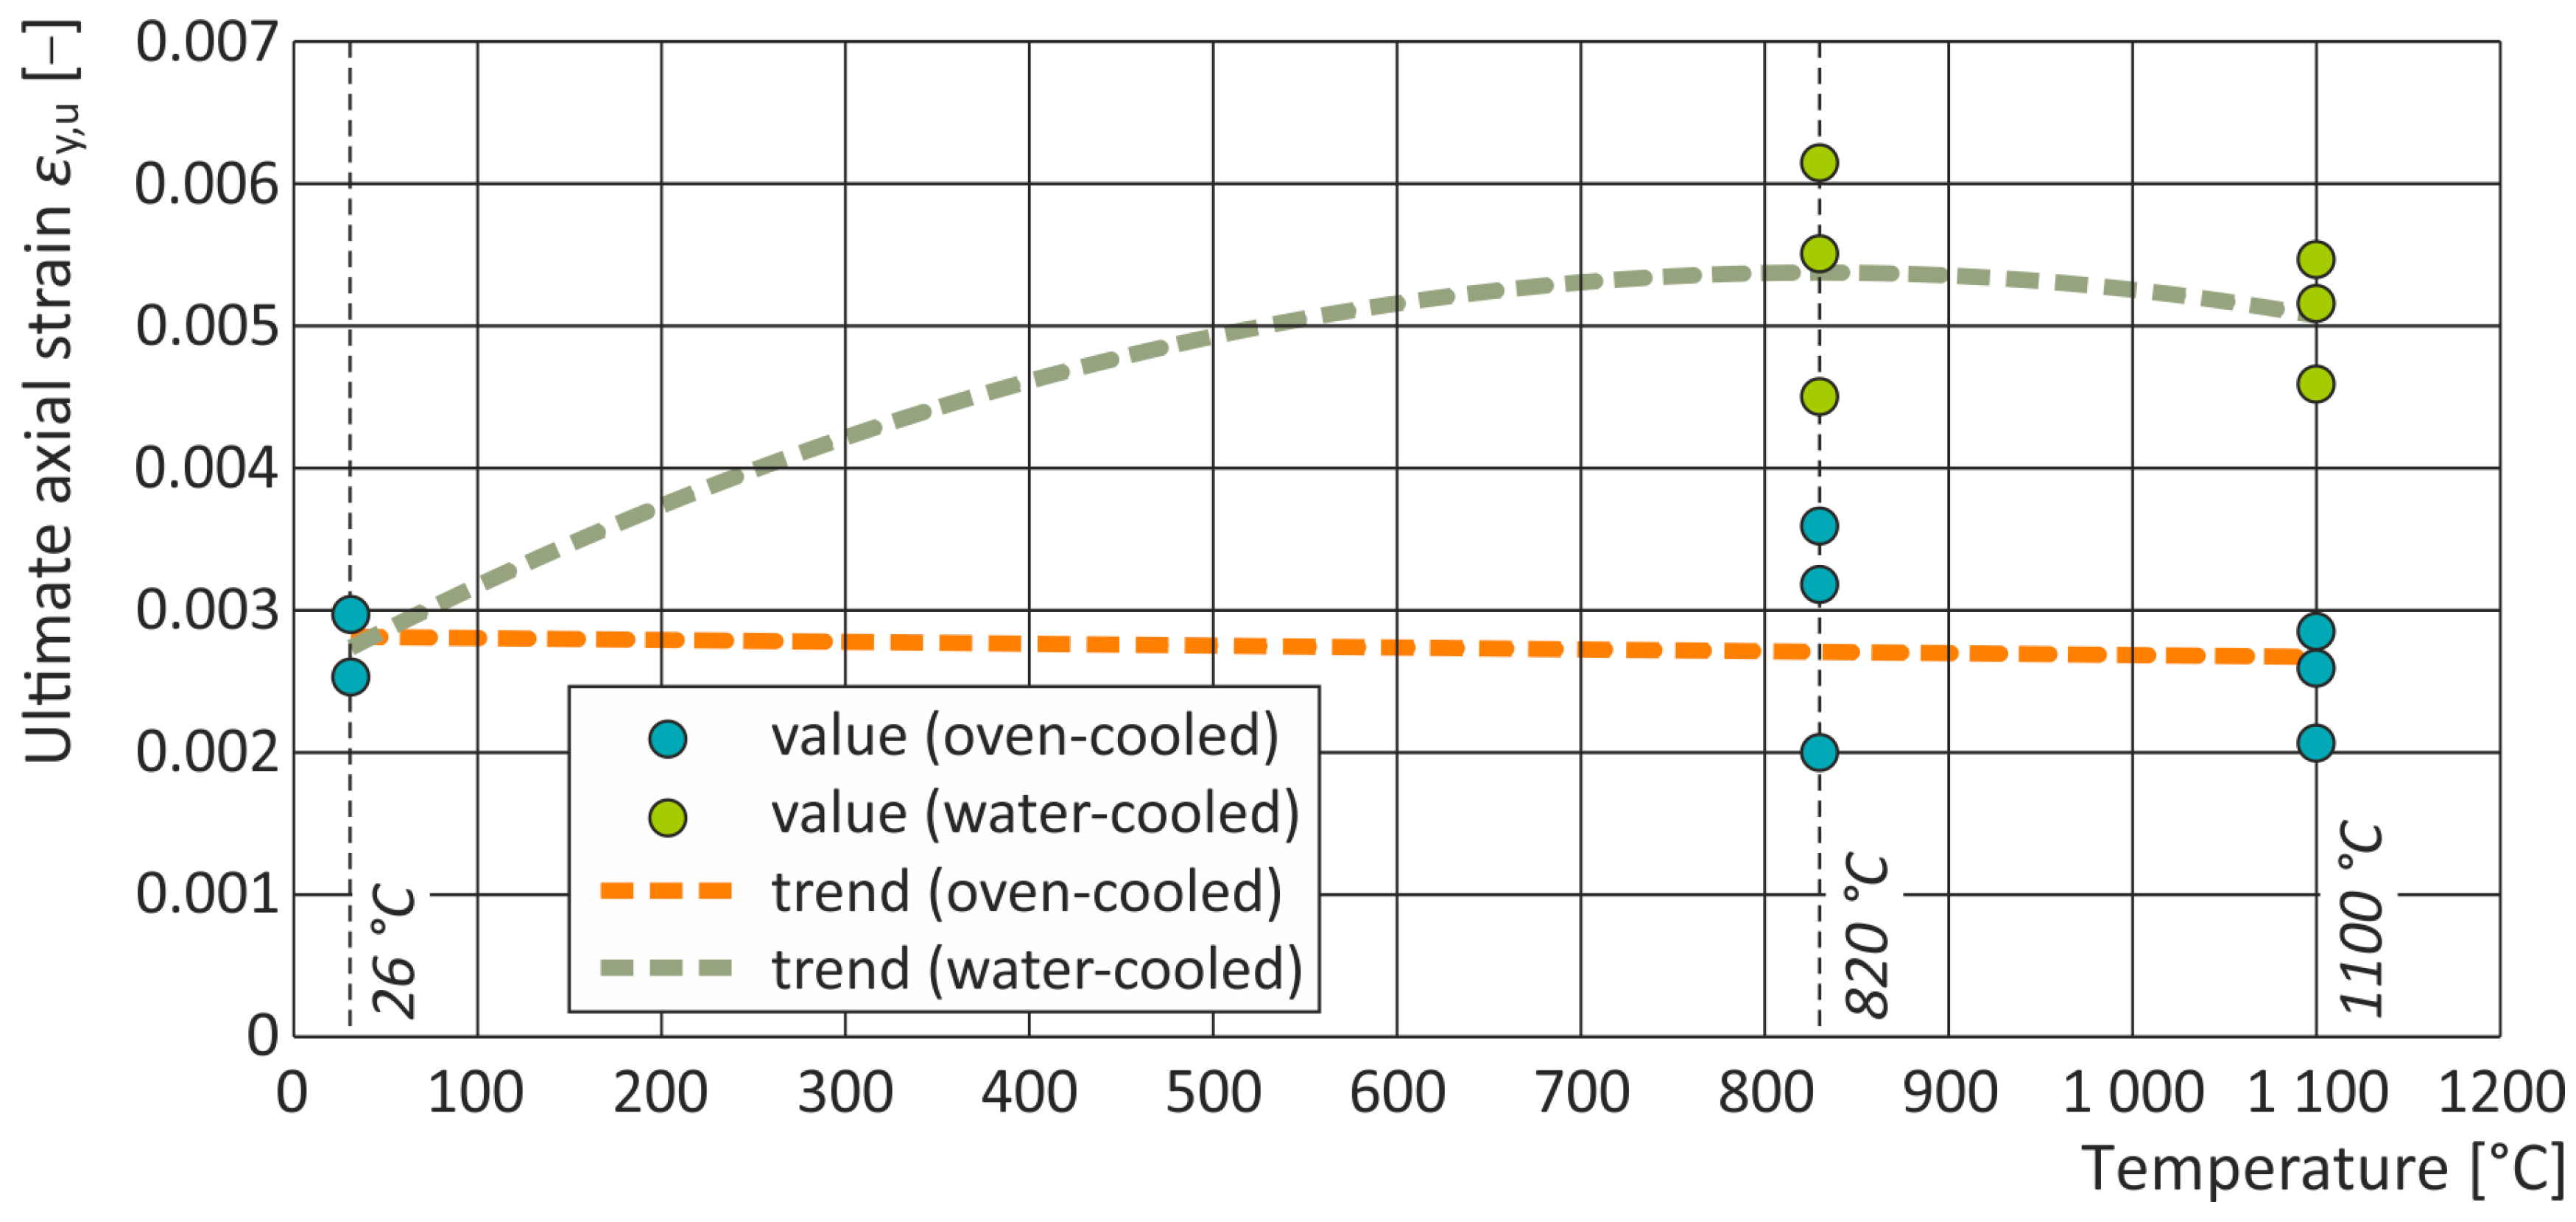
The axial strain of unheated Marlstone Group 2 averaged 0.00273 (100%), ranging from 0.00250 to 0.00297 (91–109%). At 820 °C, furnace-cooled specimens reached 0.00292 (107%), with a range of 0.00199 to 0.00359 (73–131%), while water-cooled samples increased to 0.00538 (197%), spanning 0.00450 to 0.00616 (165–226%). At 1100 °C, furnace-cooled samples showed 0.00250 (91%), within 0.00206 to 0.00285 (75–104%), and water-cooled specimens reached 0.00508 (186%), ranging between 0.00458 and 0.00550 (168–202%). The results are illustrated in Figure 12.
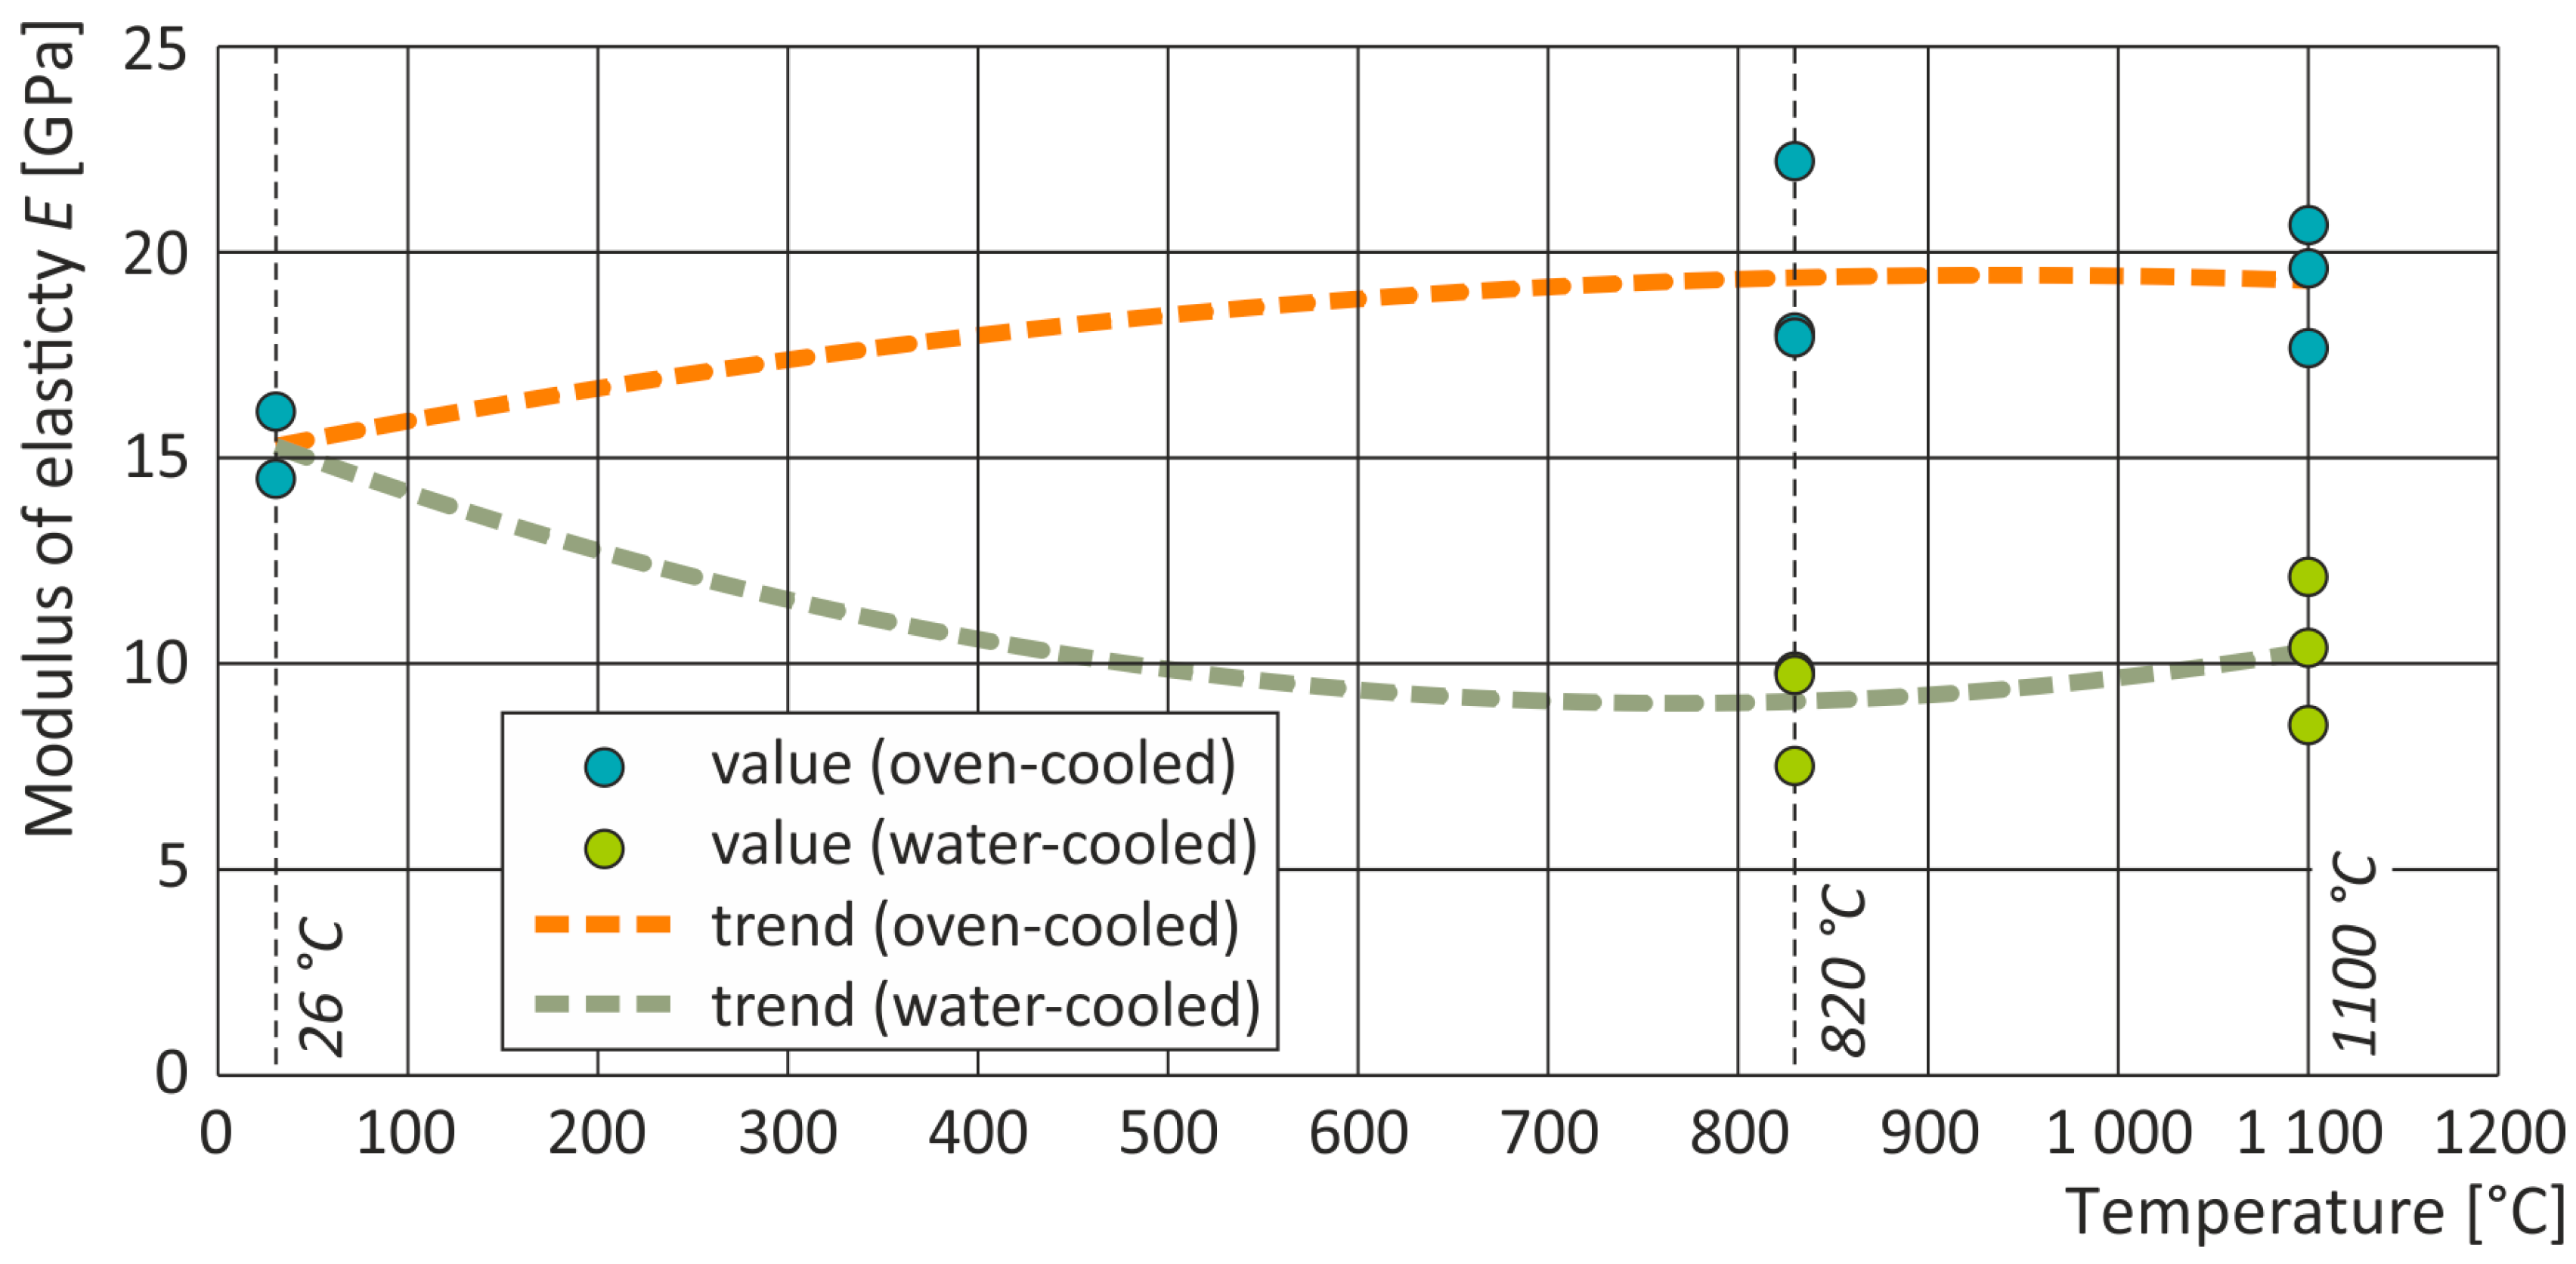
The Young’s modulus of unheated Marlstone Group 2 averaged 15.29 GPa, varying between 14.45 GPa and 16.13 GPa (95–106%). Heating to 820 °C increased values for furnace-cooled specimens to 19.41 GPa (127%), within 17.93 GPa to 22.34 GPa (117–146%), while water-cooled samples decreased to 9.12 GPa (60%), ranging from 7.47 GPa to 9.99 GPa (49–65%). At 1100 °C, furnace-cooled specimens maintained an average of 19.32 GPa (126%), spanning 17.67 GPa to 20.67 GPa (116–135%), whereas water-cooled samples averaged 10.31 GPa (67%), with values between 8.53 GPa and 12.07 GPa (56–79%). The dependence of Young’s modulus on temperature is presented in Figure 13.
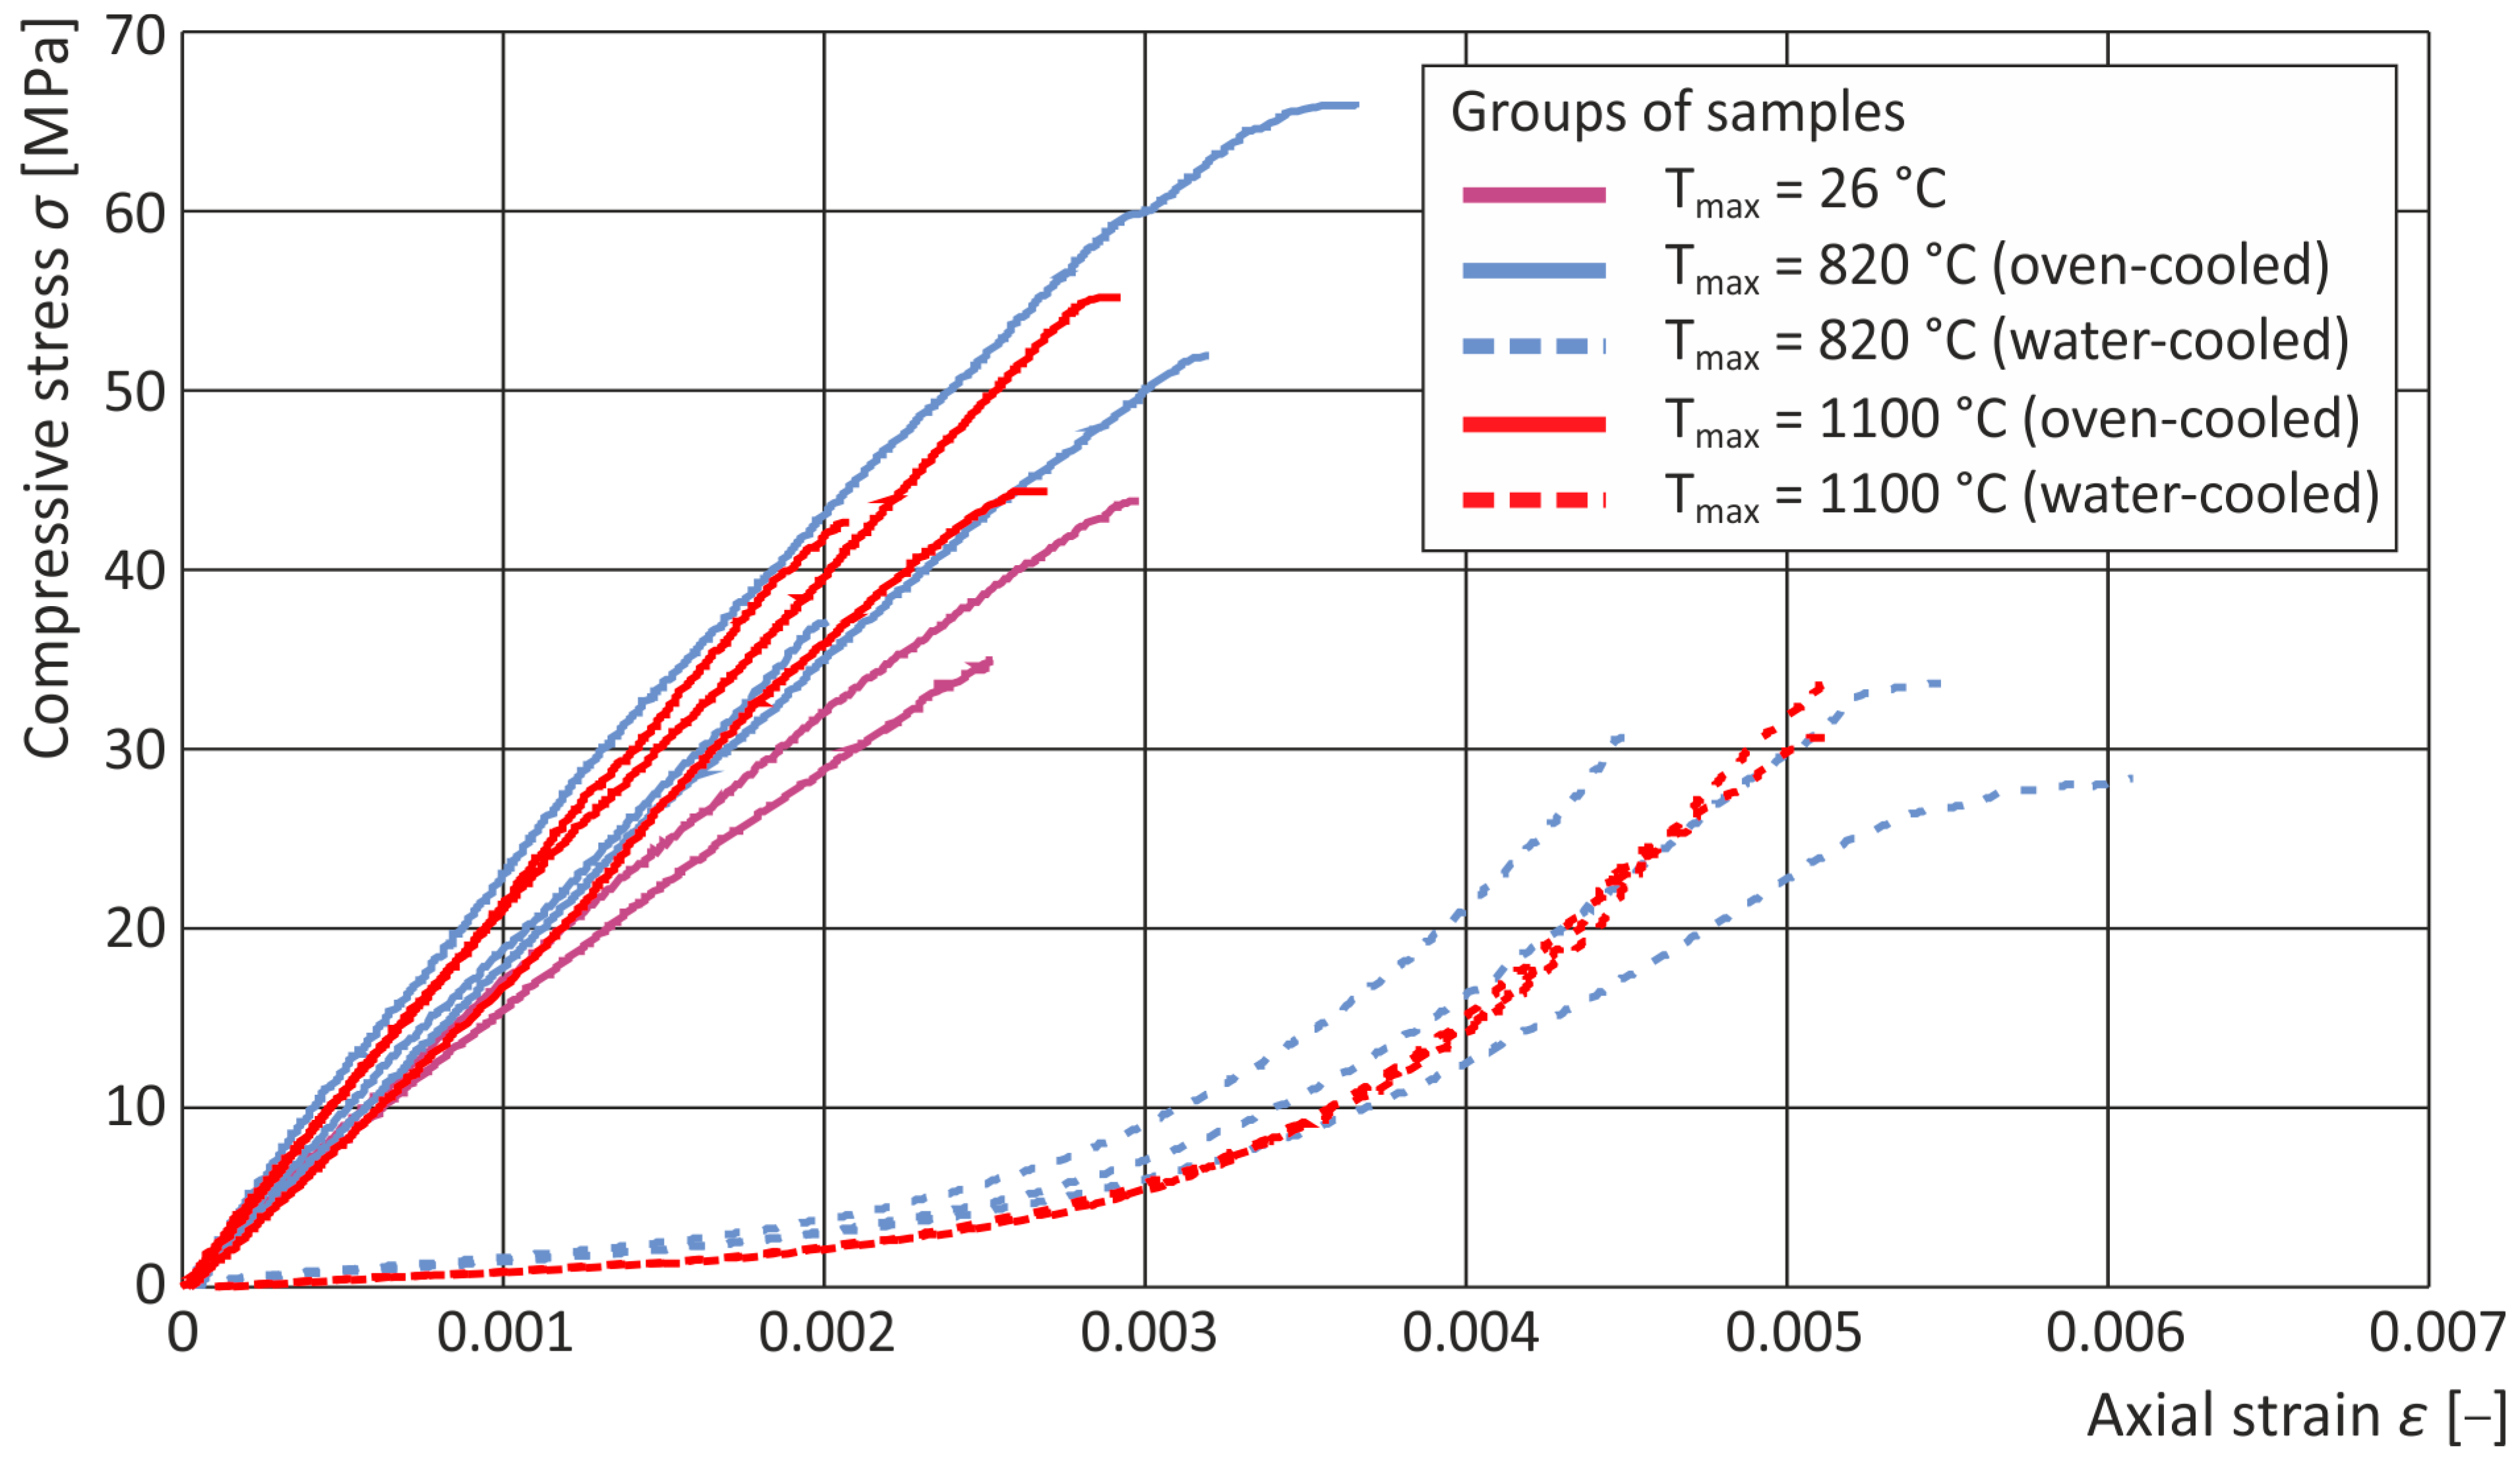
Table 9, Table 10 and Table 11 present the experimentally obtained values of compressive strength, axial strain, and Young’s modulus for Marlstone Group 2 specimens, together with their basic statistical evaluation. The tables summarize the measured results and highlight the variability of the mechanical response within the tested sample set. The stress–strain curves for individual specimens are illustrated in Figure 14, providing a visual comparison of behavior under load.

4.2.3. Statistical Analysis

For Marlstone Group 1, a significant effect of heating was found only for compressive strength (F (3, 12) = 5.532, p = 0.013). No significant differences were observed for axial strain (F (3, 12) = 3.005, p = 0.075) or Young’s modulus (F (3, 12) = 2.988, p = 0.075). Tukey’s post hoc test indicated that compressive strength significantly increased in samples heated at 870 °C (Mdiff = −26.056, adjusted p = 0.013) and at 1100 °C (Mdiff = −21.272, adjusted p = 0.043), whereas samples heated at 620 °C did not differ significantly from unheated samples (Mdiff = −11.217, adjusted p = 0.407).
One-way ANOVA showed that oven-cooled Marlstone Group 2 samples were not significantly affected by temperature in terms of compressive strength (F(2, 5) = 0.840, p = 0.485), axial strain (F(2, 5) = 0.373, p = 0.707), or Young’s modulus (F(2, 5) = 3.286, p = 0.123). In contrast, water-cooled samples exhibited significant temperature effects on axial strain (F(2, 5) = 12.27, p = 0.012) and Young’s modulus (F(2, 5) = 10.36, p = 0.017), but not on compressive strength (F(2, 5) = 3.207, p = 0.127). Post hoc tests revealed increases in axial strain after heating to 820 °C (Mdiff = −0.003, p = 0.013) and 1100 °C (Mdiff = −0.002, p = 0.013) and reductions in Young’s modulus at 820 °C (Mdiff = 6.167, p = 0.016) and 1100 °C (Mdiff = 4.979, p = 0.036). These results highlight that the effect of temperature is more pronounced in water-cooled specimens.
Two-way ANOVA confirmed that cooling method significantly influenced axial strain (F(1, 8) = 43.311, p < 0.001), specimen stress (F(1, 8) = 15.717, p = 0.004), and elastic modulus (F(1, 8) = 80.135, p < 0.001). Heating temperature showed no significant effect on axial strain (F(1, 8) = 0.898, p = 0.371), stress (F(1, 8) = 0.329, p = 0.582), or elastic modulus (F(1, 8) = 0.260, p = 0.624), and no significant interactions were found for axial strain (F(1, 15) = 0.025, p = 0.879), stress (F(1, 8) = 0.099, p = 0.761), or elastic modulus (F(1, 8) = 0.352, p = 0.569). Overall, the cooling method is the primary factor affecting the mechanical properties, with temperature effects mostly observable under water-cooling conditions.

4.3. Petrographic Analysis

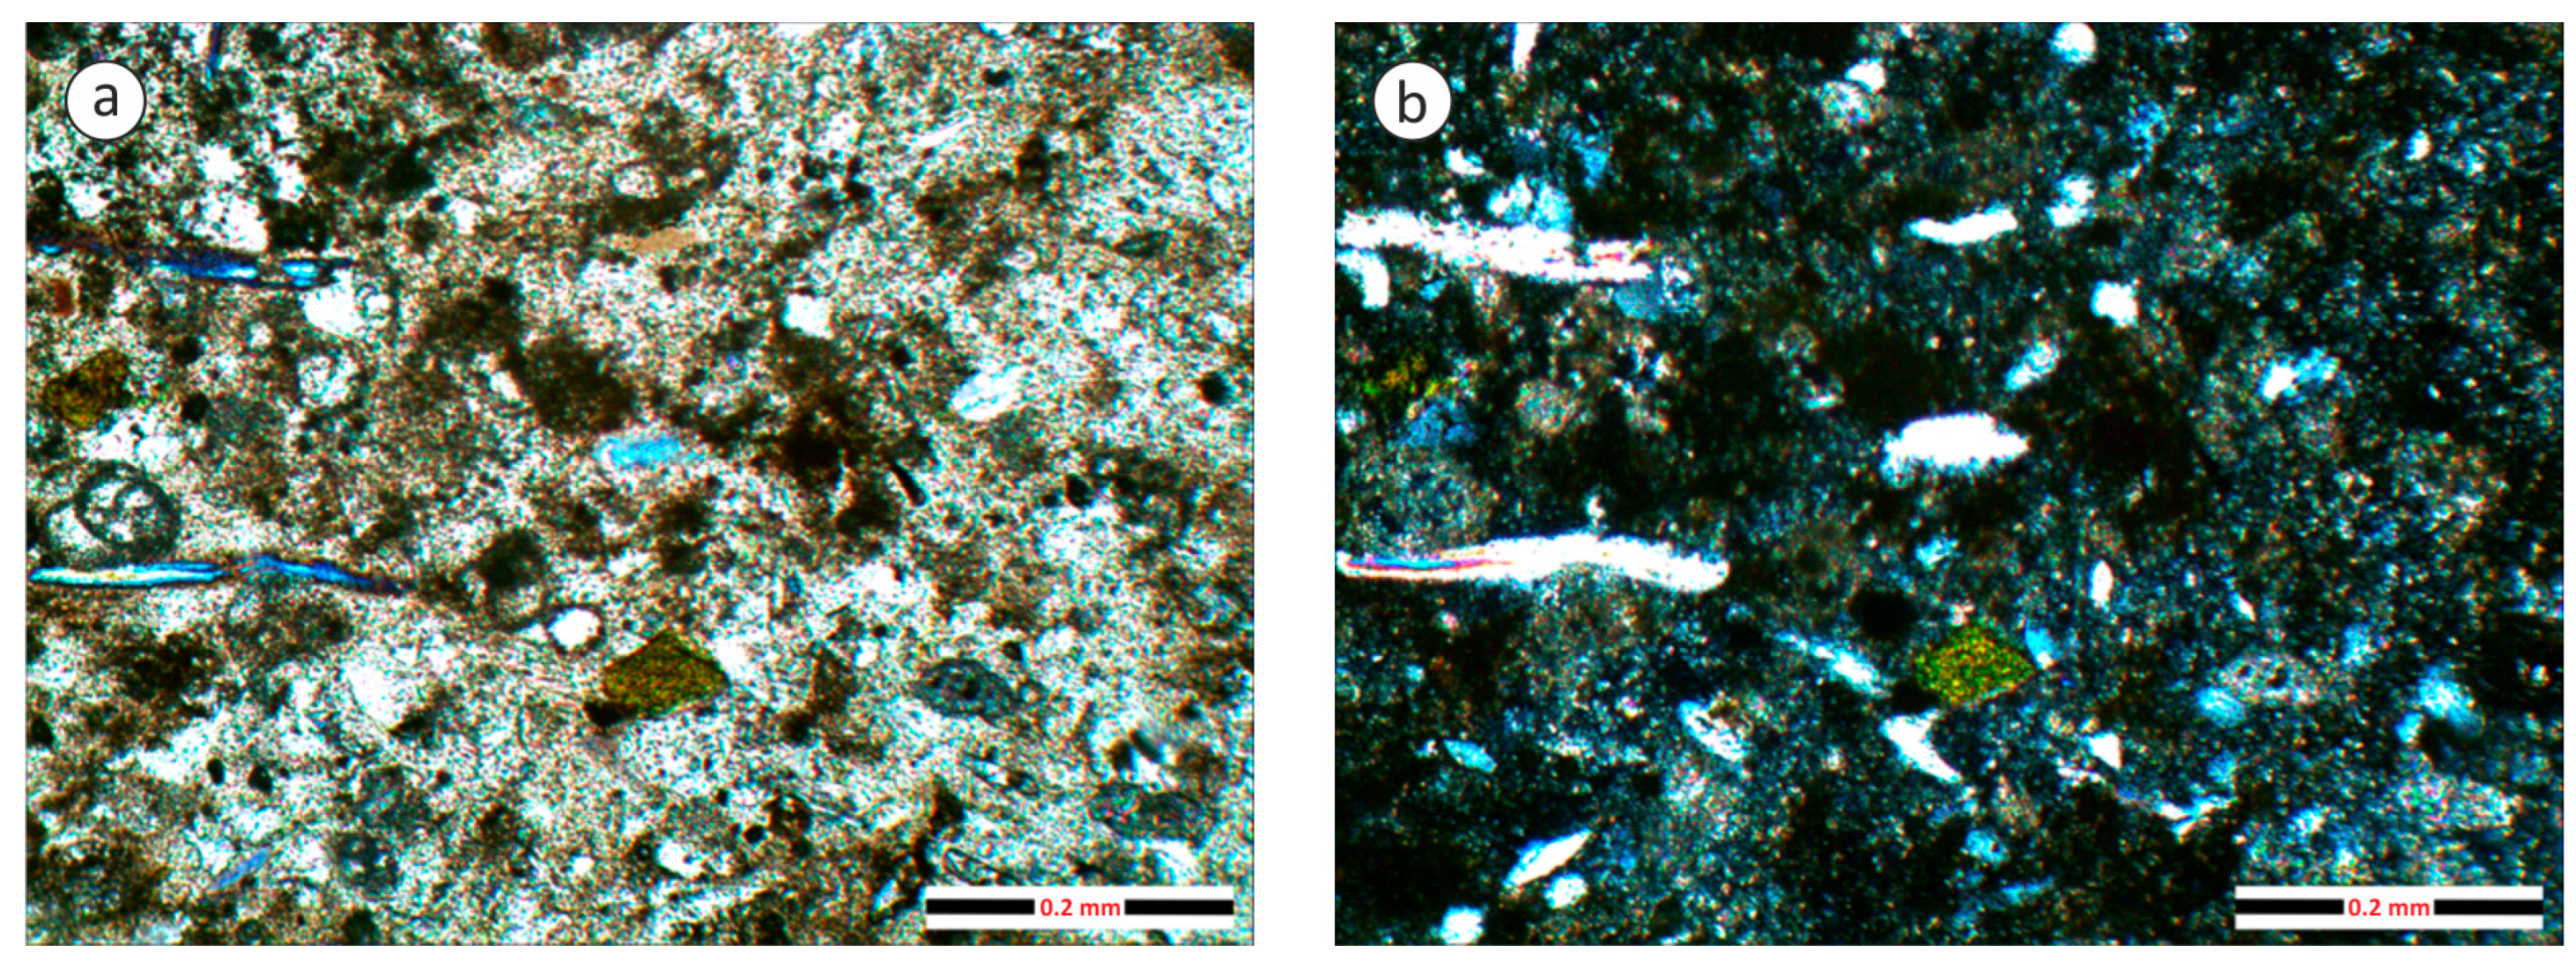
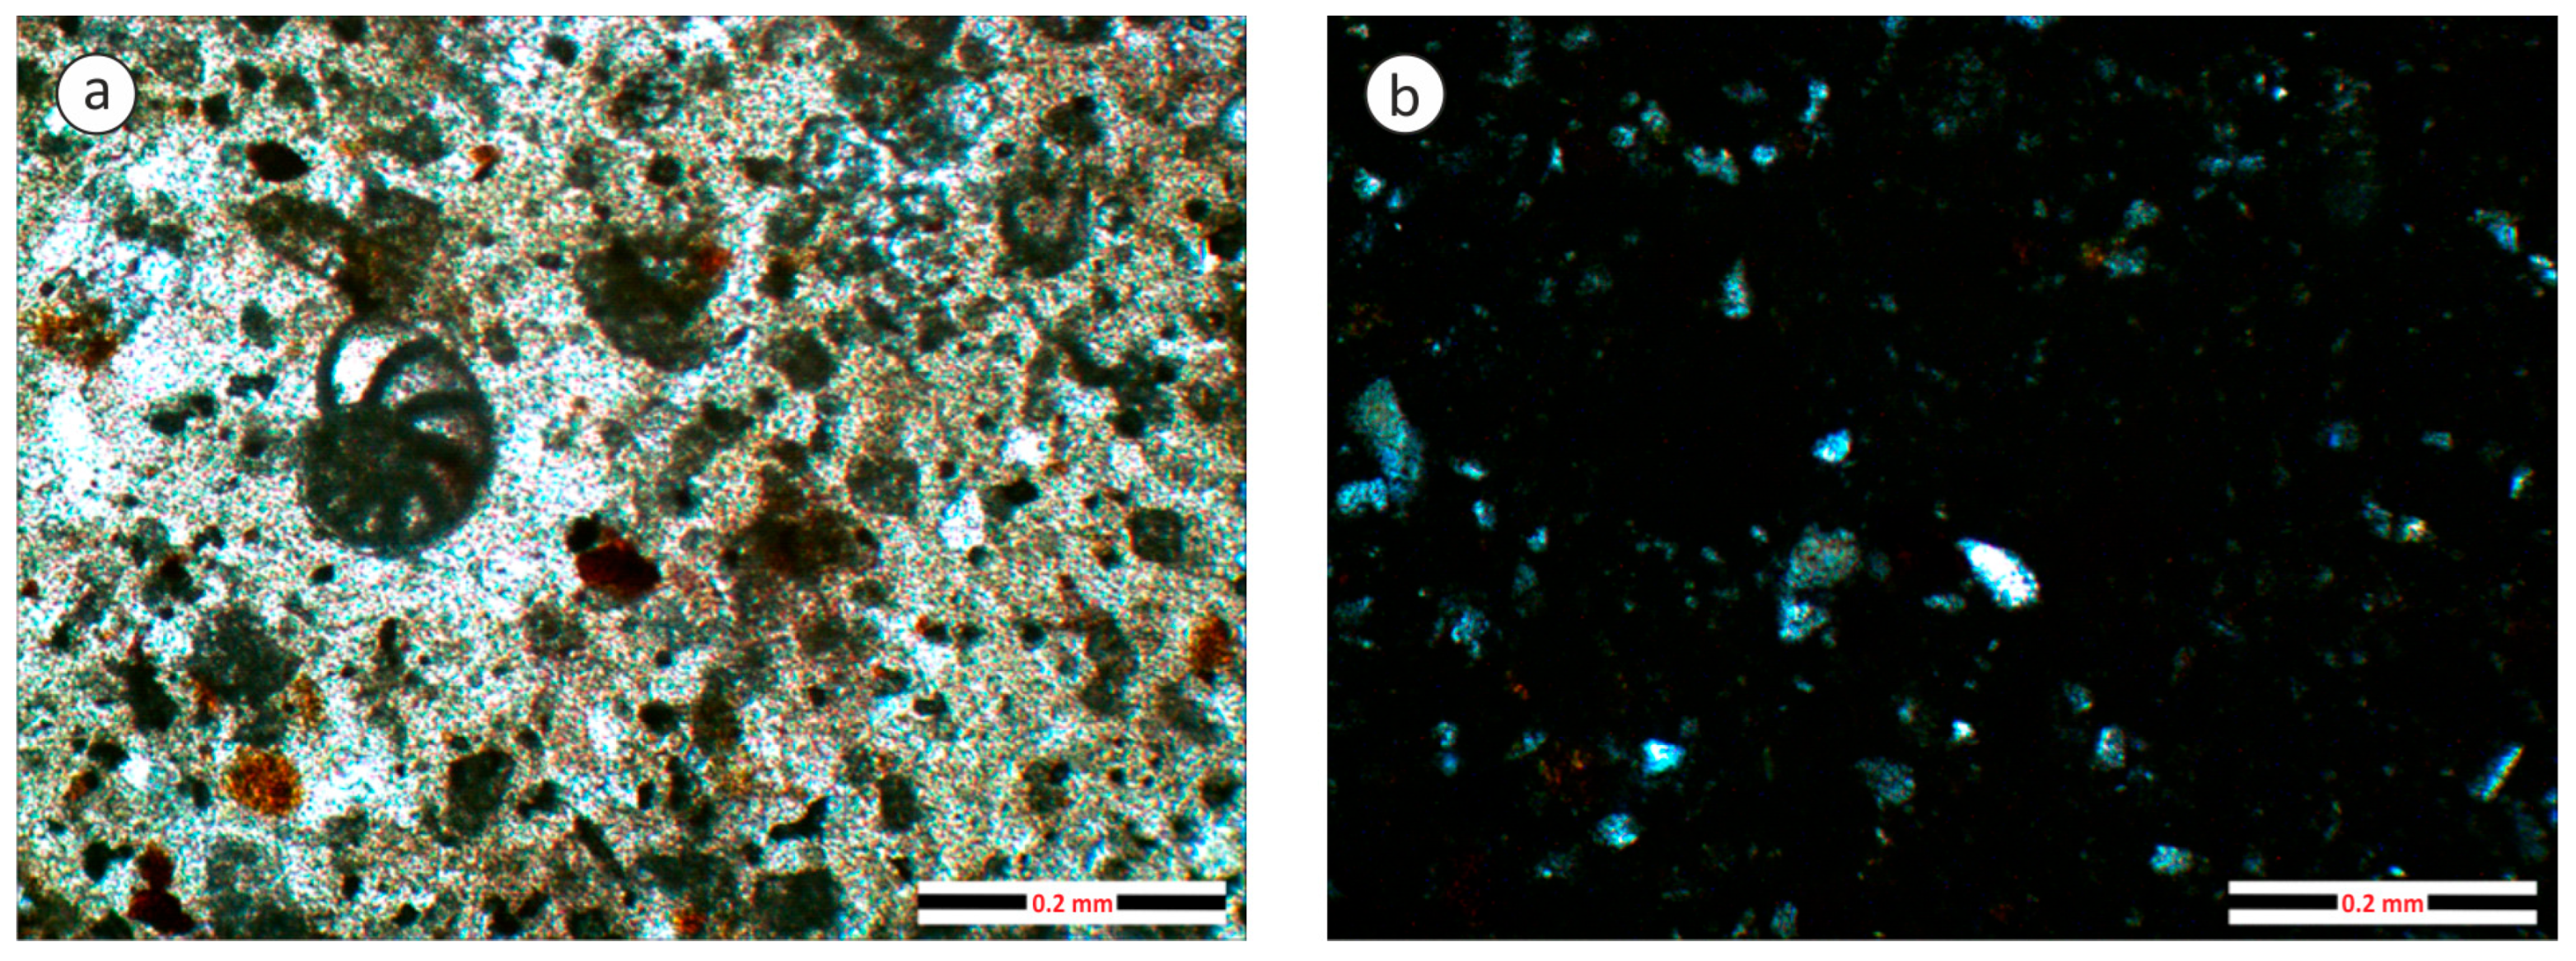
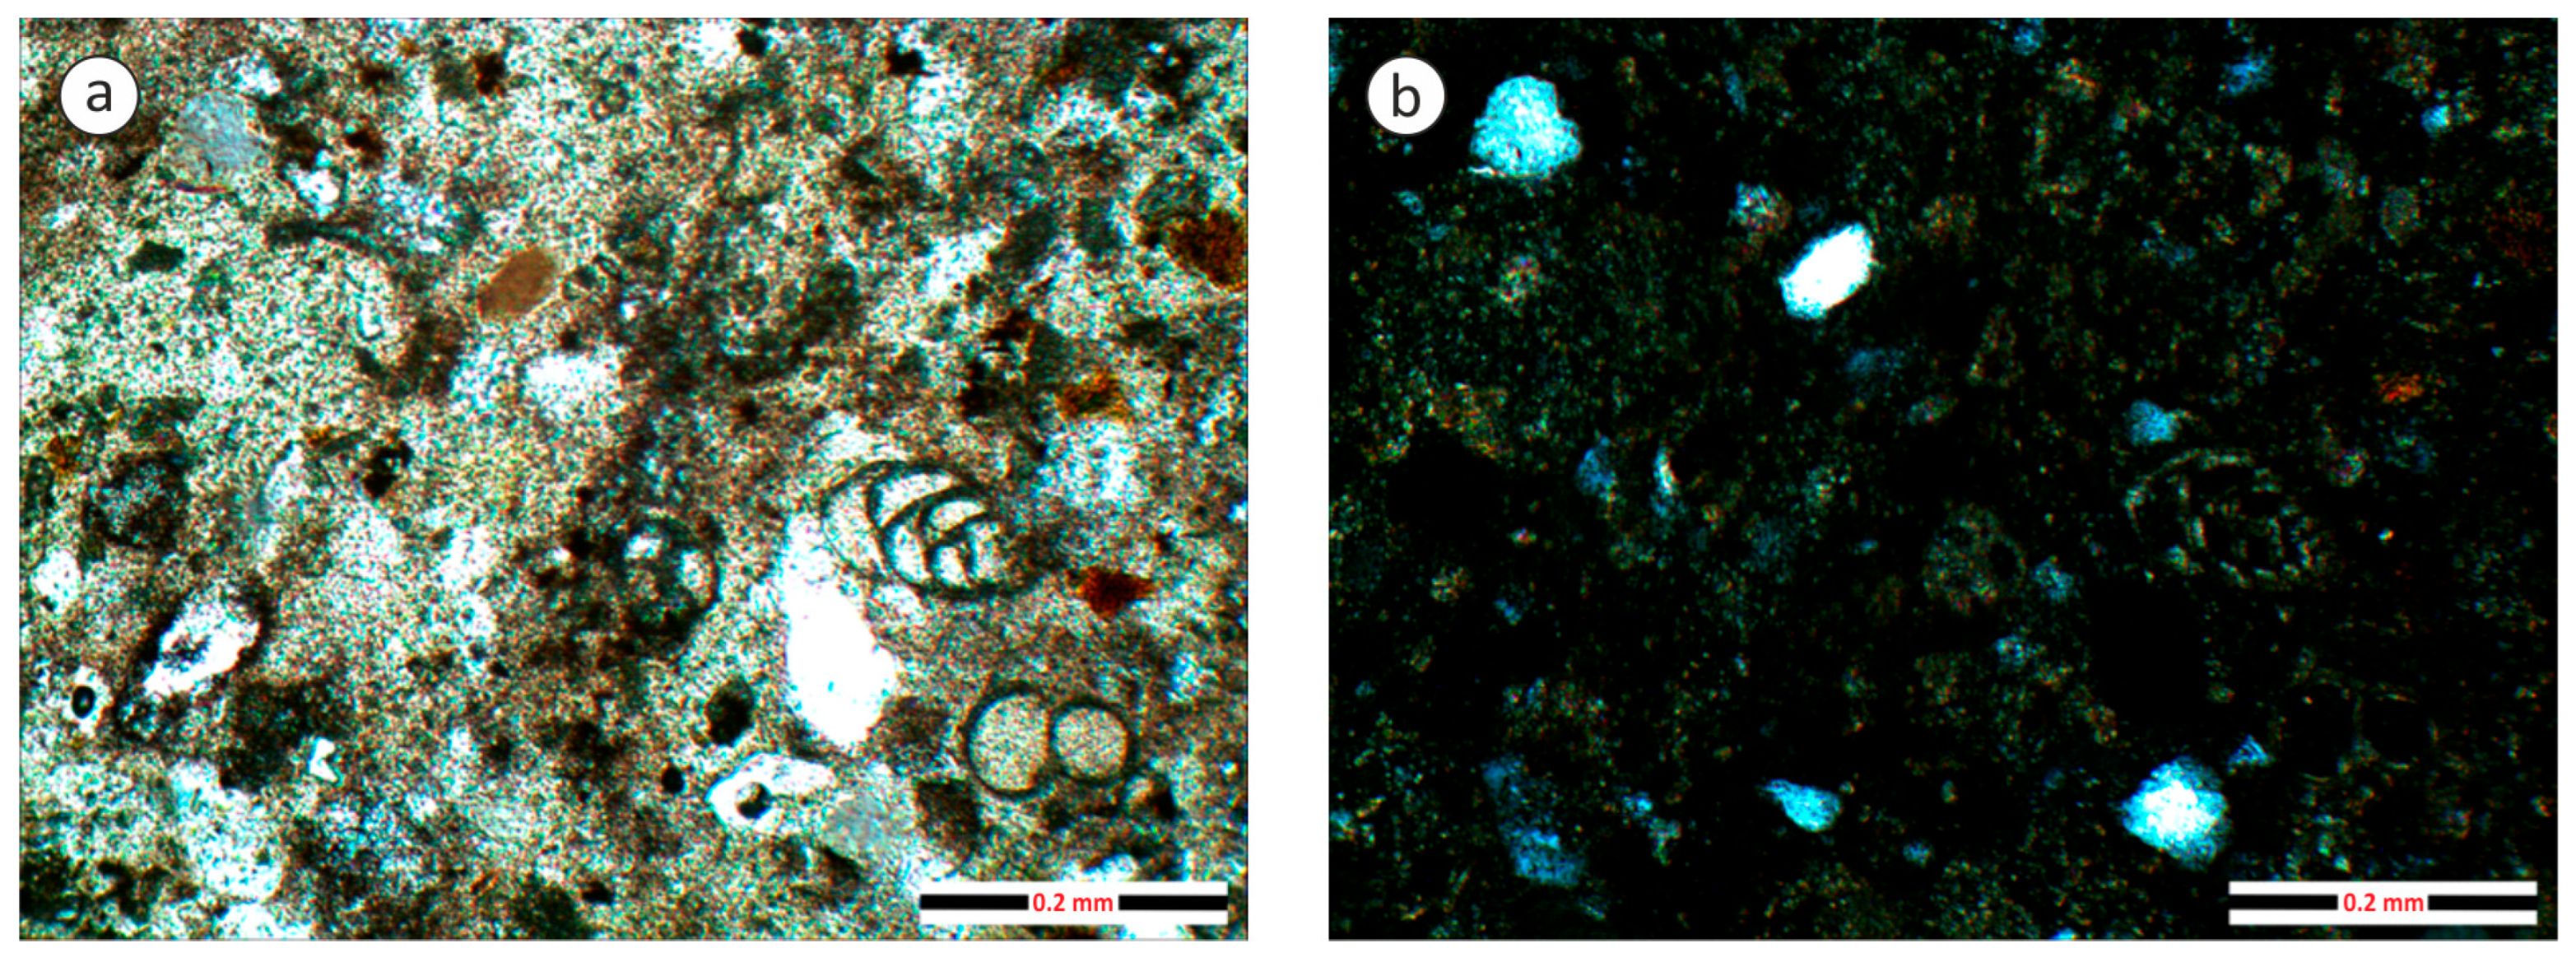
The conducted research confirmed the expected variability in petrographic composition and the associated heterogeneity of the rock material. The unheated marlstone (sample M1_13, Figure 15a,b) consists of dusty quartz grains, with significantly less frequent occurrences of muscovite, glauconite, and occasional potassium feldspar. The matrix consists of a mixture of clay minerals and carbonate residues with recrystallized spongia spicules. Microfossils are abundant. The thin section also shows the presence of a pigment consisting of iron oxyhydroxides, most likely limonite. The presence of CaCO3 was demonstrated by a strong reaction with hydrochloric acid.
As the temperature of the marlstone increases to 1100 °C, the minerals undergo several key transformations, leading to the formation of new mineral phases. Mineralogical changes can have an impact on the physical–mechanical properties of these rocks, in addition to structural changes. In the case of quartz, the transition from α quartz to β quartz occurs at a temperature of 580 °C to 595 °C [26], although this change is not detectable by the method used. Calcite begins to convert to calcium oxide slowly, but its decomposition accelerates rapidly once the temperature exceeds 750 °C [27]. Calcite was detected microscopically in all samples up to a temperature of 870 °C, where it was also confirmed by reaction with hydrochloric acid. Glauconite decomposes at a temperature of 900 °C and was not detected in samples heated to 1100 °C. Illite remains detectable even at 900 °C [26]. It undergoes dehydroxylation between 350 °C and 600 °C, while its remaining structure breaks down between 700 °C and 850 °C, leading to the formation of a liquid phase [28]. Muscovite undergoes transformation into dehydroxylated muscovite as structural water is lost at temperatures up to 600 °C [29]. However, due to the fine grain size of the material studied and the magnification used, these changes are not visible. The most significant transformation of iron-bearing minerals, such as limonite, occurs at elevated temperatures. At around 900 °C, a new mineral phase, hematite, forms while the previously present mineral phases disappear. Hematite, being relatively resistant to heat, represents the final reaction product of any iron-bearing oxyhydroxide exposed to high temperatures [26,29]. Thanks to the different optical properties of hematite, this change was observed.
The study of marlstone using a conventional polarizing microscope is difficult due to its very fine grain size. Nevertheless, the microscope photographs show some changes in the mineral composition of these rocks, described above, as a result of increasing temperatures. In the case of sample M1_9 (Figure 16a,b), which was heated to 620 °C, we can still detect the presence of calcite and other mineral phases, as in the case of the sample that was not subjected to heat. Calcite was also confirmed by reaction with hydrochloric acid.
In the case of sample M1_4 (Figure 17a,b), which was heated to 870 °C, calcite is not visible, but other minerals are still present. But calcite was also confirmed by reaction with hydrochloric acid.
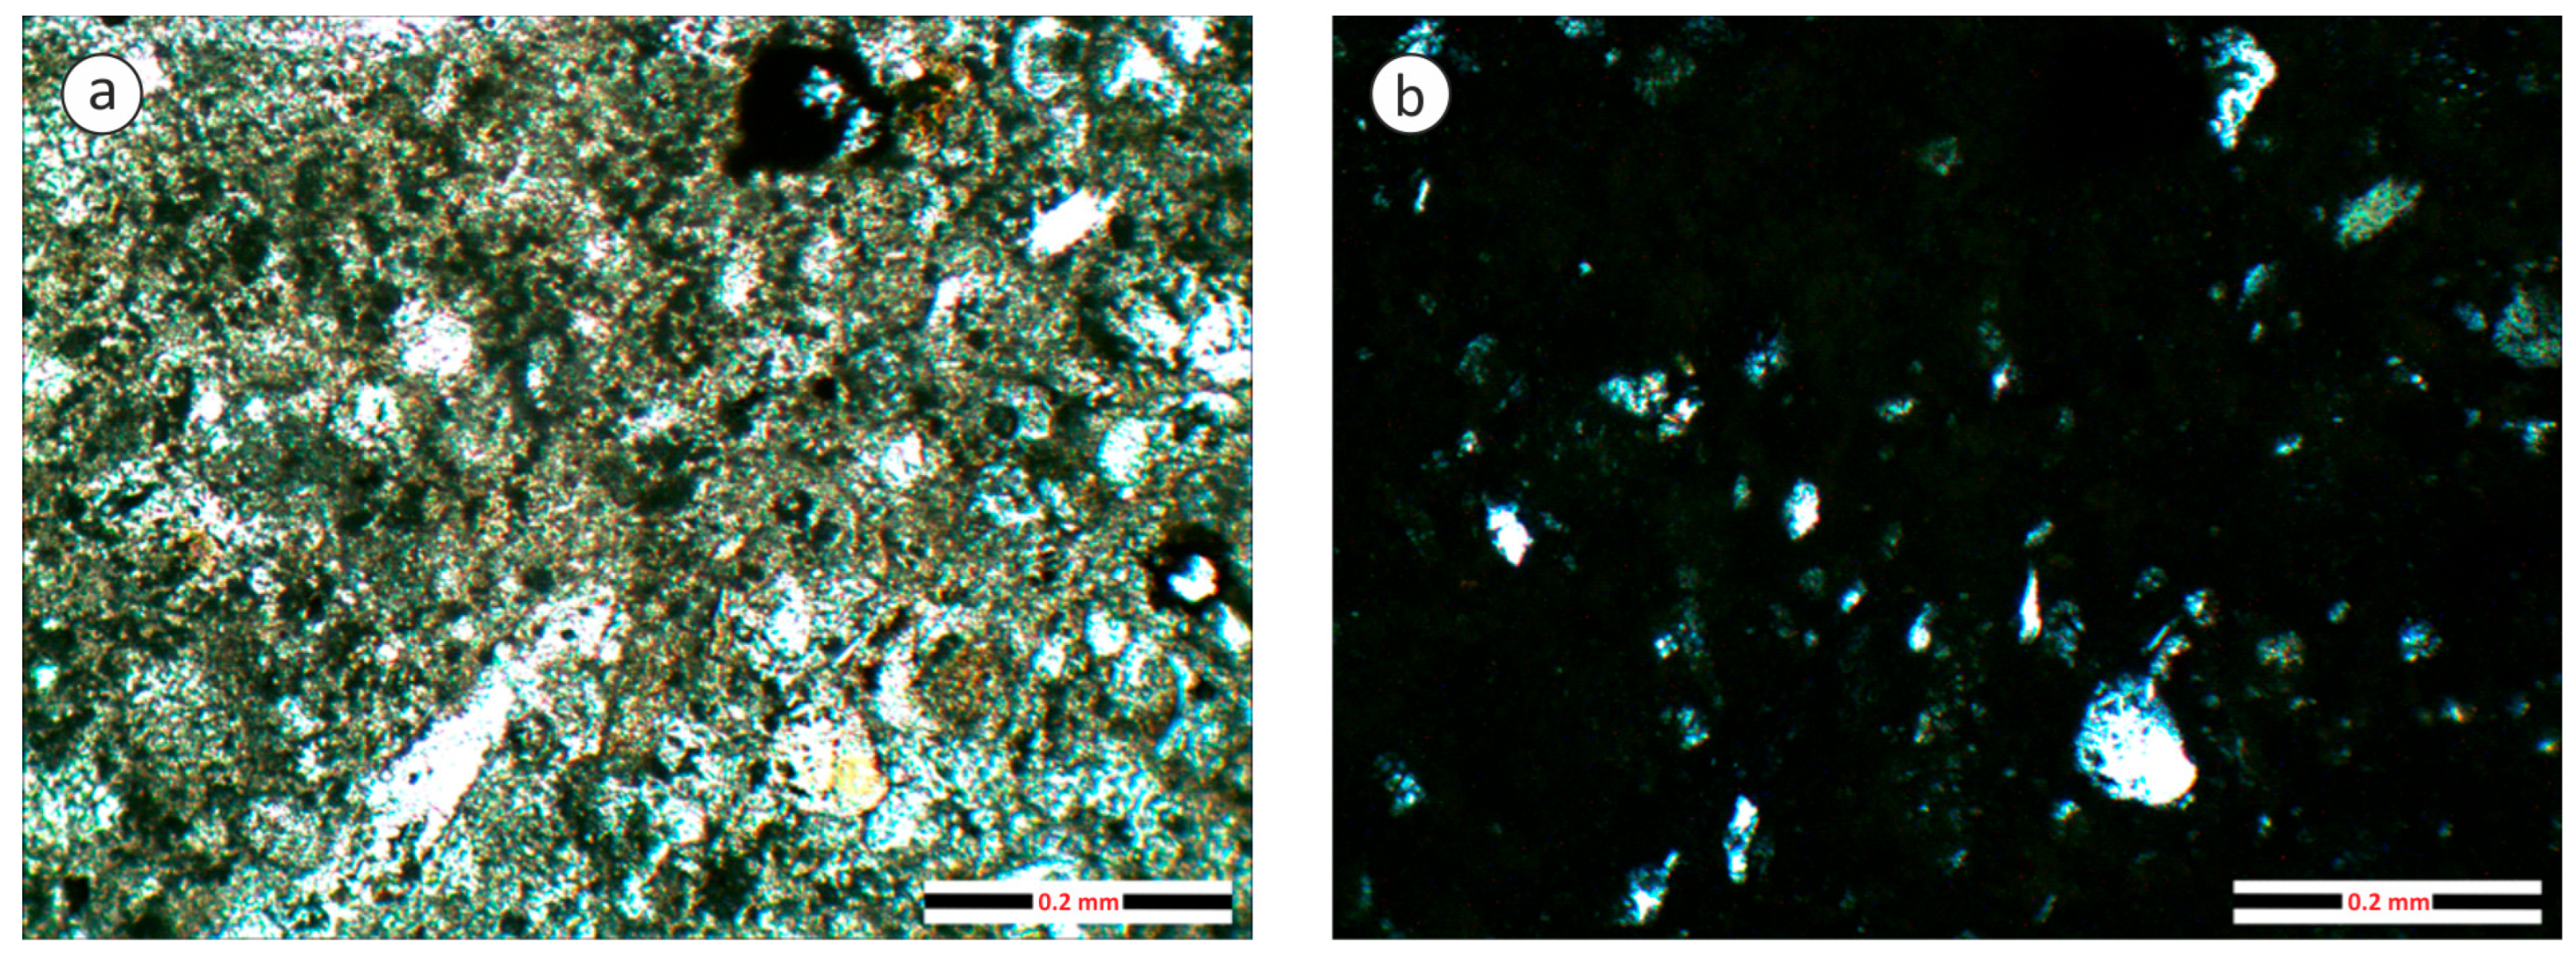
In the case of the last sample, M1_7 (Figure 18a,b), which was subjected to the highest temperature of 1100 °C, calcite was no longer detectable, even when reacted with hydrochloric acid. At the same time, the images show a change in limonite to hematite, which has a significantly darker color under a polarizing microscope. Muscovite and glauconite were also not detected. Mineral and structural changes in the matrix are also evident, but closer identification is not possible at the magnification used.
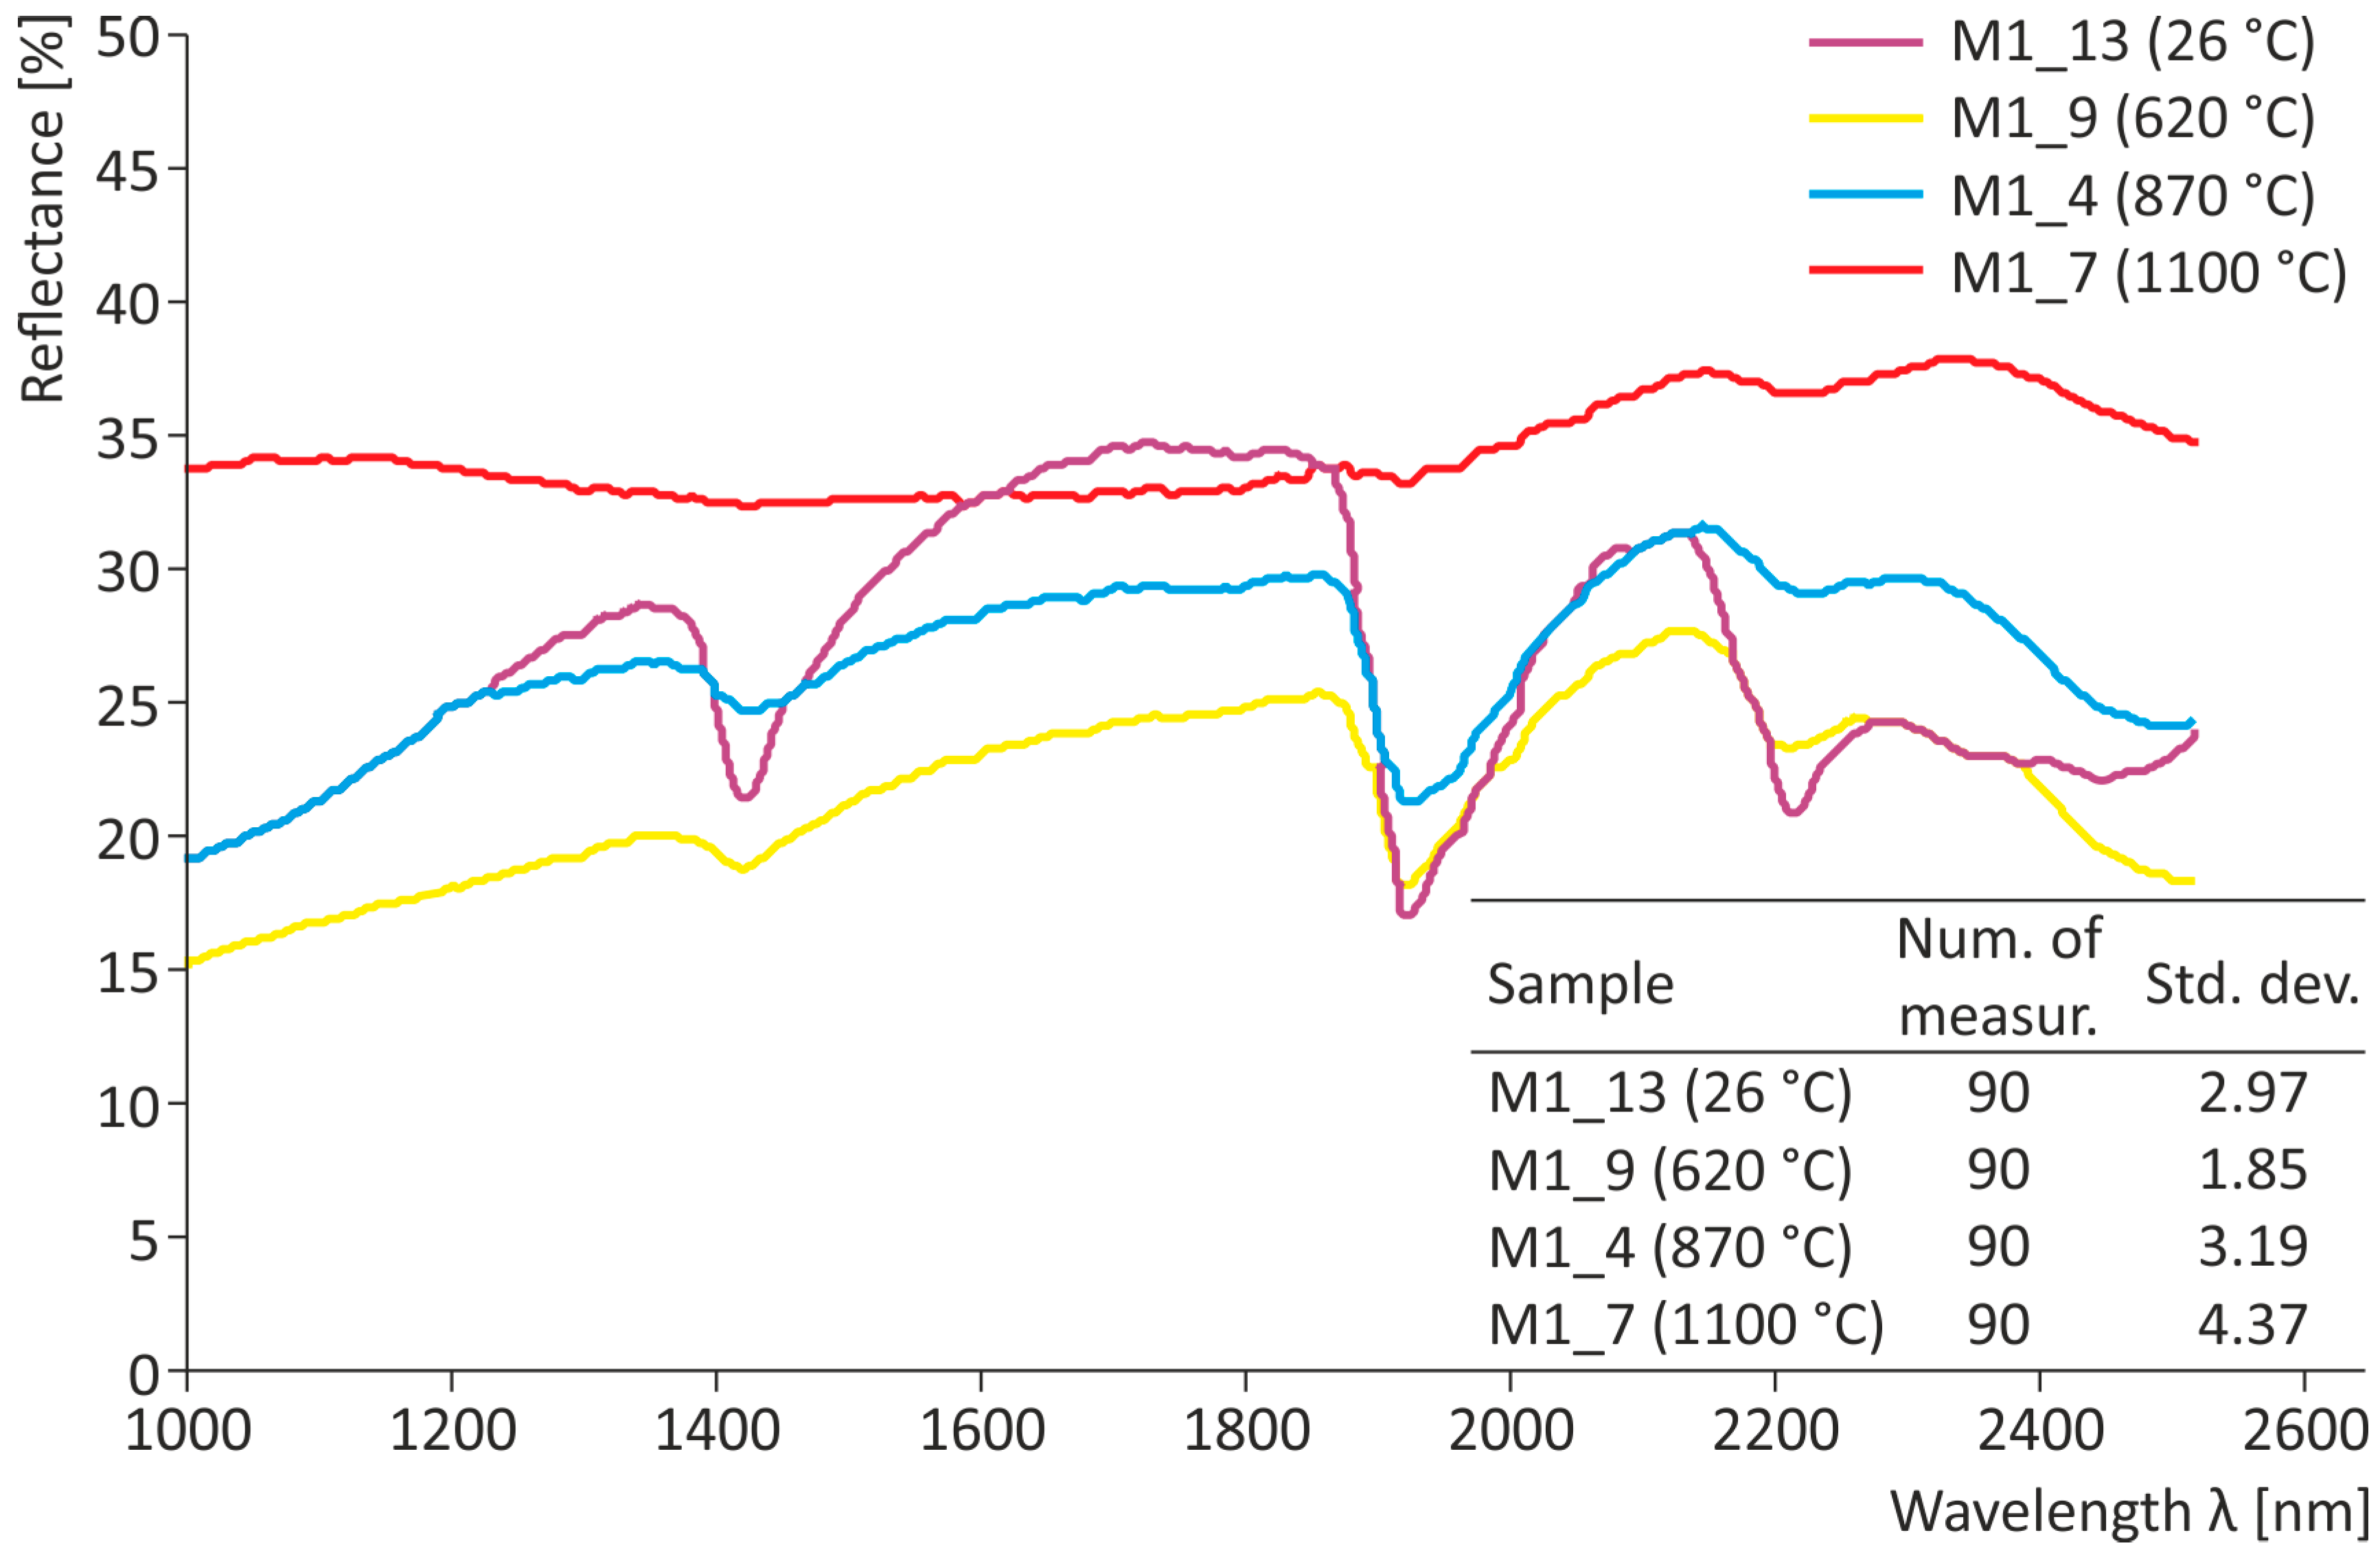
Reflectance spectrometry was employed in this study to test its applicability for detecting thermally induced mineralogical changes in marlstone. Although the method has known limitations and its interpretation can be challenging, the results demonstrate that mineral-related spectral changes are clearly detectable (Figure 19), particularly at wavelengths documented in previous studies [30,31]. In the Short-Wave Infrared (SWIR) region (1000–2500 nm), several distinct spectral features primarily influenced by their mineral composition are present. These absorption bands are linked to various chemical bonds such as OH, H2O, Al-OH, and Mg/FeOH, which are typical for the minerals commonly found in marlstones in varying amounts. The Al-OH absorption band, around 2200 nm, is typically associated with clay minerals like kaolinite and illite. Finally, calcite and dolomite can be identified by the CO32− absorption band around 2300 nm [30,31]. The spectral reflectance curves are presented in Figure 19.
The purple curve (M1_13, 26 °C) has a completely different shape in terms of both slope and absorption minima and maxima at a given wavelength. The curves’ difference in the wavelength range from 1000 to 1300 nm may be caused, among other things, by the thermal transformation of iron oxyhydroxides. In this band, the minerals magnetite and goethite (a component of limonite) have an identifiable, different curve [24]. Moreover, sample M1_13 shows very strong absorption dips at 1400 nm, 1900 nm and 2200 nm. The changes in these dips in yellow (M1_9, 620 °C), blue (M1_4, 870 °C) and red curves (M1_7, 1100 °C) prove the processes of dehydration, dehydroxylation and breakdown of clay minerals. Furthermore, the red curve (M1_7, 1100 °C) shows the pyrolysis of calcite, which has an absorption band at 2337 nm [32].
The red curve (M1_7, 1100 °C) shows changes in both mineral and structural composition. In this case, heating the marlstone certainly leads to a change in internal structure and porosity, as is the case with ceramic raw materials with a similar mineral composition. The firing process causes an overall increase in the reflectance of the material studied.

4.4. Elemental Concentrations Analysis (X-Ray Fluorescence)

Elemental concentration analysis using X-ray fluorescence (XRF) was performed to quantify the bulk chemical composition of the samples and to support the interpretation of thermally induced mineralogical transformations inferred from petrographic and spectroscopic observations. Due to limitations in analytical resources, XRF measurements were conducted exclusively on samples from Group M1, which were selected as representative of the studied marlstone material.
The results of the elemental composition of samples exposed to increasing temperatures (620, 870, and 1100 °C) are presented in Table 12.
The most pronounced shift in elemental composition was observed in the samples exposed to 1100 °C. Compared with the samples at 26 °C, the SiO2 content decreased by 3.85%, which may indicate partial structural or mineralogical transformation at the highest temperature. In contrast, CaO increased by 4.45%, suggesting enhanced decomposition of calcium-bearing phases. The increase in CaO concentration at 1100 °C indicates calcite pyrolysis, as Ca is no longer bound within CaCO3, a process corroborated by petrographic observations and reflectance spectrometry. A moderate decrease was also recorded for Al2O3 (−1.39%), while SO3 exhibited a slight increase of 0.25%. These variations confirm that thermal exposure at 1100 °C leads to the most significant reorganization of the material’s chemical composition.
Much smaller elemental changes were found in samples exposed to 870 °C compared with the control samples (26 °C). The SiO2 content decreased by 1.18%, while CaO increased by only 0.46%, indicating that decomposition of calcium-bearing phases was roughly ten times lower than in the 1100 °C samples. The decrease in Al2O3 (−0.29%) was approximately four times lower than at 1100 °C, whereas SO3 increased by 0.64%, which is about three times higher than the increase observed in the 1100 °C samples. However, this change could also reflect a possible organic-related origin of SO3 and, consequently, the natural heterogeneity of organic components within marlstone, which is common in such materials.
In contrast, the samples treated at 620 °C displayed an opposite trend: SiO2 increased by 0.66%, while CaO decreased by 0.50%. These opposing changes suggest that moderate heating at 620 °C induces different mineralogical reactions than those occurring at higher temperatures (870 °C and 1100 °C), resulting in divergent compositional shifts.

4.5. Color Change Analysis

4.5.1. Marlstone Group 1

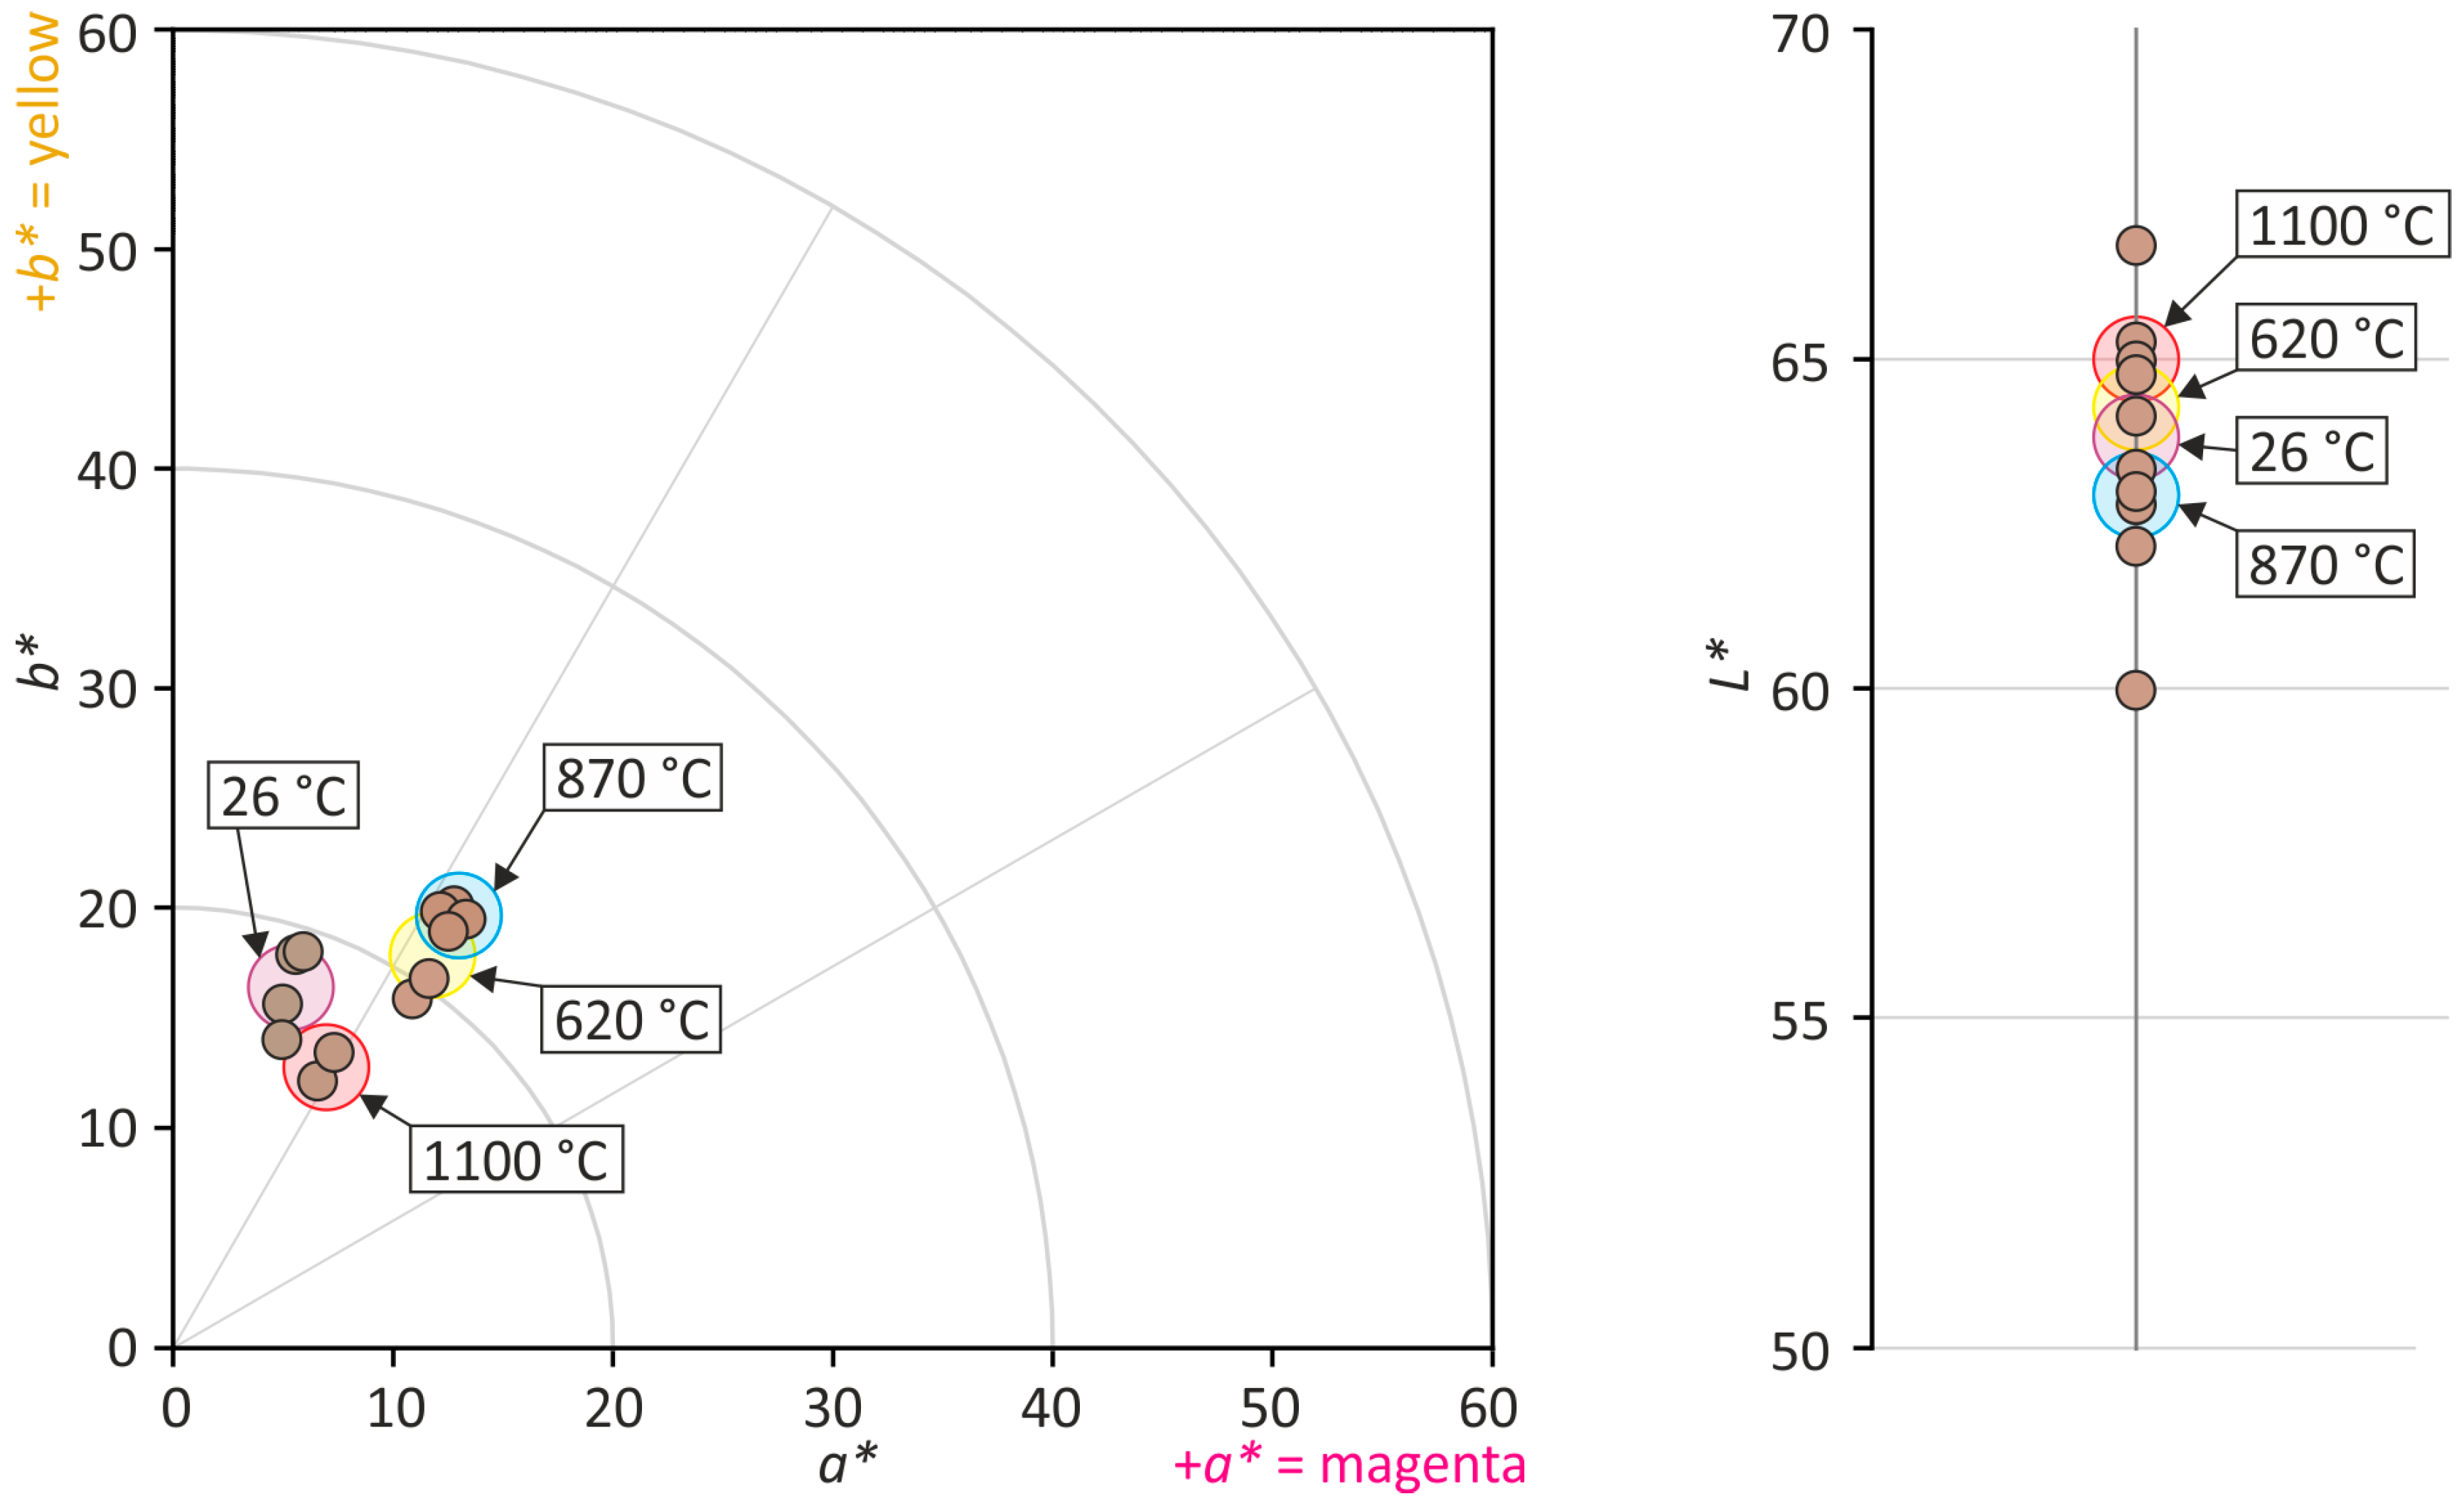
The evolution of L*, a*, and b* values with increasing temperature is shown in Figure 20 and Table 13. Lightness (L*) exhibited a slight increase from 63.75 in the reference samples to 64.22 at 620 °C, followed by a minor decrease to approximately 62.98 at 870 °C. After heating to 1100 °C, L* rose again to 64.91. The a* parameter, strongly influenced by iron oxide-bearing minerals, increased substantially from 5.34 to 11.80 at 620 °C and further to 12.97 at 870 °C. At 1100 °C, however, it decreased to 6.96. The b* parameter showed a similar pattern, rising from 16.37 to 17.85 (620 °C) and 19.53 (870 °C), before dropping to 12.74 at 1100 °C. The color difference (ΔE*) varied only moderately: it averaged 7.06 after 620 °C, increased to 8.49 after 870 °C, and decreased to 4.19 after heating to 1100 °C.

4.5.2. Marlstone Group 2

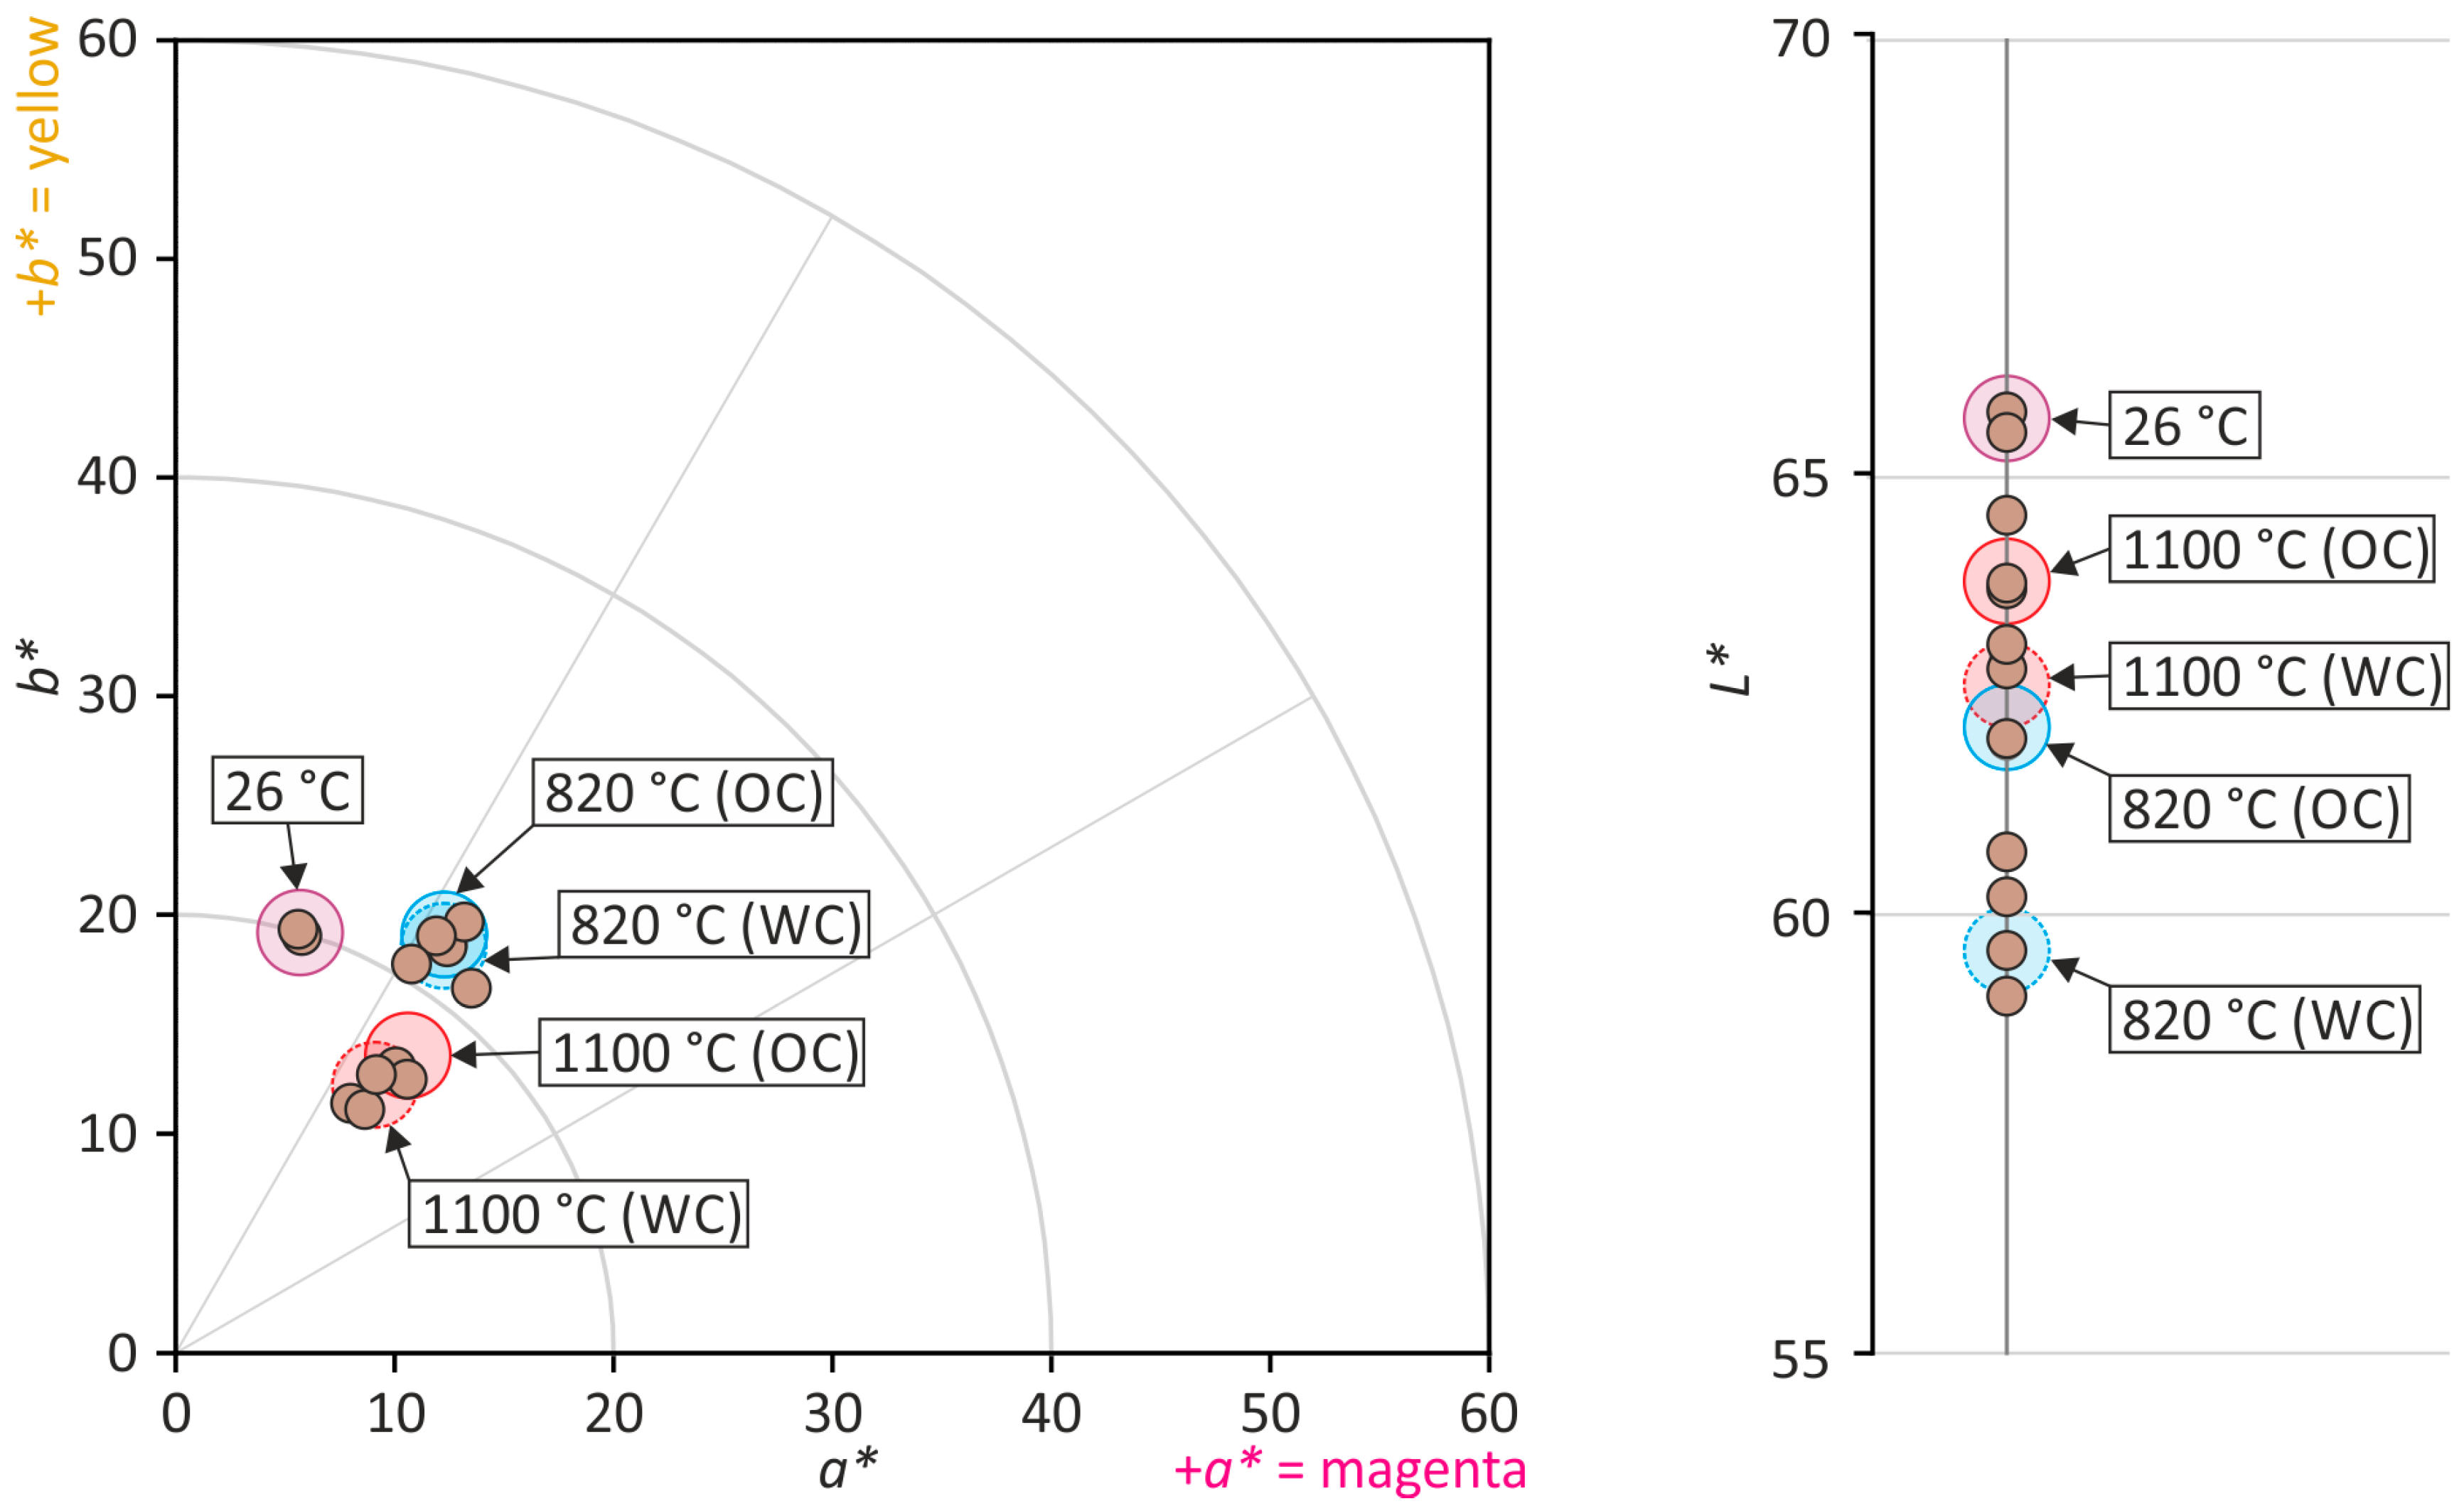
The L*, a*, and b* values measured at different temperatures are illustrated in Figure 21 and Table 14. Lightness (L*) decreased from an initial value of 65.64 to 62.16 after heating to 820 °C in oven-cooled samples and to 59.62 in water-cooled samples. At 1100 °C, L* increased slightly again—reaching 63.81 for oven-cooled and 62.59 for water-cooled specimens. The a* parameter remained positive and rose from 5.67 to 12.16 at 820 °C for both cooling methods. After heating to 1100 °C, it decreased to 10.70 (oven-cooled) and 9.24 (water-cooled). The b* parameter declined from the reference value of 19.19 to 18.69 (oven-cooled) and 18.83 (water-cooled) at 820 °C, and further to 13.58 and 12.16, respectively, at 1100 °C. The overall color difference (ΔE*) changed only slightly: it reached 7.46 and 8.86 after 820 °C and 8.35 and 8.56 after heating to 1100 °C.
The evolution of the CIELab parameters broadly follows the temperature range in which mineralogical changes were identified by petrographic and spectroscopic analyses. However, the observed color variations cannot be attributed solely to thermal transformations. In several cases, samples measured at 26 °C and after heating to 1100 °C exhibit very similar L* values, suggesting that average color differences may be strongly influenced by the intrinsic heterogeneity of the marlstone. Notably, the L* values of samples M1_13, M1_9, M1_4, and M1_7 correspond with trends observed in reflectance spectrometry, although increased reflectance may also result from differences in particle size, as documented in previous studies [33,34] and supported by microscopic observations of variable grain size. Certain changes may further relate to transformations of iron-bearing phases, such as the limonite-to-hematite transition, which becomes significant around 900 °C and is associated with a darker optical appearance under the microscope. Overall, the variability among individual samples across temperatures indicates that both thermally induced mineralogical changes and the natural heterogeneity of marlstone contribute to the measured CIE Lab* parameter variations.

5. Conclusions

The results demonstrate that the mechanical and optical properties of marlstone are strongly affected by thermal loading, with the material response governed by both lithological characteristics and the applied cooling regime. Marlstone Group 1 exhibited a systematic increase in compressive strength with increasing temperature, reaching statistical significance at 870 °C and 1100 °C, whereas variations in axial strain and Young’s modulus remained statistically insignificant. This indicates that elevated temperatures primarily enhanced strength while inducing only limited changes in deformability and stiffness for this lithotype.
In contrast, Marlstone Group 2 showed a markedly different response. Under furnace-cooling conditions, temperature had no statistically significant effect on compressive strength, axial strain, or Young’s modulus. However, rapid water quenching resulted in a pronounced increase in axial strain accompanied by a substantial reduction in elastic modulus, highlighting the critical role of thermal shock-induced damage. Two-way ANOVA further confirmed that the cooling method represents the dominant factor controlling the mechanical behavior, whereas the direct influence of temperature alone is comparatively limited.
The increase in strength during heating is probably related to the sintering process, as in the manufacture of ceramics. Materials containing clays, quartz, and calcite are also used in the manufacture of ceramics. Although, as a rule, an increase in temperature leads to the cracking of quartz or feldspar grains [26,35], it appears that a change in the chemical and structural composition of the clay–carbonate matrix and limonite pigment leads to an improvement in strength characteristics.
The changes in compressive strength are probably caused by the formation of new mineral phases, such as gehlenite and anorthite, but these could not be identified using the methods applied; however, it can be assumed based on the mineral composition of the rock samples studied [36,37,38]. Jordán et al. [37] reported the presence of gehlenite in the studied samples at temperatures of 950 °C, while above 1050 °C, he did not detect this mineral.
The question is whether the increase in strength after heating is a permanent phenomenon. Hajpál and Török [26] documented the origin of portlandite within their research on calcite-cemented sandstones. After the decomposition of calcite at 900 °C to CaO, a new mineral phase, portlandite, was detected after leaving the samples at room temperature for two hours at about 45% relative humidity. This mineral is a reaction product of air humidity (water) and CaO. They also state that the formation of this secondary mineral phase is associated with a volume increase of 20% on average and leads to the disintegration of cylindrical sandstone specimens.
Petrographic analyses confirmed changes in the mineralogical composition of marlstone, specifically the transformation of CaCO3 to CaO and the transition of iron oxyhydroxides (limonite and goethite) to hematite. Corresponding changes in mineralogical and structural characteristics were also identified by reflectance spectrometry. However, considering the heterogeneous nature of the studied material, the application of additional techniques (e.g., differential thermal analysis or electron microscopy) would be beneficial for a more detailed future assessment of mineralogical transformations.
Elemental analysis using the Xepos XRF system revealed clear temperature-dependent changes in the material’s composition. The greatest alterations occurred at 1100 °C, where SiO2 and Al2O3 decreased significantly, while CaO and SO3 increased. Samples heated to 850 °C showed similar but much weaker shifts, indicating substantially less extensive thermal decomposition. In contrast, samples exposed to 620 °C exhibited opposite trends, with an increase in SiO2 and a decrease in CaO, suggesting distinct mineralogical reactions at moderate temperatures compared with high-temperature treatments.
CIELab color analysis indicated that thermal exposure induced only moderate color changes in both marlstone types. The most pronounced variations were observed in the a* and b* parameters, reflecting temperature-dependent mineralogical transformations, while overall color differences (ΔE*) remained relatively limited across the investigated temperature range. Collectively, the results underscore the complex and non-linear response of marlstone to high temperatures, with mechanical degradation being significantly intensified under rapid cooling conditions.
Building on the findings of this study and the identified limitations, future research will aim to further improve the understanding of fire-induced changes in marlstone. The planned work will focus on a comparative analysis of marlstone samples before and after thermal exposure, using advanced techniques such as scanning electron microscopy (SEM), X-ray diffraction (XRD), and Fourier-transform infrared spectroscopy (FTIR). These methods will allow detailed observation of microcrack development, grain boundary alterations, and other thermally induced structural changes. Together, these analyses will facilitate the detection of subtle mineralogical and chemical alterations that may not be evident through conventional testing methods, leading to a more comprehensive understanding of the physical and chemical processes responsible for the changes occurring in marlstone at elevated temperatures.


Author Contributions

Conceptualization, R.Z. and E.J.; methodology, R.Z., E.J., K.K. and P.R.; resources, E.J., K.K. and T.Č.; experimental investigation, E.J., R.Z., K.K., E.M. and P.R.; data processing, E.J., K.K., E.M. and P.R.; writing—original draft preparation, E.J., R.Z., K.K., P.R. and T.Č.; writing—review and editing, R.Z.; supervision, R.Z.; project administration, R.Z.; funding acquisition, R.Z. All authors have read and agreed to the published version of the manuscript.
Funding

This research was funded by internal CTU grant SGS25/010/OHK1/1T/11, “Residual properties of selected building materials after fire”.

Data Availability Statement

The original contributions presented in this study are included in the article. Further inquiries can be directed to the corresponding author.

Acknowledgments

The authors would like to thank the Department of Architectural Engineering at the Faculty of Civil Engineering, CTU in Prague, for kindly providing the marlstone material essential for the experimental work.

Conflicts of Interest

The authors declare no conflicts of interest.

Abbreviations

The following abbreviations are used in this manuscript:
UCSUniaxial compression test
DICDigital image correlation
MSymbol for marlstone samples
ANOVAAnalysis of variance
HSDHonestly significant difference
XRFX-ray fluorescence
SEMScanning electron microscopy
XRDX-ray diffraction
FTIRFourier-transform infrared spectroscopy

References

  1. Rong, G.; Peng, J.; Yao, M.; Jiang, Q.; Wong, L.N.Y. Effects of specimen size and thermal-damage on physical and mechanical behavior of a fine-grained marble. Eng. Geol. 2018, 232, 46–55. [Google Scholar] [CrossRef]
  2. Zhang, Y.; Ta, X.; Qin, S. Effect of heat treatment on physico-mechanical behaviour of a natural building stone: Laizhou dolomite marble. J. Build. Eng. 2022, 47, 103885. [Google Scholar] [CrossRef]
  3. Li, P.; Zhou, S.; Zhang, J.; Pan, A.; Chai, S.; Gong, Y.; Hu, J. Effects of high temperature on pore structure and mechanical properties of phyllite. Case Stud. Therm. Eng. 2025, 73, 106504. [Google Scholar] [CrossRef]
  4. Wu, L.; Huang, Y.; Li, J.; Wang, G.; Li, Y.; Li, X.; Ji, C. Macro-and micro-mechanical response and damage mechanism of sandstone under high-temperature conditions. Int. J. Min. Sci. Technol. 2025, 35, 265–274. [Google Scholar] [CrossRef]
  5. Wang, C.; Meng, Q.; Wu, K.; Shen, T. Investigation of the Mechanical Behavior Evolution and Cracking Characteristics of Coral Reef Limestone Subjected to High Temperature Utilizing the AE Technique. Rock Mech. Rock Eng. 2025, 58, 5047–5070. [Google Scholar] [CrossRef]
  6. Tripathi, A.; Khan, M.M.; Pain, A.; Rai, N.; Iqbal, M.A. Compressive strength of thermally treated Barakar sandstone in Jharia coal mine fire region: Interplay of strength, strain rate, and temperature. Eng. Fract. Mech. 2025, 319, 111002. [Google Scholar] [CrossRef]
  7. Gomah, M.E.; Li, G.; Omar, A.A.; Abdel Latif, M.L.; Sun, C.; Xu, J. Thermal-Induced Microstructure Deterioration of Egyptian Granodiorite and Associated Physico-Mechanical Responses. Materials 2024, 17, 1305. [Google Scholar] [CrossRef]
  8. Jodry, C.; Heap, M.J.; Bayramov, K.; Alizada, G.; Rustamova, S.; Nabiyeva, S. Influence of High Temperature on the Physical and Mechanical Properties of Porous Limestone from Baku (Azerbaijan). Fire 2023, 6, 263. [Google Scholar] [CrossRef]
  9. Shen, M.; Zhao, Y.; Bi, J.; Wang, C.; Liu, T.; Du, B. Softening properties and damage evolution of the preloaded building sandstone after exposure to high-temperature. Constr. Build. Mater. 2024, 414, 134970. [Google Scholar] [CrossRef]
  10. Verma, S.; Sirdesai, N.N.; Goel, M.D.; Maeder, M.; Marburg, S. The role of cooling on the physical-mechanical response of thermally treated Jodhpur sandstone: A major heritage stone in India. Geoheritage 2024, 16, 132. [Google Scholar] [CrossRef]
  11. Martínez-Ibáñez, V.; Garrido, M.E.; Signes, C.H.; Tomás, R. Micro and macro-structural effects of high temperatures in Prada limestone: Key factors for future fire-intervention protocols in Tres Ponts Tunnel (Spain). Constr. Build. Mater. 2021, 286, 122960. [Google Scholar] [CrossRef]
  12. Srinivasan, V.; Hasainar, H.; Singh, T.N. Experimental study on failure and fracturing attributes of granite after thermal treatments with different cooling conditions. Eng. Geol. 2022, 310, 106867. [Google Scholar] [CrossRef]
  13. González-Fernández, B.; Alonso, F.J.; Valdeón, L.; Pando, L. Upper Cretaceous Limestones as Stone Resources for the Monuments of Oviedo (Asturias, NW of Spain): Petrographic Variability and Stratigraphic Origin. Geoheritage 2022, 14, 30. [Google Scholar] [CrossRef]
  14. Girotto, C.; Dilaria, S.; Previato, C.; Bonetto, J.; Mazzoli, C. The Use of Stone Resources in the Roman Architecture of Oderzo (Treviso, Italy). Heritage 2025, 8, 44. [Google Scholar] [CrossRef]
  15. Sanz-Arauz, D.; Rodríguez-Escalante, M.; del Río-Calleja, B.; López-Andrés, S. Characterization, Analysis, and Investigation of the Provenance of the Stone Construction Materials of the Vera Cruz Church (Segovia, Spain). Minerals 2024, 14, 178. [Google Scholar] [CrossRef]
  16. Kotlík, P. Stavební Materiály Historických Objektů-Materiály Koroze Sanace (Building Materials of Historical Buildings Materials Corrosion Rehabilitation); VŠCHT: Praha, Czech Republic, 1999. (In Czech) [Google Scholar]
  17. Kotlík, P.; Šrámek, J.; Kaše, J. OPUKA (Marlstone); STOP: Praha, Czech Republic, 2000. (In Czech) [Google Scholar]
  18. Přikryl, R.; Lokajíček, T.; Svobodová, J.; Weishauptová, Z. Experimental weathering of marlstone from Přední Kopanina (Czech Republic)—Historical building stone of Prague. Build. Environ. 2003, 38, 1163–1171. [Google Scholar] [CrossRef]
  19. Valečka, J.; Zelenka, P. Cretaceous sediments on the territory of the Džbán Nature Park—Some interesting phenomena. In Zprávy o Geologických Výzkumech v Roce 2012; Czech Geological Survey: Prague, Czech Republic, 2013; pp. 93–96. [Google Scholar]
  20. ČSN EN 772-1+A1; Methods of Test for Masonry Units—Part 1: Determination of Compressive Strength. ÚNMZ: Prague, Czech Republic, 2016.
  21. EN ISO 9513; Metallic materials—Calibration of Extensometer Systems Used in Uniaxial Testing. ISO Copyright Office: Geneva, Switzerland, 2012.
  22. ASTM E83; Standard Practice for Calibration, Verification, and Classification of Extensometer Systems. American Society for Testing and Materials: West Conshohocken, USA, 2025.
  23. Witt, K. CIE color difference metrics. In Colorimetry: Understanding the CIE System; Schanda, J., Ed.; John Wiley & Sons: Hoboken, NJ, USA, 2007; pp. 79–100. [Google Scholar]
  24. Clark, R.N. Spectroscopy of Rocks and Minerals, and Principles of Spectroscopy. In Manual of Remote Sensing; Rencz, A.N., Ed.; John Wiley & Sons: Hoboken, NJ, USA, 1999; Volume 3, pp. 3–58. [Google Scholar]
  25. Van der Meer, F. Near-infrared laboratory spectroscopy of mineral chemistry: A review. Int. J. Appl. Earth Obs. Geoinf. 2018, 65, 71–78. [Google Scholar] [CrossRef]
  26. Hajpál, M.; Török, Á. Mineralogical and colour changes of quartz sandstones by heat. Environ. Geol. 2004, 46, 311–322. [Google Scholar] [CrossRef]
  27. Karunadasa, K.S.P.; Manoratne, C.H.; Pitawala, H.M.T.G.A.; Rajapakse, R.M.G. Thermal decomposition of calcium carbonate (calcite polymorph) as examined by in-situ high-temperature X-ray powder diffraction. J. Phys. Chem. Solids 2019, 134, 21–28. [Google Scholar] [CrossRef]
  28. Amiri, M.; Kalantari, B.; Porhonar, F. The effect of thermal stabilization process on mineralogy, morphology and engineering properties of red soil in southern Iran. Case Stud. Constr. Mater. 2023, 19, e02454. [Google Scholar] [CrossRef]
  29. Liu, X.; Yuan, S.; Sieffert, Y.; Fityus, S.; Buzzi, O. Changes in Mineralogy, Microstructure, Compressive Strength and Intrinsic Permeability of Two Sedimentary Rocks Subjected to High-Temperature Heating. Rock Mech. Rock Eng. 2016, 49, 2985–2998. [Google Scholar] [CrossRef]
  30. Bowitz, J.; Ehling, A. Non-destructive infrared analyses: A method for provenance analyses of sandstones. Environ. Geol. 2008, 56, 623–630. [Google Scholar] [CrossRef]
  31. Zhou, Y.; Wang, T.; Fan, F.; Chen, S.; Guo, W.; Xing, G.; Sun, J.; Xiao, F. Advances on Exploration Indicators of Mineral VNIR-SWIR Spectroscopy and Chemistry: A Review. Minerals 2022, 12, 958. [Google Scholar] [CrossRef]
  32. Lugassi, R.; Ben-Dor, E.; Eshel, G. Reflectance spectroscopy of soils post-heating—Assessing thermal alterations in soil minerals. Geoderma 2014, 213, 268–279. [Google Scholar] [CrossRef]
  33. Leu, D.J. Visible and near—Infrared reflectance of beach sands: A study on the spectral reflectance/grain size relationship. Remote Sens. Environ. 1977, 6, 169–182. [Google Scholar] [CrossRef]
  34. Okin, G.S.; Painter, T.H. Effect of grain size on remotely sensed spectral reflectance of sandy desert surfaces. Remote Sens. Environ. 2004, 89, 272–280. [Google Scholar] [CrossRef]
  35. Folstad, M.B.; Yu, H.; Wang, H.; Tangstad, M. Disintegration of Six Different Quartz Types during Heating to 1600 °C. Minerals 2023, 13, 132. [Google Scholar] [CrossRef]
  36. Shoval, S. Mineralogical changes upon heating calcitic and dolomitic marl rocks. Thermochim. Acta 1988, 135, 243–252. [Google Scholar] [CrossRef]
  37. Jordán, M.M.; Boix, A.; Sanfeliu, T.; de la Fuente, C. Firing transformations of cretaceous clays used in the manufacturing of ceramic tiles. Appl. Clay Sci. 1999, 14, 225–234. [Google Scholar] [CrossRef]
  38. Mesrar, L.; Raouf, J.; Mesrar, H. Physicochemical and Mechanical Characterization of Ceramic Materials from Meknes Region (Morocco). J. Ecol. Eng. 2023, 24, 183–197. [Google Scholar] [CrossRef]
Figure 1. (a) Basilica of St. George at Prague Castle (1142), Prague; (b) rotunda in Holubice near Prague (1224–1226).
Heritage 09 00076 g001
Figure 2. Experimental samples of marlstone with height h = 70 mm. Sample dimensions were identified according to ČSN EN 772-1+A1 [20].
Heritage 09 00076 g002
Figure 3. (a) Original stone for samples of Marlstone Group 1; (b) original stone for samples of Marlstone Group 2.
Heritage 09 00076 g003
Figure 4. (a) Electric muffle furnace; (b) samples before heating; (c) samples during heating (temperature 1100 °C).
Heritage 09 00076 g004
Figure 5. (a) Heating and cooling curves for samples of Marlstone Group 1; (b) heating and cooling curves for samples of Marlstone Group 2 (oven- and water-cooled).
Heritage 09 00076 g005
Figure 6. (a) Experimental setup; (b) sample in hydraulic press with optical deformeters.
Heritage 09 00076 g006
Figure 7. Relationship between ultimate compressive stress and temperature (vertical dashed lines highlight the samples’ group test temperature)—Marlstone Group 1.
Heritage 09 00076 g007
Figure 8. Relationship between ultimate axial strain and temperature (vertical dashed lines highlight the samples’ group test temperature)—Marlstone Group 1.
Heritage 09 00076 g008
Figure 9. Relationship between Young’s modulus of elasticity and temperature (vertical dashed lines highlight the samples’ group test temperature)—Marlstone Group 1.
Heritage 09 00076 g009
Figure 10. Stress–strain relationship of marlstone samples under uniaxial compression—Marlstone Group 1.
Heritage 09 00076 g010
Figure 11. Relationship between ultimate compressive stress and temperature (vertical dashed lines highlight the samples’ group test temperature)—Marlstone Group 2.
Heritage 09 00076 g011
Figure 12. Relationship between ultimate axial strain and temperature (vertical dashed lines highlight the samples’ group test temperature)—Marlstone Group 2.
Heritage 09 00076 g012
Figure 13. Relationship between Young’s modulus of elasticity and temperature (vertical dashed lines highlight the samples’ group test temperature)—Marlstone Group 2.
Heritage 09 00076 g013
Figure 14. Stress–strain relationship of marlstone samples under uniaxial compression—Marlstone Group 2.
Heritage 09 00076 g014
Figure 15. (a) Microscopic image of unheated marlstone sample in natural light (10× magnification); (b) microscopic image of unheated marlstone sample in polarized light (10× magnification).
Heritage 09 00076 g015
Figure 16. (a) Microscopic image of marlstone sample heated to 620 °C in natural light (10× magnification); (b) microscopic image of marlstone sample heated to 620 °C in polarized light (10× magnification).
Heritage 09 00076 g016
Figure 17. (a) Microscopic image of marlstone sample heated to 870 °C in natural light (10× magnification); (b) microscopic image of marlstone sample heated to 870 °C in polarized light (10× magnification).
Heritage 09 00076 g017
Figure 18. (a) Microscopic image of marlstone sample heated to 1100 °C in natural light (10× magnification); (b) microscopic image of marlstone sample heated to 1100 °C in polarized light (10× magnification).
Heritage 09 00076 g018
Figure 19. Spectral reflectance curves of unheated and heated marlstone samples.
Heritage 09 00076 g019
Figure 20. Visualization of color properties in CIELab space of Marlstone Group 1 samples.
Heritage 09 00076 g020
Figure 21. Visualization of color properties in CIELab space of Marlstone Group 2 samples. Note: OC—oven-cooled samples, WC—water-cooled samples.
Heritage 09 00076 g021
Table 1. Summary of previous research.
StudyMaterialTemps (°C)Methodes/TestsFocus/Main Outcomes
Rong et al. [1]Fine-grained marble (China)200–600, (200 inc.)UCS, UPV, optical microscopyMicrocrack char., mechanical degradation, failure mode, specimen size effect
Zhang et al. [2]Laizhou dolomite marble (China)105, 200, 400, 500, 600, 700, 800UCS, UPV, SEM, ESD, MIT porosity, XRD, densityColor change, mechanical degradation, microstructural change
Li et al. [3]Phyllite (China)300, 400, 500, 600, 800, 900Mass loss, UPV, NMR porosity, UCS, AE, SEMDamage evolution, pore structure, mechanical degradation, microstructural change, brittle–ductile behavior
Wu et al. [4]Sandstone (China)200–1200, (200 inc.)AE, SEM, XRD, NMR porosity, UPVColor change, failure modes, high-temperature mechanical response, cracking, microstructural change
Wang et al. [5]Limestone (China)100–1200, (100 inc.)Volume, density, UPV, thermal cond., UCS, AE, 3D CTColor change, evolution of physical and mechanical parameters, cracking
Tripathi et al. [6]Barkar sandstone (NM)200–800, (200 inc.)UCS, SHPB, petrography, FE-SEMMicrostructural damage, mechanical degradation, failure mode,
Gomah et al. [7]Egyptian granodiorite (Egypt)200–800, (200 inc.)Mass loss, porosity, UCS, UPV, XDR, SEM, XRF, TGA, DTAMineralogical transformation, physical and mechanical degradation, cracking
Jodry et al. [8]Limestone (Azerbaijan)100, 200, 400, 600, 800Density, porosity, permeability, UPV, thermal cond., thermal diffusivity, UCSColor change, thermal decomposition, structural disintegration
Shen et al. [9]Red sandstone (China)200–800, (200 inc.)UPV, 3D microscopy UCSEffect of cyclic pre-loading and temperature on strength, color change, failure mode
Verma et al. [10]Sandstone (India)250–1000, (250 inc.)UPV, UCS, density, porosity, TG-DTA, XRF, XRD, SEMEvolution of physical and mechanical parameters, cooling method influence, mineralogical transformation,
Martínez-Ibáňez et al. [11]Prada limestone (Spain)200–600, (100 inc.)CS-IR, XRF, petrography, SEM, MIP, porosity, density, UPV, UCSmineralogical changes, variation in physical and mechanical properties, cooling rate effects
Srinivasan et al. [12]Granite (India)200–600, (100 inc.)UCS, AE, UPV, optical microscopy, BTSCooling rate effects on physical and mechanical properties, microstructural change, fracture development
Table 2. Experimental samples’ dimensions—Marlstone Group 1.
Sample IDØ [mm]h [mm]A [mm2]m [g]
M1_134.9070.71956.44125.51
M1_234.9571.63959.37123.97
M1_334.9272.46957.72128.11
M1_434.9070.59956.81122.24
M1_534.8770.46954.98123.18
M1_634.9270.03957.54123.29
M1_734.8668.21954.25122.08
M1_834.9271.15957.90124.38
M1_934.9070.83956.81124.09
M1_1034.9172.08957.17127.96
M1_1134.9770.30960.28123.28
M1_1234.9069.29956.44121.18
M1_1334.9171.68957.35125.81
M1_1434.9171.70956.99124.38
M1_1534.9570.12959.55126.70
M1_1634.9168.85957.35122.82
Table 3. Experimental samples’ dimensions—Marlstone Group 2.
Sample IDØ [mm]h [mm]A [mm2]m [g]
M2_134.8371.69952.61122.79
M2_234.8970.35955.89122.95
M2_334.8469.51953.15118.58
M2_434.8370.01952.70118.88
M2_534.8469.40953.43118.17
M2_634.8869.24955.44121.41
M2_734.8769.69955.16121.58
M2_834.8269.77952.42122.38
M2_934.8369.23952.70121.27
M2_1034.8069.65951.06120.66
M2_1134.8469.50953.15120.12
M2_1234.8069.19951.24123.18
M2_1334.7569.63948.60122.51
M2_1434.8670.14954.52124.18
Table 4. Mass loss values—Marlstone Group 1.
TmaxSample Δm [g]Δmmean [g]Δmrelative [%]St.Dev. [-]Variation [g]Var. Coeff. [%]
26 °CM1_13------
M1_14-
M1_15-
M1_16-
620 °CM1_93.953.722.990.1570.0254.215
M1_103.65
M1_113.52
M1_123.74
870 °CM1_28.028.036.430.4640.2155.773
M1_38.78
M1_47.71
M1_87.59
1100 °CM1_18.289.247.490.9840.96810.653
M1_58.27
M1_69.91
M1_710.49
Table 5. Mass loss values—Marlstone Group 2.
TmaxSample Δm [g]Δmmean [g]Δmrelative [%]St.Dev. [-]Variation [g]Var. Coeff. [%]
26 °CM2_2------
M2_14-
820 °CM2_108.919.027.440.0860.0070.954
M2_119.12
M2_129.03
M2_3 *7.697.866.490.3030.0923.859
M2_8 *8.29
M2_13 *7.61
1100 °CM2_49.949.728.140.2570.0662.640
M2_59.86
M2_69.36
M2_1 *9.919.317.640.4520.2044.852
M2_7 *9.20
M2_9 *8.82
* Water-cooled samples.
Table 6. Experimental values of ultimate compressive stress σu—Marlstone Group 1.
TmaxSample σu [MPa]σu,mean [MPa]σu,relative [%]St.Dev. [-]Variation [MPa]Var. Coeff. [%]
26 °CM1_1335.6634.491003.92815.43211.391
M1_1427.83
M1_1536.50
M1_1637.95
620 °CM1_946.1545.70132.536.18438.24113.530
M1_1050.78
M1_1150.42
M1_1235.47
870 °CM1_246.8460.54175.5514.857220.73724.540
M1_378.59
M1_444.96
M1_871.79
1100 °CM1_161.7055.76161.683.88515.0926.967
M1_552.50
M1_656.74
M1_752.10
Table 7. Experimental values of axial strain at peak stress εy,u—Marlstone Group 1.
TmaxSample εy,u [--]εy,u,mean [--]εy,u,relative [%]St.Dev. [-]Variation [-]Var. Coeff. [%]
26 °CM1_130.002010.001911000.00038 1.47 × 10 7 20.101
M1_140.00126
M1_150.00211
M1_160.00225
620 °CM1_90.003490.00293153.610.00041 1.68 × 10 7 14.004
M1_100.00287
M1_110.00302
M1_120.00234
870 °CM1_20.002820.00283148.490.00043 1.85 × 10 7 15.198
M1_30.00331
M1_40.00305
M1_80.00215
1100 °CM1_10.003080.00275144.170.00062 3.85 × 10 7 22.548
M1_50.00342
M1_60.00274
M1_70.00176
Table 8. Experimental values of Young’s modulus of elasticity E—Marlstone Group 1.
TmaxSample E [GPa]Emean [GPa]Erelative [%]St.Dev. [-]Variation [GPa]Var. Coeff. [%]
26 °CM1_1317.7720.181004.85923.61424.081
M1_1420.73
M1_1527.69
M1_1614.53
620 °CM1_912.3616.5682.042.6747.14816.149
M1_1019.07
M1_1118.67
M1_1216.13
870 °CM1_222.4925.76127.663.32111.02612.889
M1_326.24
M1_423.34
M1_830.98
1100 °CM1_121.2522.88113.374.47119.99219.544
M1_517.91
M1_622.25
M1_730.11
Table 9. Experimental values of ultimate compressive stress σu—Marlstone Group 2.
TmaxSample σu [MPa]σu,mean [MPa]σu,relative [%]St.Dev. [-]Variation [MPa]Var. Coeff. [%]
26 °CM2_234.8539.361004.5120.3111.450
M2_1443.87
820 °CM2_1051.9451.72131.3911.76138.3122.740
M2_1137.20
M2_1266.01
M2_3 *28.5631.00 78.752.094.386.754
M2_8 *33.68
M2_13 *30.76
1100 °CM2_444.4047.42120.475.5430.6811.681
M2_542.67
M2_655.19
M2_1 *30.6529.7475.563.7714.2012.670
M2_7 *24.74
M2_9 *33.83
* Water-cooled samples.
Table 10. Experimental values of axial strain at peak stress εy,u—Marlstone Group 2.
TmaxSample εy,u [--]εy,u,mean [--]εy,u,relative [%]St.Dev. [-]Variation [-]Var. Coeff. [%]
26 °CM2_20.002500.002731000.00024 5.52 × 10 8 8.608
M2_140.00297
820 °CM2_100.003180.00292106.900.00068 4.58 × 10 7 23.196
M2_110.00199
M2_120.00359
M2_3 *0.006160.00538197.070.00068 4.64 × 10 7 12.665
M2_8 *0.00548
M2_13 *0.00450
1100 °CM2_40.002590.0025091.390.00033 1.08 × 10 7 13.176
M2_50.00206
M2_60.00285
M2_1 *0.005500.00508185.980.00038 1.44 × 10 7 7.480
M2_7 *0.00458
M2_9 *0.00515
* Water-cooled samples.
Table 11. Experimental values of Young’s modulus of elasticity E—Marlstone Group 2.
TmaxSample E [GPa]Emean [GPa]Erelative [%]St.Dev. [-]Variation [GPa]Var. Coeff. [%]
26 °CM2_214.4515.291000.8410.7075.500
M2_1416.13
820 °CM2_1017.9319.41126.932.0744.30310.688
M2_1117.95
M2_1222.34
M2_3 *7.479.1259.671.1671.36212.792
M2_8 *9.99
M2_13 *9.91
1100 °CM2_417.6719.32126.341.2391.5366.415
M2_520.67
M2_619.61
M2_1 *10.3410.3167.441.4442.08614.004
M2_7 *8.53
M2_9 *12.07
* Water-cooled samples.
Table 12. Elemental composition of samples [%].
ElementM1_13 (26 °C)M1_9 (620 °C)M1_4 (870 °C)M1_7 (1100 °C)
SiO259.495460.151658.318055.6440
CaO9.11248.60739.570813.5644
Al2O38.30328.16068.01296.9086
Fe2O31.59021.53541.69081.7442
K2O0.86530.88070.95190.9564
TiO20.25490.28170.32730.3544
MgO0.18620.19400.26190.3372
P2O50.05440.05840.05260.0686
SrO0.02590.02110.02750.0277
Ba0.01920.00360.02960.0148
ZrO20.01800.00960.01870.0168
SO30.01740.04950.65540.2750
MnO0.01570.01020.01540.0175
Table 13. Values of CIELab parameters—Marlstone Group 1.
TmaxSample L*L*meana*a*meanb*b*meanΔE*ΔE*mean
26 °CM1_1363.2563.755.915.3418.0016.371.79-
M1_1464.854.8314.032.64
M1_1562.784.9715.611.28
M1_1664.115.6817.861.57
620 °CM1_962.1564.2212.1511.8019.8317.857.807.06
M1_1062.7312.5218.937.68
M1_1165.2611.6416.776.48
M1_1266.7310.8815.856.30
870 °CM1_259.9762.9812.8612.9719.9519.539.138.49
M1_364.1612.7218.967.82
M1_463.0113.0719.768.47
M1_864.7713.2419.458.53
1100 °CM1_1-64.91-6.96-12.74-4.19
M1_564.976.6112.074.65
M1_6----
M1_764.857.3213.413.72
Table 14. Values of CIELab parameters—Marlstone Group 2.
TmaxSample L*L*meana*a*meanb*b*meanΔE*ΔE*mean
26 °CM2_265.5265.645.595.6719.3419.19--
M2_1465.755.7519.04-
820 °CM2_1062.9462.1612.5312.1618.6518.697.397.46
M2_1160.7413.1819.678.97
M2_1262.8110.7717.746.01
M2_3 *59.5959.6212.4012.1618.5318.839.078.86
M2_8 *60.2011.8418.978.23
M2_13 *59.0712.2418.979.30
1100 °CM2_463.1263.8110.0710.7012.9713.588.028.35
M2_563.7313.4016.668.35
M2_664.578.6311.118.67
M2_1 *62.0462.598.149.2411.3112.169.018.56
M2_7 *63.7810.4112.468.44
M2_9 *61.969.1612.718.23
* Water-cooled samples.
Disclaimer/Publisher’s Note: The statements, opinions and data contained in all publications are solely those of the individual author(s) and contributor(s) and not of MDPI and/or the editor(s). MDPI and/or the editor(s) disclaim responsibility for any injury to people or property resulting from any ideas, methods, instructions or products referred to in the content.