
Article

Microclimate Behaviour Inside Archival Boxes, Books, and Paper Stacks: Buffering, Ventilation, and Pollutant Dynamics

by
Morten Ryhl-Svendsen
Royal Danish Academy, Institute of Conservation, 1263 Copenhagen, Denmark
Heritage 2026, 9(2), 63; https://doi.org/10.3390/heritage9020063
Submission received: 28 December 2025 / Revised: 29 January 2026 / Accepted: 2 February 2026 / Published: 4 February 2026
(This article belongs to the Special Issue Microclimate in Heritage)

Abstract

Paper-based heritage objects are commonly stored in archival boxes, books, and paper stacks, creating confined microclimates that may differ from the surrounding environment. While room-level climate control is central to preventive conservation, object-level conditions are shaped by enclosure permeability, hygroscopic buffering, ventilation, and internal emissions. This study investigates temperature, relative humidity, air exchange, and gaseous pollutants inside archival boxes, bound books, and paper stacks under laboratory and real storage conditions. Air exchange rates were determined using CO2 tracer decay, while climates were monitored over periods from hours to one year. Chemical conditions were assessed using passive sampling of air pollutants, oxygen measurements, and dosimetric methods. The results show that boxes, books, and paper stacks behave as semi-permeable rather than sealed systems. Hygroscopic buffering attenuated short-term RH fluctuations, especially within books and paper stacks, while long-term internal conditions followed ambient trends with pronounced time lags. Restricted ventilation limited the ingress of external pollutants but could allow for internally generated gases to accumulate. Experiments using acid-sensitive indicator paper demonstrated the slow penetration of acetic acid into paper stacks. Overall, enclosure performance reflected a balance between buffering capacity, permeability, and chemical reactivity rather than airtightness alone, highlighting the importance of object-level microclimate assessment in preventive conservation.

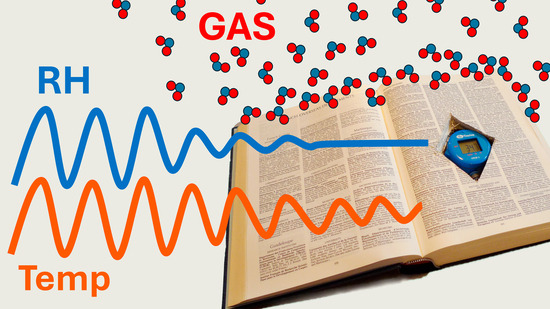
Graphical Abstract

1. Introduction

Paper-based cultural heritage, such as books, archival records, and documents stored in boxes or stacks, exist within a hierarchy of climatic environments. At the broadest scale, outdoor climate influences the building environment, which shapes the room climate in archives and libraries. Nested within these layers are still smaller microenvironments: the air inside archival boxes, between the leaves of a book, or deep within a paper stack. Although only millimetres to centimetres thick, these microclimates can strongly influence how paper-based collections behave, age and deteriorate [1].
Room-level climate control is a cornerstone of preventive conservation, and is what is referred to in most standards and guidelines (e.g., refs. [2,3,4]), but the conditions experienced by objects may differ substantially from the environment measured in the room. Enclosures and bound volumes can filter, delay, or amplify environmental conditions, and their behaviour is not always predictable from ambient temperature and relative humidity (RH) alone [5].
Archival boxes, folders, slipcases, and book bindings provide physical protection against dust, airborne particles, and handling damage [6,7,8]. They can also act as thermal and hygric buffers. When ambient RH changes rapidly, due to HVAC cycling, seasonal shifts, or people’s activity, the internal conditions in boxes and books typically respond more slowly [5,8,9,10,11,12]. This lag reflects restricted air exchange at enclosure boundaries and the hygroscopic capacity of paper, board, and binding materials, which absorb and release moisture over time.
These same protective properties can also introduce conservation challenges. Reduced ventilation can, on all levels, limit the ingress of reactive outdoor-derived pollutants (e.g., ozone or nitrogen oxides) [13,14], but may allow for internally generated volatile organic compounds (VOCs), for example, organic acids emitted by degrading paper, adhesives, or coatings, to accumulate [15]. Whether an enclosure is protective, therefore, depends on the balance between pollutant exclusion and pollutant retention, as well as on moisture and temperature buffering. Previously, such confined microclimates were difficult to characterise. Miniaturised dataloggers, sensitive passive samplers, and dosimeter techniques are now available for in situ measurements [16,17,18] with techniques which can be applied to the inside of boxes, books, and stacks as well.
In this paper, microclimate performance is understood as the balance between buffering, permeability, and ventilation, rather than airtightness alone. Confined microclimates are examined empirically through measurements of temperature, RH, and gaseous pollutants recorded inside archival boxes, within books, and in stacks of paper. These measurements show microclimates that are strongly buffered yet dynamically coupled to their surroundings, shaped by enclosure design, material properties, contents, and the room-level environment.

2. Background

2.1. Factors Influencing the Microenvironment Inside Archival Boxes and Books

Archival boxes and other enclosures (book bindings, etc.) modify the microenvironment experienced by heritage objects. Rather than acting as sealed enclosures, they typically behave as semi-permeable systems that moderate the surrounding macroclimate through a combination of air exchange, moisture sorption, material permeability, enclosure geometry, and internal emissions of volatile species [5,8].

2.2. Air Exchange and Enclosure Behaviour

The air exchange rate (AER) controls how rapidly moisture and pollutants are transported between an enclosure and the surrounding room. Heat transfer is also influenced by air exchange, together with heat conduction through materials. Low AER can improve short-term RH stability, but studies of museum enclosures (display cases, frames) have shown that excessively restricted ventilation can promote accumulation of corrosive gases [17,19,20,21,22,23].
Archival boxes generally exhibit higher AERs than display cases because of smaller size, porous board materials and less rigid construction. AER depends on box design (e.g., clamshell versus two-part), gaps at seams and closures, and the air velocity around the box [8,24]. Even modest air movement in a storage room can significantly increase exchange [25], so enclosure performance should ideally be evaluated in context rather than in isolation.

2.3. Moisture Sorption, Buffering, and Vapour Transmission

Moisture sorption by paper, board, and binding materials is the dominant mechanism governing RH moderation inside boxes, books, and paper stacks [26,27,28]. Cellulosic materials absorb and desorb water vapour due to their hydrophilic structure, buffering short- and medium-term RH fluctuations [1,5,29]. Book and stack interiors respond slowly: exposed surfaces change first, while the bulk interior may remain largely unaffected by short-term RH variation [11,27].
Moisture transfer also occurs via diffusion through the box board and through leaks. The water vapour transmission rate (WVTR), widely used in packaging science [30], has only recently been applied systematically to archival enclosures [5,24]. Standard archival boards typically have relatively high WVTR, providing limited resistance to humidity ingress; RH moderation in unmodified boxes therefore relies primarily on buffering rather than isolation. Reducing WVTR through material selection or surface modification can improve RH stability. For example, laminated barrier layers applied to pastel microclimate boxes reduced measured air exchange by roughly an order of magnitude and improved RH stability under fluctuating conditions [10]. However, increasing barrier performance can also increase the risk of internal gradients and pollutant accumulation if ventilation becomes very low [17,19,31,32].

2.4. Geometry, Storage Configuration, and Contents

Enclosure geometry influences microclimate behaviour through surface-area-to-volume ratio and airflow pathways. Smaller boxes respond more rapidly to external influence and can reach higher equilibrium concentrations of internally emitted pollutants for a given emission rate [14,20,31]. The contents of an enclosure are equally important: hygroscopic paper materials enhance buffering, whereas plastics generally contribute little to moisture control and, depending on the type of plastic, may act as VOC sources [33,34].
Storage configuration modifies effective air exchange. Filled boxes usually show more stable RH profiles than empty boxes, and stacked boxes and densely shelved books often experience reduced airflow and lower exposed surface area, lowering effective AER and increasing RH stability under certain conditions [5,11].

2.5. Chemical Microenvironments and Pollutants

The chemical composition of enclosure microenvironments is governed by internal emissions, enclosure volume, sorptive capacity, and air exchange. VOC emissions from enclosure materials have long been a concern, but recent quantitative studies indicate that emissions from box materials are generally minor compared with emissions from degrading paper itself, provided realistic air exchange rates are maintained [29].
General modelling studies (on building and room scale) further indicate that moderately ventilated spaces can maintain lower equilibrium indoor air pollution concentrations than more airtight rooms, because dilution and removal are more effective [15,35,36]. These findings challenge the assumption that greater airtightness necessarily confers superior preservation. However, direct pollutant measurements inside boxes and books remain limited. Published work primarily includes chromatographic headspace analysis of paper and book materials [37,38,39,40]; however, the SPME-GC/MS technique has also been applied to direct contact sampling of VOCs emitted by ageing paper inside book blocks [40,41,42]. A field investigation at the National Archives of Norway showed that enclosure air can differ measurably from room air due to ventilation and sorptive effects [18].
Overall, enclosure microenvironments are shaped by interacting physical and chemical processes rather than by any single property. Effective preventive strategies, therefore, require aligning box materials, design, permeability, and storage configuration with the vulnerabilities of the stored materials and the characteristics of the surrounding environment.

3. Methods and Materials

3.1. Boxes, Paper Stacks, and Books

The study combined laboratory-based measurements and long-term in situ monitoring to characterise microclimatic conditions inside archival boxes, paper stacks, and books. Methods were designed to quantify air exchange, temperature and RH dynamics, moisture uptake and release, and the chemical activity of confined paper-based systems. Measurements inside enclosures and objects were compared with the surrounding room environment.
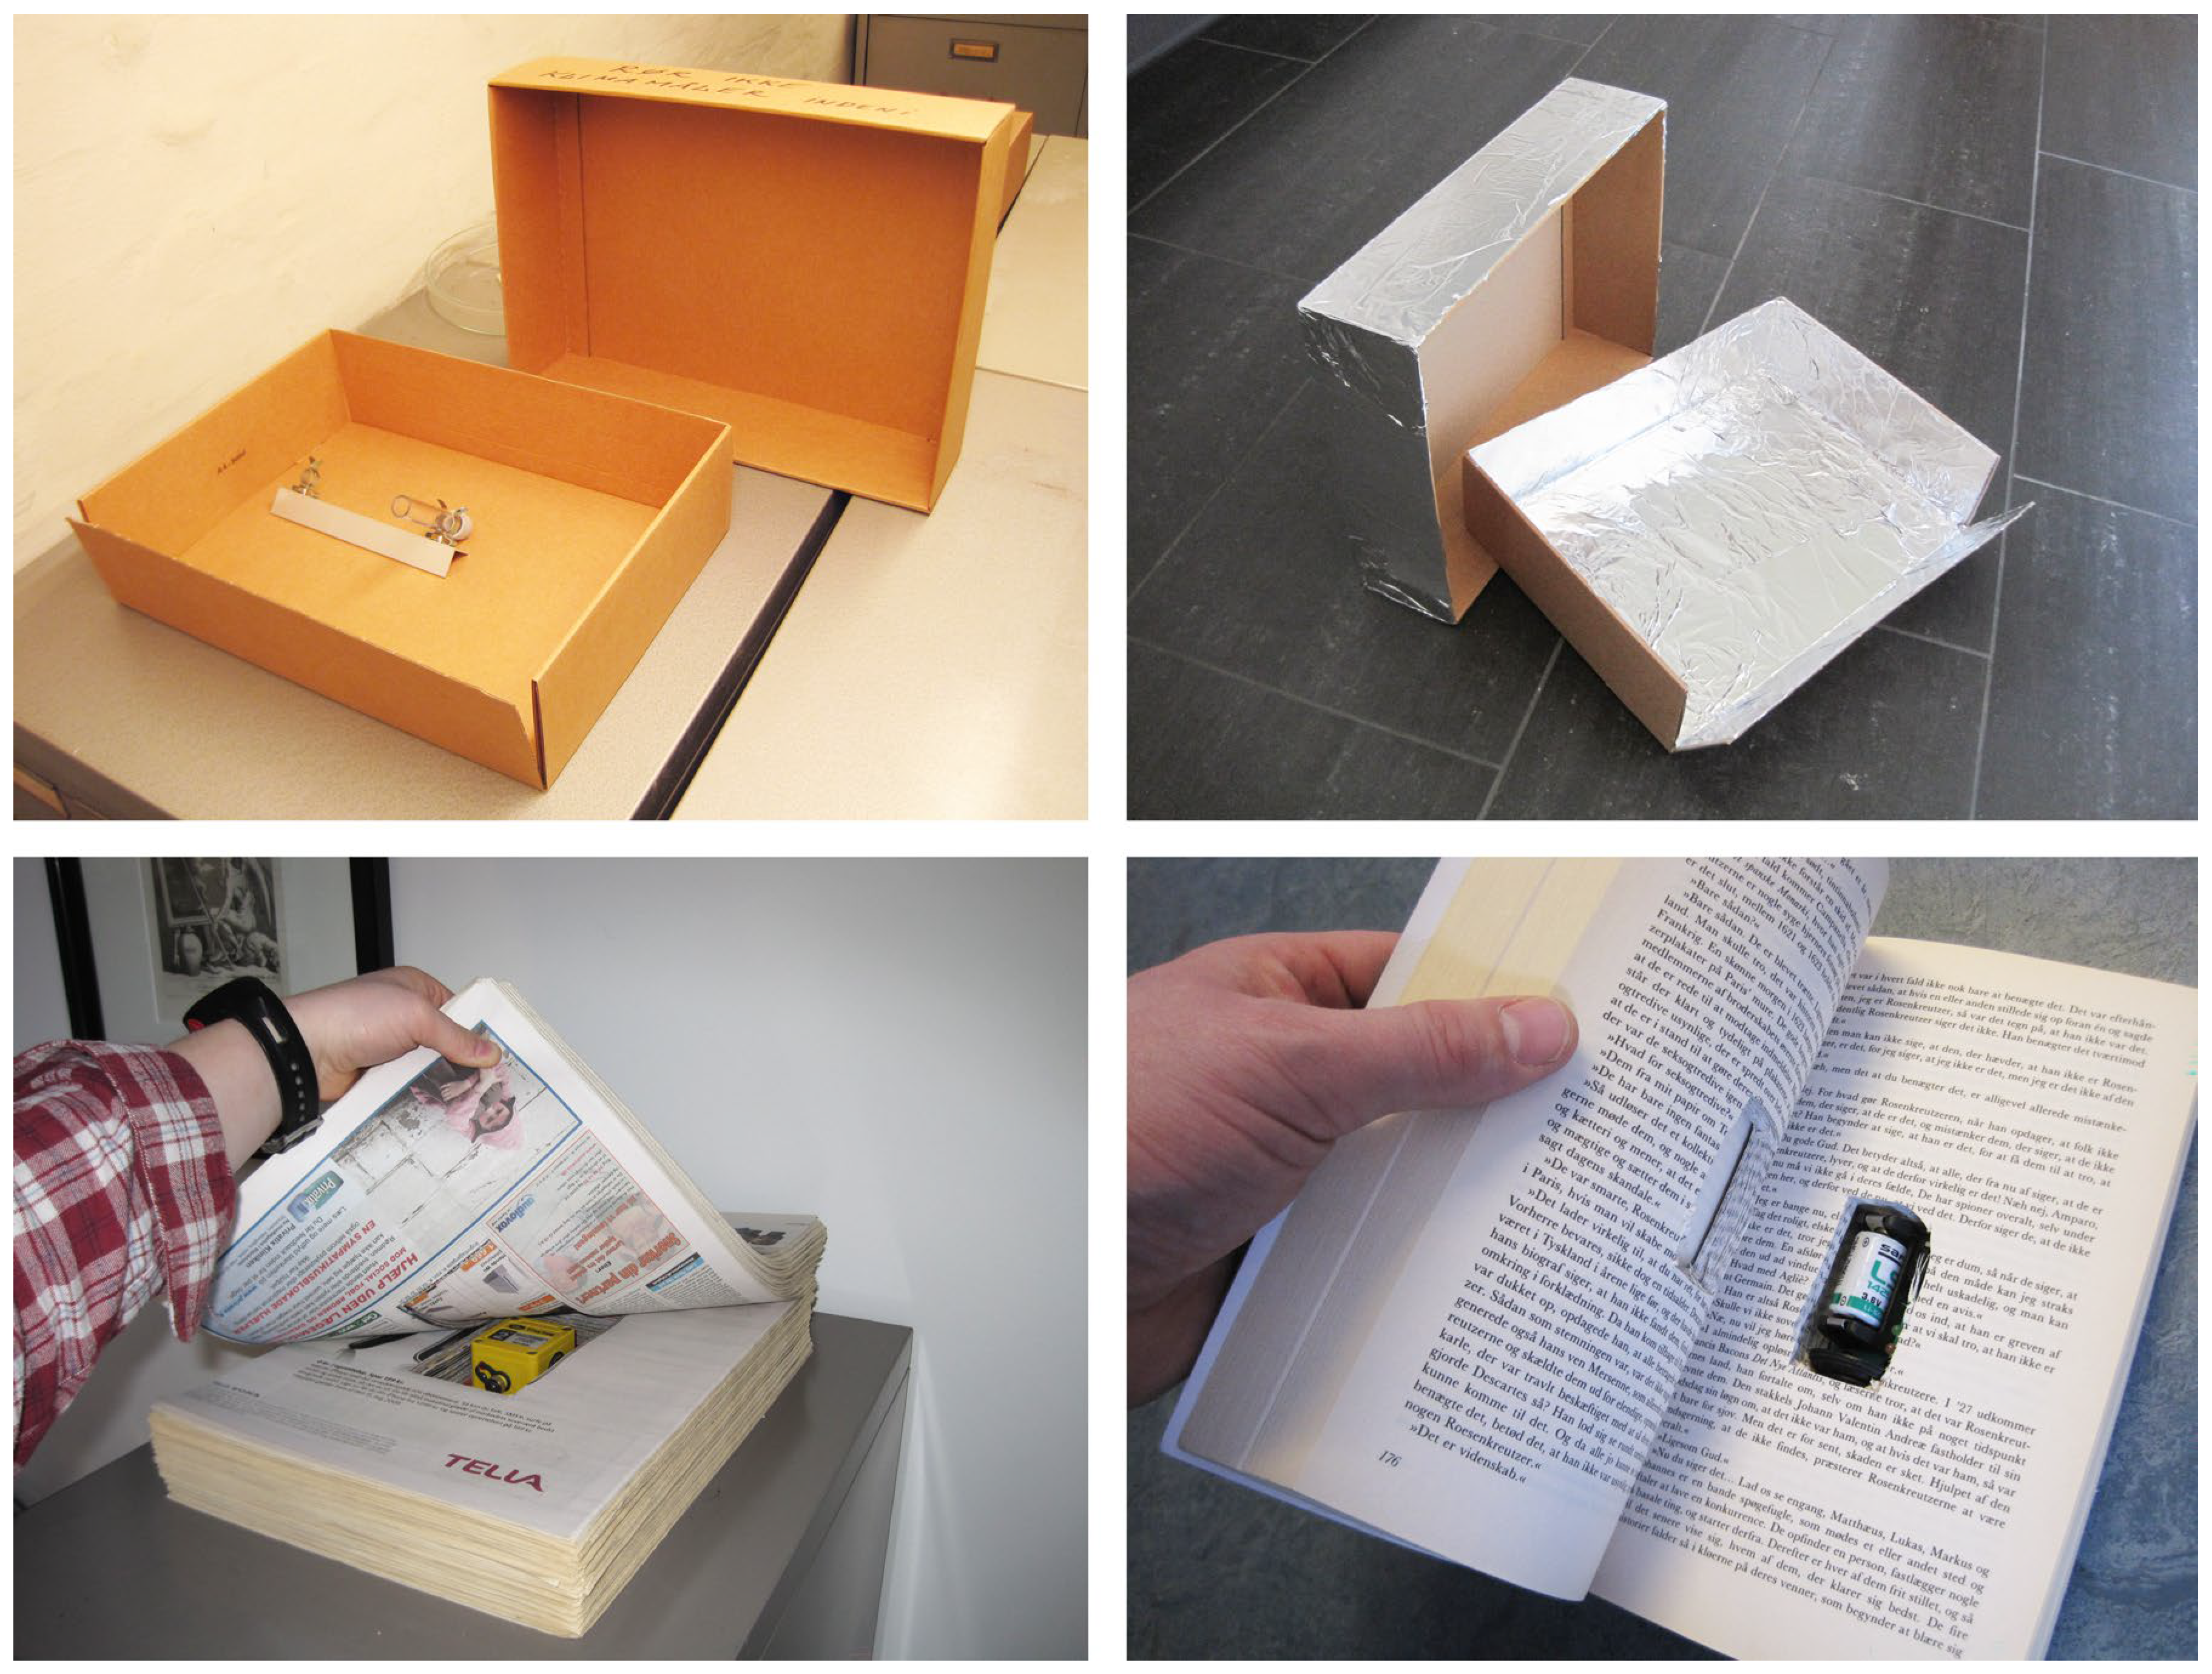
Danish National Archive’s (Rigsarkivet) standard two-part A4 corrugated cardboard (2 mm) archival boxes were used (Figure 1). Boxes were tested as supplied; in selected experiments, one box was lined internally with aluminium foil to reduce gas and vapour permeability through the boxboard (Figure 1). The foil was glued in place with spray adhesive (Spray Mount by 3M, Hutchinson, MN, USA), which made the surfaces gas-tight without changing the geometry or function of the box. In some tests, a box was filled with a stack of modern A4 copy paper (Table 1).
As a representative detached stack, a stack of aged newsprint paper (Metro Express, tabloid format, May 2009) was used. This stack has been used in multiple test series and, for most measurements reported here, was more than 10 years old.
Three modern books of different sizes were used. For books and paper stacks, a cavity was cut into the interior to house sensors (temperature/RH, CO, CO2, and/or VOC) while maintaining the overall integrity and density of the material.
The experiments were intended to show general trends, and the focus was therefore on selected but typical materials: modern archival cardboard, new books, and modern paper types. Different results might occur for coated paper, highly acidic paper, or non-cellulosic materials, including very airtight containers (e.g., plastic boxes or metal cans), but these examples are beyond the scope of this paper. The dimensions and masses of the tested items are summarised in Table 1 and examples shown in Figure 1.

3.2. Air Exchange Measurements

Air exchange rates were determined for empty archival boxes and for paper stacks using carbon dioxide (CO2) as a tracer gas. For paper stacks, a small cavity was cut into the centre of the stack to place a CO2 sensor while maintaining close contact with surrounding paper layers. CO2 monitors with dataloggers from Gemini Data Loggers, Chichester, UK (Tinytag CO2 TGE-0010), Bacharach Inc., New Kensington, PA, USA (CO2 Analyzer 2815), and IoT Fabrikken, Roskilde, Denmark (Roomalyzer) were used for monitoring, logging at 1 min intervals.
CO2 from a compressed gas cylinder was introduced to the cavity via a thin tube until internal concentration exceeded the ambient background by a measurable margin (several thousand ppm). The enclosure was then left undisturbed, and the CO2 concentration decay was recorded as dilution occurred through air exchange with the surrounding room. Ambient room CO2 was measured simultaneously and used as background level.
Air exchange rates were calculated from the exponential decay of CO2 concentration, assuming well-mixed conditions within the enclosure volume [22,44]. Additional observations captured how internal CO2 inside boxes and paper stacks responded to naturally varying ambient CO2 levels, providing insight into permeability under realistic conditions.

3.3. Temperature and Relative Humidity Monitoring

Temperature and RH inside and outside archival boxes and paper stacks were monitored using Gemini Tinytag dataloggers (Gemini Data Loggers (UK) Ltd., Chichester, UK, models Plus 2 TGP-4500; View 2 TV-4505 with external probe; Tinytalk TK-0302 RH and TK-4014 Temperature). Laboratory measurements were conducted in a climate chamber where temperature and RH were systematically varied. Internal microclimate conditions were recorded continuously while external conditions followed predefined scenarios.
To assess long-term behaviour in a bound volume, miniature dataloggers were placed in a cavity cut into a book block (Gemini Tinytalk TK-0302 RH and TK-4014 Temperature, Gemini Data Loggers (UK) Ltd., Chichester, UK). The sensors were separated from their housing to make them as small and compact as possible (Figure 1). The book was returned to a shelf in an office environment and monitored for one year. Temperature and RH were recorded hourly inside the book block and in the surrounding room, enabling comparison over seasonal cycles.

3.4. Moisture Uptake and Release in a Book

Moisture sorption in a book was assessed gravimetrically. A closed book equilibrated at a steady RH was weighed (milligram precision, by Mettler Toledo PB3002 laboratory balance, Greifensee, Switzerland) to establish a baseline. RH was then changed rapidly in a climate chamber at constant temperature. The book was weighed (almost) every weekday until a new equilibrium was reached. Each measurement period lasted six to seven weeks. Mass change was expressed as a percentage of the initial mass to quantify moisture uptake or release and to estimate response time. The experiment was conducted from moisture equilibrium at 73% RH to 50% RH, and then from 12% RH to 50% RH.

3.5. Oxygen Consumption and Gas Emission from Paper Samples

The chemical activity of paper under confined conditions was assessed by measuring oxygen consumption and production of carbon monoxide (CO) and carbon dioxide (CO2). The approach of oxygen monitoring followed the method of Matthiesen [45], using a 2.5 L glass desiccator jar as the airtight container. Oxygen level was monitored by sensors and measuring unit (Fibox 3) by PreSens, Regensburg, Germany, using an oxygen-sensitive disc (sensor-spot) placed inside the enclosure, which could be read optically through the glass.
Three paper samples (200 g each), taken from the same stock of newsprint paper, and one sample of Whatman filter paper (200 g) were in turn tested in the sealed desiccator jar. Oxygen concentration was recorded at 10 min intervals for approximately 500 h. CO and CO2 were monitored simultaneously using a CO (Lascar Eletronics, Pennsylvania, PA, USA, model EasyLog EL-USB-CO) and a CO2 sensor (Gemini Tinytag CO2 TGE-0010) placed inside the desiccator, also logging at 10 min intervals. A power cable for the CO2 sensor went through an airtight silicone plug in a hole in the lid.
Prior to testing, the paper samples were conditioned to moisture equilibrium at 20%, 50%, or 80% RH to provide controlled starting conditions. This setup allowed for simultaneous observation of oxygen consumption and gas accumulation as indicators of paper reactivity under different humidity regimes.

3.6. Monitoring of Gas Accumulation in a Newspaper Stack

To investigate the role of ventilation in internal gas accumulation, VOCs and CO were monitored in a cavity within a freestanding newspaper stack. Two scenarios were compared: the stack placed freely in a room, allowing for air exchange; and the same stack wrapped in aluminium foil and sealed with aluminium tape to restrict exchange. Sensors (Lascar Eletronics EasyLog EL-USB-CO, and Roomalyzer by IoT Fabrikken) recorded concentrations of volatiles at 1 min intervals.

3.7. Measurement of Gaseous Pollutants Using Passive Samplers

Selected gaseous pollutants were measured using passive diffusion samplers: organic acids (acetic and formic acid), ozone (O3), and nitrogen dioxide (NO2). Samplers were deployed inside archival boxes, inside the cavity of a newsprint paper stack, and in room air outside enclosures for direct comparison. O3 and NO2 samplers were exposed for one month; organic acid samplers were exposed for one week, after which the samplers were immediately posted for analysis. Organic acid samplers were analysed by the IVL Swedish Environmental Research Institute (SE), Gothenburg, Sweden; O3 and NO2 samplers were analysed by Gradko International Ltd. (Winchester, UK). Before use, samplers were stored in a refrigerator according to the manufacturer’s instructions. The uncertainties for the passive diffusion samplers were approx. ±10% for O3 and NO2, and approx. ±20% for organic acids.

3.8. Air Quality Detected by Dosimetry

In one test, a pure lead coupon (50 × 25 mm) was placed for one year inside the cavity of the newspaper stack (Stack A) at stable room conditions (approximately 21 °C and 55% RH). Mass gain by corrosion after exposure was determined according to ISO 11844-2:2020 [46].
In a separate paper-stack experiment, pH-sensitive Acid-Detector (AD) paper sheets were placed at the centre of stacks of modern A4 copy paper (Stack B). Four stacks were made; each comprised 500 sheets above and below the AD-paper. The AD-paper sheets were slightly larger than A4 to ensure exposure of the AD paper edges to the surrounding air.
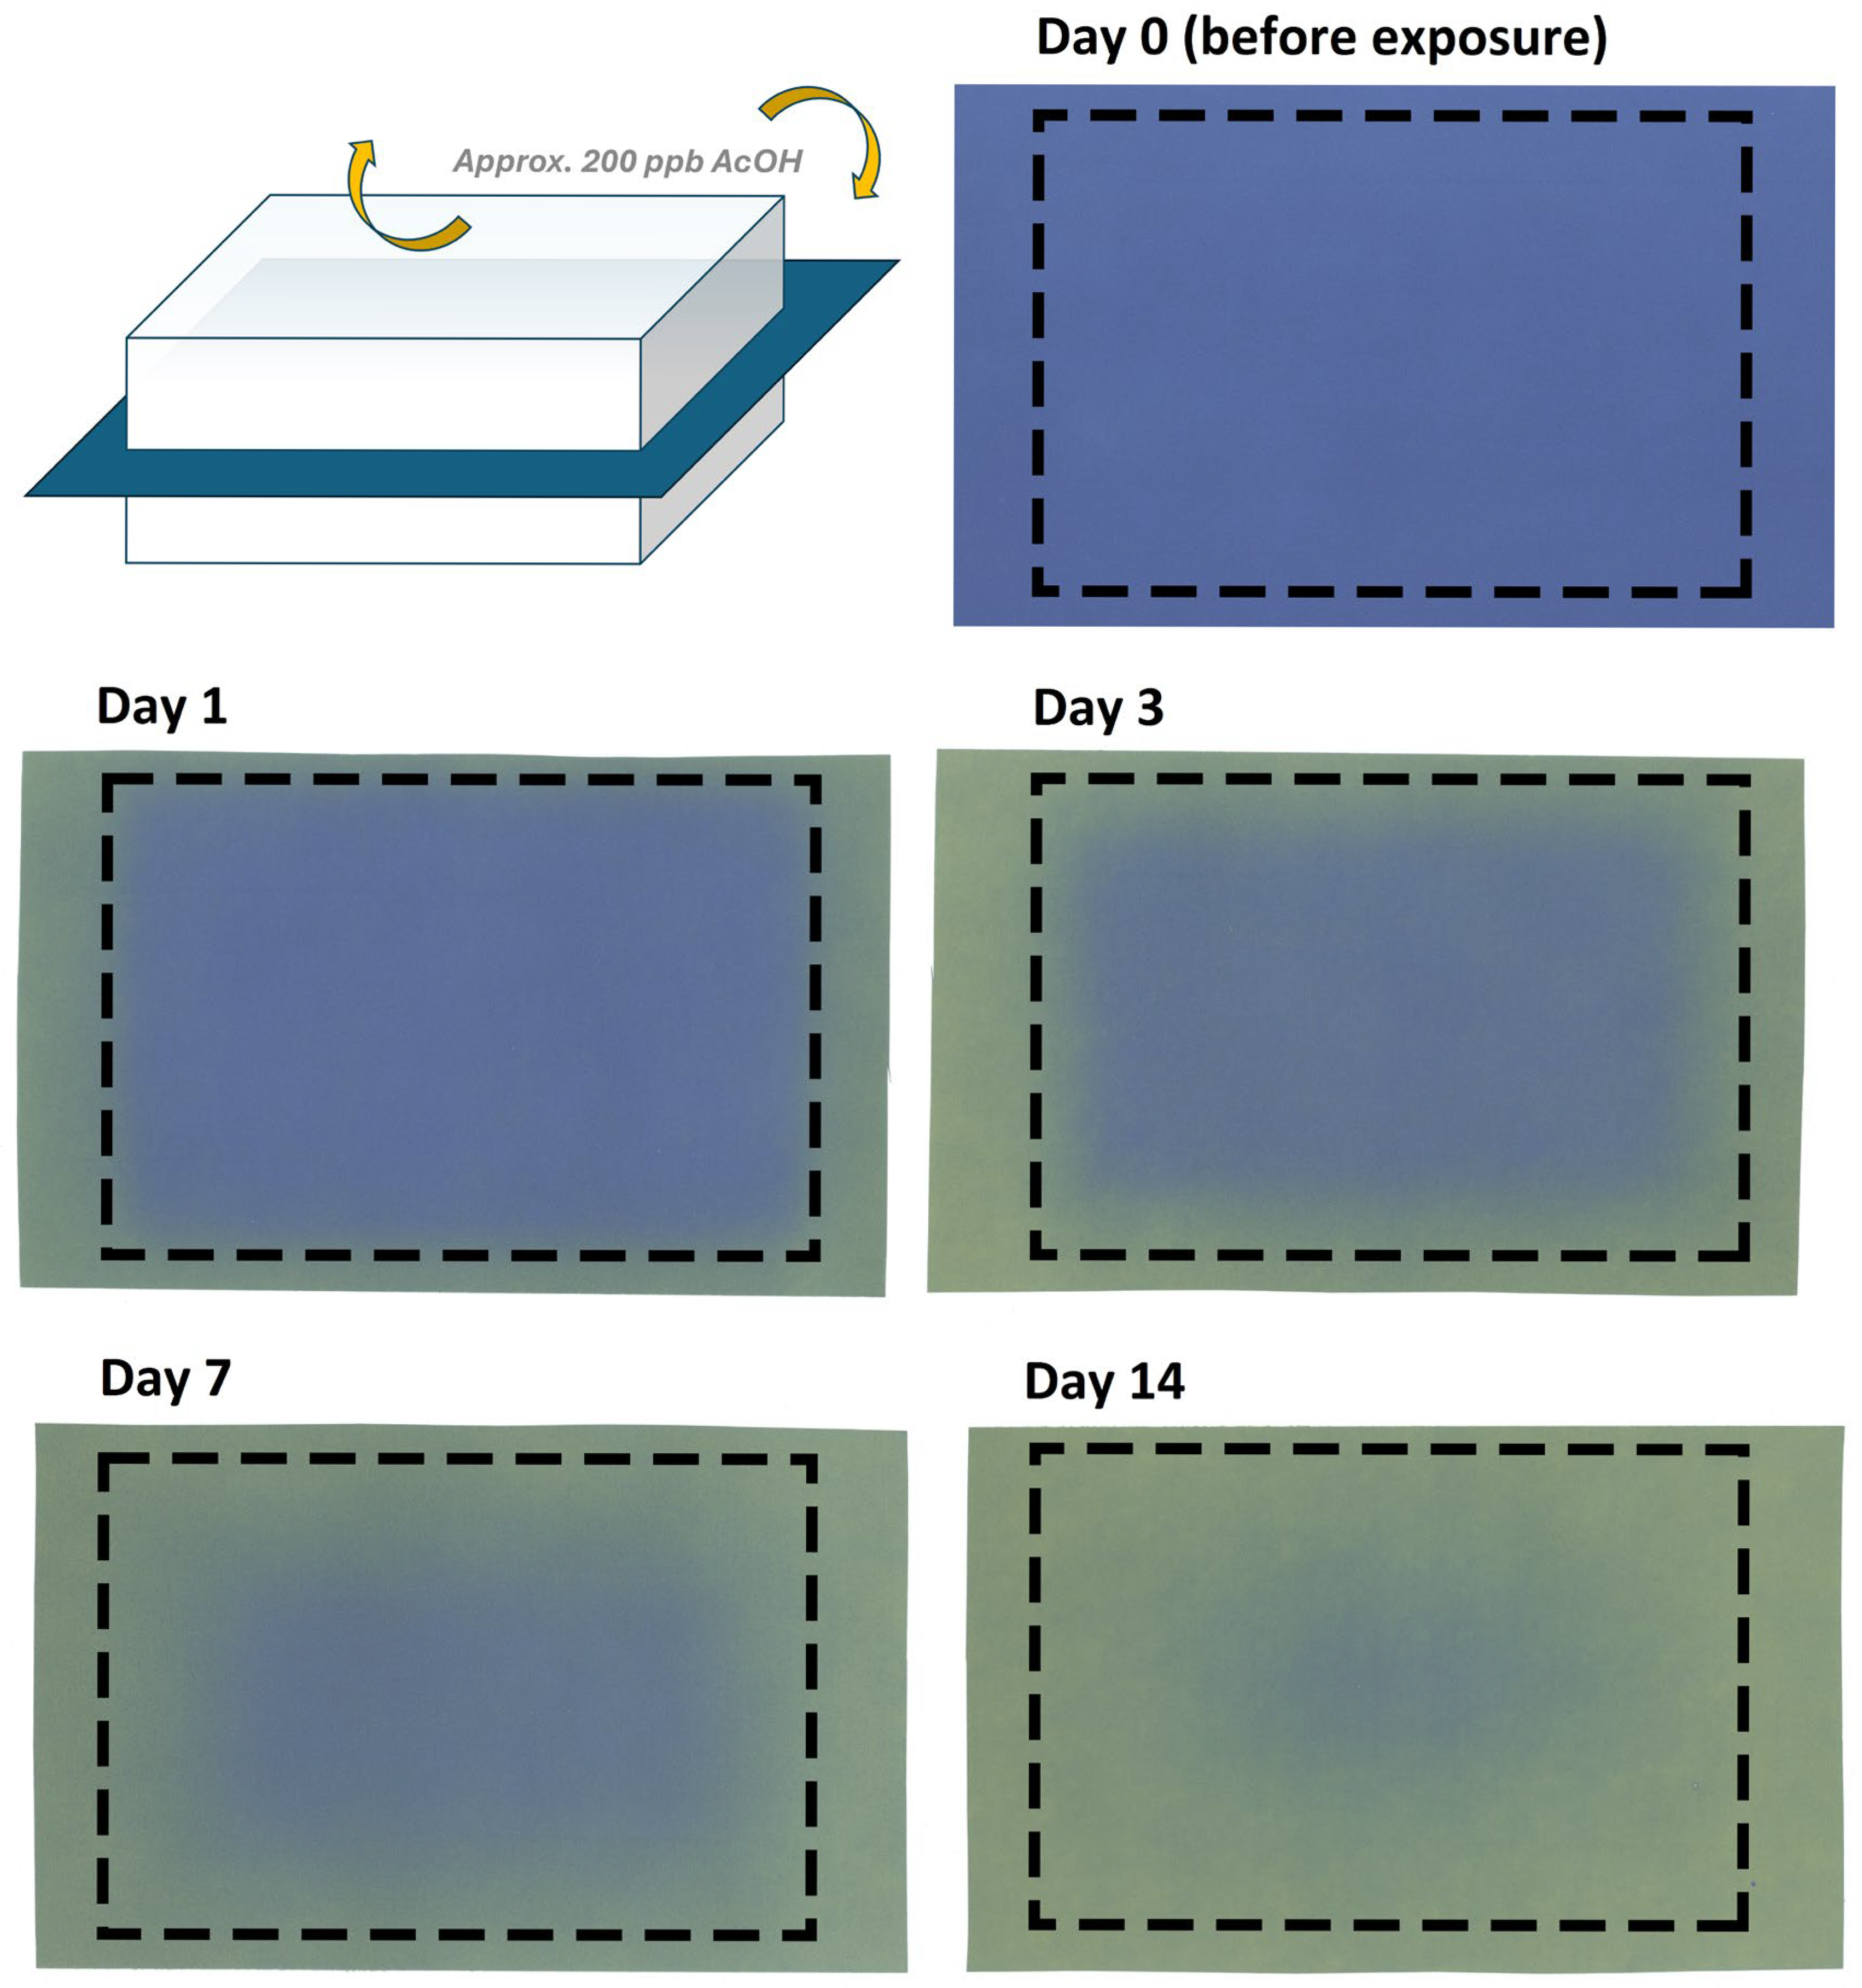
The stacks were exposed in a climate chamber to air containing approximately 200 ppb acetic acid, generated from glacial acetic acid in a glass vial. Acetic acid concentrations were monitored using IVL passive samplers for organic acids. Exposure durations of the stacks were 1, 3, 7, and 14 days. After exposure, the AD paper was removed and photographed. The colour change in the AD paper (from blue over green to yellow) was used as a qualitative indicator of acetic acid infiltration into the paper stacks. AD paper sheets (custom order) were supplied by the Image Permanence Institute (Rochester, NY, USA).

4. Results and Discussion

This study addresses three common conservation situations: an archival cardboard box, a stack of newsprint, and bound books. These systems define some of the smallest microenvironments encountered in libraries and archives, yet they are widely used protective strategies. The results enable a more differentiated discussion of how these systems function physically, hygrothermally, and chemically under realistic conditions.

4.1. Archival Boxes as Barriers

The physical protective function of archival boxes is well established: they reduce handling stress, limit mechanical damage, and provide effective protection against dust and particulate matter. Their role as climatic barriers is more variable and depends on material permeability, construction quality, and the nature of the enclosed contents.
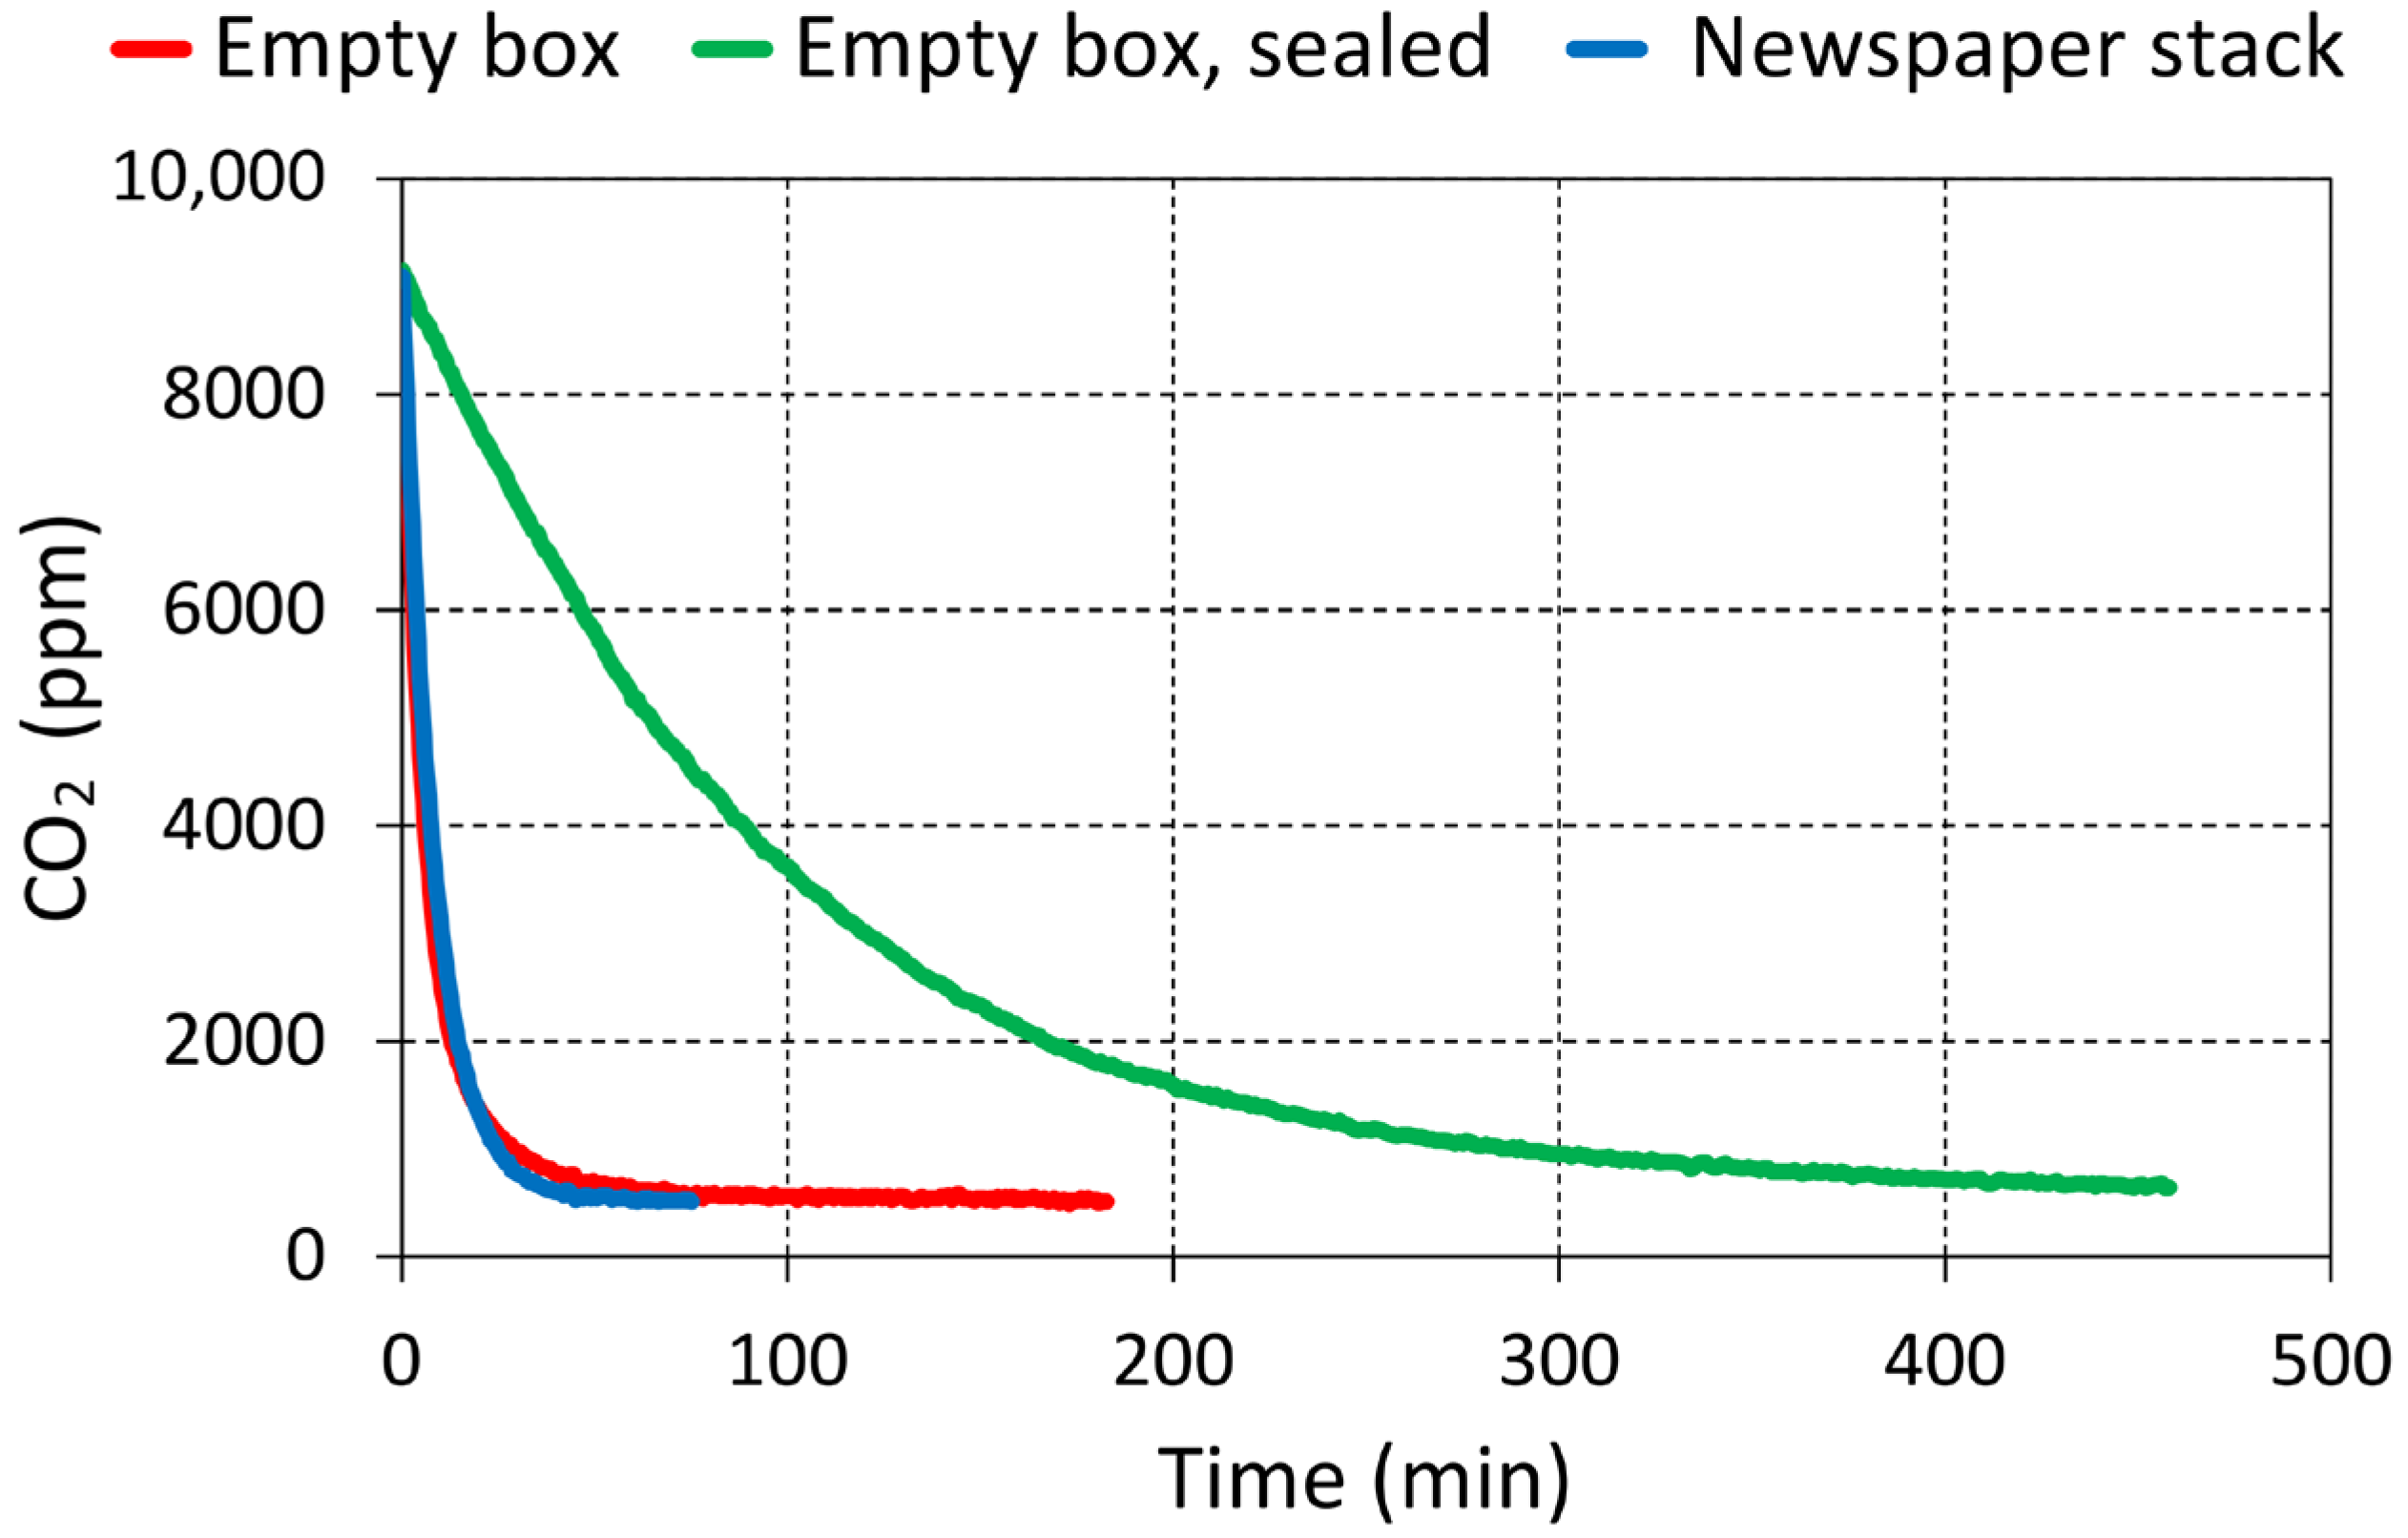
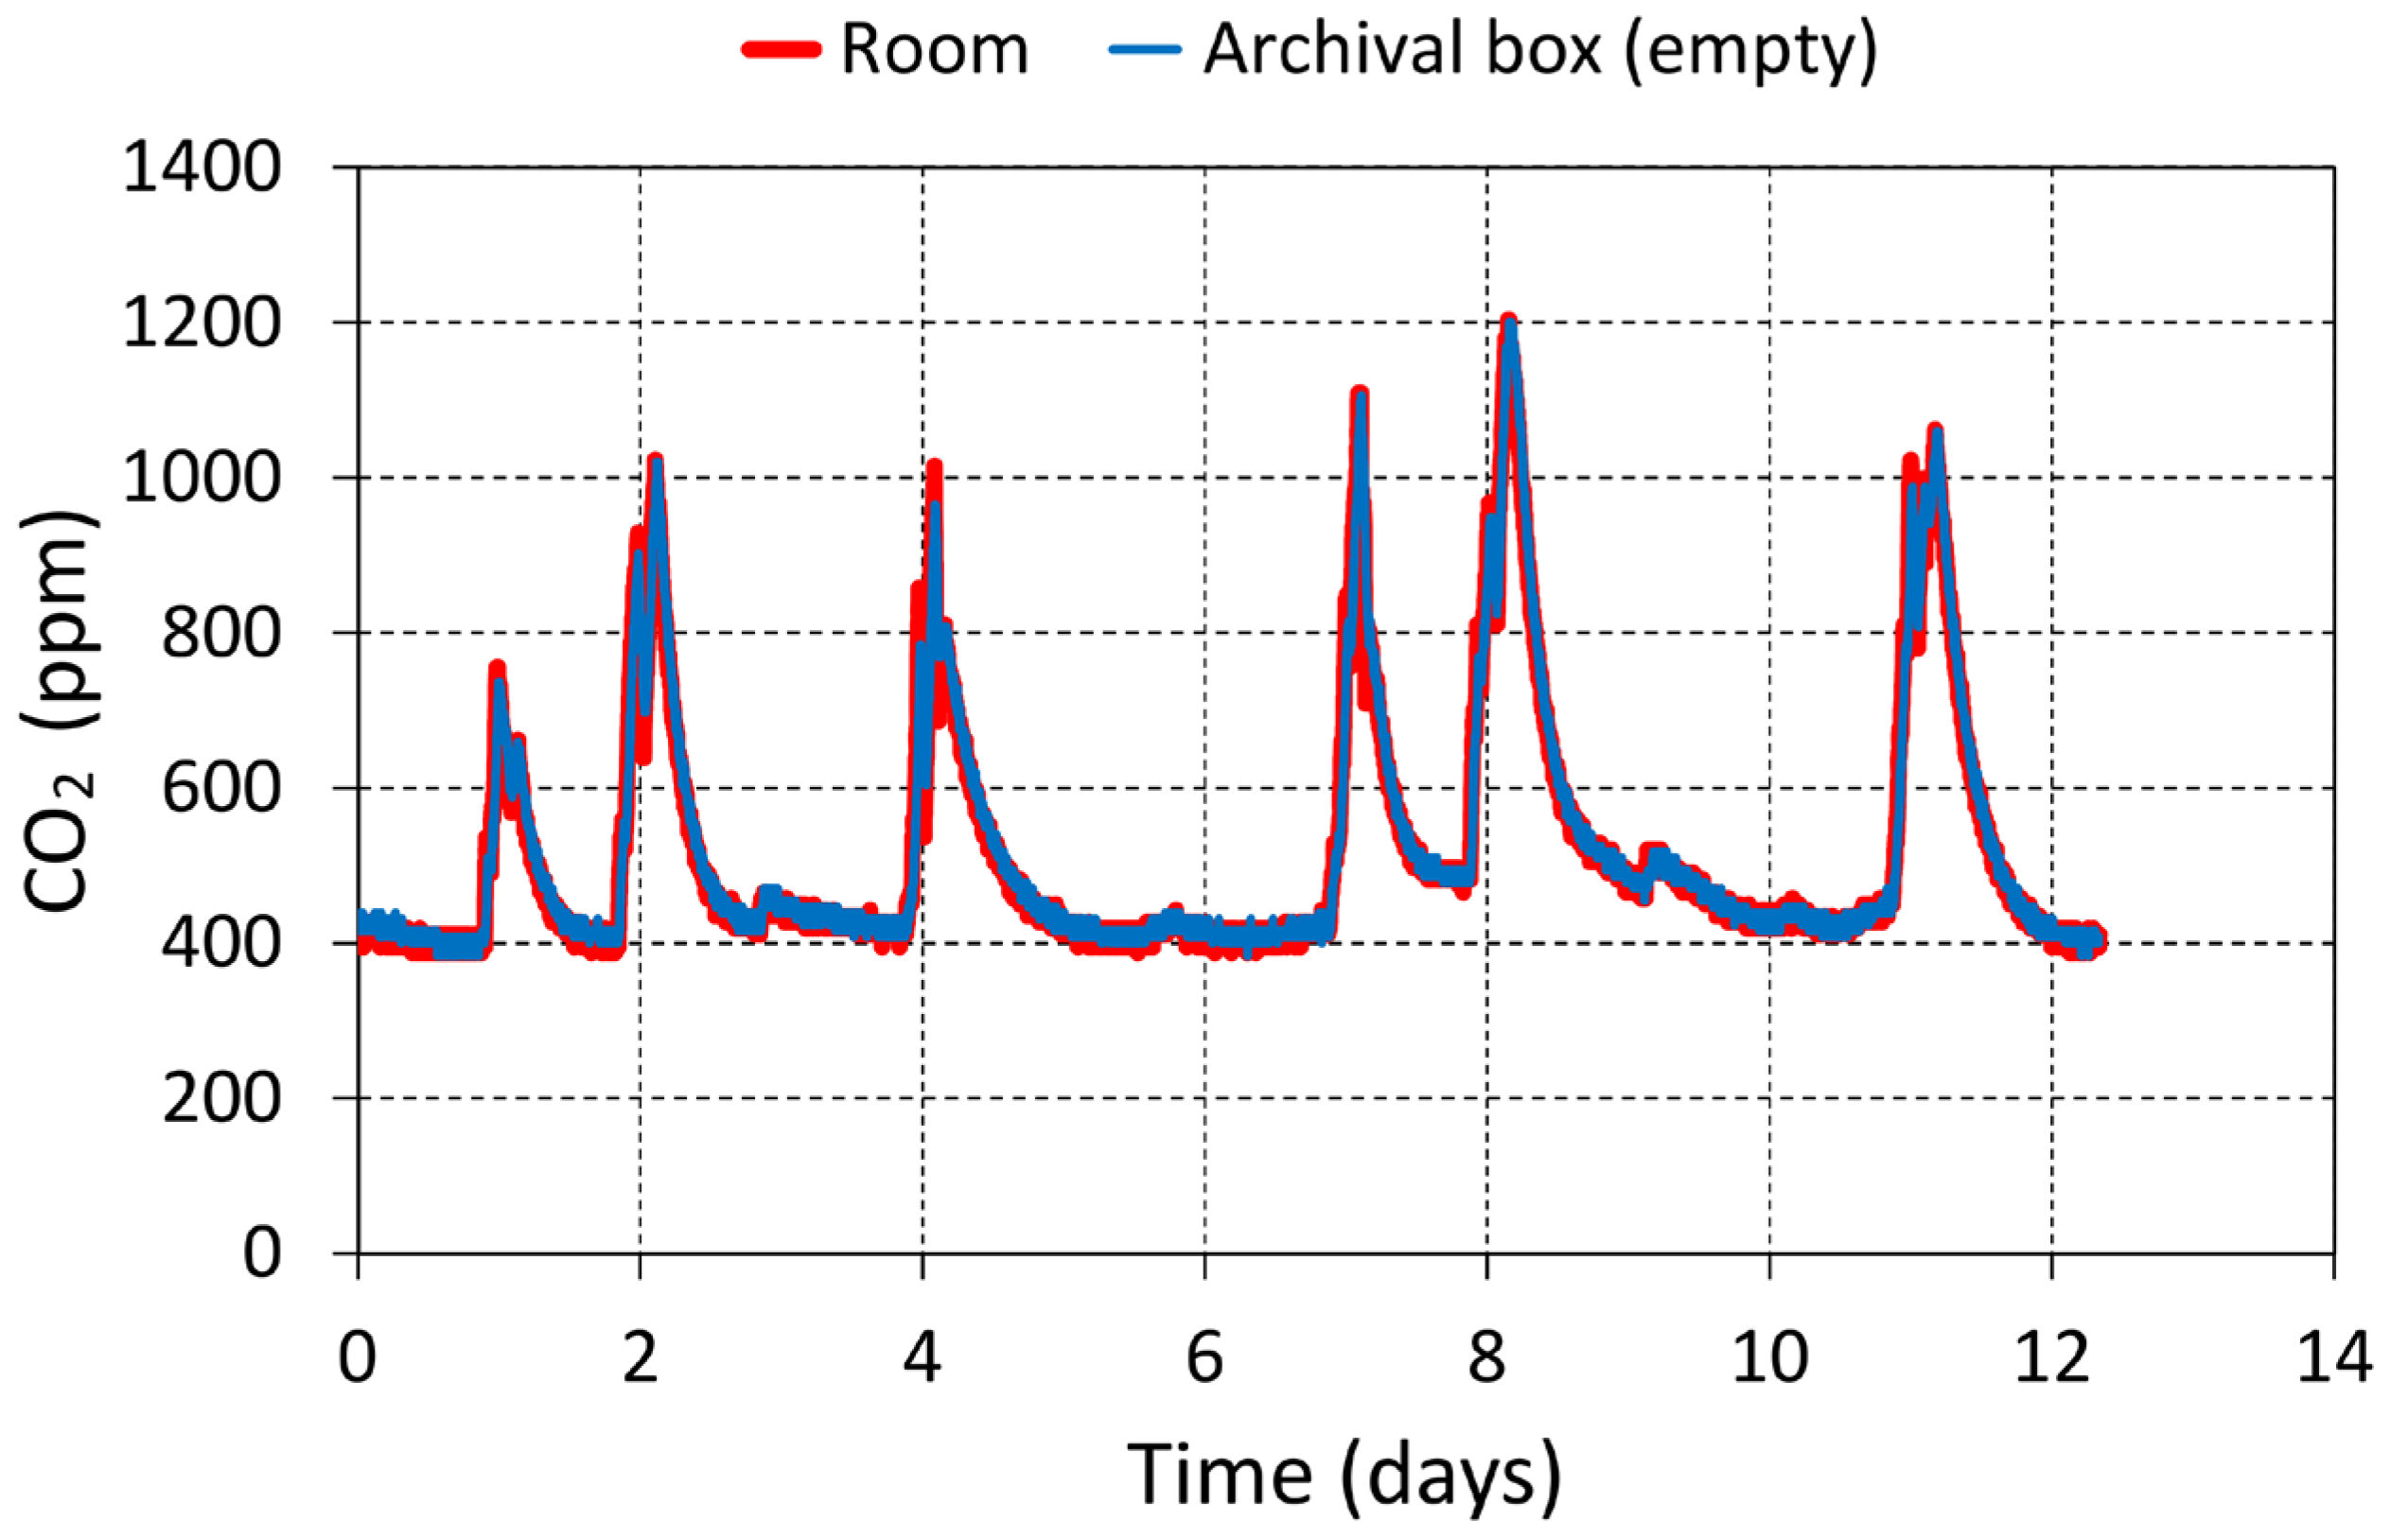
Quantifying AER is essential for evaluating microclimatic isolation. The concentration decay rate followed a decreasing exponential course during most of the three measurement periods, where it decreased linearly with its half-life, indicating a constant air exchange. The measurements show that the tested cardboard box (Box A) was not airtight at all; air exchange occurred readily through the porous board and at seams, yielding an AER of approximately 10 h−1 (Figure 2). Under these conditions, the internal atmosphere in an empty box closely followed room air, challenging the assumption that a closed box automatically creates a confined microclimate (Figure 3).
Lining the same type of box with aluminium foil (Box B) substantially altered behaviour by suppressing diffusion through the board and restricting exchange primarily to the seams. The AER decreased to approximately 0.6 h−1 (Figure 2). This comparison demonstrates that the permeability of enclosure materials, not geometry alone, largely determines whether a box behaves as an open or airtight microenvironment. This can, for example, affect one’s decision about box materials in terms of protection against air pollution (see below).
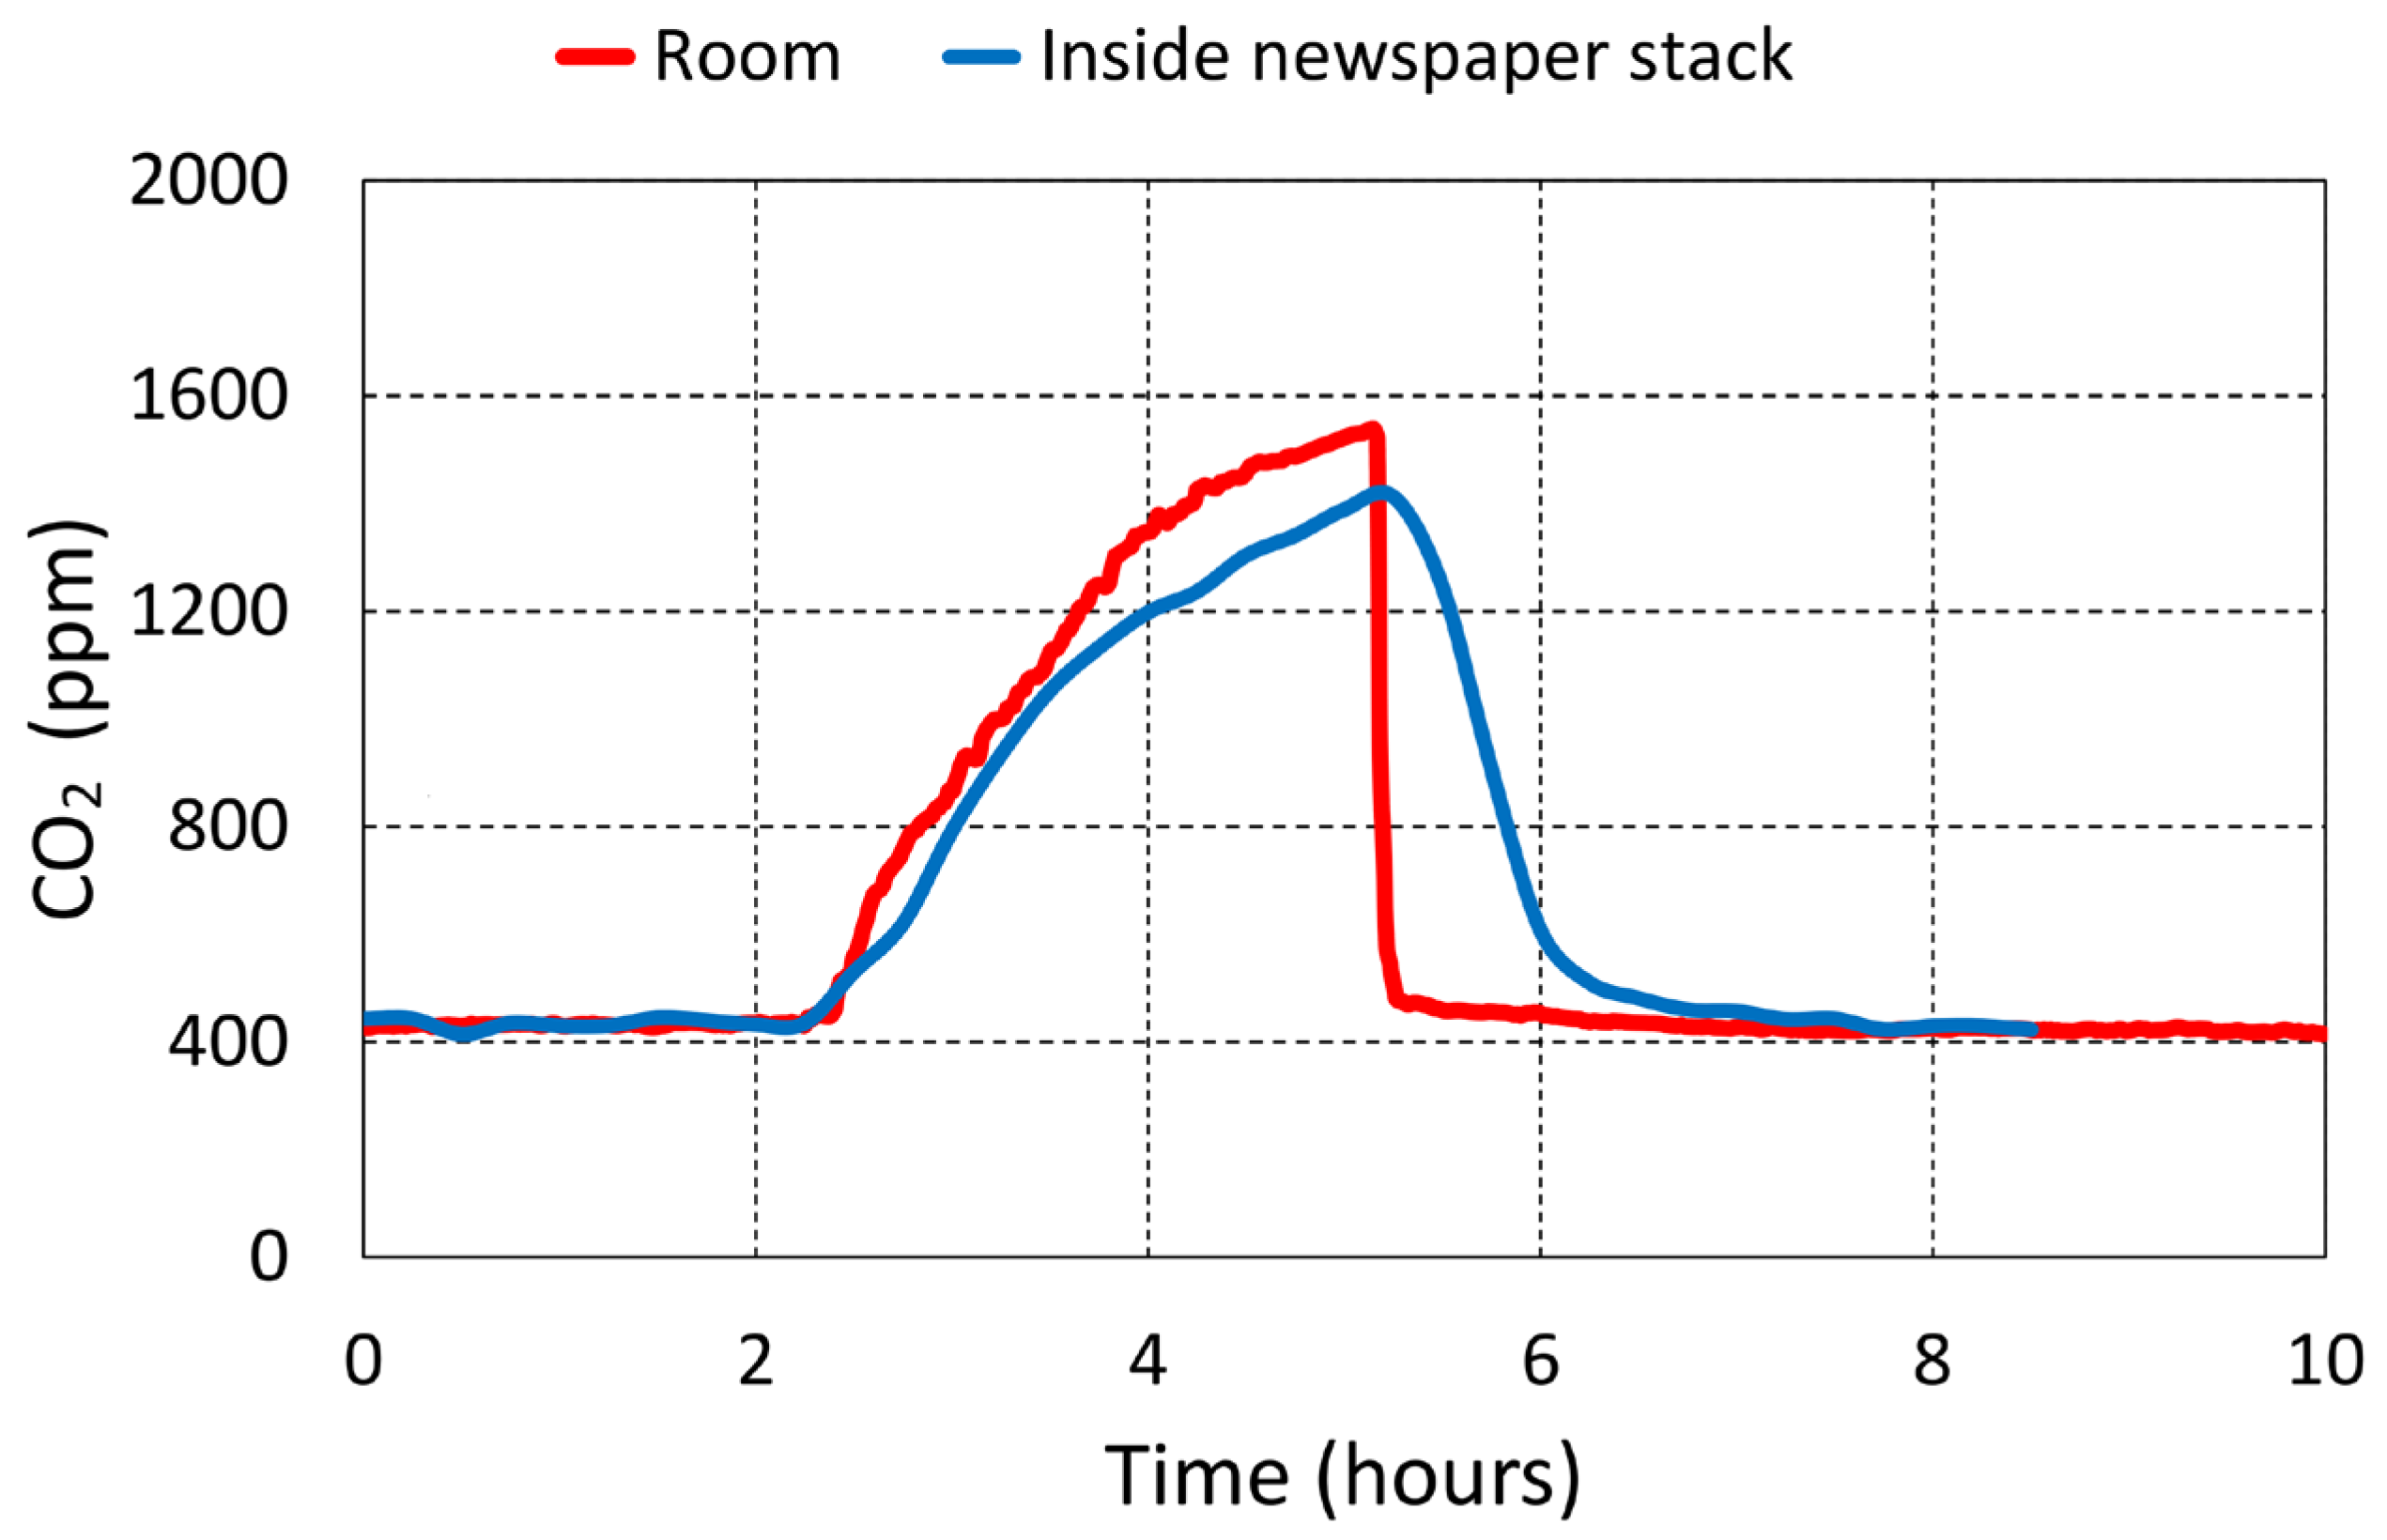
Even inside the newsprint paper stack, the CO2 concentration closely followed the ambient fluctuations. The close-up of a daily CO2 concentration peak (Figure 4) shows a microclimate that lags only minutes behind that of the room.

4.2. Thermal Behaviour

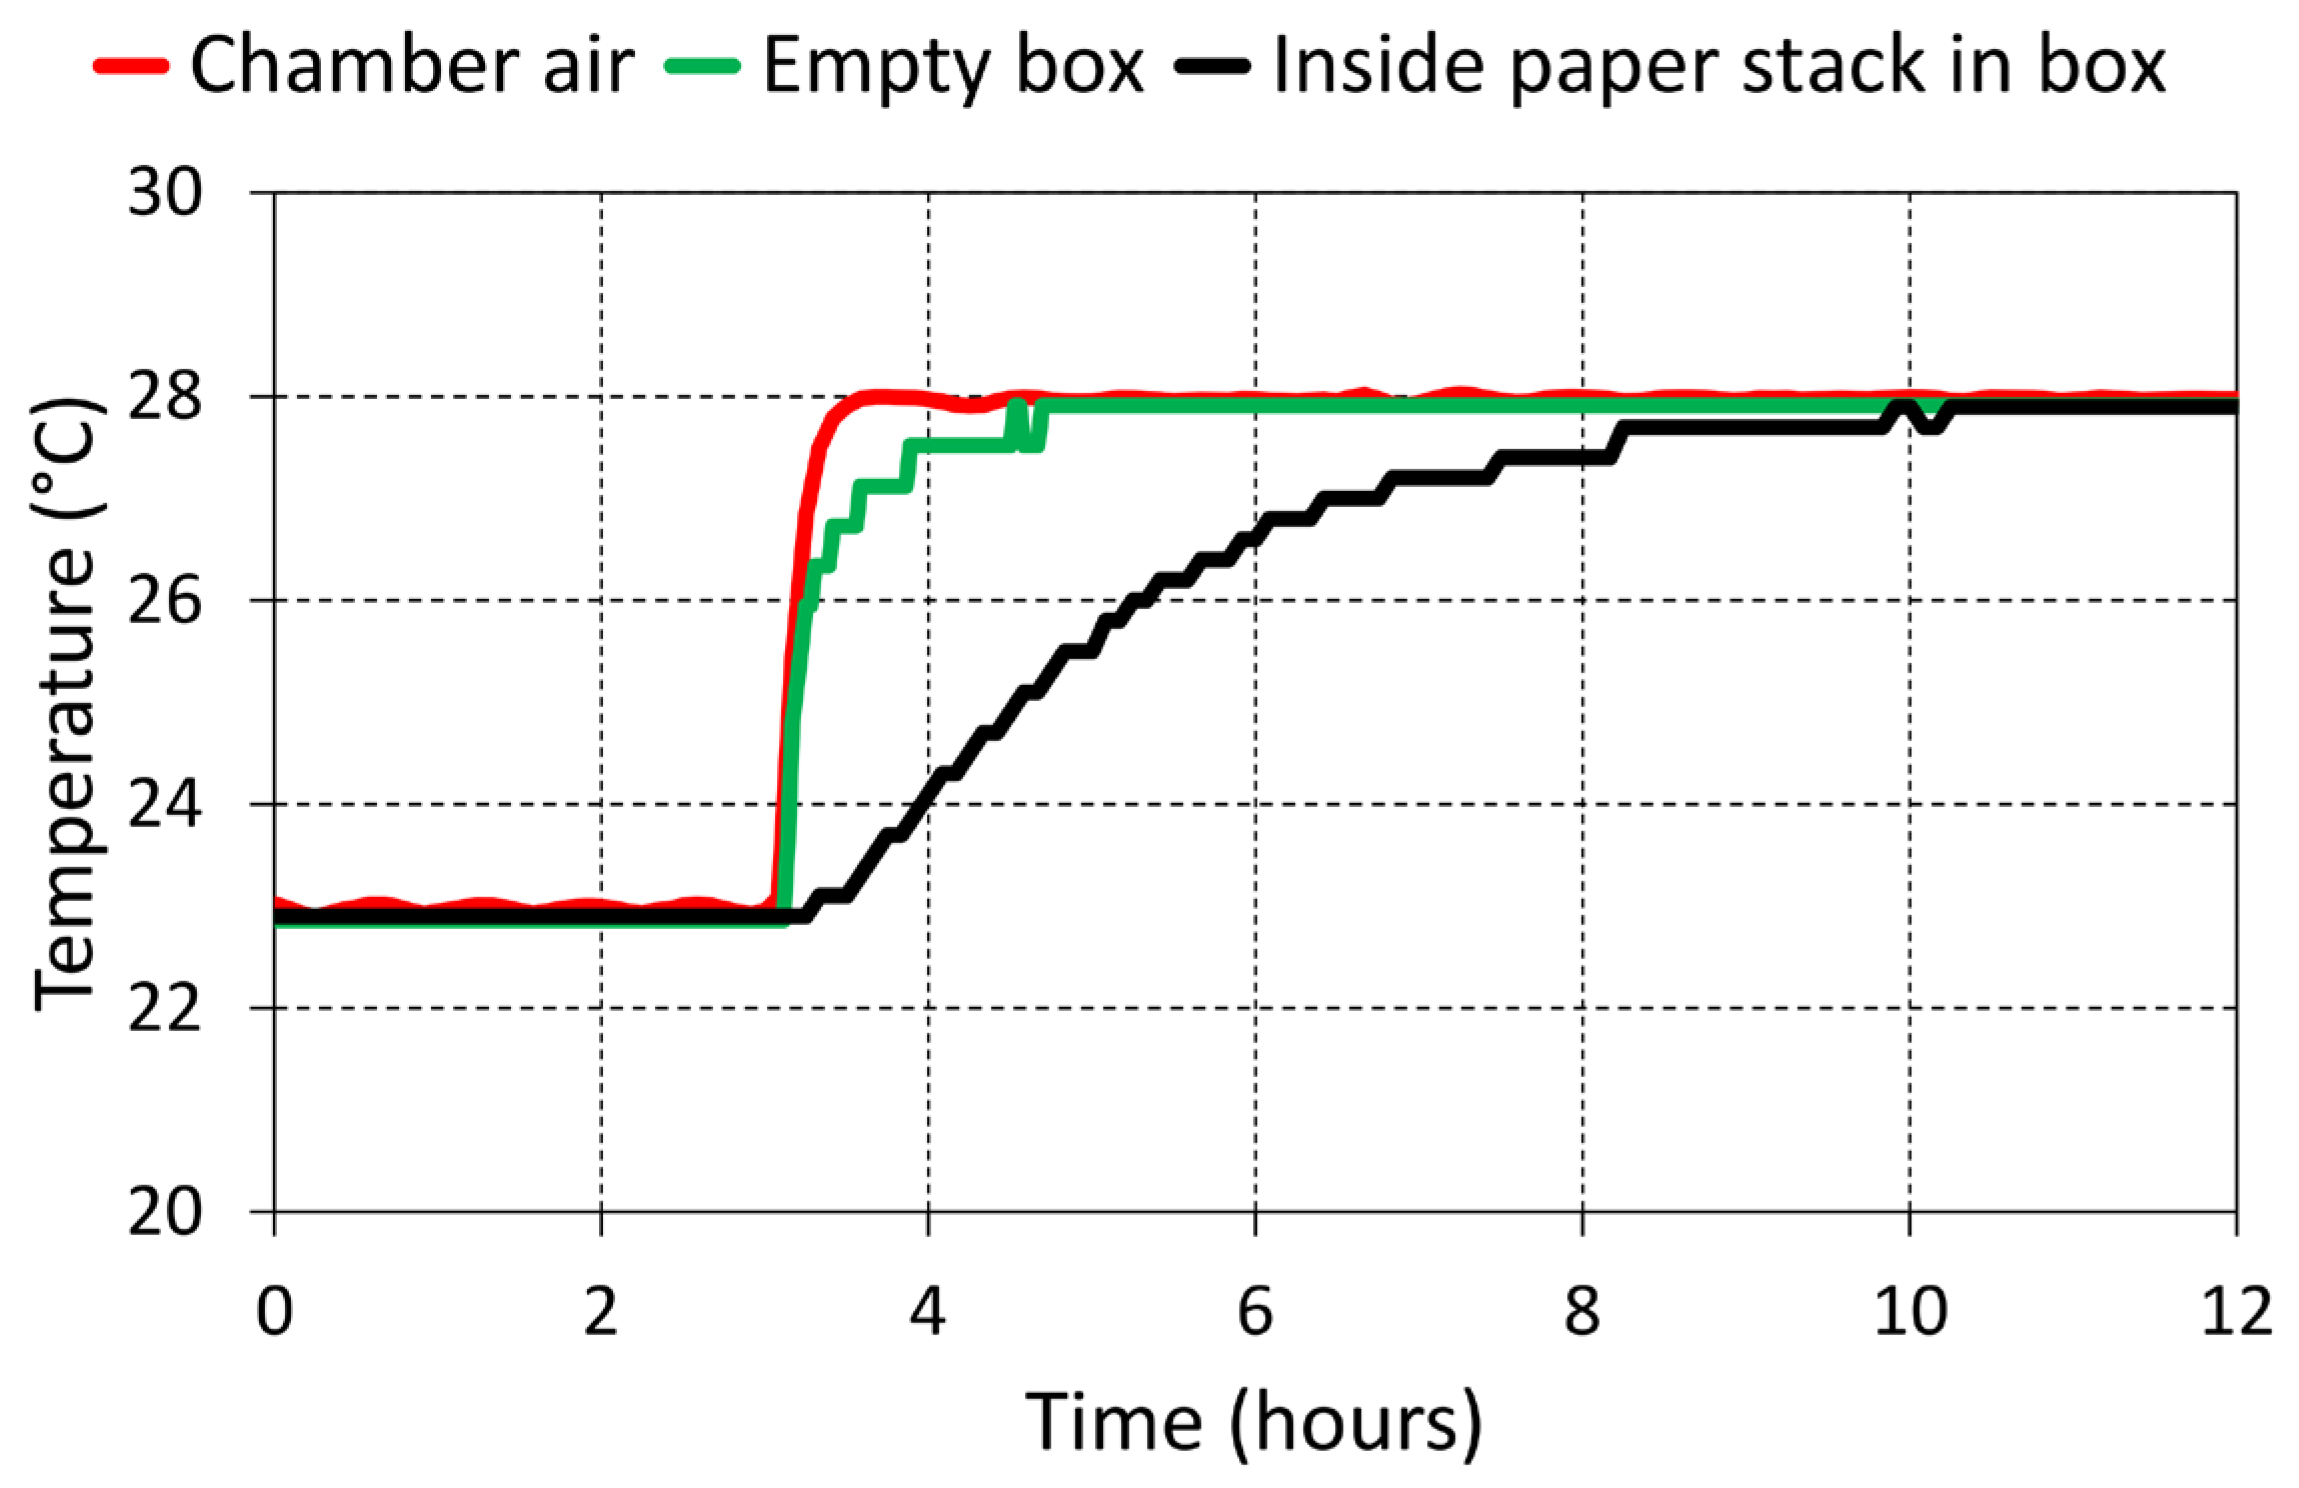
An empty archival box provided limited thermal buffering: the internal temperature tracked room temperature closely with minimal lag, consistent with the low thermal mass of cardboard. Filling the box with paper introduced thermal inertia, producing a delayed temperature change within the enclosure, taking about three times longer, but still a relatively rapid change (Figure 5).
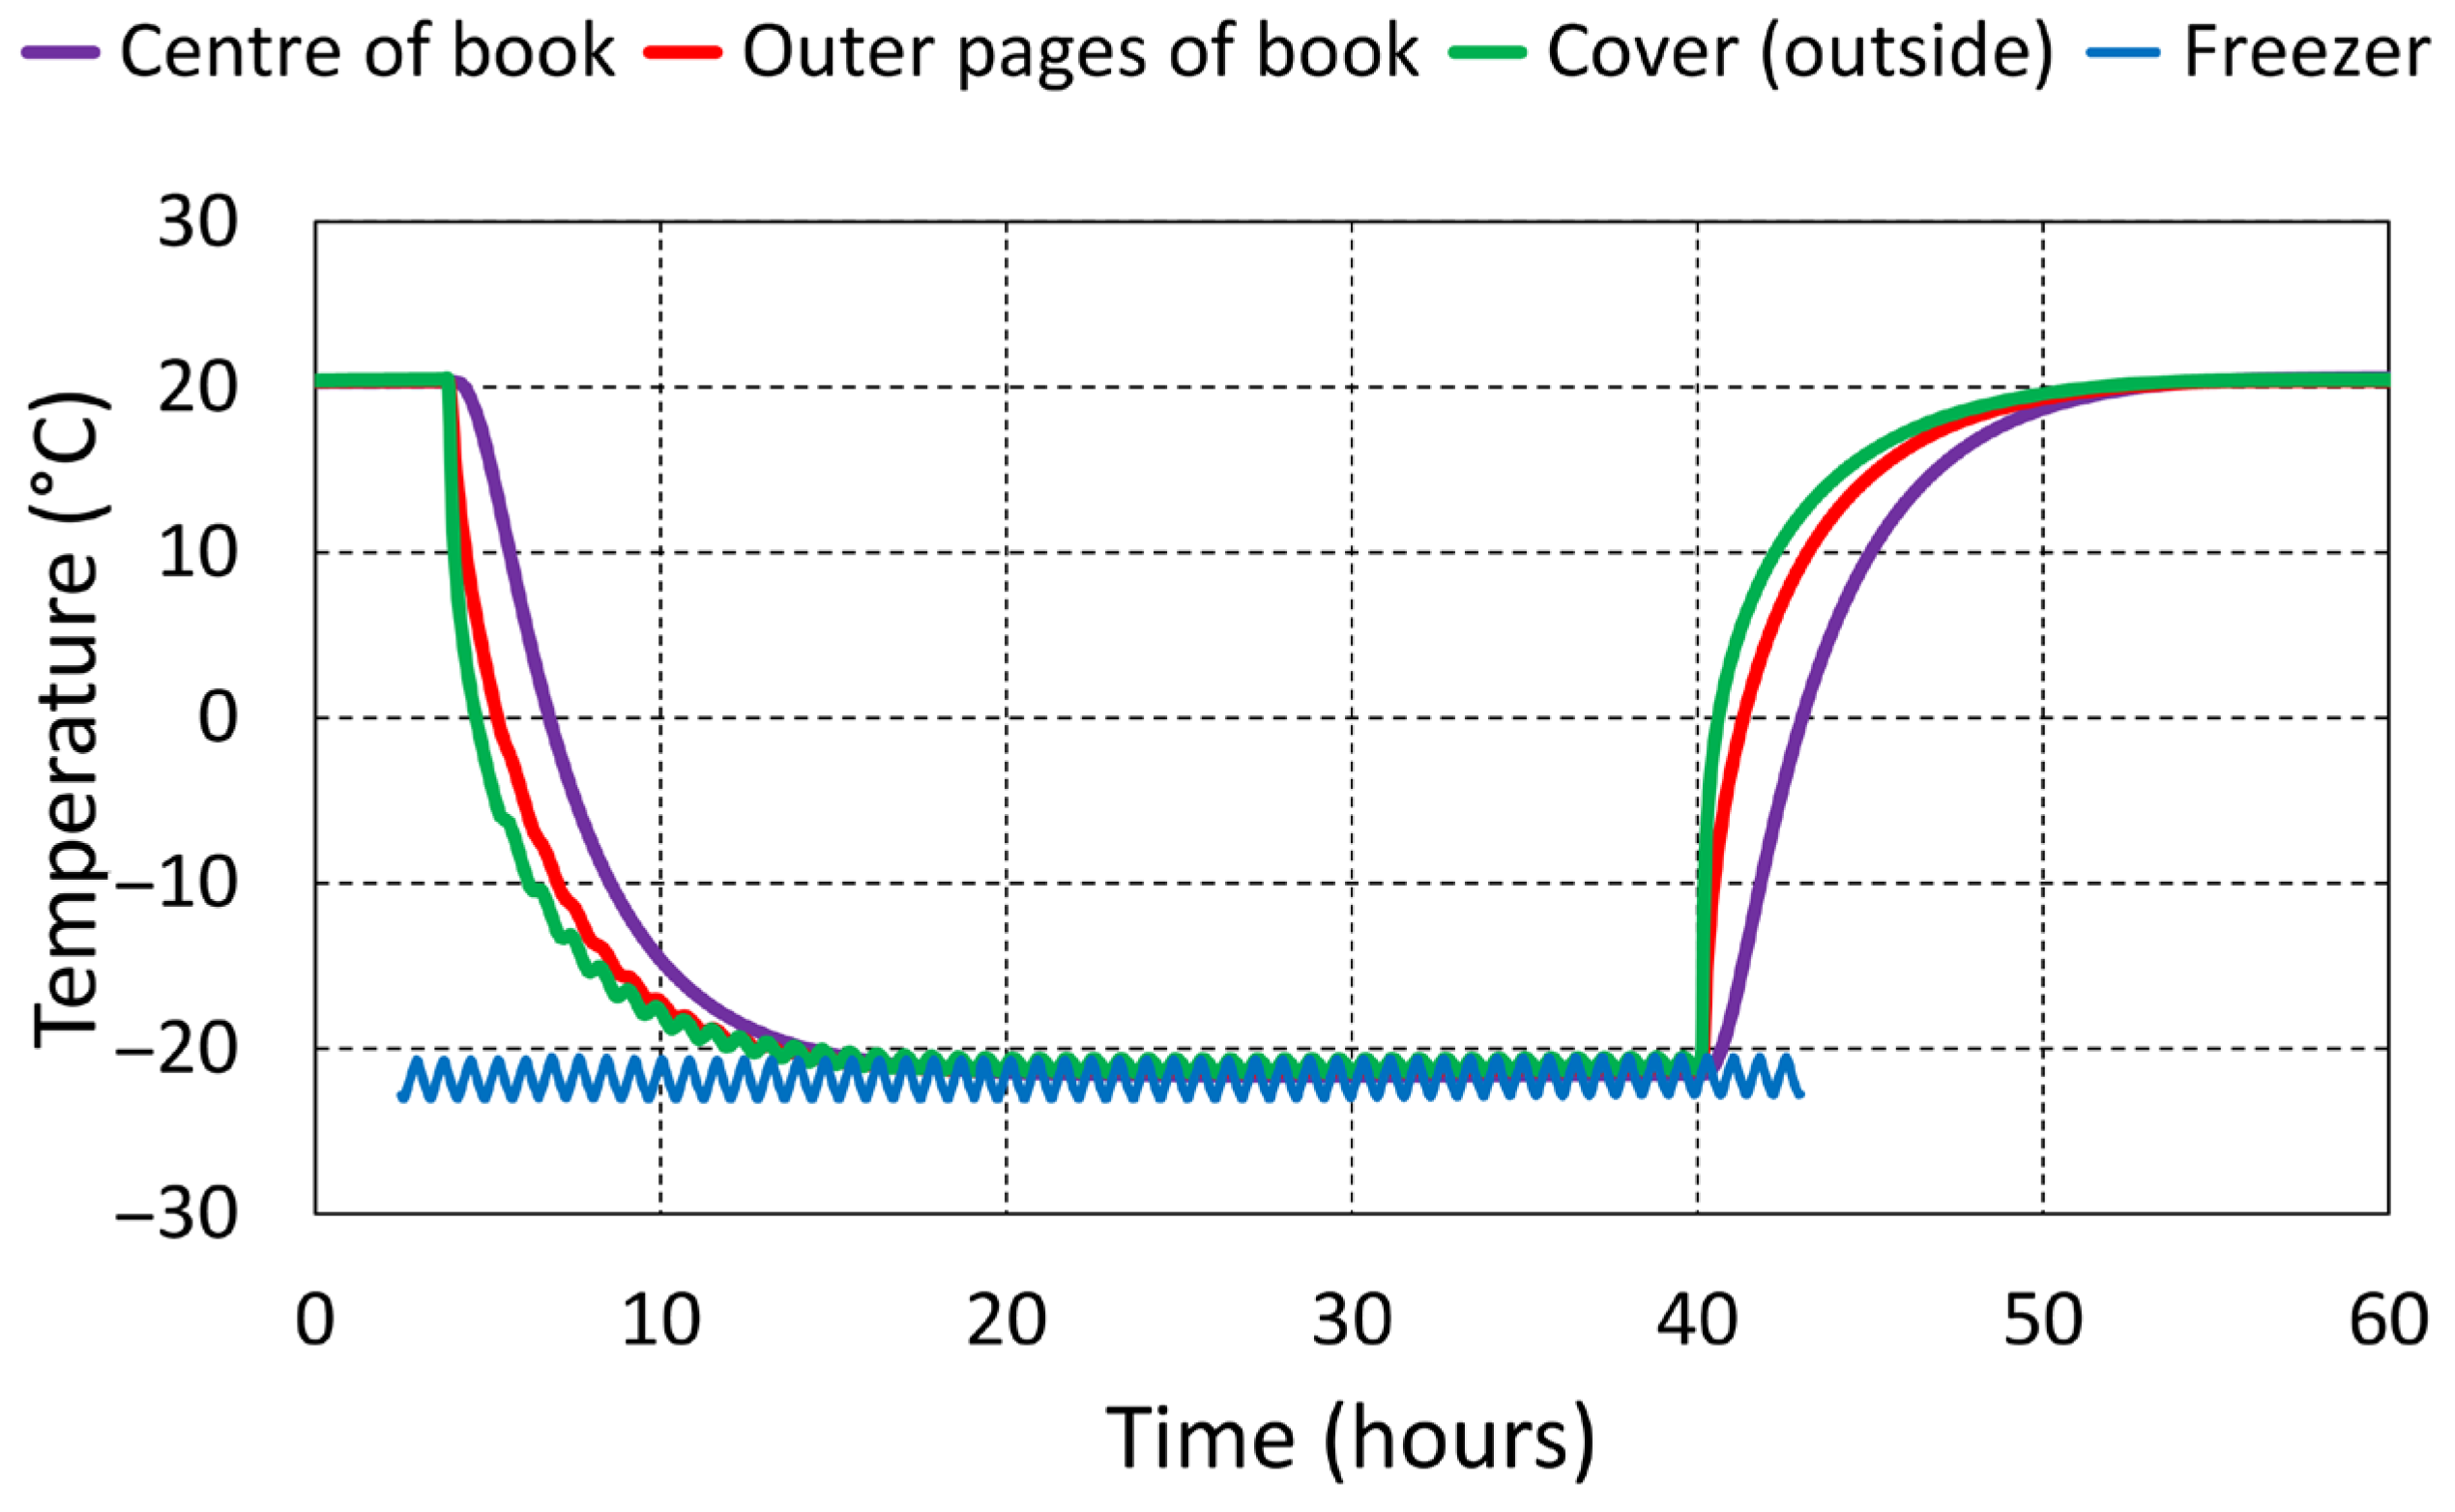
Similar behaviour was observed in books, where transient temperature gradients developed across the book block. Although outer pages responded faster than the core, temperature equilibration at the centre of a book went relatively fast, even for a quite thick and heavy book, as shown in Figure 6, when exposed to large and sudden temperature changes as used in pest treatments (by freezing). The temperature change in the centre of the book block was approximately 2–3 h behind that of the sides near the cover. Although these temperature effects were modest compared with RH buffering (see below), they remain relevant because local temperature differences shift equilibrium moisture content and can contribute to RH gradients during ambient change [1].

4.3. Humidity Dynamics

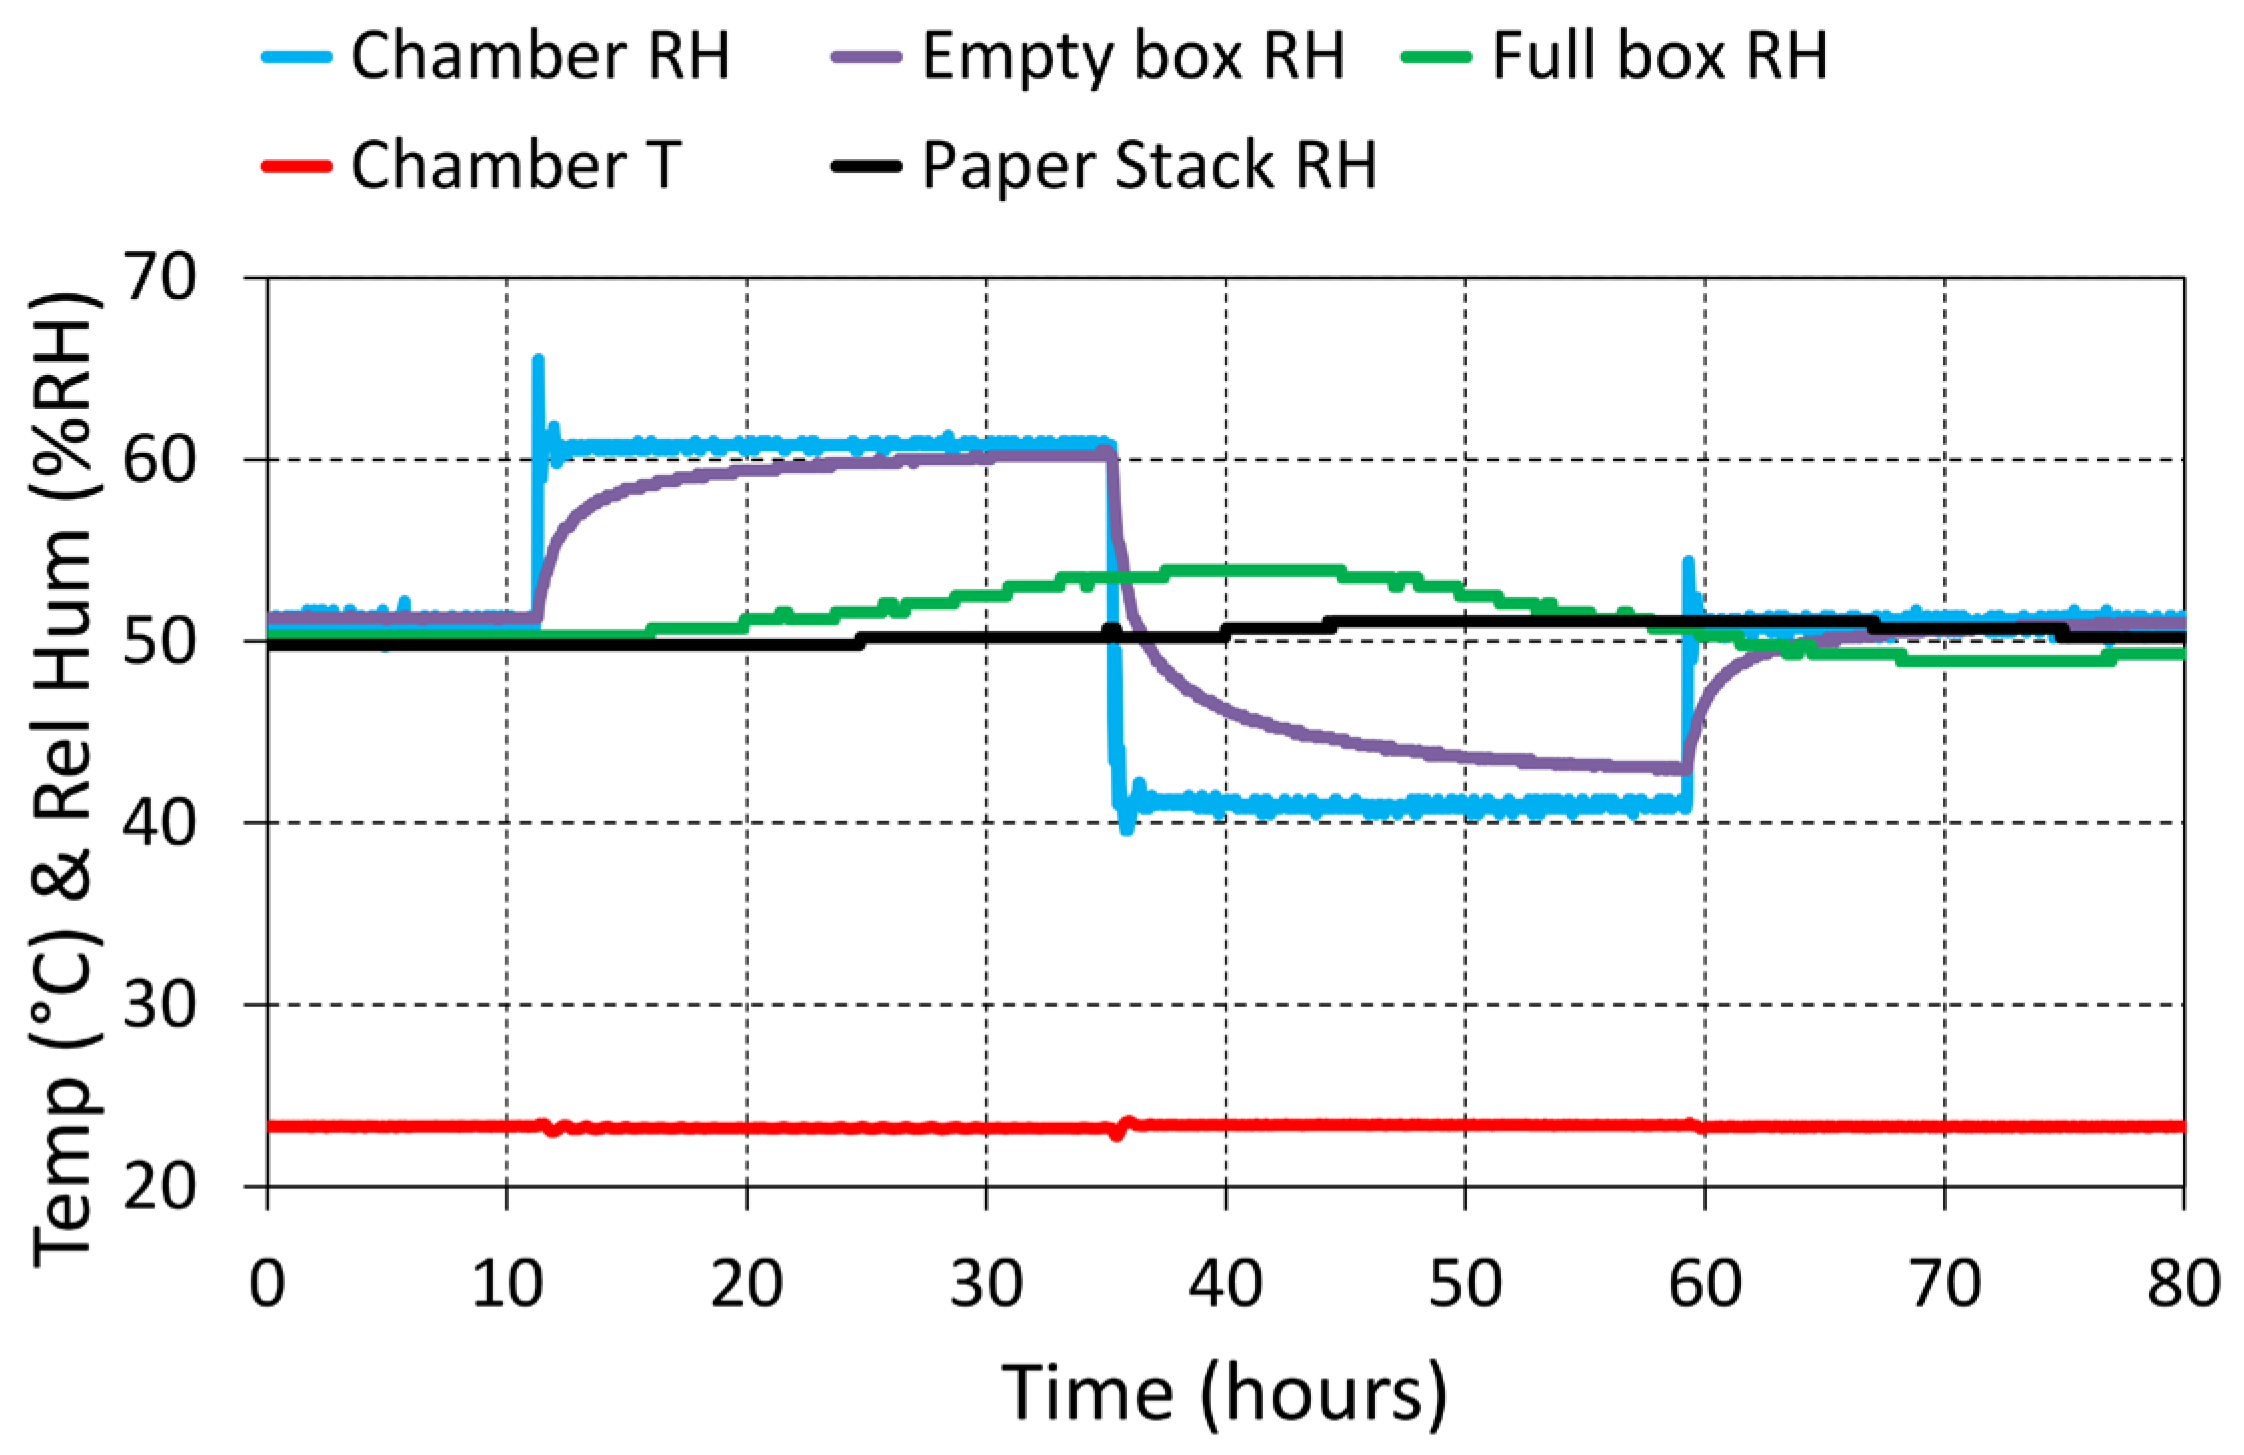
The most pronounced microclimate effect concerned RH, whose behaviour was governed primarily by hygroscopic buffering. In an empty box, internal RH responded quickly to external change (Figure 7). Once a large mass of hygroscopic materials was present (a box full of paper), response slowed dramatically. The average RH level, however, is determined by the humidity level of the surroundings and will, in the long term, be the same as that of the ambient.
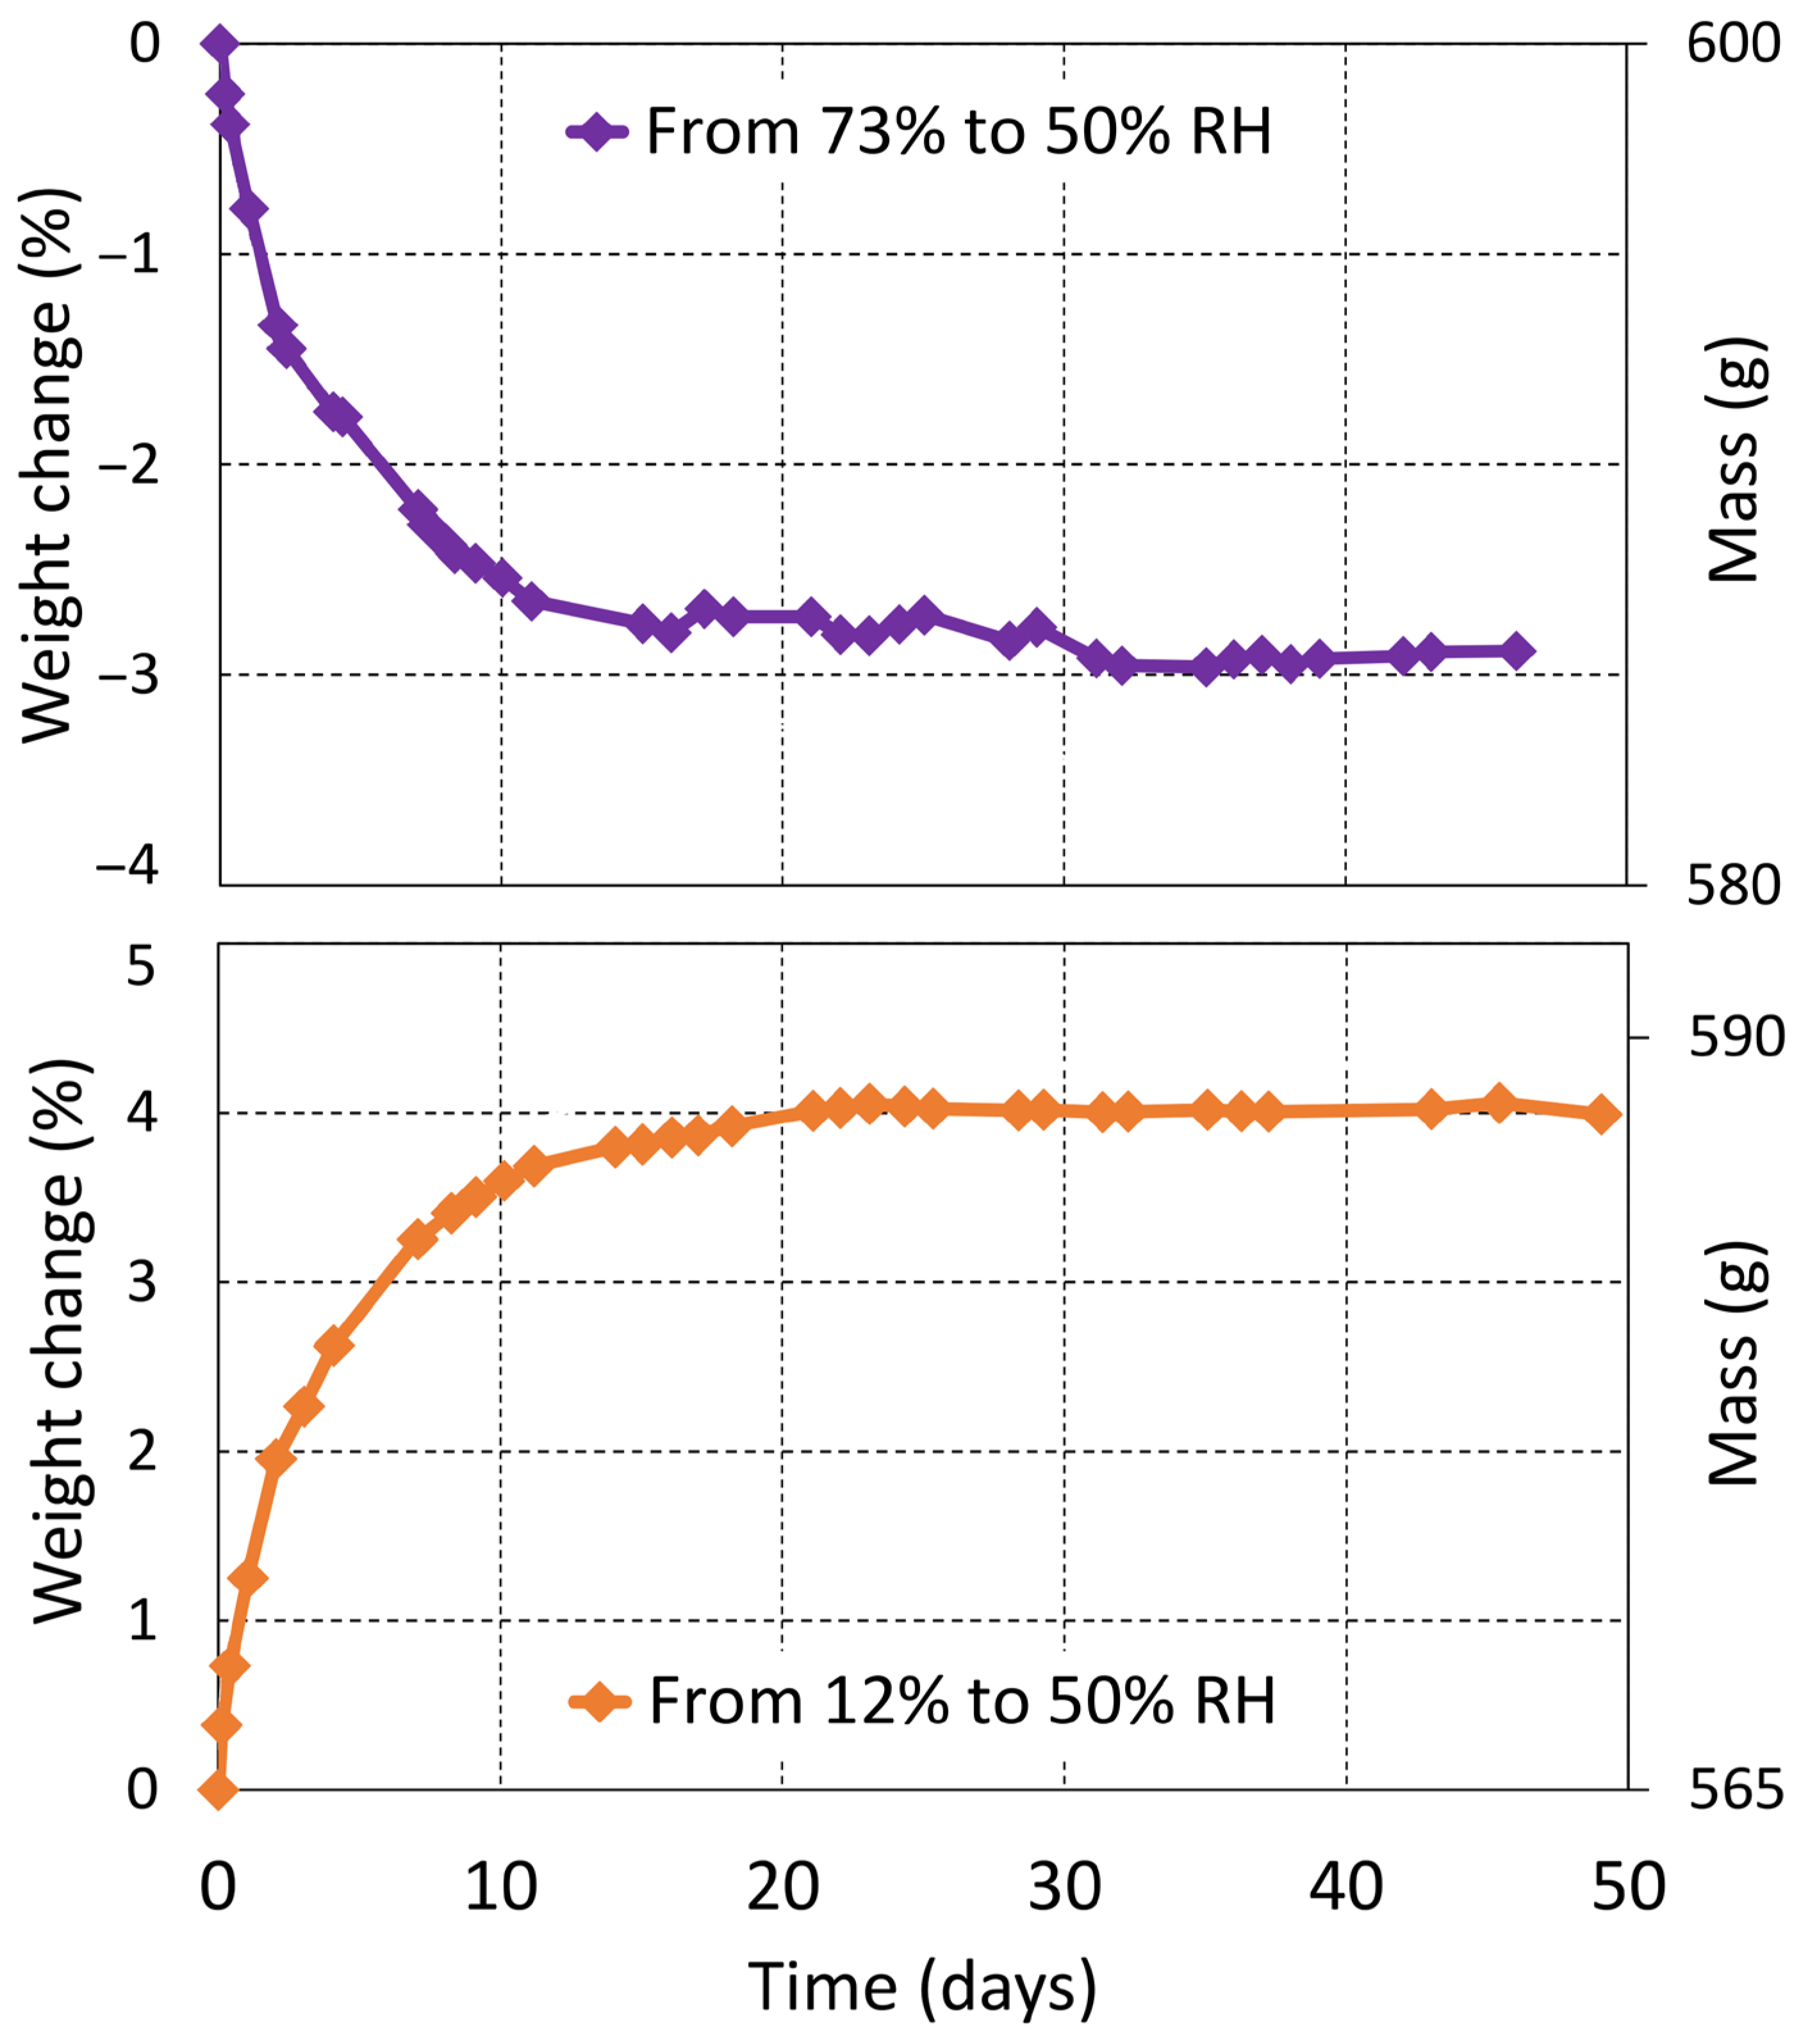
Within paper stacks and book blocks, RH change penetrated only gradually into the material matrix. While the air inside a box may reflect ambient RH changes relatively quickly, the interior of a dense paper mass can remain nearly unchanged for extended periods (Figure 7). Equilibration times ranged from days to weeks, depending on mass and density. In the gravimetric book experiment (Book B), the closed, but otherwise freely exposed book required more than 20 days to reach a new equilibrium after step and sudden changes in RH (Figure 8). It can be noted that when the weight of the book did not reach exactly the same weight after each test, this can be attributed to the well-known hysteresis effect for moisture adsorption and desorption in paper, which is why paper can have a range of moisture content values when in equilibrium at a given RH [1,27].
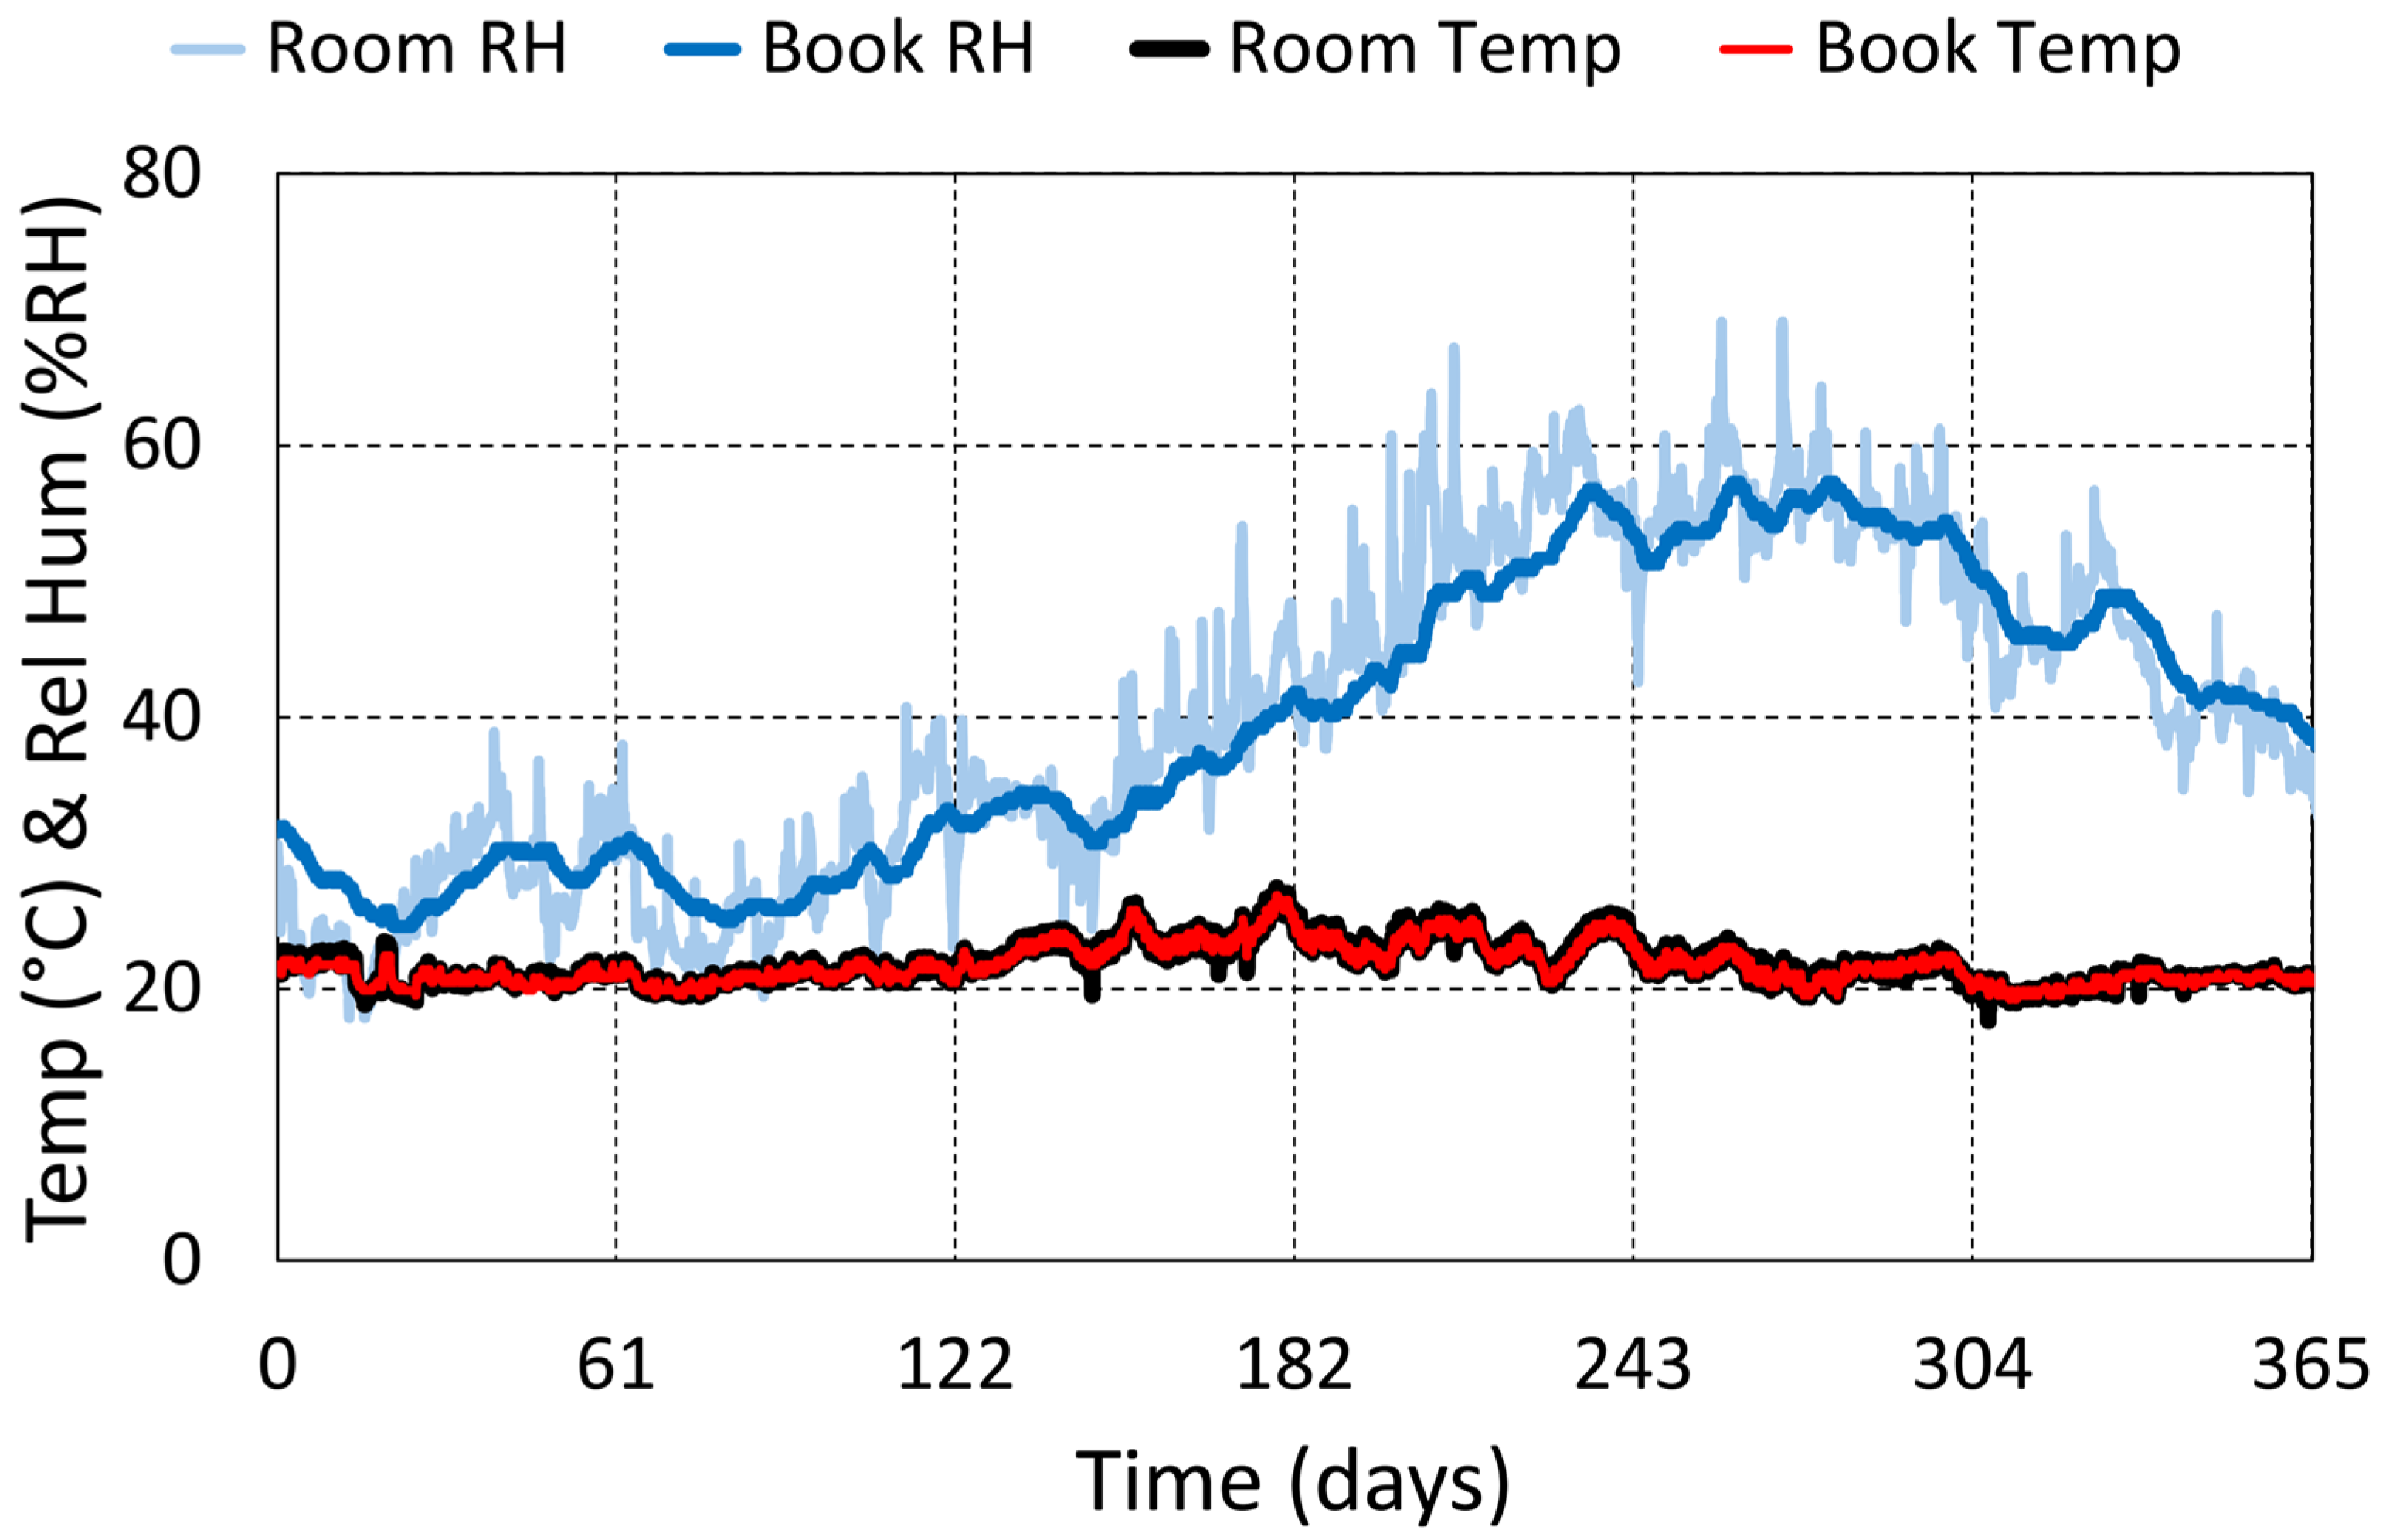
Consequently, short-term RH fluctuations in the surrounding environment are effectively filtered out and may not reach the interior of books or stacks. Over longer periods, however, the internal RH follows the slow trend of the room climate. One-year monitoring of a shelved book showed that internal RH converged toward the seasonal mean with much reduced amplitude and a pronounced time lag (Figure 9), indicating that books act as low-pass filters; they attenuate rapid variations but transmit slow changes.

4.4. Chemical Activity

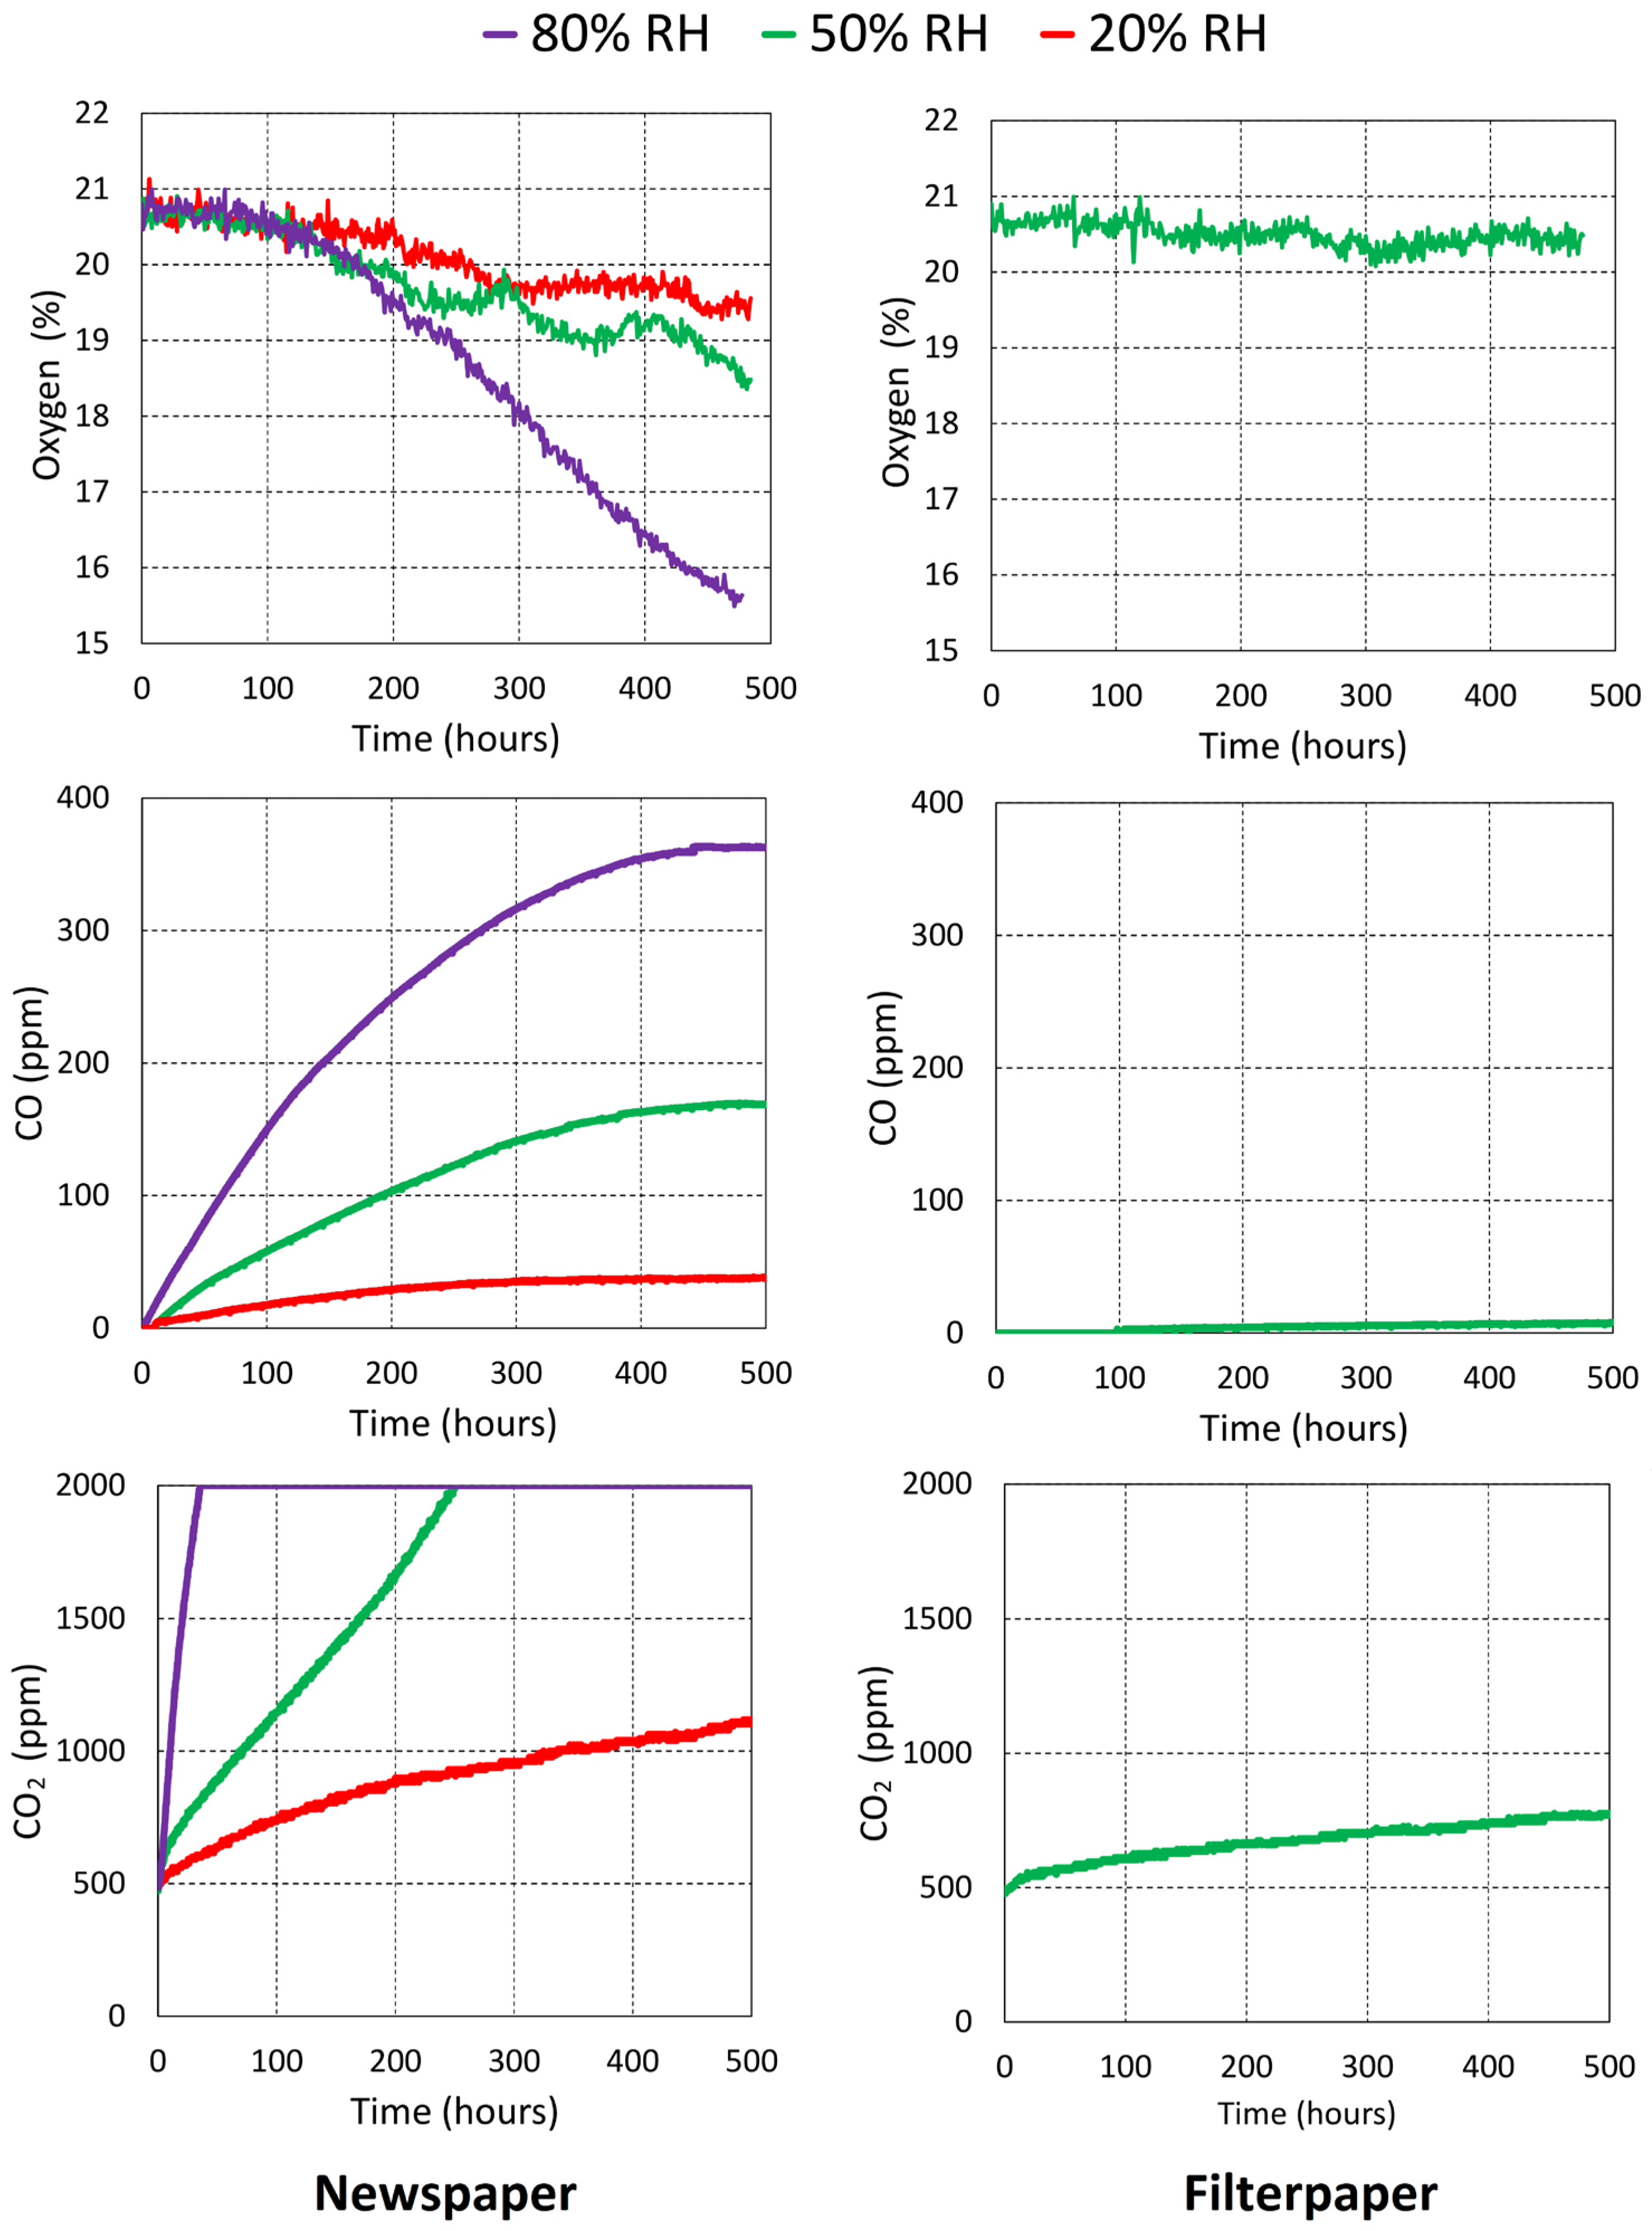
Microclimates inside boxes, books, and stacks are not chemically inert. Cellulose-based materials can act as both sources of degradation products and reactive sinks for gases, depending on their composition and purity [47]. Laboratory experiments with enclosed paper samples in airtight vessels showed that acidic, wood-containing newsprints consumed oxygen and accumulated decomposition products, consistent with oxidative and hydrolytic processes in deteriorating paper (Figure 10). In contrast, neutral (pure cotton linters) filter paper showed markedly lower gas exchange, indicating slower chemical activity (Figure 10).
The CO readings should, however, be interpreted cautiously. Although the CO readings in open air showed realistic background levels (near 0 ppm), the levels reached for the enclosed samples were unusually high. The manufacturer does not publish cross-sensitivity information for the Lascar CO logger, but electrochemical CO sensors can exhibit responses to other oxidisable gases, e.g., certain VOCs. In this study, CO measurements are therefore interpreted as indicative of CO and/or related oxidisable species and are used primarily for demonstrating that some degradation products are being released from the samples. CO is a known pollutant from certain wood products (e.g., fresh wood pellets) [48]; however, to the author’s knowledge, it has never been registered previously in archive or museum environments or has been an emission of concern from heritage papers.
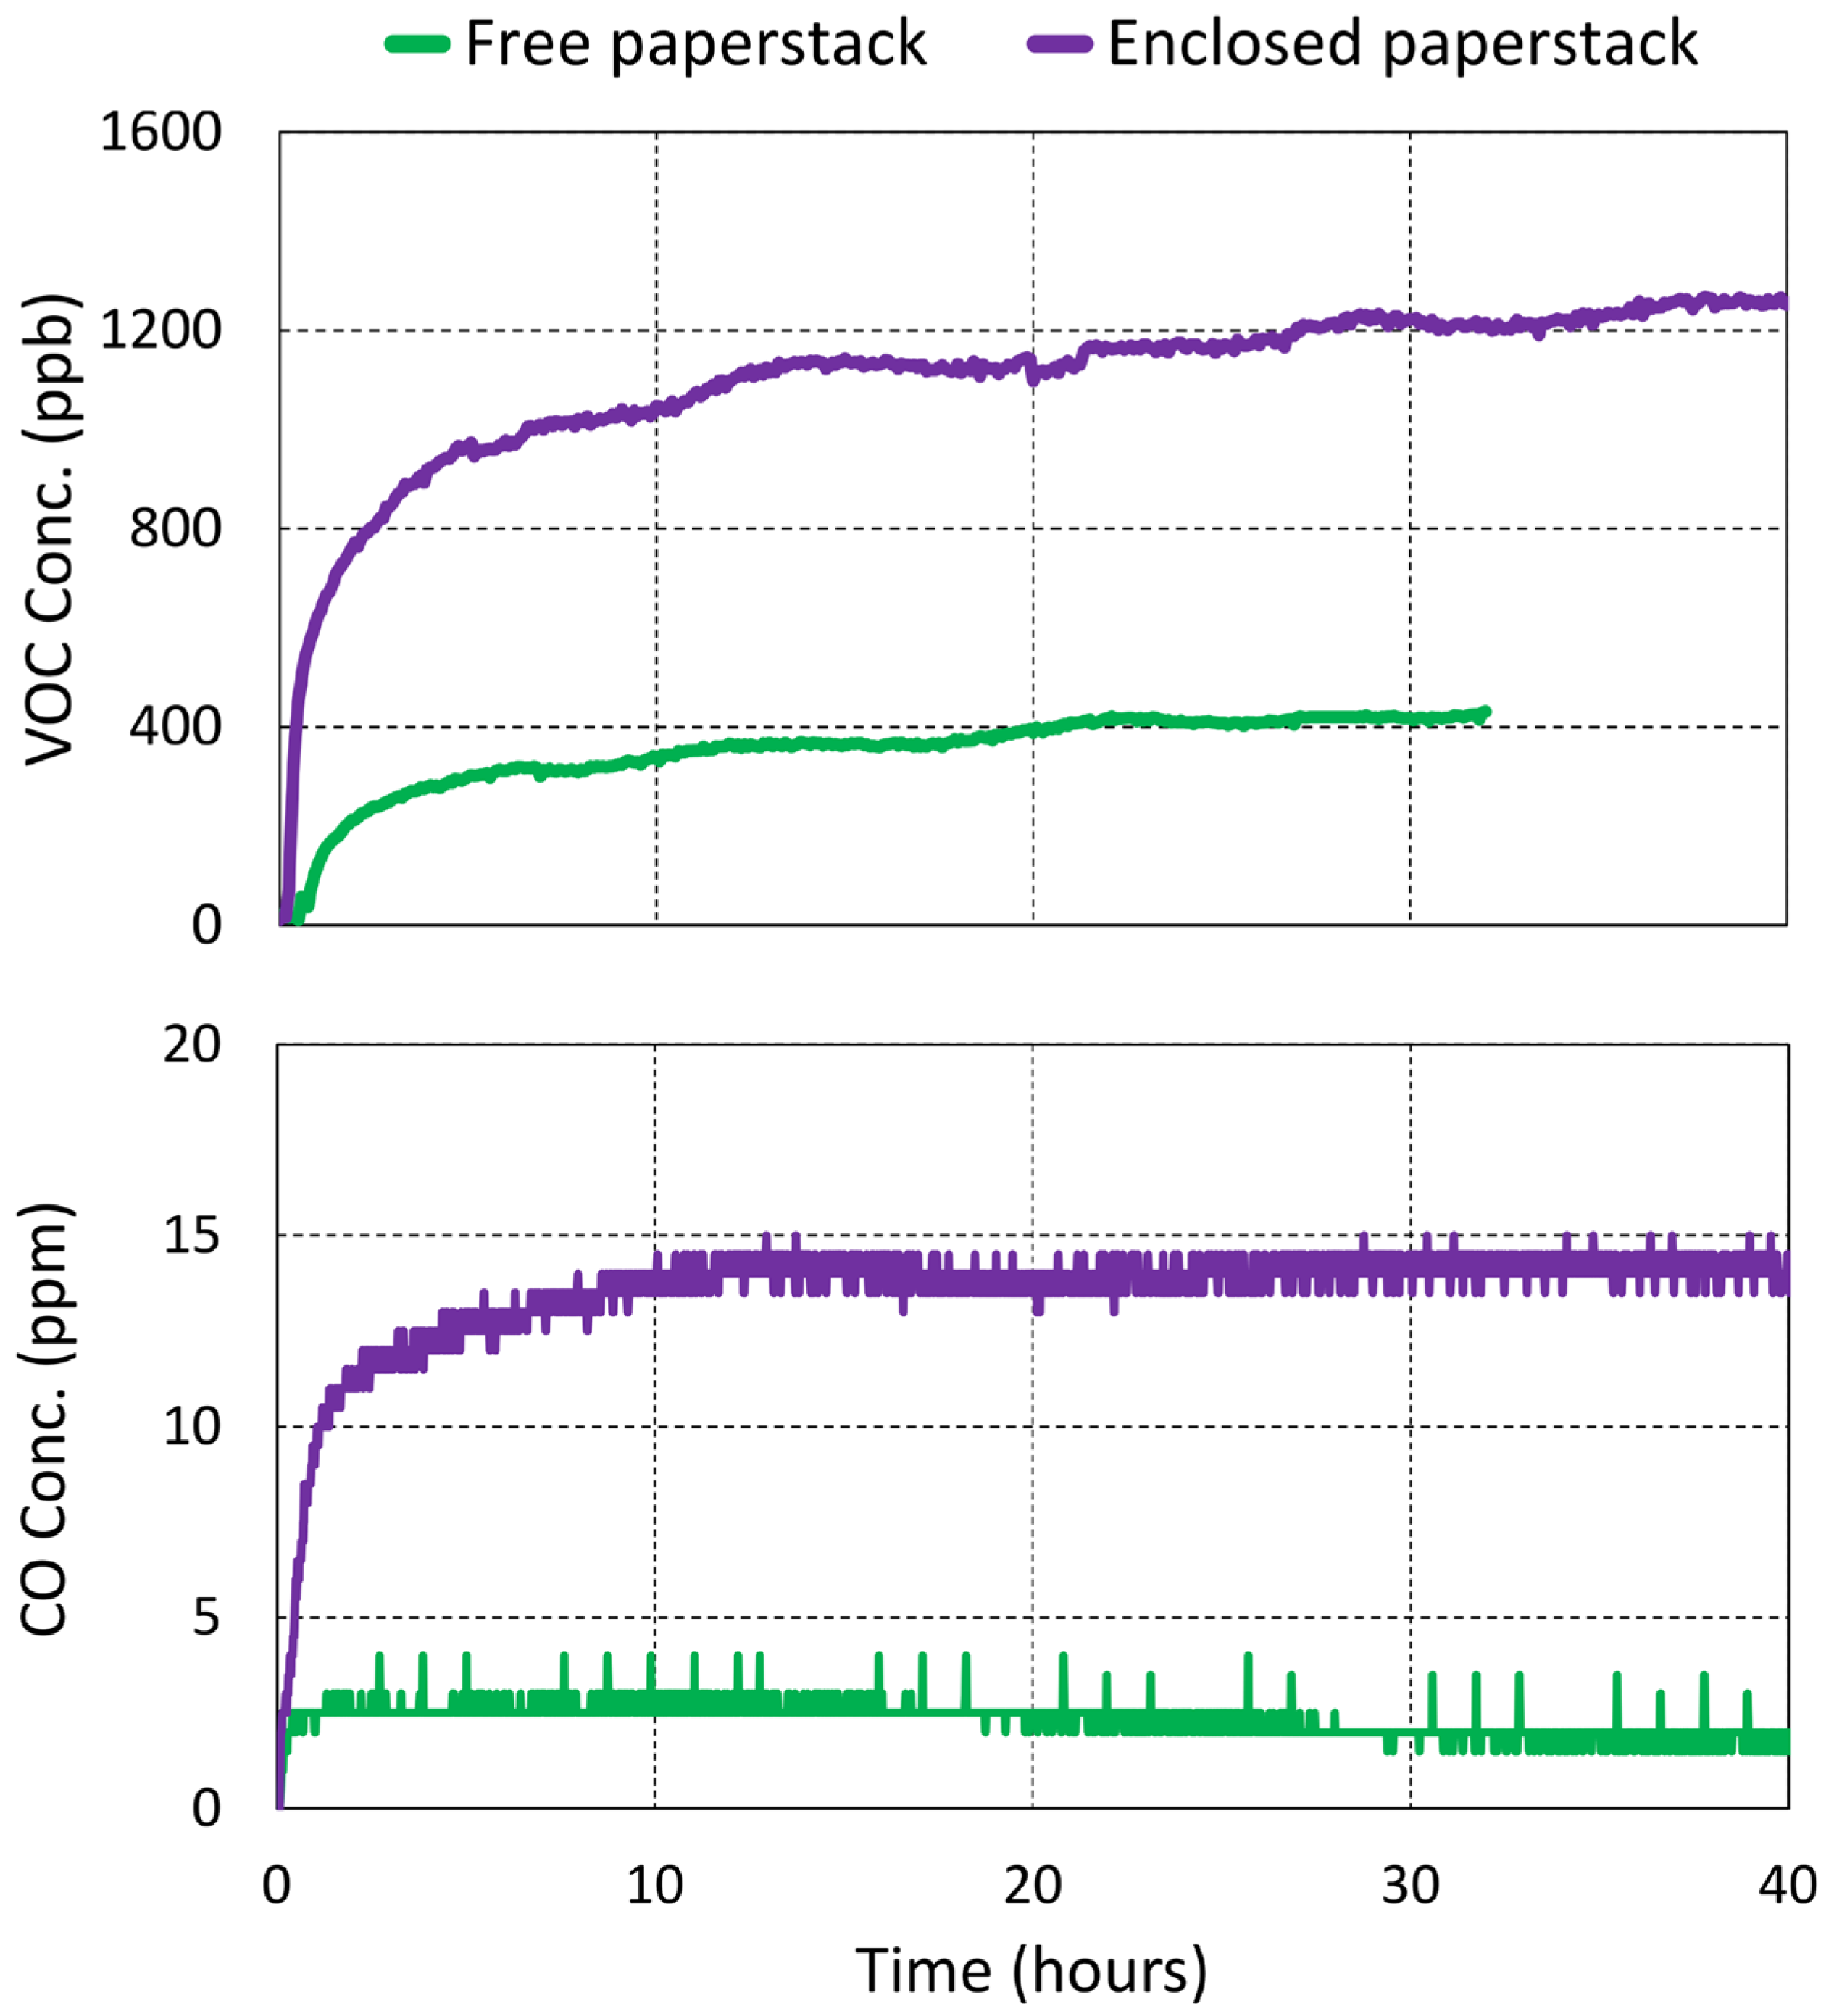
At a larger scale, and mimicking archival environments, the newsprint paper stack experiment with enclosed VOC and CO sensors demonstrated the role of ventilation (using Stack A). When the stack was freely exposed to room air, the inside VOC levels reached a moderate level (yet significantly higher than the room air), as a balance between the generation and ventilation rate. However, when wrapped airtight in aluminium foil, VOC concentrations increased about three times (Figure 11), illustrating a key conservation trade-off: restricting air exchange can exacerbate the accumulation of internally generated gases when the materials are the emission source.
The same trend was observed from the CO sensor (Figure 11). However, as mentioned above, the CO readings should be interpreted with care, as the sensor may react to a broad range of oxidisable gases, e.g., certain VOCs. In any case, the readings show that volatiles are emitted from the newsprint at a steady rate and demonstrate here the strong influence of two different ventilation scenarios. An attempt was made to measure the same effect by the use of passive diffusion samplers for organic acids, but the results could not show a clear correlation between ventilation and concentration. Measurements showed, without a significant difference between different tests and their repetitions, levels largely between 200 and 400 ppb. This is interpreted as this type of measurement being at the limit of what diffusion samplers can be used for. According to the manufacturer, a passive diffusion sampler needs some turbulence around it for correct sampling, but in these very small stagnant air volumes, such as cavities inside a stack of paper, the sampler will absorb all the gas present, and in reality measure the rate of emission from the paper rather than the concentration in air (the so-called starvation effect). It must therefore be concluded only that the generation of organic acid from the newsprint was indeed significant, but the extent and its concentration in the air could not be quantified.
While the impact of acetic acid on paper materials is debated [49], the levels reached can indeed deteriorate other materials. Lead, which, for example, is found in historic seals on manuscripts (bullae), may readily corrode at the levels observed. The lead coupon left inside Stack A was, after one year, heavily corroded (whitish surface colour and a mass increase of 13.2 mg/m2); a level comparable to that of highly polluted display cases [50].

4.5. Balancing Pollutant Retention and Pollutant Exclusion

While restricted ventilation can increase retention of internally generated pollutants, boxes can also attenuate the ingress of external pollutants. Cardboard walls act as reactive and sorptive filters: highly reactive gases such as ozone can be consumed entirely before reaching the interior, whereas moderately reactive gases, such as nitrogen dioxide or acetic acid, if present in the ambient environment, may be retarded but still infiltrate partially (Table 2). Less- or non- reactive gases may penetrate more readily, especially when AER is high. CO2 was, for example, always observed in equal concentration both inside and outside an empty box (Table 2). In contrast, organic acids readily accumulate inside a box if a source is present. In theory, they would reach a steady-state concentration that balances generation rate and loss by diffusion out of the box, combined with (a moderate) loss by re-adsorption to the interior of the box. In the example of the archive room referred to in Table 2, acetic and formic acids were attempted to be measured by passive diffusion samplers inside boxes filled with paper records. The measurements showed elevated concentrations (100 s of ppb), but the results were not reproducible when repeated, probably for the same reasons as for the acid measurements in the newsprint paper stack, as discussed above.
Paper stacks showed a similar filtering effect to the cardboard boxes. As already shown in the air exchange tests (Figure 2 and Figure 4), paper stacks are well ventilated as such (the newsprint stack had an AER of 10 h−1). However, reactive gases will be consumed by surface reactions on their tortuous path through the paper matrix, thereby delaying penetration relative to the actual air flow through the stack. This is illustrated by an experiment with AD sheets placed in the middle of a paper stack, which was subsequently exposed to elevated acetic acid in the surrounding air. Even after 14 days, there was a clear difference in the effect of the acid on the pH indicator from the edge to the centre of the stack (Figure 12). The pattern of colour change further suggests that penetration occurs most rapidly along the paper sheets from the sides of the stack, relative to any penetration across the paper sheets from the top, as the opposite would have given a more uniform colour change across the entire sheet. This is similar to the discolouration often observed in older books, where the paper yellows fastest along the edges. The colour change on the AD paper does not directly indicate the acid concentration, but rather, it suggests the relative difference between edge and centre; the clear gradient in the pH indicator’s response expresses the difference in the infiltration rate of acetic acid as compared to the high air changes otherwise measured with non-reactive gases in the other stack experiments (Figure 2 and Figure 4).
On a general note, the pollution experiments presented here should be understood as contextual and conditional, rather than implying that gaseous pollutants represent an equivalent risk under all storage conditions. Internal pollutant accumulation becomes most relevant in situations where air exchange is strongly restricted and where paper or other enclosed materials act as active emission sources. Under moderately ventilated conditions, enclosure materials and paper itself may act as effective sorptive sinks, limiting gas-phase concentrations. The results presented here should therefore be seen primarily as a demonstration of when and under which enclosure conditions pollutant effects may become significant, rather than suggesting a universal chemical risk.

5. Conclusions

The results support a differentiated view of archival boxes, books, and paper stacks as active microclimate systems. Their performance reflects permeability, buffering capacity, material reactivity, and the timescales of environmental change. However, the results also demonstrate that neither high permeability nor airtightness alone constitutes optimal enclosure performance.
Room climate control remains essential because microclimates ultimately follow long-term ambient trends. Short-term RH fluctuations are strongly attenuated in books and dense paper masses, reducing exposure to rapid RH cycling. Excessive sealing can be counterproductive for emitting materials, as reduced ventilation promotes the accumulation of internally generated pollutants. This dual role of both pollutant barrier and pollutant trap highlights that enclosure performance cannot be assessed on airtightness alone. It must consider the chemical nature of both internal emissions and external pollutants—although the actual risk from emissions from box and paper materials is increasingly being questioned—as well as the timescales of exchange and buffering. While pollutant effects may become critical under specific enclosure or ventilation scenarios, RH remains the dominant environmental factor influencing the long-term stability of paper-based collections. The strong buffering effects observed in boxes, books, and paper stacks are therefore of primary conservation significance.
In summary, microclimates inside archival boxes, books, and paper stacks provide meaningful protection against dust, handling, and rapid environmental change, but they can also create conditions conducive to slow equilibration and pollutant build-up. Conservation strategies should therefore address both the room environment and the nested microenvironments experienced by the objects themselves. Object-level monitoring will be valuable because room measurements alone cannot capture microclimate gradients and time lags.

Funding

This research received no external funding.

Data Availability Statement

Data are available from the author after reasonable request.

Acknowledgments

The article contains a collection of experiments carried out over several years in the laboratories of the National Museum of Denmark and the Royal Danish Academy, in connection with teaching demonstrations, student experiments, and research. Both institutions are thanked for supporting this type of demonstration experiment. Preliminary dissemination of results has previously taken place at COST Action D42 (Chemical Interactions between Cultural Artefacts and Indoor Environment—ENVIART) workshops and Indoor Air Quality in Museums conferences, but gathered in a coherent context herein for the first time.

Conflicts of Interest

The author declares no conflicts of interest.

References

  1. Padfield, T. The Interaction of Water Vapour with Paper. Conservation Physics. 2006. Available online: https://www.conservationphysics.org/vapap/vapap.pdf (accessed on 20 December 2025).
  2. EN 15757:2010; Conservation of Cultural Property—Specifications for Temperature and Relative Humidity to Limit Climate-Induced Mechanical Damage in Organic Hygroscopic Materials. European Committee for Standardization (CEN): Brussels, Belgium, 2010.
  3. ISO 11799:2024; Information and Documentation—Document Storage Requirements for Archive and Library Materials. International Organization for Standardization: Geneva, Switzerland, 2024.
  4. ASHRAE. Museums, Galleries, Archives, and Libraries. In 2023 ASHRAE Handbook—HVAC Applications; Kennedy, H.E., Ed.; American Society of Heating, Refrigerating and Air-Conditioning Engineers: Peachtree Corners, GA, USA, 2023; Chapter 24; pp. 1–47. [Google Scholar]
  5. Novak, M.; Grau-Bove, J.; De Stefani, C.; Checkley-Scott, C.; Kraševec, I.; Cigić, I.K.; Elnaggar, A. Evaluation and modelling of the environmental performance of archival boxes, part 1: Material and environmental assessment. Herit. Sci. 2024, 12, 24. [Google Scholar] [CrossRef]
  6. Caldararo, N. The Solander Box: Its varieties and its role as an archival unit of storage for prints and drawings in a museum, archive or gallery. Mus. Manag. Curatorship 1993, 12, 387–400. [Google Scholar] [CrossRef] [PubMed]
  7. Wilson, H.; VanSnick, S. The Effectiveness of dust mitigation and cleaning strategies at The National Archives, UK. J. Cult. Herit. 2017, 24, 100–107. [Google Scholar] [CrossRef]
  8. Markelj, J.; Grau-Bove, J.; Kraševec, I.; Vereecken, E.; Strlič, M. A simple generalized mass transfer model for evaluation of the environmental performance of archival boxes. NPJ Herit. Sci. 2025, 13, 387. [Google Scholar] [CrossRef]
  9. Bigourdan, J.L.; Reilly, J.M. Effects of fluctuating environments on paper materials stability and practical significance for preservation. In Proceedings of the La Conservation à l’ère du Numérique: Actes des Quatrièmes Journées Internationales D’études de l’ARSAG; Paris, France, 27–30 May 2002, Groupe Liénart Press: Paris, France, 2002; pp. 180–192. [Google Scholar]
  10. Ankersmit, B.; Kragt, W.; Leeuwen, I.V. The climate in pastel microclimate cardboard boxes when exposed to fluctuating climates. In Proceedings of the 16th Triennial Conference, ICOM Committee for Conservation, Lisbon, Portugal, 19–23 September 2011; Bridgland, J., Ed.; ICOM: Paris, France, 2011; pp. 1–9. [Google Scholar]
  11. Garside, P.; Knight, B. The behaviour of books in changing environmental conditions and the implications for collection storage. In Proceedings of the 16th Triennial Conference, ICOM Committee for Conservation, Lisbon, Portugal, 19–23 September 2011; Bridgland, J., Ed.; ICOM: Paris, France, 2011; pp. 1–9. [Google Scholar]
  12. Han, B.; Li, X.; Wang, F.; Bon, J.; Symonds, I. The buffering effect of a paper-based storage enclosure made from functional materials for preventive conservation. Indoor Built Environ. 2023, 33, 167–182. [Google Scholar] [CrossRef]
  13. Weschler, C.J.; Shields, H.C.; Naik, D.V. Indoor Ozone Exposures. J. Air Pollut. Control Assoc. 1989, 39, 1562–1568. Available online: https://www.tandfonline.com/doi/epdf/10.1080/08940630.1989.10466650 (accessed on 20 December 2025). [CrossRef]
  14. Brimblecombe, P. A theoretical approach to the pollution of air volumes within museums. Conservator 1989, 13, 15–19. [Google Scholar] [CrossRef]
  15. Ryhl-Svendsen, M. The role of air exchange rate and surface reaction rates on the air quality in museum storage buildings. In Museum Microclimates, Proceedings of the Contributions to the Copenhagen Conference, Copenhagen, Denmark, 19–23 November 2007; Borchersen, K., Padfield, T., Eds.; National Museum of Denmark: Copenhagen, Denmark, 2007; pp. 221–226. [Google Scholar]
  16. Rosenberg, E.; De Santis, F.; Kontozova-Deutsch, V.; Odlyha, M.; van Grieken, R.; Vichi, F. Chapter 9: Measuring gaseous and particulate pollutants, Instruments and instrumental problems. In Basic Environmental Mechanisms Affecting Cultural Heritage. Understanding Deterioration Mechanisms for Conservation Purposes; Camuffo, D., Fassina, V., Havermans, J., Eds.; COST Action D 42 (ENVIART); Nardini Editore: Florence, Italy, 2010; pp. 115–146. [Google Scholar]
  17. Grøntoft, T.; Odlyha, M.; Mottner, P.; Dahlin, E.; Lopez-Aparicio, S.; Jakiela, S.; Scharff, M.; Andrade, G.; Obarzanowski, M.; Ryhl-Svendsen, M.; et al. Pollution monitoring by dosimetry and passive diffusion sampling for evaluation of environmental conditions for paintings in microclimate frames. J. Cult. Herit. 2010, 11, 411–419. [Google Scholar] [CrossRef]
  18. Grøntoft, T.; Thickett, D.; Lankester, P.; Hackney, S.; Townsend, J.H.; Ramsholt, K.; Garrido, M. Assessment of indoor air quality and the risk of damage to cultural heritage objects using MEMORI® dosimetry. Stud. Conserv. 2016, 61, 70–82. [Google Scholar] [CrossRef][Green Version]
  19. Grøntoft, T. Performance Evaluation for Museum Enclosures. Measurement, Modelling and Mitigation of Pollutant Impact on Objects in Museum Enclosures. e-Preserv. Sci. 2012, 9, 36–46. Available online: https://www.morana-rtd.com/e-preservationscience/2012/Grontof-26-06-2012.pdf (accessed on 20 December 2025).
  20. Tetreault, J. Display material: The good, the bad and the ugly. In Proceedings of the Exhibition and Conservation, Preprint, Edinburgh, Scotland, 21–22 April 1994; Scottish Society for Conservation and Restoration (SSCR): Edinburgh, Scotland, 1994; pp. 79–86. [Google Scholar]
  21. Camuffo, D.; Sturaro, G.; Valentino, A. Showcases: A really effective mean for protecting artworks? Thermochim. Acta 2000, 365, 65–77. [Google Scholar] [CrossRef]
  22. Thickett, D.; David, F.; Luxford, N. Air exchange rate—The dominant parameter for preventive conservation? Conservator 2005, 29, 19–34. [Google Scholar] [CrossRef]
  23. Chiantore, O.; Poli, T. Indoor air quality in museum display cases: Volatile emissions, materials contributions, impacts. Atmosphere 2021, 12, 34. [Google Scholar] [CrossRef]
  24. Novak, M. Evaluation of the Environmental Performance of Archival Boxes for Cellulose Acetate Storage. Ph.D. Thesis, University College London, London, UK, 2022. [Google Scholar]
  25. Camuffo, D. Microclimate for Cultural Heritage, 3rd ed.; Elsevier: Amsterdam, The Netherlands, 2019. [Google Scholar]
  26. Parker, M.E.; Bronlund, J.E.; Mawson, A.J. Moisture sorption isotherms for paper and paperboard in food chain conditions. Package Technol. Sci. 2006, 19, 193–209. [Google Scholar] [CrossRef]
  27. Derluyn, H.; Janssen, H.; Diepens, J.; Derome, D.; Carmeliet, J. Hygroscopic behavior of paper and books. J. Build. Phys. 2007, 31, 9–34. [Google Scholar] [CrossRef]
  28. Ioelovich, M. Study of sorption properties of cellulose and its derivatives. BioResources 2011, 6, 178–195. [Google Scholar] [CrossRef]
  29. Deraz, R.; Di Gianvincenzo, F.; Schuhmann, K.; Anders, M.; Maleši, J.; Cigic, I.K.; Elnaggar, A.; Strlic, M. Quality assessment of box materials for long-term archival storage: VOC emissions are not a significant concern. ChemPlusChem 2025, 91, e202500337. [Google Scholar] [CrossRef]
  30. Scrivens, G.; Gerst, P.; MacDonald, B.C.; Carabillo, D.; Monahan, A.P.; Timpano, R.J.; Lippke, L.; Ticehurst, M.; Wood, G.; Ryan, K.O. Chapter 5: The humidity exposure of packaged products. In Accelerated Predictive Stability; Qiu, F., Scrivens, G., Eds.; Academic Press: London, UK, 2018; pp. 105–146. [Google Scholar]
  31. Cassar, M.; Martin, G. The environmental performance of museum display cases. Stud. Conserv. 2013, 39, 171–173. [Google Scholar] [CrossRef]
  32. Thickett, D. Print frame microclimates. In Art on Paper: Mounting and Housing; Rayner, J., Kosek, J.M., Christensen, B., Eds.; Archetype Publications: London, UK, 2005; pp. 48–54. [Google Scholar]
  33. Shashoua, Y. Conservation of Plastics; Butterworth-Heinemann: Oxford, UK, 2008. [Google Scholar]
  34. Curran, K.; Aslam, A.; Ganiaris, H.; Hodgkins, R.; Moon, J.; Moore, A.; Ramsay, L. Volatile organic compound (VOC) emissions from plastic materials used for storing and displaying heritage objects. In Proceedings of the 18th Triennial Conference, ICOM Committee for Conservation, Copenhagen, Denmark, 4–8 September 2017; Bridgland, J., Ed.; ICOM: Paris, France, 2017; pp. 1–8. [Google Scholar]
  35. Ryhl-Svendsen, M.; Smedemark, S.H. Mass-Transfer Air Pollution Modeling in Heritage Buildings. Heritage 2023, 6, 4768–4786. [Google Scholar] [CrossRef]
  36. Smedemark, S.H.; Ryhl-Svendsen, M. Determining the level of organic acid air pollution in museum storage rooms by mass-balance modelling. J. Cult. Herit. 2022, 55, 309–317. [Google Scholar] [CrossRef]
  37. Lattuati-Derieux, A.; Bonnassies-Termes, S.; Lavédrine, B. Characterisation of compounds emitted during natural and artificial ageing of a book. Use of headspace-solid-phase microextraction/gas chromatography/mass spectrometry. J. Cult. Herit. 2006, 7, 123–133. [Google Scholar] [CrossRef]
  38. Clark, A.J.; Calvillo, J.L.; Roosa, M.S.; Green, D.B.; Ganske, J.A. Degradation product emission from historic and modern books by headspace SPME/GC-MS: Evaluation of lipid oxidation and cellulose hydrolysis. Anal. Bioanal. Chem. 2011, 399, 3589–3600. [Google Scholar] [CrossRef] [PubMed]
  39. Paolin, E.; Strlič, M. Volatile organic compounds (VOCs) in heritage environments and their analysis: A review. Appl. Sci. 2024, 14, 4620. [Google Scholar] [CrossRef]
  40. Strlič, M.; Cigić, I.K.; Kolar, J.; De Bruin, G.; Pihlar, B. Non-Destructive Evaluation of Historical Paper Based on pH Estimation from VOC Emissions. Sensors 2007, 7, 3136–3145. [Google Scholar] [CrossRef]
  41. Robertson, C.; Lewicki, J.P.; Shields, K.; Mitchell, G.; Todd, D.; Gibson, L.T. Comparative methods of volatile organic compound measurement and characterisation from individual books. In Proceedings of the Advances in Paper Conservation Research, London, UK, 23–24 March 2009; Horie, C.V., Ed.; British Library: London, UK, 2009; pp. 45–47. [Google Scholar]
  42. Pedersoli, J.L.; Ligterink, F.J.; van Bommel, M. Non-destructive determination of acetic acid and furfural in books by solid-phase micro-extraction (SPME) and gas chromatography-mass spectrometry (GC/MS). Restaurator 2011, 32, 110–134. [Google Scholar] [CrossRef]
  43. Rigsarkivet. Bilag til Rigsarkivets Anvisning o Materialekvaliteter: Arkivæsker af 17. okt. 2005, pkt. 3. Kravspecifikation til: Arkivæsker—Rigsarkivets Model; (Appendix to the National Archives’ Instructions on Material Qualities: Archive Boxes of 17 October 2005, item 3. Specification for: Archive Boxes—National Archives Model); Rigsarkivet: Copenhagen, Denmark; Available online: https://www.rigsarkivet.dk/wp-content/uploads/2024/02/Bilag-til-Rigsarkivets-anvisning-om-materialekvaliteter.pdf (accessed on 20 December 2025). (In Danish)
  44. Calver, A.; Holbrook, A.; Thickett, D.; Weintraub, S. Simple methods to measure air exchange rates and detect leaks in display and storage enclosures. In Proceedings of the 14th Triennial Conference, ICOM Committee for Conservation, The Hague, The Netherlands, 12–16 September 2005; Bridgland, J., Ed.; ICOM: Paris, France, 2005; pp. 597–609. [Google Scholar]
  45. Matthiesen, H. A novel method to determine oxidation rates of heritage materials in vitro and in situ. Stud. Conserv. 2007, 52, 271–280. [Google Scholar] [CrossRef]
  46. ISO 11844-2; Corrosion of Metals and Alloys—Classification of Low Corrosivity of Indoor Atmospheres—Part 2: Determination of Corrosion Attack in Indoor Atmospheres. International Organization for Standardization: Geneva, Switzerland, 2020.
  47. Strlič, M.; Kolar, J. (Eds.) Ageing and Stabilisation of Paper; National and University Library: Ljubljana, Slovenia, 2005. [Google Scholar]
  48. Svedberg, U.; Samuelsson, J.; Melin, S. Hazardous off-gassing of carbon monoxide and oxygen depletion during ocean transportation of wood pellets. Ann. Occup. Hyg. 2008, 52, 259–266. [Google Scholar] [CrossRef]
  49. Ligterink, F.; Di Pietro, G. The limited impact of acetic acid in archives and libraries. Herit. Sci. 2018, 6, 59. [Google Scholar] [CrossRef]
  50. Grinder-Hansen, P.; Kjær, U.; Ryhl-Svendsen, M.; Colombini, M.P.; Degano, I.; La Nasa, J.; Sabatini, F.; van der Plicht, J.; Rasmussen, K.L. Textiles and environment in the showcase containing Saint Canute the Holy († AD 1086): Radiocarbon dating and chemical interactions. Herit. Sci. 2020, 8, 95. [Google Scholar] [CrossRef]
Figure 1. Examples of archive boxes, stacks of paper, and books used for the experiments. Top left: box with a passive diffusion sampler placed inside, ready for exposure. Top right: box lined with aluminium foil. Bottom: shows how stacks of paper and books were fitted with climate sensors in a cavity cut out in the centre of the stack.
Heritage 09 00063 g001
Figure 2. The rate at which elevated CO2 concentration decayed over time due to air exchange, for the inside of Box A (red) and B (green), and a stack of newsprint (Stack A, blue). The air change for each measurement series was determined in the 9000–2000 ppm interval, where the concentration decay rate decreased linearly with its half-life.
Heritage 09 00063 g002
Figure 3. The CO2 concentration in an office for 12 days, and inside an empty archival box located in the same room (Box A). The CO2 variations are due to the presence of people.
Heritage 09 00063 g003
Figure 4. Close-up on the CO2 concentration in an office for a few hours, and inside a stack of newsprint paper located in the same room (Stack A). The CO2 variation is due to the presence of people followed by airing the room.
Heritage 09 00063 g004
Figure 5. Temperature measured inside an empty archival box (Box A), and inside an archival box full of paper (Box C, measurement spot at the centre of the paper stack), when the ambient temperature suddenly increased from 23 °C to 28 °C.
Heritage 09 00063 g005
Figure 6. Temperature measured around, on the surface of, and inside Book A, when the ambient temperature suddenly decreased from 20 °C to −22 °C. Measurement spots were inside the centre of the book block; inside, in the middle of a page, a few pages from the book cover; on the outside of the book cover; and in the free air of the freezer.
Heritage 09 00063 g006
Figure 7. The variation in relative humidity inside an empty archival box (Box A) and inside an archival box full of paper (Box C, air measurement spots: inside the box and the centre of the paper stack), when the ambient relative humidity suddenly changed from 50% to 60% RH, then 60% to 40% RH, and then back to 50% RH. Each cycle was 24 h.
Heritage 09 00063 g007
Figure 8. The change in weight of Book B when exposed to a sudden change in relative humidity. Top: the change from being in moisture equilibrium at 73% RH to 50% RH, and bottom: from being in moisture equilibrium at 12% RH to 50% RH.
Heritage 09 00063 g008
Figure 9. The microclimate inside a paperback book (Book C) located on a bookshelf in an office, and the office climate, during a full year.
Heritage 09 00063 g009
Figure 10. Oxygen consumption and accumulation of degradation products for paper samples enclosed in a 2.5 L desiccator jar, over a period of 500 h. Newsprint samples (left) were pre-conditioned to 20%, 50%, and 80% RH equilibrium, and the filter paper sample (right) was conditioned to 50% RH. Degradation products were recorded via CO2 and CO sensors; however, the signal can be broadly interpreted as indicative of a number of volatile compounds due to the cross-sensitivity of the sensors. The upper measurement range of the CO2 sensor was 2000 ppm, which some measurement series exceeded.
Heritage 09 00063 g010
Figure 11. The concentration of volatile substances measured by VOC and CO sensors inside the stack of newsprint (Stack A) when it was freely exposed to the air in a well-ventilated room, and when it was wrapped airtight in aluminium foil.
Heritage 09 00063 g011
Figure 12. The continuous development of colour changes on pH-sensitive AD sheets, each placed in the middle of a stack of new A4 copy paper (Stack B type, top left) and exposed to an acetic acid-containing atmosphere in a climate chamber. The paper’s pH indicator changes colour from blue to green/yellow as the acid slowly penetrates through the paper stack.
Heritage 09 00063 g012
Table 1. The properties of archive boxes, stacks of paper, and books used for the experiments. The paper stacks and book blocks of Box C, Stack A, and Books A and C had a cavity cut inside the centre of the paper block. “AD”—Acid-detector paper (see Section 3.8).
LabelItemDimensions (cm)Mass (kg)Material/Notes
Box AArchival box, empty33 × 25 × 8.50.28Two-part, corrugated cardboard, acid-free [43]
Box BArchival box, empty, lined33 × 25 × 8.50.29As Box A, lined with household aluminium film (glued on)
Box CArchival box,
full of paper
33 × 25 × 8.53.4 (box + paper)As Box A, filled with new A4 copy paper, 80 g/m2
Stack ANewsprint paper stack40 × 28 × 9.05.2Metro Express, May 2009, tabloid format, spine with staples cut off
Stack BModern A4 copy paper (no name)30 × 21 × 5.52.5500 sheets, new, 80 g/m2. Used for AD-test with 2 × 500 sheets each test
Book AThick book (dictionary)29 × 22 × 8.03.3Library binding
(30 years old)
Book BCasebound book22 × 15 × 3.00.58Cloth binding
(10 years old)
Book CPaperback20 ×13 × 4.00.51Paperback (5 years old)
Table 2. The concentration of gases in the air inside and around empty archival boxes (Box A type), located in an archive. The room was well-ventilated and climate-controlled to about 20 °C and 50% RH, but without dedicated air pollution control.
GasAmbient Concentration (Room)Level Inside Box (% of Ambient)
CO2408 ppm100%
NO26.9 ppb60%
Organic acids
(acetic + formic acid)
20 ppb45%
O34.9 ppb<10% (below detection)
Disclaimer/Publisher’s Note: The statements, opinions and data contained in all publications are solely those of the individual author(s) and contributor(s) and not of MDPI and/or the editor(s). MDPI and/or the editor(s) disclaim responsibility for any injury to people or property resulting from any ideas, methods, instructions or products referred to in the content.