Figure 1.
Components of a desiccated microclimate. Examples of (1) airtight enclosure (2) desiccant and (3) RH monitoring devices.
Figure 1.
Components of a desiccated microclimate. Examples of (1) airtight enclosure (2) desiccant and (3) RH monitoring devices.
Figure 2.
Setup of 1 L Lock and Lock containers illustrating the distribution of 88 g silica gel over two bags in either end of the container and placement of datalogger.
Figure 2.
Setup of 1 L Lock and Lock containers illustrating the distribution of 88 g silica gel over two bags in either end of the container and placement of datalogger.
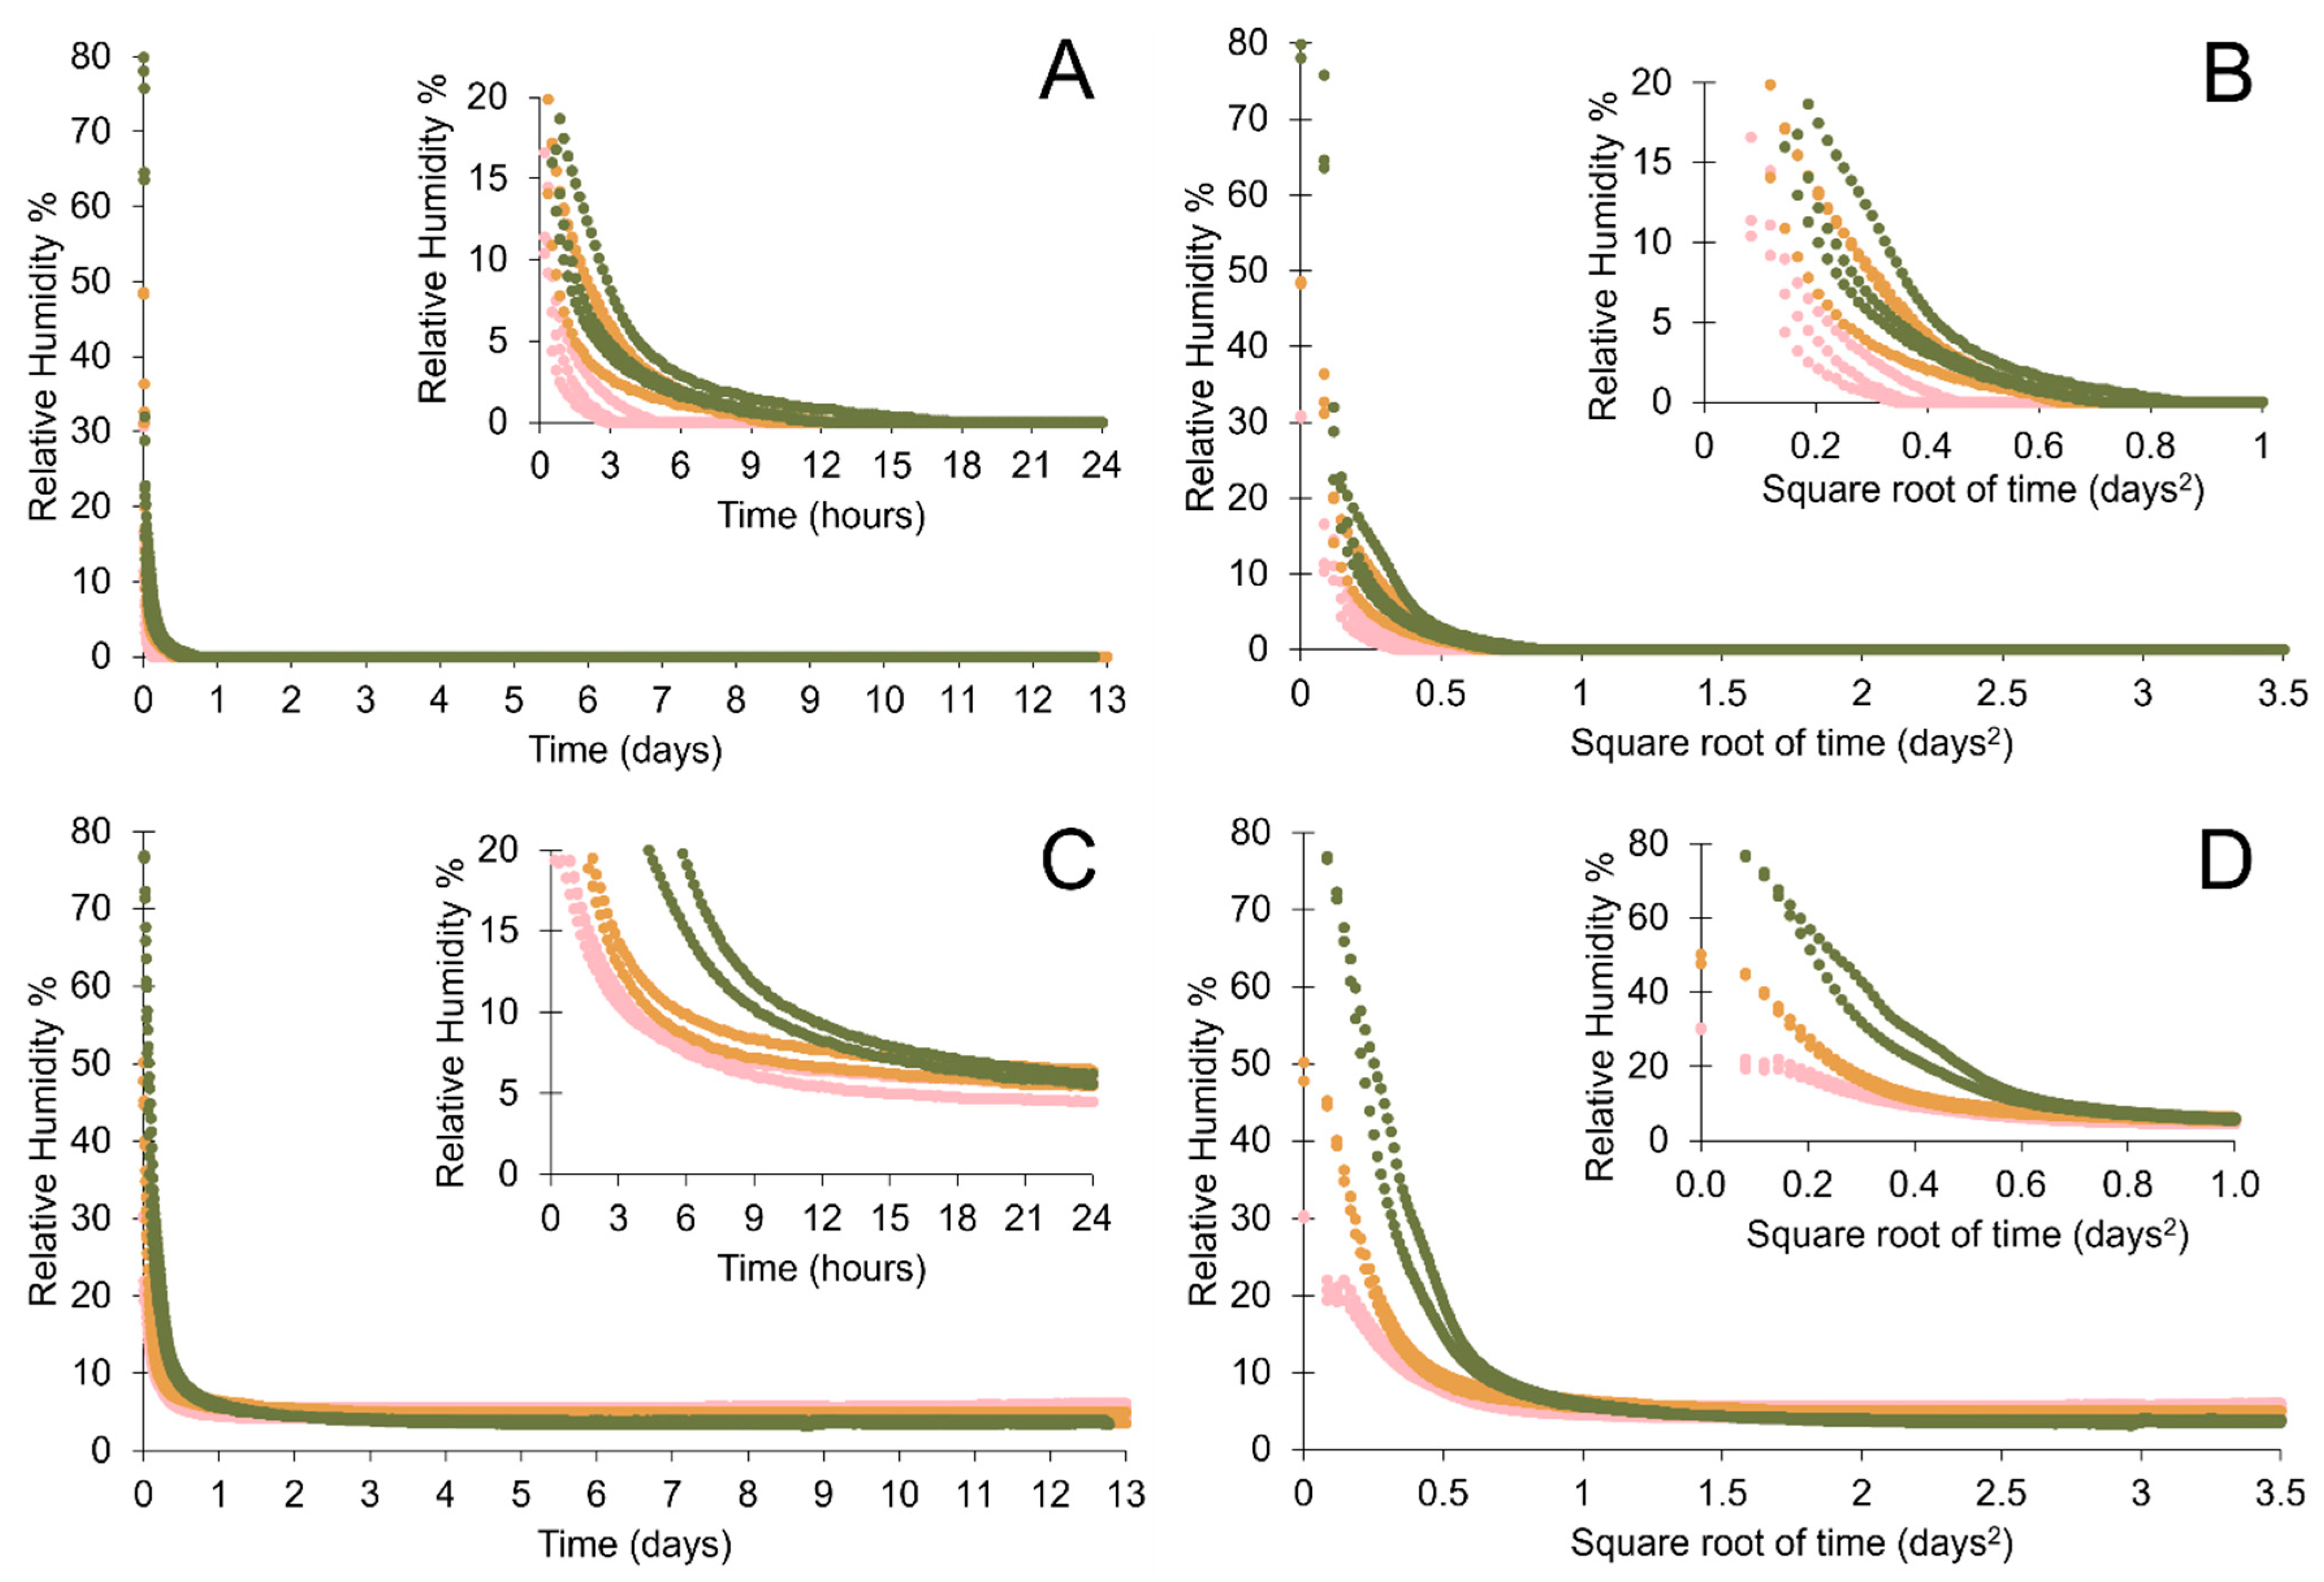
Figure 3.
Desiccation rates of 88 g silica gel in 1 L Lock & Lock containers when (A,B) loose and (C,D) in polythene bags where the initial RH values vary between 30% RH and 80% RH. Linear timelines (A,C) are plotted against square root of time (B,D) to highlight differences in desiccation rates. Insets show detail of the first 24 h.
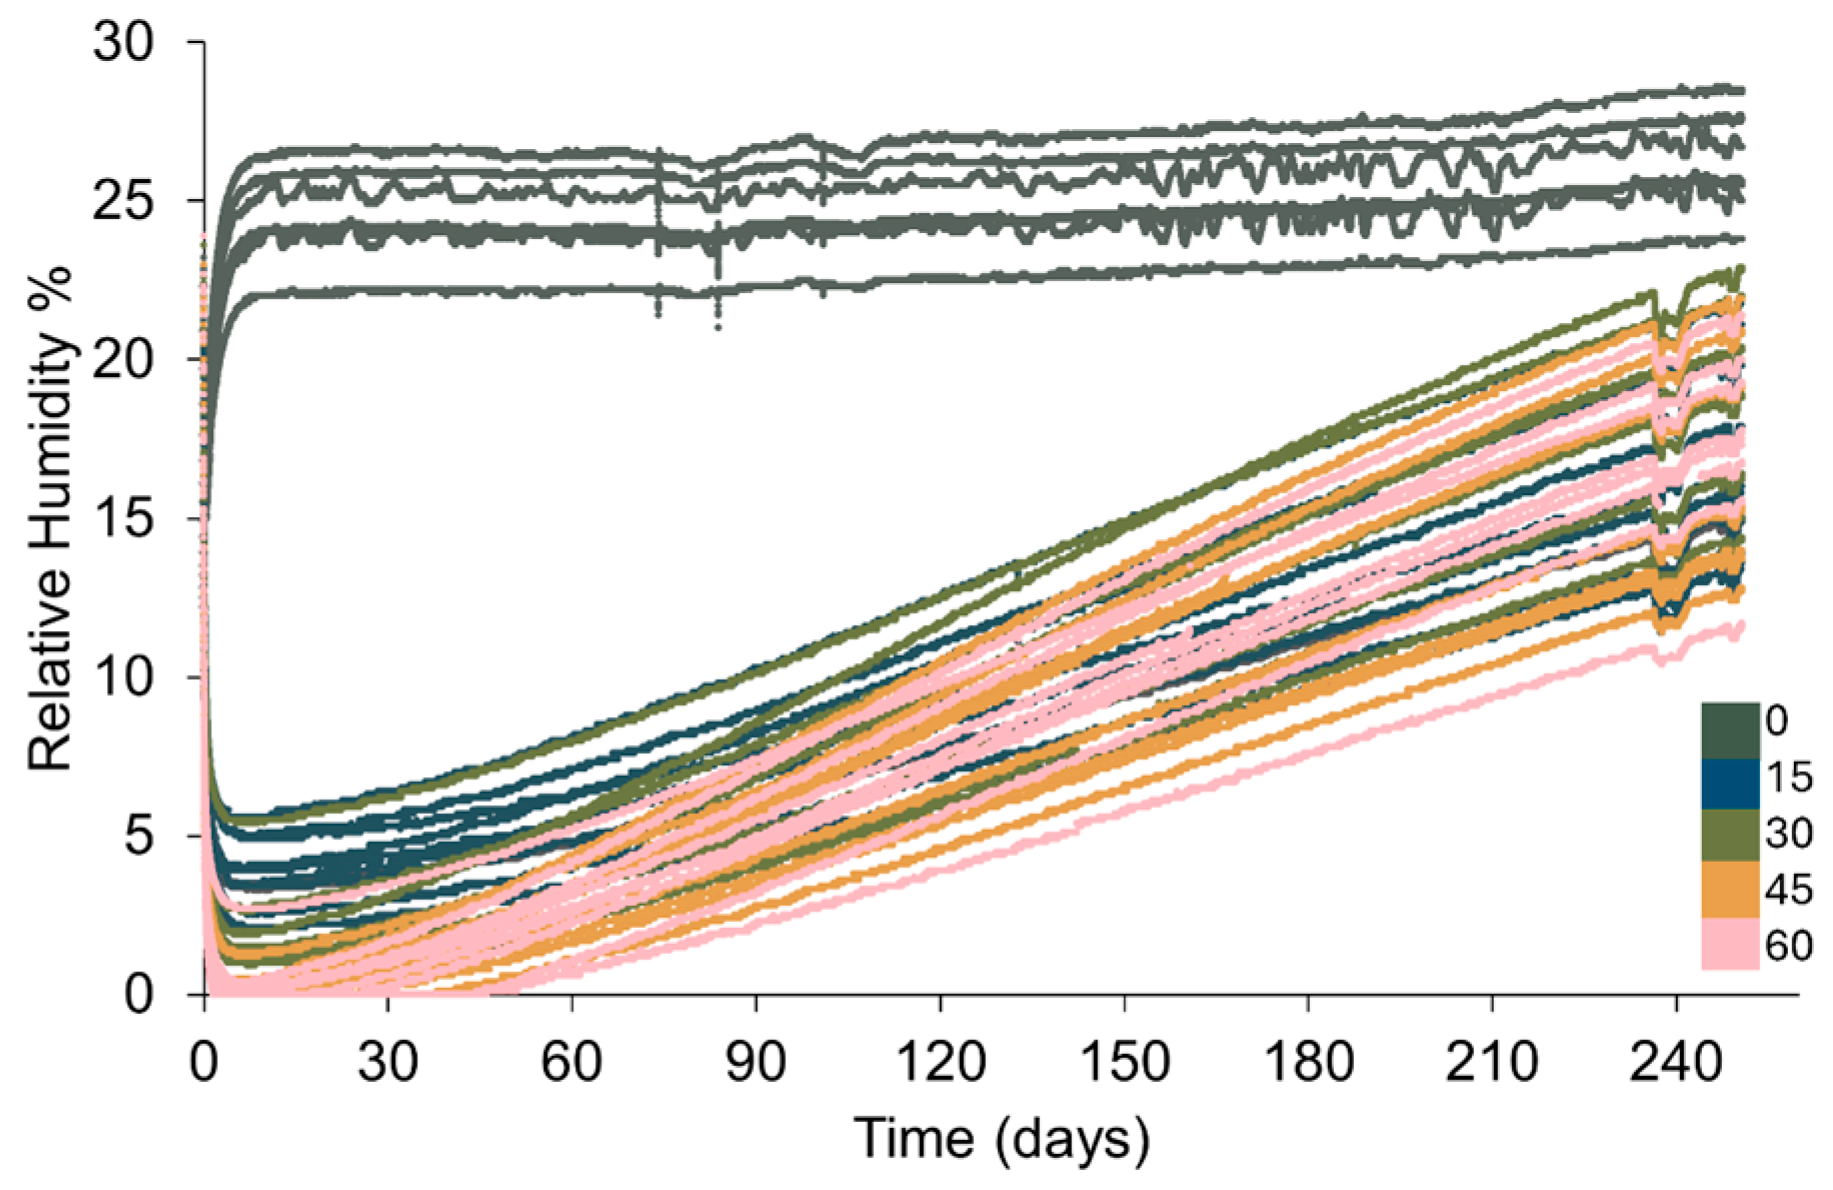
Figure 4.
Change in RH within 1 L Lock & Lock containers where 88 g of silica gel is placed in polythene bags pierced a varying number of times. Key indicates how many times each bag is pierced.
Figure 4.
Change in RH within 1 L Lock & Lock containers where 88 g of silica gel is placed in polythene bags pierced a varying number of times. Key indicates how many times each bag is pierced.
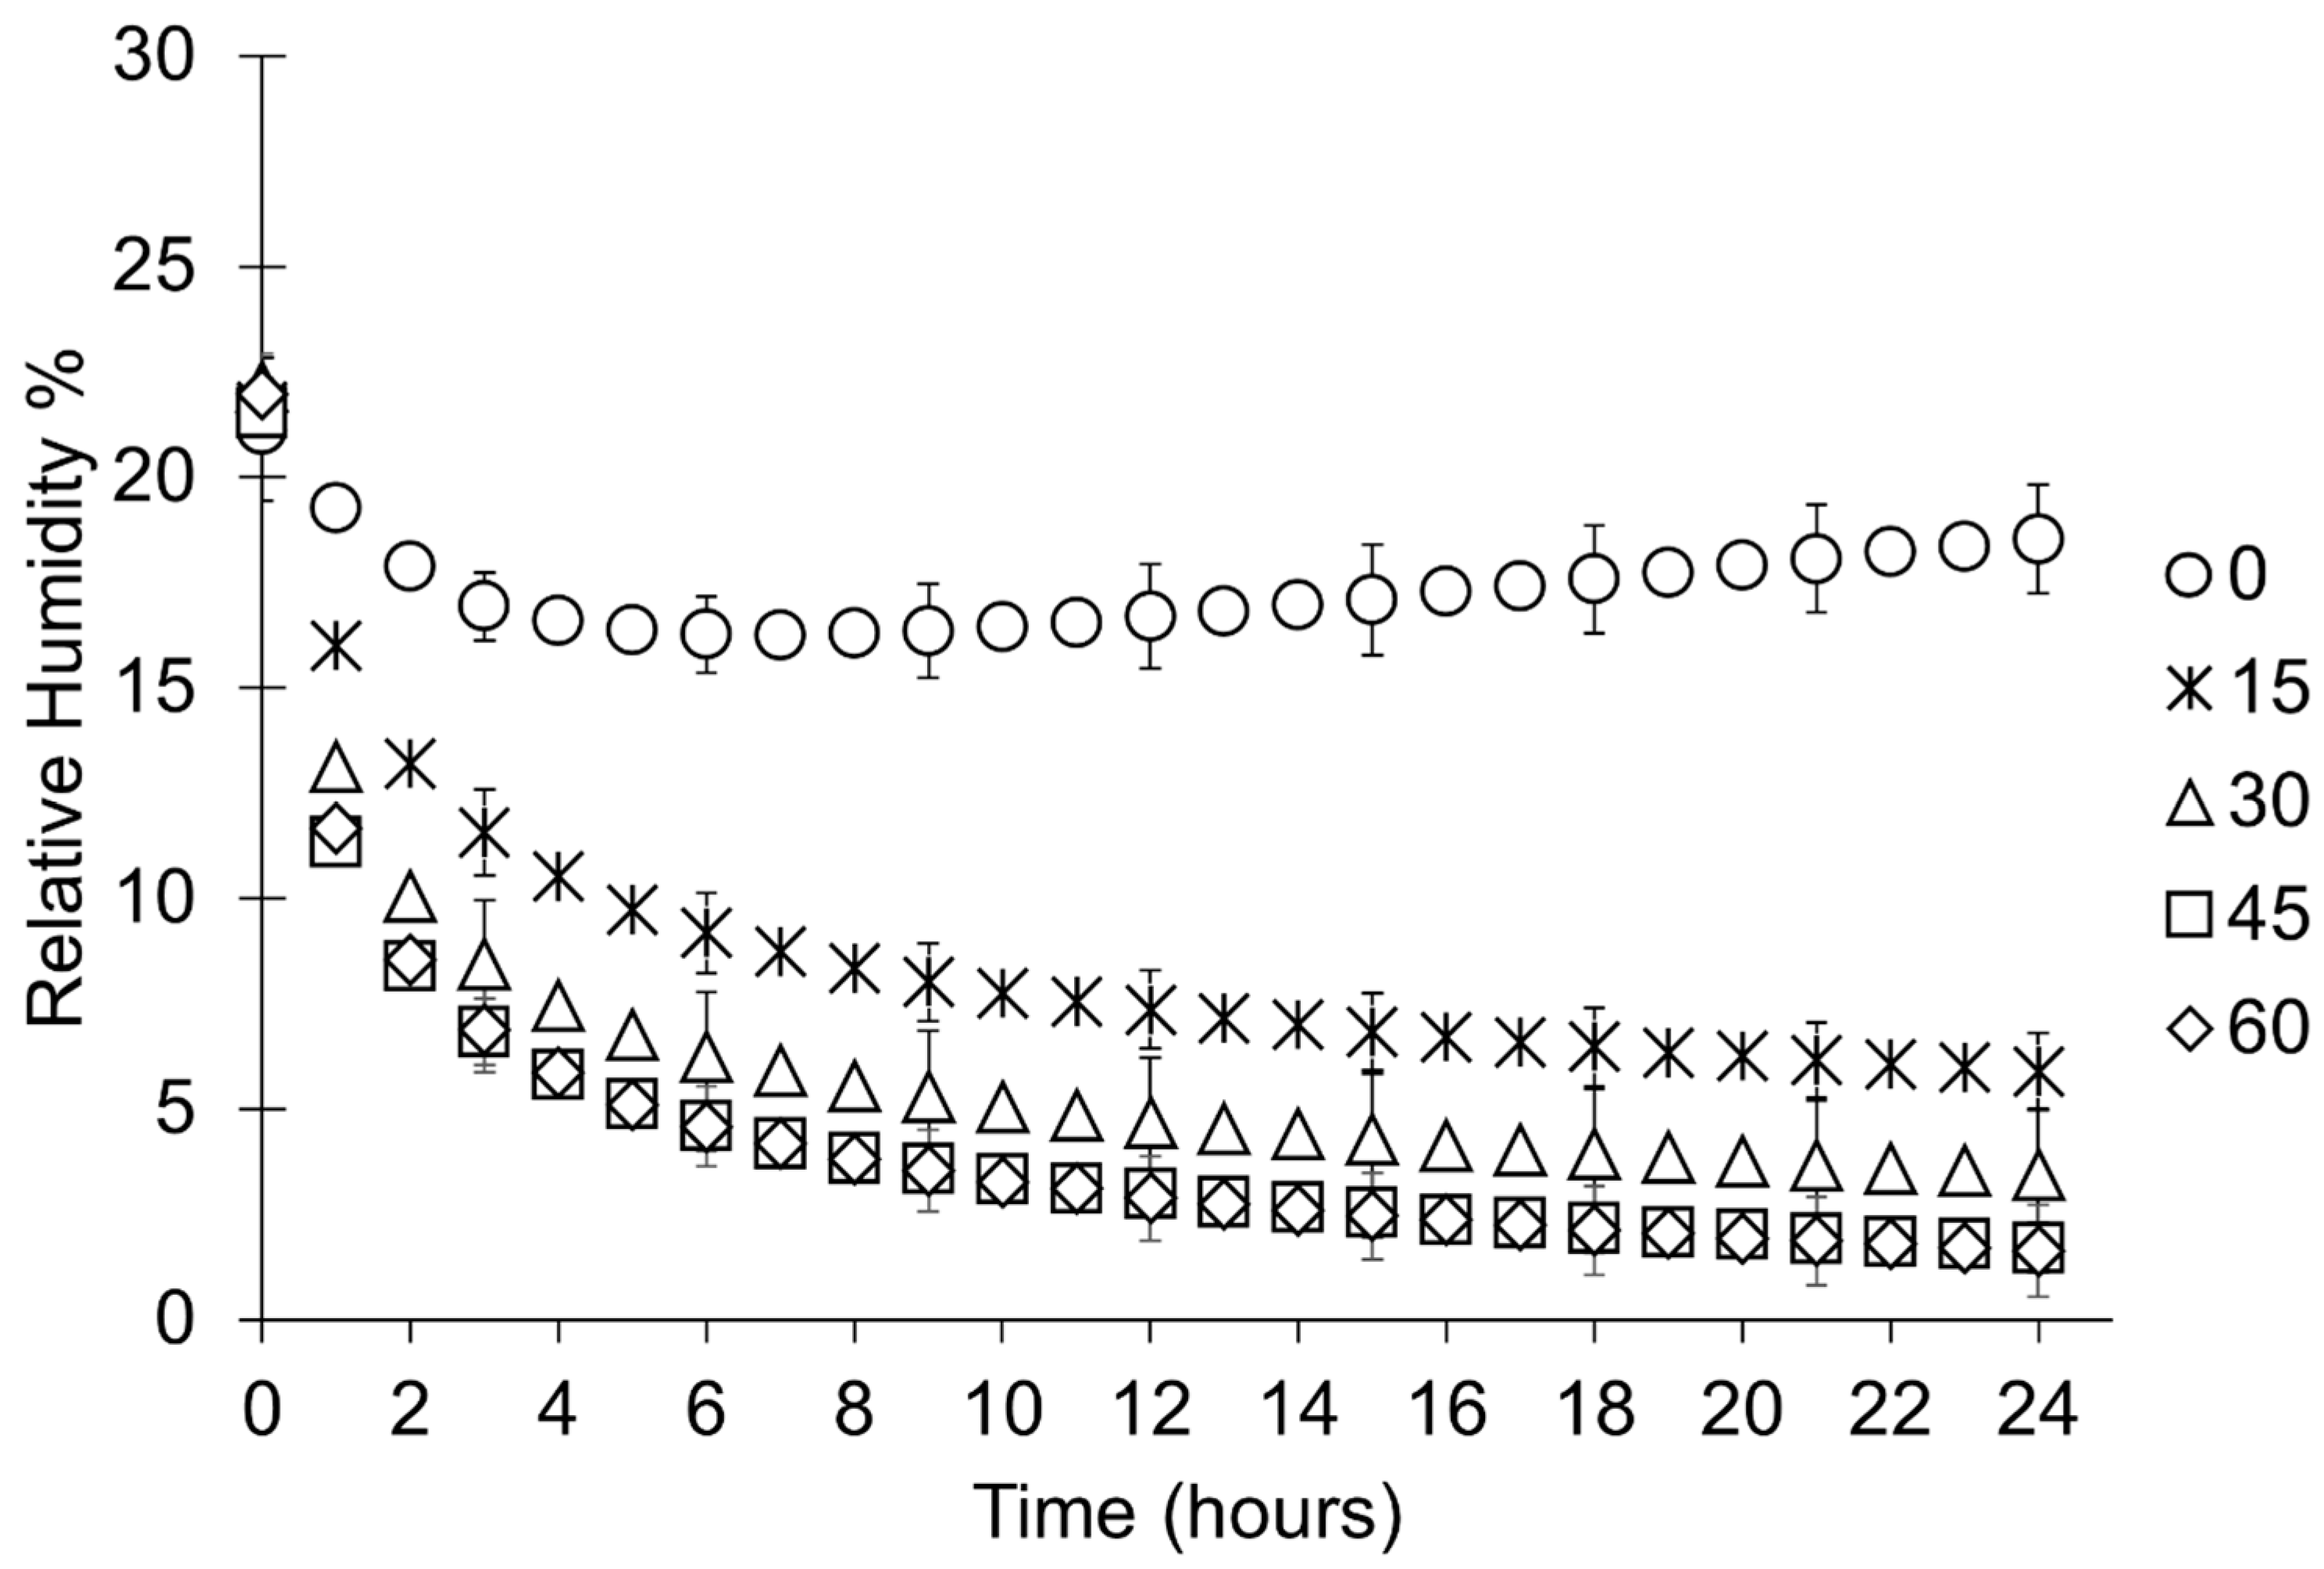
Figure 5.
Rate of desiccation during the first 24 h of the study where mean data from each sample set is presented in one-hour intervals. Error bars represent the standard deviation of that datapoint. Key indicates how many times each bag is pierced.
Figure 5.
Rate of desiccation during the first 24 h of the study where mean data from each sample set is presented in one-hour intervals. Error bars represent the standard deviation of that datapoint. Key indicates how many times each bag is pierced.
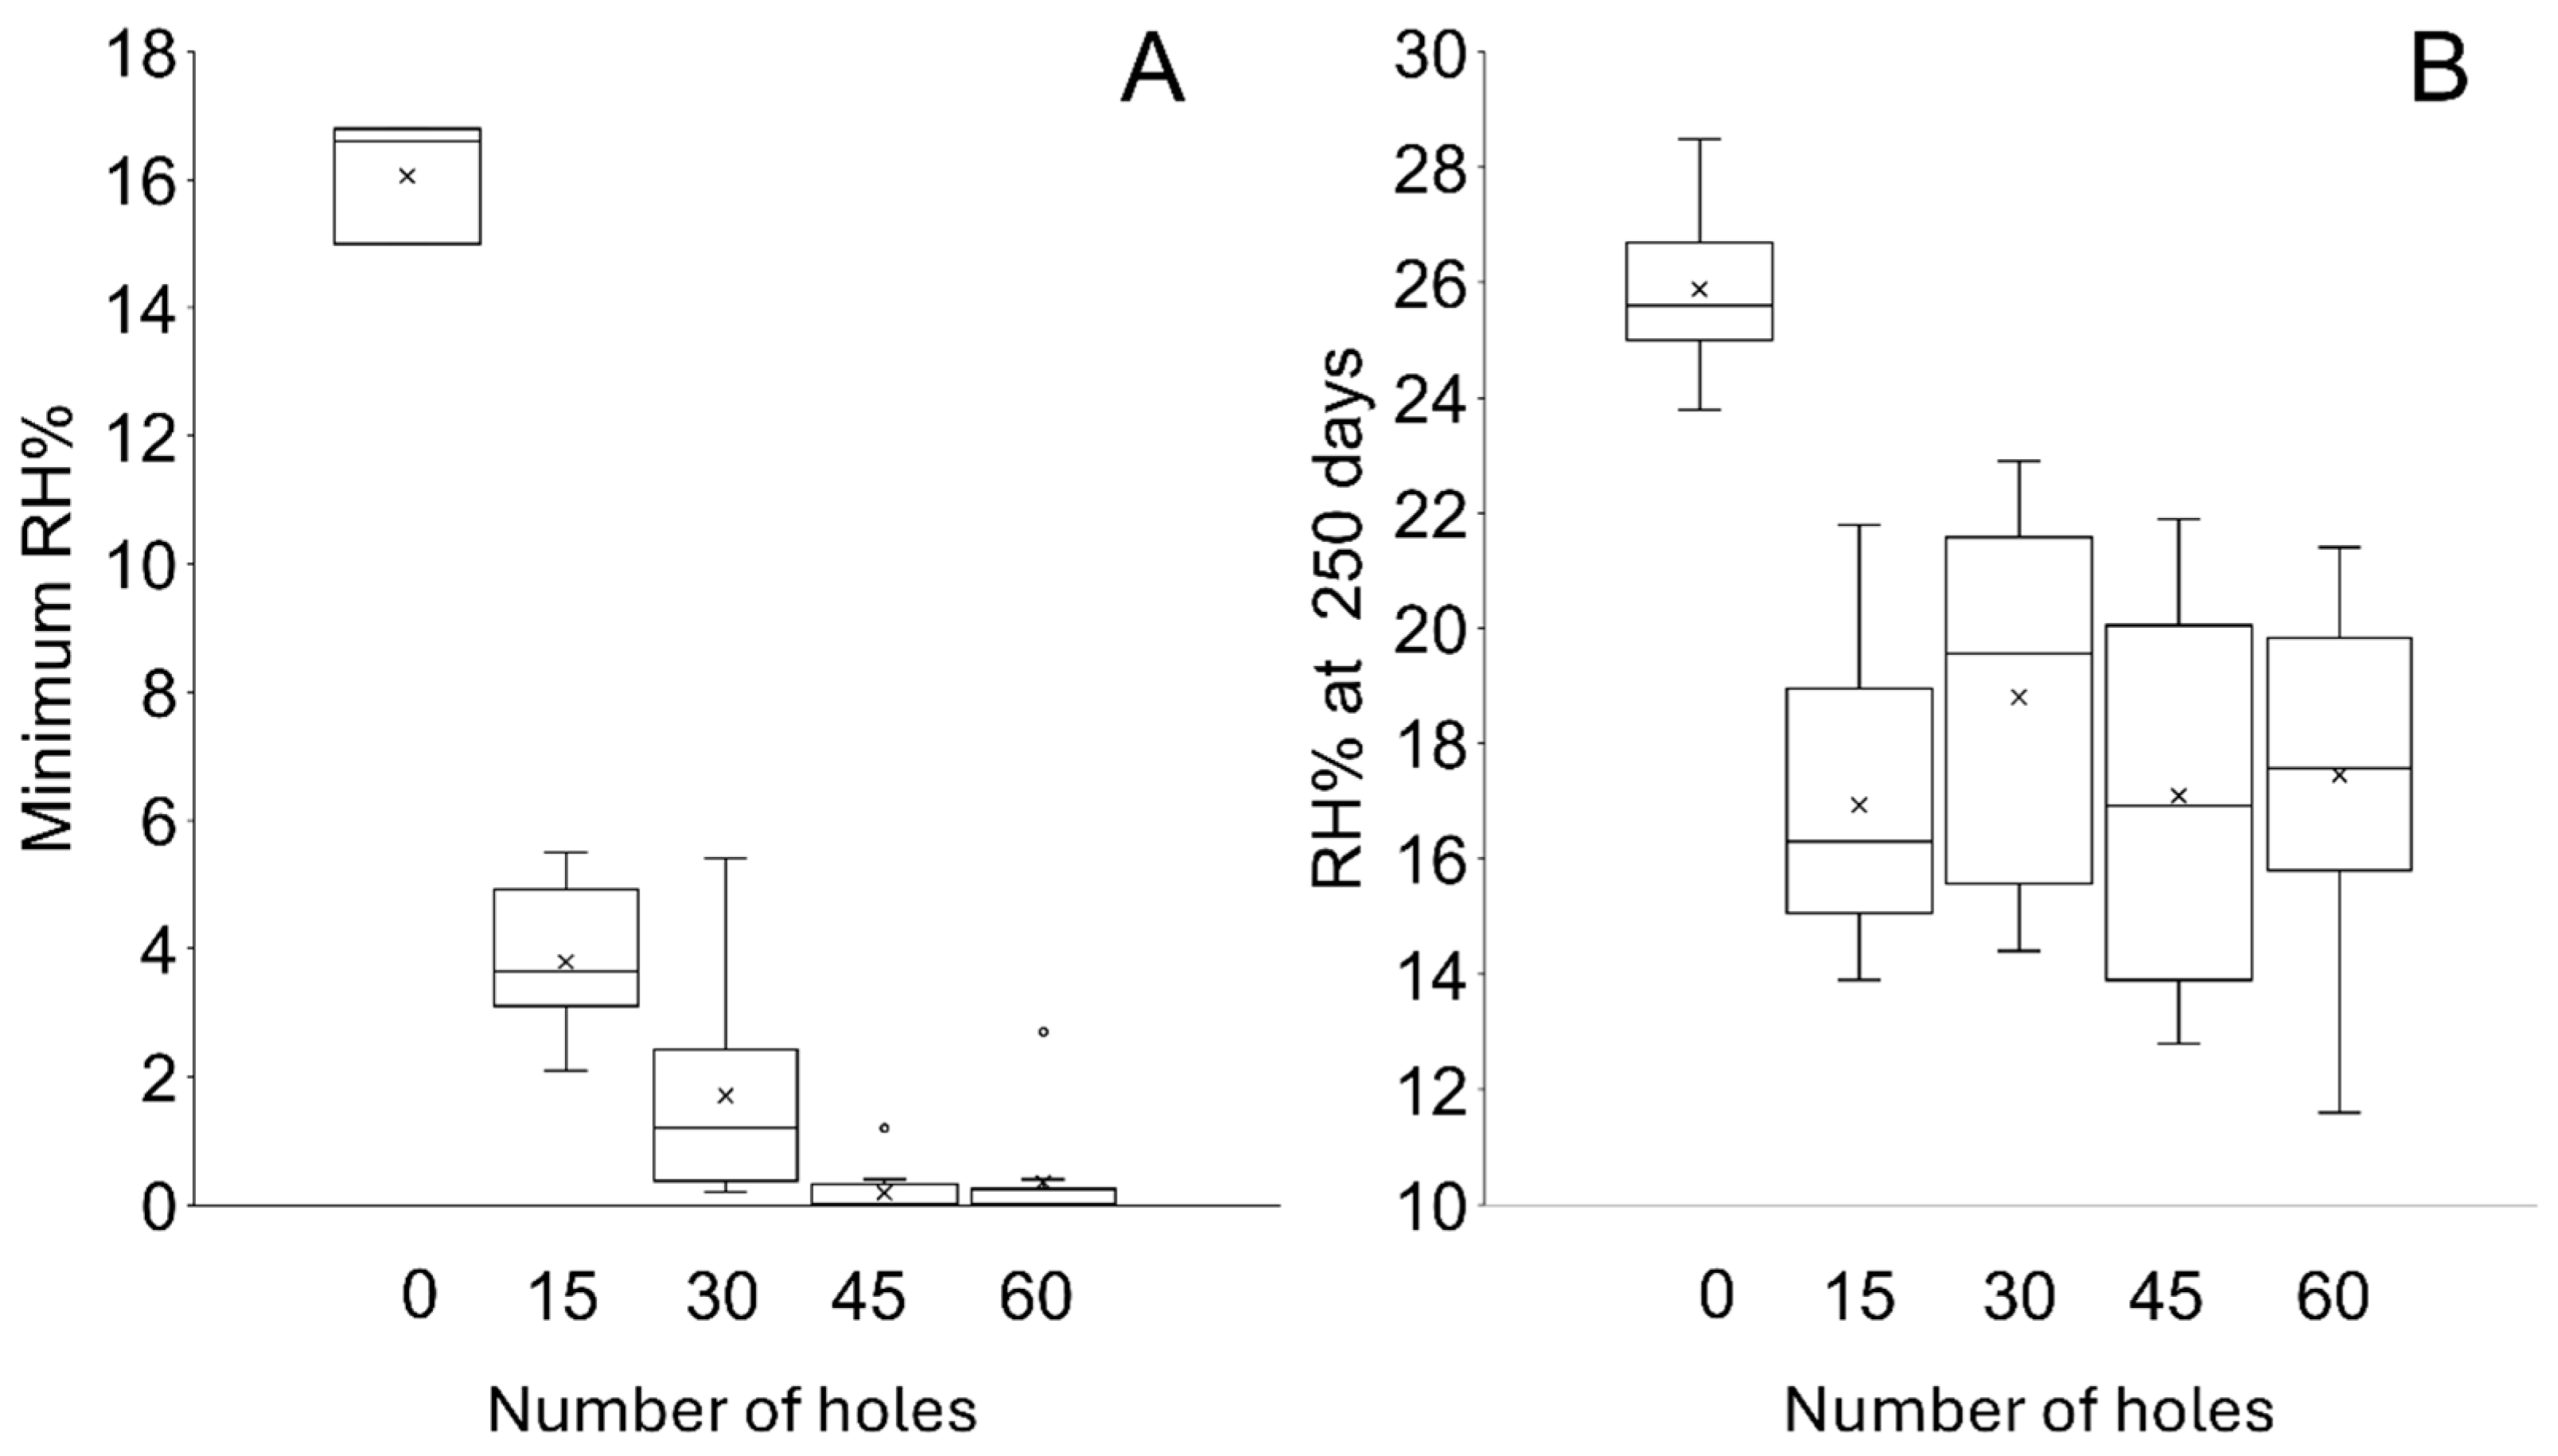
Figure 6.
Boxplot of the (A) minimum RH and (B) RH at 250 days showing the spread of data. In all boxplots presented here, the box represents the interquartile range, the horizontal line within the box denotes the median, the x shows the mean and the upper and lower whiskers represent the maximum and minimum values. A circle shows an outlier, defined as being between 1.5 and 3 times the interquartile range from the upper or lower quartile.
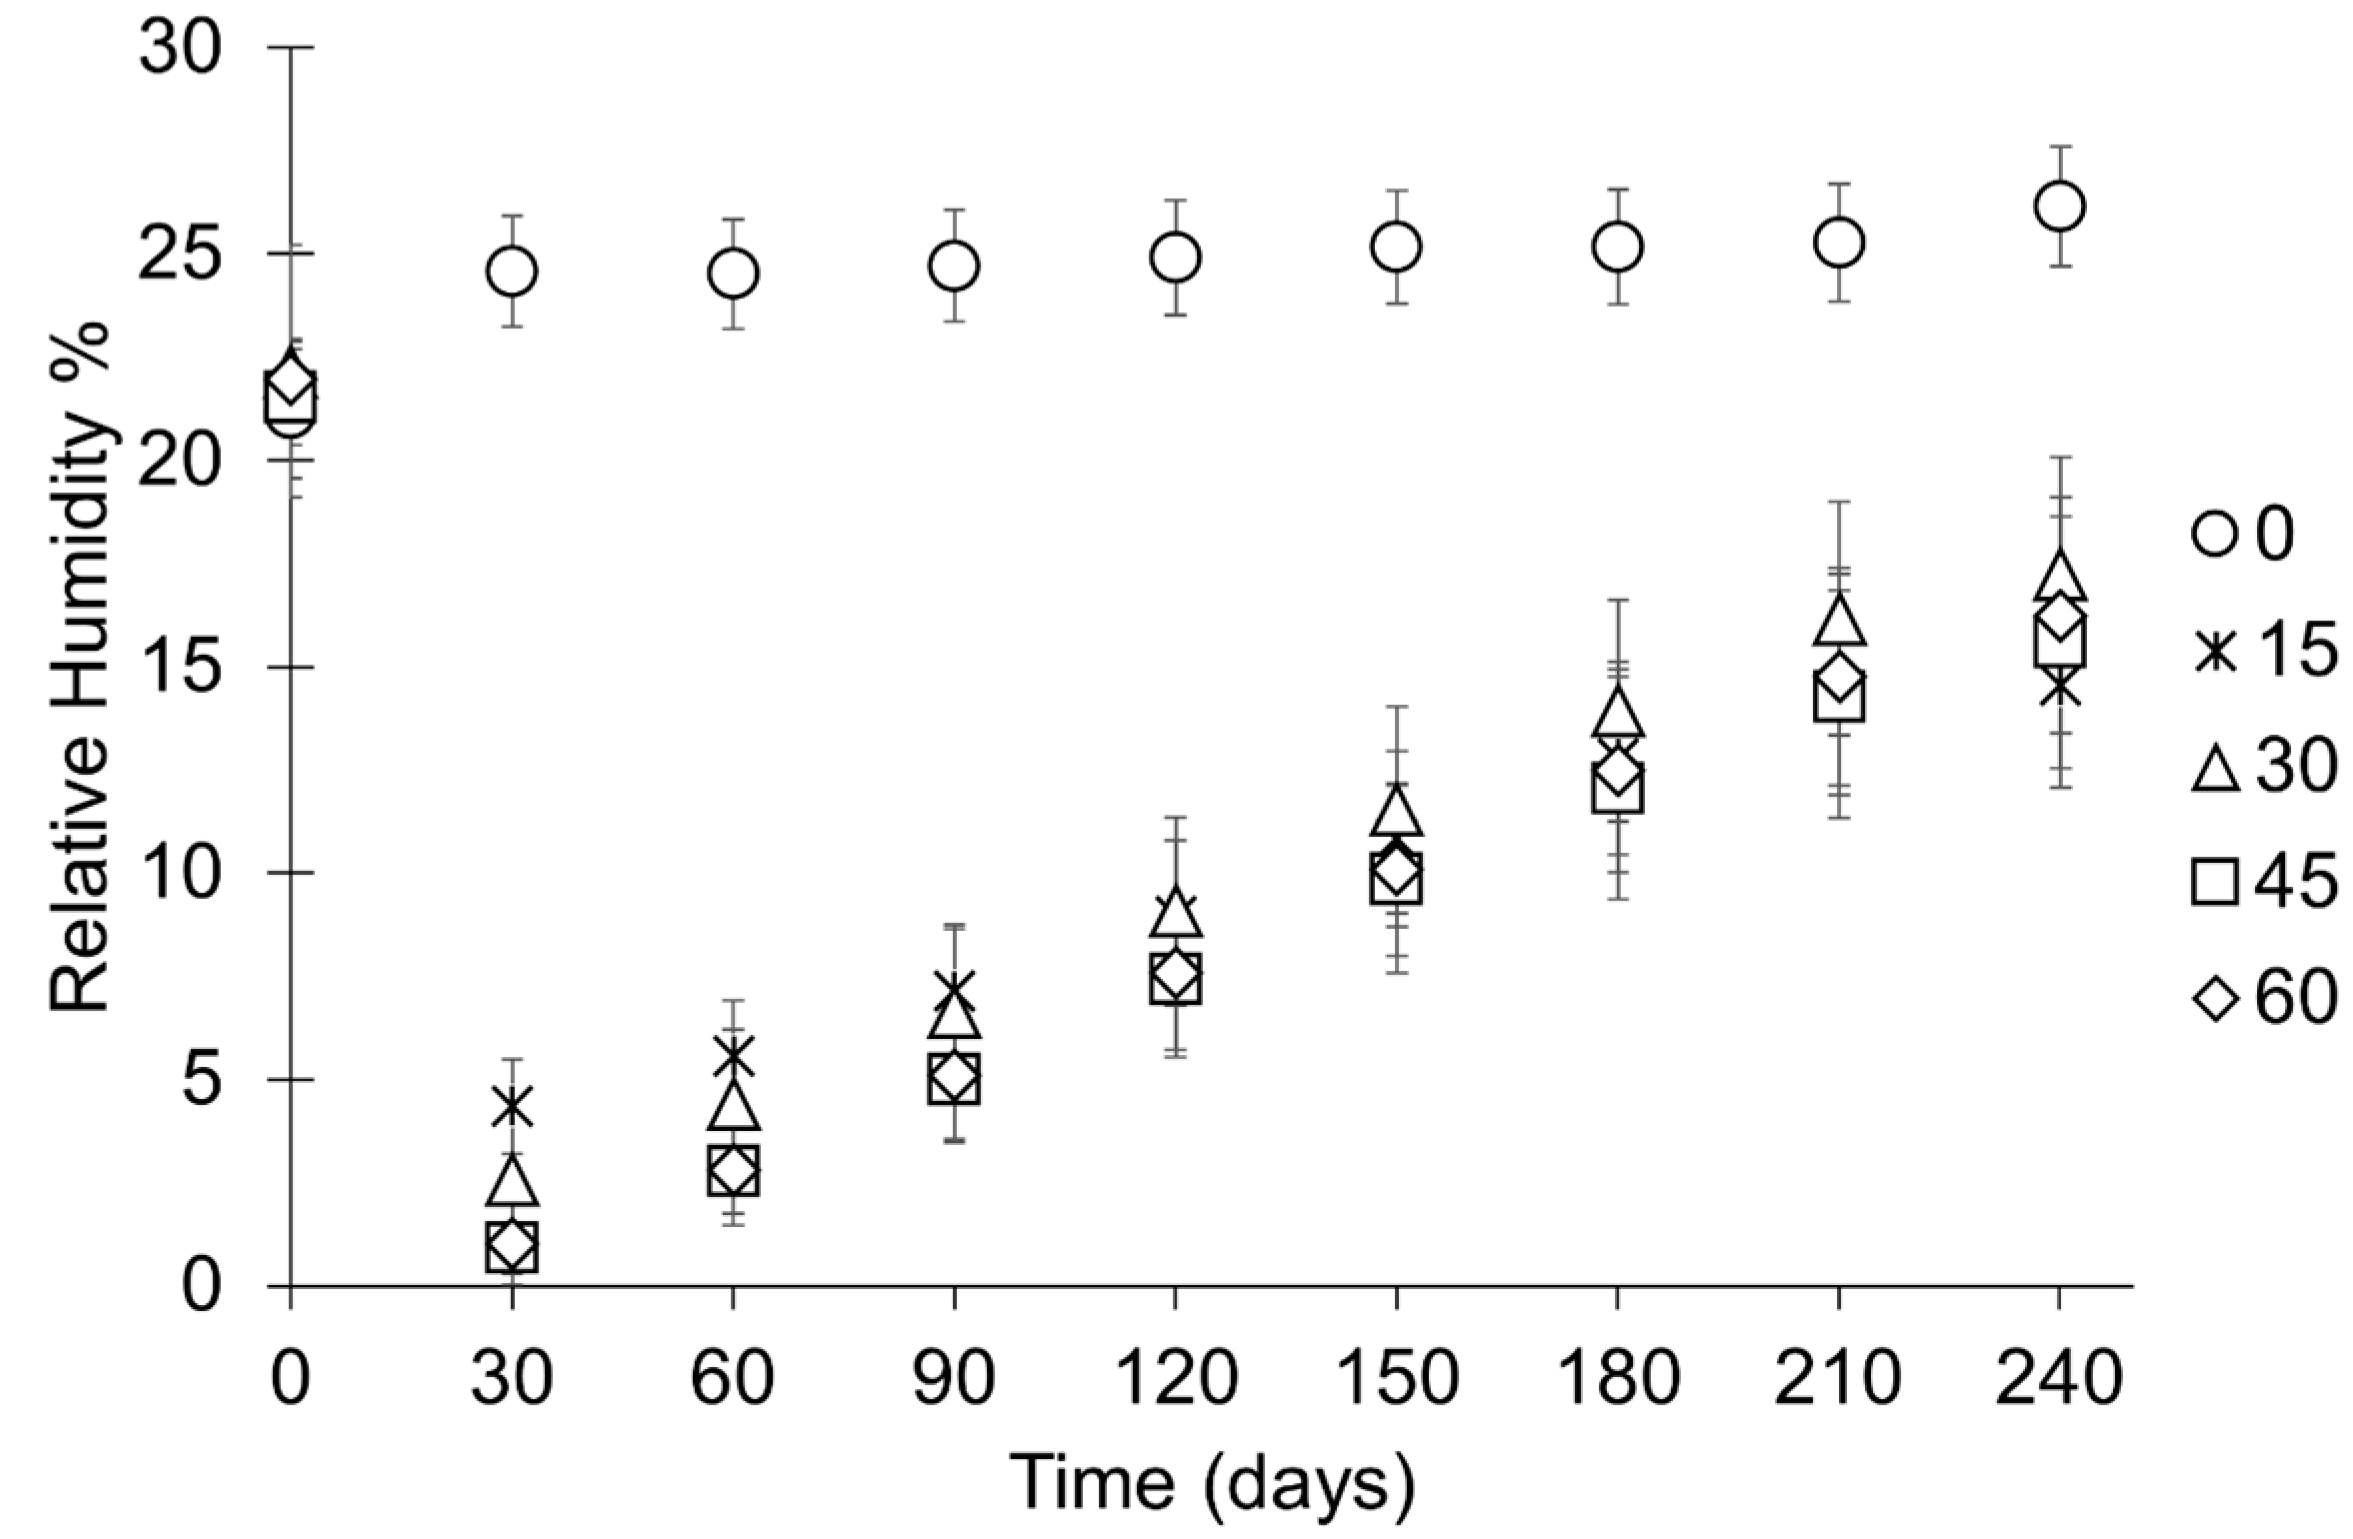
Figure 7.
Rate of change in RH throughout the period of study presented as the mean of each sample set at 30-day intervals. Error bars represent the standard deviation of that datapoint. Key indicates how many times each bag is pierced.
Figure 7.
Rate of change in RH throughout the period of study presented as the mean of each sample set at 30-day intervals. Error bars represent the standard deviation of that datapoint. Key indicates how many times each bag is pierced.
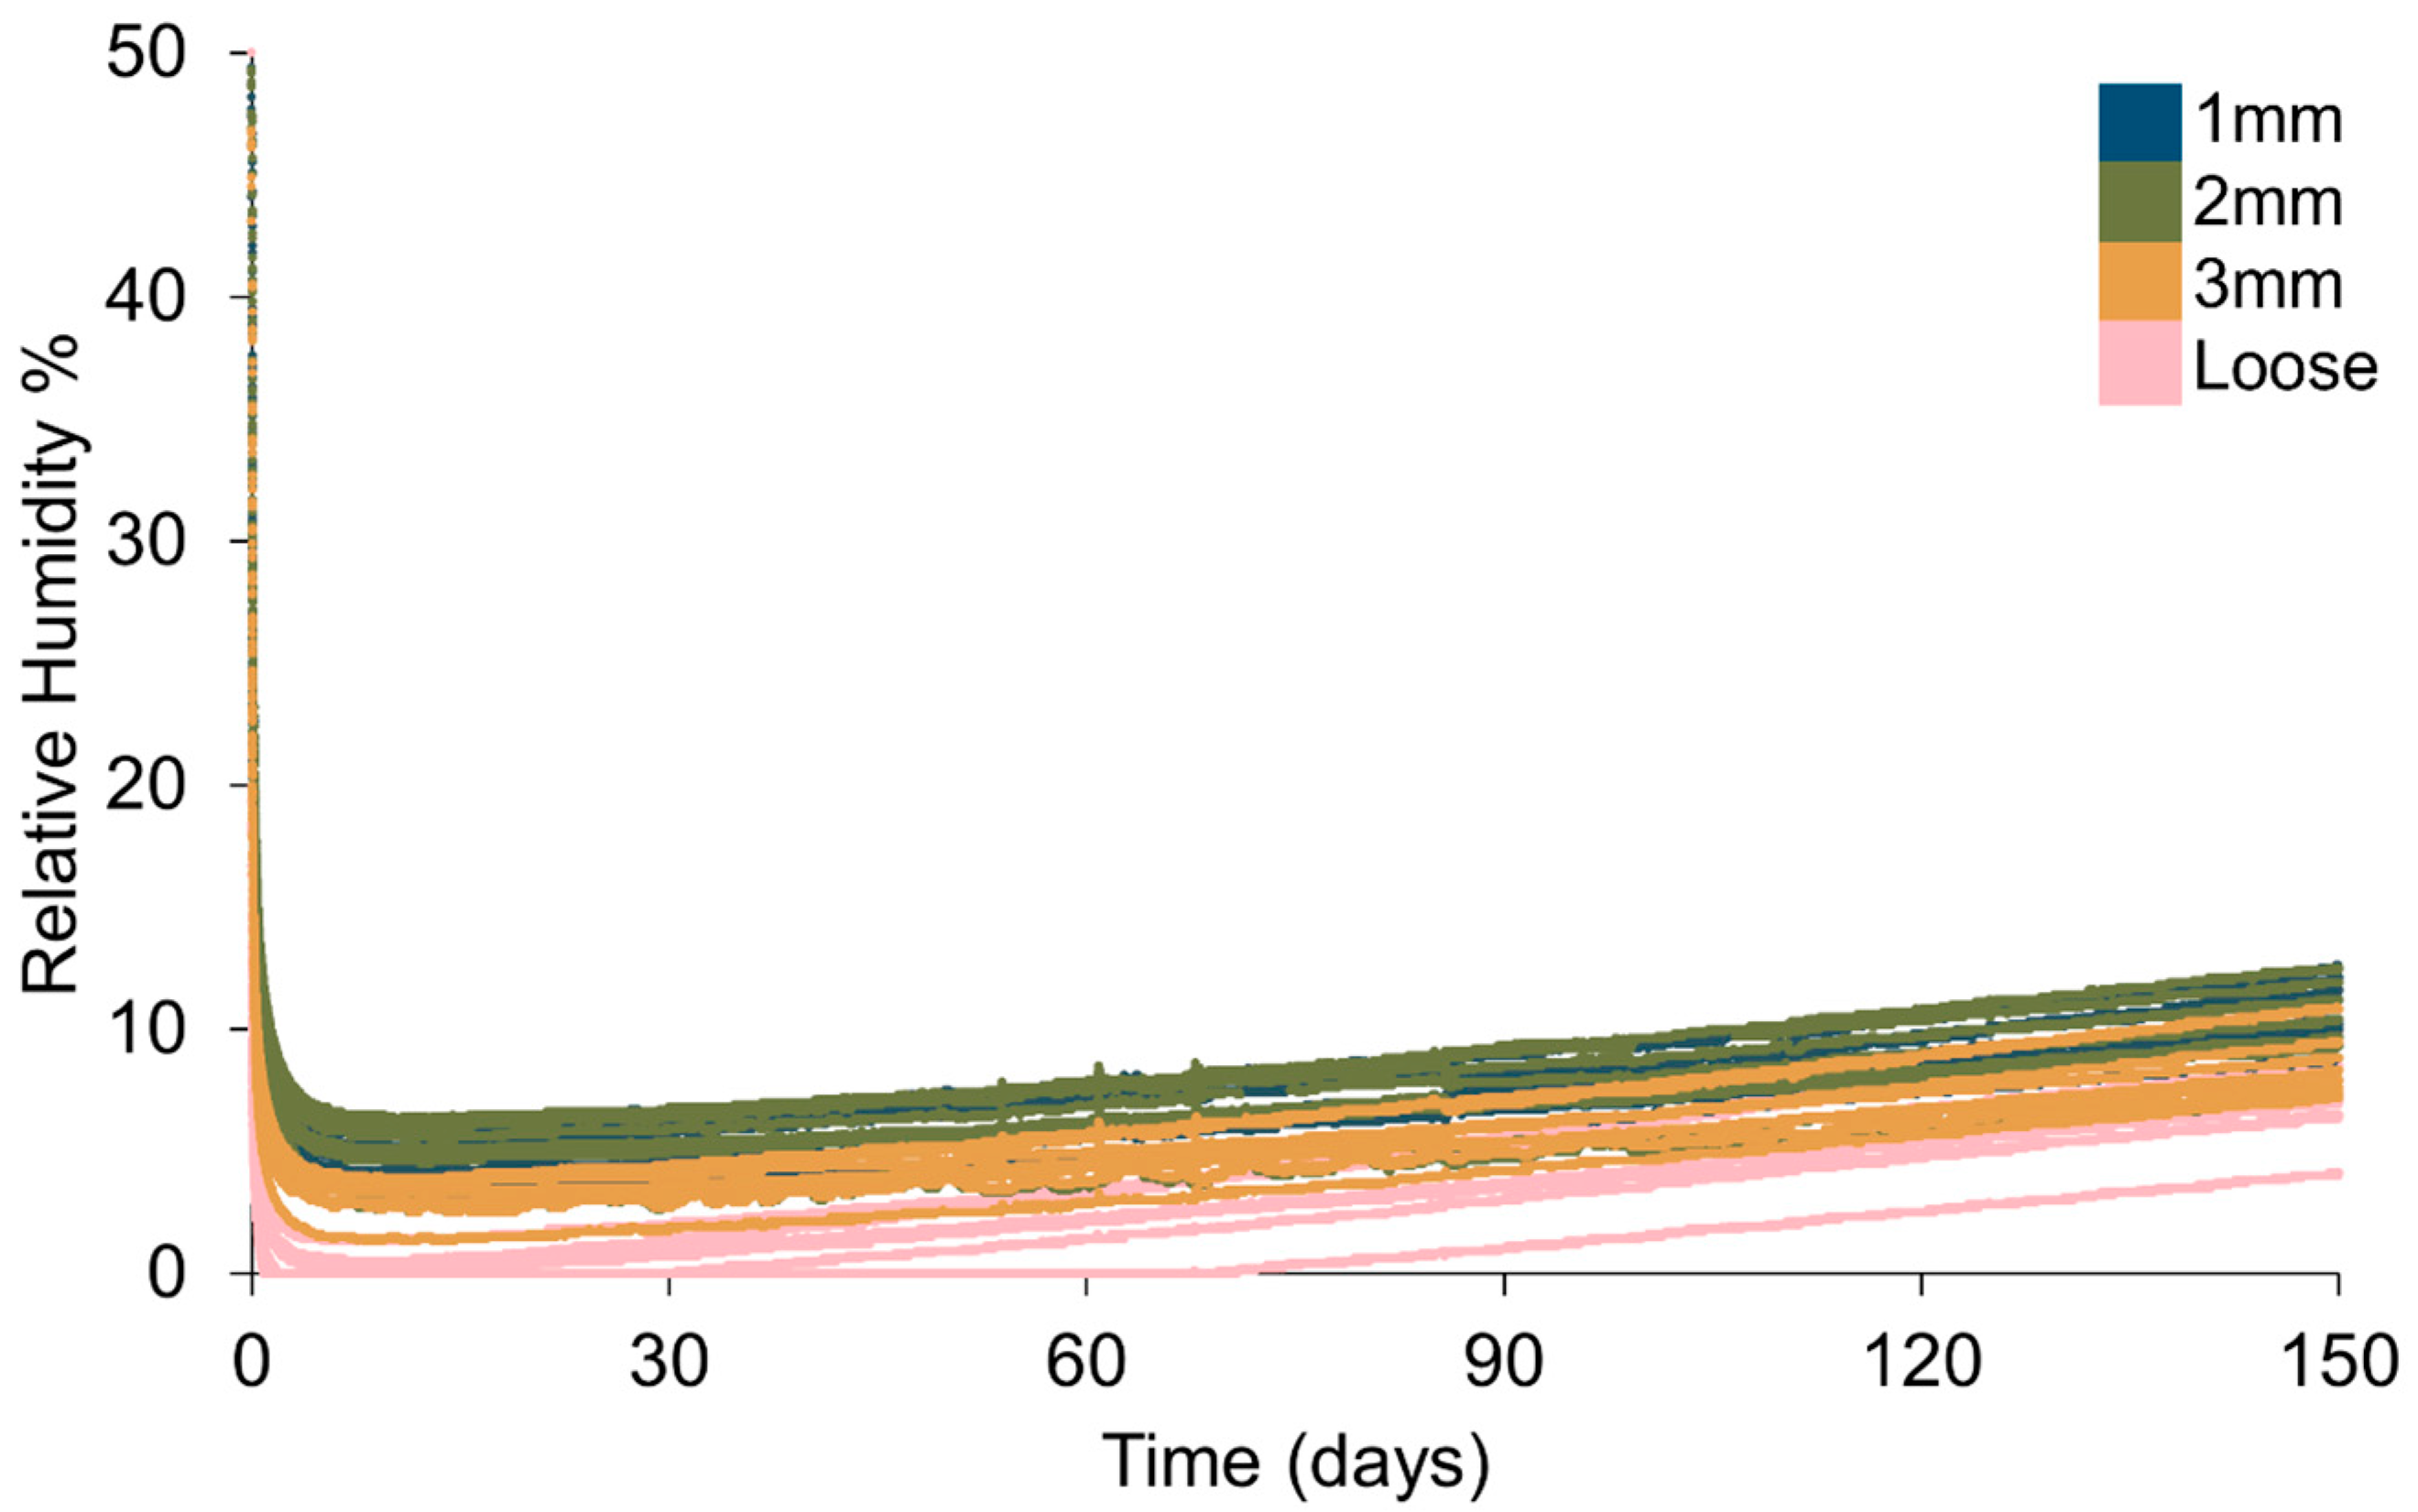
Figure 8.
Change in RH within 1 L Lock & Lock containers where 88 g of silica gel is placed in polythene bags with different diameter holes. Key indicates the size of each hole in diameter (mm).
Figure 8.
Change in RH within 1 L Lock & Lock containers where 88 g of silica gel is placed in polythene bags with different diameter holes. Key indicates the size of each hole in diameter (mm).
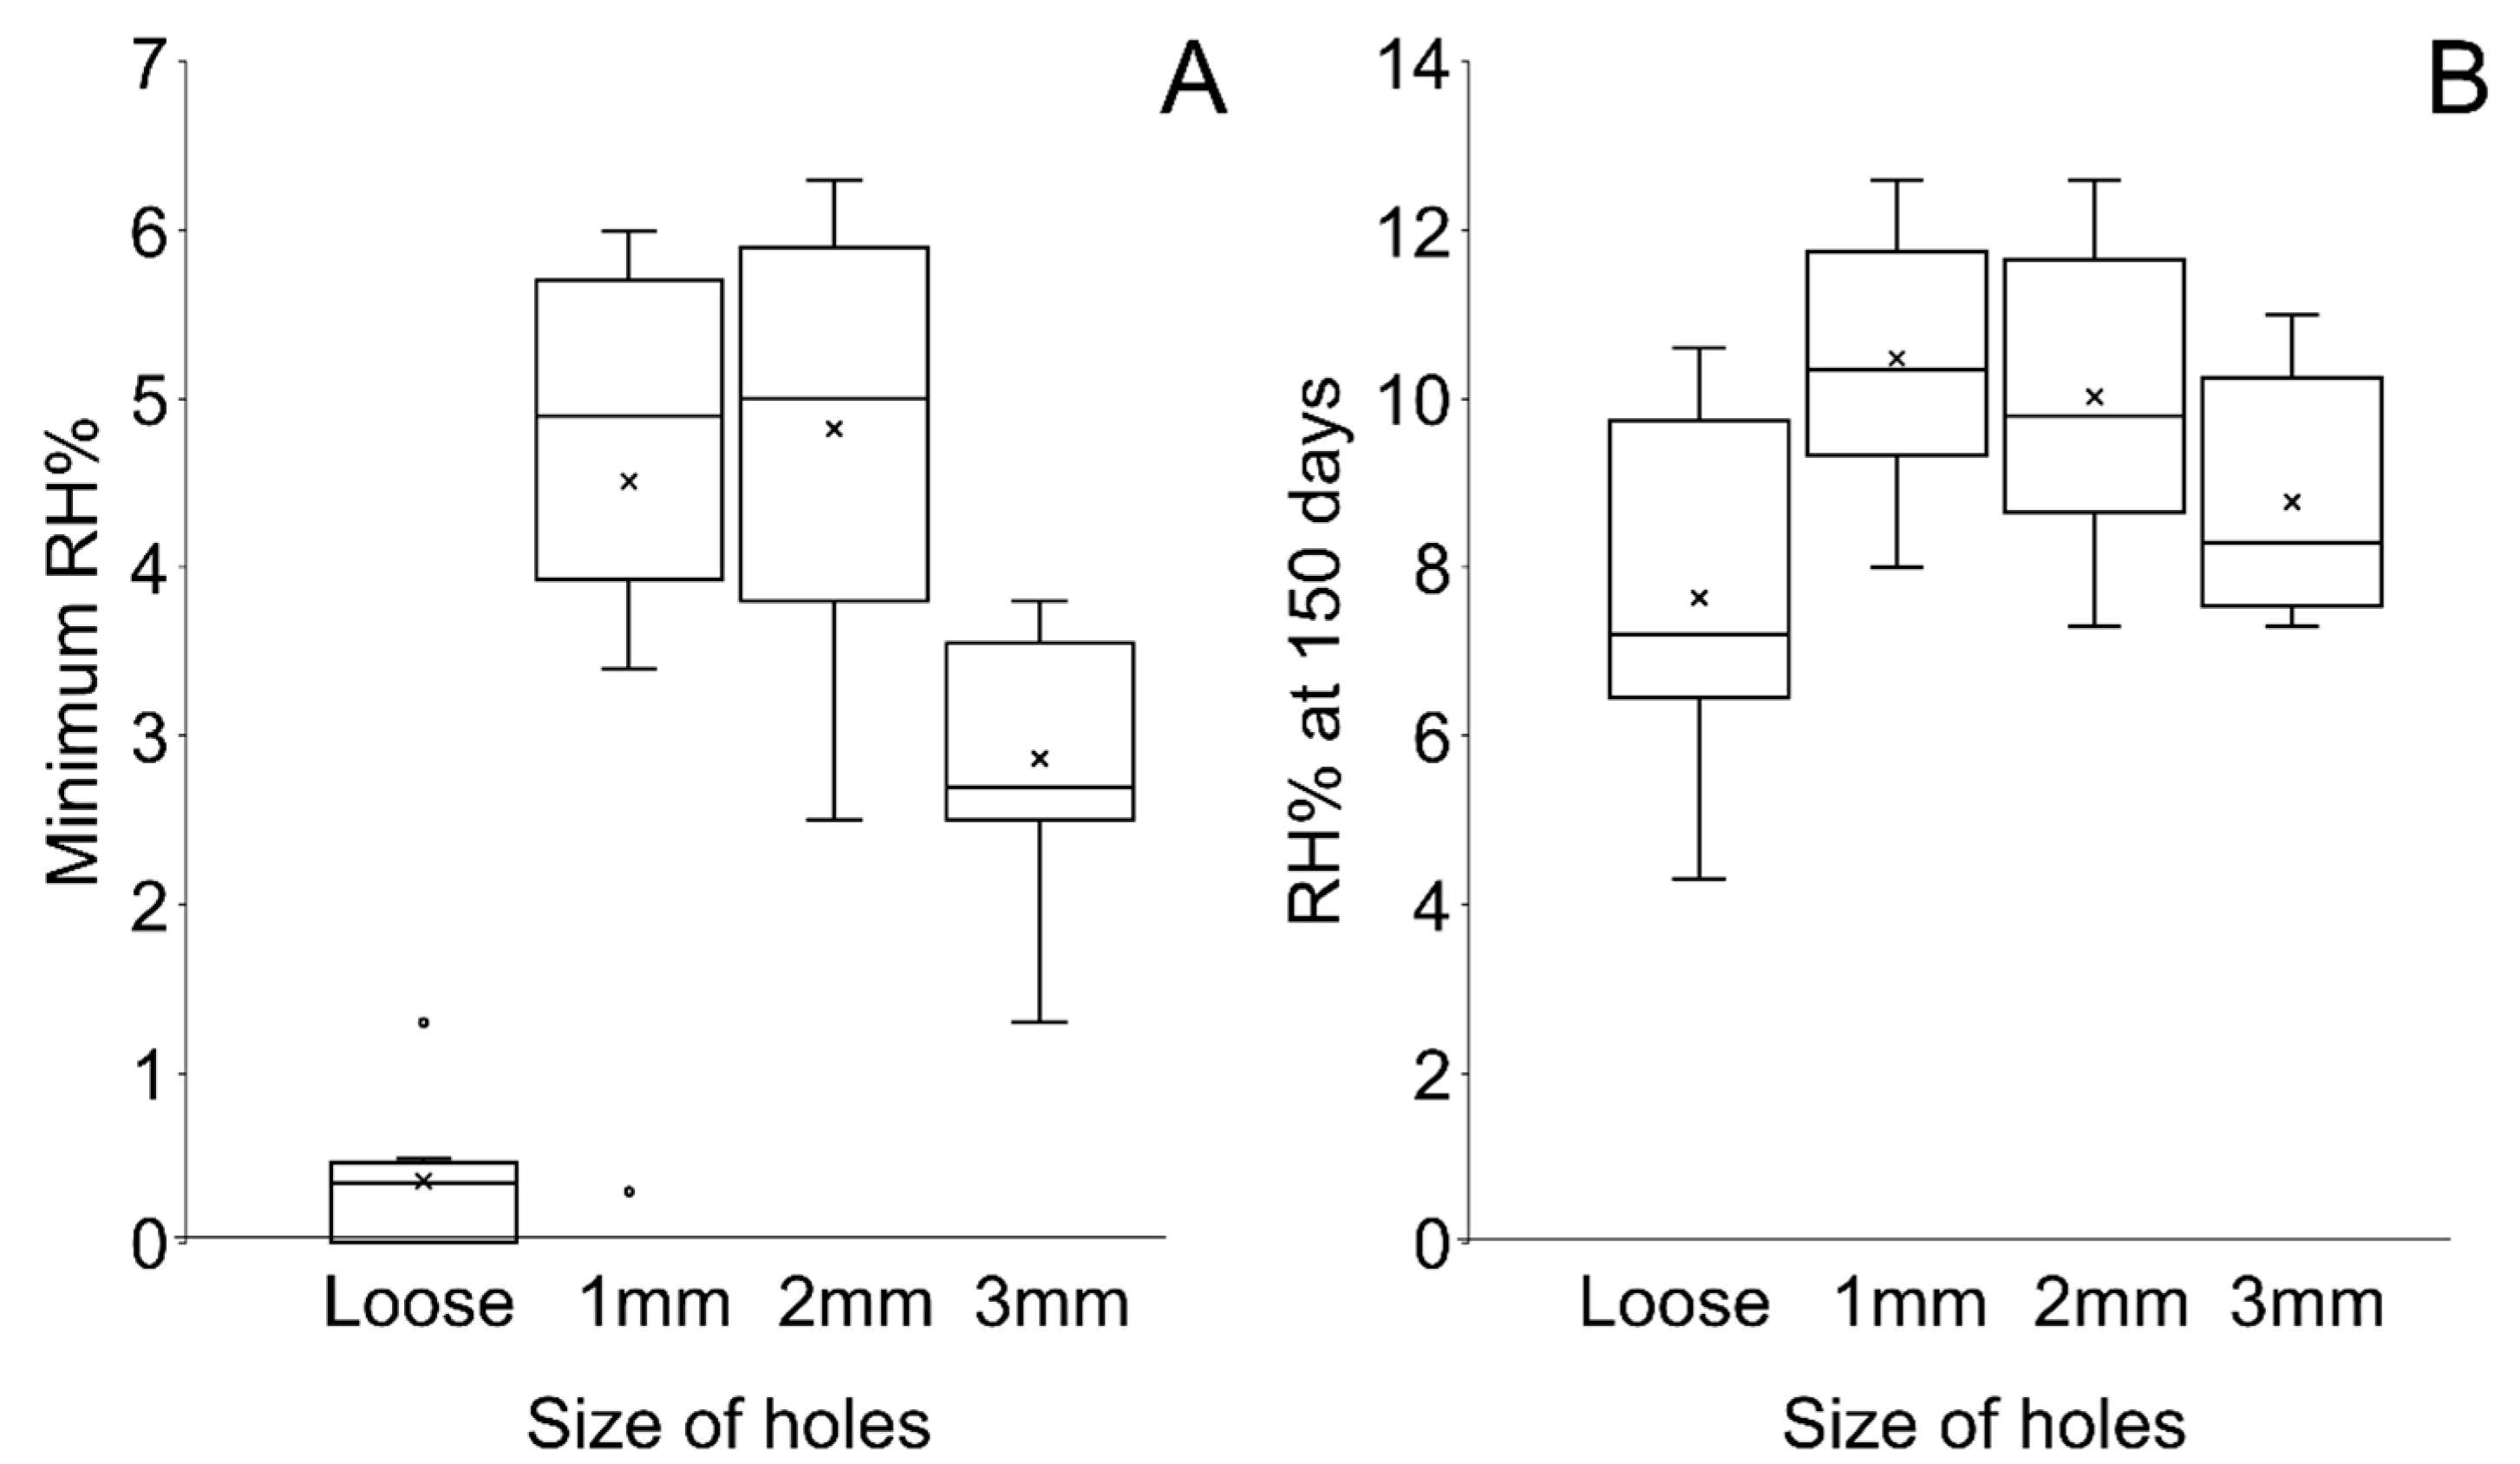
Figure 9.
Boxplot of (A) the minimum RH and (B) RH at 150 days (B) showing the spread of data.
Figure 9.
Boxplot of (A) the minimum RH and (B) RH at 150 days (B) showing the spread of data.
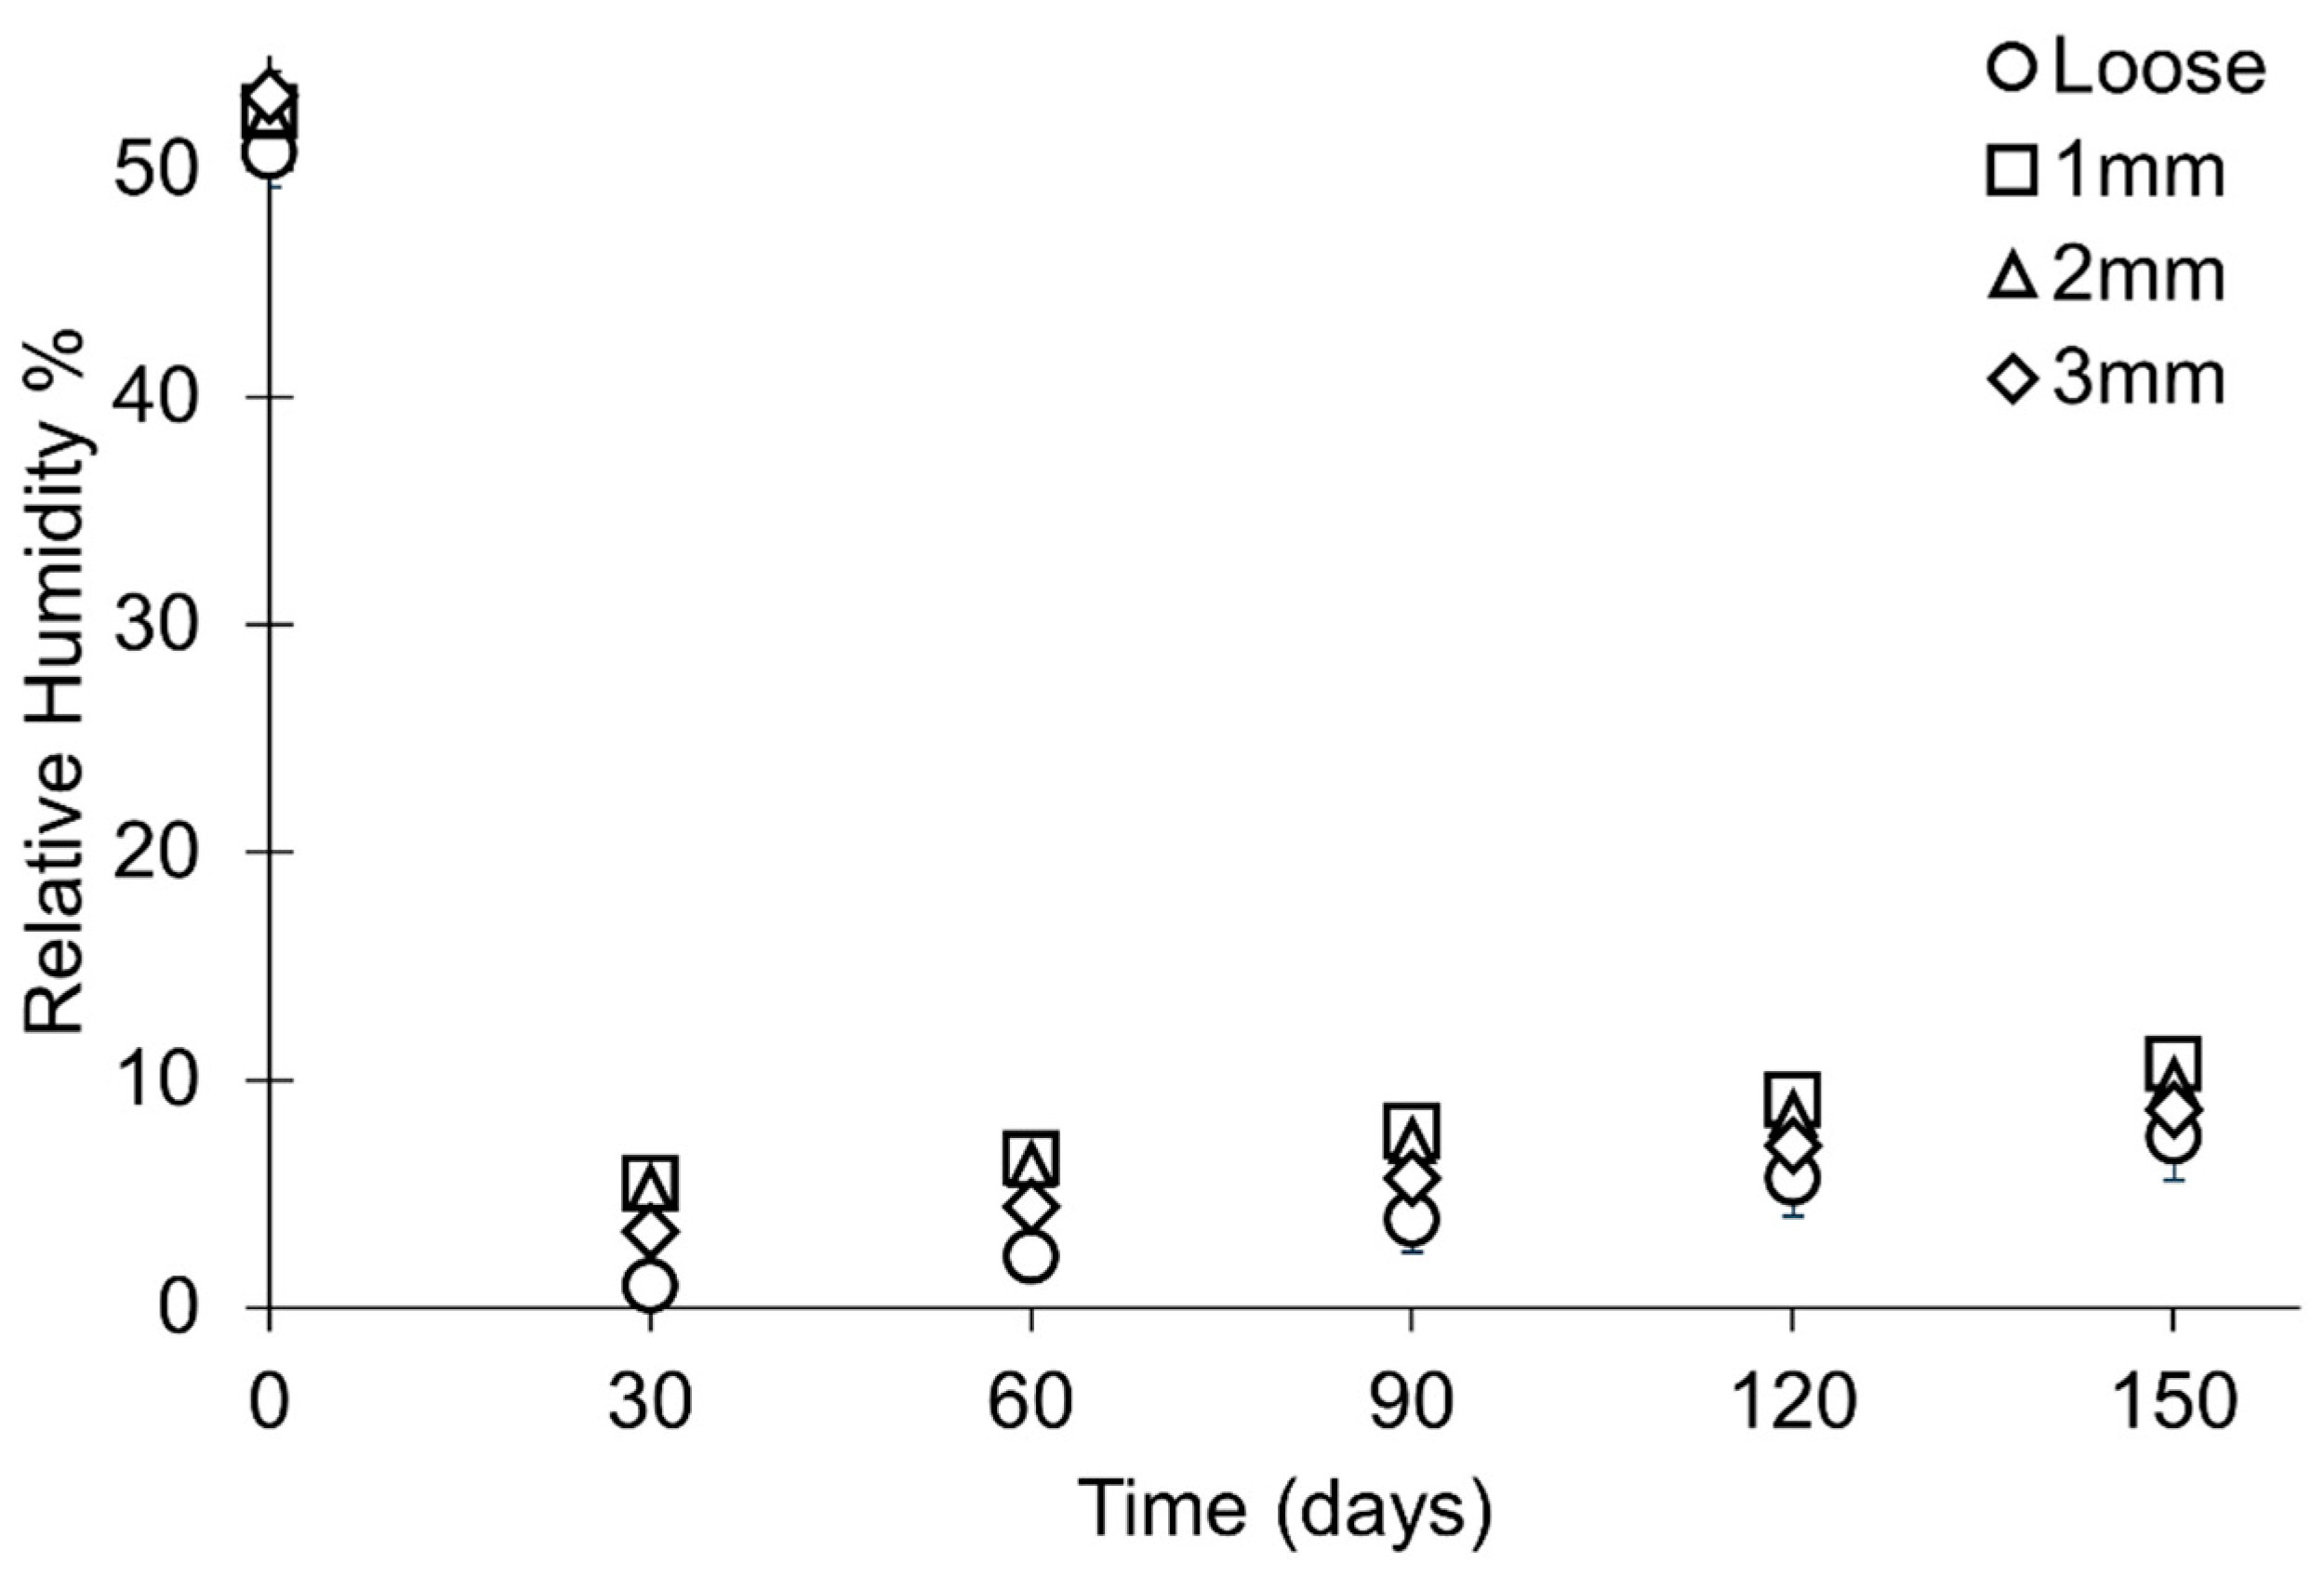
Figure 10.
Rate of desiccation during the first 24 h of the study where mean data from each sample set is presented in one-hour intervals. Error bars represent the standard deviation of that datapoint. Key indicates the size of each hole in diameter (mm).
Figure 10.
Rate of desiccation during the first 24 h of the study where mean data from each sample set is presented in one-hour intervals. Error bars represent the standard deviation of that datapoint. Key indicates the size of each hole in diameter (mm).
Figure 11.
Rate of change in RH throughout the period of study presented as the mean of each sample set at 30-day intervals. Error bars represent the standard deviation of that datapoint.
Figure 11.
Rate of change in RH throughout the period of study presented as the mean of each sample set at 30-day intervals. Error bars represent the standard deviation of that datapoint.
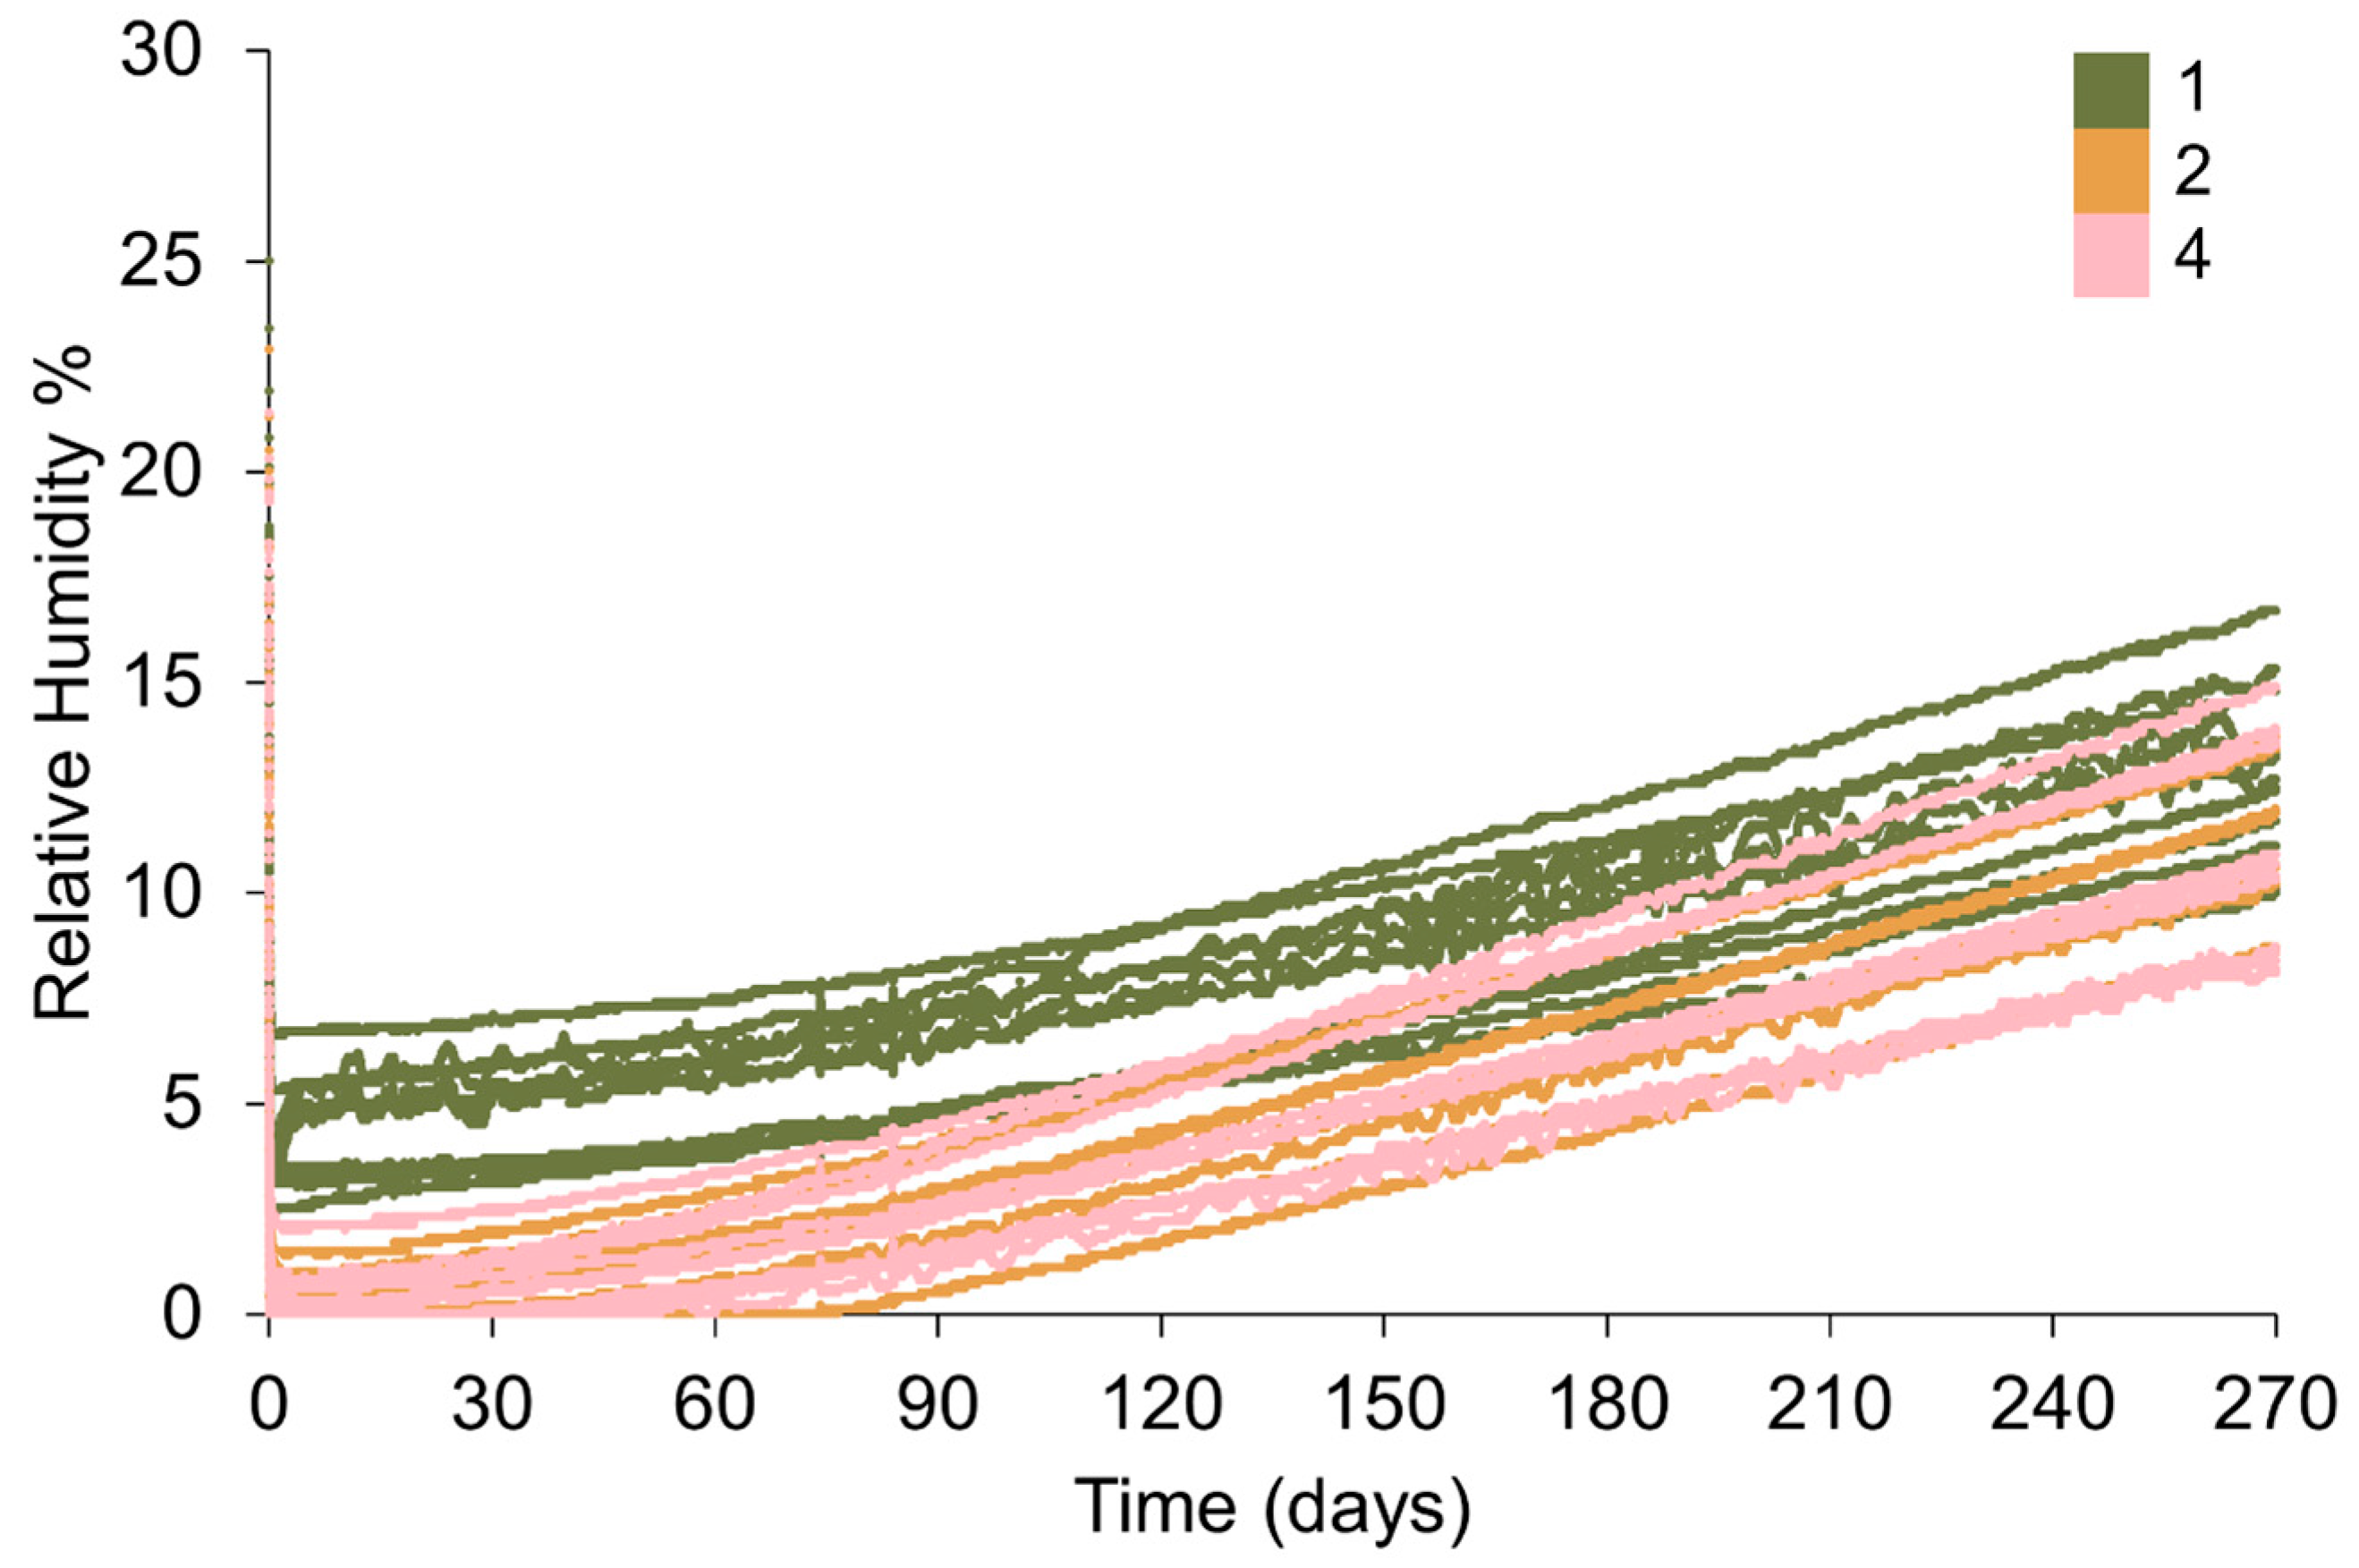
Figure 12.
Change in RH within 1 L Lock & Lock containers where 88 g of silica gel is placed in varying numbers of polythene bags. Key indicates the number of bags silica gel is distributed over.
Figure 12.
Change in RH within 1 L Lock & Lock containers where 88 g of silica gel is placed in varying numbers of polythene bags. Key indicates the number of bags silica gel is distributed over.
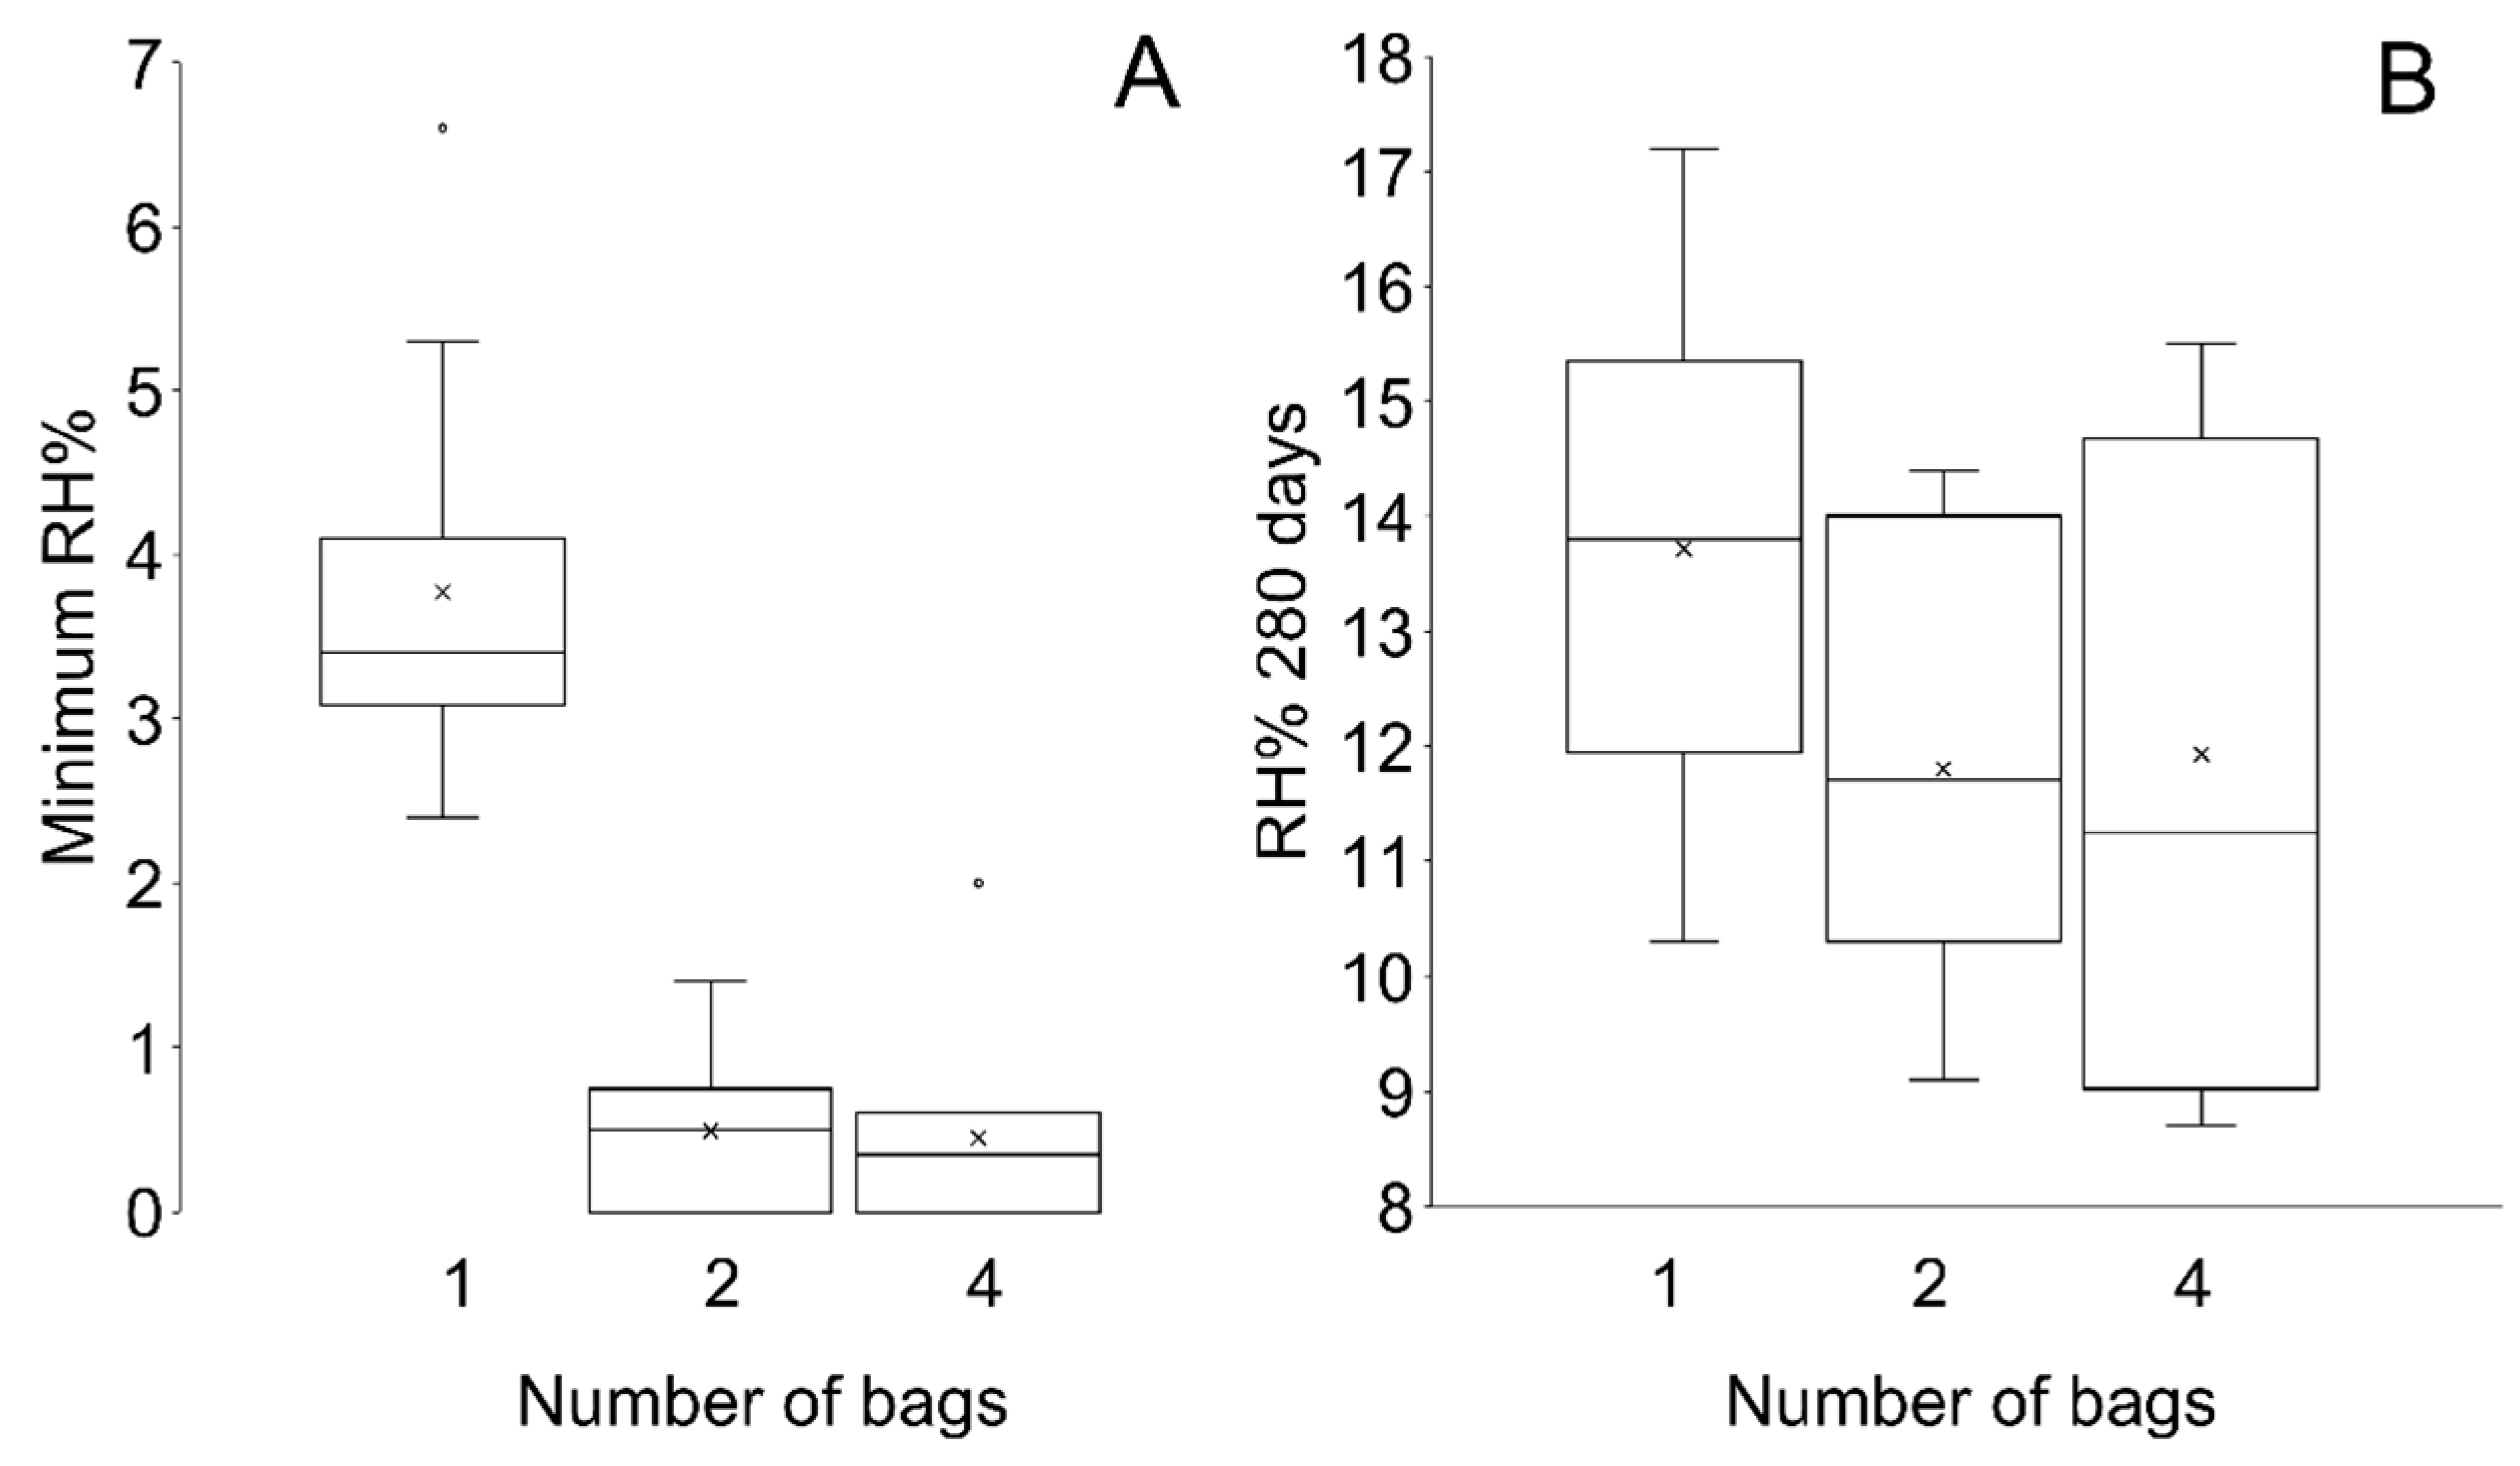
Figure 13.
Boxplot of (A) the minimum RH and (B) RH at 270 days showing the spread of data.
Figure 13.
Boxplot of (A) the minimum RH and (B) RH at 270 days showing the spread of data.
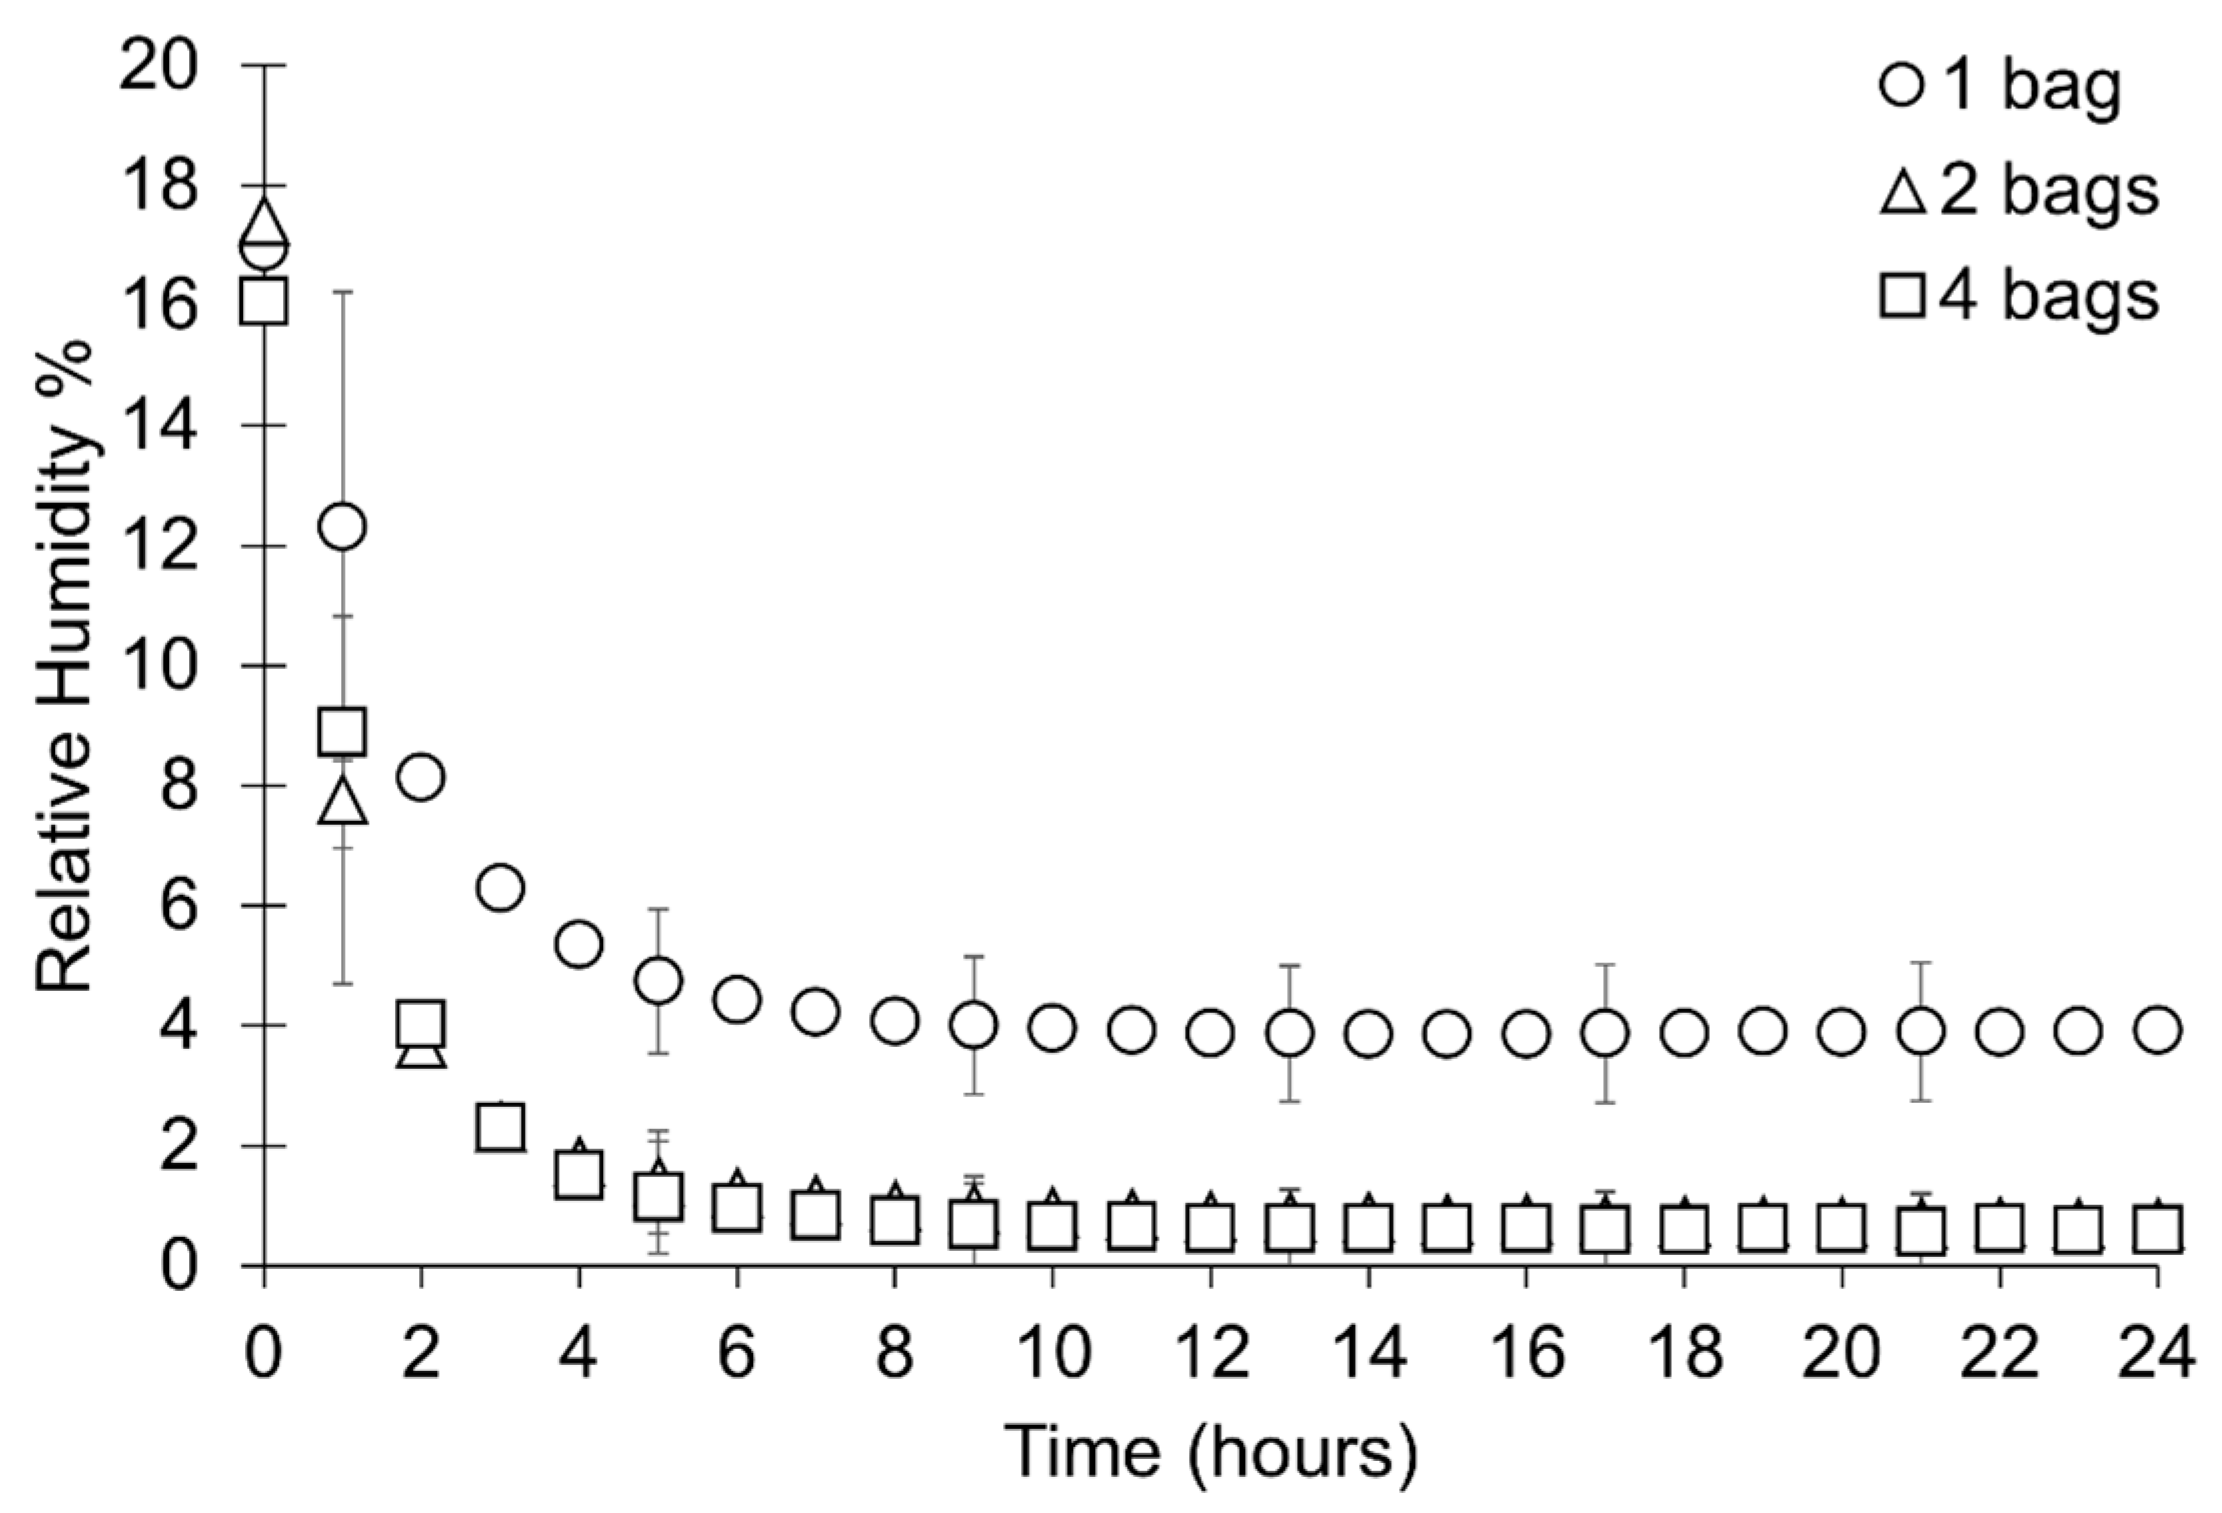
Figure 14.
Rate of desiccation during the first 24 h of the study where mean data from each sample set is presented in one-hour intervals. Error bars represent the standard deviation of that datapoint. Key indicates the number of bags silica gel is distributed over.
Figure 14.
Rate of desiccation during the first 24 h of the study where mean data from each sample set is presented in one-hour intervals. Error bars represent the standard deviation of that datapoint. Key indicates the number of bags silica gel is distributed over.
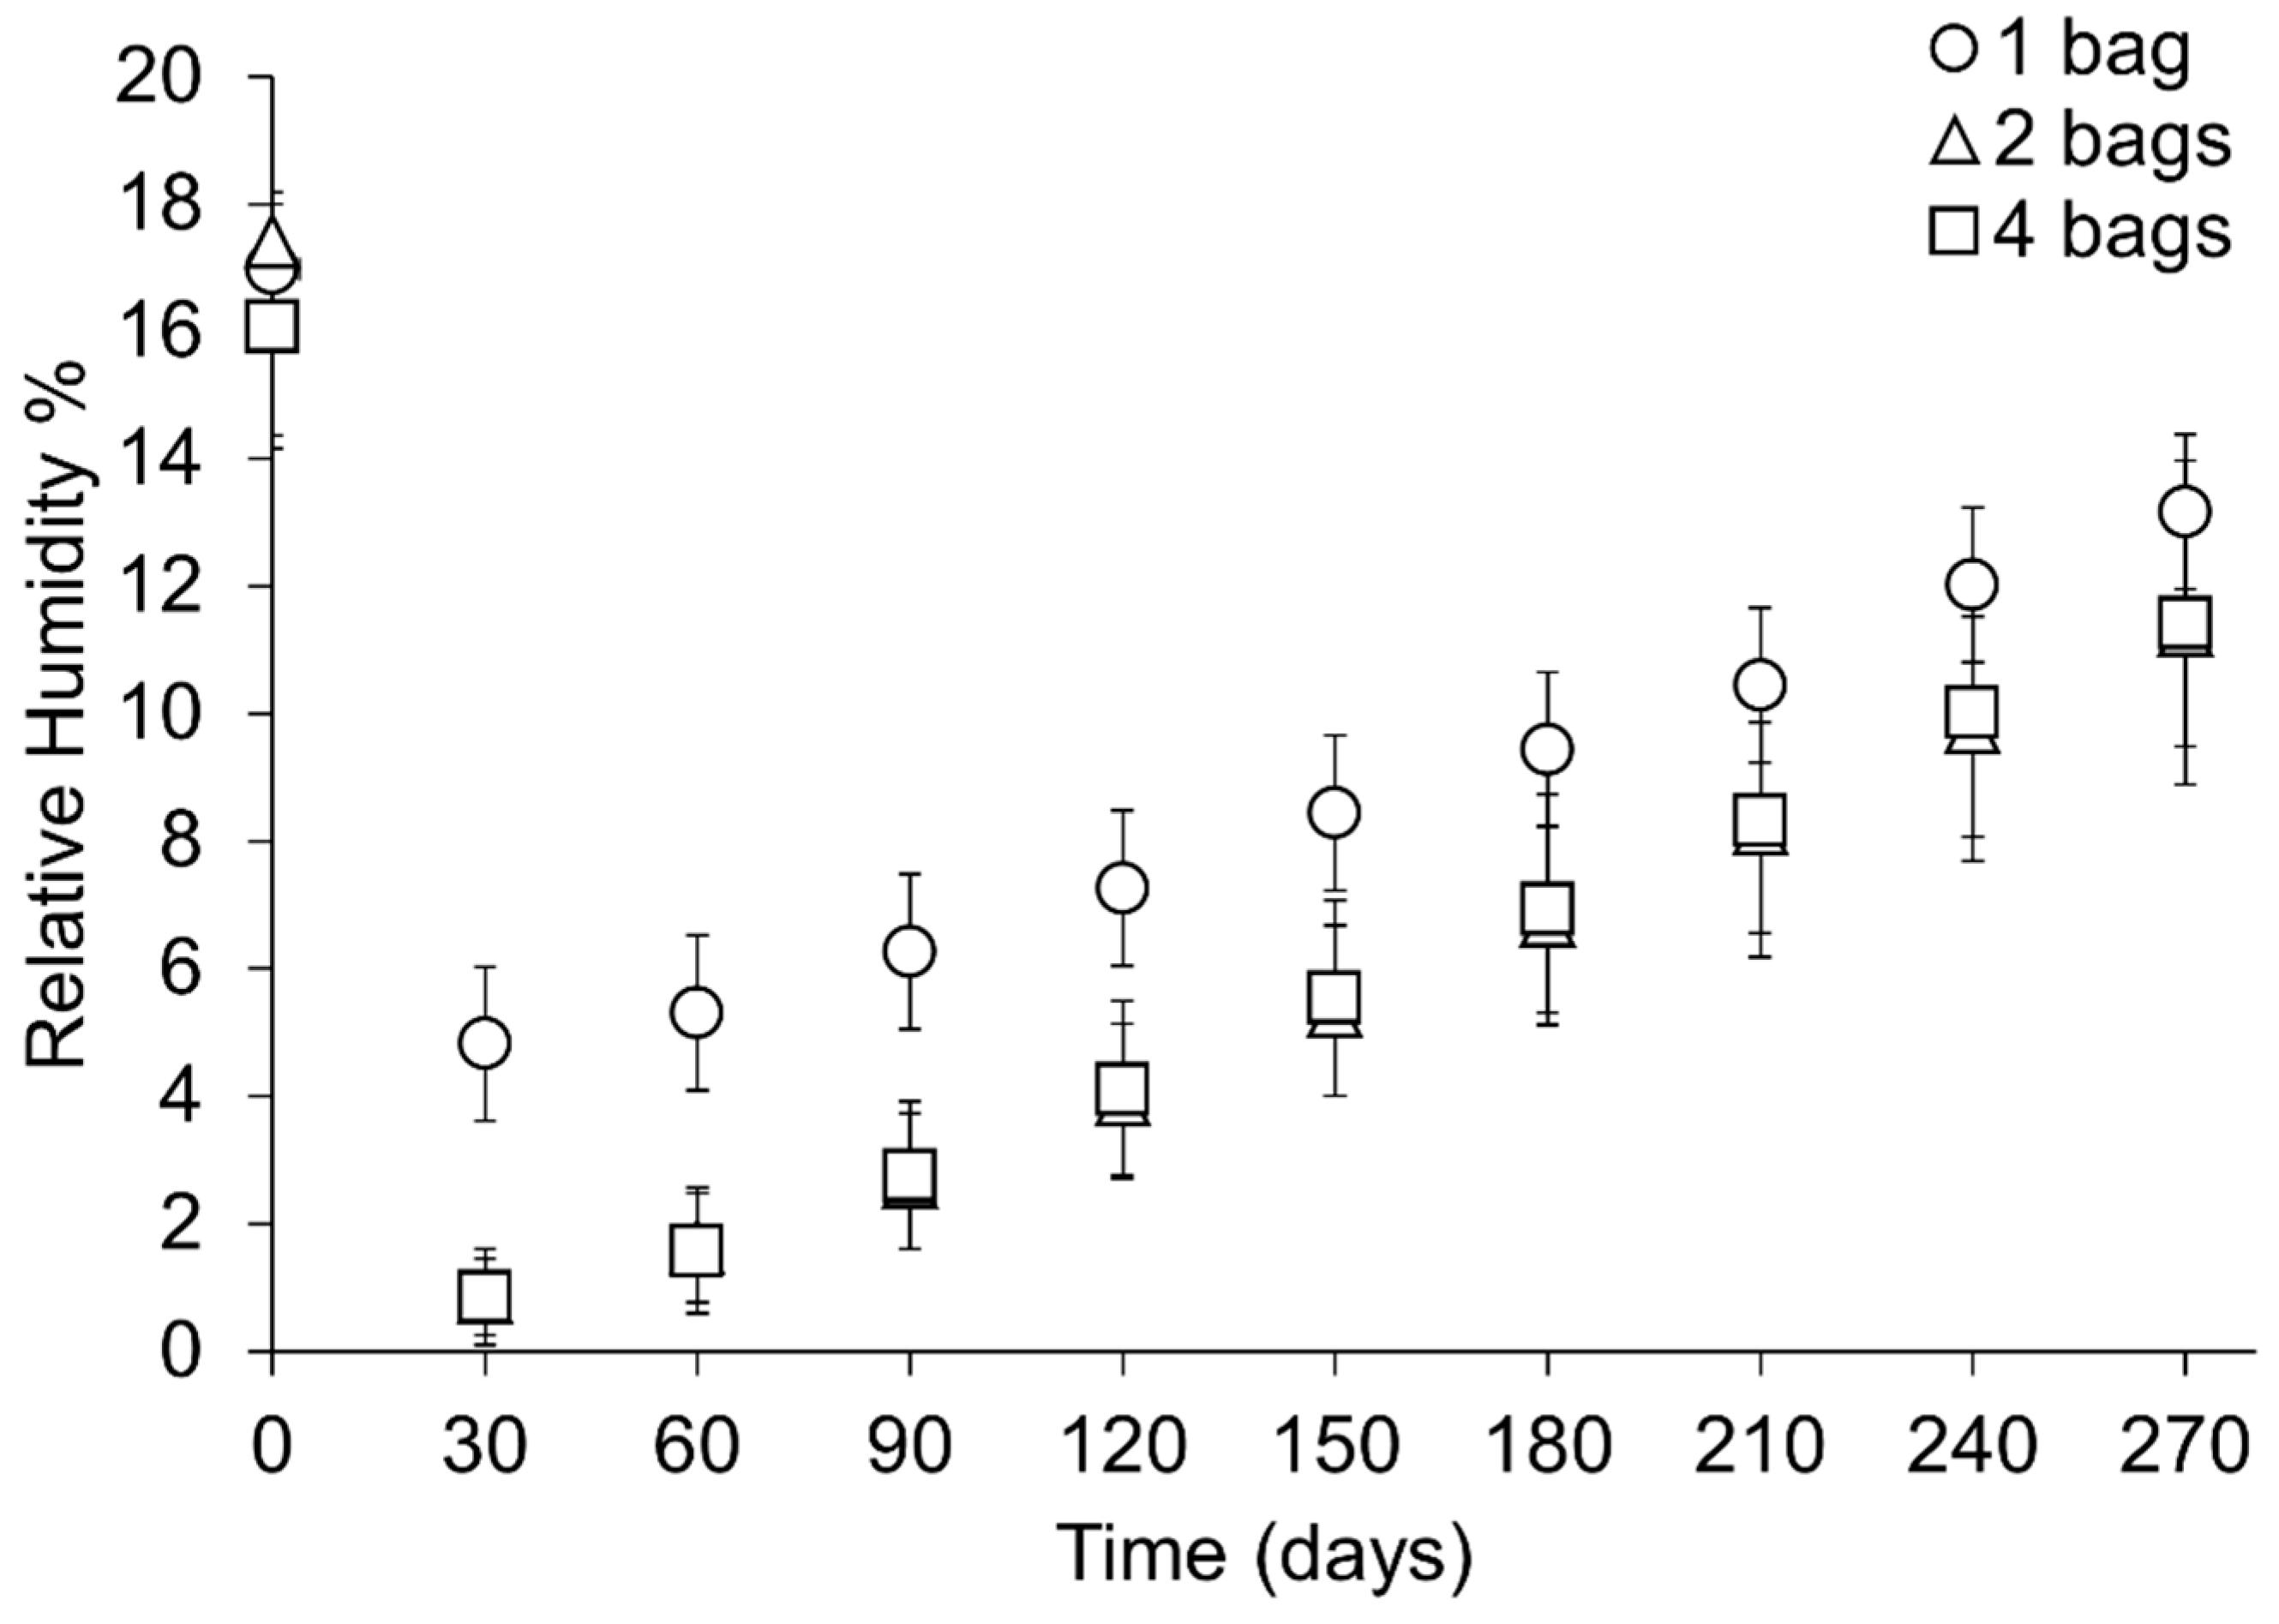
Figure 15.
Rate of change in RH throughout the period of study presented as the mean of each sample set at 30-day intervals. Error bars represent the standard deviation of that datapoint. Key indicates the number of bags silica gel is distributed over.
Figure 15.
Rate of change in RH throughout the period of study presented as the mean of each sample set at 30-day intervals. Error bars represent the standard deviation of that datapoint. Key indicates the number of bags silica gel is distributed over.
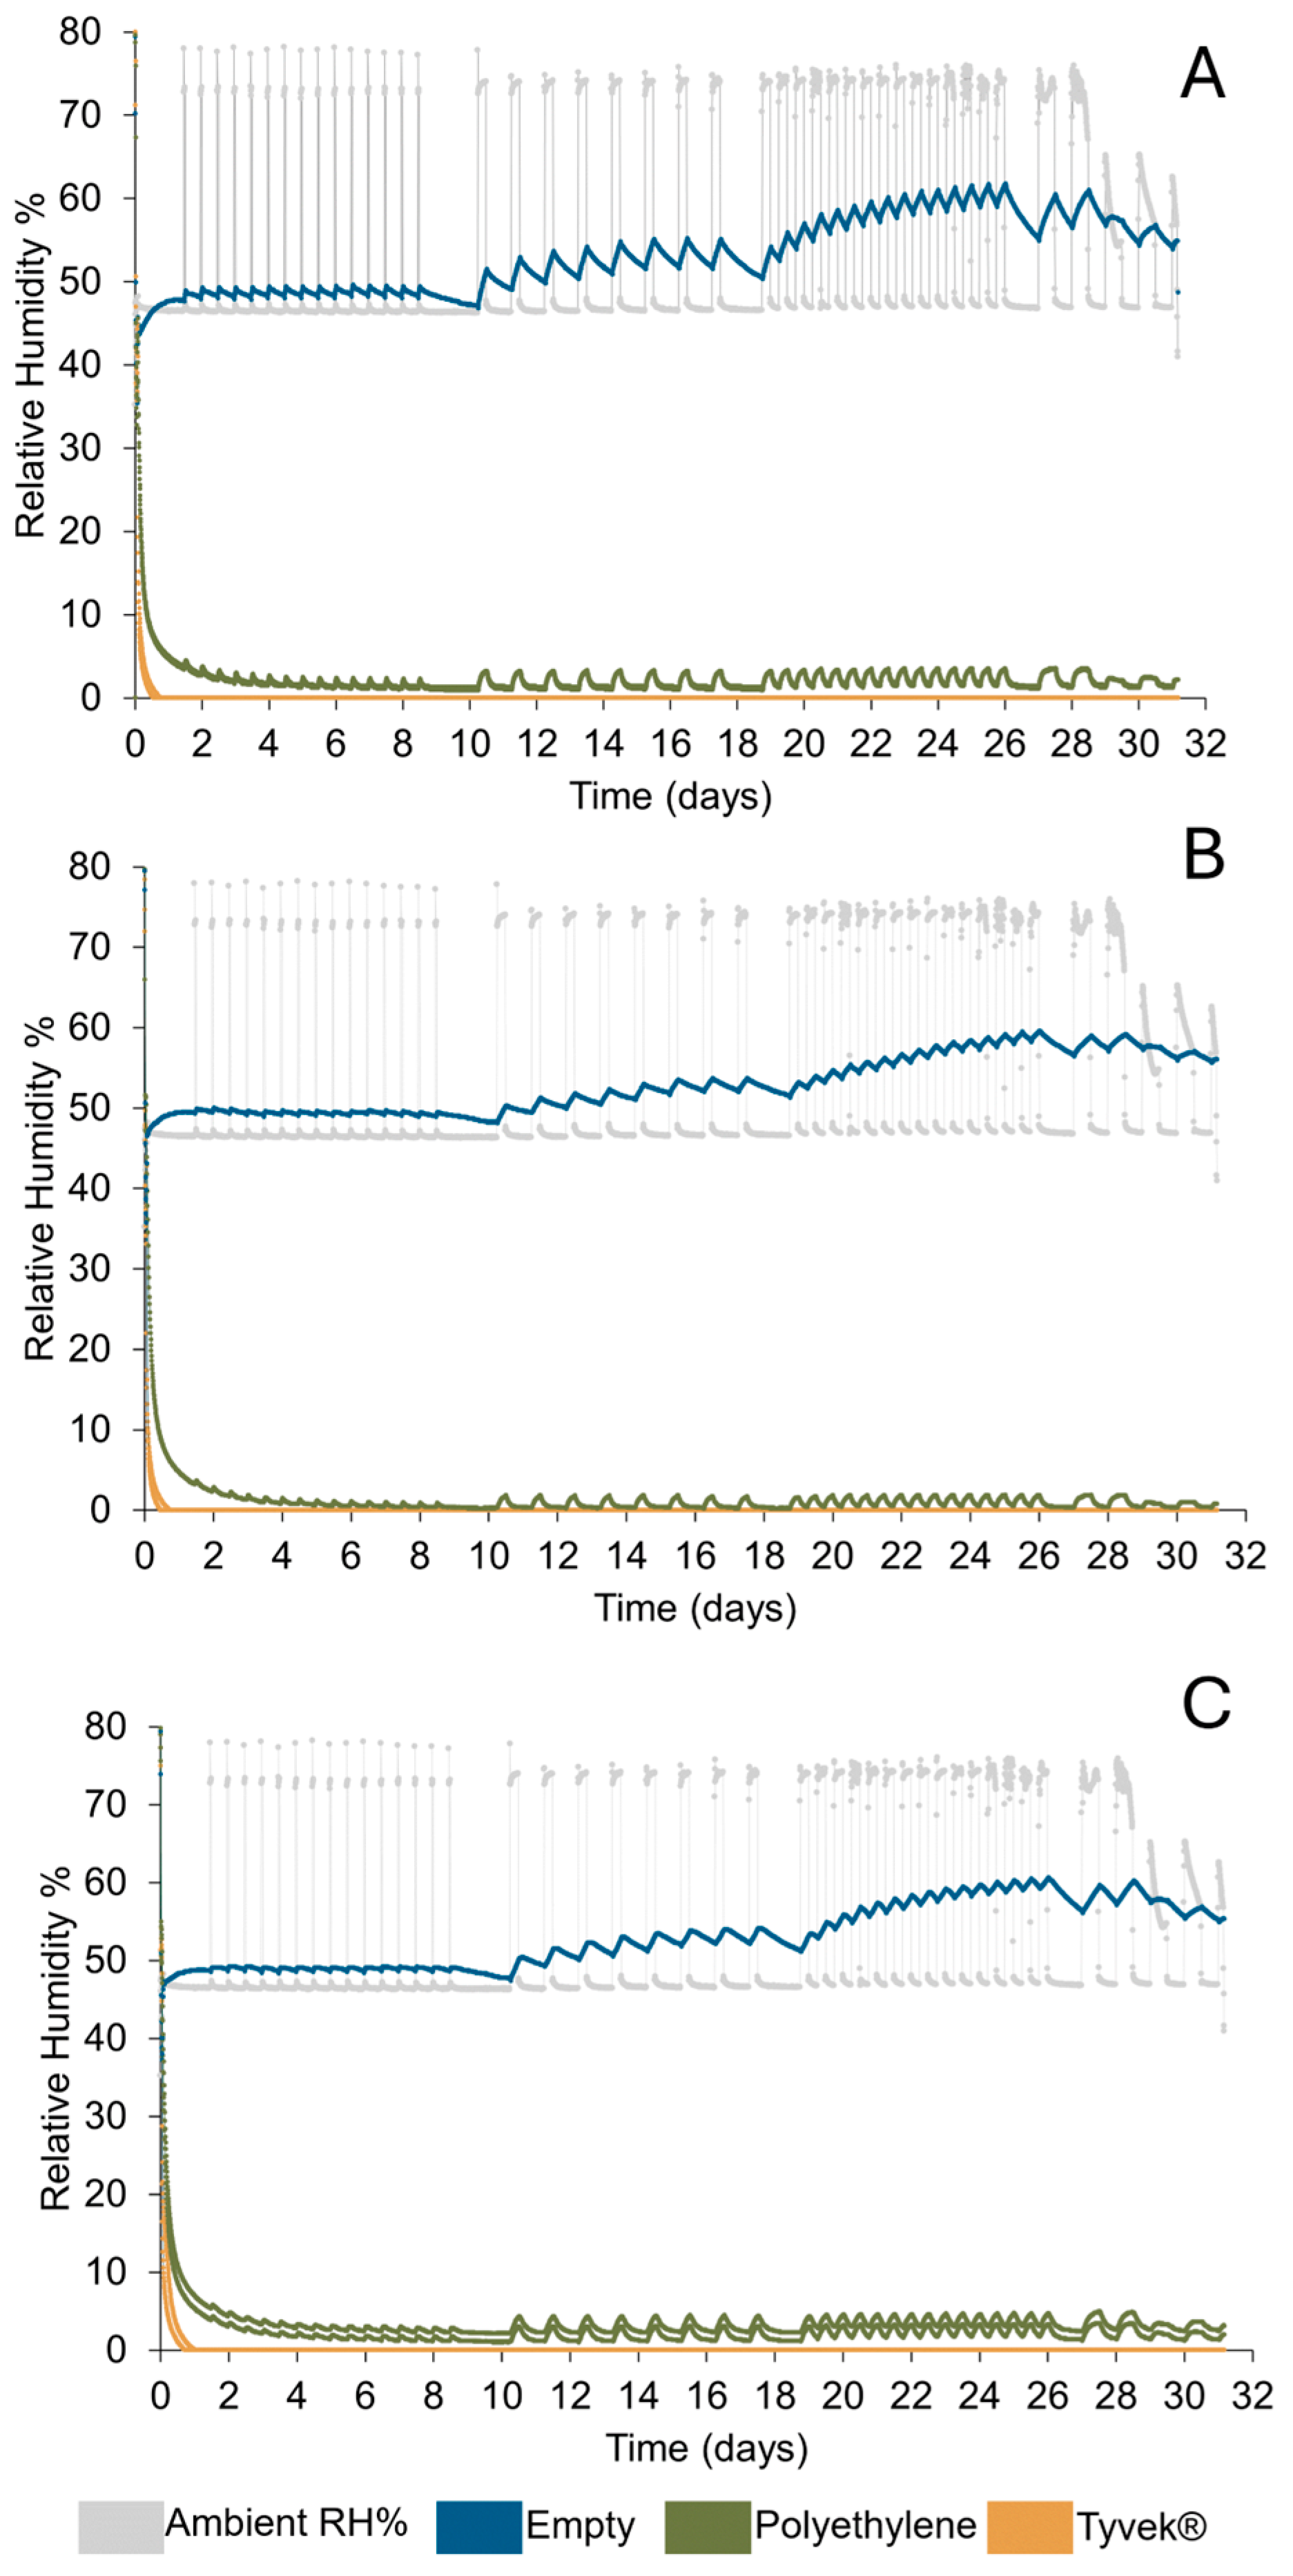
Figure 16.
Response to short-term fluctuations within 5–6.5 l containers that are either empty or 500 g of silica gel is placed in polythene or Tyvek® bags. (A) Stewart Gastronorm (B) Stewart Sealfresh (C) Lock & Lock.
Figure 16.
Response to short-term fluctuations within 5–6.5 l containers that are either empty or 500 g of silica gel is placed in polythene or Tyvek® bags. (A) Stewart Gastronorm (B) Stewart Sealfresh (C) Lock & Lock.
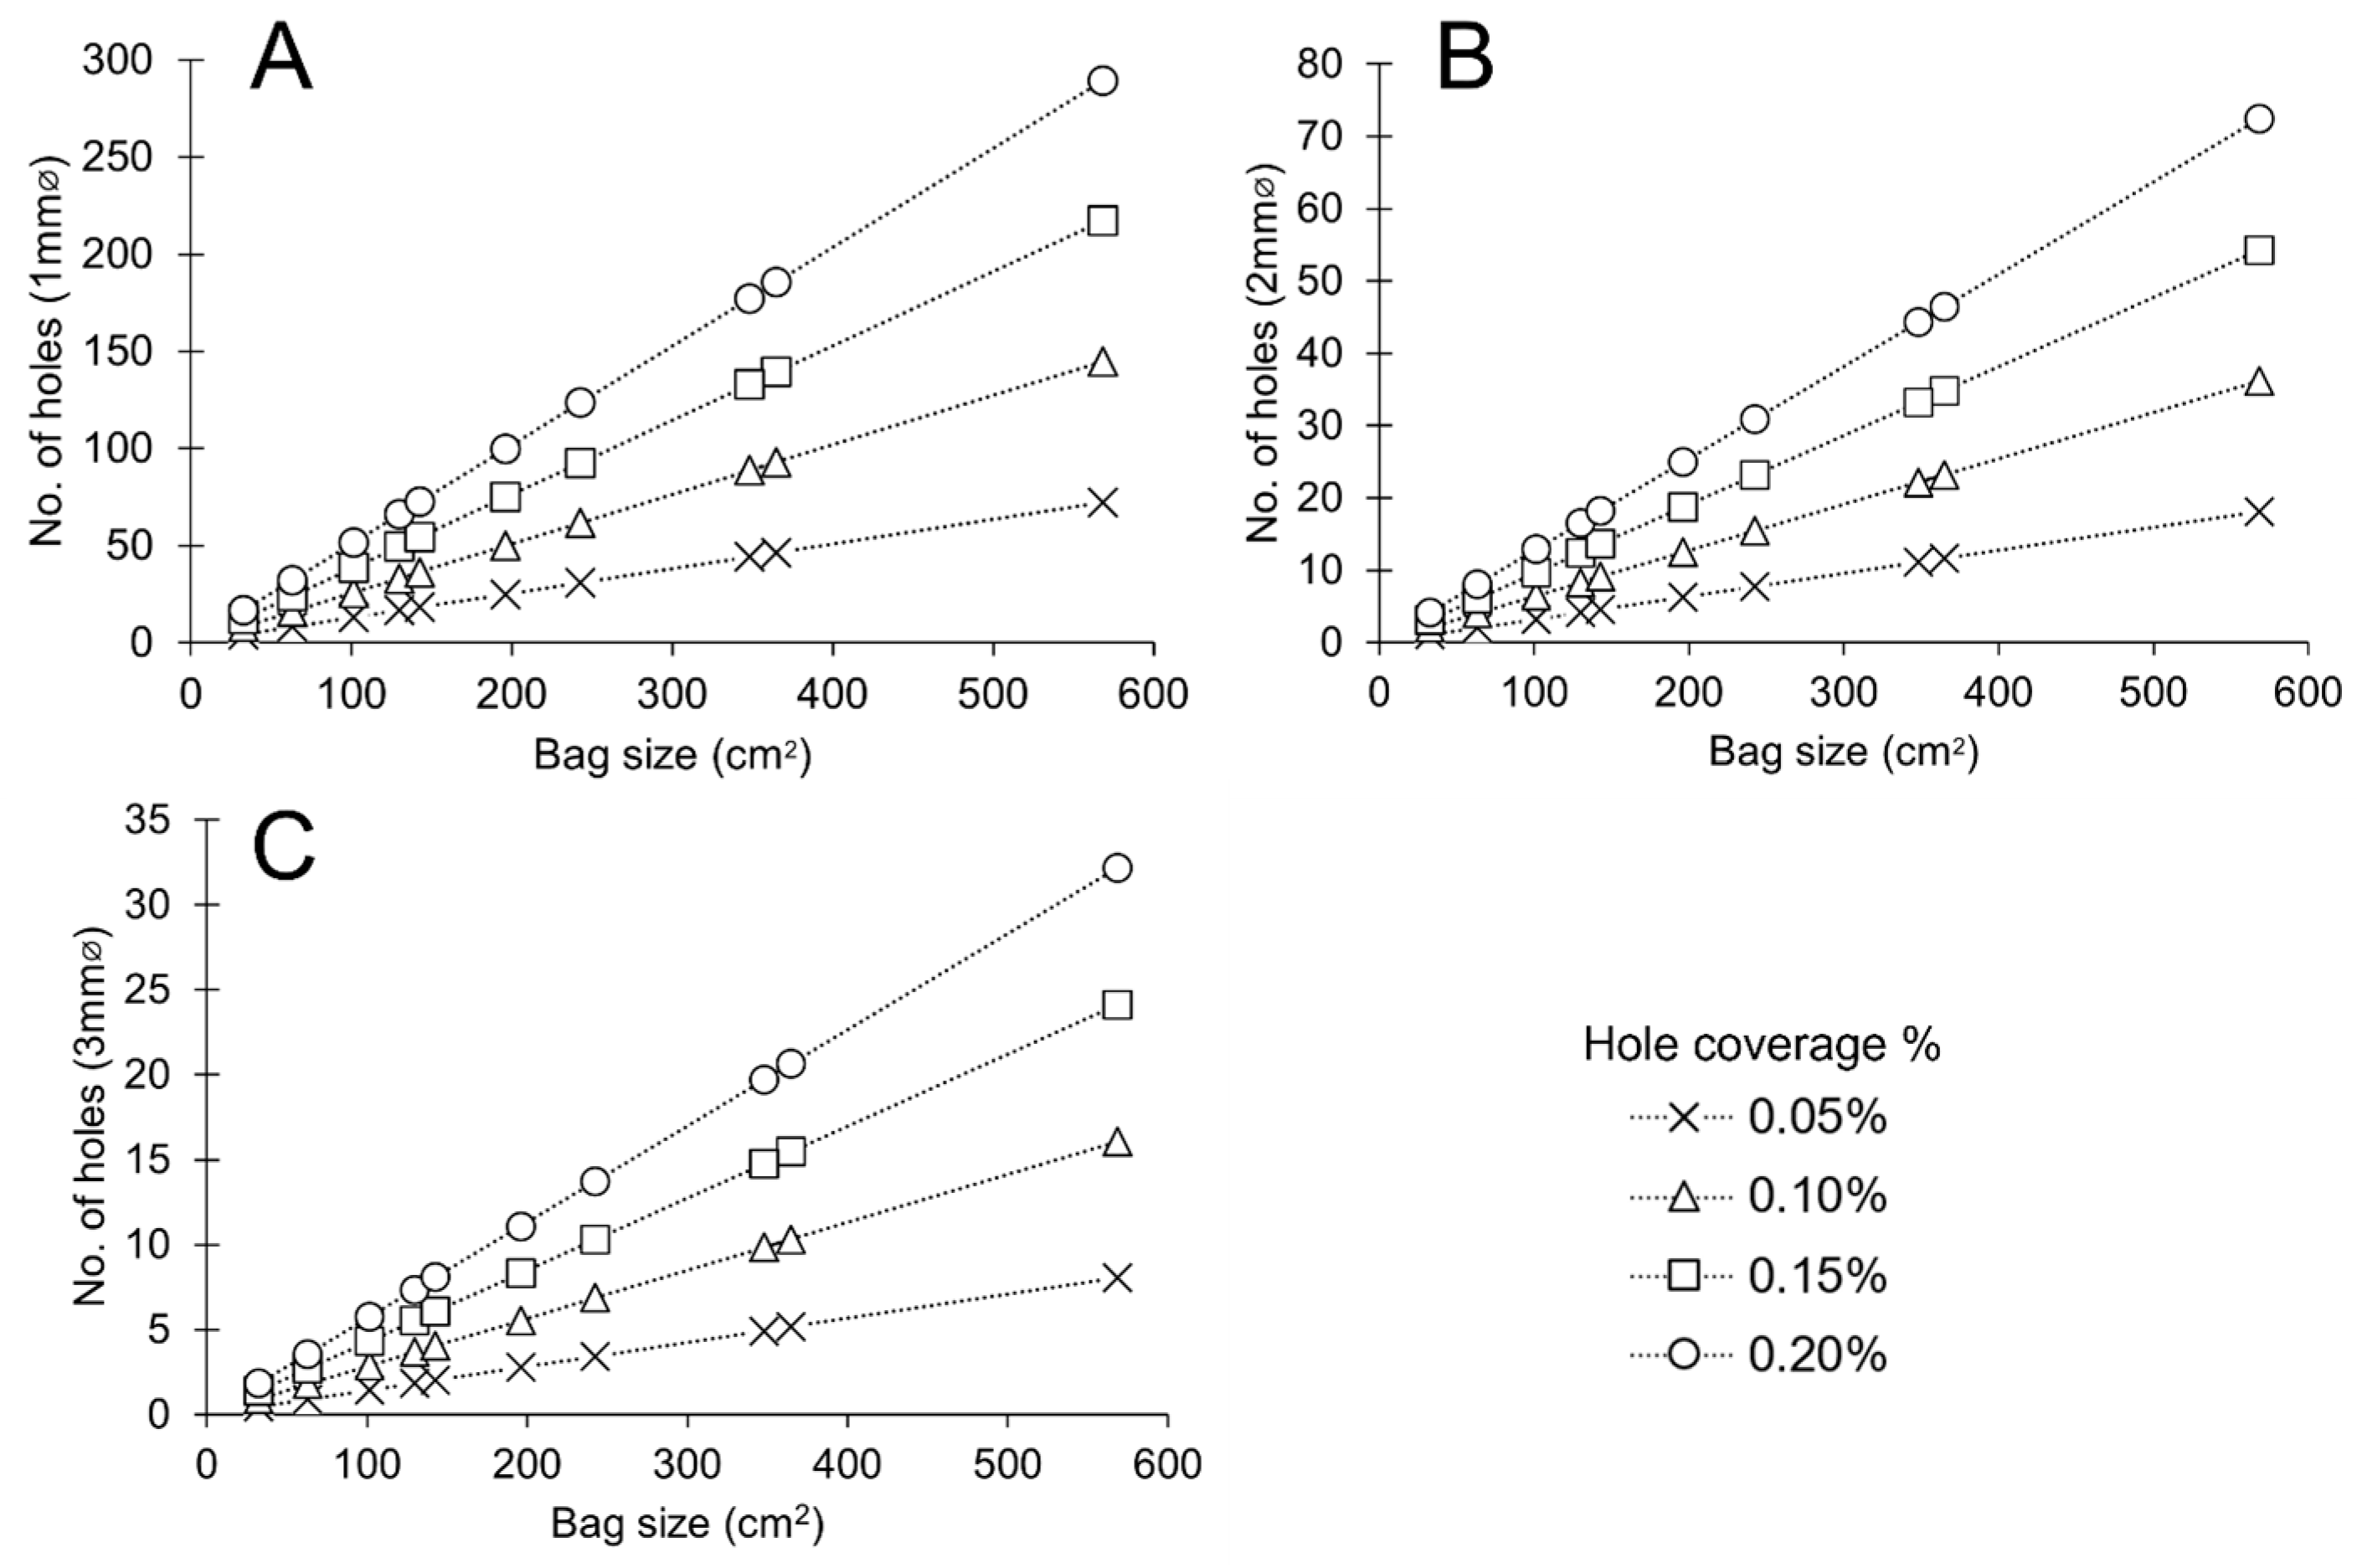
Figure 17.
Number of holes required in standard PA-sized bags to achieve different hole coverage of total surface area of bags. (A) Ø1 mm implements (B) Ø2 mm implements (C) Ø 3 mm implements.
Figure 17.
Number of holes required in standard PA-sized bags to achieve different hole coverage of total surface area of bags. (A) Ø1 mm implements (B) Ø2 mm implements (C) Ø 3 mm implements.
Table 1.
Preparation methods of polythene bags. Based on 90 responses from a sector-wide study [
45].
Table 1.
Preparation methods of polythene bags. Based on 90 responses from a sector-wide study [
45].
| Example of Devices used in Practice to Pierce Polythene Bags | Number of Holes Reported when Piercing Polythene Bags |
| Roller pin-pricker | None |
| Home-made device | Randomly |
| Bamboo/wooden skewer | One |
| Paper clip | Two-thirds of the bags |
| Dress-maker wheel | All sides 2–3 cm apart |
| “Pokey thing” | 4–5 holes at the top |
| Scalpel | |
| Dental tools | |
| Pins | |
| Blades | |
| Hole puncher | |
| Sewing pin | |
| Cocktail stick | |
Table 2.
Summary of hardware use throughout the study. Examined variables highlighted in grey. PE: polyethylene.
Table 2.
Summary of hardware use throughout the study. Examined variables highlighted in grey. PE: polyethylene.
| Test | No. of Containers | Silica Gel (g) | Type of Bag | No. of Bags | Bag Size (mm) | Diameter of Holes (mm) | No. of Holes | Piercing Interval (mm) |
| Desiccation capacity by initial RH | 6 | 88 | PE | 2 | 130 × 90 | 1 | 30 | 20 × 30 |
| 6 | 88 | N/A | None | N/A | N/A | N/A | N/A |
| Piercing bags | 10 | 88 | PE | 2 | 130 × 90 | None | None | None |
| 10 | 88 | PE | 2 | 130 × 90 | 1 | 15 | 40 × 60 |
| 10 | 88 | PE | 2 | 130 × 90 | 1 | 30 | 20 × 30 |
| 10 | 88 | PE | 2 | 130 × 90 | 1 | 45 | 20 × 20 |
| 10 | 88 | PE | 2 | 130 × 90 | 1 | 60 | 10 × 15 |
| Hole dimensions | 10 | 88 | PE | 2 | 130 × 90 | 1 | 30 | 20 × 30 |
| 10 | 88 | PE | 2 | 130 × 90 | 2 | 30 | 20 × 30 |
| 10 | 88 | PE | 2 | 130 × 90 | 3 | 30 | 20 × 30 |
| Silica gel distribution | 10 | 88 | N/A | None | N/A | N/A | N/A | N/A |
| 10 | 88 | PE | 1 | 155 × 103 | 1 | 30 | 20 × 30 |
| 10 | 88 | PE | 2 | 130 × 90 | 1 | 30 | 20 × 30 |
| 10 | 88 | PE | 4 | 90 × 77 | 1 | 18 | 20 × 30 |
| Buffering capacity | 6 | 500 | PE | 1 | 253 × 153 | 2 | 70 | 20 × 30 |
| 6 | 500 | Tyvek® | 1 | 240 × 170 | N/A | N/A | N/A |
| 3 | None | N/A | N/A | N/A | N/A | N/A | N/A |
Table 3.
Containers used in conducted tests and the amount of silica gel used for each size. PP: polypropylene, Si: silicone.
Table 3.
Containers used in conducted tests and the amount of silica gel used for each size. PP: polypropylene, Si: silicone.
| Box | Material | Closing Mechanism | Size (l) | Volume (cm3) | Seal Length (cm) | No of Locks |
| Lock & Lock | PP, Si gasket | Locks | 1 | 1140 | 64 | 4 |
| 5.5 | 5900 | 101 | 4 |
| Stewart Sealfresh | PP | Snap seal | 6.5 | 6700 | 104 | None |
| Stewart Gastronorm | PP | Snap seal | 5.7 | 5900 | 100 | None |
Table 4.
Fluctuation patterns during 24 h. Each cycle was programmed to run for seven days.
Table 4.
Fluctuation patterns during 24 h. Each cycle was programmed to run for seven days.
| Cycle 1 | Cycle 2 | Cycle 3 | Cycle 4 |
| 11 h 50% RH | 18 h 50% RH | 6 h 50% RH | 12 h 50% RH |
| 1 h 80% RH | 6 h 80% RH | 6 h 80% RH | 12 h 80% RH |
| 11 h 50% RH | | 6 h 50% RH | |
| 1 h 80% RH | | 6 h 80% RH | |
Table 5.
Minimum RH and time to reach minimum RH in 1 L Lock & Lock containers where 88 g of silica gel is loose or placed in polythene bags at different RH environments.
Table 5.
Minimum RH and time to reach minimum RH in 1 L Lock & Lock containers where 88 g of silica gel is loose or placed in polythene bags at different RH environments.
| | Loose | Polythene Bags |
| RH% at closure | 30 | 50 | 80 | 30 | 50 | 80 |
| Minimum RH% |
| Mean | 0 | 0 | 0 | 4.8 | 3.8 | 3.4 |
| Range | 0 | 0 | 0 | 1.4 | 0.4 | 0.4 |
| SD | 0 | 0 | 0 | 0.58 | 0.2 | 0.2 |
| Time to reach minimum RH% (hours) |
| Mean | 4 | 11 | 14 | 173 | 178 | 305 |
Table 6.
Minimum RH, time to reach minimum RH and the RH at 250 days when 88 g of silica gel is placed in polythene bags with different piercing intervals in 1 L Lock & Lock containers.
Table 6.
Minimum RH, time to reach minimum RH and the RH at 250 days when 88 g of silica gel is placed in polythene bags with different piercing intervals in 1 L Lock & Lock containers.
| No. of Holes | 0 | 15 | 30 | 45 | 60 |
| Surface area covered by holes (%) | - | 0.05 | 0.1 | 0.15 | 0.2 |
| Minimum RH% |
| Mean | 16.1 | 3.8 | 1.7 | 0.2 | 0.4 |
| Range | 1.8 | 3.4 | 5.2 | 1.2 | 2.7 |
| SD | 0.79 | 1.03 | 1.59 | 0.36 | 0.84 |
| Time to reach minimum RH% (h) |
| Mean | 6 | 131 | 133 | 88 | 76 |
| RH% at 250 days |
| Mean | 26.1 | 16.6 | 18.8 | 16.9 | 17.4 |
| Range | 4.7 | 8.4 | 8.5 | 9.1 | 9.8 |
| SD | 1.49 | 2.65 | 2.94 | 3.19 | 2.83 |
Table 7.
Minimum RH, time to reach minimum RH and the RH at 150 days when 88 g of silica gel is placed in polythene bags with different piercing intervals in 1 L Lock & Lock containers.
Table 7.
Minimum RH, time to reach minimum RH and the RH at 150 days when 88 g of silica gel is placed in polythene bags with different piercing intervals in 1 L Lock & Lock containers.
| Hole Size (Ø mm) | Loose | 1 | 2 | 3 |
| Surface area covered by holes (%) | NA | 0.1 | 0.4 | 0.9 |
| Minimum RH% |
| Mean | 0.3 | 5.0 | 4.8 | 2.9 |
| Range | 1.3 | 5.7 | 3.8 | 2.5 |
| SD | 0.4 | 1.6 | 1.2 | 0.7 |
| Time to reach minimum RH% (h) |
| Mean | 105 | 216 | 229 | 260 |
| RH% at 150 days |
| Mean | 7.6 | 10.8 | 10.0 | 8.8 |
| Range | 6.3 | 4.6 | 5.3 | 3.7 |
| SD | 1.9 | 1.4 | 1.7 | 1.4 |
Table 8.
Minimum RH, time to reach minimum RH and the RH at 270 days when 88 g of silica gel is placed in varying numbers of polythene bags in 1 L Lock & Lock containers.
Table 8.
Minimum RH, time to reach minimum RH and the RH at 270 days when 88 g of silica gel is placed in varying numbers of polythene bags in 1 L Lock & Lock containers.
| No. of Bags | 1 | 2 | 4 |
| Surface area covered by holes (%) | 0.07 | 0.1 | 0.1 |
| Minimum RH% |
| Mean | 3.8 | 0.5 | 0.5 |
| Range | 4.2 | 1.4 | 2.0 |
| SD | 1.2 | 0.4 | 0.6 |
| Time to reach minimum RH% (h) |
| Mean | 14 | 52 | 21 |
| RH% at 270 days |
| Mean | 13.7 | 11.8 | 11.9 |
| Range | 6.9 | 5.3 | 6.8 |
| SD | 2.0 | 1.9 | 2.6 |
| Increase in RH (mean) | 9.9 | 11.3 | 11.5 |
Table 9.
Minimum RH, time to reach minimum RH and the RH at 32 days when 500 g of silica gel is placed in polythene or Tyvek® bags in 5–6.5 L containers of different brands.
Table 9.
Minimum RH, time to reach minimum RH and the RH at 32 days when 500 g of silica gel is placed in polythene or Tyvek® bags in 5–6.5 L containers of different brands.
| | Lock & Lock | Stewart Gastronorm | Stewart Sealfresh |
| Minimum RH% |
| Container no. | 1 | 2 | 1 | 2 | 1 | 2 |
| Polyethylene bags | 2.1 | 1 | 0.9 | 1.1 | 0.2 | - |
| Tyvek® | 0 | 0 | 0 | 0 | 0 | 0 |
| Time to reach minimum RH% (h) |
| Polyethylene bags | 228 | 233 | 232 | 222 | 225 | - |
| Tyvek® | 17 | 23 | 12 | 17 | 10 | 17 |
| RH% at 32 days |
| Polythene bags | 2.6 | 1.4 | 1.2 | 1.4 | 0. 3 | - |
| Tyvek® | 0 | 0 | 0 | 0 | 0 | 0 |
Table 10.
The average increase and decrease in RH between containers during and between fluctuation events. * The decrease in RH becomes smaller as RH approaches the full desiccation capacity.
Table 10.
The average increase and decrease in RH between containers during and between fluctuation events. * The decrease in RH becomes smaller as RH approaches the full desiccation capacity.
| Cycle | Environment | Container Setup |
| Empty | Polythene | Tyvek® |
| Increase RH% | Decrease RH% | Increase RH% | Decrease RH% | Increase RH% | Decrease RH% |
| 1 | 11 h 50% RH 1 h 80% RH | 1.5 | 1.5 | 1 | 1.5 * | 0 | 0 |
| 2 | 18 h 50% RH 6 h 80 | 2 | 1.4 | 2 | 2 | 0 | 0 |
| 3 | 6 h 50% RH 6 h 80% RH | 2 | 1 | 2 | 1.8 | 0 | 0 |
| 4 | 12 h 50% RH 12 h 80% RH | 4 | 3 | 2.2 | 2.2 | 0 | 0 |
Table 11.
The theoretical amount of water vapour in containers used within this study at different RH when the temperature is 20 °C.
Table 11.
The theoretical amount of water vapour in containers used within this study at different RH when the temperature is 20 °C.
| | 30% RH | 50% RH | 80% RH |
| Water vapour g/m3 | 5.187 | 8.645 | 13.832 |
| Water vapour (g) 1140 cm3 1 L Lock & Lock | 0.006 | 0.010 | 0.016 |
Water vapour (g) 5900 cm3 5.5 L Lock & Lock
5.7 L Stewart Gastronorm | 0.031 | 0.051 | 0.082 |
| Water vapour (g) 6700 cm3 6.5 L Stewart Sealfresh | 0.035 | 0.058 | 0.093 |


