Article

A Novel Framework for Heat Stress Risk Assessment and Mitigation in Real and Typological Historical Public Open Spaces Under Climate Change Scenarios


by
Enrico Quagliarini
1,
Caterina Alighieri
1,
Gabriele Bernardini
1,*,
Elena Cantatore
2 and
Fabio Fatiguso
2
1
DICEA—Dipartimento di Ingegneria Civile, Edile e Architettura, Università Politecnica delle Marche, via Brecce Bianche, 12, 60131 Ancona, Italy
2
DICATECh—Dipartimento di Ingegneria Civile, Ambientale, del Territorio, Edile e di Chimica, Politecnico di Bari, via Edoardo Orabona, 4, 70125 Bari, Italy
*
Author to whom correspondence should be addressed.
Heritage 2026, 9(2), 60; https://doi.org/10.3390/heritage9020060
Submission received: 16 December 2025 / Revised: 22 January 2026 / Accepted: 28 January 2026 / Published: 4 February 2026

Abstract

Climate change is altering the use of public open spaces in historical urban environments, compounded by urban heat island effects. Especially considering urban squares, rising temperatures increase health risks for outdoor users, particularly for vulnerable individuals (by, e.g., age and fragility). Rapid risk assessment under current and future climate scenarios can exploit integrated simulations to support the process, considering both real-world environments and Built Environment Typologies (BETs), which represent the recurring morphological, constructive, and material features of such urban squares. Simulation-based approaches can also support the assessment of mitigation strategies considering sustainability, reversibility, visual integration, and compatibility with the heritage. This work proposes a framework for simulation-based heat risk assessment of outdoor users under current and future (2050 and 2080) overheating scenarios and considers pre- and post-mitigation conditions of urban squares. Outdoor temperature conditions are simulated using ENVI-met, enabling the multiscale assessment of users’ heat stress and thresholds in exposure timings before critical dehydration. The approach is applied to two Italian historical urban squares in Bari and Naples, and to their associated BETs. The results highlight the framework’s capabilities in addressing the impact of climate scenarios and pre-/post-mitigation conditions, considering the local and global conditions of the urban squares. Moreover, the observed similarities between POSs and their corresponding BETs demonstrate that these archetypes can support preliminary risk assessments, providing decision makers with a rapid overview before adapting analyses and mitigation strategies to the specific characteristics of each urban square.

1. Introduction

Historical urban built environments are increasingly exposed to the multiple effects of climate change, which pose significant challenges to their preservation, functionality, and habitability [1,2,3,4]. Among these, the progressive increase in air temperature represents one of the most pervasive stress factors, directly influencing thermal comfort, altering the liveability of built environments, and inducing health risks for users, especially in relation to outdoor areas and, in particular, public open spaces (POSs), such as urban squares and streets [5,6].
Raising temperatures and possible overheating phenomena are classified as Slow-Onset Disasters (SLODs), implying that their effects gradually rise over time, and are often not immediately perceived by users [7,8]. This can lead to reduced awareness of heat-related risks and to some limitations in both individual and collective adaptive responses. On the one side, exposure to relevant thermal conditions progressively alters the way people use and experience the built environment, particularly POSs, affecting comfort levels, behavioural patterns, and overall physical and psychological well-being [7,9,10]. On the other side, related heat stress on users can lead to significant physiological responses, mainly due to water loss phenomena at the individual level [7,9,11]. Effects grow with the increase in outdoor permanence time [7]. Such heat stress on users can be expressed as hourly sweat rates, allowing the estimation of the potential amount of water loss per hour [g/h] under a given level of heat stress [12,13]. Heat exposure increases sweating and water loss, which, in extreme cases, can lead to dehydration and other heat-related illnesses [14]. Moreover, prolonged exposure to heat stress can have cumulative effects on health, particularly for vulnerable groups such as the elderly, children, and individuals with existing health conditions [7,15]. Different thresholds of critical users’ risk levels due to water losses are identified by previous works, starting from the onset of dehydration symptoms (water loss > 4% of body weight [11,16]) up to increased heat-related mortality risk [17]. Consolidated methodologies point out how the Universal Thermal Climate Index (UTCI) can be used to evaluate basic conditions for heat stress, also considering different user groups characterised by their individual features (e.g., age, gender, health conditions, and fragilities) [7,11,18].
Heat stress intensity is not driven solely by regional climate, but is strongly modulated by urban morphology and material characteristics [19]. Key parameters such as urban orientation, the relationship between building height and open space width, surface materials, and the presence of vegetation or water bodies directly influence heat dissipation and local microclimatic conditions [7]. These combined factors are commonly manifested through the urban heat island (UHI) effect [20,21], characterised by higher perceived temperatures in densely built areas compared to surrounding rural zones [22,23,24].
In historical urban contexts, the UHI effect exacerbates local overheating by reinforcing the microclimatic consequences of compact urban form, limited vegetation, and heat-retentive surfaces, with direct implications for outdoor thermal comfort [25,26]. These phenomena become even more critical when considering POSs. POSs are essential components of the urban fabric, and they shape the identity of cities and play a crucial role in supporting social interaction, mobility, and outdoor activities [27,28]. In particular, historical urban squares are especially significant due to their symbolic, functional, and spatial roles, acting as focal points for civic, cultural, and recreational activities [5,29,30]. Their architectural and cultural value, combined with the concentration of heritage buildings and tourist attractions, results in particularly high levels of use, especially during daytime hours and warmer seasons [6,31].
High usage levels can imply an increased exposure to heat stress, especially in historical squares where morphological conditions, such as wide open spaces surrounded by relatively tall buildings, limit the availability of shading [32,33,34]. The scarcity of vegetation, the use of heat-absorbing materials, and restricted airflow further intensify surface and air temperatures [35,36]. These combined factors amplify users’ exposure to heat stress, especially under projected climate warming scenarios [9,37]. At the same time, the slow and progressive increase in temperatures can change how urban squares are used and perceived over time, influencing the habits, the length of stay, and behaviour of users [15,29,38,39].
Although possible critical levels of heat stress can affect historical POSs, the assessment of health risk levels for users and the related definition of mitigation interventions should face the general features of historical urban built environments.
Considering risk assessment, historical POSs are complex environments, due to the combination of their morphological, constructive, and material-based features, and require tailored and time-consuming efforts in data collection, organisation, and risk analysis [10,25,40,41]. To boost the assessment process, previous works have introduced the concept of Built Environment Typology (BET) [42], which serves as an idealised archetype representing the typical morphological, geometric, and material features of different, similar POSs [43,44]. In fact, BETs are defined by collecting basic features of POSs. They can therefore be applied for preliminary assessment and comparative analysis purposes, enabling simplified evaluations of POS thermal behaviour, heat stress for users, and, thus, insights into POS mitigation potential [7].
Considering risk mitigation, the high degree of morphological compactness and heritage protection constraints could limit the adoption and adaptability of structural interventions [45,46]. These intrinsic features, while contributing to cultural value and identity, often hinder the implementation of conventional adaptation strategies commonly adopted in modern contexts [47]. In this context, resilience refers to the ability of the built environment to absorb and adapt to climatic stresses while maintaining its cultural and physical integrity [48]. Improving resilience in historical areas does not simply mean introducing technological or structural solutions, but rather requires a careful balance between the conservation of heritage values and the integration of sustainable, reversible, and visually compatible interventions [41,45,46,49]. This balance is particularly critical when addressing temperature-related risks, as heat accumulation and reduced ventilation can amplify both the discomfort and health vulnerability of outdoor users [14,50].
In view of the above, the application of users’ heat stress assessment methods, in both historical POSs and BETs, still needs further exploration. On the one side, most studies focus on present-day climatic conditions, without explicitly addressing future climate change scenarios combined with the UHI effect. Moreover, potential retrofit or mitigation alternatives specifically designed to reduce users’ heat stress in POSs are not analysed. On the other side, while user exposure modelling is included, the translation of results into practical decision-support tools for stakeholders, such as urban planners and heritage managers, remains limited.
In this context, heat risk and its implications for user health should be assessed at two spatial scales: the microscale, focusing on different areas within the POS, and the mesoscale, considering the POS as a whole [29]. This approach can boost the heat risk assessment by accounting for the way users behave in the POSs, as well as through a rapid analysis perspective, which can be relevant for decision makers when prioritising interventions in different POSs within the same historical urban environment [7]. Therefore, this user-centred approach for user heat risk assessment should be better investigated according to two main research questions (RQs), and considering climate change scenarios: (RQ1) “Can this approach evaluate the effectiveness of mitigation strategies tailored for a specific POS?”; and (RQ2) “Can BET represent typical heat risk conditions of POSs?”.
These RQs can be included in a wider perspective of potential goals, which include the following: (i) the opportunity to assess the use of such POSs in climate change scenarios as a first step to study the effects and effectiveness of strategies in multi-risk and behaviour-based dimensions for cultural and historical built environments; and (ii) the possibility of extending the results of success and failures to other similar cultural POSs by means of typological environment as a minimal representation of possible complexities in historic environments. In this perspective, the RQs represent the preliminary results of the REACT project (resilient urban and metropolitan built environments through inclusive multi-risk behavioural-based models and simulations), which aims to provide models and simulation tools for inclusive assessment and mitigation of POSs by means of archetypes in single-to-multi-risk scenarios. Investigations are conducted through the assessment of possible increasing risk scenarios determined by the combination of slow (heatwaves and the growing trend for climate change projection) and sudden (e.g., flooding and earthquake) hazards while considering conditions related to user vulnerabilities.
To face the research questions, the present study aims to develop and expand an integrated, simulation-based framework for assessing heat risk in historical urban squares as relevant reference POSs, considering both user exposure and vulnerability under current and future climate conditions. The proposed framework integrates microclimatic modelling, future climate scenario projections, and the testing of mitigation strategies compatible with historical contexts and aimed at the reduction in surface and air temperatures, minimising local overheating effects.
The framework is applied to two case studies (Piazza dell’Odegitria in Bari and Largo Regina Coeli in Naples), which share similar morphological characteristics and can be associated with the same BET identified in previous typological analyses [42]. Therefore, modelling tasks are carried out both for the urban squares and for the corresponding BET to compare results and assess the representativeness of the typological approach.
The final objectives of the study are to validate the use of BETs as reliable archetypes for rapid and preliminary assessment of heat risk in historical urban contexts, to verify the consistency and transferability of results between POSs and typological models, and to provide operational support to local authorities and urban planners in selecting effective, heritage-compatible, and sustainable mitigation strategies, promoting climate adaptation in historical urban environments.

2. Methodological Framework

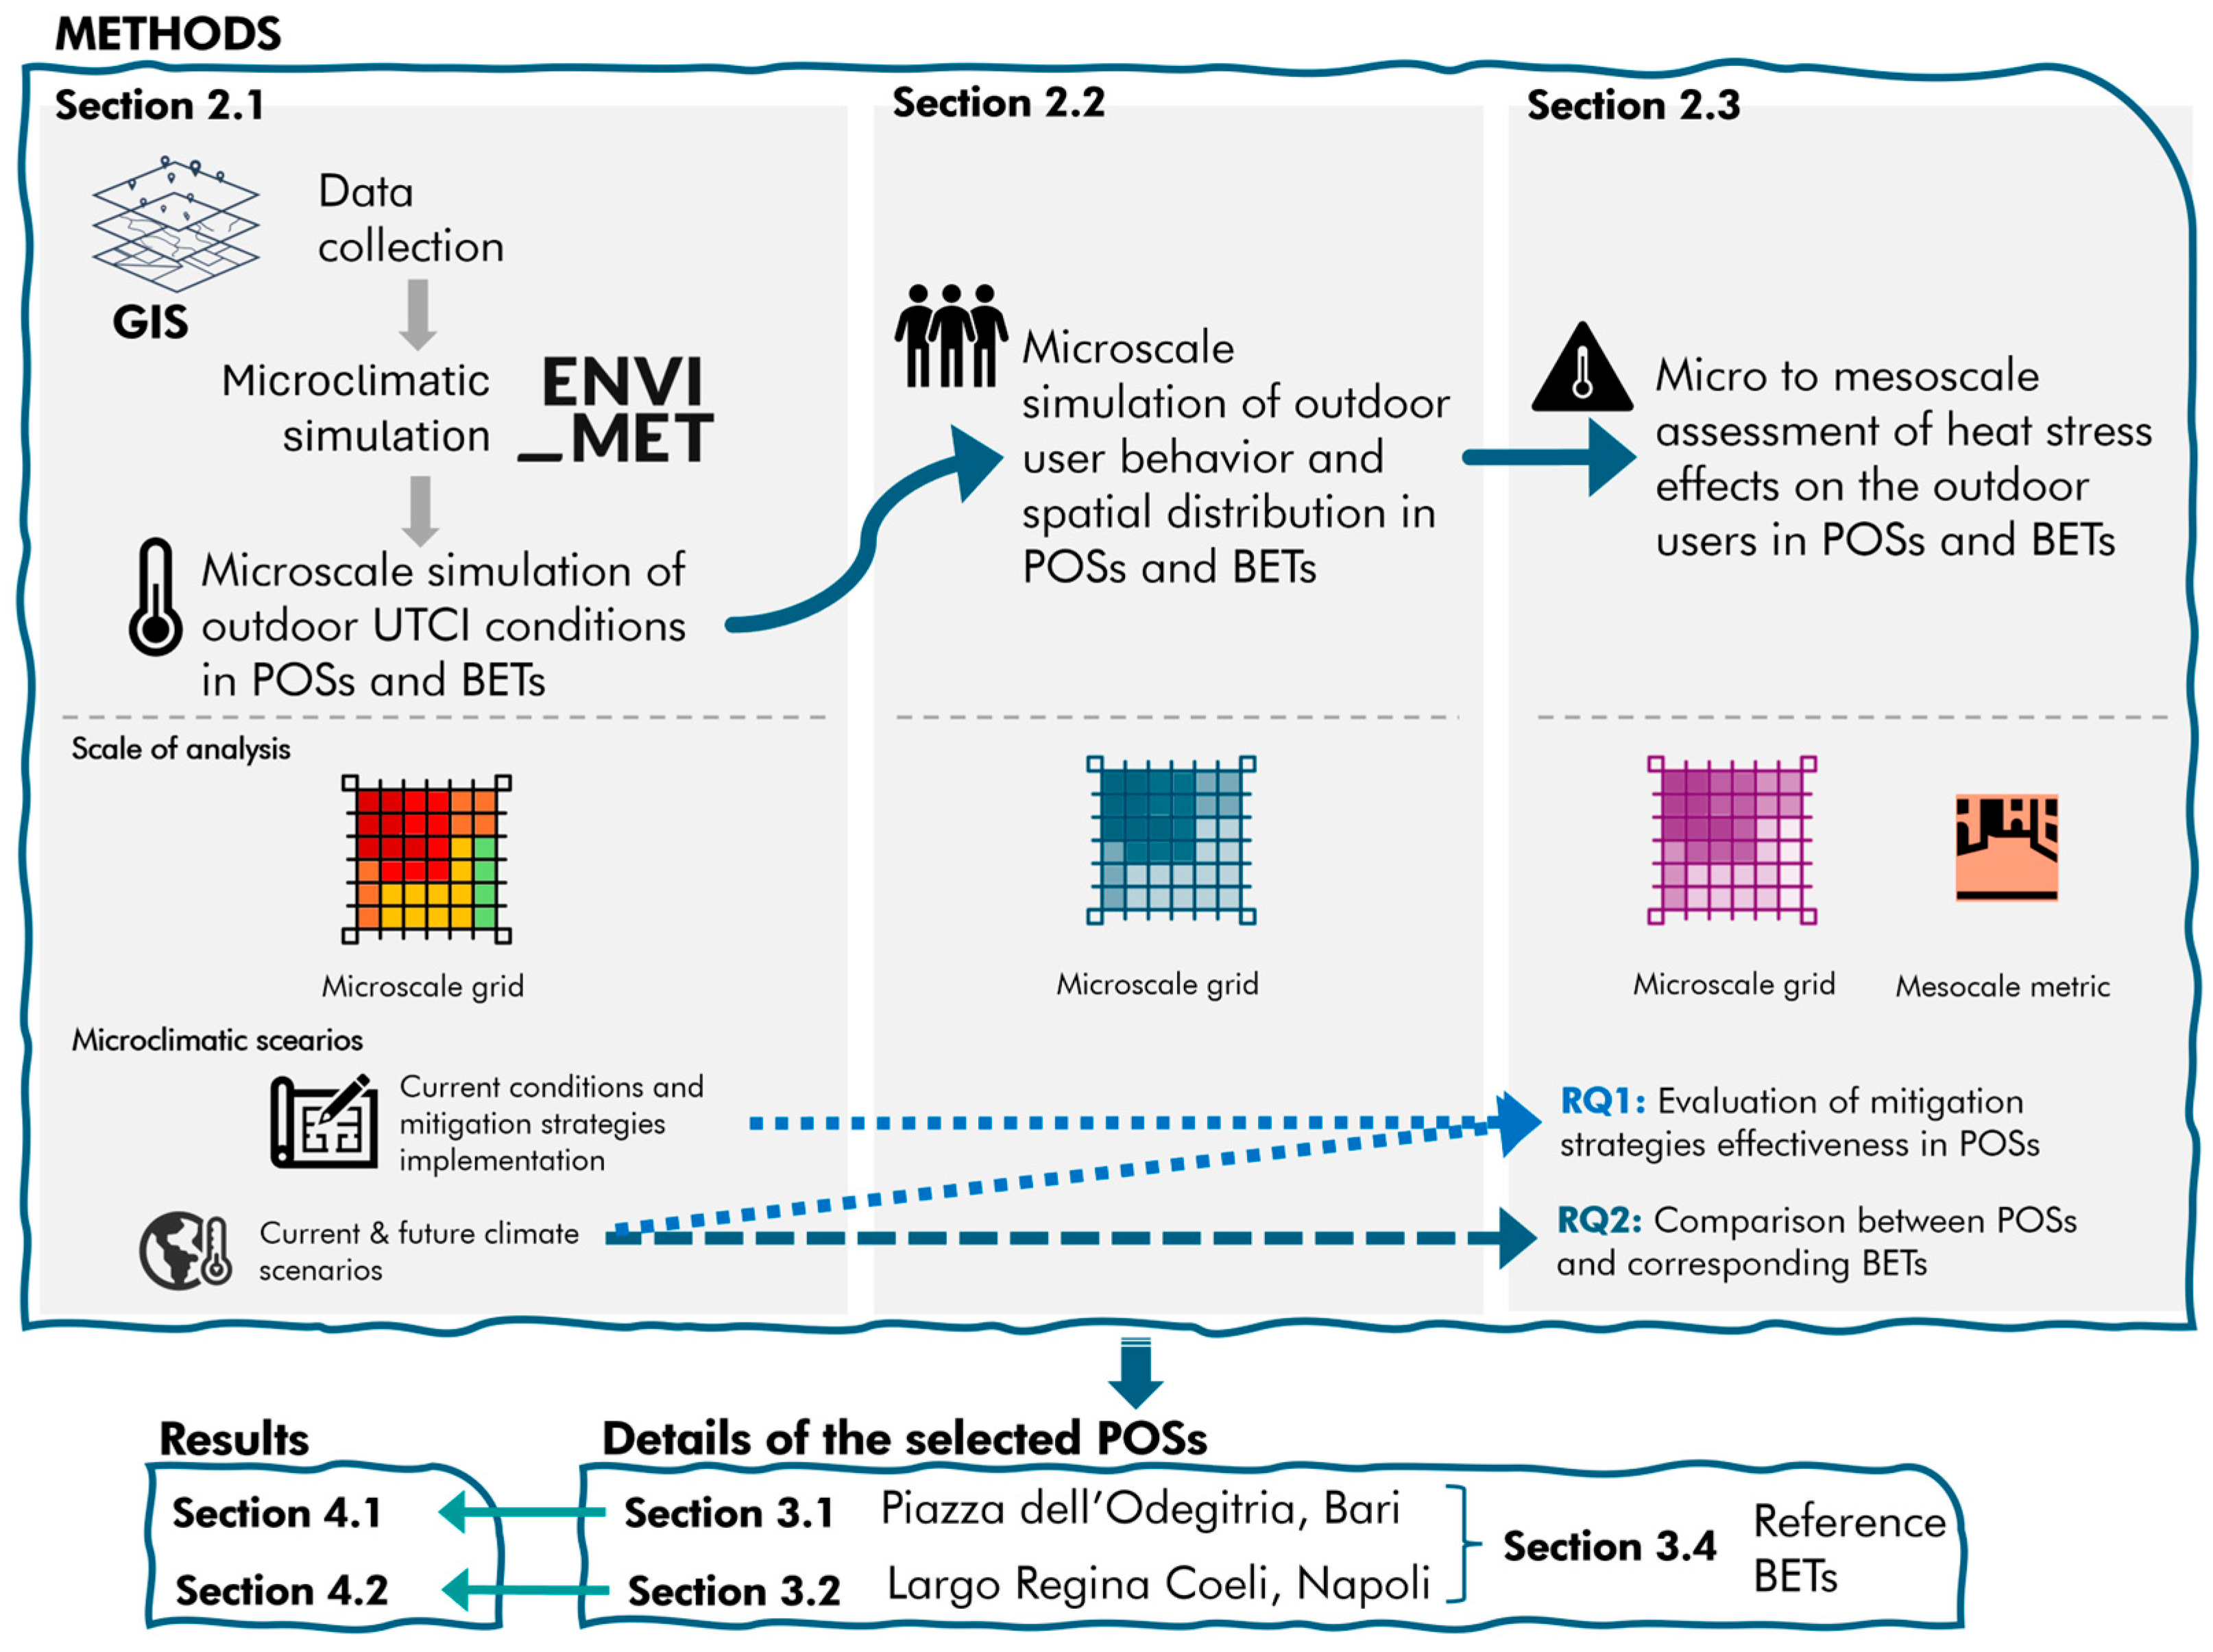
The study is structured in three main phases, as illustrated in Figure 1, which provides a descriptive overview of the applied framework, along with the references to each specific section in which related methods are discussed. In particular, the work phases concern the following:
  • The microscale simulation of outdoor UTCI conditions, according to GIS-based collection of data and the related application of ENVI-met simulations on the resulting model (Section 2.1);
  • The microscale simulation of user behaviour and spatial distribution within the POS/BET, depending on the prevailing heat conditions (Section 2.2);
  • The micro- to mesoscale assessment of the physiological effects induced by heat stress, accounting for user vulnerability, behaviour, and spatial distribution within the POS/BET (Section 2.3).
According to the research questions defined in Section 1, this framework is applied (a) to both POSs and their corresponding BETs, (b) by considering current climatic conditions and projected future climate scenarios, and (c) by accounting for the implementation of mitigation strategies aimed at reducing heat stress. These issues are discussed in Section 3, which presents the details of the selected POSS and thus the specific arrangements adopted in the scenario modelling. Nevertheless, it is worth remarking that the proposed framework can be applied to any other urban square, as well as in BETs, also considering additional climatic conditions, by updating the modelling variables according to the POS’s features. Therefore, the application is mainly intended to provide an overview of the methodological capabilities in view of the investigation of RQ1 and RQ2, and is not oriented towards a full generalisation towards other POS and BET conditions.

2.1. Microscale Simulation of Outdoor UTCI Conditions

The first part of the framework uses ENVI-met simulations (a three-dimensional Computational Fluid Dynamics (CFD) tool) and a GIS environment as pivotal tools for the setup of scenarios and their assessment, since the model relies on microscale UTCI analysis for evaluating heat stress, using consolidated approaches [7]. On the one hand, due to the geo-spatial requirements in describing local conditions of case studies, ENVI-met allows the Universal Thermal Climate Index (UTCI)-based scenarios to take into account local boundary conditions (i.e., solar exposure, geographical orientation of the site, and terrain elevation), and thus enables detailed evaluation of temperature variations, radiative behaviour, and shading effects [51]. Moreover, according to previous works, ENVI-met also enables a realistic analysis of how different retrofit elements contribute to reducing heat stress and improving microclimatic comfort [52,53]. On the other hand, GIS allows the comparison and calculation of users’ distribution and health stress, maintaining global spatial references and detailed spatial accuracy.
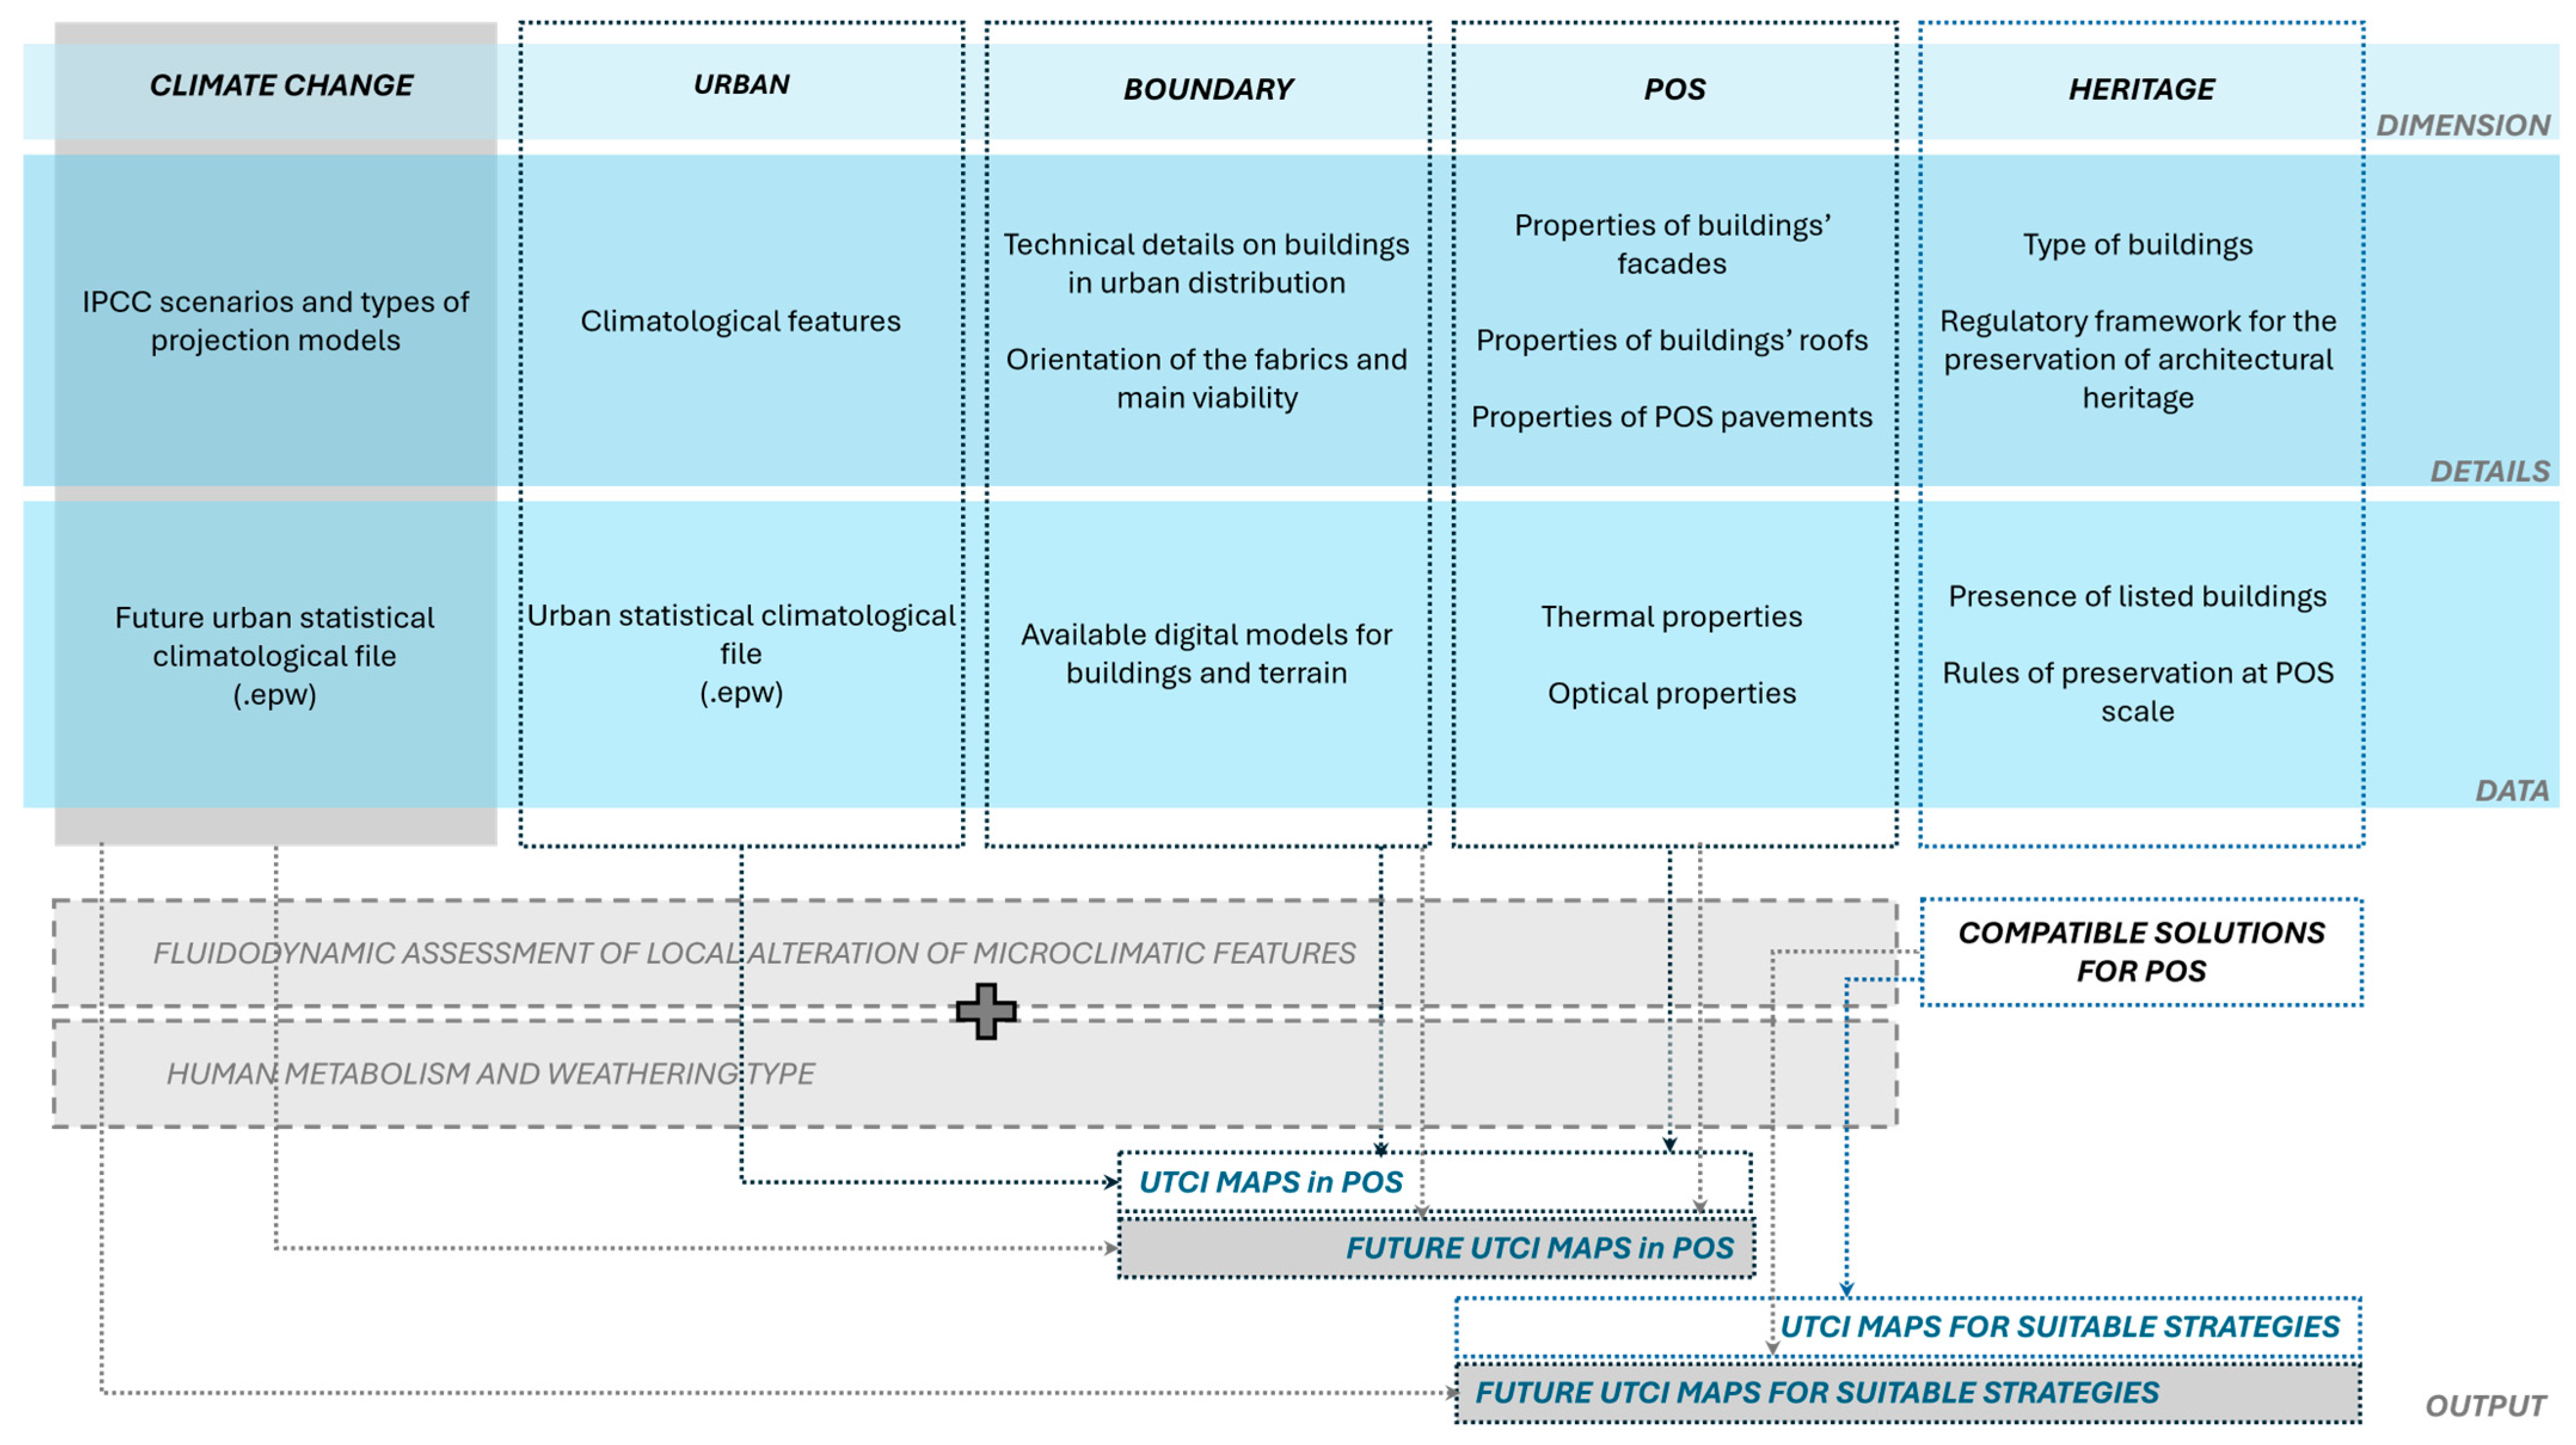
Considering the main aim of determining the baseline for users’ distribution in POSs and the relations with local overheating determined by heatwaves combined with local morphological and material features, UTCI mapping requires the collection, modelling, and management of data at the appropriate scale. Figure 2 (blue boxes) schematizes the levels of detail and data, as well as the dimensions to consider for modelling and simulating POSs as the preliminary activities in building scenarios (pre-/post-mitigation strategies, and actual and future climatological conditions) for the setup of related UTCI-based maps.
In detail, POS modelling and simulation require the use of a multi-dimensional set of data useful for describing the historical POS under analysis [54,55,56], as well as coherent with the requirements of the fluid dynamic simulations [57,58]. The dimensions, details, and data required can be described as follows:
-
Climate change dimensions are managed by identifying future climatological conditions coherently with a relevant IPCC scenario, which is useful for setting climatological conditions of simulation in actual and future scenarios at the urban dimension.
-
Urban dimension includes the selection of the relevant local climatological features in terms of temperatures, humidity, wind speed, and direction details, as well as geographical details required to determine solar radiation intensity and cardinal exposure. Compatible statistical climatological datasets of cities are selected to be properly transformed coherently with the identified future scenarios, while identifying the significant summer week for simulation.
-
The boundary geometric conditions of POSs relate to modelling activities aimed at determining the potential local variation in urban climatological details at the district scale. To this end, three-dimensional geometric details of buildings and their mutual distribution within the district are required, taking advantage of regional or local technical models. Similarly, a plano-morphological distribution of the terrain is required in order to ensure a coherent representation of the terrain. In that sense, regional technical data may be considered to build the geometric model of POSs. The global extension of the models should also include the bordering areas of the POS in order to consider the features of the surrounding districts.
-
In addition to the previous one, the POS dimension is enhanced with the material properties (thermal and optical) of the surrounding surfaces. In this case, properties can be collected by on-site analysis of building and pavement finishes and by modelling their optical features. In particular, optical properties are derived for each finishing layer for buildings (walls and roof) and pavement. This collection of data also allows the systematisation of original and added materials within historical POSs.
-
Finally, the “heritage” dimension of a POS and its components (pavement, buildings, materials, and uses, etc.) includes the recognition of the main relevant qualities to be preserved, through the analysis of building listings and available preservation regulations and guidelines for the historic case studies.
On the one hand, urban, boundary, and POS dimensions constitute the main basis for modelling and starting fluidodynamic (CFD) assessments of local alterations of microclimatic conditions. On the other hand, the dimensions of heritage and climate change serve as forcing conditions of the actual POS state, moving towards mitigated and compatible scenarios and future climate conditions, respectively.
Consequently, UTCI maps for POSs can be derived using the results of dynamic simulations and the UTCI calculation, as suggested by EU COST Action 730 [13,59], as a simple stationary thermal comfort indicator for a fixed person setting wearing summery clothing (grey boxes in Figure 2). Coherently with the paper’s aims, UTCI maps are setup considering actual and future climatological scenarios, both for the baseline and improved (with mitigative suitable strategies) POS models (output in Figure 2).

2.2. Microscale Simulation of Outdoor User Behaviour and Spatial Distribution

Users’ behaviour and spatial distribution are estimated according to UTCI values for all the assessed scenarios selected, as defined in Section 2.1. A thermal acceptability probability parameter (PA [%]) is used, originally defined in previous research [7]. For each cell representing the POS, PA is calculated using Equation (1), by distinguishing two user categories based on behavioural fruition of outdoor spaces, expressed in terms of expected duration of stay in the outdoor environment: (a) users who remain outdoors for less than 15 min (OO—Only Outdoor; e.g., passersby) and (b) users who stay for more than 15 min (PO—Prevalent Outdoor; e.g., customers of bar and restaurant dehors). This parameter provides a quantitative representation of user presence under different microclimatic conditions across the analysed scenarios.
P A   % = 0.0859 · U T C I 2 + 4.019 · UTCI + 54.119   for   OO 0.2485 · U T C I 2 + 12.914 · UTCI 85.681     for   PO

2.3. Micro- to Mesoscale Assessment of Heat Stress Effects on the Outdoor Users

Two assessment levels are provided for the POS. The microscale level refers to the evaluation of heat stress for each cell in the simulation grid (Section 2.3.1). These data are then used to evaluate the overall effects of heat stress for the POS as a whole, thus moving towards the mesoscale level (Section 2.3.2) [29]. On this basis, scenarios are compared using both microscale maps and mesoscale indicators (Section 2.3.3).

2.3.1. Microscale Assessment of Heat Stress

The sweat rate [g/h] was computed to quantify the thermo-physiological response of users exposed to UTCI conditions over time, according to consolidated simulation approaches [7]. This parameter, defined on the basis of formulations reported in the relevant literature [12,13], allows the estimation of the associated water loss as a function of the duration of exposure to heat stress. For each time interval t [h], and for each cell in the outdoor grid, sweat rate values are linked to specific UTCI-based heat stress categories, as shown in Table 1. This classification provides a consistent framework for modelling water loss across the analysed thermal conditions.
Water loss (WL [g/h]) is subsequently estimated for each grid cell of the outdoor area of POSs and BETs, accounting for both the local environmental conditions and user-related characteristics [7]. WL, calculated through Equation (2), represents the amount of water lost through evapotranspiration and is used to evaluate the potential health impacts associated with heat stress.
W L = ( S w e a t   r a t e   ·   t c r i t · A a ) ( A a · t c r i t , t o t )
In Equation (2), the model incorporates the critical exposure time ( t c r i t [h]), defined as the expected duration for which users are expected to remain in the area under given thermal conditions, which is 0.25 h (15 min) for OO and 1 h for PO users. The total critical exposure time ( t c r i t , t o t   [ h ] ) corresponds to the full hour associated with PO users’ potential presence in the space. The calculation also considers the surface area of each grid cell (Aₐ [m2]), ensuring that water loss is spatially allocated across the entire study domain. This parameterisation provides a consistent basis for comparing water loss patterns and associated health risks across the pre- and post-retrofit scenarios.
To better evaluate microscale effects on users, this work also calculates the time required for a user occupying the POS to lose 1% of their body mass through sweating. According to the literature [11,60], a fluid loss of approximately 1% of body weight, although classified as mild dehydration, has been shown to impair cognitive performance and reduce the ability to perform complex tasks. This threshold, therefore, provides a meaningful indicator for evaluating potential health risks associated with heat exposure. As the amount of fluid corresponding to 1% body mass is inherently dependent on an individual’s body weight, the estimation must account for demographic variability. Body weight is closely linked to both age and gender; consequently, five age groups are considered in this study [7]: toddlers (TU), children (PC), young adults (YA), adults (AU), and elderly users (EU). Table 2 reports the hypothetical body weights assigned to each age group and gender category for the purposes of the model.
The time required for a user to lose 1% of their body mass through sweating ( t 1 % [h]) is hence calculated for each grid cell of the POS using Equation (3):
t 1 % =   g a g e W L
In this formulation, g a g e represents the amount of body mass corresponding to 1% of the total body weight for each age–gender group (as reported in Table 2) [g], while WL denotes the water loss rate previously computed for each cell (as reported in Equation (2)) [g/h]. The resulting value of t 1 % , therefore, provides, for every cell and for each demographic class, the estimated exposure duration leading to a 1% reduction in body mass through sweating.

2.3.2. Mesoscale Assessment of Heat Stress

The mesoscale assessment provides an aggregated measure of the thermo-physiological impact across the entire outdoor area, using a spatially averaged water loss indicator ( W L P O S [g/h]). This parameter represents the mean water loss associated with user exposure within the full extent of the POS/BET, integrating the WL values derived at the grid cell level. The calculation of W L P O S , presented in Equation (4), allows the overall effect of heat-induced fluid loss to be quantified consistently, thereby supporting comparative assessments of thermal risk under different microclimatic conditions.
W L P O S = a = 0 n ( S w e a t   r a t e   ·   ( t c r i t · A a ) ) ( a = 0 n A a ) · t c r i t , t o t
Similarly, cell-level values of t 1 % are aggregated to produce a single indicator representative of the entire POS. This is performed by weighting the t 1 % values for each age–gender category according to its proportion within the total population of the case study. Equation (5) shows t*1% [h], which describes the average exposure time at which a typical user in the POS would reach a 1% body water loss through sweating. Minimum and maximum t*1% values are also calculated by considering the related values for specific age classes, as traced in Table 2.
t 1 % = t 1 % · % a g e
The age group percentages of the POS ( % a g e ) used in Equation (5) were derived from demographic data provided by the Italian National Institute of Statistics (ISTAT) [61], referring to the total population of the respective municipalities.
In view of the above, this indicator complements the UTCI analysis by quantifying safe outdoor exposure durations under different climatic conditions, by considering the users’ health features and fragilities by age.

2.3.3. Comparison Methods and Criteria

For comparison purposes in respect to RQ1 and RQ2, the proposed framework is structured by providing a systematic analysis of pre- versus post-retrofit conditions, current versus future climate change scenarios, and POSs versus their corresponding BETs. To guide the interpretation of the results, Table 3 summarises the main comparison methods, the calculation of each indicator, and their expected interpretation at both micro- and mesoscale levels. This table allows readers to understand how each comparison supports either RQ1, RQ2, or both, and provides a clear link between the indicators (WLPOS, t1%, and t*1%), including their percentage variations expressed by dI [%], as well as their interpretation.
Microscale maps of environmental conditions, exposure, and heat stress effects are represented through chromatically coded spatial maps that allow a cell-by-cell evaluation of the indicators. In particular, UTCI maps calculated according to ENVI-met-based simulations (Section 2.1) display the microclimatic distribution of heat stress, reporting values in degrees Celsius from the minimum to the maximum recorded in each scenario. t1% maps (Section 2.3.1) use a similar colour scale, ranging from 0 h up to the maximum exposure time detected in the given scenario. The indicators listed in Table 3 are used to qualitatively compare local conditions under different scenarios (i.e., current/future climate; pre-/post-mitigation), as well as to trace differences between POSs and the corresponding BETs. Moreover, minimum and maximum t1% values under each comparison scenario are also provided to represent the local effects of the most and least critical heat stress.
At the mesoscale, W L P O S values are used to compare POSs with corresponding BETs, thus excluding user vulnerability by age, which can be different depending on the profiles of hosted users. Conversely, both W L P O S and t*1% values are used to provide POS-related comparisons under climate scenarios and pre-/post-mitigation scenarios, considering the user characterisation as constant in terms of population by age (according to Table 2).
Finally, percentage differences in microscale and macroscale indicators dI [%] are calculated according to the equations in Table 3 for the comparisons between the following: (a) POS and BET results; (b) current (cur) and future (fut) climate scenarios in POS and BETs; and (c) pre- (pre) versus (post) post-mitigation scenarios in POSs. dI is calculated considering the minimum and maximum t 1 % values at the microscale, and W L P O S and t*1% values at the mesoscale.

3. Details of the Selected POSs

This chapter describes the selected POSs used as case studies in the application of the proposed framework. Section 3.1 and Section 3.2 present the geometric, morphological, material, and functional characteristics of Piazza dell’Odegitria in Bari and Largo Regina Coeli in Naples, respectively, highlighting their historical value and spatial configuration. Section 3.3 introduces the mitigation strategies considered for the two POSs, discussing their selection and spatial implementation in relation to heritage constraints and urban morphology. In fact, mitigation strategies imply a specific setup of microscale simulations of outdoor UTCI conditions, thus representing POS inputs for the simulation-based framework. Section 3.4 defines the reference BETs associated with the urban squares in Bari and Naples, outlining their geometric alignment and comparability. Finally, Section 3.5 reports the climatic inputs and model data adopted for the UTCI-based assessment of the analysed scenarios.

3.1. Piazza dell’Odegitria, Bari

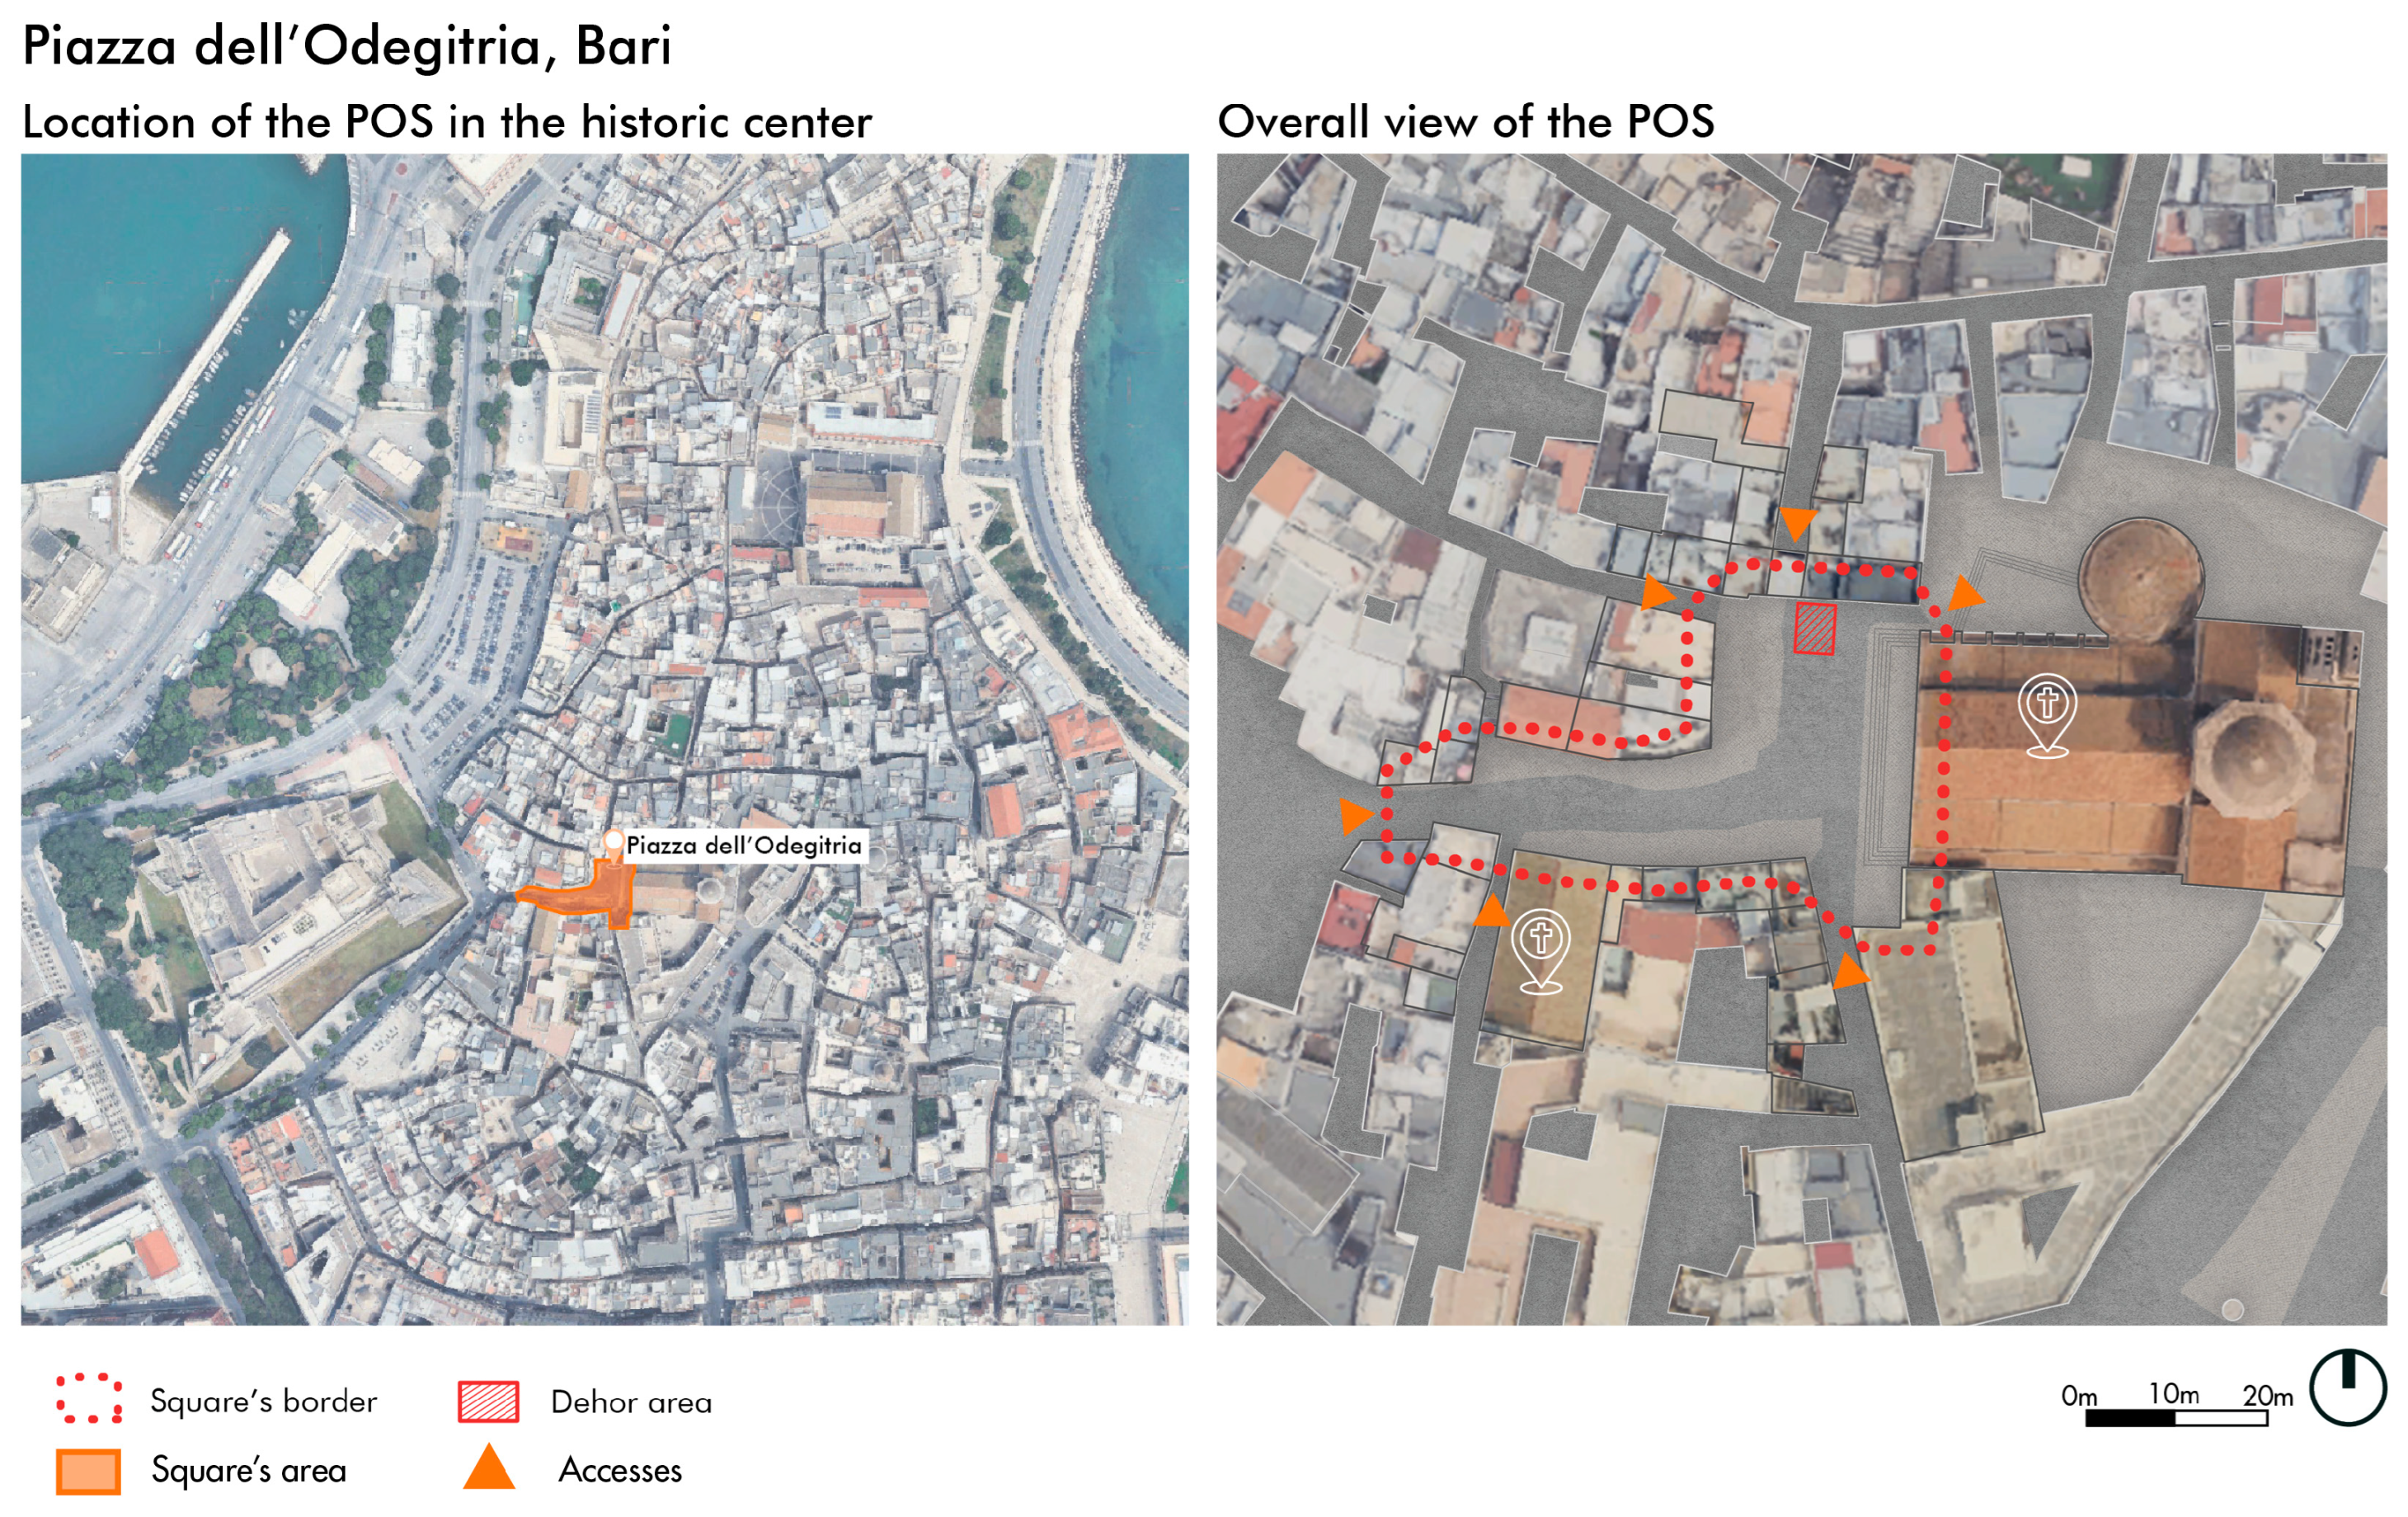
The first case study, Piazza dell’Odegitria in Bari (Figure 3), is a historical square that opens forecourt in front of the Cathedral of San Sabino; the square’s form and prominence are directly tied to the medieval and post-medieval phases of the cathedral complex. Archaeological investigations in the cathedral’s “succorpo” (the sub-structure/crypt area) have shown layered building phases (late antique/paleo-Christian structures overlain by a Byzantine cathedral and then by the Romanesque San Sabino), which explains why the church and therefore the piazza occupy a concentrated, historically complex footprint in Bari Vecchia [62,63]. Due to these historical relations, the square and the Cathedral cannot be considered independently in terms of their identity and when assessing possible strategies for climate-related improvements. Piazza dell’Odegitria is surrounded by typical residential buildings, mainly characterised by clear-coloured plastered walls or unplastered ones. Roofs reflect the transformations undergone over their long existence, alternating flat pavements in red or calcareous tiles with dark or light bituminous waterproof external layers. The surrounding built fabric is dense, with building heights ranging between 14 and 24 m, creating a relatively enclosed urban space with limited sky-view factors. As for the pavements, clear calcareous tiles are located all around the perimeter of the flat square, while dark basalt pavement has more recently replaced the central part of the square. Apart from its openness in front of the cathedral, Piazza dell’Odegitria is included in a very close district, characterised by complex and narrow streets, consistent with Mediterranean historical practices. The main wide access to the square is located in front of the cathedral, remarking their strong relation. The other five minor accesses allow access into the public area that is fully pedestrianised, limiting vehicular circulation to residents. The square covers an area of approximately 1300 m2 and presents a convex layout with an overall compact plan (width–length ratio ≈ 0.72). Functionally, the square is a central attractor within the old town, hosting a mix of residential, commercial, and religious functions. Commercial activities, including outdoor bar areas organised through fixed terraces, occupy most of the ground floors. The combination of compact morphology, limited ventilation corridors, and extensive hard surfaces makes Piazza dell’Odegitria particularly sensitive to overheating effects, conditions that are expected to worsen under future climate change scenarios. For these reasons, the square represents a representative Mediterranean POS for assessing local overheating risks and evaluating mitigation strategies.
Finally, according to the methods outlined in Section 2.3.2, the weighted contributions of each age–gender group to the total population are as follows: TU—1.67% males, 1.56% females; PC—4.12% males, 3.93% females; YA—2.47% males, 2.29% females; AU—31.76% males, 33.06% females; and EU—8.11% males, 11.02% females.

3.2. Largo Regina Coeli, Naples

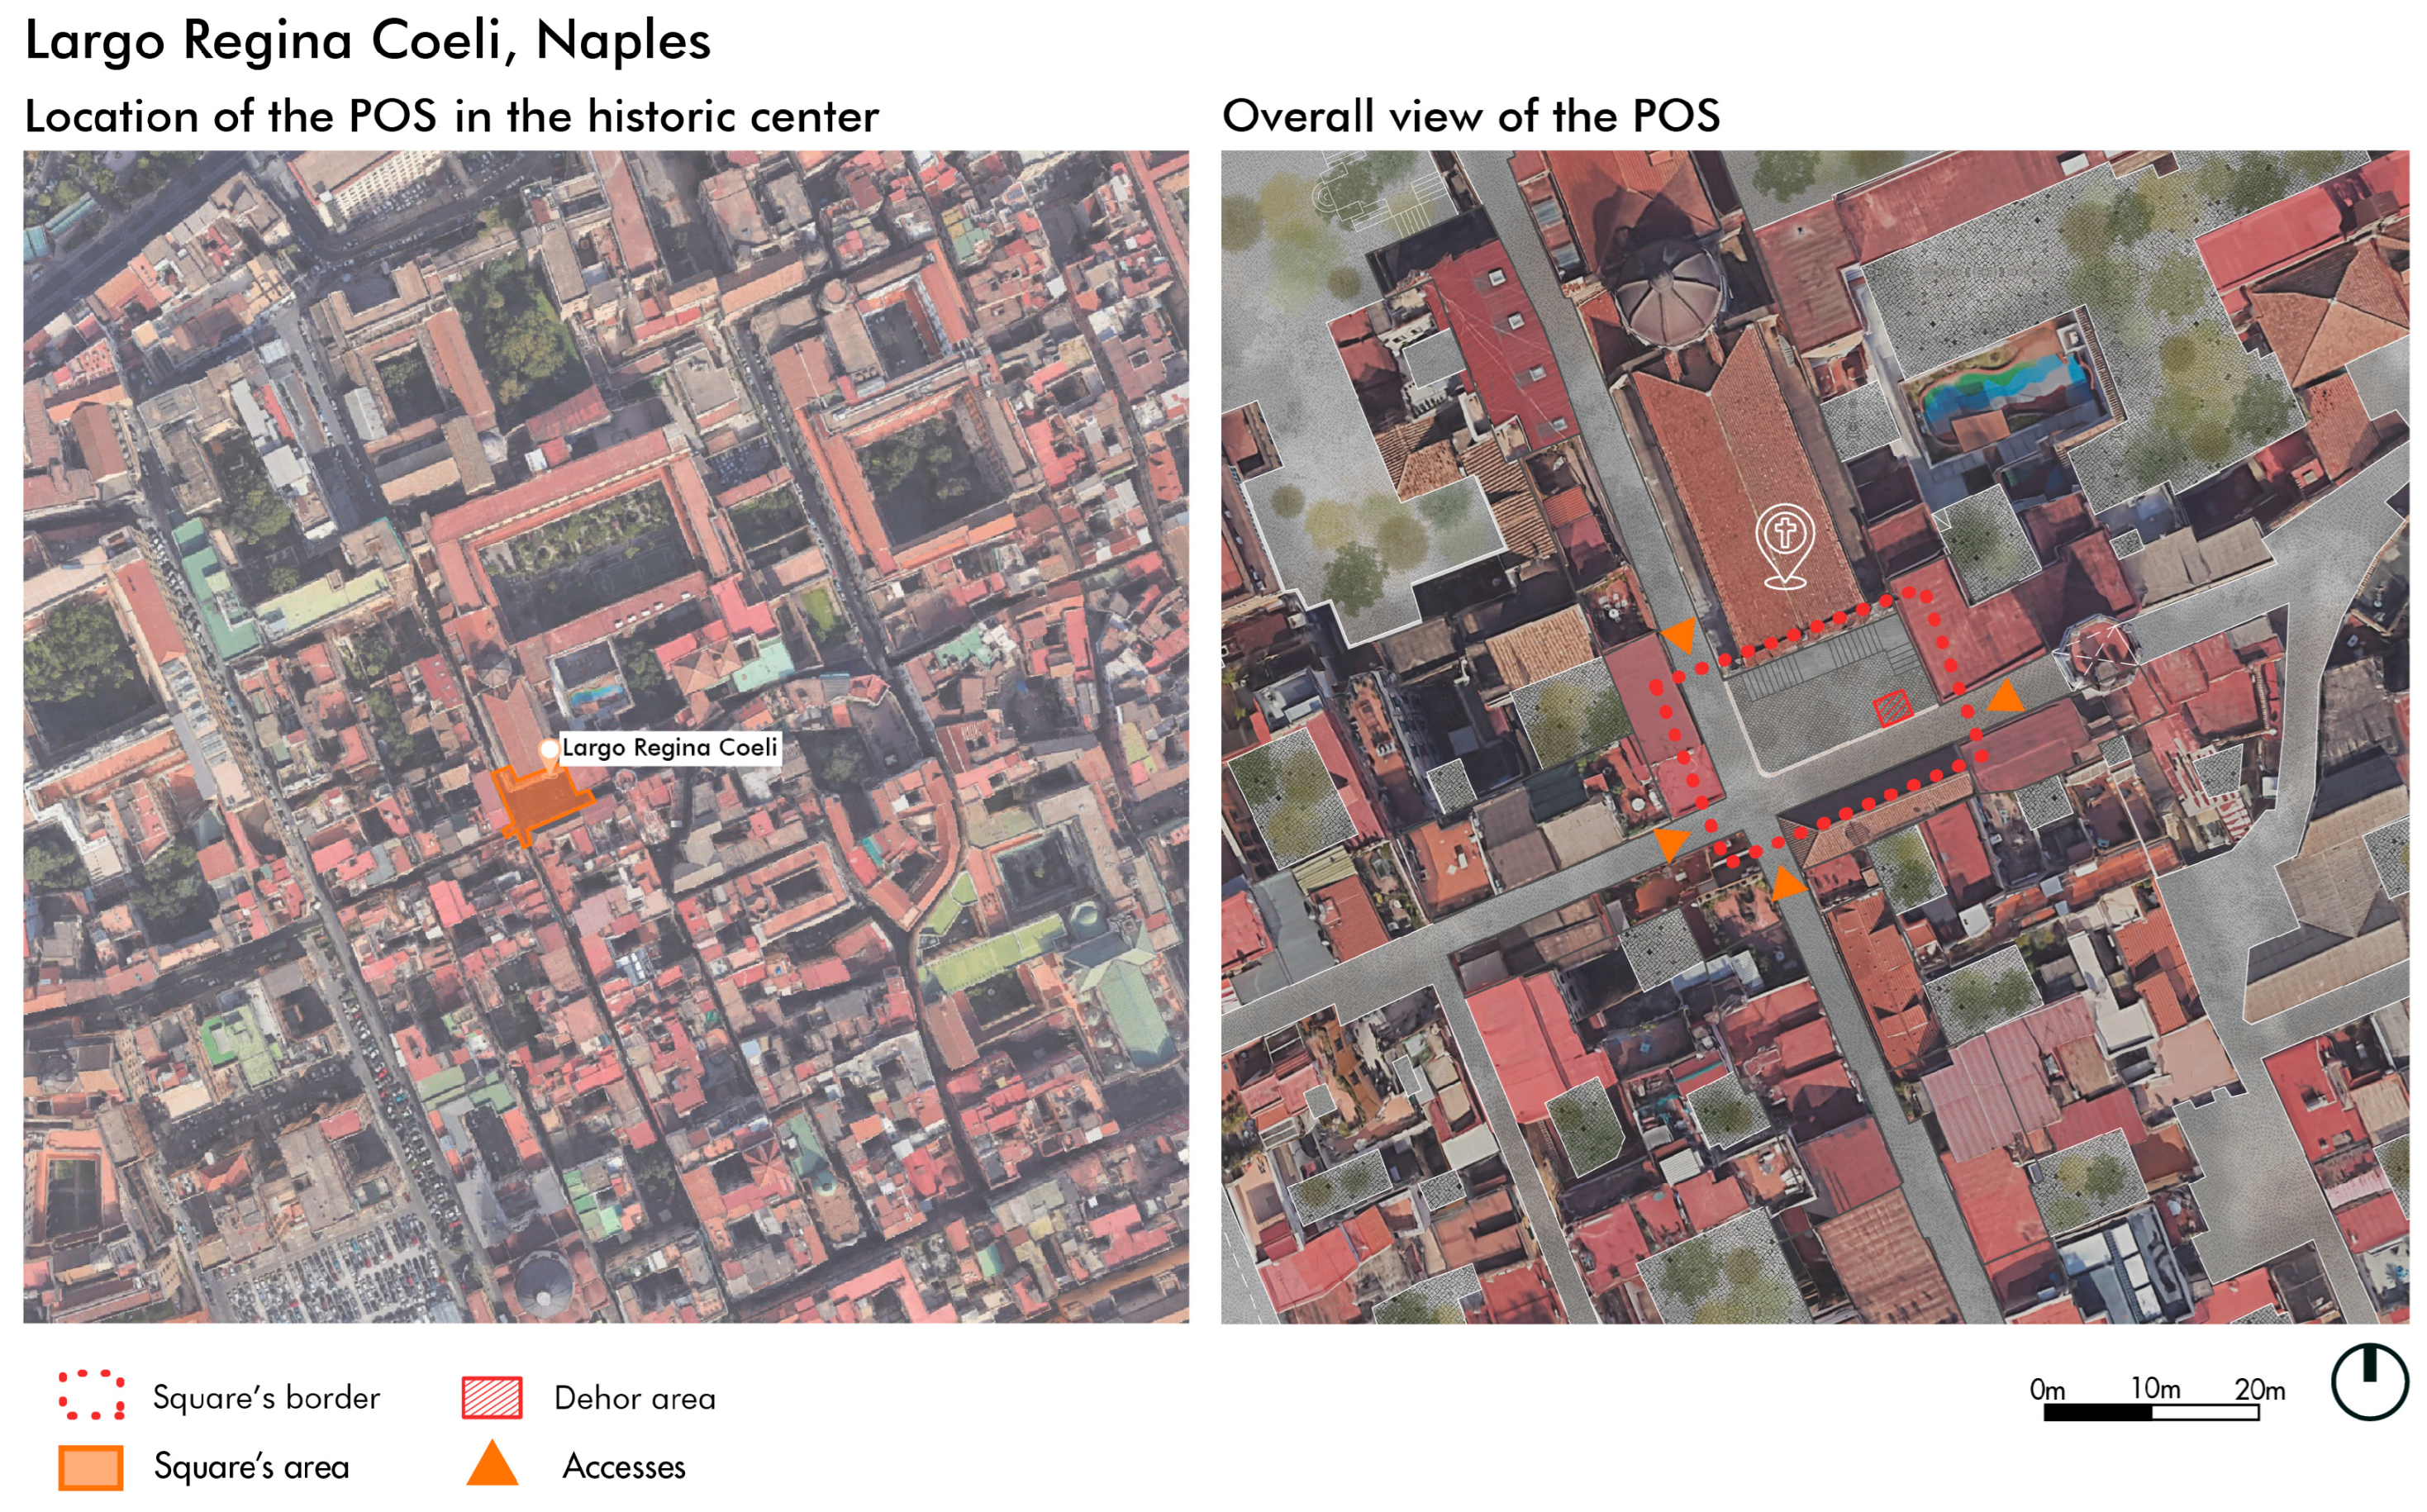
The second case study, Largo Regina Coeli (commonly tied to the church and monastery of Santa Maria Regina Coeli) in Naples (Figure 4), occupies a small piazza on the Decumano Superiore (the historic east–west axis of central Naples). The present church and convent complex were established in the late 16th century when a noble palace was converted into a monastic house for the canonical women (Lateran Canonesses/Augustinian rule) [64]. Older documentary references name the place historically as “Capo de Trio” (a nod to three converging streets), and urban historians emphasise that this small piazza is a node where multiple medieval streets meet—hence its persistent role as a local urban node rather than as a large, monumental square [65]. In contrast to the case of Bari, the relation between the church and the square is mediated by streets that border the public open space, rather than creating a direct visual openness to the church. The square has a relatively small footprint, covering 416.76 m2, and is framed by narrow converging streets that create an enclosed spatial configuration. Surrounding buildings typically range between 18 and 22 m in height, producing a pronounced canyon effect that influences local shading and airflow patterns. The façades facing the square are predominantly composed of light-coloured plastered surfaces or stone masonry, consistent with traditional Neapolitan construction techniques. The pavement is characterised by stone slabs and other high-reflectance materials commonly found in historical streetscapes. Largo Regina Coeli also hosts a special building, the Church of Santa Maria Regina Coeli, which acts as the main architectural landmark. A bar dehor is present in the square, increasing the frequency and duration of pedestrian presence in the outdoor environment. The area is pedestrianised, with vehicular access restricted exclusively to residents; commercial activities are concentrated on the ground floors, while the upper storeys are primarily residential. The compactness of the geometry, the narrow access streets, and the abundant shading contribute to generally lower thermal loads compared with more open Mediterranean POSs. Nevertheless, Largo Regina Coeli still experiences significant heat stress, particularly in future climate change scenarios. Its spatial and functional characteristics make it a representative case for assessing microclimatic behaviour in highly enclosed historical environments and for evaluating the effectiveness of localised mitigation strategies.
Finally, according to Section 2.3.2’s methods, the weighted contributions of each age–gender group to the total population are as follows: TU—1.99% males, 1.89% females; PC—4.88% males, 4.58% females; YA—2.90% males, 2.75% females; AU—31.85% males, 33.41% females; and EU—6.49% males, 9.27% females.

3.3. Mitigation Strategies for the POSs

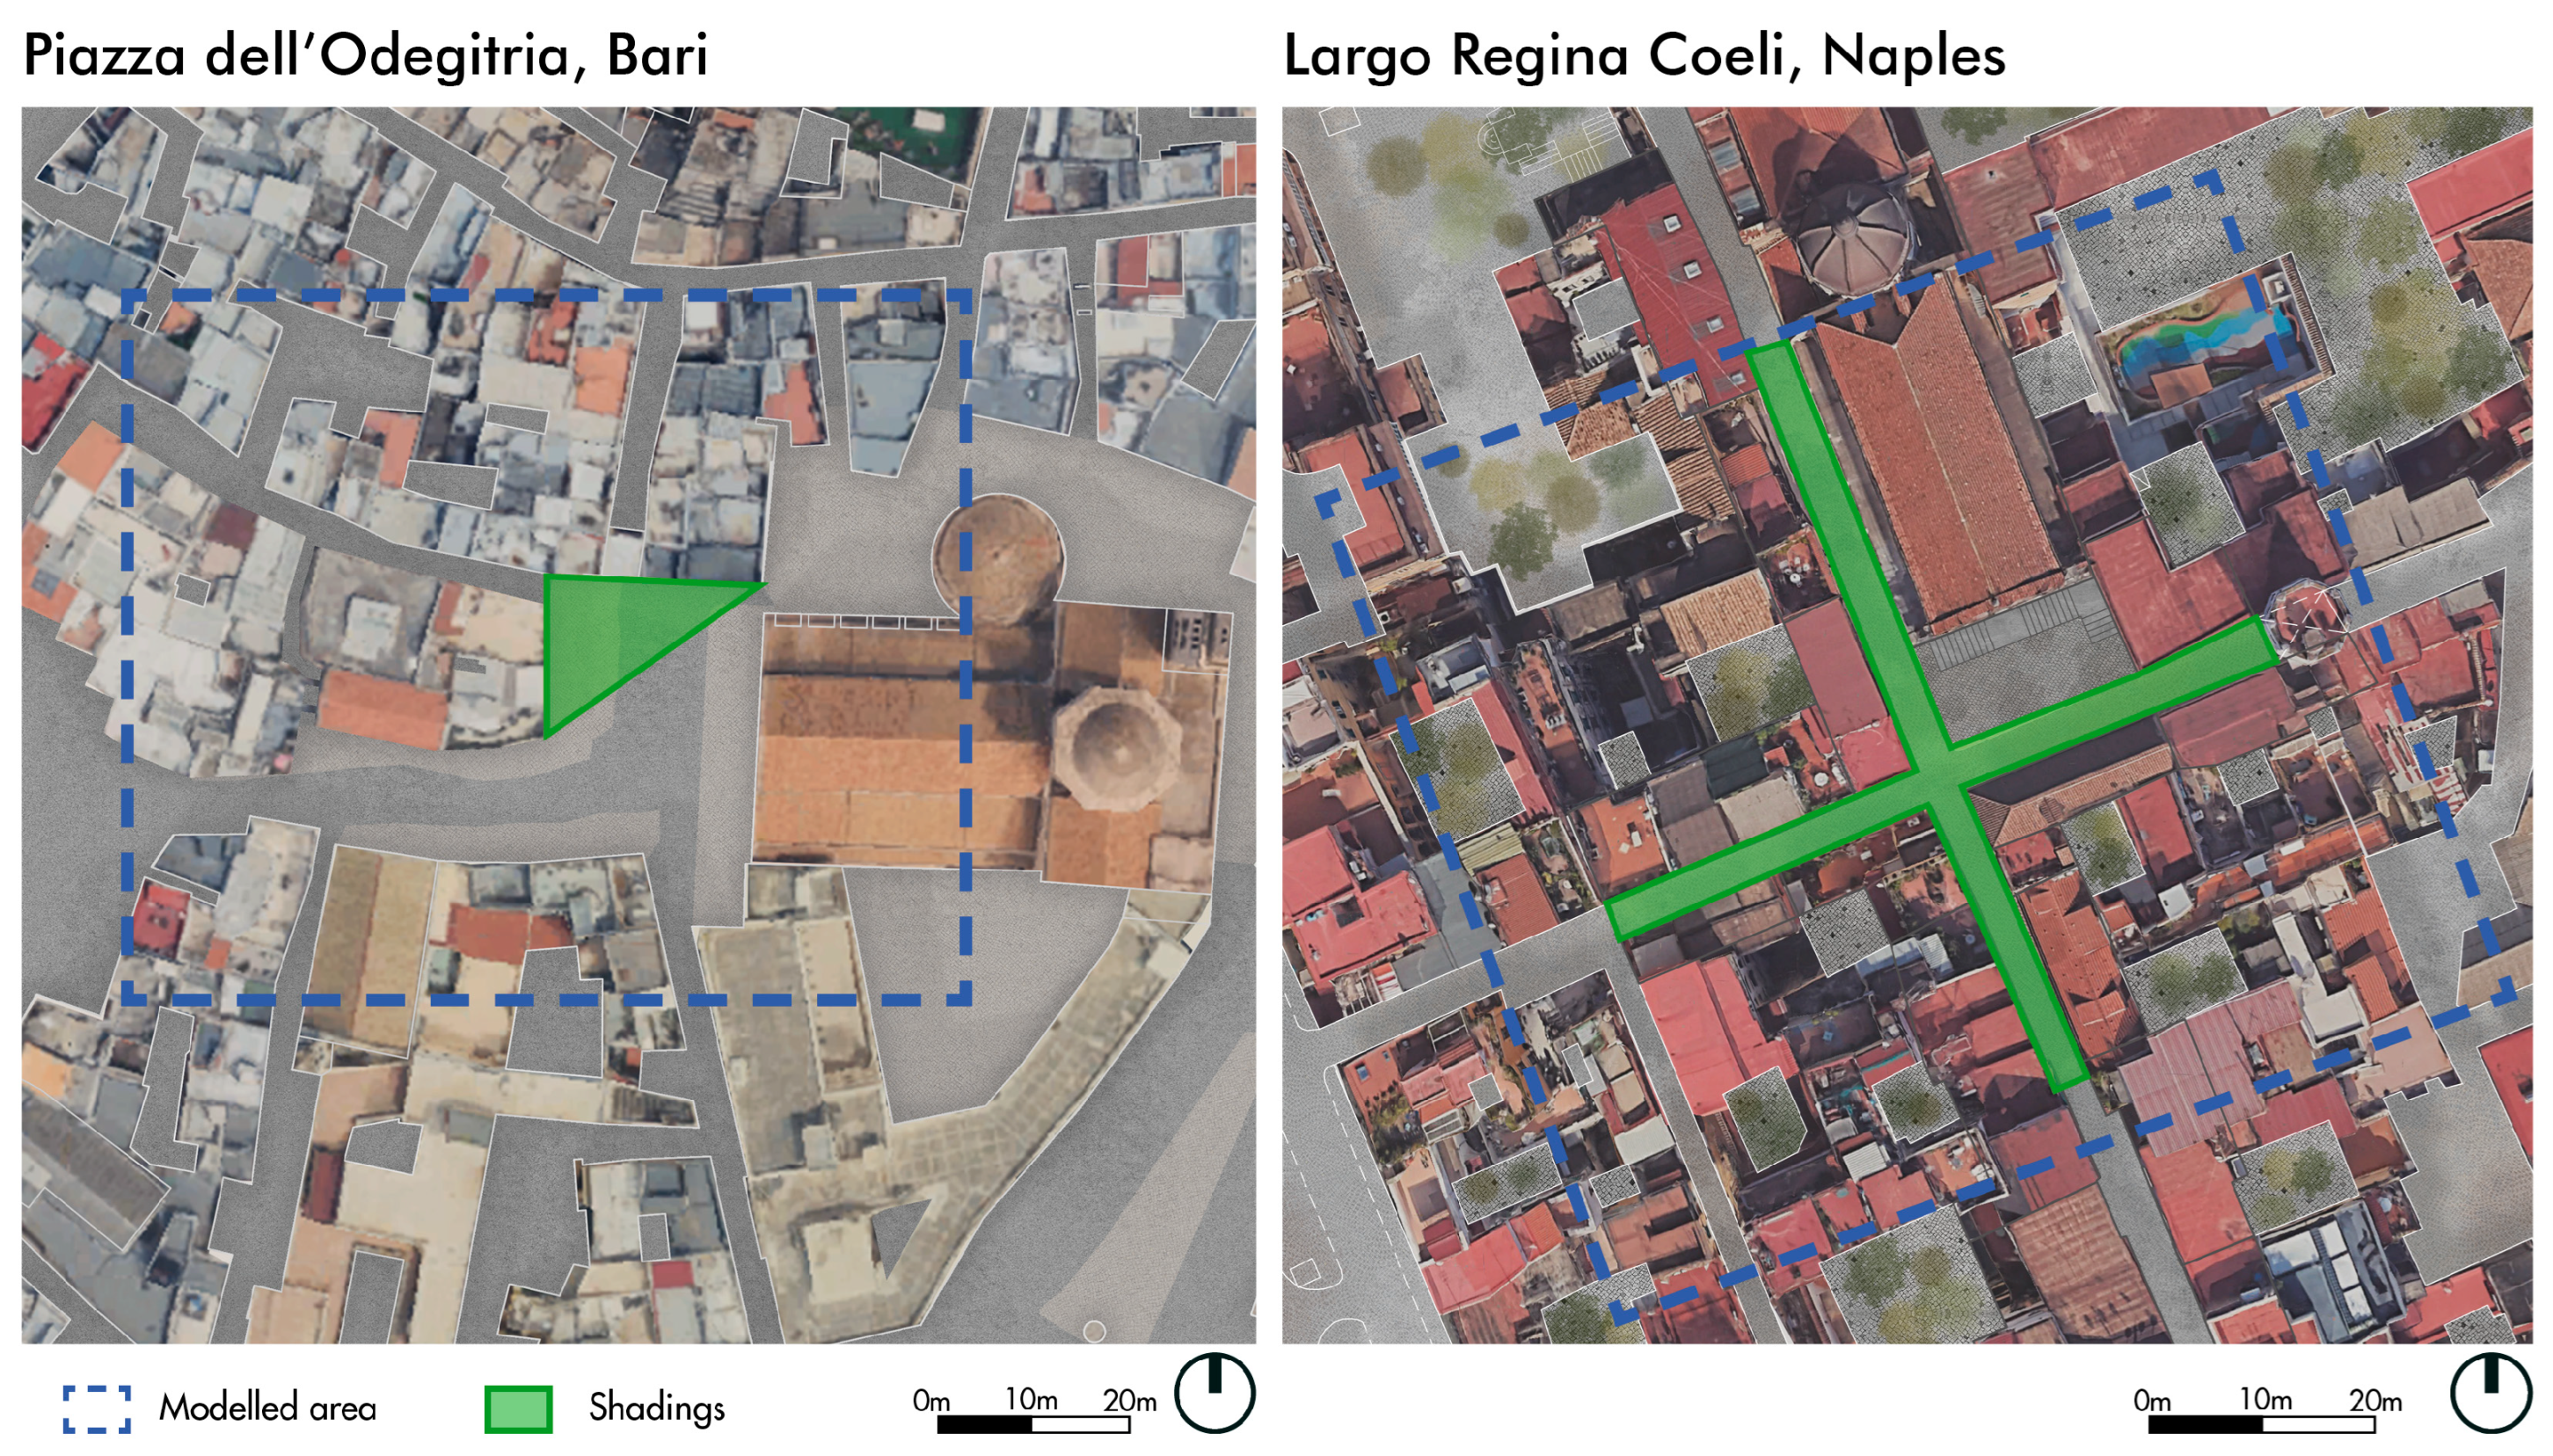
The POSs in Bari and Naples are analysed considering their peculiarities in terms of historic squares, and thus also in view of intervention compatibility and place identity, while also taking into account principles of sustainability, visual integration, and reversibility [66,67,68,69]. In detail, Table 4 summarises possible mitigation strategies, coherently with previous classification for heatwave exposure [68], and indicates their compatibility with both case studies. As a result, suspended shading is selected as the most flexible technology. In fact, due to its reduced extension, Largo Regina Coeli in Naples cannot host large furniture like traditional green or blue strategies. On the other hand, the possible effectiveness of fixed shading is supported by its high potential to mitigate the main determinant in UTCI assessment, direct solar radiation, as already demonstrated in several Mediterranean experiences [70,71]. As far as their application details are concerned, sunsails can be suspended by steel stretchers punctually fixed to facades, in order to minimise wall perforations.
Figure 5 summarises the distribution of fixed shading along the modelled POSs, which reflects the specificities of each urban square. For Piazza dell’Odegitria in Bari, the visual openness of the monumental facade of the church in the western part of the POS should be preserved through horizontal intermediate layering. For this reason, a system of suspended but fixed solar shading is located in the eastern part of the POS, taking advantage of buildings to connect them, while ensuring the visual continuity of the church façade in the entrance of the square. In the case of Largo Regina Coeli in Naples, shadings are distributed all along the boundary streets, limiting the overlapping effect on the Santa Maria Regina Coeli church.

3.4. Reference BETs

Reference BETs are selected among Italian historical urban squares identified by previous works [42], and have already been applied in user-centred, simulation-based approaches for SLOD risk assessments [7]. These works investigated 1111 urban squares in Italian historical city centres, defining objective and quantitative indicators for application beyond individual sites. On this basis, previous research demonstrated that historical POSs often share recurring morphological, constructive, and functional characteristics, which are represented by the defined indicators and influence users’ exposure and vulnerability. These characteristics have been described and grouped into a limited number of archetypal conditions, namely, the BETs. Each BET is described by a range of values, or by a median value, for each defined indicator. When all the indicators of a given POS are similar to those of a certain BET (within the representative range or with equal medians), the POS can be associated with the BET. Given this rationale, the POSs defined in Section 3.1 and Section 3.2 are aligned with the corresponding BETs, addressing RQ1.
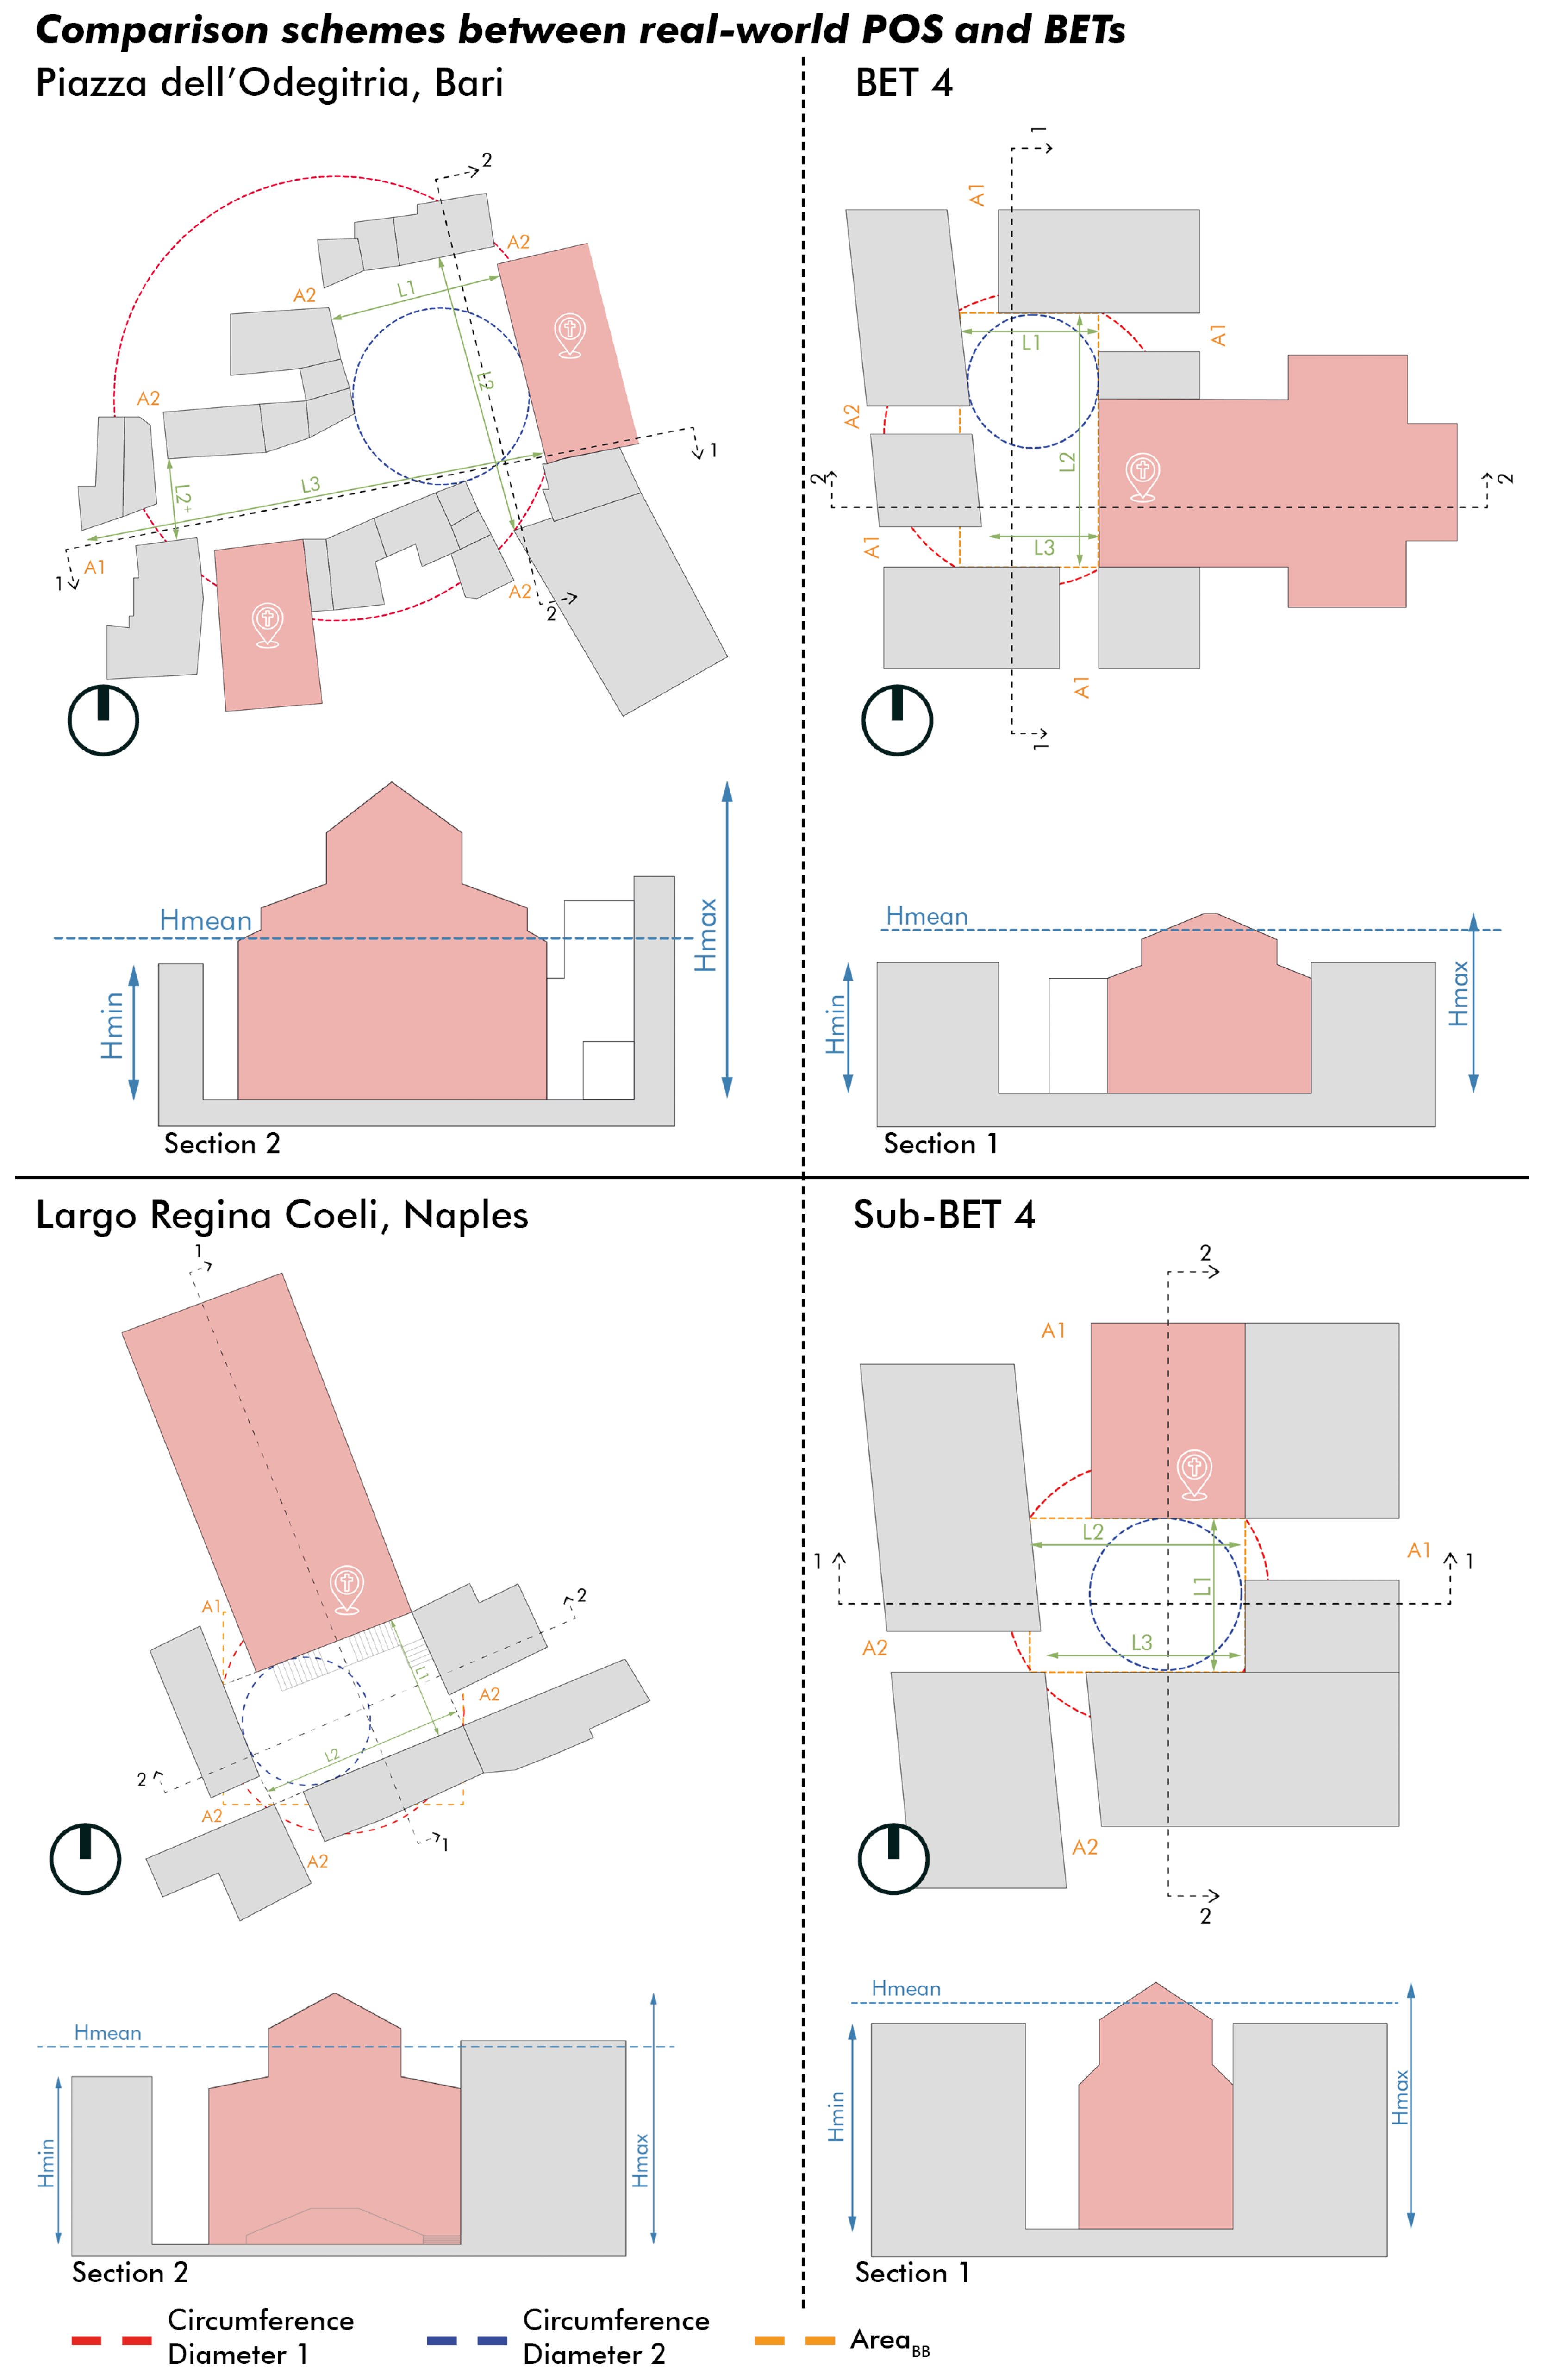
Considering the reference Italian historical context [42], the selected case studies share similarities with the so-called BET4. This compact BET is characterised by a relevant maximum height of built fronts relative to the open space width, and a good distribution of accesses along its perimeter (which can also impact square ventilation). Nevertheless, the POSs also have specific features. Piazza dell’Odegitria in Bari (BET4) seems to have an overall slight “L-shaped” layout, but the main areas of the urban square are placed in front of the cathedral (east side of the POS) and thus the area behaves as a convex open space with medium compactness and regular building-front alignment (Figure 6). Largo Regina Coeli in Naples presents similar levels of compactness and morphological regularity, but its significantly smaller geometric scale prevents a direct match with the standard BET4 configuration. For this reason, it was associated with a reduced-scale sub-typology of BET4 (namely, sub-BET4), selected to ensure geometric comparability with the Neapolitan case study (Figure 6). Figure 6 summarises these issues in terms of plan and section comparison of the POSs and of the related BETs. The quantitative values of the geometric and morphological indicators underpinning this comparison are reported in Table 5, which also highlights minor deviations between the POSs and the BET validity ranges, without compromising their typological correspondence. Together, Figure 6 and Table 5 demonstrate the suitability of the selected POSs to be assimilated to BET4 and sub-BET4, providing the basis for their subsequent use in the overheating risk assessment framework.
Given these general characteristics, these BETs can be considered representative not only of the case study POSs in Mediterranean historical cities, but also of their morphology and level of compactness [10,56,71]. The relevance is discussed in Section 3.5 by considering relevant climate conditions of POSs and BETs.

3.5. Climate and Model Data for the UTCI-Based Assessment of Scenarios

As far as the morphological dimensions are concerned, the selected case studies are characterised by some similarities proper of historical urban built environments located in southern Italy. As shown in Figure 3 and Figure 4, these urban squares are placed in vulnerable, compact, and intricated layouts, typical of Mediterranean cities, and have also a high touristic interest [10,49,72].
Moreover, they are characterised by a typical Mediterranean climate, which is expected to be critically affected by increasing trends in summer mean conditions and the frequency of climatological heatwaves [73]. Finally, both these urban squares share similarities with a corresponding BET in the Italian context [42], as demonstrated in Section 3.4.
Table 6 summarises the data collected and used according to POS modelling for UTCI-based assessment in actual and future scenarios (Section 2.1), as well as in the mitigated ones (Section 3.3). In detail, for the urban climatological dimensions of POS modelling, TMY (Typical Meteorological Year) files for Bari and Naples were obtained using standard statistical reference periods. TMY files include temperature, relative humidity, wind speed, and velocity used for CFD simulations. Then, TMY files are used to solve the climate change dimension of the modelling, transposed into the future considering the Shared Socio-economic Pathways SSP2-4.5 scenario, as the most representative “middle-of-the-road” pathway into the IPCC AR6 framework. Its selection is motivated by its wide adoption in climate impact studies across Europe and the Mediterranean, as it provides a balance between overly optimistic assumptions (e.g., SSP1-2.6) and high-end projections (e.g., SSP5-8.5). The future climate data were calculated by morphing the TMY using the Future Weather Generator [74,75], a climatological morphing tool that incorporates recent AR6 IPCC scenario guidelines [76]. The identified projections are set for 2050 and 2080, intended as the representative mid-term and long-term horizons, in accordance with the IPCC scenarios. Then, regional technical details are used to address the boundary dimension of the model, combining DTM to define the 2D extent and spatial distribution of buildings, as well as their main height, and DSM to represent morphological variations in the squares. This is necessary due to the urban square location in complex urban contexts. Material details for POS dimensions are collected by on-site inspections, while the mitigation strategy is modelled coherently with the opportunities discussed in Section 3.3.
All the details describing the POSs are thus used to model them by combining GIS and ENVI-met tools, as synthesised in Table 6. In particular, the microscopic assessment approach relies on the discretisation of outdoor POS areas into cells (1 m for each side). Therefore, UTCI values are estimated for each cell using the ENVI-met simulation [77]. Considering the necessity to assess it in the worst summer scenarios [7], UTCI maps show the mean values among the 11:00–16:00 period of the simulated day for each cell.

4. Results

This chapter presents the results of the microclimatic simulations and indicator-based analyses carried out on the selected POSs and their corresponding BETs. Section 4.1 focuses on Piazza dell’Odegitria in Bari, first discussing the results obtained under pre- and post-retrofit conditions through UTCI and t1% spatial distributions and aggregated indicators, and subsequently presents the comparison between the POS and its reference BET. Section 4.2 follows the same analytical structure for Largo Regina Coeli in Naples, presenting the effects of the mitigation strategy and the comparison with the corresponding BET.

4.1. Results on Piazza dell’Odegitria, Bari and BET Comparison

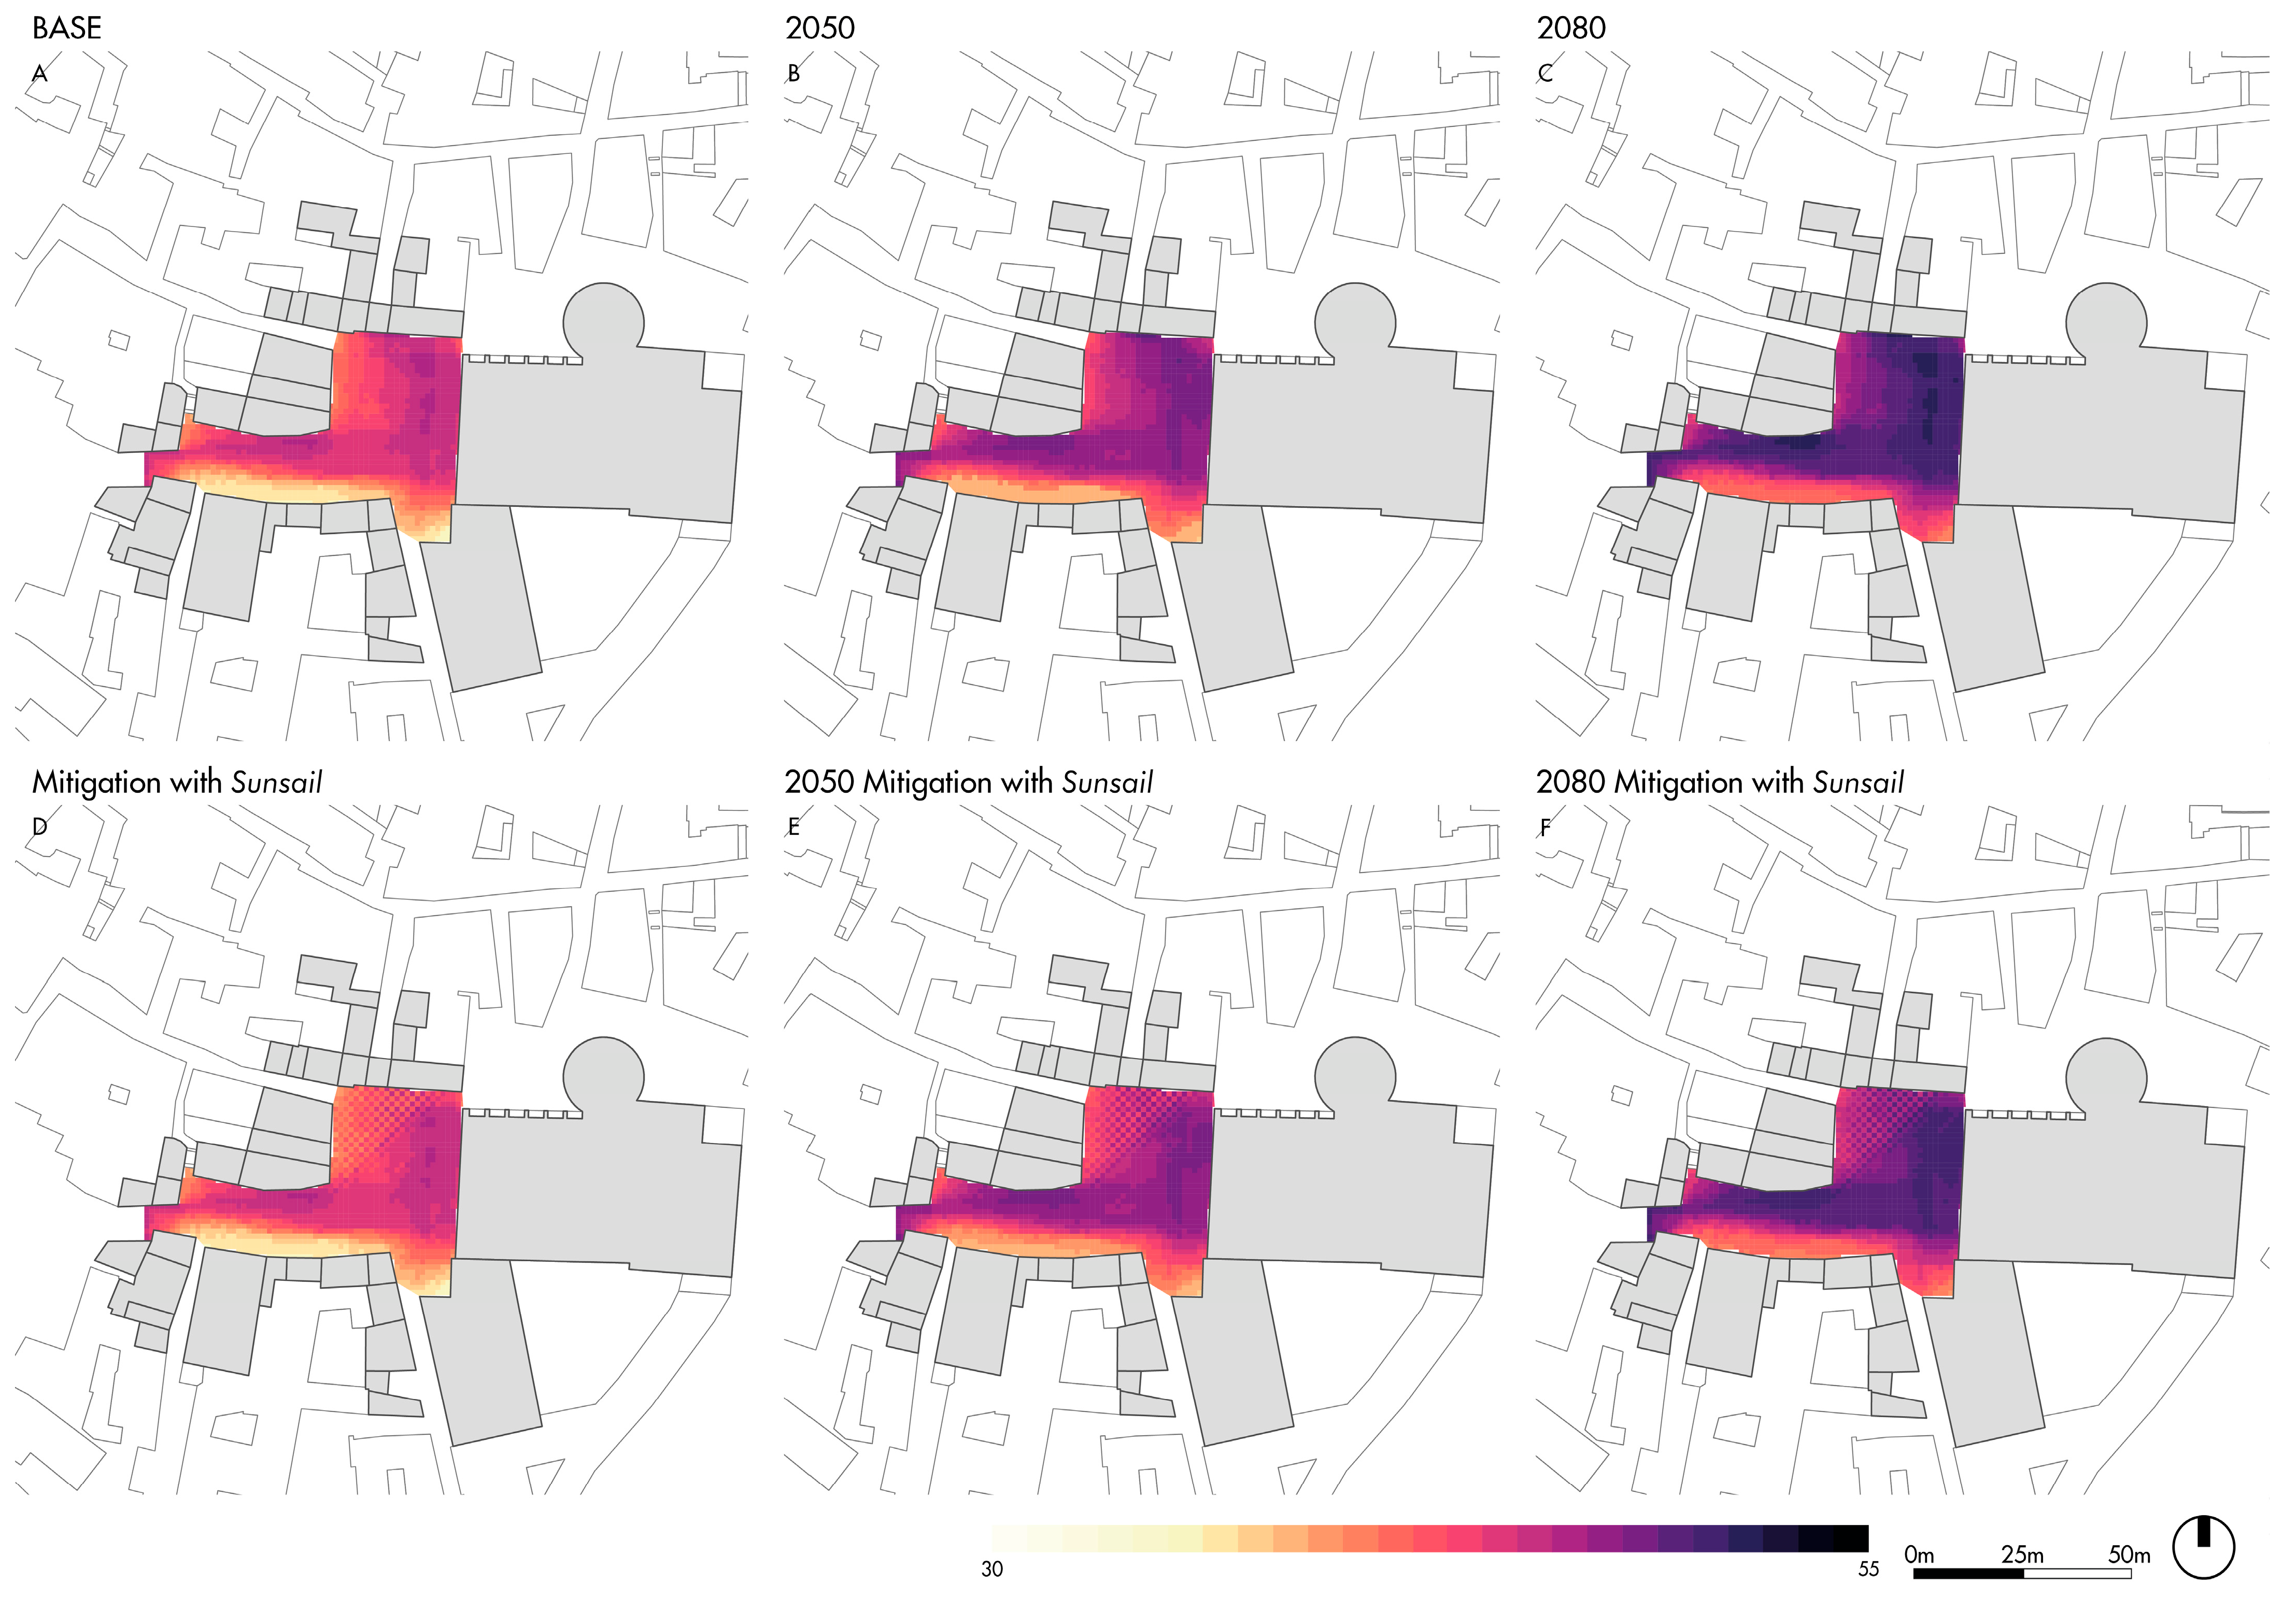
The UTCI maps for Piazza dell’Odegitria (Figure 7) highlight a clear reduction in heat stress under all simulated scenarios following the introduction of the sunsails. In the pre-retrofit conditions, the urban square exhibits extensive areas with high UTCI values, particularly in the central corridor and in the sector facing the cathedral, where exposure to direct solar radiation is most persistent. This pattern intensifies in the 2050 and 2080 projections, with large portions of the square reaching critical thermal stress levels. Under the post-retrofit scenario, the sunsails produce a noticeable mitigation effect in the shaded portion of the POS. UTCI values within the sunsails’ footprint decrease across all climate scenarios, with greater effectiveness under future conditions due to higher background temperatures. The shaded area exhibits a shift toward lower UTCI classes, while the surrounding unshaded areas maintain values similar to those of the pre-retrofit scenario. Overall reductions within the shaded area range between approximately 2 and 4 °C. In summary, for Bari, the comparison demonstrates that the sunsails effectively reduce peak UTCI values, shrink the extent of high-stress zones, and delay the onset of extreme thermal conditions, even though future climate projections still push the square toward critical UTCI levels.
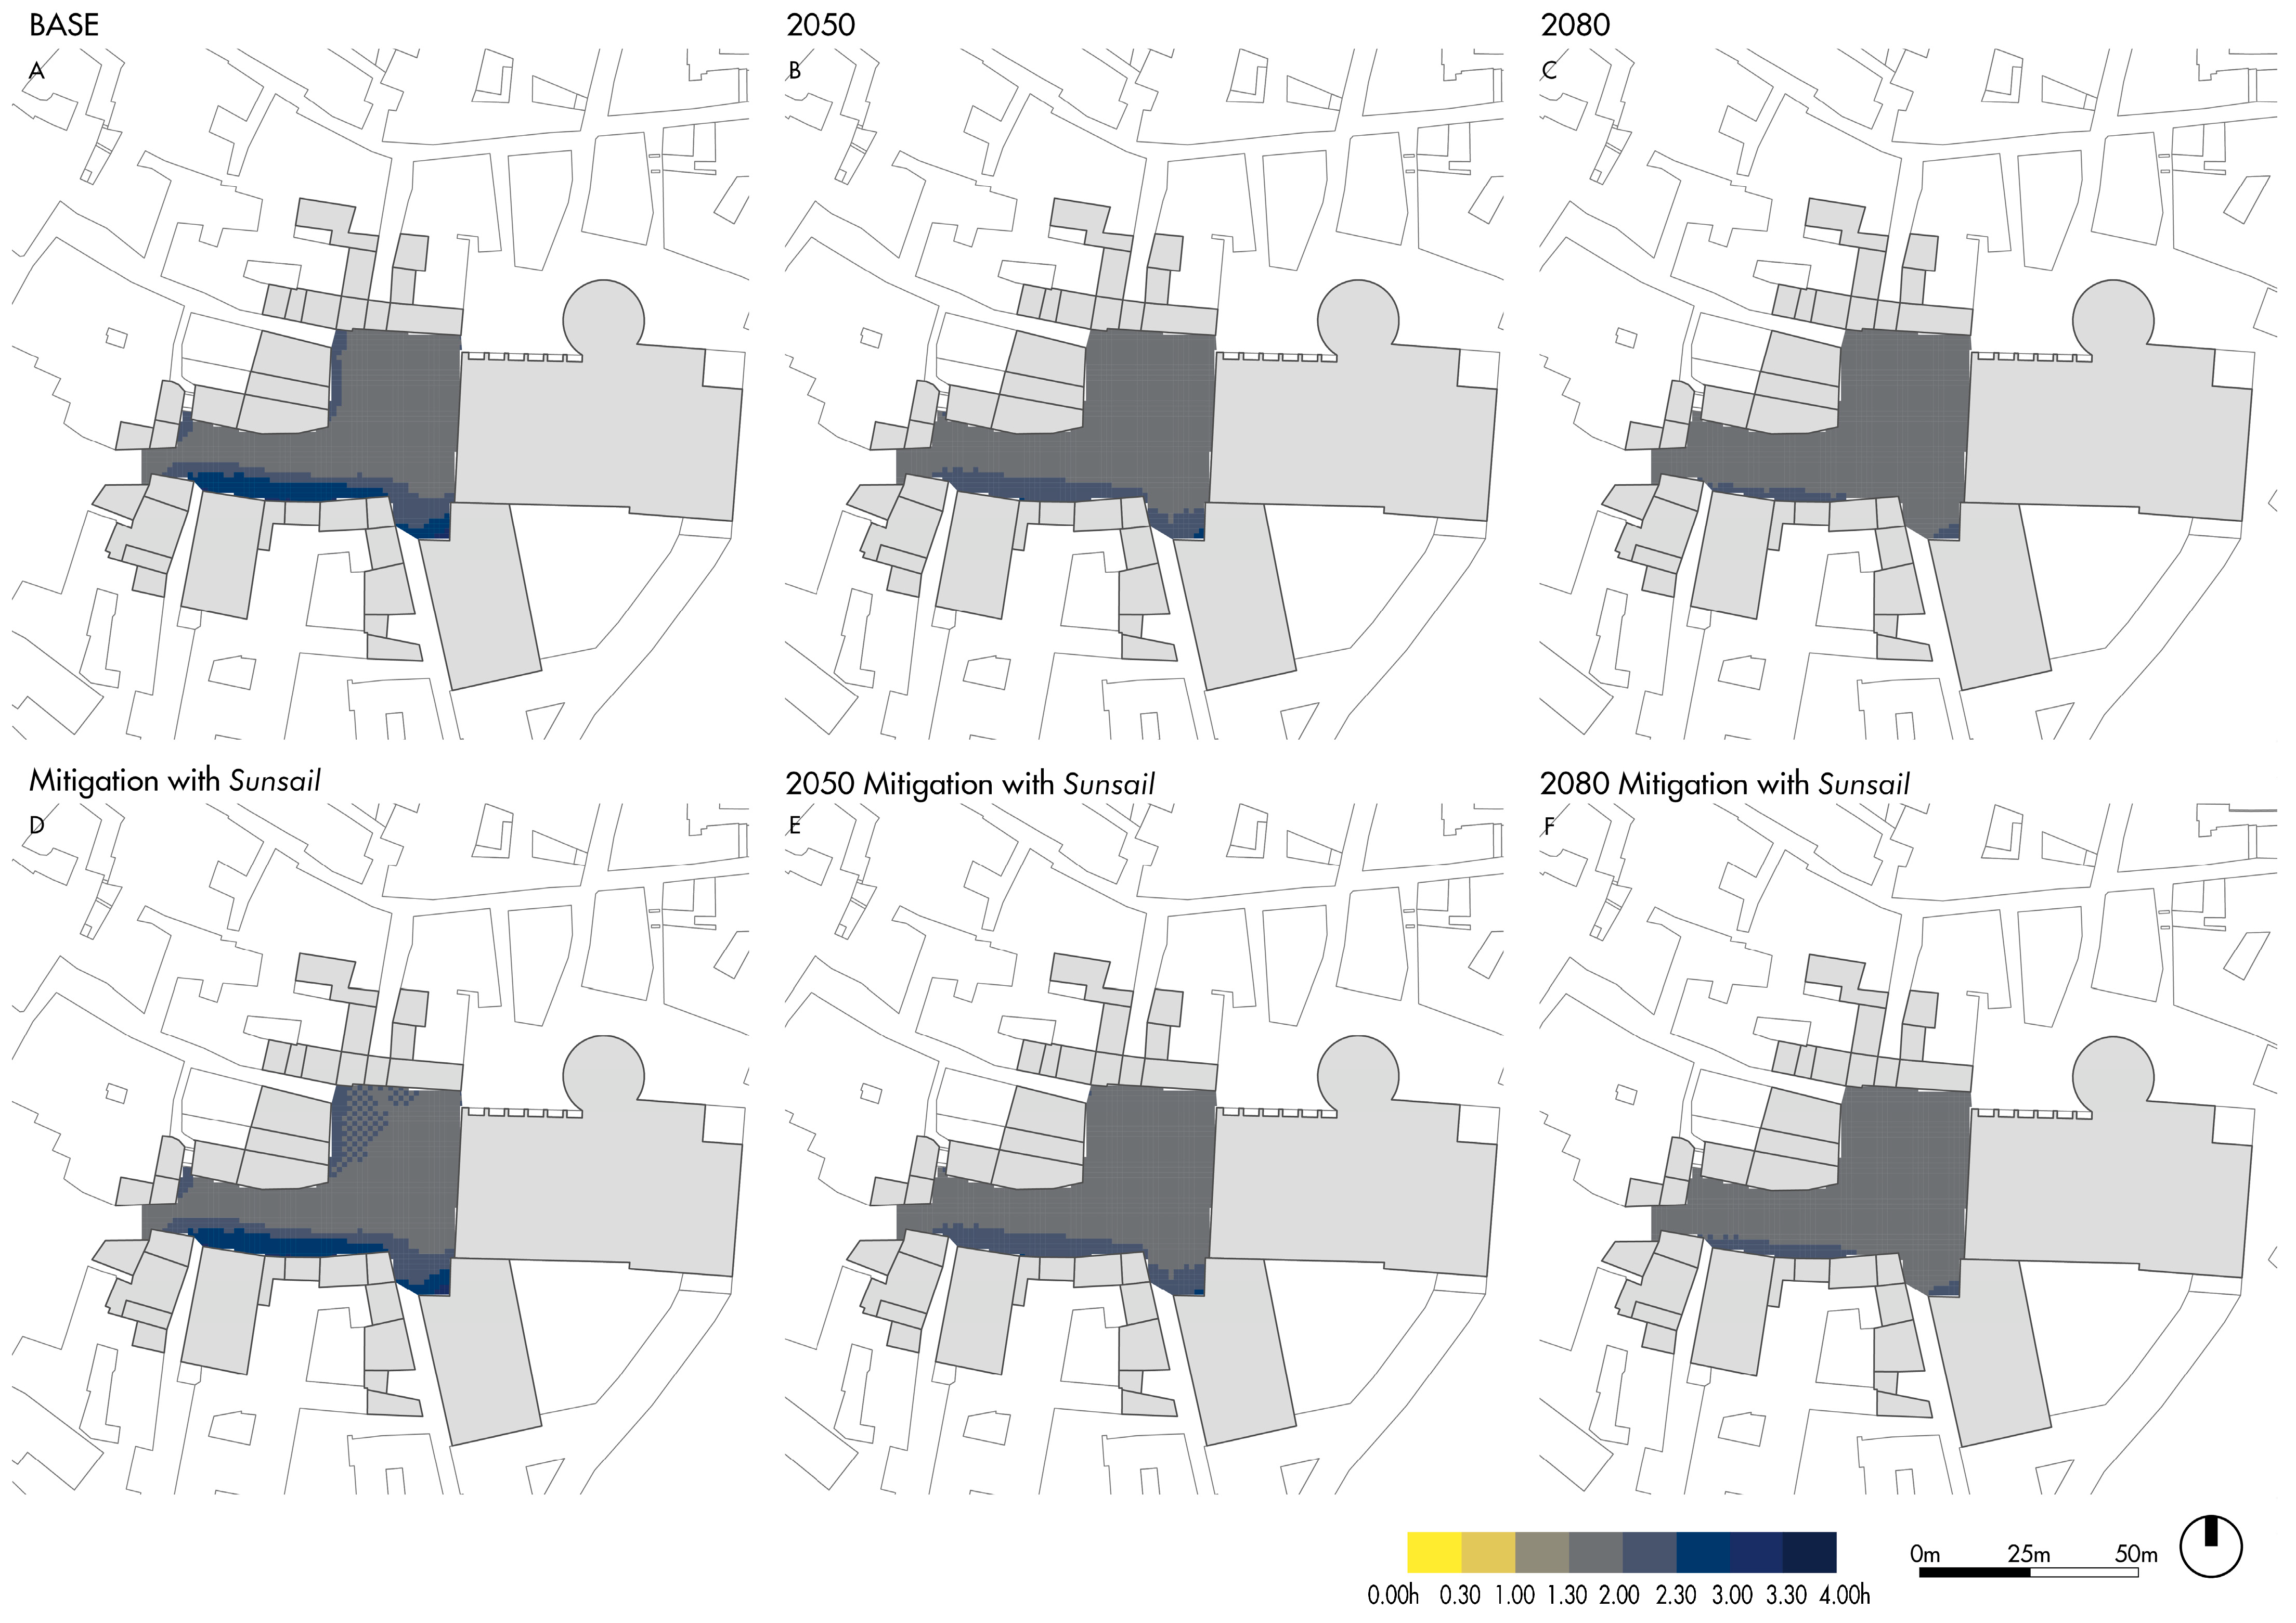
The maps of t1% for Piazza dell’Odegitria (Figure 8) reveal a consistent pattern of short exposure tolerances across all climate scenarios. In the pre-retrofit condition, most of the POS shows values close to 1.0–1.3 h, indicating that, under baseline climatic conditions, users may reach the dehydration threshold after approximately one hour of exposure. Slightly longer tolerable times (up to 2.0–2.3 h) are limited to localised façade-adjacent areas benefiting from partial shading. In future scenarios (2050 and 2080), most of the square shifts toward values below 1.0 h, confirming a marked intensification of heat-related dehydration risk. The post-retrofit simulations introduce a notable mitigation effect produced by the sunsails. In the shaded portion of the POS, t1% increases by approximately 0.3–0.5 h relative to the pre-retrofit condition. Across all scenarios, shaded areas consistently maintain higher exposure tolerances than unshaded zones. Overall, the mitigation strategy does not eliminate risk, but it significantly delays the onset of the dehydration threshold, especially in future climate scenarios where its contribution becomes proportionally more relevant.
The aggregated indicator t*1% shows a progressive reduction in safe exposure time from the baseline to future scenarios (Table 7). In the pre-retrofit condition, t*1% decreases from 1.41 h (baseline) to 1.31 h in 2050 and 1.21 h in 2080, confirming that users are expected to reach the dehydration threshold increasingly quickly under projected warming. The reduction in maximum values (from 2.46 h to 1.60 h) and in SS indicates that, in 2080, almost the entire square approaches uniformly critical conditions.
Table 8 also reports the WLPOS values for both transient (OO) and permanent (PO) users under future climate change scenarios. For Piazza dell’Odegitria, the comparison between pre- and post-mitigation scenarios shows that WLPOS varies only marginally following the installation of the sunsails: the maximum improvement corresponds to a reduction of approximately 3% in the 2050 scenario with shading.
This limited variation reflects the open morphology of the POS, which constrains the overall effectiveness of localised shading interventions. As a result, the minimum recorded t1% values remain unchanged in all scenarios (1.15 h), indicating that the most critical sectors of the square are only minimally influenced by mitigation. The post-mitigation simulations show a modest but consistent improvement due to the sunsails. t*1% increases slightly in all scenarios (e.g., from 1.41 h to 1.46 h in the baseline; 1.21 h to 1.22 h in 2080).
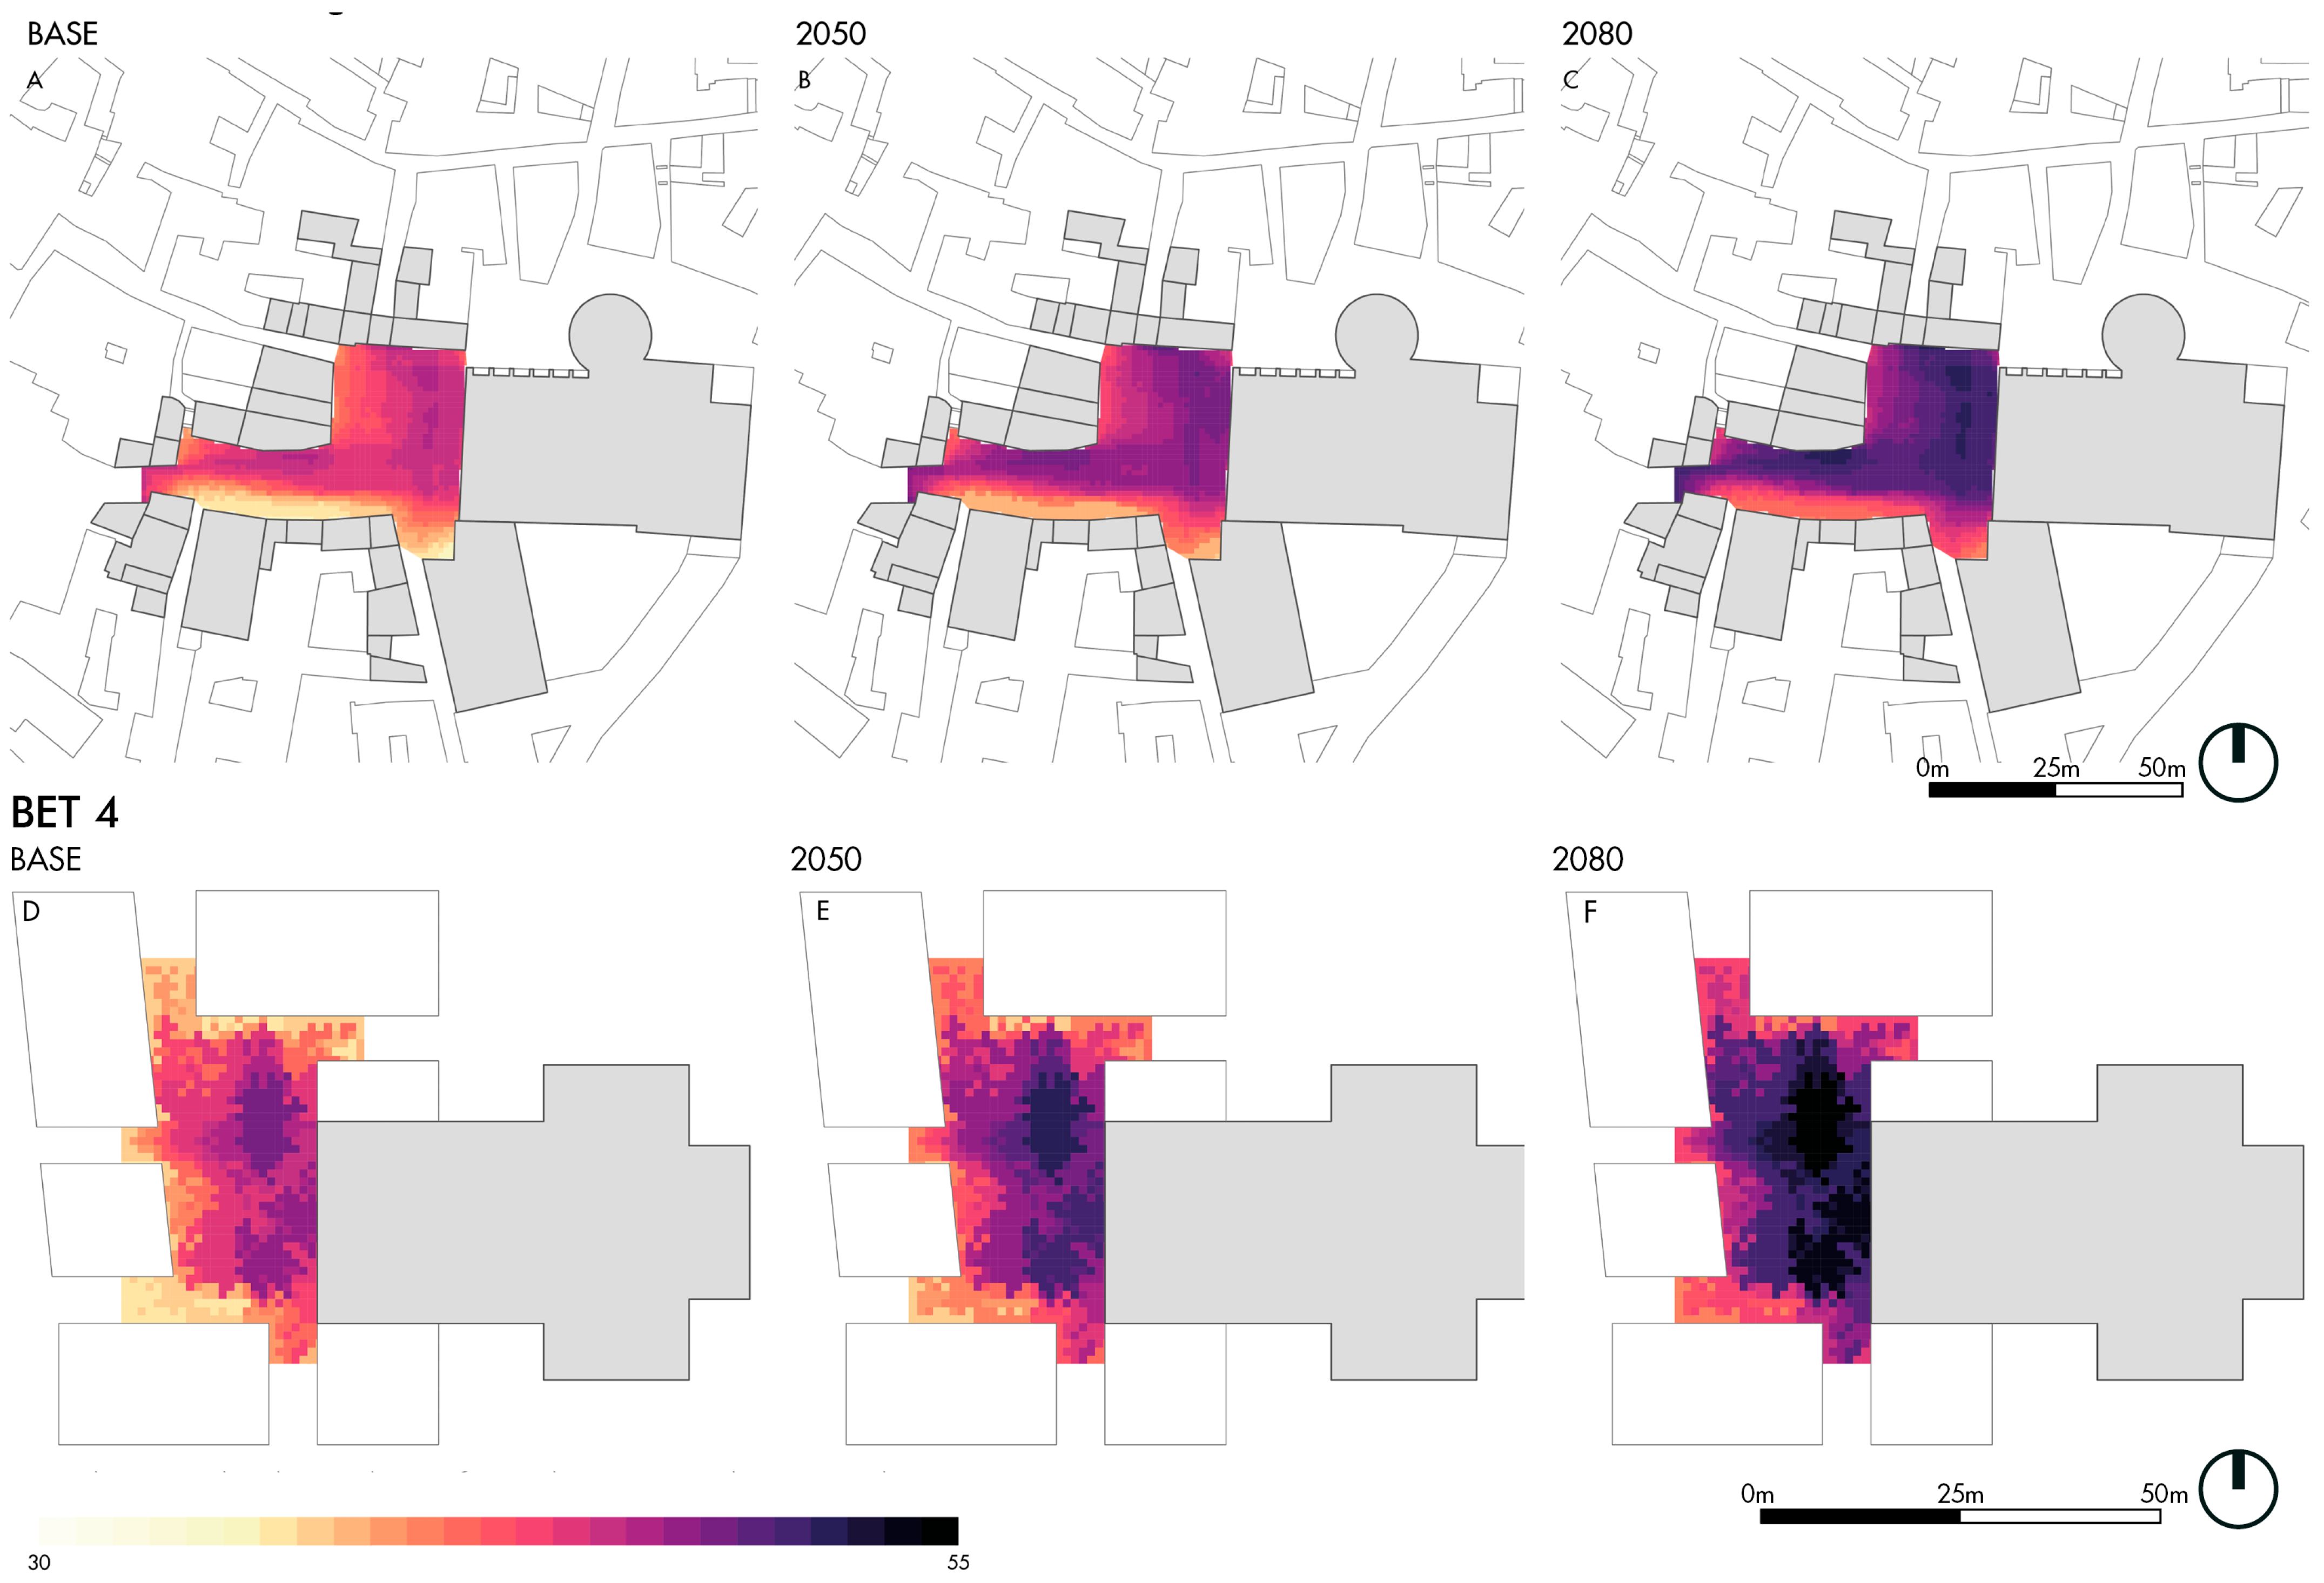
Considering the POS-BET comparison, Figure 9 shows that the spatial patterns of the UTCI simulated for Piazza dell’Odegitria closely mirror those produced for BET4 across all scenarios, including the increasing severity of heat stress toward the future time horizons.
In both the POS and the BET, the highest UTCI values occur in the portion of the square facing the cathedral, especially near the dehor area, where shading is limited and direct solar exposure is sustained during the analysed hours. Peak UTCI values reach approximately 44 °C in the baseline and progressively increase to about 46 °C in 2050 and 48 °C in 2080, confirming the high thermal load affecting this area. It should be noted that the UTCI maps shown in Figure 9 correspond to the same simulations presented in Figure 7 (top row), reported here to allow a direct visual comparison with the BET4 results.
Table 9 summarises the values of the spatially averaged water loss indicator (WLPOS) for Piazza dell’Odegitria and for BET4 across the three climate scenarios, distinguishing between transient users (OO, t ≤ 15 min) and permanent users (PO, t ≥ 15 min). The table also reports percentage differences for both POS–BET and climate scenario comparisons. The WLPOS values reported for Piazza dell’Odegitria are the same as those previously discussed in the analysis of mitigation effects. They are reproduced here to ensure consistency and comparability within the POS–BET framework.

4.2. Results on Largo Regina Coeli, Napoli, and BET Comparison

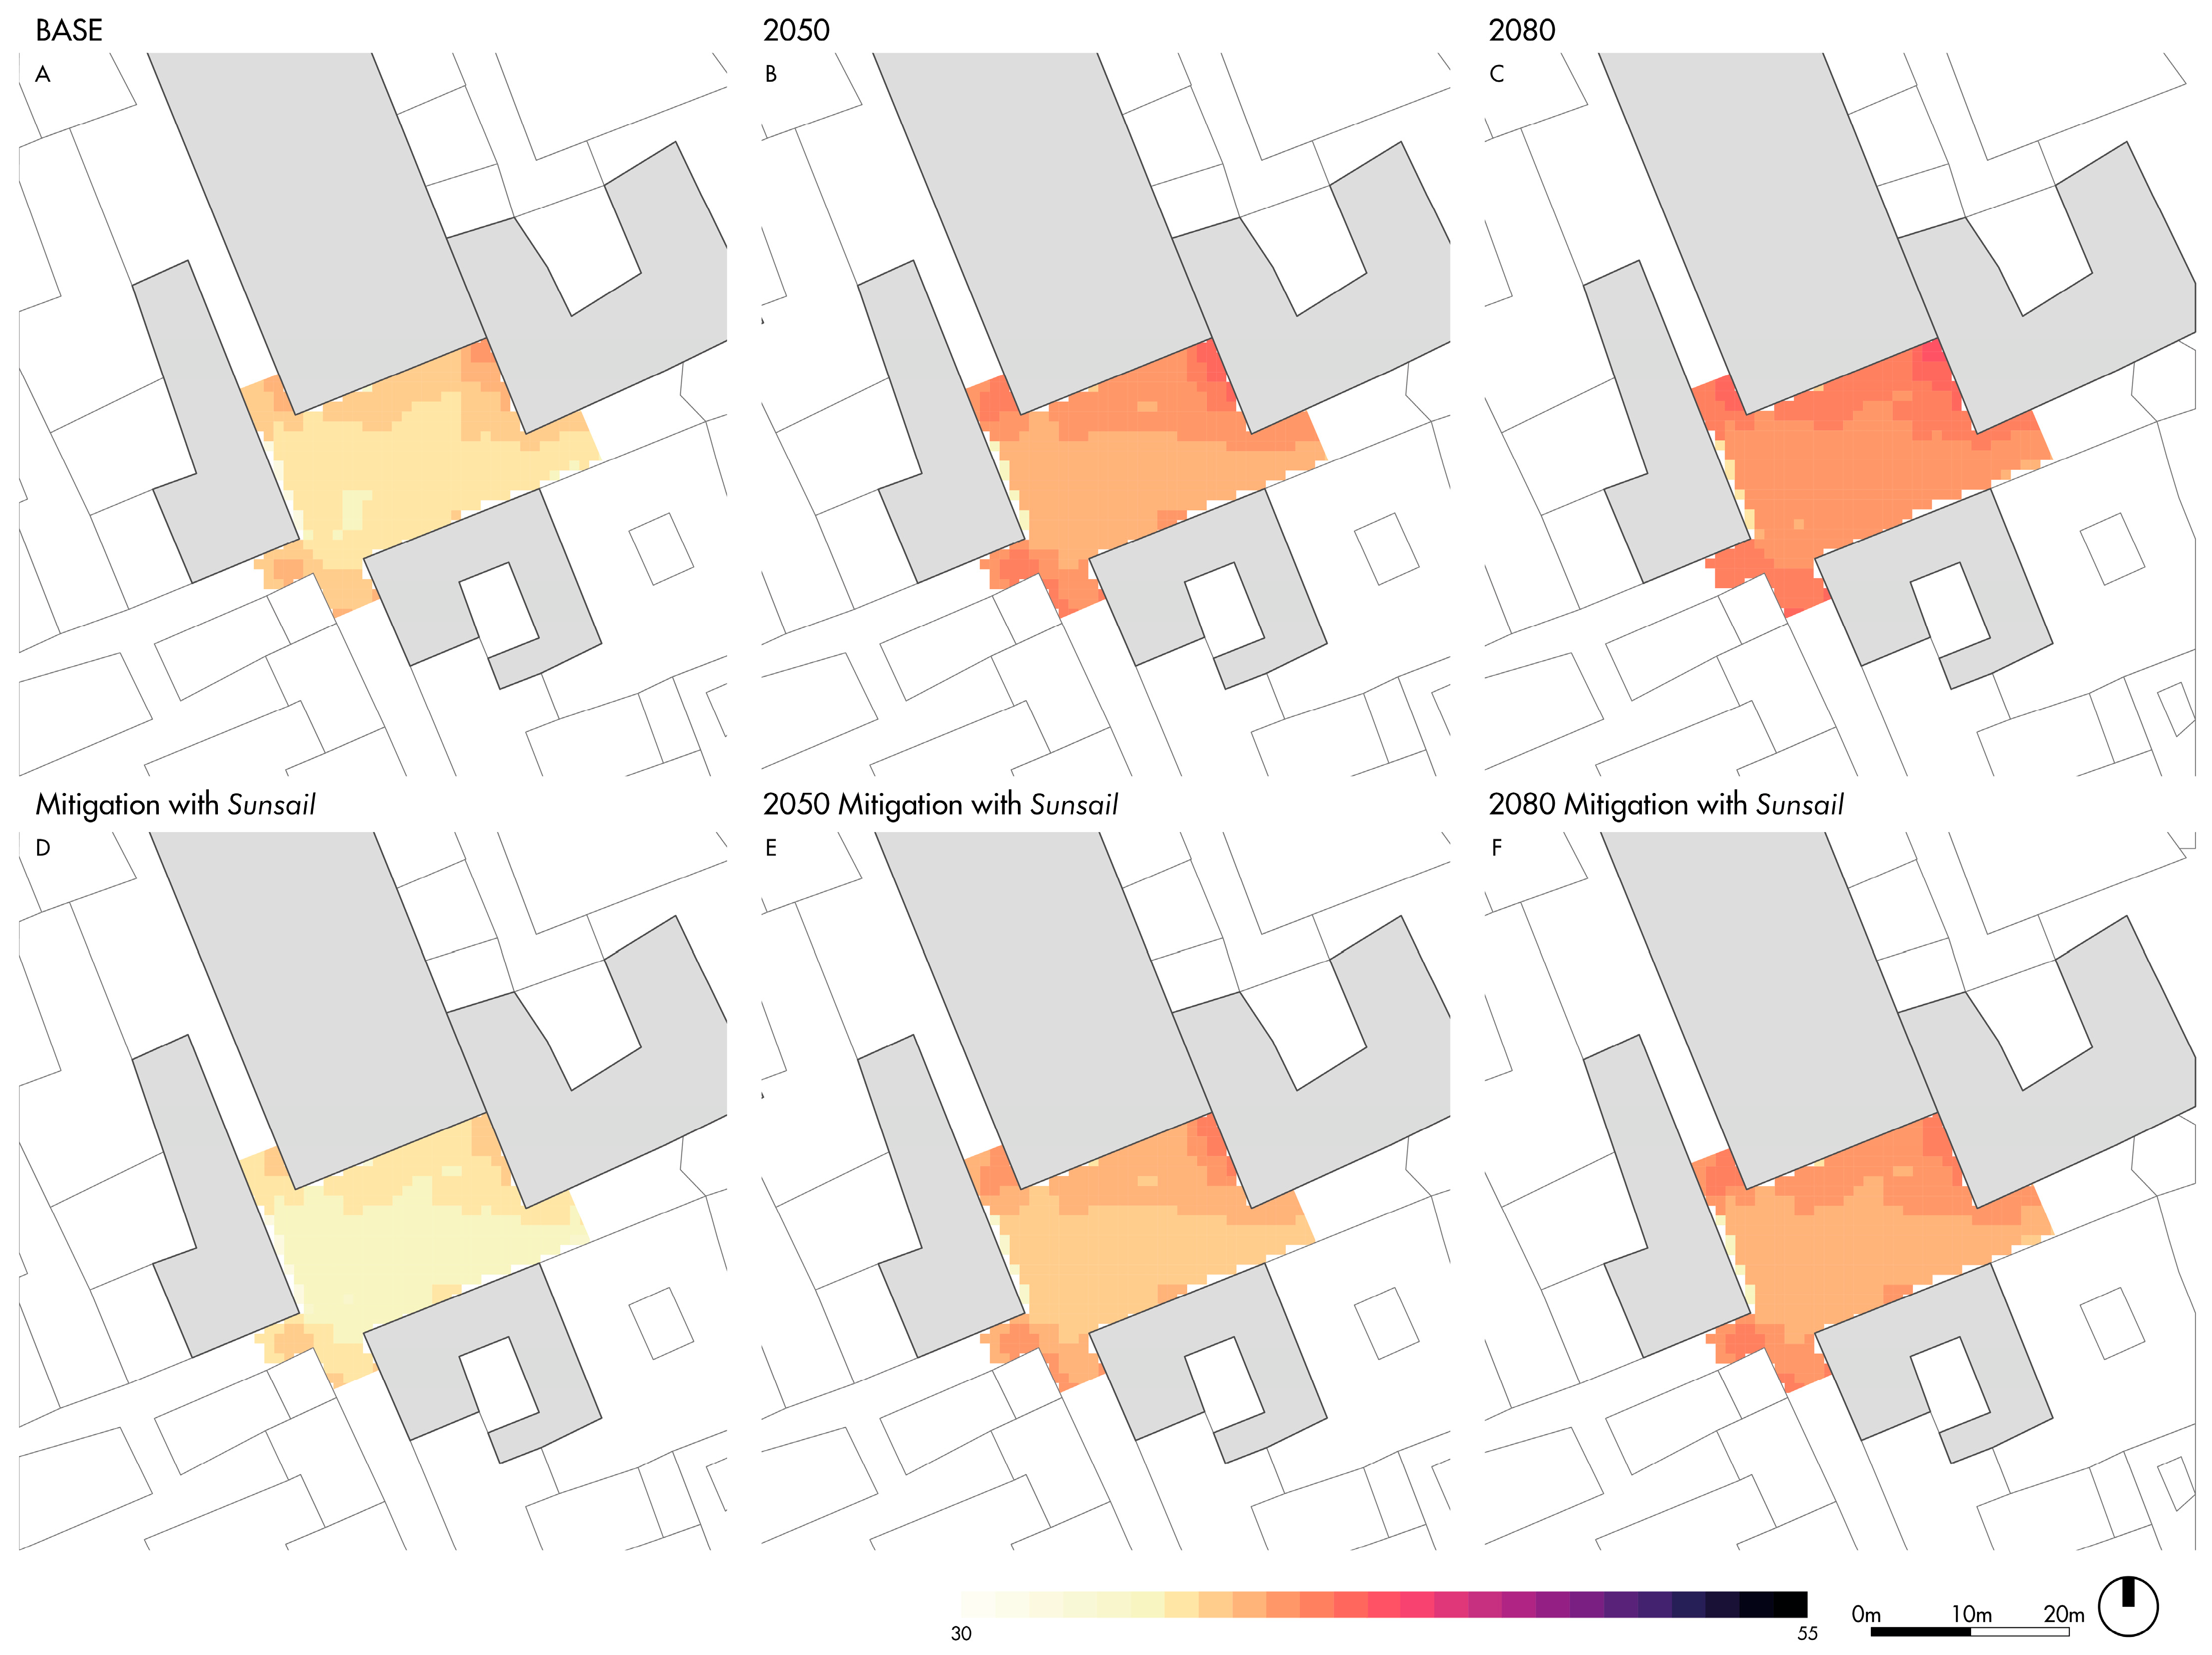
Pre- and post-retrofit results are first presented according to the microscale level in Figure 10.
Although absolute values remain lower than those observed in Bari, the spatial pattern confirms the presence of thermally stressed areas, particularly under future climate projections. The introduction of the sunsails in the post-retrofit simulations results in a decrease in the UTCI within the shaded zone, with the most substantial reductions occurring in the central open area where users are most exposed. The mitigation effect becomes more evident in future scenarios, where the sunsails partially offset projected climatic warming by maintaining lower UTCI classes. In fact, across all scenarios, UTCI values within the area covered by the sunsails decrease by approximately 2–3 °C, depending on the scenario. The cooling footprint is spatially well defined, and while the remainder of the square remains influenced by high background temperatures, the intervention consistently provides a meaningful reduction in heat stress within its coverage area. Overall, the sunsails also reduce heat stress in Largo Regina Coeli, although with a more modest magnitude than in Bari due to the already more shaded and ventilated configuration of the square.
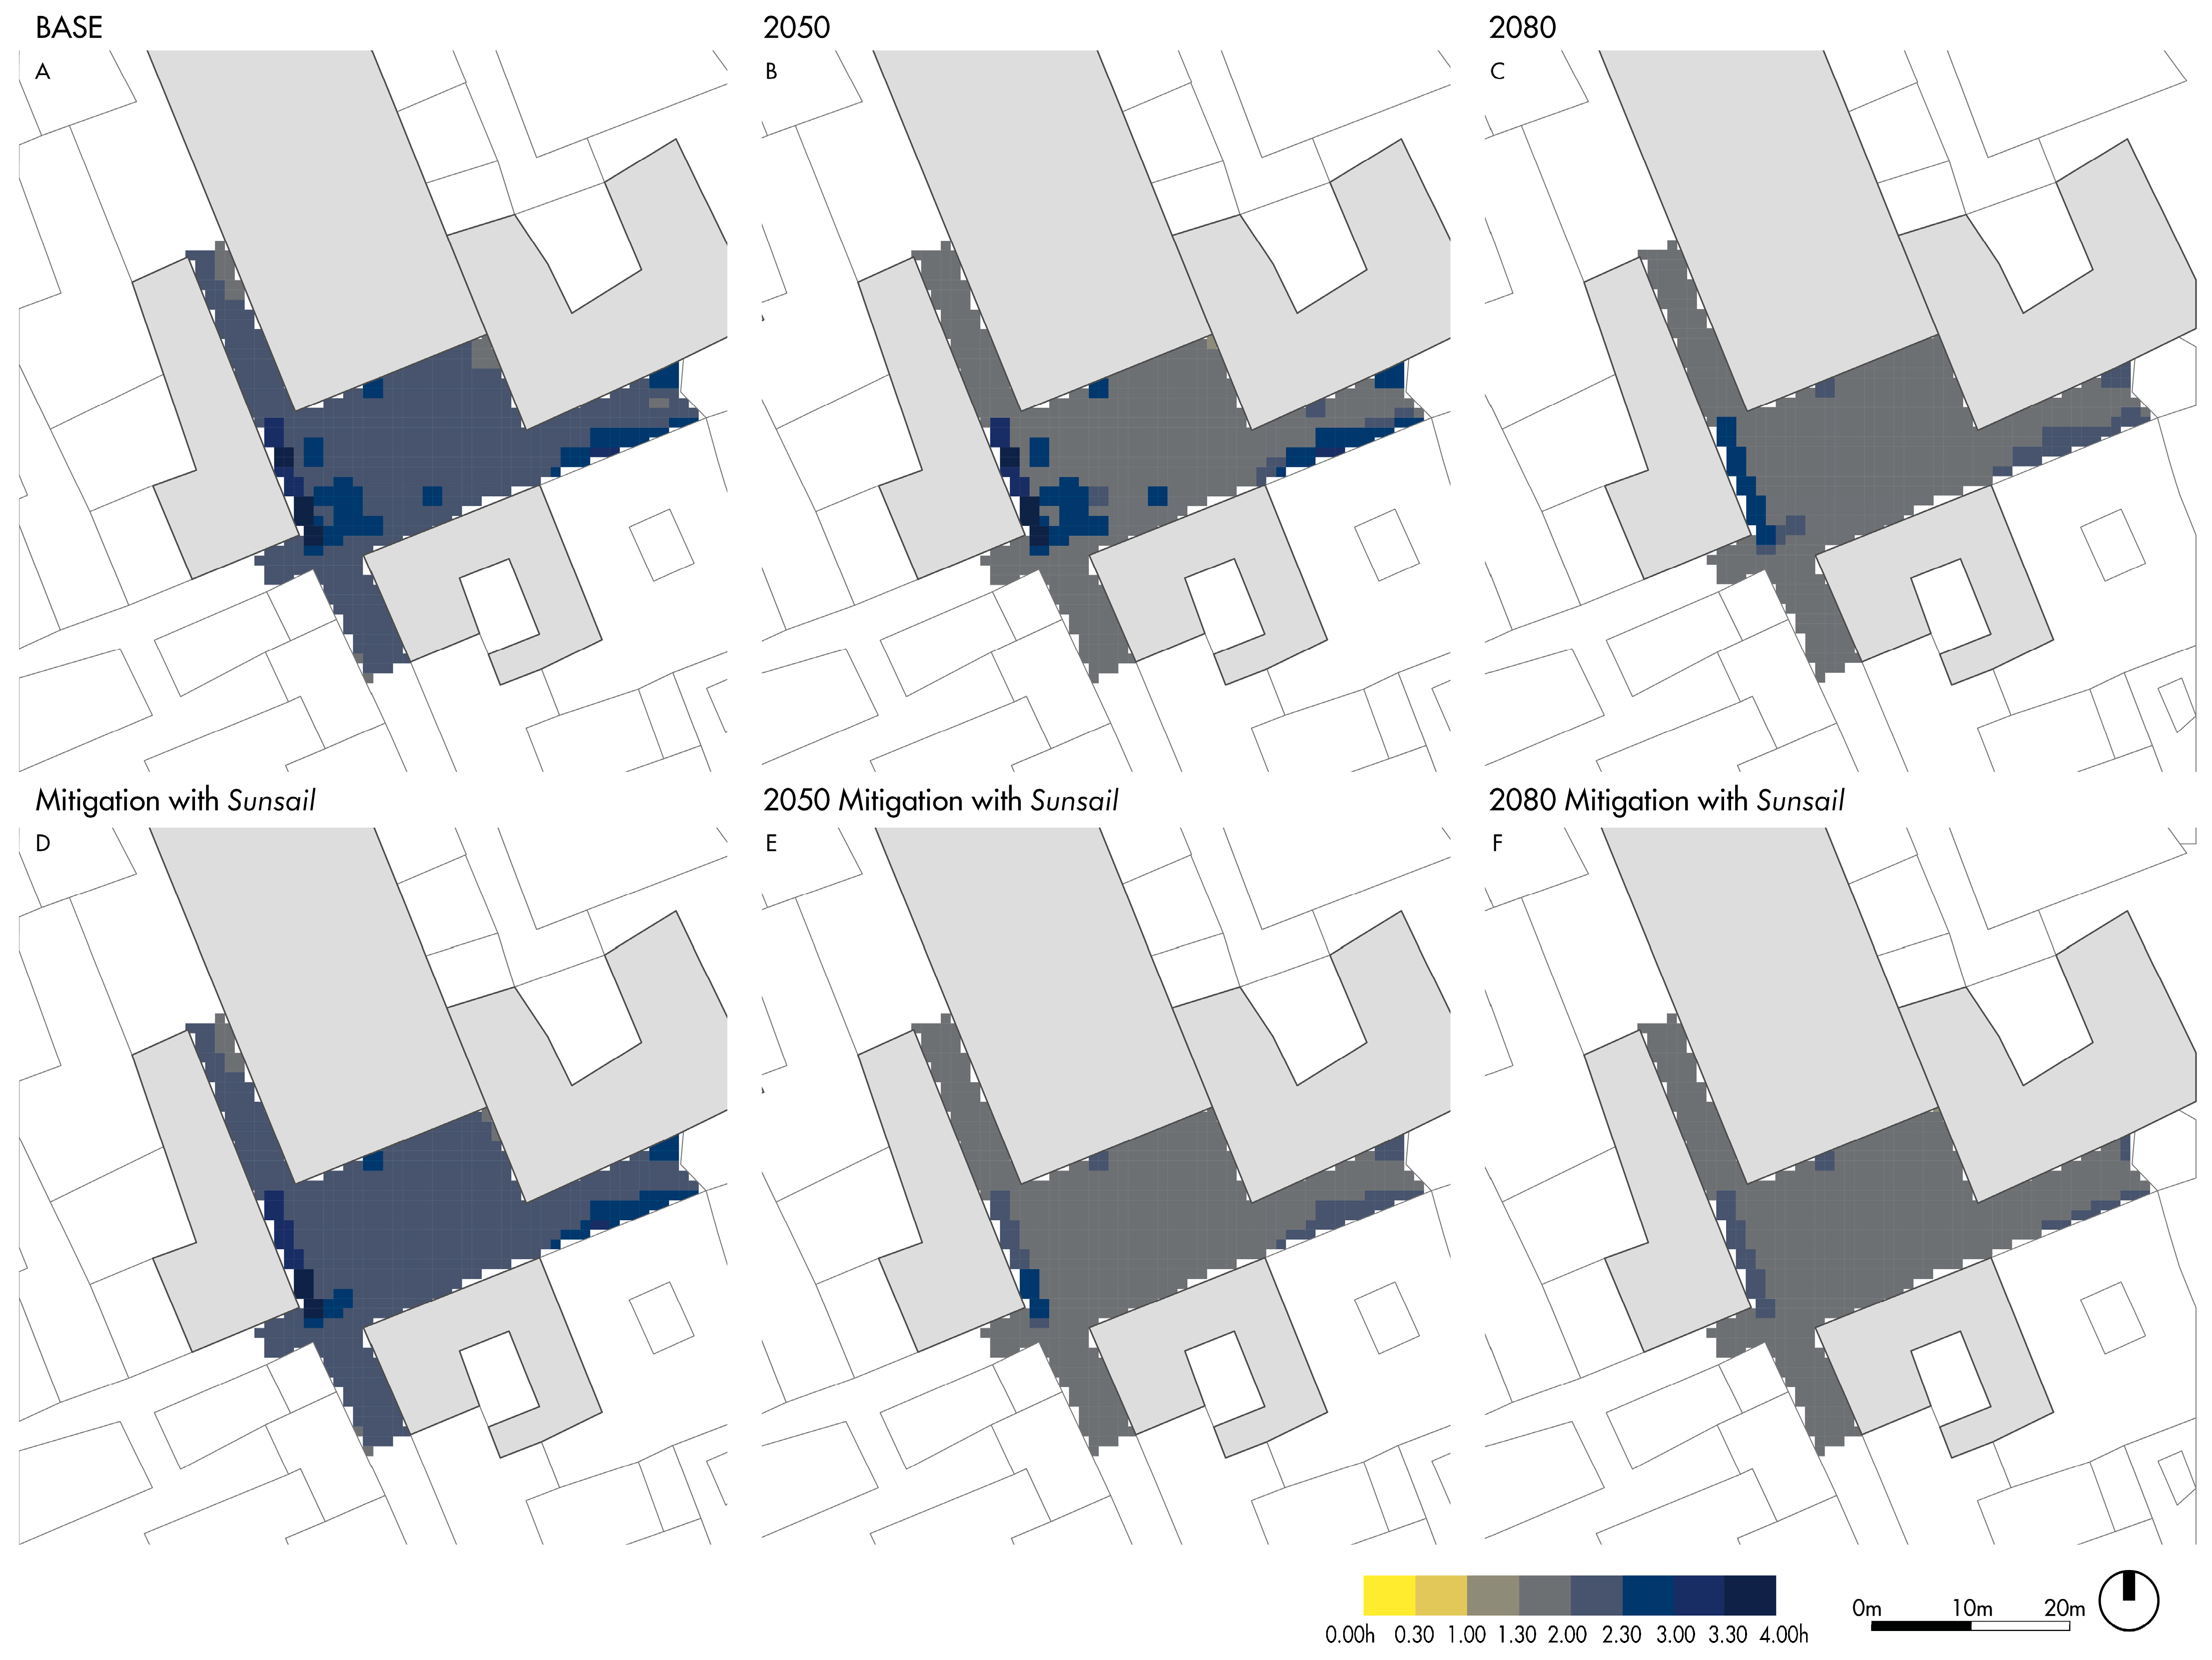
The behaviour of t1% in Largo Regina Coeli (Figure 11) is hence consistent with the UTCI results, although higher tolerable times are observed compared with Bari.
In the pre-retrofit condition, the baseline scenario shows exposure durations mostly between 1.3 and 2.0 h, with some zones approaching 2.3 h in areas benefiting from shading and favourable airflow. In the 2050 and 2080 scenarios, the central portion of the POS shifts toward 1.0–1.3 h, while only a small area retains values near 1.8–2.0 h. Under post-retrofit conditions, the sunsails provide a noticeable but spatially confined improvement In the baseline scenario, shaded areas reach t1% values of approximately 1.8–2.3 h, compared with 1.3–1.8 h without mitigation. In the 2050 scenario, mitigated areas predominantly remain in the 1.3–1.8 h range instead of dropping toward 1.0–1.3 h. Even in 2080, the sunsails stabilise t1% around 1.0–1.3 h in the shaded cells, whereas unshaded areas fall closer to 0.7–1.0 h. Overall, the sunsails extend safe exposure duration by approximately 0.3–0.5 h, a smaller but still meaningful effect compared to Bari, due to the more compact and shaded morphology of the square.
The aggregated indicator t*1% highlights a progressive reduction in safe exposure times across future climate scenarios (Table 10). Under pre-retrofit conditions, the baseline value of 2.30 h decreases to 1.86 h in 2050 and stabilises around 1.83 h in 2080. This reduction reflects the increasing difficulty for users to tolerate outdoor heat without reaching the 1% dehydration threshold. Maximum values also decline (from 3.68 h to 2.61 h), indicating that even the most favourable micro-locations become less resilient under projected warming. Then, Table 11 reports the WLPOS values for both transient (OO) and permanent (PO) users under future climate change scenarios. The comparison between pre- and post-mitigation scenarios shows that WLPOS remains largely stable, due to the limited size and compact layout of Largo Regina Coeli, which restrict the extent of shading achievable by the sunsails. Only minor variations are observed between pre- and post-retrofit conditions across all scenarios.
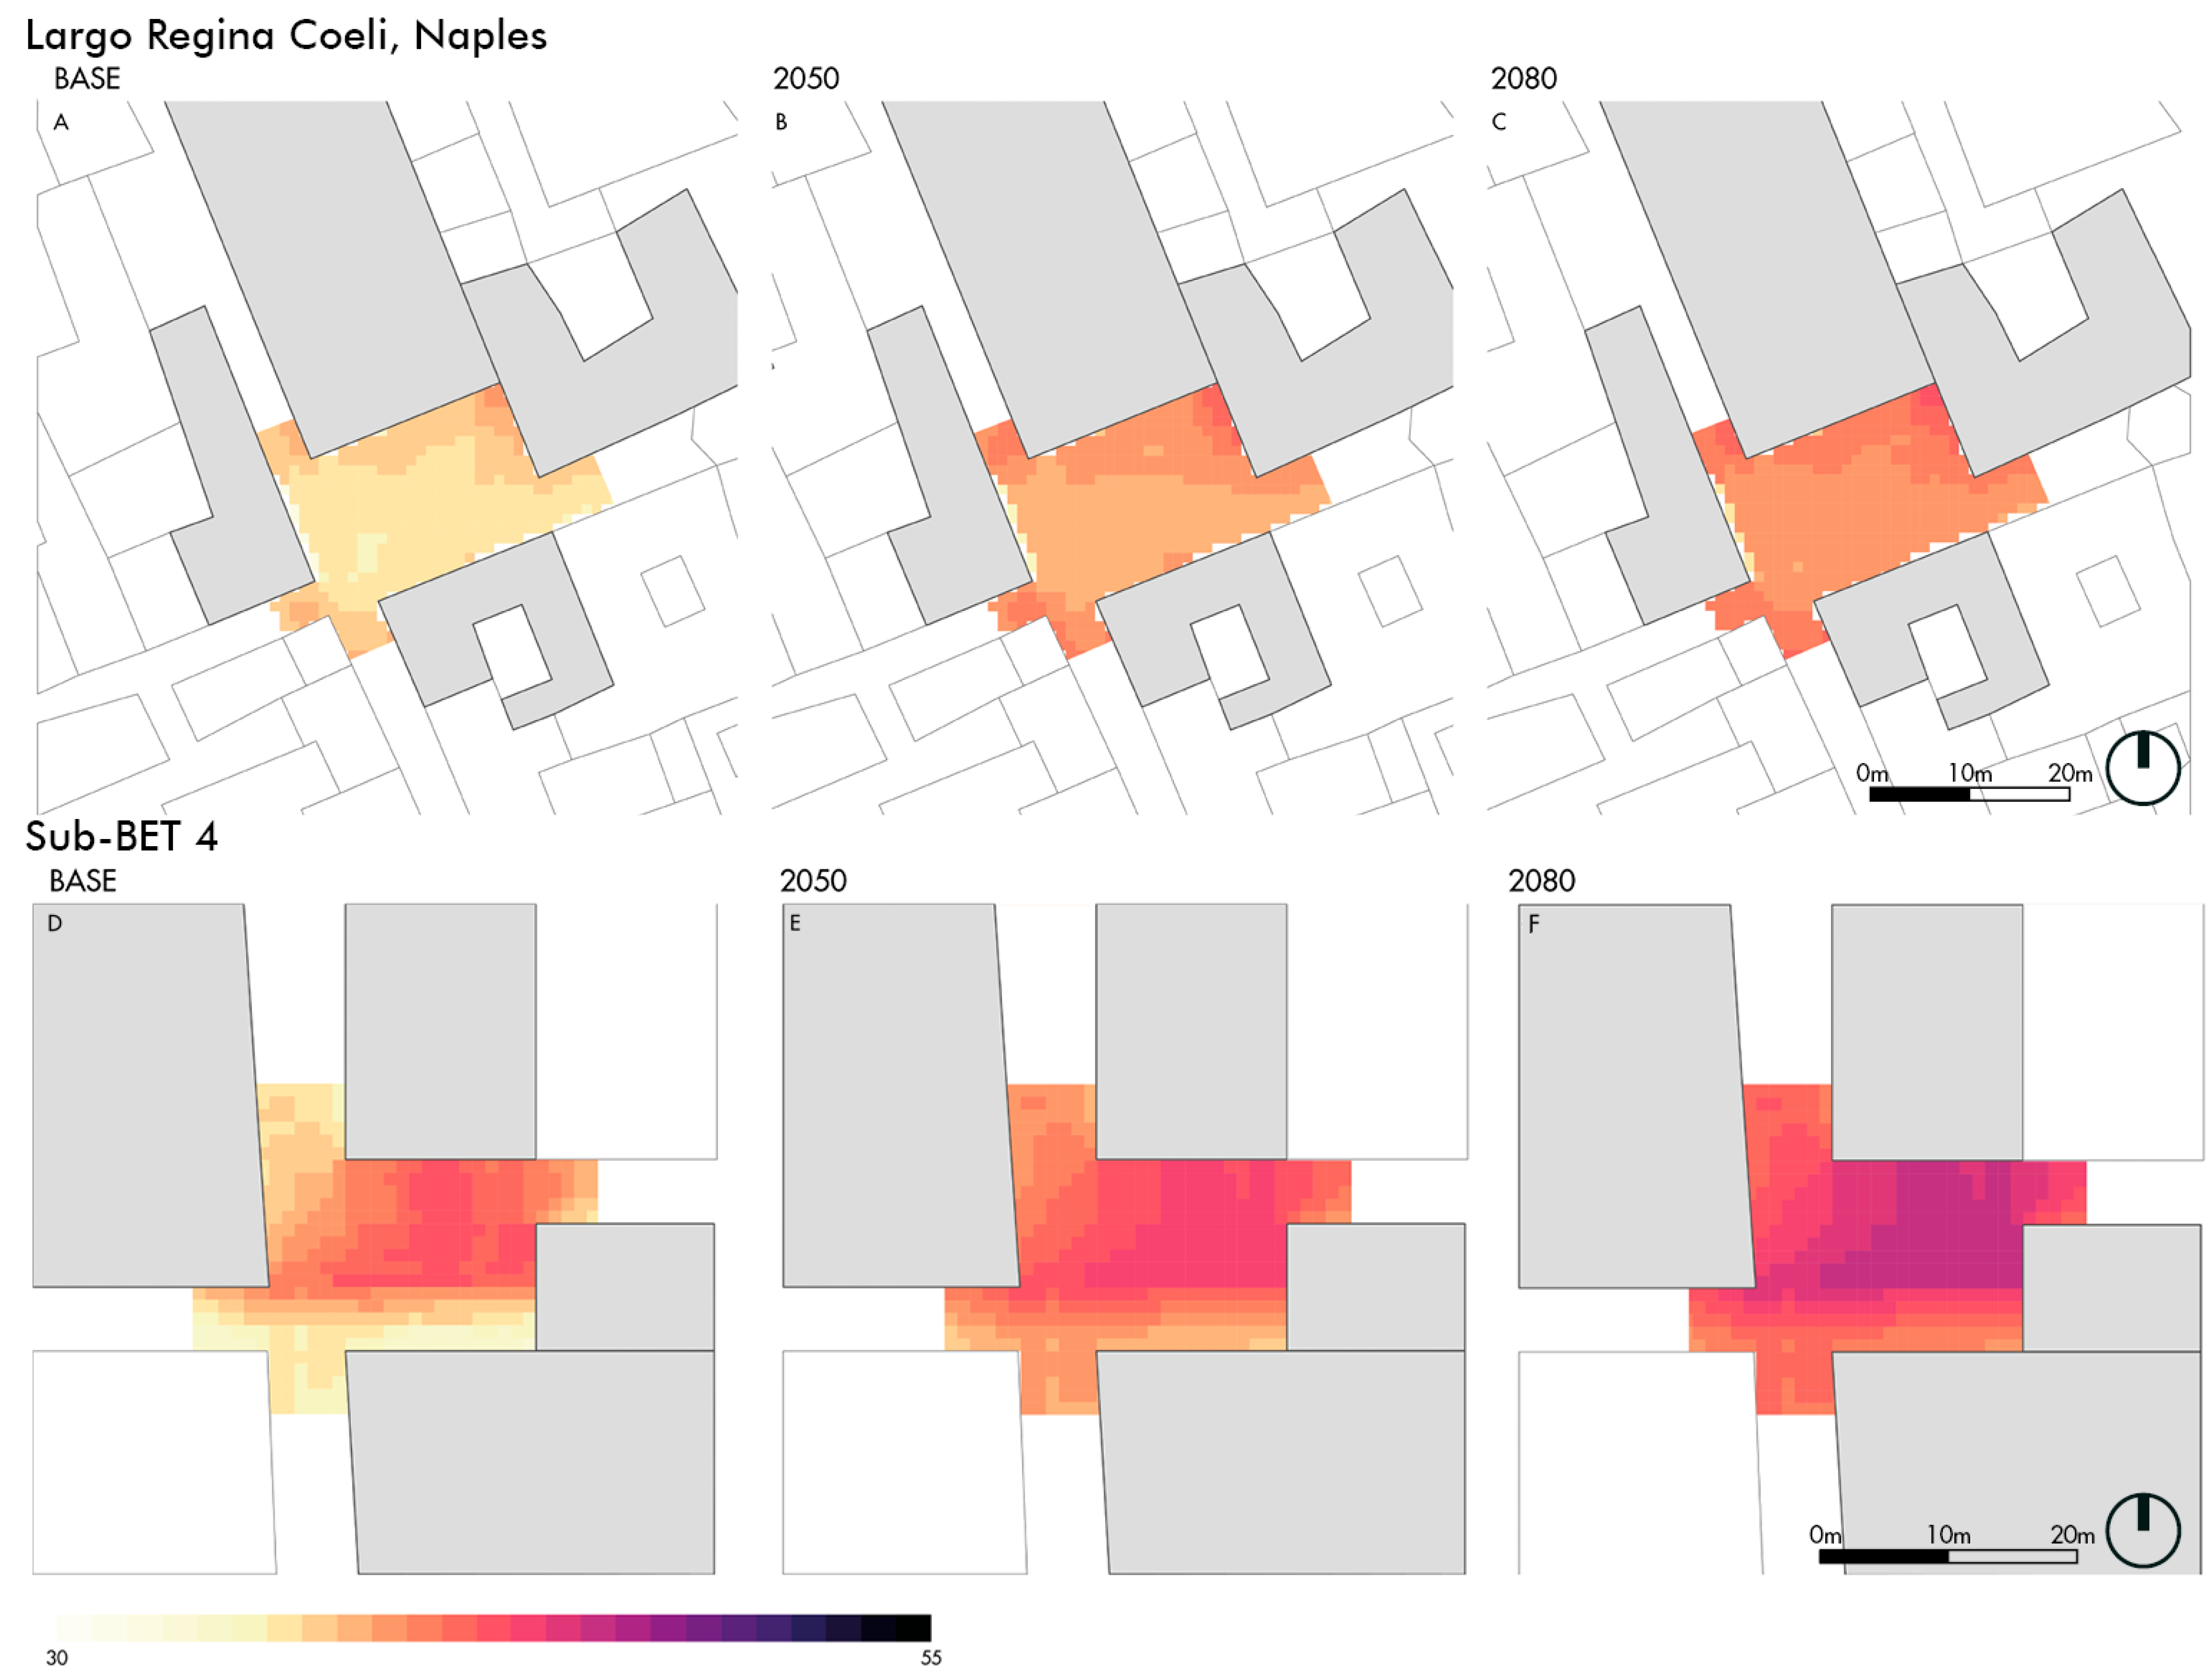
After analysing mitigation effects, results from Largo Regina Coeli and its typological counterpart sub-BET4 are provided. The UTCI maps in Figure 12 show that Largo Regina Coeli and sub-BET4 exhibit similar spatial patterns and trends of increasing heat stress across future scenarios.
In both Largo Regina Coeli and sub-BET 4, the area directly in front of the church façade is the most exposed to high heat stress. The UTCI values progressively increase across future climate change scenarios, showing comparable overall magnitudes between the POS and its typological counterpart. It should be noted that the UTCI maps for Largo Regina Coeli shown in Figure 12 correspond to the same simulations already presented in the first row of Figure 10; they are reproduced here to facilitate direct comparison with the sub-BET4 results.
Table 12 reports the values of WLPOS for transient users (OO, t ≤ 15 min) and permanent users (PO, t ≥ 15 min) across the three scenarios for both Largo Regina Coeli and the sub-BET4. Percentage differences are reported to compare POS–BET correspondence and climate scenario effects. The WLPOS values reported for Largo Regina Coeli are the same as those previously discussed in Table 11 and are reproduced here to ensure consistency within the POS–BET comparison.

5. Discussion

The results provide valuable insights into overheating risk assessment and mitigation for urban squares in historical environments, as discussed in Section 5.1. In particular, they suggest a multiscale assessment of the impact of mitigation strategies under different conditions (in view of RQ1) and illustrate how BETs could be representative of the tested POSs under current and future climate scenarios (in view of RQ2). In particular, considering RQ2, this work provides the basis for the replicability of the approach in a BET-based perspective (Section 5.2). At the same time, it also paves the way for future applications by decision makers and designers from the POS-based perspective (Section 5.2), although some limitations exist and need to be addressed by future works (Section 5.4).

5.1. Key Findings and Comparison Analysis by RQ

Considering RQ1, the proposed assessment methodology and indicators effectively highlight differences between pre- and post-mitigation scenarios at both the micro- and mesoscale levels. Simulations generally demonstrate how sunsails modify users’ heat stress exposure, while remaining compatible with heritage constraints. Nevertheless, some overall limitations in their effectiveness can be observed. On the one hand, the application of sunsails limits heat stress indicators by up to approximately 10%, especially under extreme future climate scenarios (i.e., 2080). On the other hand, microscale impacts prevail over mesoscale ones. In fact, the mitigation effects on the estimated exposure duration leading to a 1% reduction in body mass through sweating at the cell level (t1%) are significantly higher than those observed at the scale of the entire POS (expressed by t*1%). This difference is related to the aggregation process, which averages the impact across user age groups, resulting in differentiated effects depending on user-related factors under POS conditions. Some additional case-specific differences can be highlighted between the two POSs:
-
For Piazza dell’Odegitria, Bari (see Section 4.1), the most evident improvements concern maximum t1% values under future climate scenarios, indicating a local attenuation of extreme conditions. Although the overall improvement remains limited at the scale of the entire POS, these results clearly reflect the local cooling effect of the shading device, which enhances exposure tolerance in the most critical sectors. Standard deviation values remain nearly unchanged, indicating that mitigation shifts average conditions without substantially altering the spatial variability of risk. Overall, these results show that the sunsails provide a targeted but meaningful reduction in dehydration risk, particularly under future climatic conditions where exposure times become increasingly constrained.
-
For Largo Regina Coeli, Naples (see Section 4.2), improvements in maximum t1% values under future climate scenarios are more limited than in Bari, reflecting a generally lower sensitivity of the POS to extreme conditions due to its more compact configuration. However, unlike the Bari case, minimum t1% values also decreased slightly in Naples, highlighting that certain confined areas remain more vulnerable to heat stress despite mitigation. Overall, while the aggregate effect remains limited, the indicator captures a local delay in dehydration onset within shaded areas. Spatial variability, expressed through standard deviation and SS values, decreases from baseline to future scenarios, showing how the entire POS becomes more uniformly stressed under projected warming.
Considering RQ2, the current work preliminarily demonstrates the validation of BETs as archetypal tools for overheating risk assessment in urban squares, based on the comparison of results across the selected case studies and climate scenarios. In particular, the following findings can be highlighted:
-
For Piazza dell’Odegitria, Bari (see Section 4.1), POS–BET percentage differences remain below 10% across all climate scenarios, indicating a substantial affinity in thermo-physiological response. WLPOS values for the real POS are systematically slightly higher than those of BET4, but both the POS and the corresponding BET show increasing WLPOS values from baseline to future scenarios, reflecting the intensification of heat stress associated with rising UTCI values. The increase remains within approximately 10% for Piazza dell’Odegitria and up to about 15% for BET4, as mainly shown in Table 7. Despite minor quantitative differences, these results confirm that the POS and its archetype exhibit comparable trends and magnitudes of heat-induced water loss under future climate conditions.
-
For Largo Regina Coeli, Naples (see Section 4.2), POS–BET differences are more pronounced than in the Bari case, generally ranging between 10% and 20%, reflecting the stronger influence of localised microclimatic features in the real POS. Nevertheless, these differences remain within a range that supports satisfactory correspondence, with BET values providing a conservative approximation. Future climate scenarios induce marked increases in heat-induced water loss for both the POS and sub-BET4, exceeding 20% relative to baseline conditions, indicating a higher sensitivity to projected thermal intensification. These key findings, mainly reported in Table 8, confirm that sub-BET4 provides a sufficiently representative approximation of the thermal dynamics of Largo Regina Coeli under both current and future climate change conditions, supporting the use of BET-based typological models for preliminary assessments.

5.2. From Validation of BETs as Archetypal Tools to Reproducibility Implications

In this work, the attention is focused on a compact BET, namely BET4 [42]. Although this BET is derived as an archetype of urban squares in Italian historical city centres [42], its compactness, morphology, and construction features are also typical of historical city centres in the Mediterranean area [10,49,56,71,72]. In this sense, the selection of POSs, which are in the same geographical context, allows supporting the capabilities of the methods and the potential extendibility of results on BET4.
Both Piazza dell’Odegitria, Bari, and Largo Regina Coeli, Naples, exhibit spatial configurations, such as compactness, enclosure levels, and façade continuity, which correspond well with the features embedded in BET4 and its scaled sub-variant. The comparisons carried out across UTCI and WLPOS indicators show that BET4 and sub-BET4 effectively replicate the direction and magnitude of thermal stress trends observed in the real POSs, especially under future climate change scenarios. Although local morphological aspects in the real-world POSs (e.g., irregular enclosure, specific shading patterns, and airflow channelling) introduce small deviations in absolute values, the overall alignment between BET archetypes and real POSs confirms their suitability for preliminary risk assessment. Furthermore, BET values are always higher than the POS-related ones, suggesting that the adoption of archetypical scenarios could provide conservative results in common practices.
In view of the above, this work confirms that BET4 could be used to allow rapid simulation of heatwave vulnerabilities and provide early insights into how geometrical configurations influence microclimatic exposure, before extending the analysis to detailed case-specific modelling. Nevertheless, this study also points out the reliability of the BET-based application of the proposed framework, since it validates the usefulness of BETs as quick-to-apply diagnostic tools, capable of supporting early stage decision-making under limited data availability. In this sense, the framework could be replicated in other BET-related contexts and considering other BET–POS conditions, independently from the specific use of the spaces, while differences in building height and orientation, such as those related to churches, are acknowledged as factors influencing shading, wind flow, and thermal conditions. Indeed, these variations do not limit the framework’s transferability, as the BET-based methodology provides clear guidance for adapting the analysis to different orientations and urban configurations. At the same time, climate data for POSs and BETs are well structured in the whole simulation-based framework, comprising the connection with the urban square modelling thanks to different dimensions (compared with Section 2.1). Therefore, additional climatic data and future climate scenarios could substitute the ones adopted in this work, without altering the general structure of the framework, the simulation tool usage, and the user-oriented assessment goals. Scalability to other kinds of POSs (e.g., streets, riverfronts, and seaside avenues) is indeed guaranteed using the same micro-to-mesoscale standpoint [29]. Similarly, wider historical urban environment scales could still be explored. For instance, different BETs representing the aggregation of POSs in historical urban built environments could still be investigated by adopting the proposed framework. This can contribute to ranking and priority assessment in large settings, thus moving the attention of decision makers towards the urban planning dimension.

5.3. Implications for Stakeholders and Decision Makers

Beyond the methodological contribution, the findings of this study can be framed within broader climate resilience and adaptation frameworks for historic urban districts. In line with current approaches to urban resilience and disaster risk reduction, the proposed BET–POS workflow supports anticipatory, preventive, and low-regret adaptation strategies, which are increasingly advocated in climate-sensitive heritage management.
First, the typology-driven application of Built Environment Typologies (BETs) directly supports strategic planning and prioritisation processes. Municipalities and heritage authorities can adopt BET-based screening approaches to rapidly identify public open spaces that are most exposed to heat-related risks and to allocate resources accordingly. This contributes to the development of evidence-based adaptation pathways for historic districts, where financial, technical, and operational capacities are often constrained.
Second, the results demonstrate that reversible and heritage-compatible mitigation measures, such as suspended shading systems, can effectively reduce users’ heat exposure, even under future climate scenarios. This supports policy directions that promote adaptive reuse, reversibility, and minimal-impact interventions in protected environments. In practice, this suggests that local adaptation plans for historic centres should explicitly include “temporary and reversible climate-adaptation measures”, supported by simulation-based ex ante evaluations.
Third, the use of user-oriented indicators (UTCI, WLPOS, t1%, and t*1%) facilitates the translation of microclimatic analyses into metrics directly linked to public health, usability, and social equity. These indicators can be operationalised as performance criteria within local climate-adaptation guidelines, helping decision makers to define threshold-based priorities, for example, by identifying spaces where safe exposure time falls below critical values during heatwaves. Based on the empirical evidence provided by this study, several actionable recommendations can be proposed for practitioners and policymakers operating in heritage contexts:
-
Integrate typology-based screening tools (e.g., BETs) into preliminary vulnerability assessments for historic districts;
-
Require simulation-based evaluations of climate-adaptation measures prior to implementation, particularly in protected public spaces;
-
Prioritise reversible, lightweight, and visually compatible solutions as first-step adaptation options in heritage-sensitive environments;
-
Adopt user-centred thermal risk indicators within local adaptation plans to support transparent and health-oriented decision-making;
-
Promote the systematic inclusion of public open spaces in climate-adaptation policies, recognising their dual role as social infrastructures and critical exposure environments.
Overall, the proposed framework helps bridge the gap between microclimatic research and operational climate governance in historic urban environments, offering a scalable and decision-support-oriented approach for adaptation-driven heritage management.

5.4. Study Limitations and Directions for Future Research

Despite the robustness of the proposed workflow, several methodological limitations should be acknowledged. First, BETs represent simplified typological scenarios, and their abstraction smooths out finer spatial or material characteristics present in POSs. While adequate for preliminary assessments, BET-based analyses should be complemented with detailed case-specific simulations when intervention planning reaches more advanced stages [42].
Second, the climatic inputs rely on standardised climatic files and projected future scenarios that cannot fully capture local microclimatic variability or recent temperature escalations. The use of statistical meteorological data may underestimate real heat stress, especially in historic urban centres, where the increasing frequency and intensity of heatwaves in the Mediterranean region are not fully captured.
Third, the behavioural model employed for estimating thermal acceptability and water loss uses standardised user categories and population-weighted distributions [78]. Further research could refine these assumptions by integrating local demographic data, context-specific behavioural patterns, and potentially vulnerable groups (e.g., tourists unfamiliar with local climatic conditions).
Looking ahead, several developments could further strengthen and refine the proposed framework, also in view of the definition of user-centred, simulation-based approaches for climate resilience and adaptation in heritage contexts. A first possible direction concerns the exploration of a broader range of mitigation strategies, extending beyond sunsails to include other reversible and heritage-compatible solutions [10,25,52,68]. In this sense, structural solutions could include, but not be limited to, reflective pavements, temporary shading systems, evaporative devices, or selected forms of greenery. Such strategies could be assessed individually and in combination, thus comparing how the combination of different interventions could support redundancy in risk mitigation. This would also help clarify how different interventions interact in terms of shading, ventilation, and radiant heat reduction [79,80]. Another promising advancement lies in the integration of real-world monitoring data into the simulation and assessment process. Incorporating on-site microclimatic measurements and observed patterns of users’ presence would allow progressive calibration and validation of model outputs, reducing uncertainties in UTCI indicators, and ultimately strengthening the robustness of risk estimations. Finally, applying the methodology to additional climatic contexts and diverse historical settings would make it possible to test its transferability and understand how local environmental conditions influence heat exposure dynamics. Such comparative applications would contribute to shaping a more adaptable and widely usable framework for the preliminary assessment of heatwave risks in POSs [42].
Overall, the study confirms that typological modelling, combined with user-oriented heatwave risk indicators, offers a scalable and operational framework for assessing and mitigating heatwave impacts in both archetypal and historical POSs. For this reason, the comparative approach adopted in this study combines both levels of analysis. BETs provide an initial, idealised reference scenario, while POSs allow these assumptions to be validated and adapted to actual urban contexts. The POS–BET association provides the basis for comparing real-world conditions with the corresponding ideal configuration and for transferring mitigation strategies typically linked to BET4 into each specific POS.
For both the BET and the POSs, overheating risk was assessed by analysing microclimatic conditions, user exposure, and thermo-physiological indicators. Potential mitigations were then defined and tested under pre- and post-retrofit scenarios. The resulting metrics allow the evaluation of both the current level of heat stress and the expected reduction in risk following the implementation of the mitigation measures.
This integrated BET–POS approach, therefore, makes it possible to investigate how idealised typologies and urban spaces correspond, where they diverge, and to what extent mitigation strategies can be effectively transferred from archetypal models.

6. Conclusions

This study presented an integrated workflow for assessing heat-related risks in POSs of historical urban environments, combining microclimatic simulations, user-exposure modelling, and behavioural metrics such as sweat-derived water loss (WLPOS) and the aggregated dehydration indicator (t*1%). The comparison between POSs (Piazza dell’Odegitria in Bari and Largo Regina Coeli in Naples) and their corresponding typological archetypes, demonstrated that Built Environment Typologies can effectively support preliminary evaluations, offering a rapid and structured way to frame microclimatic vulnerabilities and anticipate the spatial distribution of heat stress before engaging in more detailed case-specific analyses. Results showed consistent trends between archetypes and POSs, confirming the reliability of BETs as diagnostic tools [42]. At the same time, simulations of mitigation scenarios highlighted the relevance of designing mitigation interventions compatible with historical settings; even lightweight and reversible solutions such as sunsails produced measurable benefits in terms of UTCI reduction and increased safe-exposure time (t1%), particularly in highly irradiated zones. These findings underscore the importance of integrating microclimatic evidence into conservation-aware planning processes, where thermal comfort, cultural heritage constraints, and user safety must coexist [68,69].
The workflow presented here can be applied to a wide range of historical contexts, supporting both rapid screening and more targeted evaluations of heatwave vulnerabilities. Moreover, while this study focused specifically on heat stress, the same methodological structure can be extended toward a multi-risk perspective [5]. Developing such an integrated view will be essential for future climate-resilient planning in dense historical areas, where interventions must remain lightweight, reversible, and fully compatible with cultural heritage requirements. In fact, the overheating assessment explored in this study, can be combined with analyses on other SUODs, such as air pollution [7,81], as well as with user vulnerability and exposure to additional hazards in POSs, including seismic risk, flood risk, terrorist attacks, or mass gathering conditions [5].
Finally, the results confirm that the proposed approach offers a robust and transferable basis for informing planning decisions, supporting heritage-sensitive mitigation design, and guiding public administrations toward proactive strategies to safeguard the health and well-being of urban users under evolving climatic conditions.

Author Contributions

Conceptualization, G.B., E.Q., E.C. and F.F.; methodology, G.B., E.C., E.Q. and F.F.; software, C.A. and E.C.; validation, G.B. and E.C.; formal analysis, C.A. and E.C.; investigation, G.B., C.A. and E.C.; resources, F.F. and E.C.; data curation, C.A. and E.C.; writing—original draft preparation, C.A. and E.C.; writing—review and editing, G.B., E.Q. and F.F.; visualisation, C.A. and E.C.; supervision, E.Q. and F.F.; project administration, E.Q. and F.F.; funding acquisition, E.Q. and F.F. All authors have read and agreed to the published version of the manuscript.

Funding

This research has received funding under the project ReACT (“(planning) Resilient urban and metropolitAn built environments through inClusive mulTi-risk behavioural-based models and simulations”, project code PE0000005, CUP E63C22002000002—funded under the National Recovery and Resilience Plan (NRRP), Mission 4 Component 2 Investment 1.3 (“Partenariati estesi alle università, ai centri di ricerca, alle aziende per il finanziamento di progetti di ricerca di base”) funded by the European Union—NextGenerationEU, Italian Ministry of University, according to the call for tended “Decreto Direttoriale No. 341 of 15 March 2022”, project “Multi-Risk sciEnce for resilienT commUnities undeR a changiNg climate (RETURN)”, code PE0000005—CUP, Concession Decree (Decreto Direttoriale) No. 1552 of 11 October 2022, within the “BANDO a CASCATA” of Spoke 5 TS1 “Insediamenti Urbani e Metropolitani”, with relation to the ReACT Concession Decree (Decreto Rettorale di concessione del finanziamento) DR/2025/107 of 13 January 2025 from Università Federico II di Napoli as Spoke.

Data Availability Statement

Essential data are reported in this work. Additional data is available upon reasonable request from the authors.

Conflicts of Interest

The authors declare no conflicts of interest.

Abbreviations

The following abbreviations are used in this manuscript:
UHIUrban Heat Island
BETBuilt Environment Typology
POSPublic Open Space
SLODsSlow-Onset Disasters
UTCIUniversal Thermal Climate Index
WLWater Loss
GISGeographic Information System
TMYTypical Meteorological Year
PAThermal acceptability probability parameter
CFDComputational Fluid Dynamics
RQResearch Question
IPCCIntergovernmental Panel on Climate Change
DTMDigital Terrain Model
DSMDigital Surface Model
CTRRegional Technical Cartography
OOOnly Outdoor
POPrevalent Outdoor
TUToddlers
PCParent-assisted children
YAYoung Adults
AUAdults
EUElderly

References

  1. Dimabayao, J.J.; Lara, J.L.; Canoura, L.G.; Solheim, S. Integrating Climate Risk in Cultural Heritage: A Critical Review of Assessment Frameworks. Heritage 2025, 8, 312. [Google Scholar] [CrossRef] [Scilit]
  2. Tringa, E.; Georgoulias, A.K.; Akritidis, D.; Feidas, H.; Zanis, P. Assessing the Future Risk of Damage to European Cultural Heritage Due to Climate Change. Heritage 2025, 8, 175. [Google Scholar] [CrossRef] [Scilit]
  3. Adetunji, O.; Daly, C. Climate Risk Management in Cultural Heritage for Inclusive Adaptation Actions in Nigeria. Heritage 2024, 7, 1237–1264. [Google Scholar] [CrossRef] [Scilit]
  4. Cunha Ferreira, T.; Romão, X.; Freitas, P.M.; Mendonça, H. Risk Assessment and Vulnerability Analysis of a Coastal Concrete Heritage Structure. Heritage 2023, 6, 6153–6171. [Google Scholar] [CrossRef] [Scilit]
  5. Quagliarini, E.; Bernardini, G.; D’Orazio, M. How Could Increasing Temperature Scenarios Alter the Risk of Terrorist Acts in Different Historical Squares? A Simulation-Based Approach in Typological Italian Squares. Heritage 2023, 6, 5151–5188. [Google Scholar] [CrossRef] [Scilit]
  6. Buzási, A.; Pálvölgyi, T.; Csete, M.S. Assessment of Climate Change Performance of Urban Development Projects–Case of Budapest, Hungary. Cities 2021, 114, 103215. [Google Scholar] [CrossRef] [Scilit]
  7. Diego, J.; Cadena, B.; Salvalai, G.; Bernardini, G.; Quagliarini, E. Determining Behavioural-Based Risk to SLODs of Urban Public Open Spaces: Key Performance Indicators Definition and Application on Established Built Environment Typological Scenarios. Sustain. Cities Soc. 2023, 95, 104580. [Google Scholar] [CrossRef] [Scilit]
  8. UNDRR. A/RES/71/644 Report of the Open-Ended Intergovernmental Expert Working Group on Indicators and Terminology Relating to Disaster Risk Reduction; UNDRR: Geneva, Switzerland, 2016. [Google Scholar]
  9. Ahmed, N.M.; Altamura, P.; Giampaoletti, M.; Hemeida, F.A.; Mohamed, A.F.A. Optimizing Human Thermal Comfort and Mitigating the Urban Heat Island Effect on Public Open Spaces in Rome, Italy through Sustainable Design Strategies. Sci. Rep. 2024, 14, 19931. [Google Scholar] [CrossRef] [Scilit]
  10. Gherri, B.; Maiullari, D.; Finizza, C.; Maretto, M.; Naboni, E. On the Thermal Resilience of Venetian Open Spaces. Heritage 2021, 4, 4286–4303. [Google Scholar] [CrossRef] [Scilit]
  11. Błażejczyk, K.; Baranowski, J.; Błażejczyk, A. Heat Stress and Occupational Health and Safety–Spatial and Temporal Differentiation. Misc. Geogr. Reg. Stud. Dev. 2014, 18, 61–67. [Google Scholar] [CrossRef] [Scilit]
  12. Bröde, P.; Błazejczyk, K.; Fiala, D.; Havenith, G.; Holmér, I.; Jendritzky, G.; Kuklane, K.; Kampmann, B. The Universal Thermal Climate Index UTCI Compared to Ergonomics Standards for Assessing the Thermal Environment. Ind. Health 2013, 51, 16–24. [Google Scholar] [CrossRef] [Scilit]
  13. Błazejczyk, K.; Broede, P.; Fiala, D.; Havenith, G.; Holmér, I.; Jendritzky, G.; Kampmann, B.; Kunert, A. Principles of the New Universal Thermal Climate Index (UTCI) and Its Application to Bioclimatic Research in European Scale. Misc. Geogr. 2010, 14, 91–102. [Google Scholar] [CrossRef] [Scilit]
  14. Ho, H.C.; Wong, P.P.Y.; Guo, C. Impacts of Social and Environmental Perceptions on Preparedness and Knowledge of Air Pollution Risk: A Study of Adolescent Males in an Urbanized, High-Density City. Sustain. Cities Soc. 2021, 66, 102678. [Google Scholar] [CrossRef] [Scilit]
  15. Jian, I.Y.; Chan, E.H.W.; Xu, Y.; Owusu, E.K. Inclusive Public Open Space for All: Spatial Justice with Health Considerations. Habitat Int. 2021, 118, 102457. [Google Scholar] [CrossRef] [Scilit]
  16. Sahani, J.; Kumar, P.; Debele, S.; Emmanuel, R. Heat Risk of Mortality in Two Different Regions of the United Kingdom. Sustain. Cities Soc. 2022, 80, 103758. [Google Scholar] [CrossRef] [Scilit]
  17. Savić, S.; Marković, V.; Šećerov, I.; Pavić, D.; Arsenović, D.; Milošević, D.; Dolinaj, D.; Nagy, I.; Pantelić, M. Heat Wave Risk Assessment and Mapping in Urban Areas: Case Study for a Midsized Central European City, Novi Sad (Serbia). Nat. Hazards 2018, 91, 891–911. [Google Scholar] [CrossRef] [Scilit]
  18. Bröde, P.; Fiala, D.; Blazejczyk, K.; Epstein, Y.; Holmér, I.; Jendritzky, G.; Kampmann, B.; Richards, M.; Rintamäki, H.; Shitzer, A.; et al. Calculating UTCI Equivalent Temperature. In Environmental Ergonomics XIII. Proceedings of the 13th Internatinal Conference on Environmental Ergonomics, Boston, MA, USA, 2–7 August, 2009; University of Wollongong: Wollongong, NSW, Australia, 2009; pp. 49–53. [Google Scholar]
  19. Intergovernmental Panel on Climate Change (IPCC). Climate Change 2022–Impacts, Adaptation and Vulnerability; Contribution of Working Group II to the Sixth Assessment Report of the Intergovernmental Panel on Climate Change; Pörtner, H.-O., Roberts, D.C., Tignor, M., Poloczanska, E.S., Mintenbeck, K., Alegría, A., Craig, M., Langsdorf, S., Löschke, S., Möller, V., et al., Eds.; Cambridge University Press: New York, NY, USA, 2023; ISBN 9781009325844. [Google Scholar]
  20. Oke, T.R. The Urban Energy Balance. Prog. Phys. Geogr. 1988, 12, 471–508. [Google Scholar] [CrossRef] [Scilit]
  21. Arnfield, A.J. Two Decades of Urban Climate Research: A Review of Turbulence, Exchanges of Energy and Water, and the Urban Heat Island. Int. J. Climatol. 2003, 23, 1–26. [Google Scholar] [CrossRef] [Scilit]
  22. Pigliautile, I.; Marseglia, G.; Pisello, A.L. Investigation of CO2 Variation and Mapping through Wearable Sensing Techniques for Measuring Pedestrians’ Exposure in Urban Areas. Sustainability 2020, 12, 3936. [Google Scholar] [CrossRef] [Scilit]
  23. Zhang, X.; Steeneveld, G.J.; Zhou, D.; Duan, C.; Holtslag, A.A.M. A Diagnostic Equation for the Maximum Urban Heat Island Effect of a Typical Chinese City: A Case Study for Xi’an. Build. Environ. 2019, 158, 39–50. [Google Scholar] [CrossRef] [Scilit]
  24. Piselli, C.; Castaldo, V.L.; Pigliautile, I.; Pisello, A.L.; Cotana, F. Outdoor Comfort Conditions in Urban Areas: On Citizens’ Perspective about Microclimate Mitigation of Urban Transit Areas. Sustain. Cities Soc. 2018, 39, 16–36. [Google Scholar] [CrossRef] [Scilit]
  25. Rosso, F.; Golasi, I.; Castaldo, V.L.; Piselli, C.; Pisello, A.L.; Salata, F.; Ferrero, M.; Cotana, F.; de Lieto Vollaro, A. On the Impact of Innovative Materials on Outdoor Thermal Comfort of Pedestrians in Historical Urban Canyons. Renew. Energy 2018, 118, 825–839. [Google Scholar] [CrossRef] [Scilit]
  26. Sarrat, C.; Lemonsu, A.; Masson, V.; Guedalia, D. Impact of Urban Heat Island on Regional Atmospheric Pollution. Atmos. Environ. 2006, 40, 1743–1758. [Google Scholar] [CrossRef] [Scilit]
  27. Chen, S.; Biljecki, F. Automatic Assessment of Public Open Spaces Using Street View Imagery. Cities 2023, 137, 104329. [Google Scholar] [CrossRef] [Scilit]
  28. Guo, F.; Miao, S.; Xu, S.; Luo, M.; Dong, J.; Zhang, H. Multi-Objective Optimization Design for Cold-Region Office Buildings Balancing Outdoor Thermal Comfort and Building Energy Consumption. Energies 2025, 18, 62. [Google Scholar] [CrossRef] [Scilit]
  29. Sharifi, A. Urban Form Resilience: A Meso-Scale Analysis. Cities 2019, 93, 238–252. [Google Scholar] [CrossRef] [Scilit]
  30. Bernabeu-Bautista, Á.; Serrano-Estrada, L.; Martí, P. The Role of Successful Public Spaces in Historic Centres. Insights from Social Media Data. Cities 2023, 137, 104337. [Google Scholar] [CrossRef] [Scilit]
  31. Cherfaoui, D.; Djelal, N. Assessing the Flexibility of Public Squares the Case of Grande Poste Square in Algiers. Cities 2019, 93, 164–176. [Google Scholar] [CrossRef] [Scilit]
  32. Memluk, M.Z. Designing Urban Squares. In Advances in Landscape Architecture; InTech: Rijeka, Croatia, 2013. [Google Scholar]
  33. Sharifi, A. Resilient Urban Forms: A Macro-Scale Analysis. Cities 2019, 85, 1–14. [Google Scholar] [CrossRef] [Scilit]
  34. De Lotto, R.; Sturla, S. Measure and Proportion as Keyword for Qualitative Town Squares. J. Public Space 2017, 2, 69. [Google Scholar] [CrossRef] [Scilit]
  35. Abbassi, Y.; Ahmadikia, H.; Baniasadi, E. Prediction of Pollution Dispersion under Urban Heat Island Circulation for Different Atmospheric Stratification. Build. Environ. 2020, 168, 106374. [Google Scholar] [CrossRef] [Scilit]
  36. Memon, R.A.; Leung, D.Y.C.; Liu, C.H. An Investigation of Urban Heat Island Intensity (UHII) as an Indicator of Urban Heating. Atmos. Res. 2009, 94, 491–500. [Google Scholar] [CrossRef] [Scilit]
  37. Majidi, A.N.; Vojinovic, Z.; Alves, A.; Weesakul, S.; Sanchez, A.; Boogaard, F.; Kluck, J. Planning Nature-Based Solutions for Urban Flood Reduction and Thermal Comfort Enhancement. Sustainability 2019, 11, 6361. [Google Scholar] [CrossRef] [Scilit]
  38. Garau, C.; Annunziata, A. Public Open Spaces: Connecting People, Squares and Streets by Measuring the Usability through the Villanova District in Cagliari, Italy. Transp. Res. Procedia 2022, 60, 314–321. [Google Scholar] [CrossRef] [Scilit]
  39. Jens, K.; Gregg, J.S. How Design Shapes Space Choice Behaviors in Public Urban and Shared Indoor Spaces- A Review. Sustain. Cities Soc. 2021, 65, 102592. [Google Scholar] [CrossRef] [Scilit]
  40. Kubilay, A.; Derome, D.; Carmeliet, J. Coupled Numerical Simulations of Cooling Potential Due to Evaporation in a Street Canyon and an Urban Public Square. J. Phys. Conf. Ser. 2019, 1343, 012016. [Google Scholar] [CrossRef] [Scilit]
  41. Su, W.; Zhang, L.; Chang, Q. Nature-Based Solutions for Urban Heat Mitigation in Historical and Cultural Block: The Case of Beijing Old City. Build. Environ. 2022, 225, 109600. [Google Scholar] [CrossRef] [Scilit]
  42. D’Amico, A.; Russo, M.; Angelosanti, M.; Bernardini, G.; Vicari, D.; Quagliarini, E.; Currà, E. Built Environment Typologies Prone to Risk: A Cluster Analysis of Open Spaces in Italian Cities. Sustainability 2021, 13, 9457. [Google Scholar] [CrossRef] [Scilit]
  43. Quagliarini, E.; Bernardini, G.; Romano, G.; D’Orazio, M. Users’ Vulnerability and Exposure in Public Open Spaces (Squares): A Novel Way for Accounting Them in Multi-Risk Scenarios. Cities 2023, 133, 104160. [Google Scholar] [CrossRef] [Scilit]
  44. Morganti, M. Spatial Metrics to Investigate the Impact of Urban Form on Microclimate and Building Energy Performance: An Essential Overview. In Urban Microclimate Modelling for Comfort and Energy Studies; Palme, M., Salvati, A., Eds.; Springer International Publishing: Cham, Switzerland, 2021; pp. 385–402. [Google Scholar]
  45. Romão, X.; Bertolin, C. Risk Protection for Cultural Heritage and Historic Centres: Current Knowledge and Further Research Needs. Int. J. Disaster Risk Reduct. 2022, 67, 102652. [Google Scholar] [CrossRef] [Scilit]
  46. Cerè, G.; Rezgui, Y.; Zhao, W. Critical Review of Existing Built Environment Resilience Frameworks: Directions for Future Research. Int. J. Disaster Risk Reduct. 2017, 25, 173–189. [Google Scholar] [CrossRef] [Scilit]
  47. Rezende, O.M.; Miranda, F.M.; Haddad, A.N.; Miguez, M.G. A Framework to Evaluate Urban Flood Resilience of Design Alternatives for Flood Defence Considering Future Adverse Scenarios. Water 2019, 11, 1485. [Google Scholar] [CrossRef] [Scilit]
  48. Sesana, E.; Gagnon, A.S.; Ciantelli, C.; Cassar, J.; Hughes, J.J. Climate Change Impacts on Cultural Heritage: A Literature Review. WIREs Clim. Change 2021, 12, e710. [Google Scholar] [CrossRef] [Scilit]
  49. Privitera, R.; Jelo, G. Built Heritage Preservation and Climate Change Adaptation in Historic Cities: Facing Challenges Posed by Nature-Based Solutions. Sustainability 2025, 17, 5693. [Google Scholar] [CrossRef] [Scilit]
  50. Howe, P.D.; Marlon, J.R.; Wang, X.; Leiserowitz, A. Public Perceptions of the Health Risks of Extreme Heat across US States, Counties, and Neighborhoods. Proc. Natl. Acad. Sci. USA 2019, 116, 6743–6748. [Google Scholar] [CrossRef] [Scilit]
  51. Envi-Met. Available online: https://envi-met.com/ (accessed on 24 October 2025).
  52. Liu, Z.; Cheng, W.; Jim, C.Y.; Morakinyo, T.E.; Shi, Y.; Ng, E. Heat Mitigation Benefits of Urban Green and Blue Infrastructures: A Systematic Review of Modeling Techniques, Validation and Scenario Simulation in ENVI-Met V4. Build. Environ. 2021, 200, 107939. [Google Scholar] [CrossRef] [Scilit]
  53. Paas, B.; Schneider, C. A Comparison of Model Performance between ENVI-Met and Austal2000 for Particulate Matter. Atmos. Environ. 2016, 145, 392–404. [Google Scholar] [CrossRef] [Scilit]
  54. Abedrabboh, O.; Fountoukis, C.; Al-Ansari, T.; Alfarra, M.R. Simulating Microclimate Adaptation: Evaluating Heat Mitigation Strategies for Doha, Qatar, under Current and Future Climate Conditions. Sustain. Cities Soc. 2025, 132, 106777. [Google Scholar] [CrossRef] [Scilit]
  55. Tousi, E.; Mela, A.; Tseliou, A. Nature-Based Urbanism for Enhancing Senior Citizens’ Outdoor Thermal Comfort in High-Density Mediterranean Cities: ENVI-Met Findings. Urban Sci. 2025, 9, 152. [Google Scholar] [CrossRef] [Scilit]
  56. Cantatore, E.; Fatiguso, F. An Energy-Resilient Retrofit Methodology to Climate Change for Historic Districts. Application in the Mediterranean Area. Sustain. 2021, 13, 1422. [Google Scholar] [CrossRef] [Scilit]
  57. ENVI-Met World Tour: Lima. Available online: https://envi-met.com/envi-met-world-tour-lima/ (accessed on 24 October 2025).
  58. ENVI-Met Model Concept. Available online: https://envi-met.info/doku.php?id=intro:modelconcept (accessed on 24 October 2025).
  59. Jendritzky, G.; Havenith, G.; Weihs, P.; Batchvarova, E.; DeDear, R. The Universal Thermal Climate Index UTCI Goal and State of COST Action 730. In Environmental Ergonomics XII. Proceedings of the International Scientific Conference, Poľana nad Detvou, Zvolen, Slovakia, 17–20 September 2007; Biomed: Ljubljana, Slovenia, 2007; pp. 509–512. [Google Scholar]
  60. Riebl, S.K.; Davy, B.M. The Hydration Equation. ACSMs. Health Fit. J. 2013, 17, 21–28. [Google Scholar] [CrossRef] [Scilit]
  61. ISTAT. Available online: https://www.istat.it/ (accessed on 24 October 2025).
  62. Nuzzo, D. Ricerche Archeologiche Recenti Nelle Città Medievali Della Puglia Centrale. Il Caso Di Canosa e Bari. In Florentia. Studi in Onore di Guido Vannini; Firenze University Press: Firenze, Italy, 2024; pp. 461–478. [Google Scholar]
  63. Belli d’Elia, P.; Pellegrino, E. Le Radici della Cattedrale. Lo Studio Ed Il Restauro del Succorpo nel Contesto della Fabbrica della Cattedrale di Bari; Edipuglia: Bari, Italy, 2009; ISBN 139788872285541. [Google Scholar]
  64. De Rose, A. I Palazzi Di Napoli; Newton Compton Editori: Roma, Italy, 2007; ISBN 108882896374. [Google Scholar]
  65. Ferraro, I. Napoli Atlante Della Città Storica; Edizioni CLEAN: Napoli, Italy, 2002. [Google Scholar]
  66. Zhang, J.; Wang, T.; Goh, Y.M.; He, P.; Hua, L. The Effects of Long-Term Policies on Urban Resilience: A Dynamic Assessment Framework. Cities 2024, 153, 105294. [Google Scholar] [CrossRef] [Scilit]
  67. Gandini, A.; Quesada, L.; Prieto, I.; Garmendia, L. Climate Change Risk Assessment: A Holistic Multi-Stakeholder Methodology for the Sustainable Development of Cities. Sustain. Cities Soc. 2021, 65, 102641. [Google Scholar] [CrossRef] [Scilit]
  68. Rosso, F.; Bernabei, L.; Bernardini, G.; Cadena, J.D.B.; Russo, M.; D’Amico, A.; Salvalai, G.; Currà, E.; Quagliarini, E.; Mochi, G. Mitigating Multi-Risks in the Historical Built Environment: A Multi-Strategy Adaptive Approach. In Sustainability in Energy and Buildings 2022. SEB 2022. Smart Innovation, Systems and Technologies; Littlewood, J., Howlett, R.J., Jain, L.C., Eds.; Springer: Singapore, 2023; Volume 223, pp. 197–207. [Google Scholar]
  69. Julià, P.B.; Ferreira, T.M. From Single- to Multi-Hazard Vulnerability and Risk in Historic Urban Areas: A Literature Review. Nat. Hazards 2021, 108, 93–128. [Google Scholar] [CrossRef] [Scilit]
  70. Rocca, M.; Salvadori, G.; Leccese, F.; Bisegna, F. Textile Solar Shading Systems for Reducing the Negative Impacts of Solar Radiation in Urban Areas: A Critical Review. City Environ. Interact. 2025, 28, 100240. [Google Scholar] [CrossRef] [Scilit]
  71. Garcia-Nevado, E.; Duport, N.; Bugeat, A.; Beckers, B. Benefits of Street Sun Sails to Limit Building Cooling Needs in a Mediterranean City. Build. Environ. 2021, 187, 107403. [Google Scholar] [CrossRef] [Scilit]
  72. Cantatore, E.; Esposito, D.; Sonnessa, A. Mapping the Multi-Vulnerabilities of Outdoor Places to Enhance the Resilience of Historic Urban Districts: The Case of the Apulian Region Exposed to Slow and Rapid-Onset Disasters. Sustainability 2023, 15, 14248. [Google Scholar] [CrossRef] [Scilit]
  73. Ali, E.; Cramer, W.; Carnicer Cols, J.; Georgopoulou, E.; Hilmi, N.; Le Cozannet, G.; Lionello, P. Cross-Chapter Paper 4: Mediterranean Region. In Climate Change 2022: Impacts, Adaptation and Vulnerability; Contribution of Working Group II to the Sixth Assessment Report of the Intergovernmental Panel on Climate Change; Pörtner, H.-O., Roberts, D.C., Tignor, M., Poloczanska, E.S., Mintenbeck, K., Alegría, A., Craig, M., Langsdorf, S., Löschke, S., Möller, V., et al., Eds.; University of St Andrews: St Andrews, UK, 2022. [Google Scholar]
  74. Rodrigues, E.; Fernandes, M.S.; Carvalho, D. Future Weather Generator for Building Performance Research: An Open-Source Morphing Tool and an Application. Build. Environ. 2023, 233, 110104. [Google Scholar] [CrossRef] [Scilit]
  75. Future Weather Generator. Available online: https://future-weather-generator.adai.pt/ (accessed on 24 October 2025).
  76. Lee, H.; Calvin, K.; Dasgupta, D.; Krinner, G.; Mukherji, A.; Thorne, P.; Trisos, C.; Romero, J.; Aldunce, P.; Barret, K. Climate Change 2023: Synthesis Report, Summary for Policymakers; Contribution of Working Groups I, II and III to the Sixth Assessment Report of the Intergovernmental Panel on Climate Change; NASA: Moffett Field, CA, USA, 2023. [Google Scholar]
  77. ENVI-Met BIO-Met. Available online: https://envi-met.com/tutorials/quick-tip-pet-calculation-in-bio-met/ (accessed on 24 October 2025).
  78. Chooi, Y.C.; Ding, C.; Magkos, F. The Epidemiology of Obesity. Metabolism 2019, 92, 6–10. [Google Scholar] [CrossRef] [Scilit] [PubMed]
  79. Estacio, I.; Hadfi, R.; Blanco, A.; Ito, T.; Babaan, J. Optimization of Tree Positioning to Maximize Walking in Urban Outdoor Spaces: A Modeling and Simulation Framework. Sustain. Cities Soc. 2022, 86, 104105. [Google Scholar] [CrossRef] [Scilit]
  80. Bernardini, G.; Sparvoli, G.; Cantatore, E.; Cadena, J.D.B.; Bernabei, L.; Rosso, F.; D’Amico, A.; Russo, M.; Fatiguso, F.; Salvalai, G.; et al. Evaluating Strategies for Single to Multi-Risk Mitigation in Urban Public Open Spaces: A Behavioural Simulation-Based Approach Applied to Italian Typological Historical Urban Squares. Cities 2025, 166, 106267. [Google Scholar] [CrossRef] [Scilit]
  81. Yang, J.; Shi, B.; Zheng, Y.; Shi, Y.; Xia, G. Urban Form and Air Pollution Disperse: Key Indexes and Mitigation Strategies. Sustain. Cities Soc. 2020, 57, 101955. [Google Scholar] [CrossRef] [Scilit]
Figure 1. Research framework, comprising connection to related tools, research questions (RQs), and references to the methodological, case study presentation, and results sections in which each phase is described.
Heritage 09 00060 g001
Figure 2. Structure of dimensions, details, and data (blue boxes) required to setup POS model and simulate it in CDF for the assessment of thermal comfort distribution (UTCI maps) (grey boxes). The schema merges climate change and heritage dimensions as forcing features of starting UTCI map distribution in POSs by considering future climate scenarios and/or the application of suitable strategies (output). “+”: combining the two operational tasks.
Heritage 09 00060 g002
Figure 3. Location and spatial configuration of the investigated POS: Piazza dell’Odegitria in Bari, shown within its historic centre. Metric scale is provided for the detailed POS view only, while orientation applies to all panels. Major public buildings, including the church, are indicated by white markers.
Heritage 09 00060 g003
Figure 4. Location and spatial configuration of the investigated POS, Largo Regina Coeli in Naples, shown within its historic centre. Metric scale is provided for the detailed POS view only, while orientation applies to all panels. Major public buildings, including the church, are indicated by white markers.
Heritage 09 00060 g004
Figure 5. Spatial configuration of the two POSs considering the implementation of selected mitigation strategies.
Heritage 09 00060 g005
Figure 6. Comparison diagrams (planimetric layouts and cross-sections) between POSs and BETs. The dashed lines indicate the locations of Section 1 and Section 2, from which the corresponding cross-sectional views are derived.
Heritage 09 00060 g006
Figure 7. Mean UTCI values (°C) for the 11:00–16:00 time window in Piazza dell’Odegitria (Bari) under baseline, 2050, and 2080 climate change scenarios (top row), compared with the corresponding post-retrofit simulations including the sunsails mitigation system (bottom row).
Heritage 09 00060 g007
Figure 8. t1% values [h] for the 11:00–16:00 time window in Piazza dell’Odegitria (Bari) under baseline, 2050, and 2080 climate change scenarios (top row), compared with the corresponding post-retrofit scenarios (bottom row).
Heritage 09 00060 g008
Figure 9. Mean UTCI values (°C) for the 11:00–16:00 time window under the baseline, 2050, and 2080 scenarios for Piazza dell’Odegitria (Bari, top row) and the corresponding BET4 (bottom row).
Heritage 09 00060 g009
Figure 10. Mean UTCI values (°C) for the 11:00–16:00 time window in Largo Regina Coeli (Naples) under baseline, 2050, and 2080 climate change scenarios (top row), compared with post-retrofit simulations including the sunsails mitigation system (bottom row).
Heritage 09 00060 g010
Figure 11. t1% values [h] for the 11:00–16:00 time window in Largo Regina Coeli (Naples) under baseline, 2050, and 2080 climate change scenarios (top row), compared with the corresponding post-retrofit scenarios (bottom row).
Heritage 09 00060 g011
Figure 12. Mean UTCI values (°C) for the 11:00–16:00 time window under the baseline, 2050, and 2080 scenarios for Largo Regina Coeli (Naples, top row) and the corresponding sub-BET4 (bottom row).
Heritage 09 00060 g012
Table 1. Stress categories corresponding to UTCI values, and related sweat rate to be used in Equation (2).
UTCI [°C]Stress CategorySweat Rate [g/h]
9–26No heat stress S w e a t   r a t e = 0
26–32Moderate heat stress S w e a t   r a t e = ( 225 ·   U T C I 5800 ) 7
32–38Strong heat stress S w e a t   r a t e = ( 100 ·   U T C I 2600 ) 3
38–46Very strong heat stress
>46Extreme heat stress S w e a t   r a t e = 650
Table 2. Average body weight values according to age groups and gender.
Age Classes [Years]Average Body Weight—Male (St. Dev) [kg]Average Body Weight—Female (St. Dev) [kg]
Toddlers—T (0–4)11 (4)11 (4)
Parent-Assisted Children—PC (5–14)40 (14)40 (14)
Young Adults—YA (15–19)77 (4)65 (2)
Adults—AU (20–69)89 (3)76 (1)
Elderly—EU (70+)83 (4)70 (5)
Table 3. Calculation and interpretation of percentage differences in microscale and macroscale indicators dI [%] depending on the comparison aims given by research questions (RQs) discussed in Section 1.
RQ: Comparison AimCalculationdI Values for WLPOSInterpretation for WLPOS dI   Values   for   t 1 % and t*1% Interpretation   for   t 1 % and t*1%
RQ1: dI on pre/post-mitigation comparison d I = I f u t , P O S I c u r , P O S I c u r , P O S
d I = I f u t , B E T I c u r , B E T I c u r , B E T in the given pre- or post-mitigation scenarios
Higher dIHigher negative impact of future climate scenarios in the POS/BET conditionsHigher dIHigher positive impact of mitigation strategies in the given climate scenario
RQ1 and RQ2: dI on climate scenario comparison d I = I f u t ,   P O S I c u r , P O S I c u r , P O S
d I = I f u t ,   B E T I c u r , B E T I c u r , B E T in the given pre- or post-mitigation scenarios
Higher dIHigher negative impact of future climate scenarios in the POS/BET conditionsLower dILower the negative impact due to the reduction in possible exposure time before dehydration effects
RQ2: dI on POS-BET comparison d I = I B E T I P O S I B E T −10% < dI < +10% Similarities among the POS and the corresponding BETNot assessedNot assessed
dI > 0BET results are more conservative than POS-related ones
Table 4. Analysis of mitigation strategies as described in [68] for the selected case studies, describing recommendations (R) and suitability (S).
Mitigation
Strategy
Piazza dell’Odegitria (Bari)Largo Regina Coeli (Naples)
TreesR: far from the façades of buildings and the church
S: yes, possible in the larger part of square
R: far from the façades of buildings and the church
S: no, geometric incompatibility with narrow square
Fixed shadingsR: far from the façade of the church, maintaining visual accessibility
S: yes, ensuring visual accessibility of the church’s façade from the main access; quote equal to floor course of buildings
R: far from the façade of the church
S: yes, ensuring visual accessibility of the church façade from walk paths; quote equal to floor course of buildings
Cool pavement and permeable paversR: recovery original materials for pavements
S: yes, replacement of basalt pavement with calcareous one, featured by good optical properties
R: maintain original materials for pavements
S: no, limiting replacement of basalt pavement
Cool façadesR: preserving original clear colours and material in facades
S: good properties at the actual states; limited potentiality of strategy
R: preserving original clear colours and material in facades
S: good properties at the actual states; limited potentiality of strategy
Green wallsR: preserving original clear colours and material in facades
S: no, any possible alteration of walls both for buildings and church
R: preserving original clear colours and material in facades
S: no, any possible alteration of walls both for buildings and church
Table 5. Geometric and morphological parameters of the two POSs and the respective BET4 and sub-BET4. BET parameters are reported using value ranges or median values (*) since BETs are built from different POS conditions [42]. Notations are graphically reported in Figure 6 to identify their relevance in the POS and BET description. ^: dimension related to the main POS in front of the cathedral. +: minimum value for the L-shaped part of the POS.
ParametersPiazza dell’OdegitriaBET4Largo Regina CoeliSub-BET4
Circumference diameter 1D1 [m]62.7 (44.8 ^)28.0 ÷ 50.030.918.0 ÷ 33.0
Circumference diameter 2D2 [m]25.113.0 ÷ 24.016.27.6 ÷ 19.2
D2/D10.4 (0.59 ^)0.42 ÷ 0.580.520.42 ÷ 0.58
Plan dimension L1 [m]24.9 21.3 ÷ 34.715.89.9 ÷ 16.2
Plan dimension L2 [m]45.0 (14.0 +)30.3 ÷ 49.426.216.5 ÷ 29.9
Plan dimension L3 [m]64.0 (14.2 ^)10.8 ÷ 21.026.216.5 ÷ 29.9
POS area [m2]1300.0 (805.0 ^)291.0 ÷ 775.0416.8165.0 ÷ 440.0
Mean building height Hmean [m]15.012.0 ÷ 29.016.512.0 ÷ 29.0
Max building height Hmax [m]30.018.0 ÷ 29.021.018.0 ÷ 29.0
N. of accesses A [#]63 ÷ 643 ÷ 6
n.A1 [#]/dim. [m] *5/5.74/61/4.52/6
n.A2 [#]/dim. [m] *1/2.71/33/4.02/3
Special buildings [#] *2111
Ground slope difference [m]0.930.9 ÷ 3.20.950.9 ÷ 3.2
Green area [%] *0000
Table 6. Details and type of data and sources used to model and simulate the selected case studies, linking them to the dimensions of modelling activities (Section 2.1).
Details and Type of Data/Source for ModellingPiazza dell’Odegitria (Bari)Largo Regina Coeli (Naples)
Climatological data—Urban Dimension
Statistical climatological fileTMY climatological file for “Bari_Wojtyla” (.epw)TMY climatological file “Napoli_Capodichino” (.epw)
Future Scenarios—Climate Change dimension
IPCC pathwaySSP2-4.5 scenario
Future terms2050 middle term, 2080 long term
Geometric modelling—Boundary Dimension
TerrainRegional DTM
BuildingsRegional CTR
Material properties—POS dimension (Building)
Buildings
Reflectance
(in terms of Albedo α)
Clear calcareous stone for unplastered walls: α = 0.6
Clear-coloured plastered walls: α = 0.5
Stone clear-coloured pavements: α = 0.6
Aged tiles: α = 0.5
Dark bituminous layer: α = 0.15
Clear bituminous layer: α = 0.5
Pavement
Reflectance
(in terms of Albedo α)
Stone clear-coloured pavements: α = 0.6
Basalt dark pavement: α = 0.4
Detail of CFD simulation
Cell dimensions
[x × y × z]
1 m × 1 m × 1 m
Model area extension (cells)100 × 100100 × 100
Duration of simulation72 h
Simulated day25 July26 July
Wind speed (m/s) and
direction (°)
2.5 m/s; 180°1.9 m/s; 180°
Table 7. Aggregated t*1% values [h] for Piazza dell’Odegitria (Bari) under baseline, 2050, and 2080 climate change scenarios, compared with the corresponding post-retrofit configurations including the sunsails mitigation system. Cell colors varies from dark red (more sensible dI reduction) to dark green (more sensible dI increase). n.a.: not assessed since related to the baseline for the dI comparison.
Scenariost*1% [h]dI ComparisonMax t1% [h]dI ComparisonMin t1% [h]dI ComparisonSt. Dev.Sum of Squares (SS)
Climate ScenarioPre/Post-MitigationClimate ScenarioPre/Post-MitigationClimate ScenarioPre/Post-Mitigation
Baseline1.41n.a.n.a.1.94n.a.n.a.1.15n.a.n.a.0.31123.76
20501.31−7%n.a.1.49−23%n.a.1.150%n.a.0.1948.13
20801.21−14%n.a.1.15−41%n.a.1.150%n.a.0.112.52
Baseline with Sunsail1.46n.a.−1%2.01n.a.4%1.15n.a.0%0.31122.66
2050 with Sunsail1.32−10%−3%1.55−23%4%1.150%0%0.1948.1
2080 with Sunsail1.22−16%−1%1.22−39%6%1.150%0%0.1115.93
Table 8. Aggregated WLPOS values [g/h] for Piazza dell’Odegitria (Bari) under baseline, 2050, and 2080 climate change scenarios, compared with the corresponding post-retrofit configurations including the sunsails mitigation system. Cell colors varies from dark red (more sensible dI reduction) to dark green (more sensible dI increase). n.a.: not assessed since related to the baseline for the dI comparison.
ScenariosWLPOS for OO [g/h]dI Comparison for OOWLPOS for PO [g/h]dI Comparison for PO
Climate ScenarioPre/Post-MitigationClimate ScenarioPre/Post-Mitigation
Baseline141.71n.a.n.a.566.84n.a.n.a.
2050149.796%n.a.599.166%n.a.
2080156.5410%n.a.626.1410%n.a.
Baseline with Sunsail140.72n.a.1%562.87n.a.1%
2050 with Sunsail145.944%−3%583.44%−3%
2080 with Sunsail154.2410%−1%619.9410%−1%
Table 9. Average water loss values of the whole POS (WLPOS, g/h) for transient users (OO, t ≤ 15 min) and permanent users (PO, t ≥ 15 min) in Piazza dell’Odegitria (Bari) and in BET4 in the baseline scenario, 2050, and 2080. n.a.: not assessed since related to the baseline for the dI comparison.
ScenarioPiazza dell’Odegitria (Bari)BET 4
WLPOS for OO
[ g h ]
dI Comparison for OOWLPOS for PO
[ g h ]
dI Comparison for POWLPOS for OO
[ g h ]
dI Comparison for OOWLPOS for PO
[ g h ]
dI Comparison for PO
POS-BET Climate ScenarioPOS-BETClimate ScenarioClimate ScenarioClimate Scenario
Baseline141.71 −2%n.a.566.84 −2%n.a.139.10 n.a.556.41 n.a.
2050149.79 0%6%599.16 0%6%149.12 7%596.48 7%
2080156.54 0%10%626.14 0%10%157.12 13%628.47 13%
Table 10. Aggregated t*1% values [h] for Largo Regina Coeli (Naples) under baseline, 2050, and 2080 climate change scenarios, compared with the corresponding post-retrofit configurations including the sunsails mitigation system. Cell colors varies from dark red (more sensible dI reduction) to dark green (more sensible dI increase). n.a.: not assessed since related to the baseline for the dI comparison.
Scenariost*1% [h]dI ComparisonMax t1% [h]dI ComparisonMin t1% [h]dI ComparisonSt. Dev.Sum of Squares (SS)
Climate ScenarioPre/Post-MitigationClimate ScenarioPre/Post-MitigationClimate ScenarioPre/Post-Mitigation
Baseline2.3n.a.n.a.2.85n.a.n.a.1.78n.a.n.a.0.31123.76
20501.86−19%n.a.2.2−23%n.a.1.52−15%n.a.0.1948.13
20801.83−20%n.a.1.84−35%n.a.1.44−19%n.a.0.112.52
Baseline with Sunsail1.28n.a.−1%2.75n.a.−4%1.87n.a.5%0.31122.66
2050 with Sunsail1.85−19%−1%2.18−21%−1%1.57−16%3%0.1948.1
2080 with Sunsail1.73−24%−5%2.02−27%10%1.5−20%4%0.1115.93
Table 11. Aggregated WLPOS values [g/h] for Largo Regina Coeli (Naples) under baseline, 2050, and 2080 climate change scenarios, compared with the corresponding post-retrofit configurations including the sunsails mitigation system. Cell colors varies from dark red (more sensible dI reduction) to dark green (more sensible dI increase). n.a.: not assessed since related to the baseline for the dI comparison.
ScenariosWLPOS for OO [g/h]dI Comparison for OOWLPOS for PO [g/h]dI Comparison for PO
Climate ScenarioPre/Post-MitigationClimate ScenarioPre/Post-Mitigation
Baseline82.66n.a.n.a.330.63n.a.n.a.
2050100.5922%n.a.402.3622%n.a.
2080106.8229%n.a.427.2829%n.a.
Baseline with Sunsail83.24n.a.1%332.97n.a.1%
2050 with Sunsail100.5921%0%402.3621%0%
2080 with Sunsail107.5829%1%430.3329%1%
Table 12. Average water loss values of the whole POS (WLPOS, g/h) for transient users (OO, t ≤ 15 min) and permanent users (PO, t ≥ 15 min) in Largo Regina Coeli (Naples) and in the sub-BET4 in the baseline scenario, 2050, and 2080. n.a.: not assessed since related to the baseline for the dI comparison.
ScenarioLargo Regina Coeli (Naples)Sub-BET 4
WLPOS for OO
[ g h ]
dI Comparison for OOWLPOS for PO
[ g h ]
dI Comparison for POWLPOS for OO
[ g h ]
dI Comparison for OOWLPOS for PO
[ g h ]
dI Comparison for PO
POS-BET Climate ScenarioPOS-BETClimate ScenarioClimate ScenarioClimate Scenario
Baseline82.6611%n.a.330.6311%n.a.99.66n.a.370.66n.a.
2050100.59 13%22%402.3613%22%115.3624%461.4524%
2080106.82 19%29%427.2819%29%131.4342%525.7342%
Disclaimer/Publisher’s Note: The statements, opinions and data contained in all publications are solely those of the individual author(s) and contributor(s) and not of MDPI and/or the editor(s). MDPI and/or the editor(s) disclaim responsibility for any injury to people or property resulting from any ideas, methods, instructions or products referred to in the content.