

A Preliminary Study of the Gold Content of Byzantine Coins and a Possible Link to the Supernova of Year AD 1054

Abstract
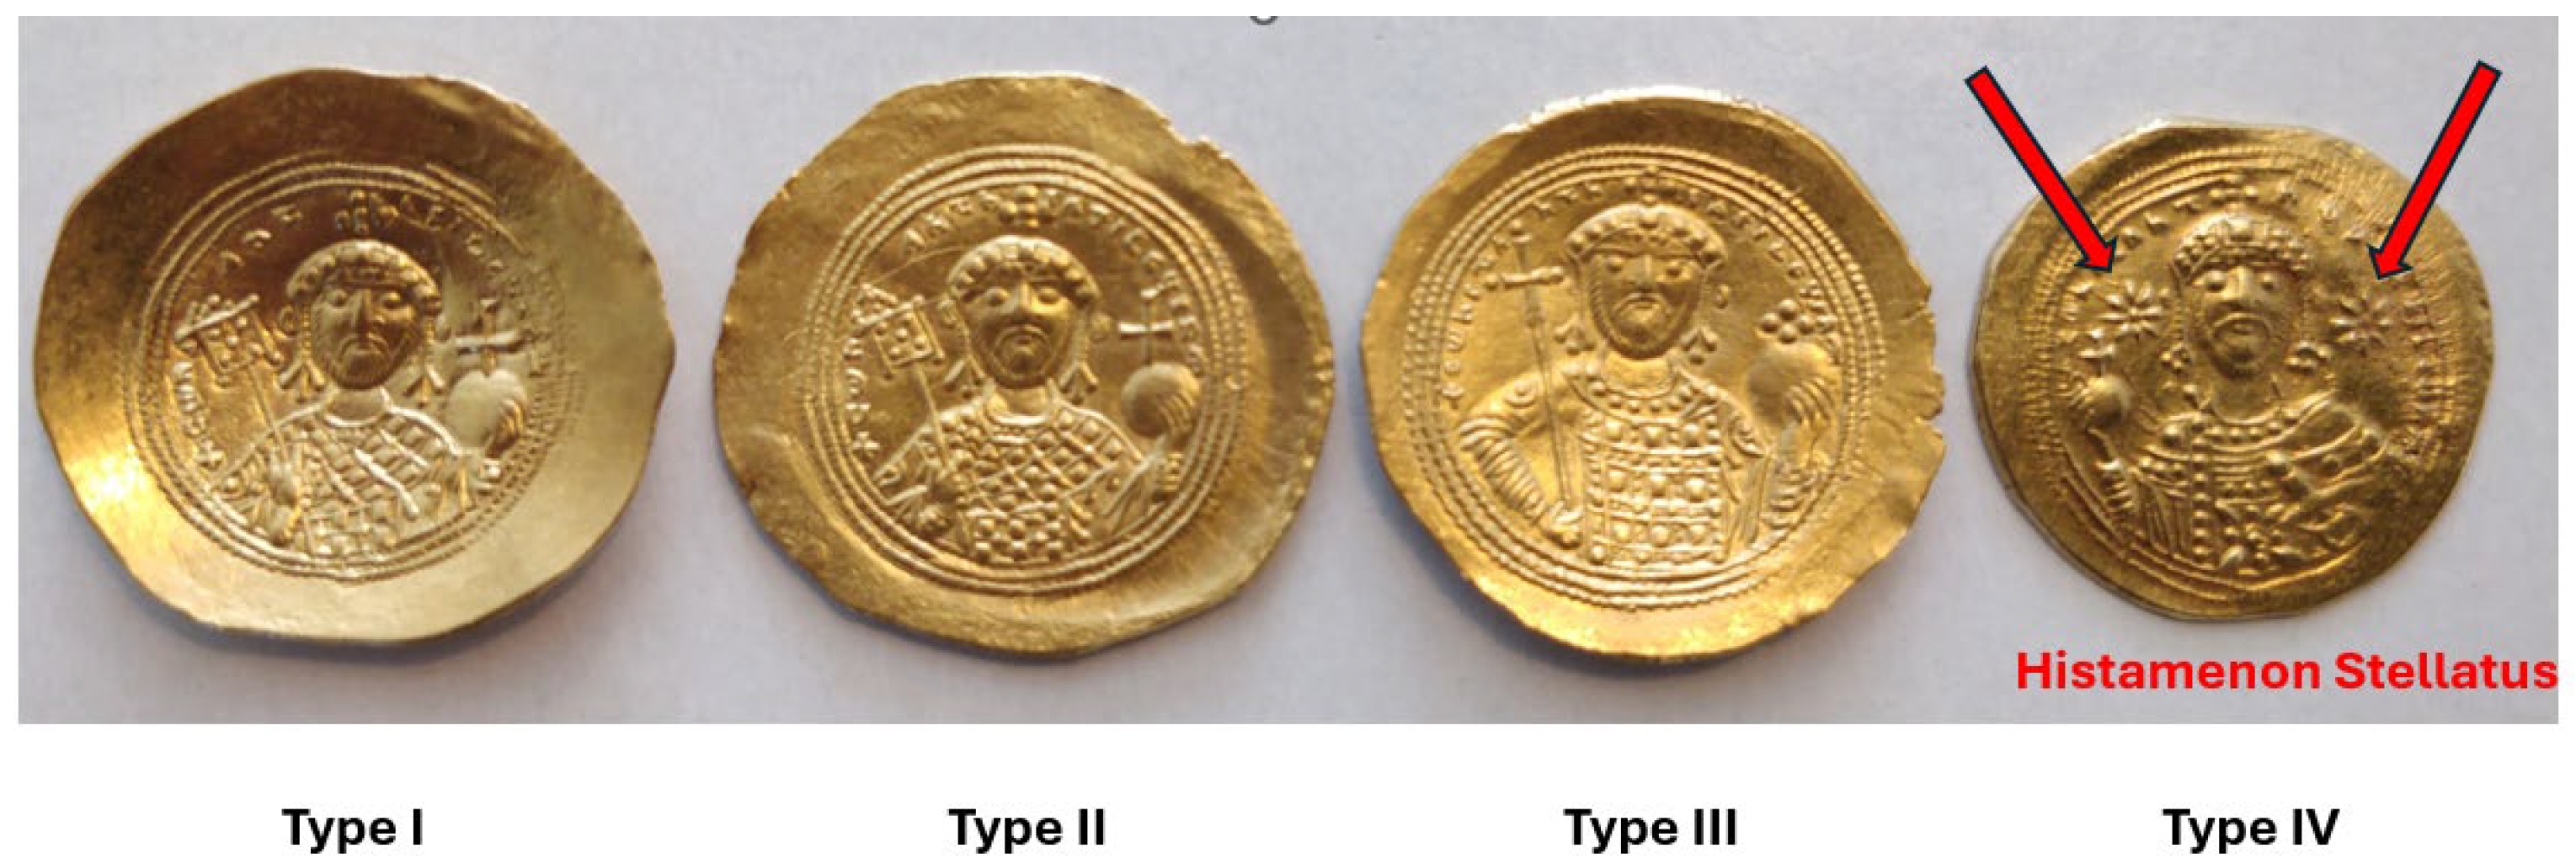
1. Introduction
2. Materials and Methods
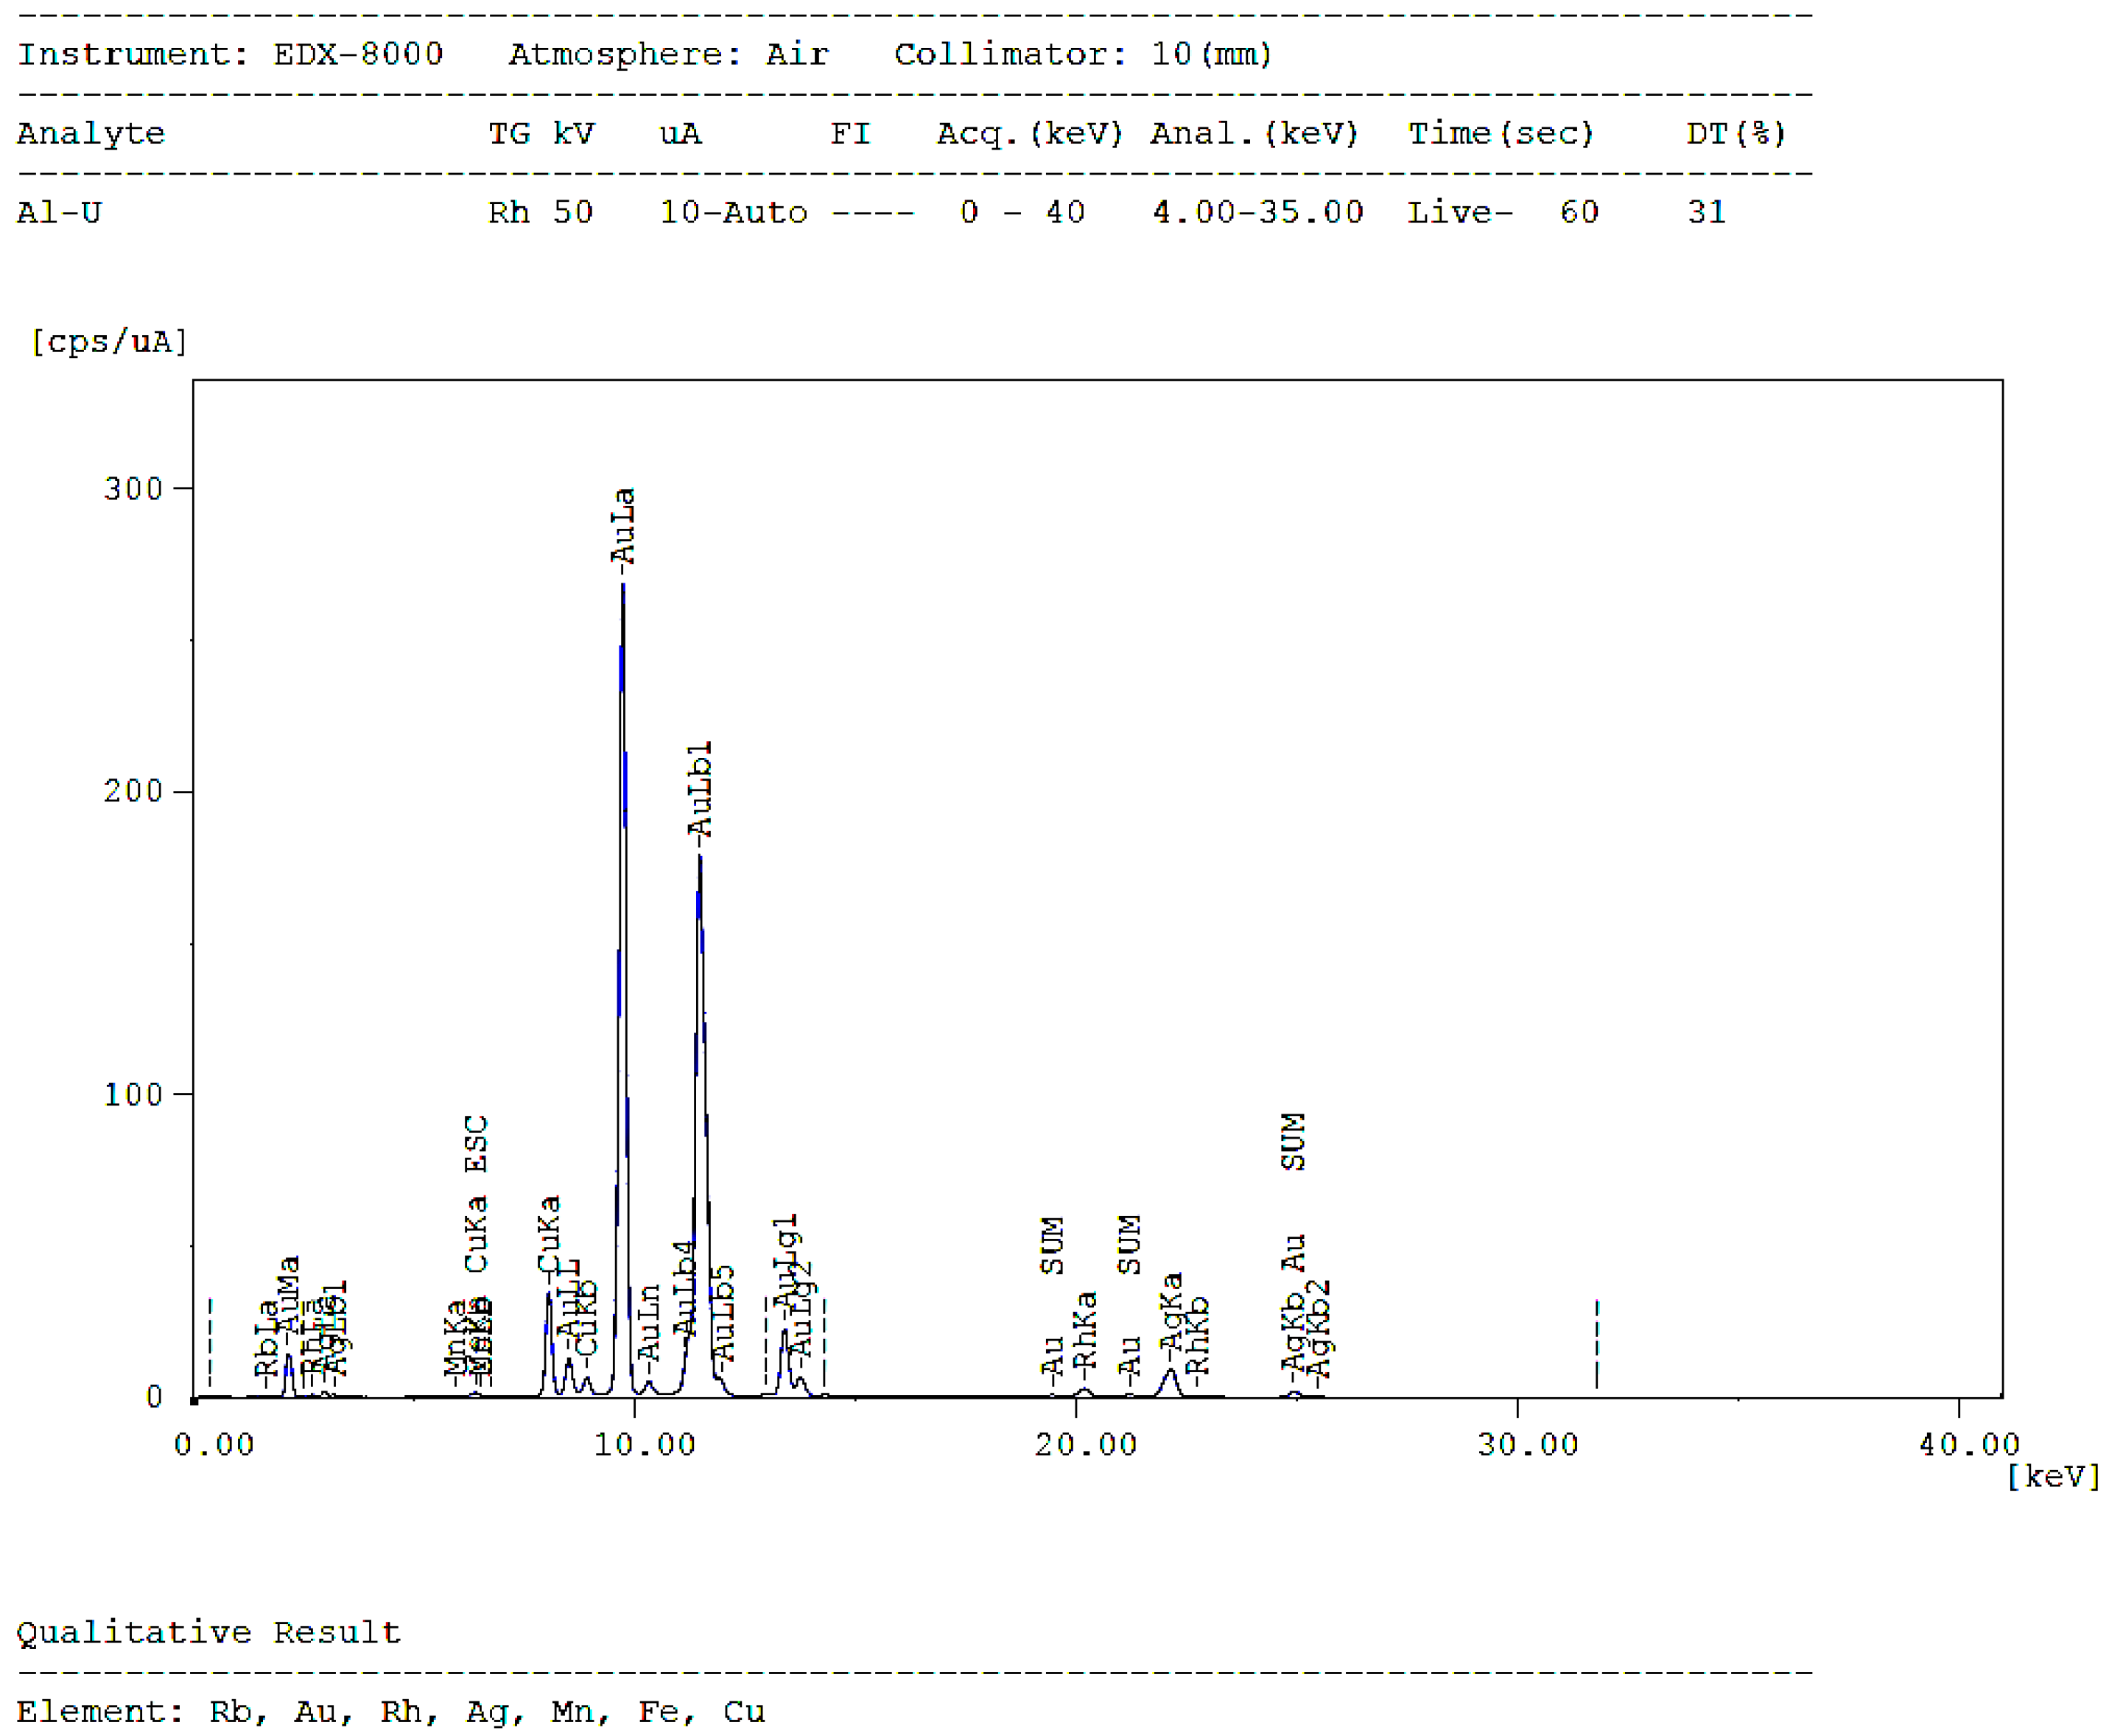
2.1. X-Ray Fluorescence Technique
2.2. Bulk Specific Density via XRF Data
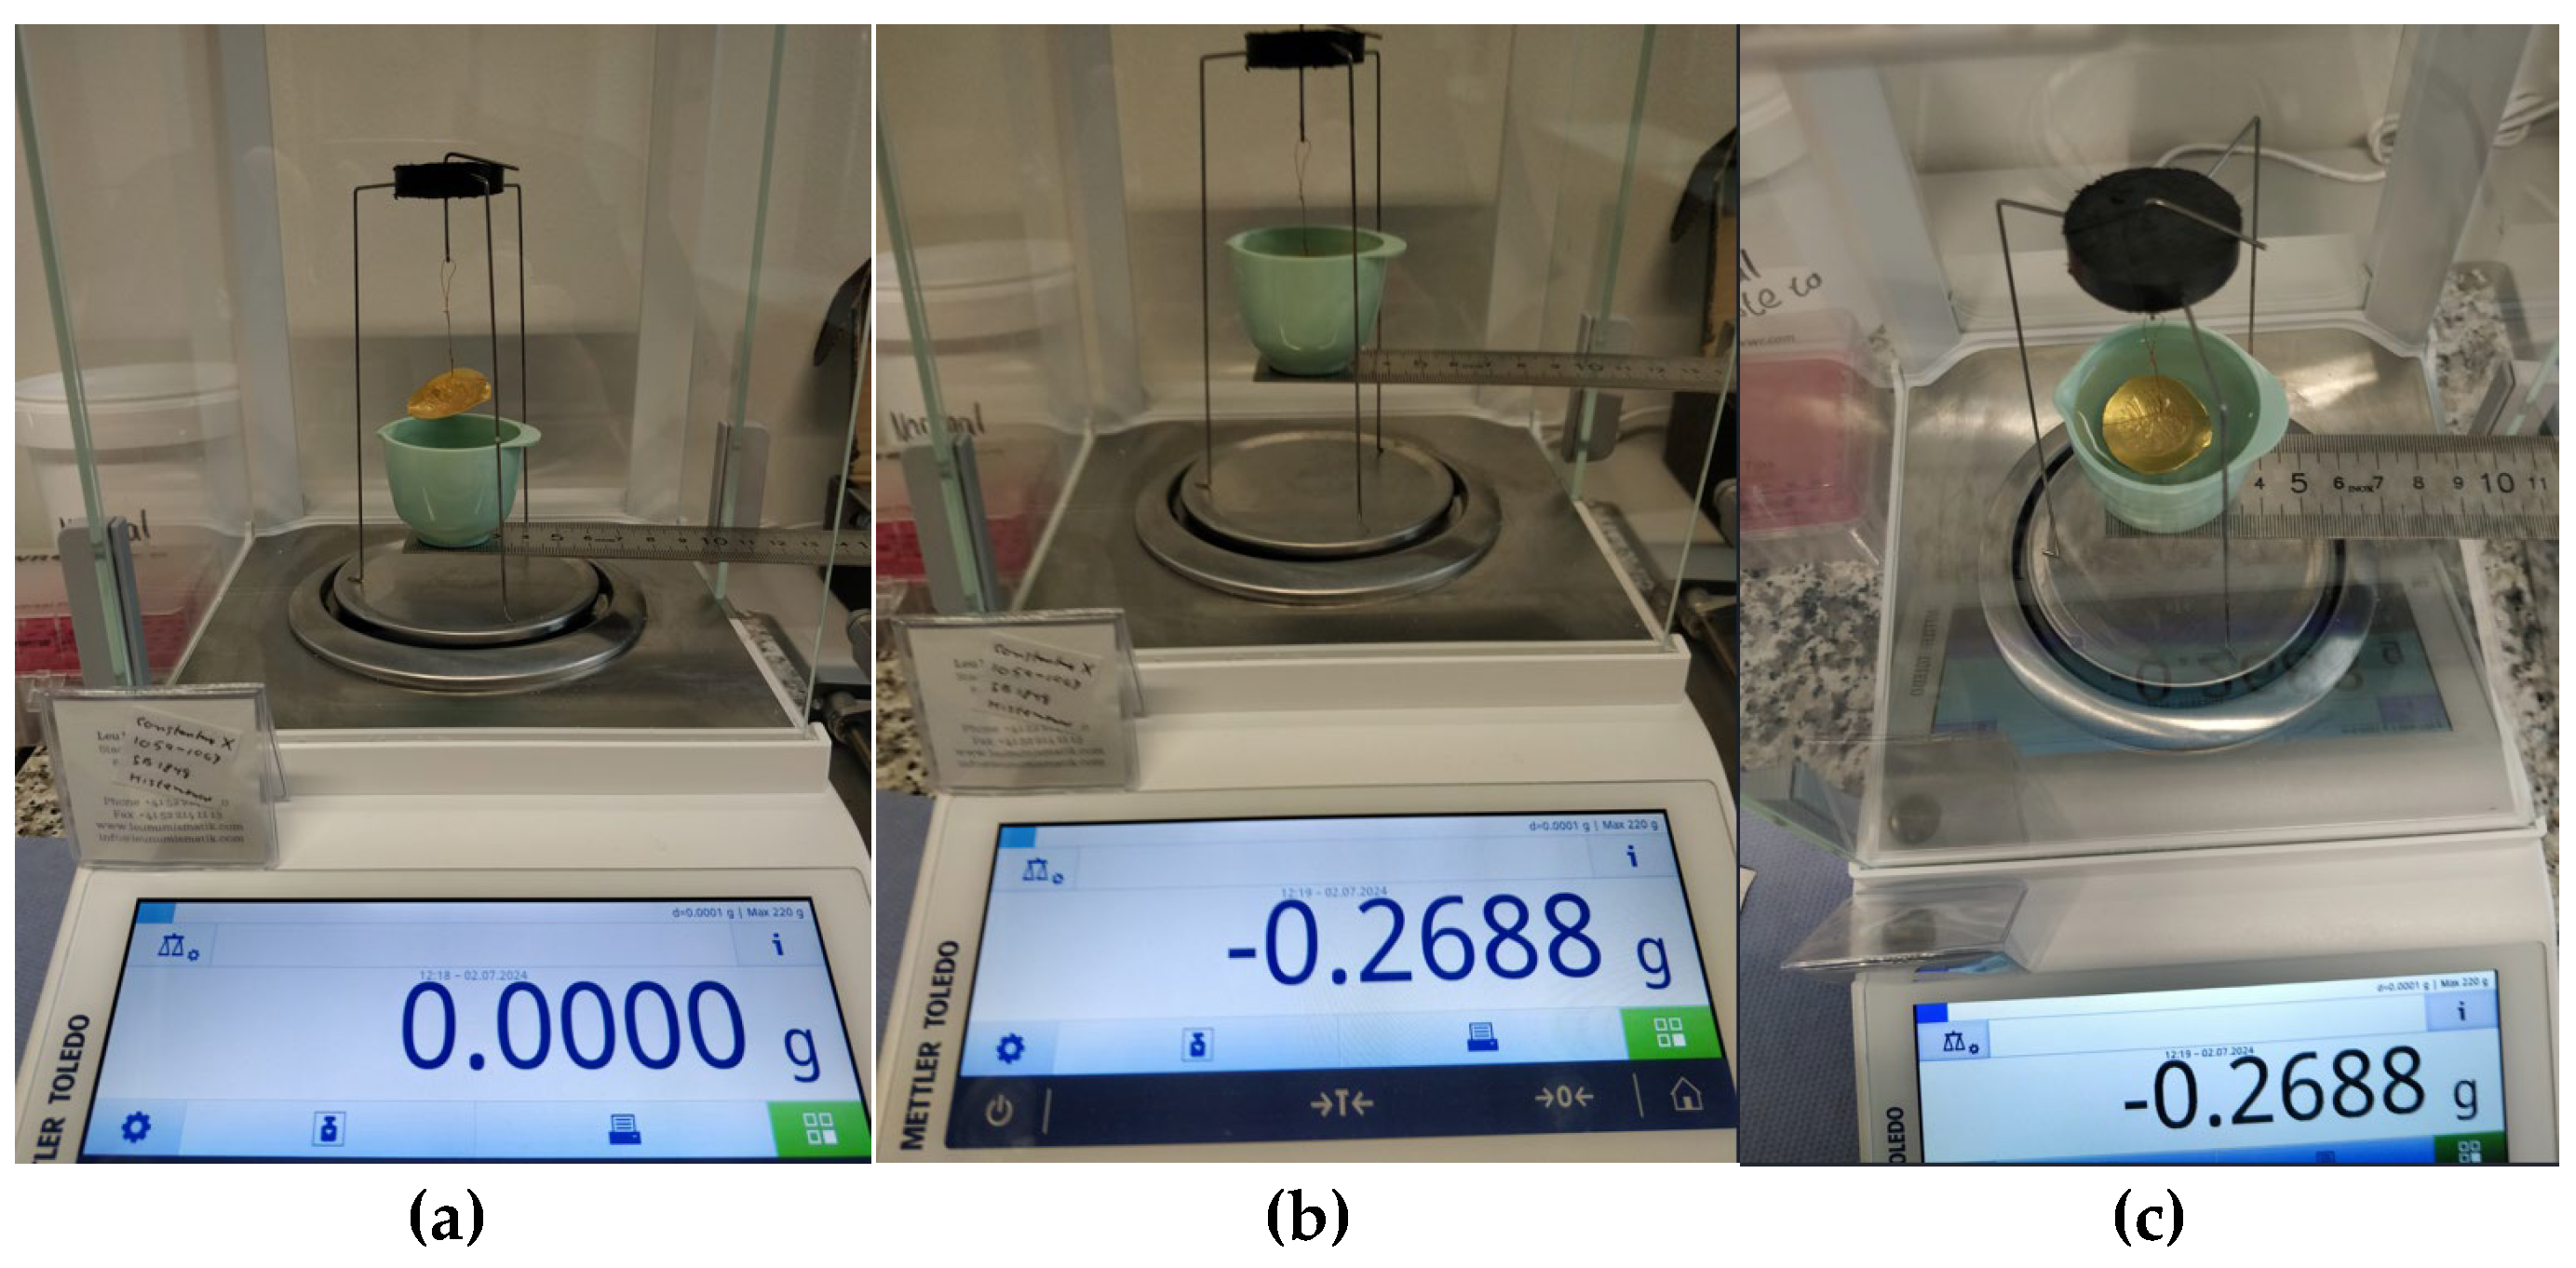
2.3. Bulk Specific Density via Volume/Weight Estimation
2.4. Bulk Specific Density Estimation via XRF Data
2.5. SEM Analysis
3. Results
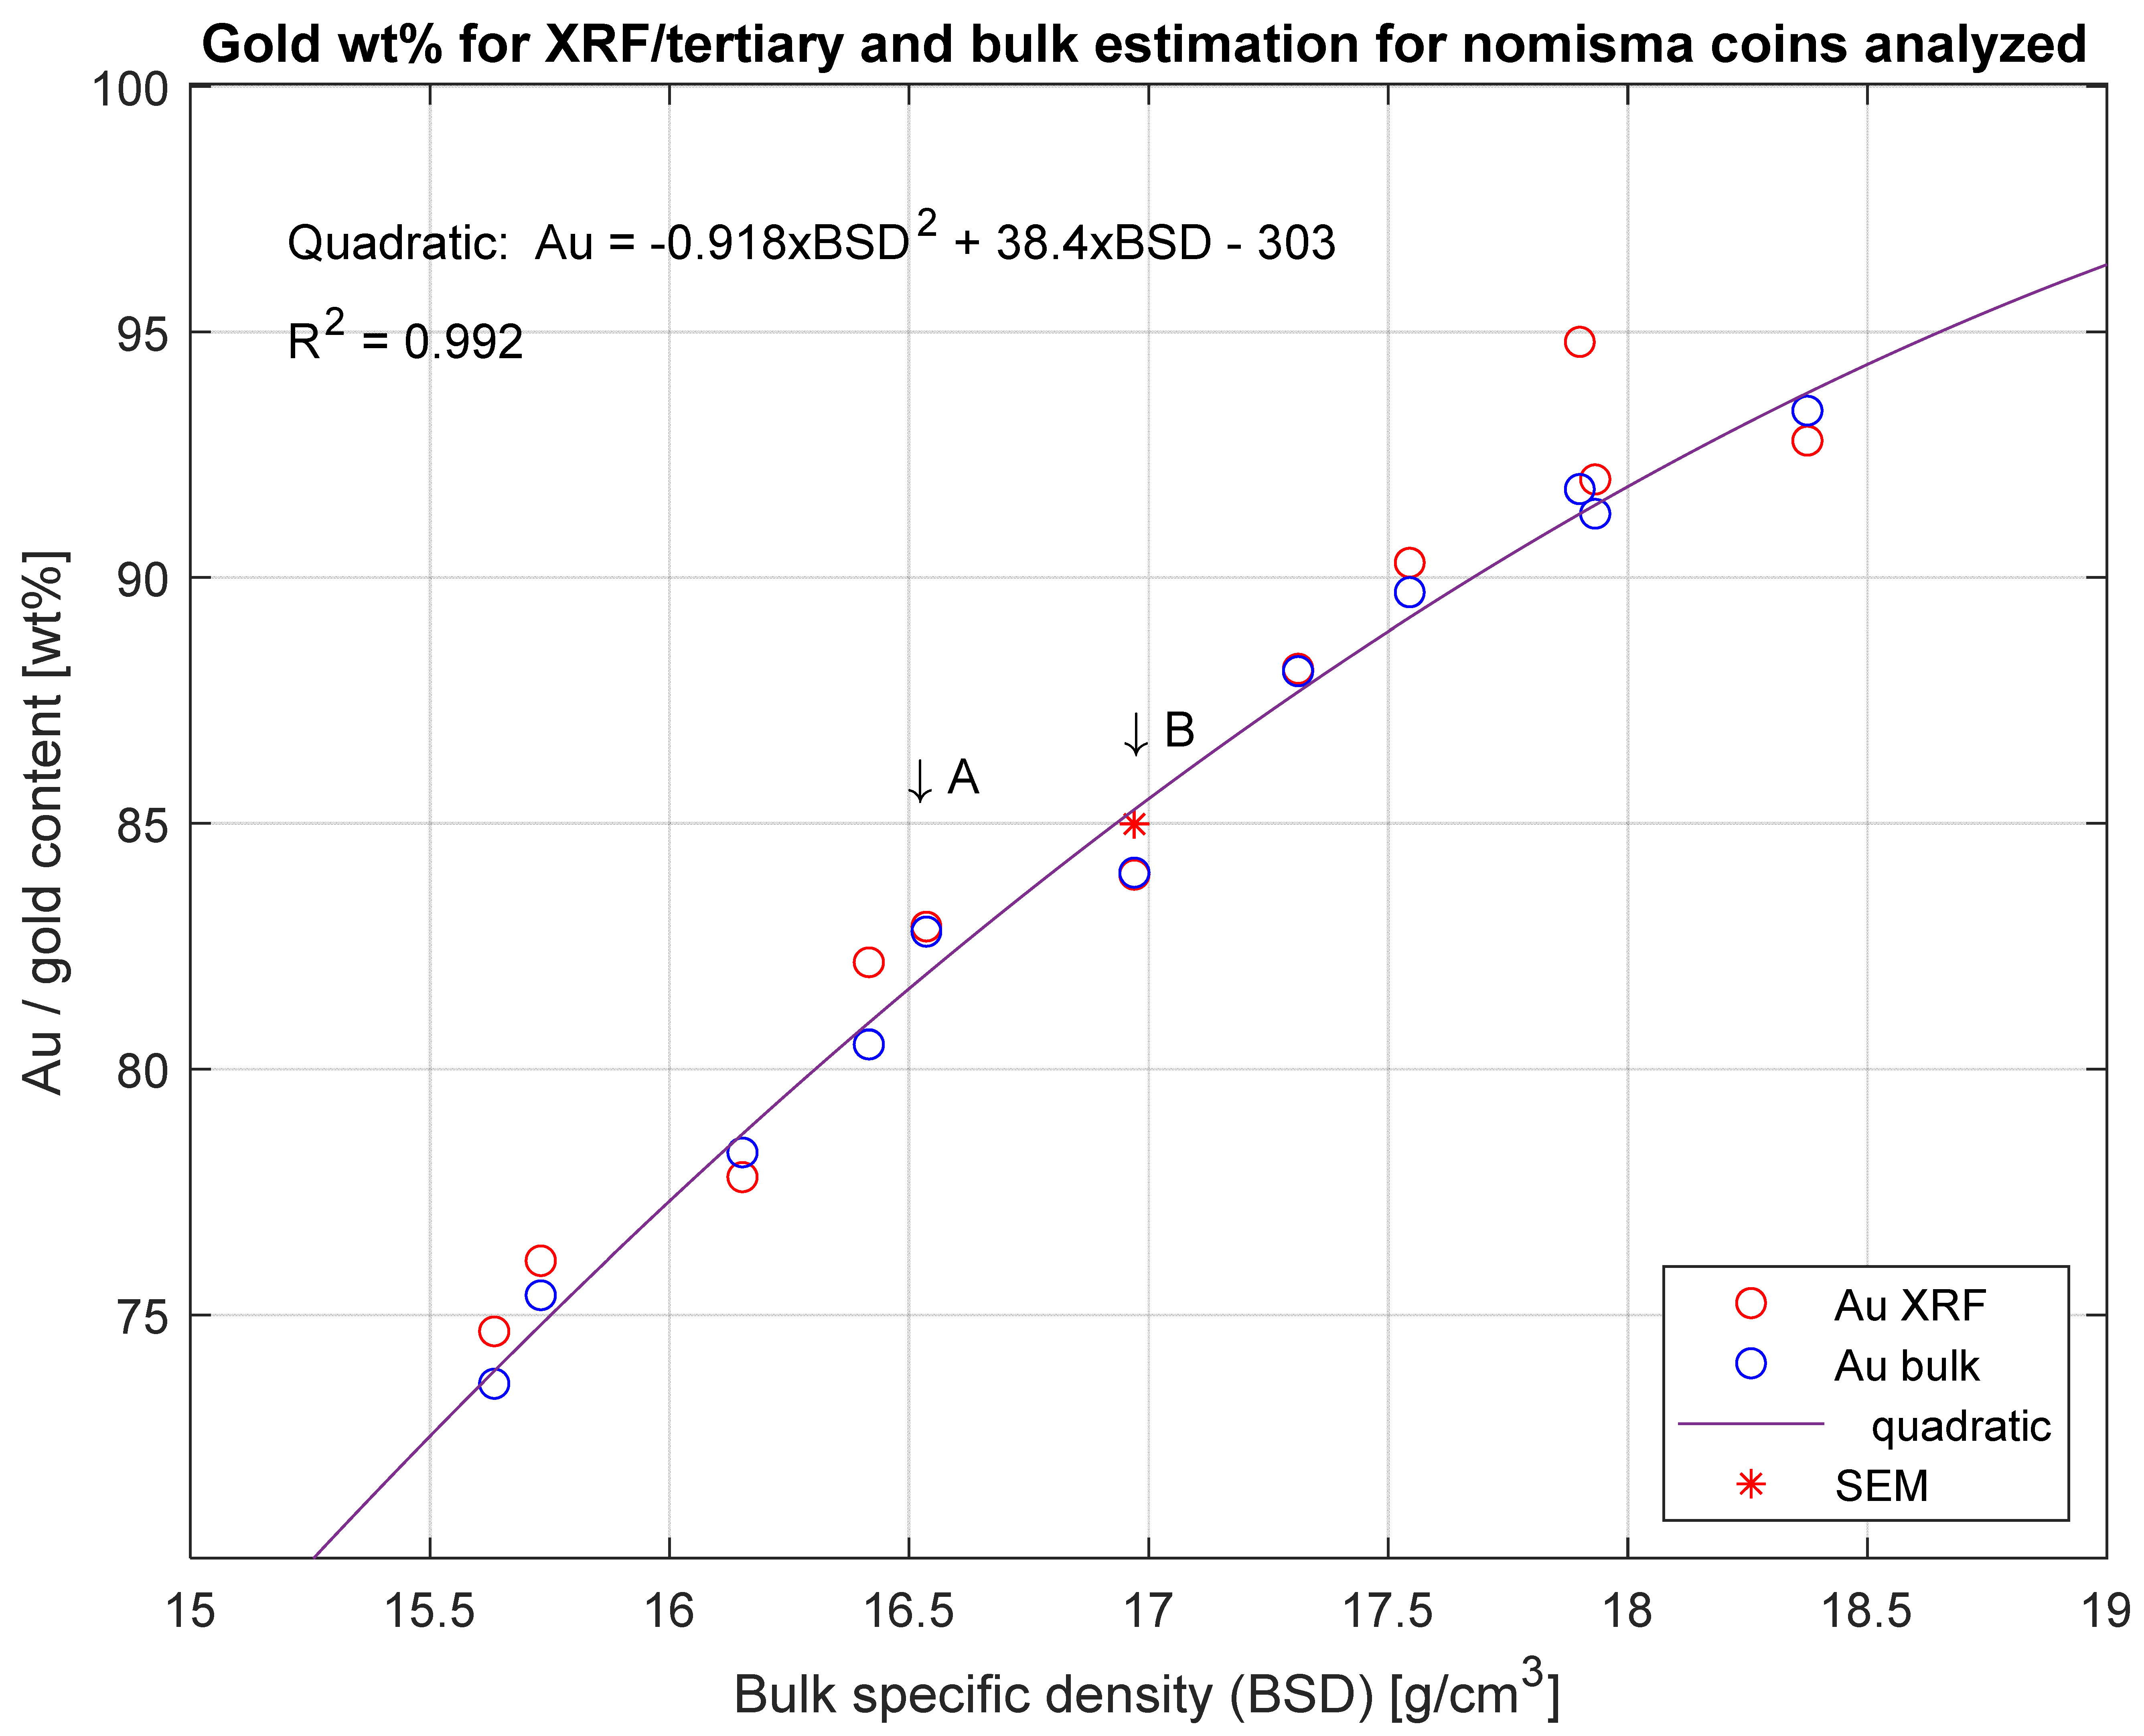
3.1. Specific Density (SD) Estimation via XRF/Ternary Plot
3.2. Specific Density (SD) and Gold Content Estimation via Volume, Weight and Ternary Plots
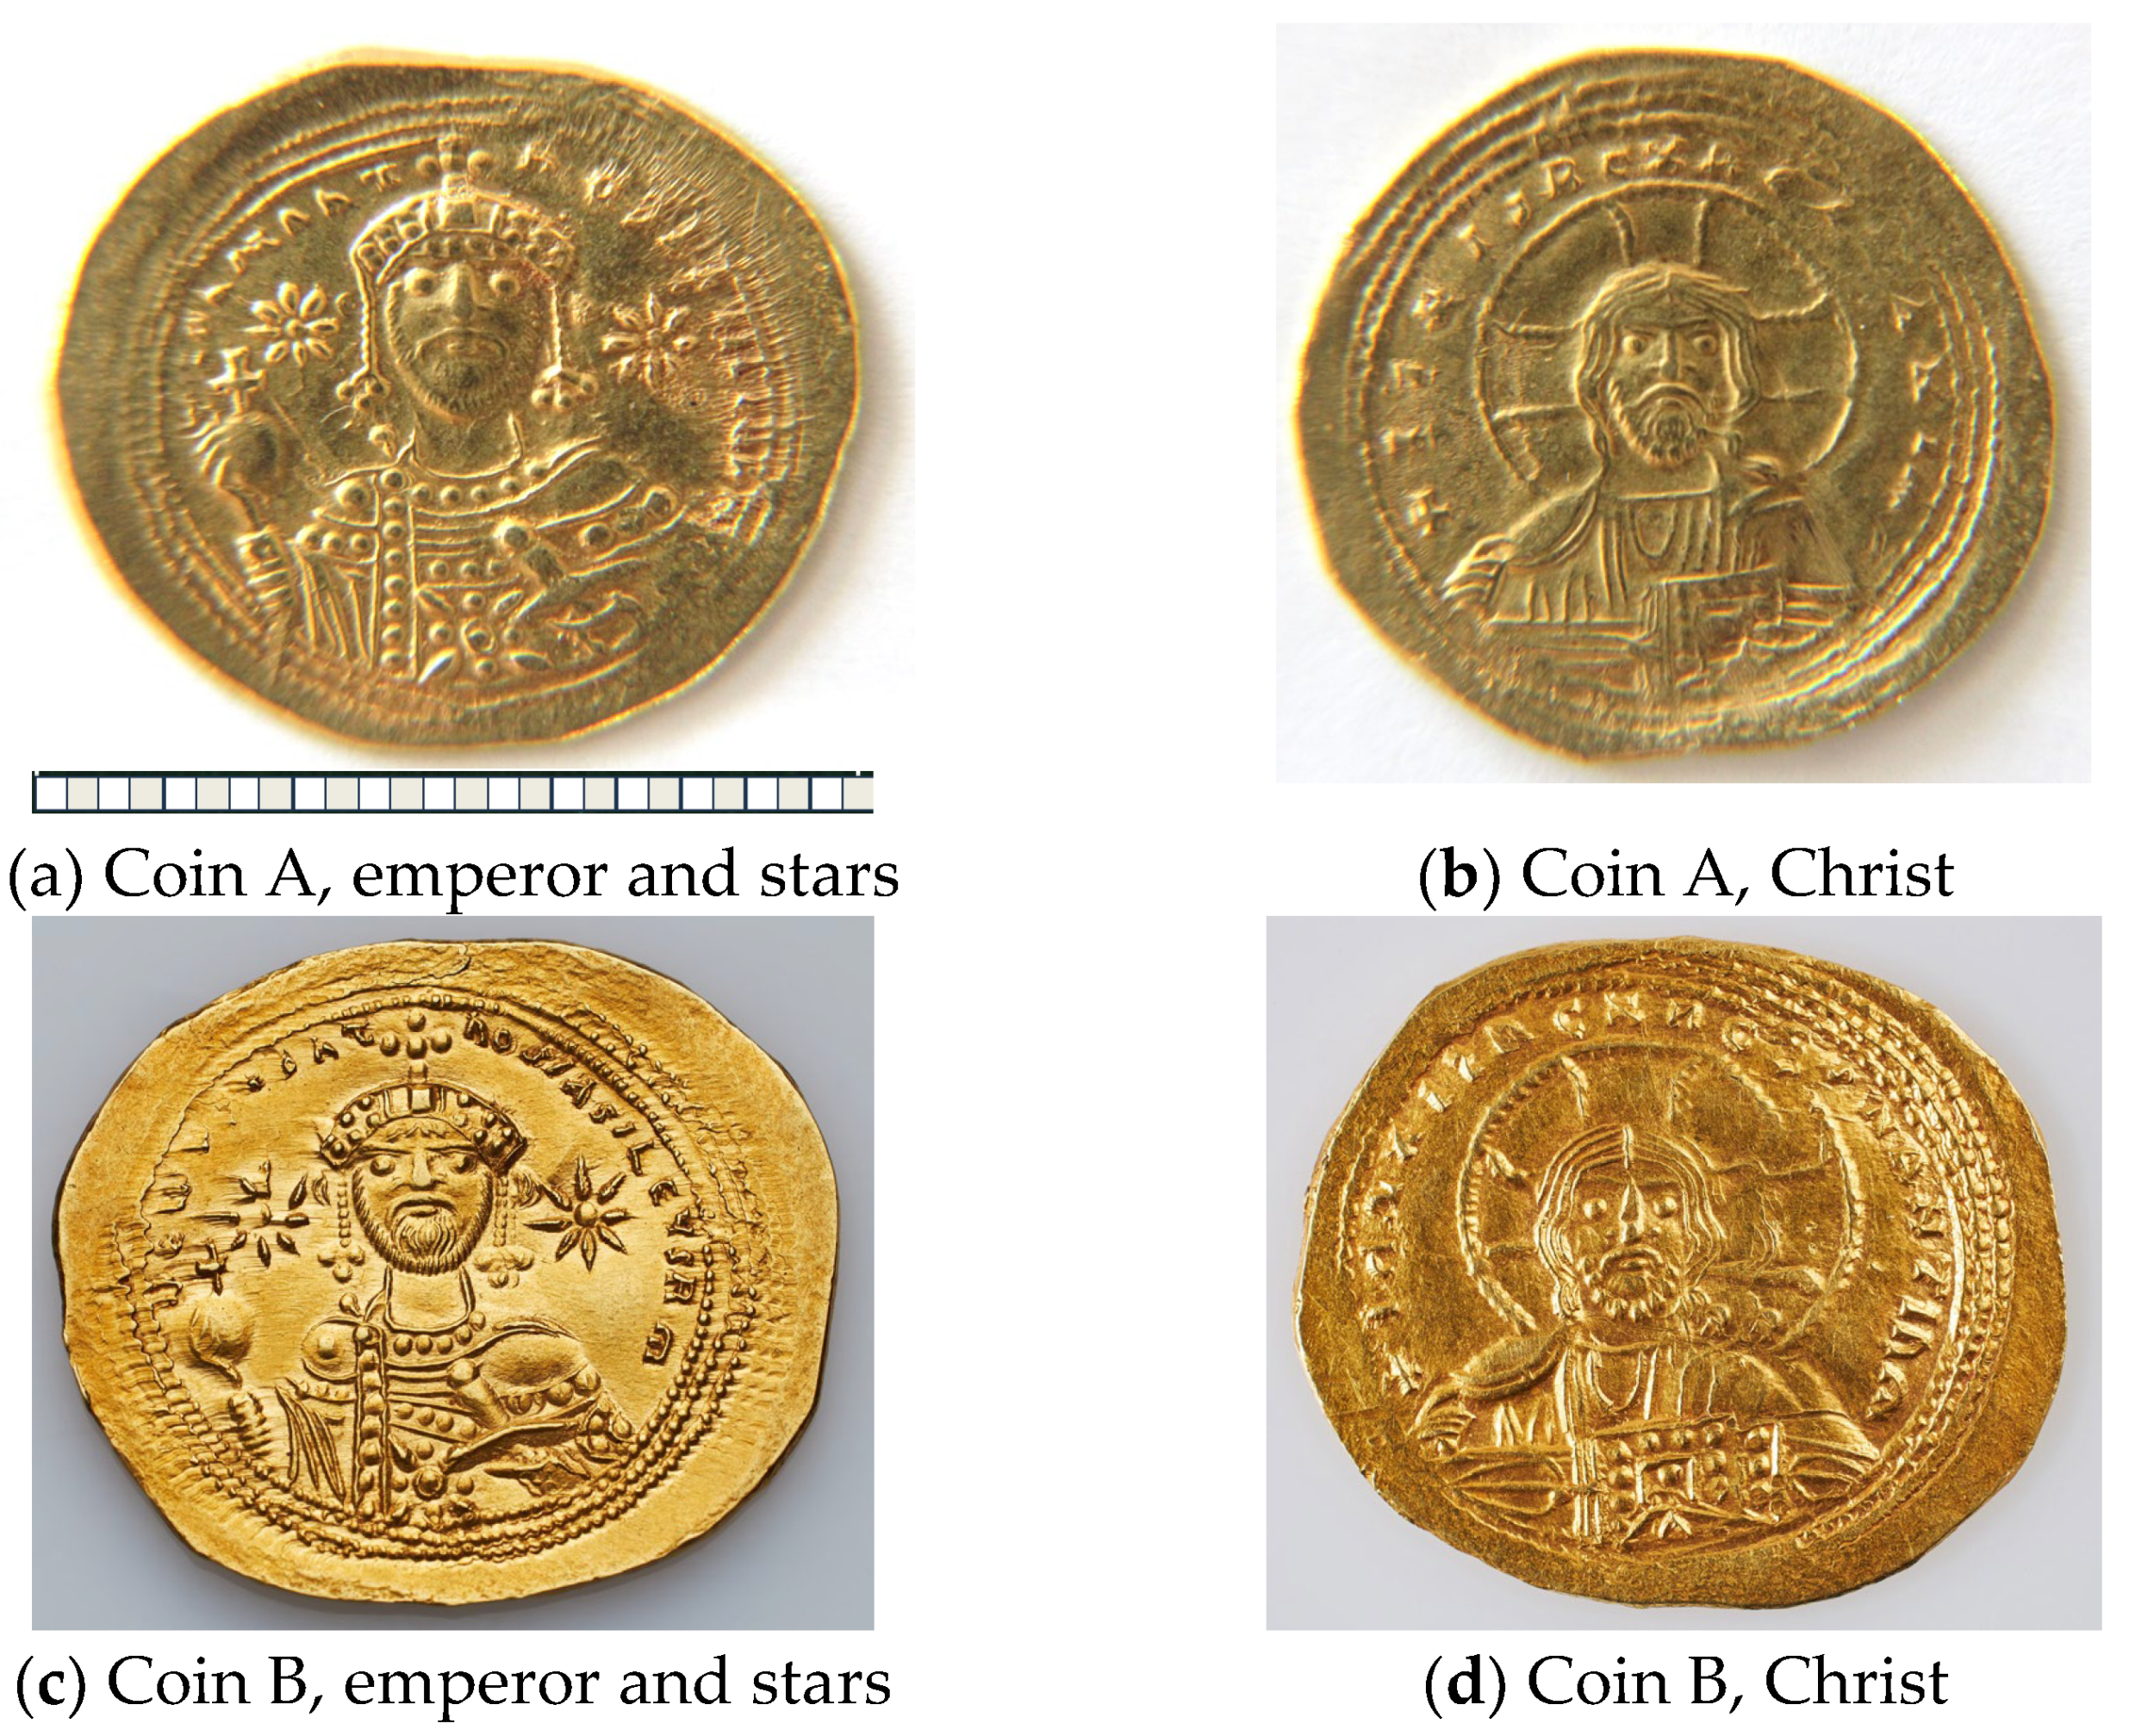
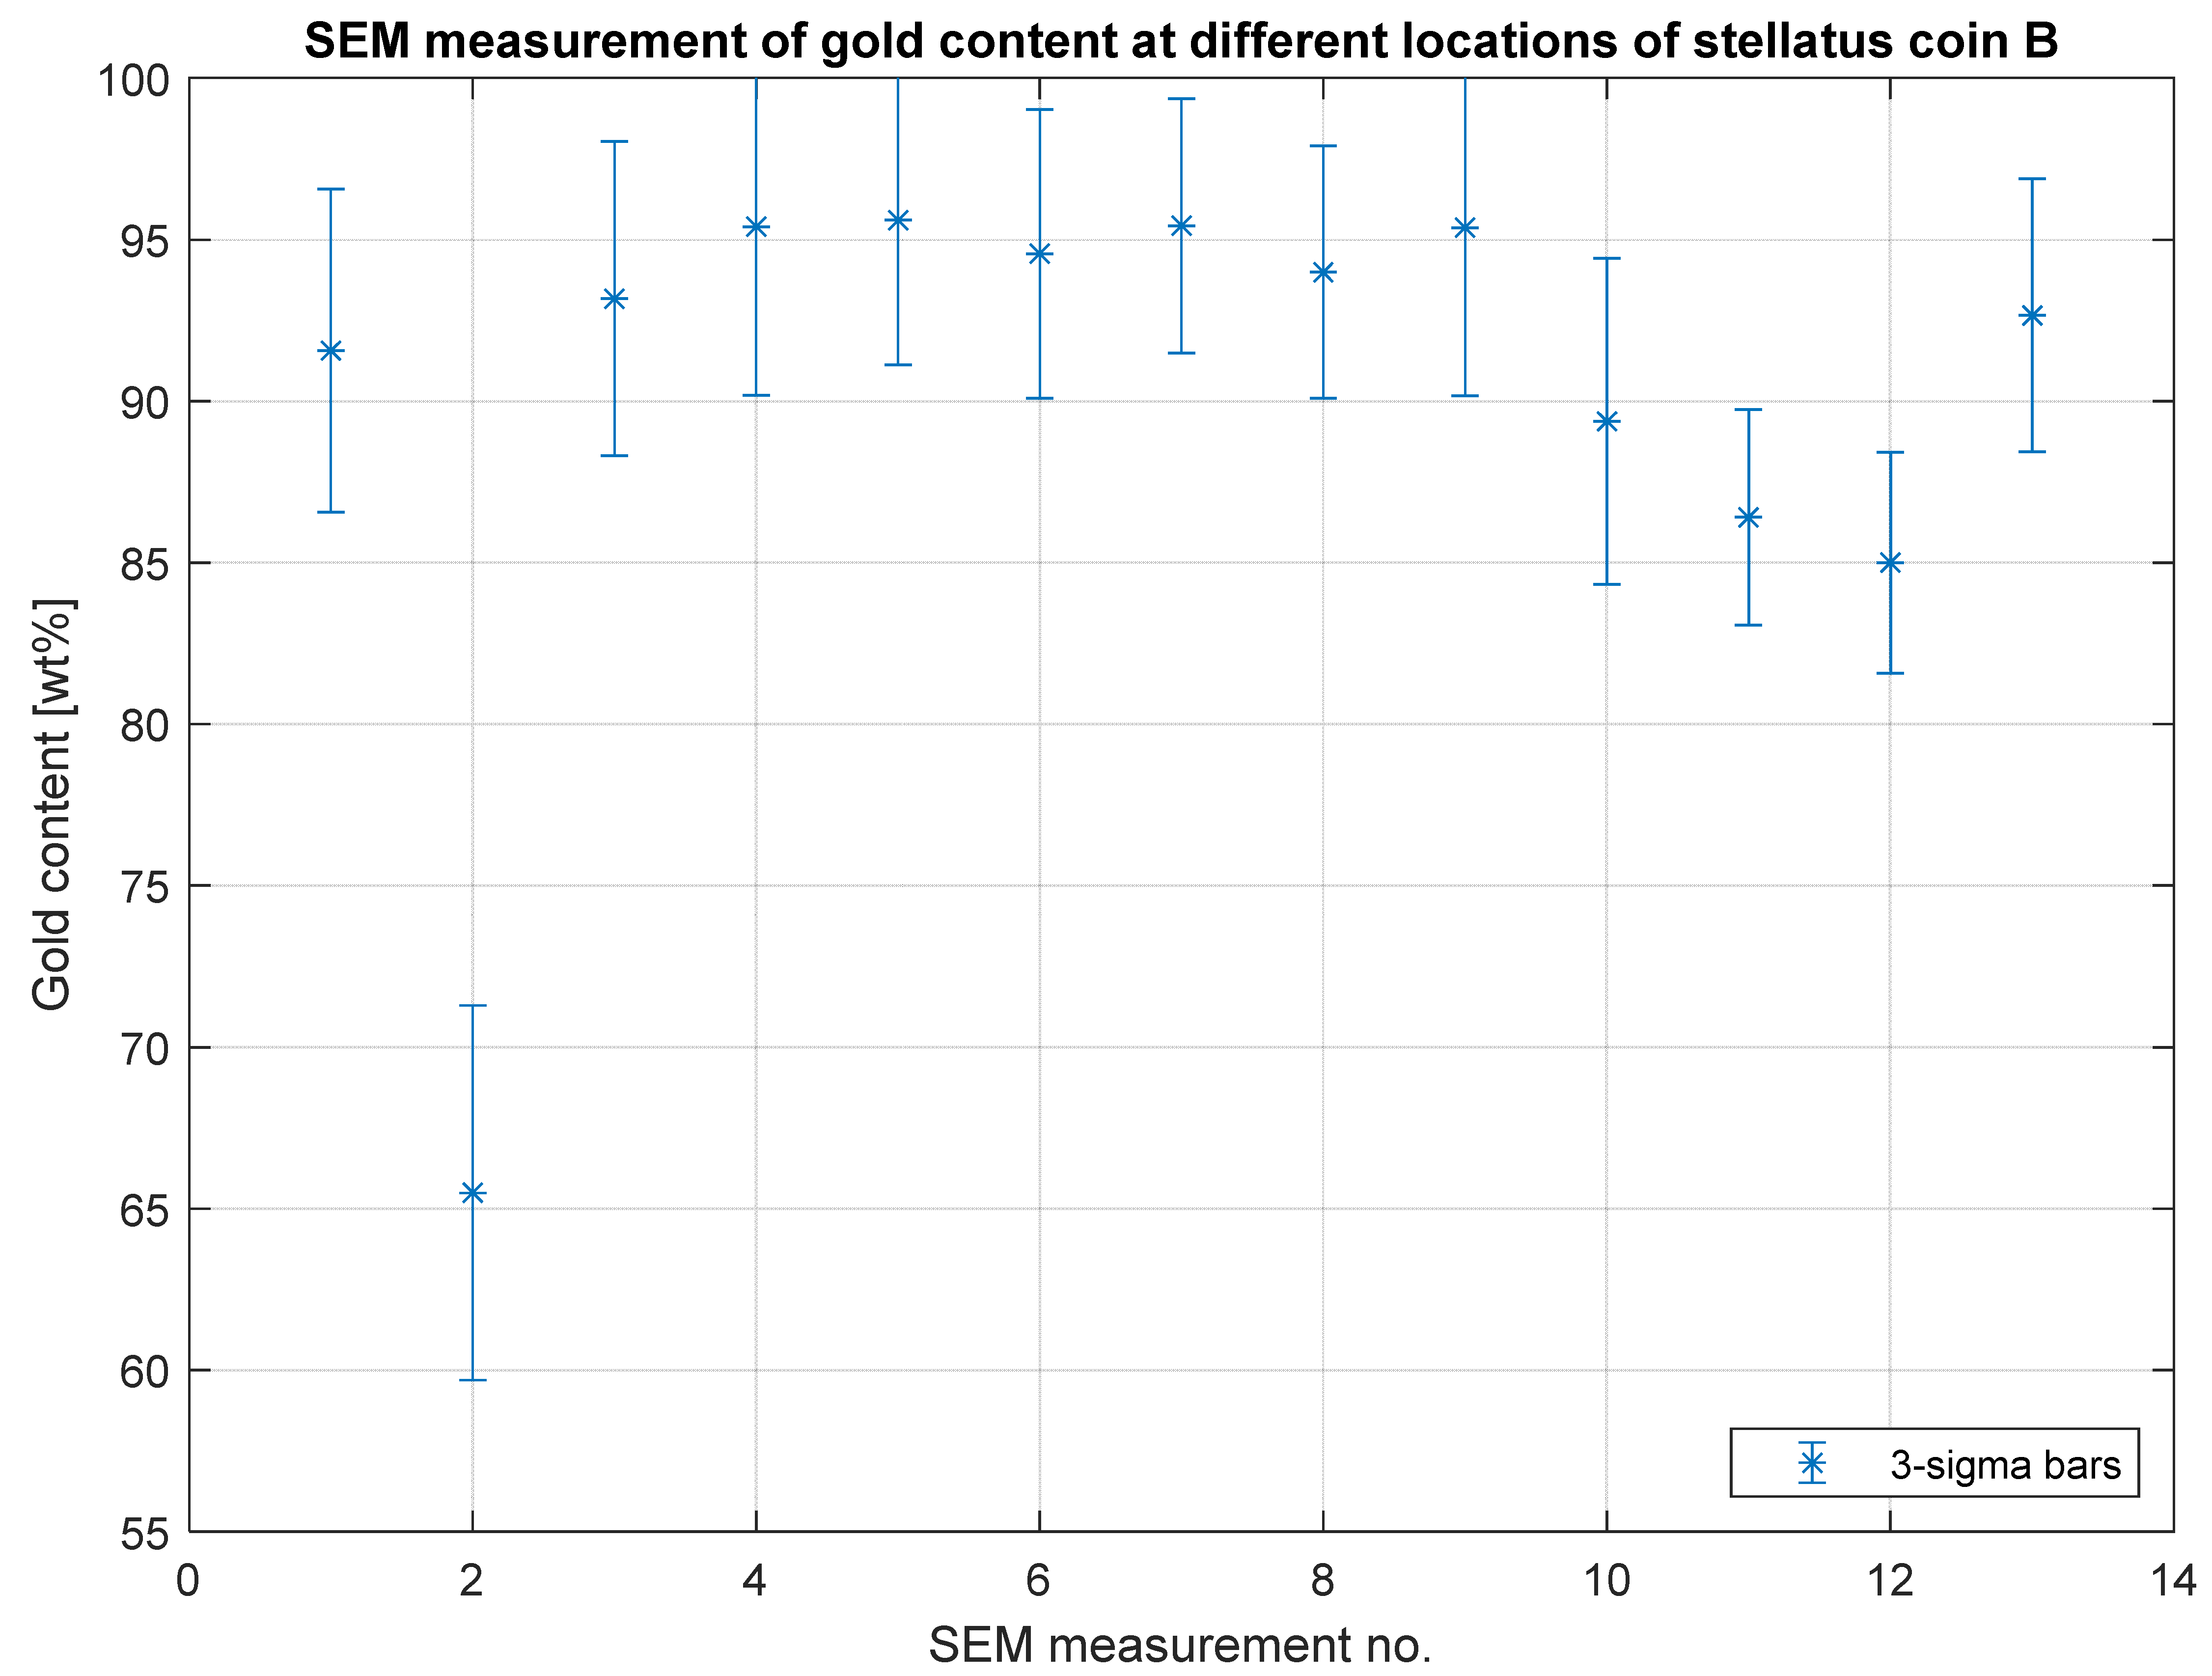
3.3. SEM Analysis of “Stellatus” Coin B
3.4. Comparison of Results
4. Relation to the Supernova SN1054
4.1. Historical Records of the Supernova SN1054
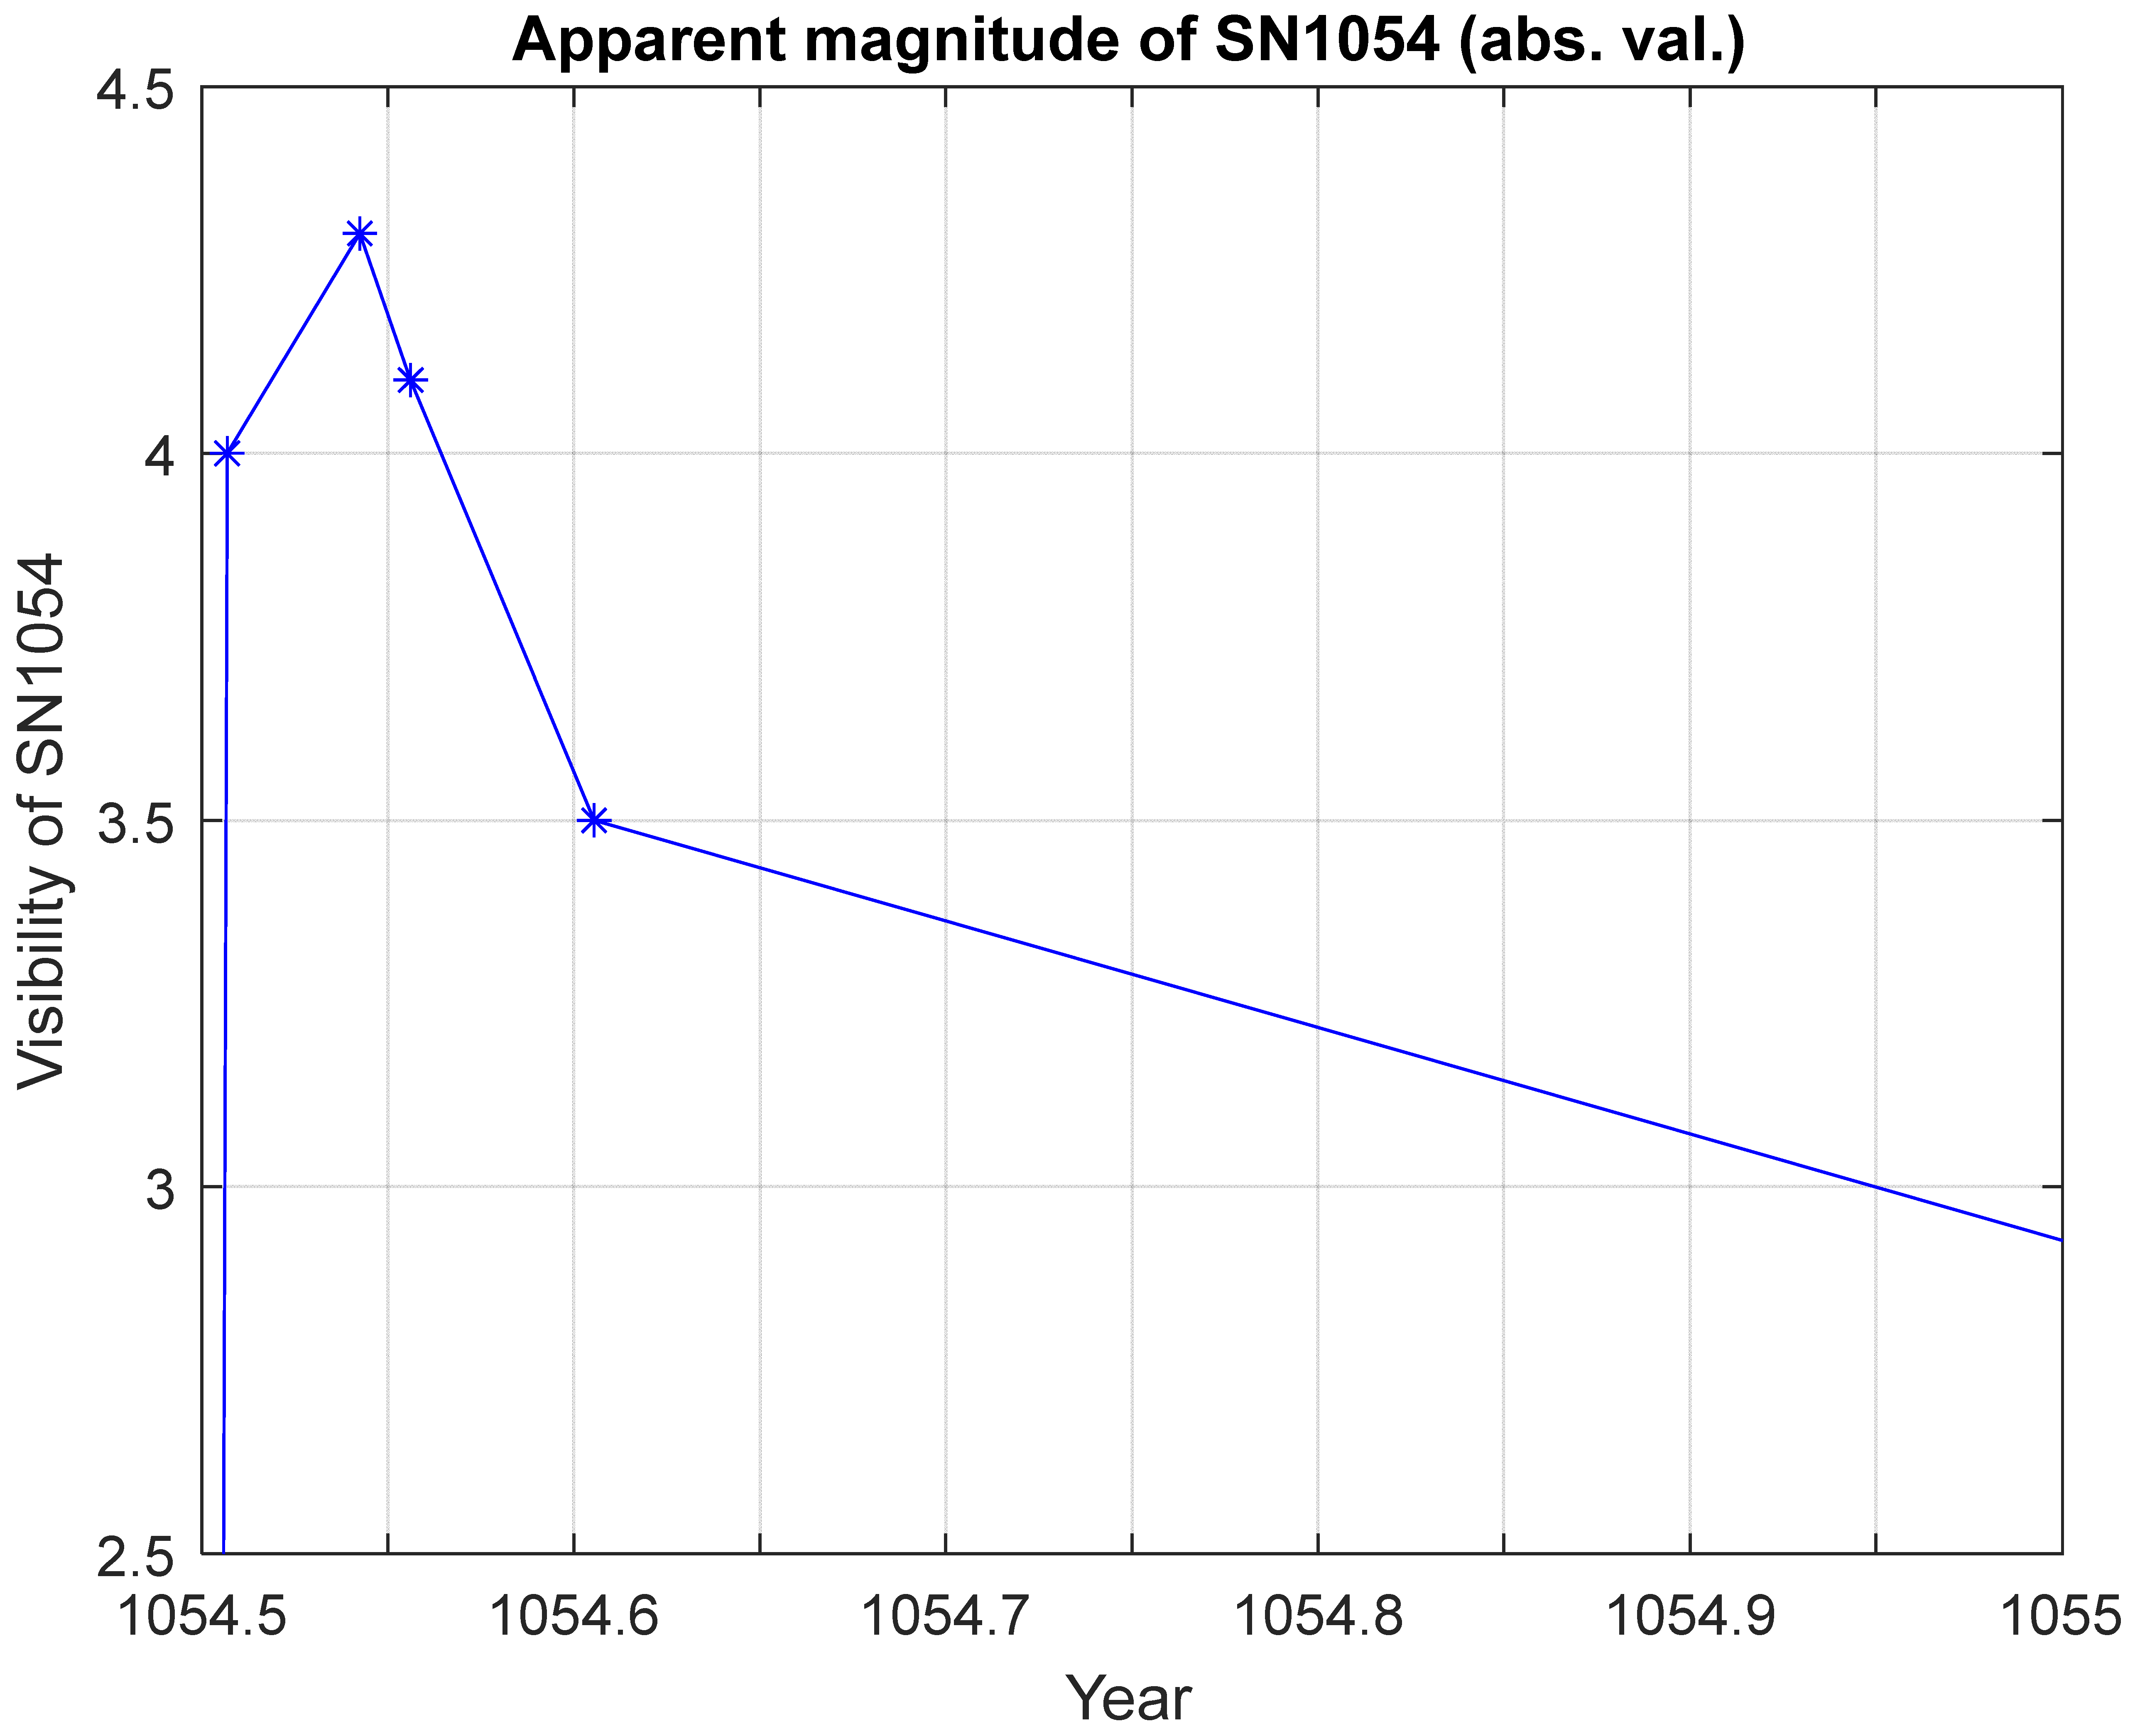
4.2. Supernova SN1054 Visibility
4.3. Star Size Relationship to Magnitude
5. Conclusions
Funding
Data Availability Statement
Acknowledgments
Conflicts of Interest
Abbreviations
| SEM | Scanning electron microscope |
| SD | Specific density |
| EDX | Energy-dispersive X-ray spectroscopy |
| wt% | Weight percent |
| XRF | X-ray fluorescence spectroscopy |
| AD | Anno Domine |
References
- Morrison, C. La dévaluation de la monnaie byzantine au XIe siècle: Essai d’interprétation. In Travaux et Mémoires du Centre d’Histoire et de Civilisation de Byzance. Tiré à Part des "Travaux et Mémoires" du Centre de Recherche d’Histoire et Civilisation de Byzance, 1976, N° 6; de Boccard: Paris, France, 1976; pp. 3–47. [Google Scholar]
- Kaplanis, C. The Debasement of the “Dollar of the Middle Ages”. J. Econ. Hist. 2003, 63, 768–801. [Google Scholar] [CrossRef]
- Morrisson, C.; Barrandon, J.-N.; Brenot, C. Composition and Technology of Ancient and Medieval Coinages: A Reassessment of Analytical Results. Museum Notes (American Numismatic Society); American Numismatic Society: New York, NY, USA, 1987; Volume 32, pp. 181–209. [Google Scholar]
- Oddy, W.A.; La Niece, S. Byzantine gold coins and jewelry-A study of gold contents. Gold Bull. 1986, 19, 19–27. [Google Scholar] [CrossRef]
- Filipovic, M.D.; Payne, J.L.; Jarrett, T.; Tothill, N.F.; Urošević, D.; Kavanagh, P.J.; Longo, G.; Crawford, E.J.; Collier, J.D.; Ilić, M. European Historical Evidence Of The Supernova Of Ad 1054 Sky Above Europe On 4th July 1054. Eur. J. Sci. Theol. 2021, 17, 147–160. [Google Scholar]
- Sear, D.R. Byzantine Coins and Their Values, 2nd ed.; Seaby Publications: London, UK, 1974. [Google Scholar]
- Stockholms Auktionsverk. Lot 3723558. On Sale 30. September 2024. Available online: https://auctionet.com/sv/3723558-guldmynt-konstantin-ix-monomachos-bysantinsk-kejsare-1042-1055-histamenon-nomisma (accessed on 2 June 2025).
- Markowitz, M. Why Did Byzantine Coinage Become Cup-Shaped in the XIth Century? Washington Ancient Numismatic Society: Washington, DC, USA, 20 April 2014. [Google Scholar]
- Oddy, W.A. The Analysis of Gold Coins–A Comparison of Results Obtained by Non-Destructive Methods. Archaeometry 1972, 14, 109–117. [Google Scholar] [CrossRef]
- Grierson, P. Byzantine Coinage; Dumbarton Oaks Research Library and Collection: Washington, DC, USA, 1999. [Google Scholar]
- Filipovic, M.D.; Ilić, M.; Jarrett, T.; Payne, J.L.; Urošević, D.; Tothill, N.F.; Kavanagh, P.J.; Longo, G.; Crawford, E.J.; Collier, J.D. European historical evidence of the supernova of AD 1054 Balkan medieval tombstones. Eur. J. Sci. Theol. 2021, 17, 11–20. [Google Scholar]
- Grierson, P. Byzantine Coinage; Dumbarton Oaks Byzantine Collection Publications: Washington, DC, USA, 1982. [Google Scholar]
- Guerra, M.F.; Radtke, M.; Reiche, I.; Riesemeier, H.; Strub, E. Analysis of trace elements in gold alloys by SR-XRF at high energy at the BAMline. In Nuclear Instruments and Methods in Physics Research Section B: Beam Interactions with Materials and Atoms; Elsevier: Amsterdam, The Netherlands, 2008. [Google Scholar] [CrossRef]
- Stankiewicz, W.; Bolibrzuch, B.; Marczak, M. Gold and gold alloy reference materials for XRF analysis. Gold Bull. 1998, 31, 119–125. [Google Scholar] [CrossRef]
- Baldassarri, M.; Esposito, A.; Ferretti, M.; Catalli, F. XRF analysis of Roman Imperial coins. Nucl. Instrum. Methods Phys. Res. Sect. B Beam Interact. Mater. Atoms. J. Archaeol. 2014, 309, 268–271. [Google Scholar] [CrossRef]
- Beckhoff, B.; Kanngießer, B.; Langhoff, N.; Wedell, R.; Wolff, H. (Eds.) Handbook of Practical X-Ray Fluorescence Analysis; Springer: Berlin/Heidelberg, Germany, 2006. [Google Scholar]
- ThermoFisher Scientific Magazine. XRF-technology in the field. In XRF Technology for Non-Scientists; EB-XRF-0121 V02; Thermo Fisher Scientific Inc.: Waltham, MA, USA, 2021; Available online: https://www.thermofisher.com/xrf (accessed on 9 October 2024).
- Caley, E.R. Validity of the Specific Density Method for the Determination of the Finesse of Gold Objects. Available online: https://api.semanticscholar.org/CorpusID:2675688 (accessed on 9 October 2024).
- Blakelock, E.S. Never judge a god object by its surface analysis: A study of surface phenomena in a selection of gold objects from the Staffordshire hoard. Archaeometry 2016, 58, 912–929. [Google Scholar] [CrossRef]
- Oddy, W.A.; Blackshaw, S.M. The Accuracy of the Specific Density Method for the Analysis of Gold Alloys. Archaeometry 1974, 16, 81–90. [Google Scholar] [CrossRef]
- Jonson, T. The Byzantine Mint in Carthage and the Islamic Mint in North Africa. In New Metallurgical Findings; Revue Numismatique: Paris, France, 2014; Volume 171, ISSN 0484-8942. [Google Scholar]
- Kraut, J.C.; Stern, W.B. The Density of Gold-Silver-Copper Alloys and its Calculation from the Chemical Composition. Gold Bull. 2000, 33, 52–55. [Google Scholar] [CrossRef]
- Shimadzu Corporation, 2023/First Edition: February 2023, 3655-12213-PDFIK, C142-E049. Available online: https://www.shimadzu.com/an/products/elemental-analysis/edx-fs/edx-700080008100/index.html (accessed on 2 June 2025).
- References: KM# 809, Schön# 17, Fr# 298. Available online: https://en.numista.com/catalogue/pieces26769.html (accessed on 2 June 2025).
- Refrence manual: Precision and Analytical Balances MS-TS, Publ no. 30235435J en. Mettler-Toledo GmbH. Available online: https://www.mt.com/ca/en/home/phased_out_products/Laboratory_Weighing_Solutions/analytical-balances/MS204TS.html (accessed on 2 June 2025).
- Engineering ToolBox (2001) [online]. Available online: https://www.engineeringtoolbox.com (accessed on 30 May 2025).
- Iinstruction manual for model S-4800field emission scanning electron microscope. Available online: https://www.scu.edu/media/school-of-engineering/photos/cns/SEM-Hitachi-S-4800-Instruction-Manual.pdf (accessed on 16 June 2025).
- Jarrett, J. Why did the Byzantine Coinage turn Concave? Old Suggestions and a New One. In XV International Numismatic Congress Taormina 2015 Proceedings, International Numismatic Council/Conseil international de numismatique, Winterthur, Switzerland; Messina: Rome, Italy, 2015. [Google Scholar]
- Clark, D.H.; Stephenson, F.R. The historical Supernovae; Pergamon Press: Elmsford, NY, USA, 1979; ISBN 0-08-020914-9. [Google Scholar]
- Filipovic, M.D.; Payne, J.L.; Jarret, T.; Tothill, N.F.; Crawford, E.J.; Urošević, D.; Longo, G.; Collier, J.D.; Kavanagh, P.J.; Matthew, C.; et al. European historical evidence of the supernova of AD 1054 Coins of Constantine IX and SN1054. Eur. J. Sci. Theol. 2022, 18, 51–66. [Google Scholar]


| Coin No. | Emperor | Period | Sear Ref. |
|---|---|---|---|
| 1 | Constine IX, type I | 1042–1055 | Sear 1828 |
| 2 | Constine IX, type I | 1042–1055 | Sear 1828 |
| 3 | Constine IX, Type II | 1042–1055 | Sear 1829 |
| 4 | Constine IX, B, type IV | 1042–1055 | Sear 1831 |
| 5 | Constine IX, A, type IV | 1042–1055 | Sear 1831 |
| 6 | Constine IX, Type III | 1042–1055 | Sear 1830 |
| 7 | Isaac I | 1057–1059 | Sear 1843 |
| 8 | Constine X | 1059–1067 | Sear 1848 |
| 9 | Romanus IV | 1068–1071 | Sear 1861 |
| 10 | Michael VII | 1071–1078 | Sear 1868 |
| 11 | Alexius I | 1081–1118 | Sear 1912 |
| Analyte | Result | 3-Sigma | Proc. Calc. | Line | Int. (Cps/uA) |
|---|---|---|---|---|---|
| Au | 83.938% | 0.207 | Quan-FP | AuLa | 2491.9247 |
| Ag | 11.917% | 0.118 | Quan-FP | AgKa | 152.4824 |
| Cu | 3.426% | 0.025 | Quan-FP | CuKa | 277.0127 |
| Fe | 0.218% | 0.006 | Quan-FP | FeKa | 9.6112 |
| K | 0.190% | 0.023 | Quan-FP | K Ka | 0.0877 |
| Cl | 0.154% | 0.049 | Quan-FP | Cl Ka | 0.0237 |
| Ca | 0.081% | 0.012 | Quan-FP | CaKa | 0.0540 |
| Mn | 0.075% | 0.011 | Quan-FP | MnKa | 2.4158 |
| Coin no. | Emperor | Period [AD] | Au [wt%] | Ag [wt%] | Cu [wt%] | Au (corr.) [wt%] | Tern. SD [g/cm3] |
|---|---|---|---|---|---|---|---|
| 1 | Const. IX | 1042–1055 | 92.7 | 5.2 | 1.0 | 92.0 | 17.93 |
| 2 | Const. IX | 1042–1055 | 95.5 | 1.9 | 1.6 | 94.8 | 17.90 |
| 3 | Const. IX | 1042–1055 | 91.0 | 6.8 | 1.4 | 90.3 | 17.54 |
| 4 | Const. IX, B | 1042–1055 | 84.7 | 11.8 | 2.7 | 84.0 | 16.97 |
| 5 | Const. IX, A | 1042–1055 | 83.6 | 11.9 | 3.4 | 82.9 | 16.54 |
| 6 | Const. IX | 1042–1055 | 93.5 | 5.0 | 1.0 | 92.8 | 17.88 |
| 7 | Isaac I | 1057–1059 | 78.5 | 16.5 | 3.7 | 76.8 | 16.15 |
| 8 | Const. X | 1059–1067 | 82.9 | 14.0 | 2.4 | 82.2 | 16.42 |
| 9 | Romanus IV | 1068–1071 | 76.8 | 19.8 | 2.6 | 76.1 | 15.73 |
| 10 | Michael VII | 1071–1078 | 75.4 | 20.7 | 1.9 | 74.7 | 15.63 |
| 11 | Alexius I | 1081–1118 | 88.9 | 7.8 | 2.9 | 88.2 | 17.31 |
| Coin No. | Emperor | Period | Vsample [mm3] | Msample [g] | Bulk SD [g/cm3] | Au [wt%] |
|---|---|---|---|---|---|---|
| 1 | Const. IX | 1042–1055 | 232.4 | 4.2631 | 18.3 | 93.4 |
| 2 | Const. IX | 1042–1055 | 245.0 | 4.3461 | 17.9 | 91.3 |
| 3 | Const. IX | 1042–1055 | 250.8 | 4.4011 | 17.6 | 89.7 |
| 4 | Const. IX, B | 1042–1055 | 259.8 | 4.4053 | 17.0 | 84.0 |
| 5 | Const. IX, A | 1042–1055 | 266.4 | 4.4047 | 16.5 | 82.8 |
| 6 | Const. IX | 1042–1055 | 242.0 | 4.3279 | 17.9 | 91.8 |
| 7 | Isaac I | 1057–1059 | 275.1 | 4.4432 | 16.2 | 78.3 |
| 8 | Const. X | 1059–1067 | 268.9 | 4.4139 | 16.4 | 80.5 |
| 9 | Romanus IV | 1068–1071 | 276.9 | 4.3557 | 15.7 | 75.4 |
| 10 | Michael VII | 1071–1078 | 279.7 | 4.3727 | 15.6 | 73.6 |
| 11 | Alexius I | 1081–1118 | 250.0 | 4.3270 | 17.3 | 88.1 |
| Meas. No. | Location | Au [wt%] | Ag [wt%] | Cu [wt%] |
|---|---|---|---|---|
| 1 | Surface | 91.6 | 5.9 | 1.5 |
| 2 | Surface | 65.5 | 0.5 | 3.0 |
| 3 | Surface | 93.2 | 4.7 | 2.1 |
| 4 | Surface | 95.4 | 3.1 | 1.6 |
| 5 | Surface | 95.6 | 3.6 | 0.9 |
| 6 | Surface | 94.6 | 4.3 | 1.2 |
| 7 | Surface | 95.4 | 3.5 | 1.2 |
| 8 | Surface | 94.0 | 4.8 | 1.3 |
| 9 | Surface | 95.4 | 4.5 | 1.7 |
| 10 | Surface | 89.4 | 4.6 | 1.2 |
| 11 | Surface | 86.4 | 11.3 | 2.3 |
| 12 | Inside scratch | 85.0 | 10.8 | 2.3 |
| 13 | Surface | 92.7 | 6.2 | 1.2 |
Disclaimer/Publisher’s Note: The statements, opinions and data contained in all publications are solely those of the individual author(s) and contributor(s) and not of MDPI and/or the editor(s). MDPI and/or the editor(s) disclaim responsibility for any injury to people or property resulting from any ideas, methods, instructions or products referred to in the content. |
© 2025 by the author. Licensee MDPI, Basel, Switzerland. This article is an open access article distributed under the terms and conditions of the Creative Commons Attribution (CC BY) license (https://creativecommons.org/licenses/by/4.0/).
Share and Cite
Paasch, K.M. A Preliminary Study of the Gold Content of Byzantine Coins and a Possible Link to the Supernova of Year AD 1054. Heritage 2025, 8, 230. https://doi.org/10.3390/heritage8060230
Paasch KM. A Preliminary Study of the Gold Content of Byzantine Coins and a Possible Link to the Supernova of Year AD 1054. Heritage. 2025; 8(6):230. https://doi.org/10.3390/heritage8060230
Chicago/Turabian StylePaasch, Kasper Mayntz. 2025. "A Preliminary Study of the Gold Content of Byzantine Coins and a Possible Link to the Supernova of Year AD 1054" Heritage 8, no. 6: 230. https://doi.org/10.3390/heritage8060230
APA StylePaasch, K. M. (2025). A Preliminary Study of the Gold Content of Byzantine Coins and a Possible Link to the Supernova of Year AD 1054. Heritage, 8(6), 230. https://doi.org/10.3390/heritage8060230