

Non-Destructive, Specular Laser Reflectometry and X-Ray Fluorescence Analysis Applied to Coins of the Gallic Roman Empire

 , ,
, ,  , ,
, ,
Abstract
1. Introduction
- Mint I struck radiates with draped and cuirassed busts (type D1: the emperor wears a cuirass covered by a military coat held together with a fibula at the front shoulder). The mint was organized in two workshops (officinae), which were occasionally marked by additional mint marks in the field. In the study, only coins from officina B were included.
- Mint II issued cuirassed portraits which might show a bulge of a mantle at the back shoulder (type B1). The coins were produced by a single workshop (officina).
2. Materials and Methods
2.1. Roman Coin Series
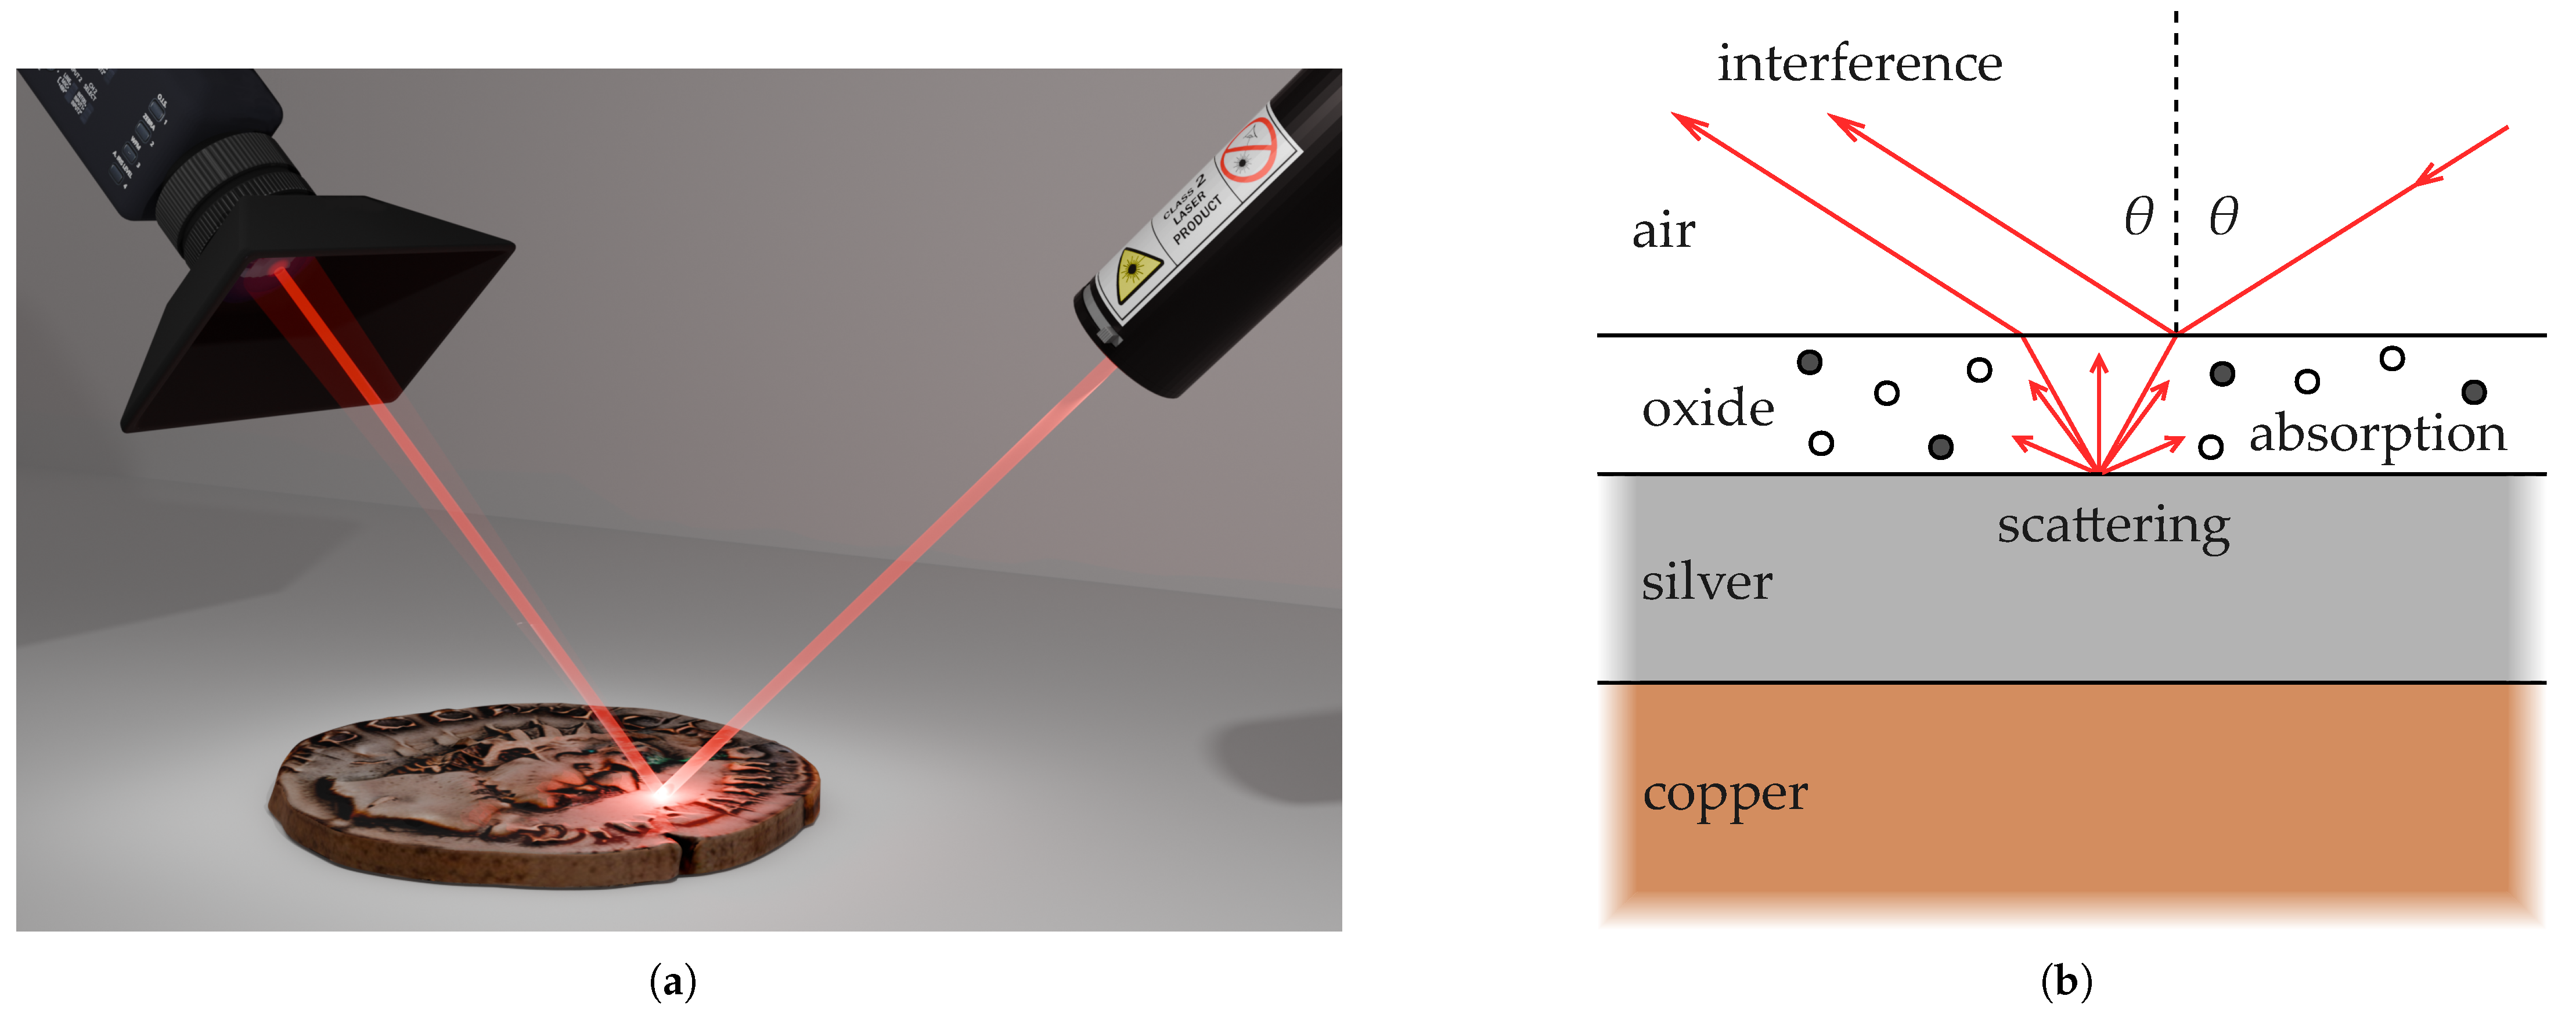
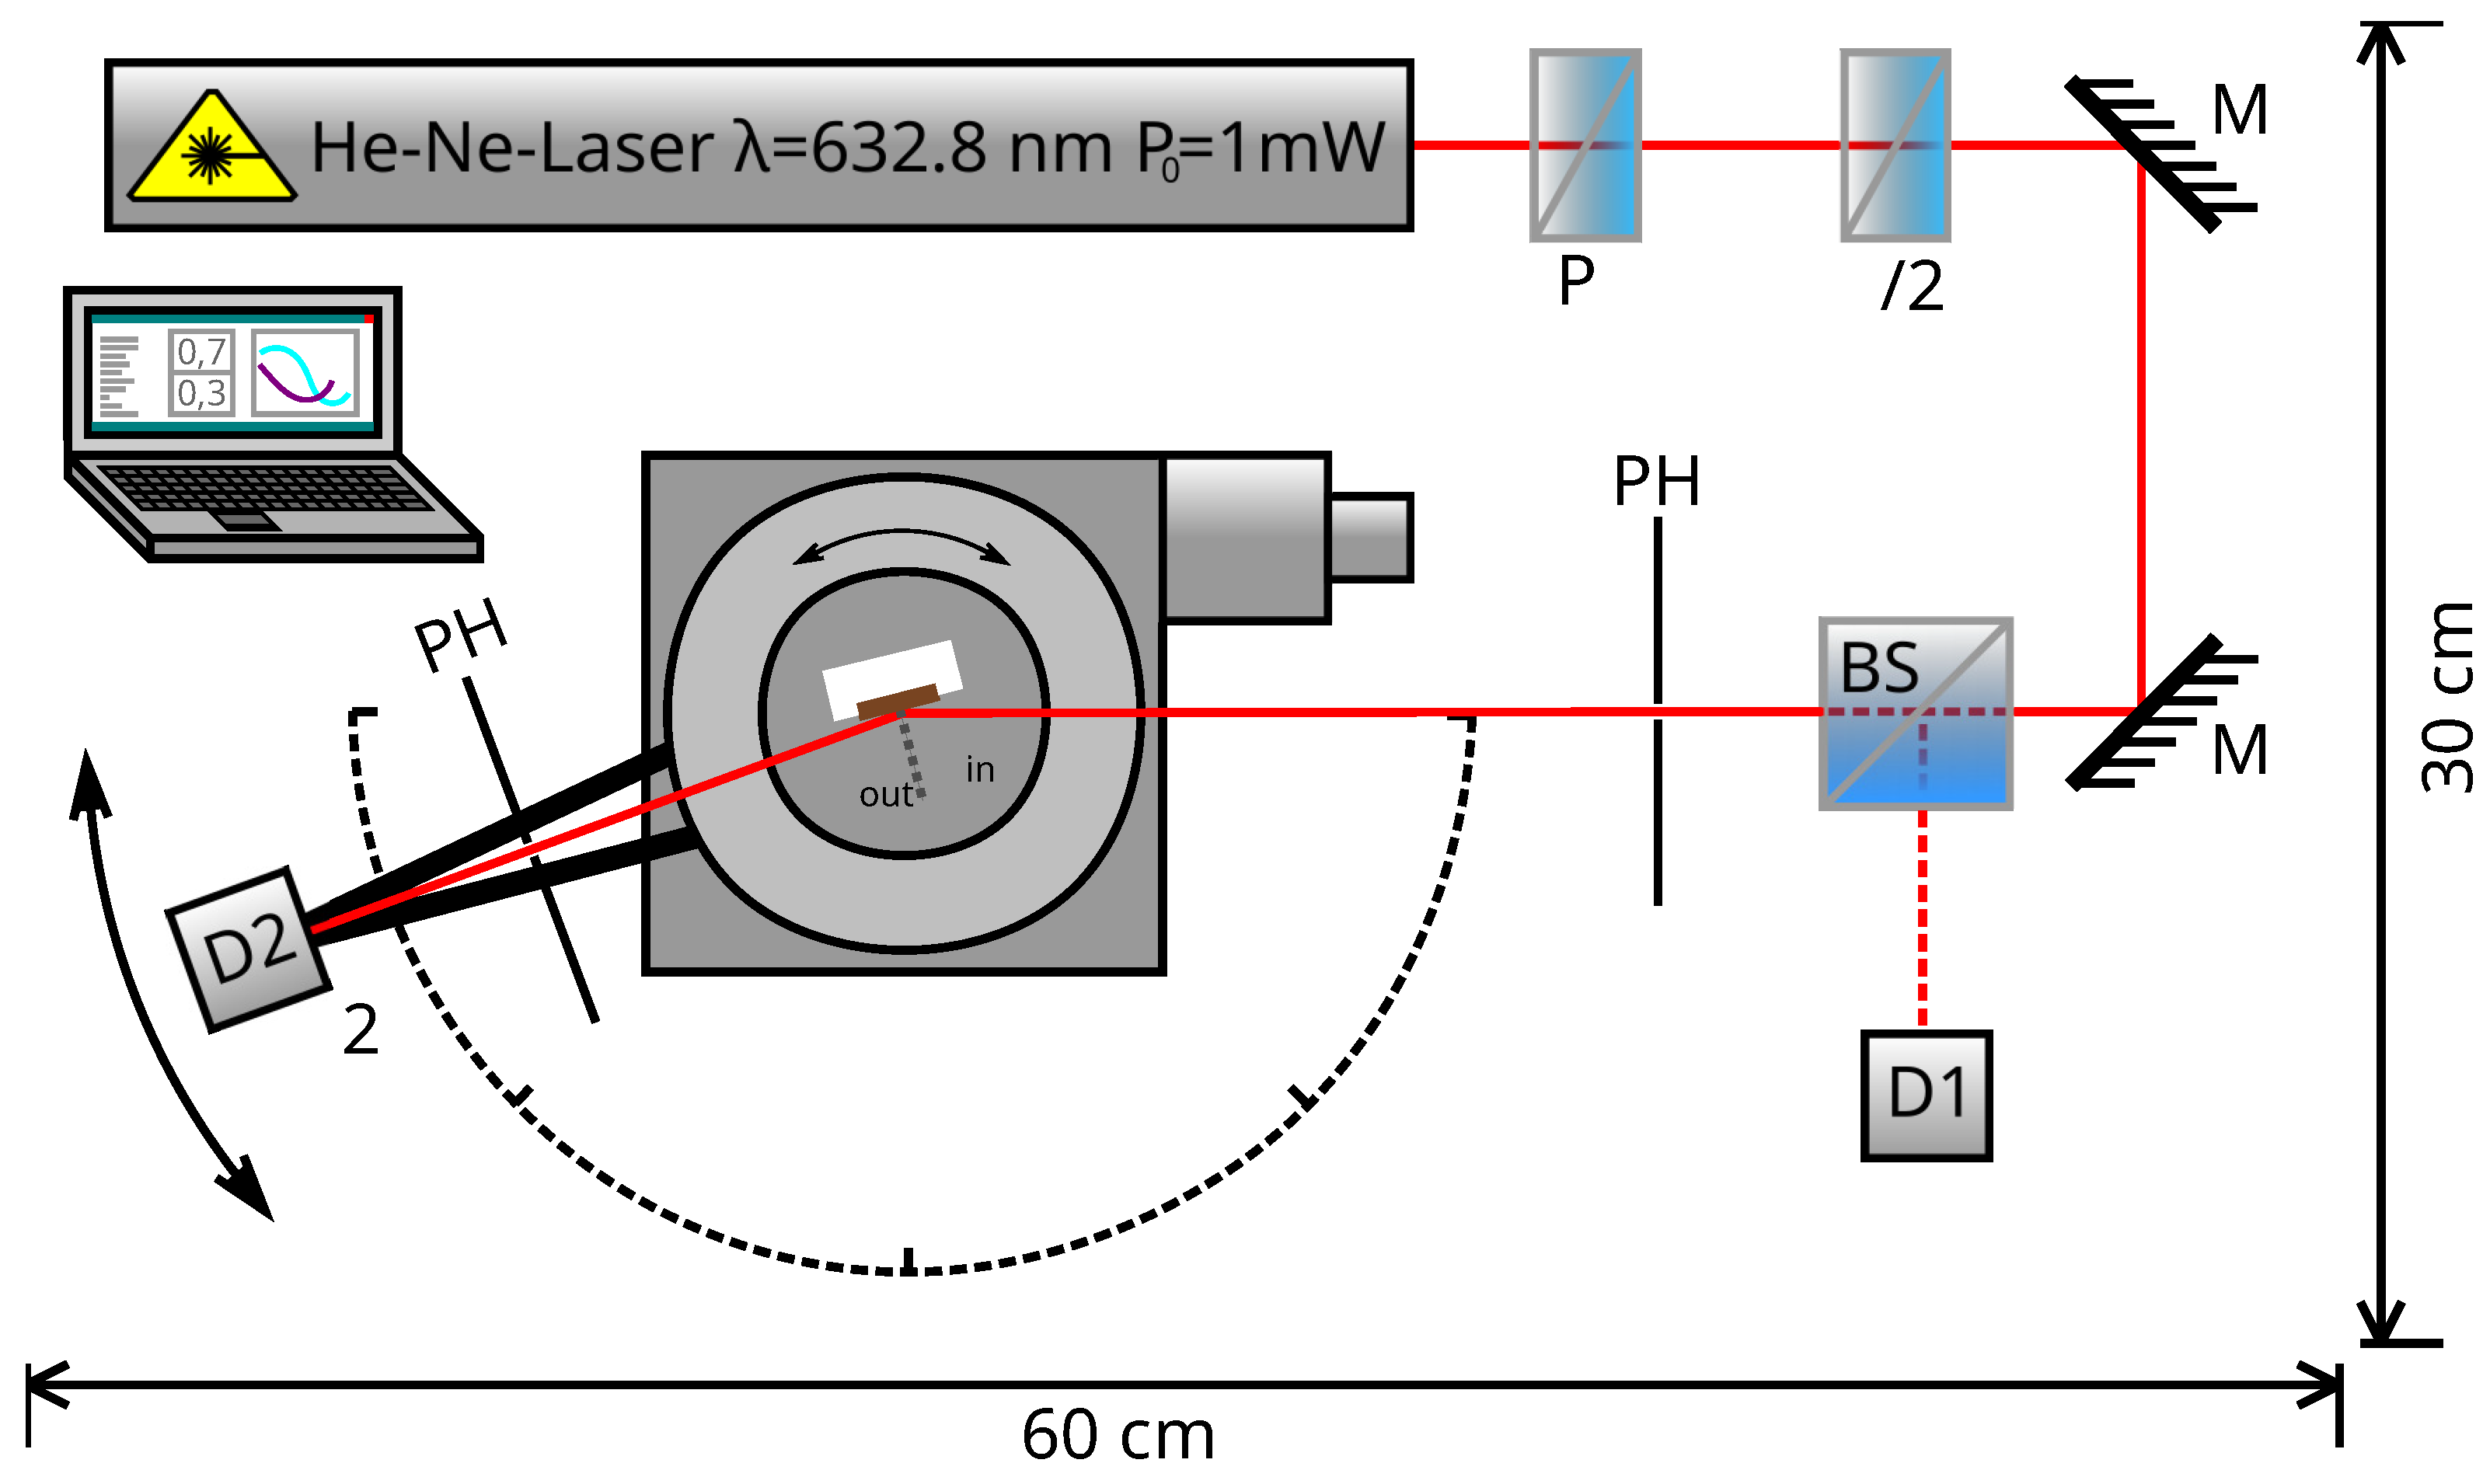
2.2. Specular Laser Reflectometry and X-Ray Fluorescence Analysis
- (1)
- Select an appropriate sample mount; insert and fix the coin; mount the holder onto the rotation stage.
- (2)
- Rotate the polarizer in vertical position (s-polarization) and perform an angular scan to determine .
- (3)
- Rotate the polarizer in horizontal position (p-polarization) and perform an angular scan to determine .
- (4)
- Determine and plot the ratio according to Equation (1).
- (5)
- Unmount the Roman coin and continue from the beginning with the next one.
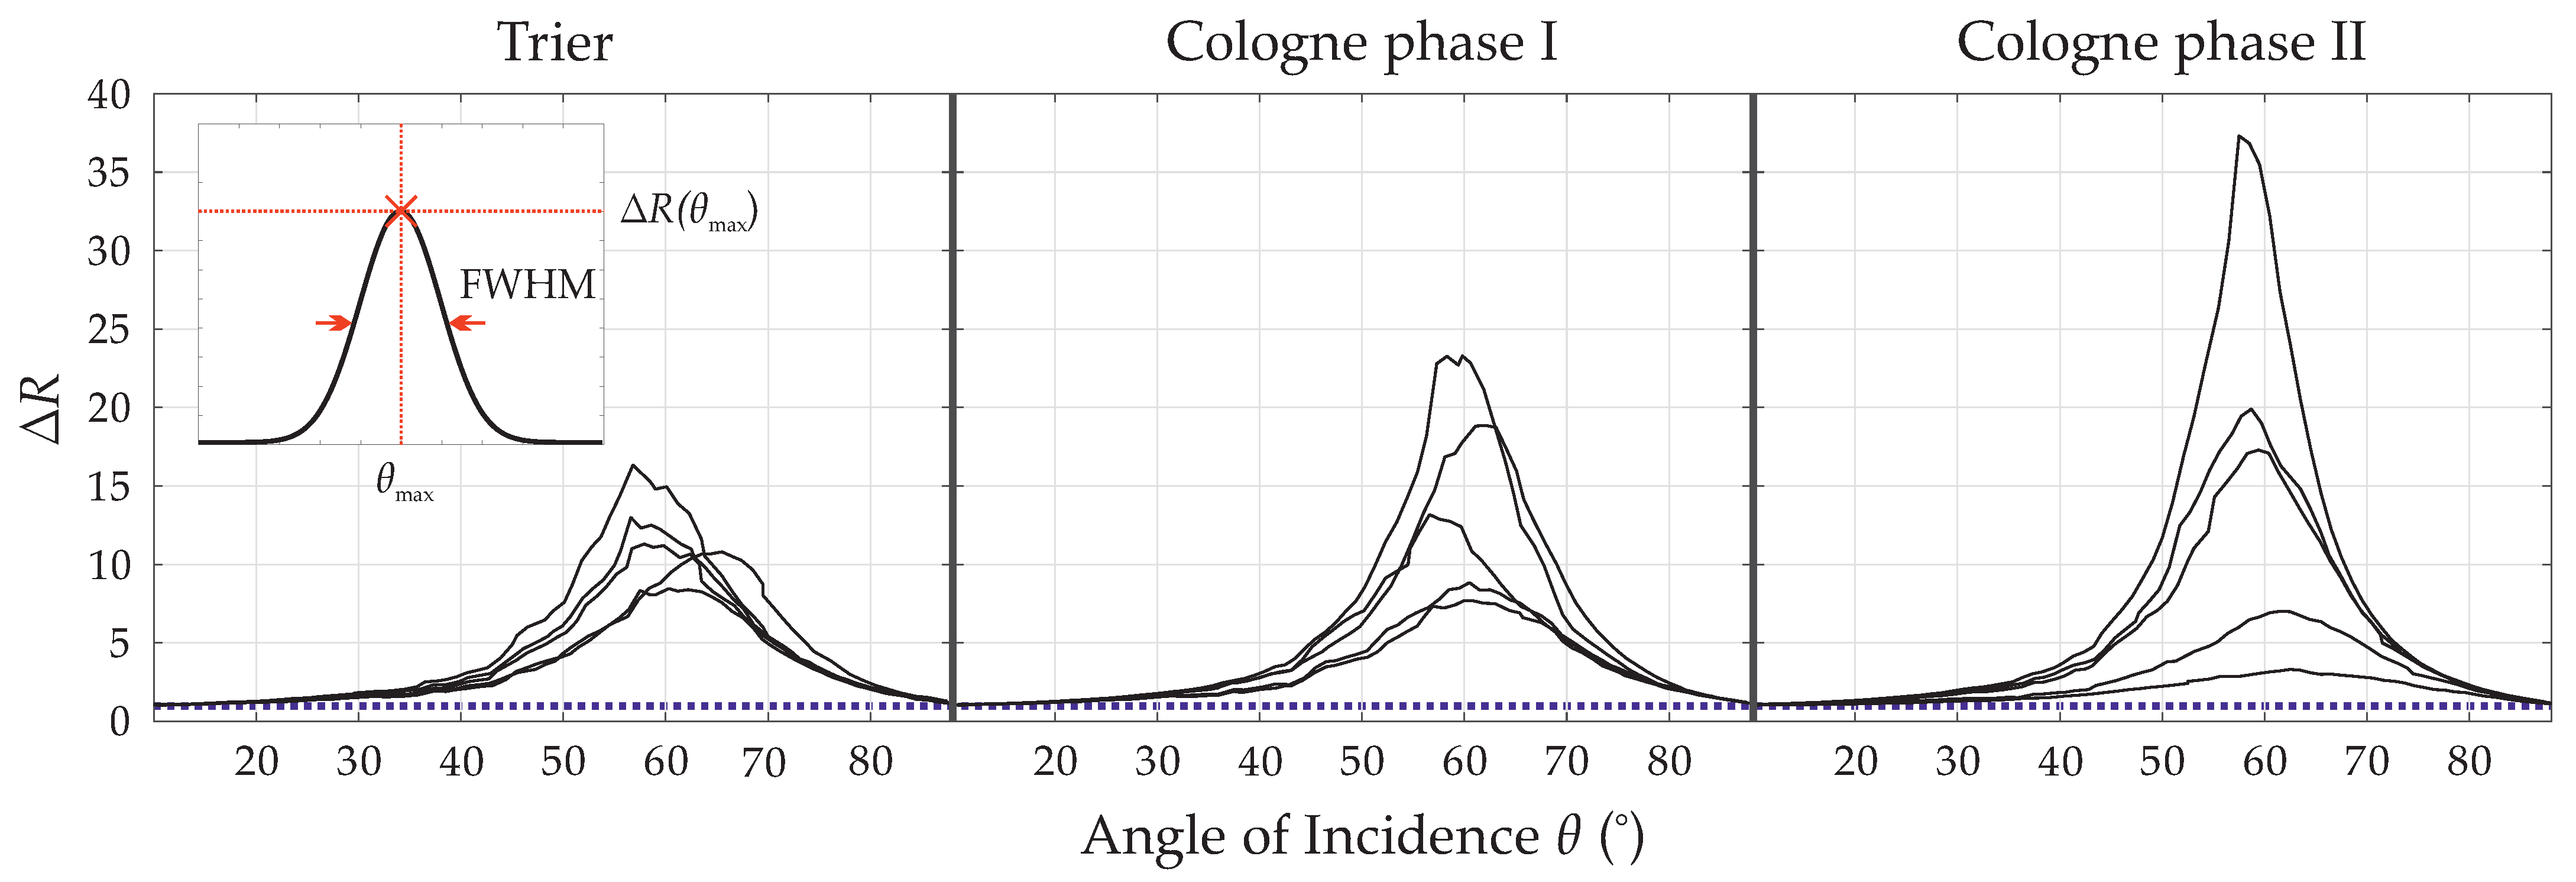
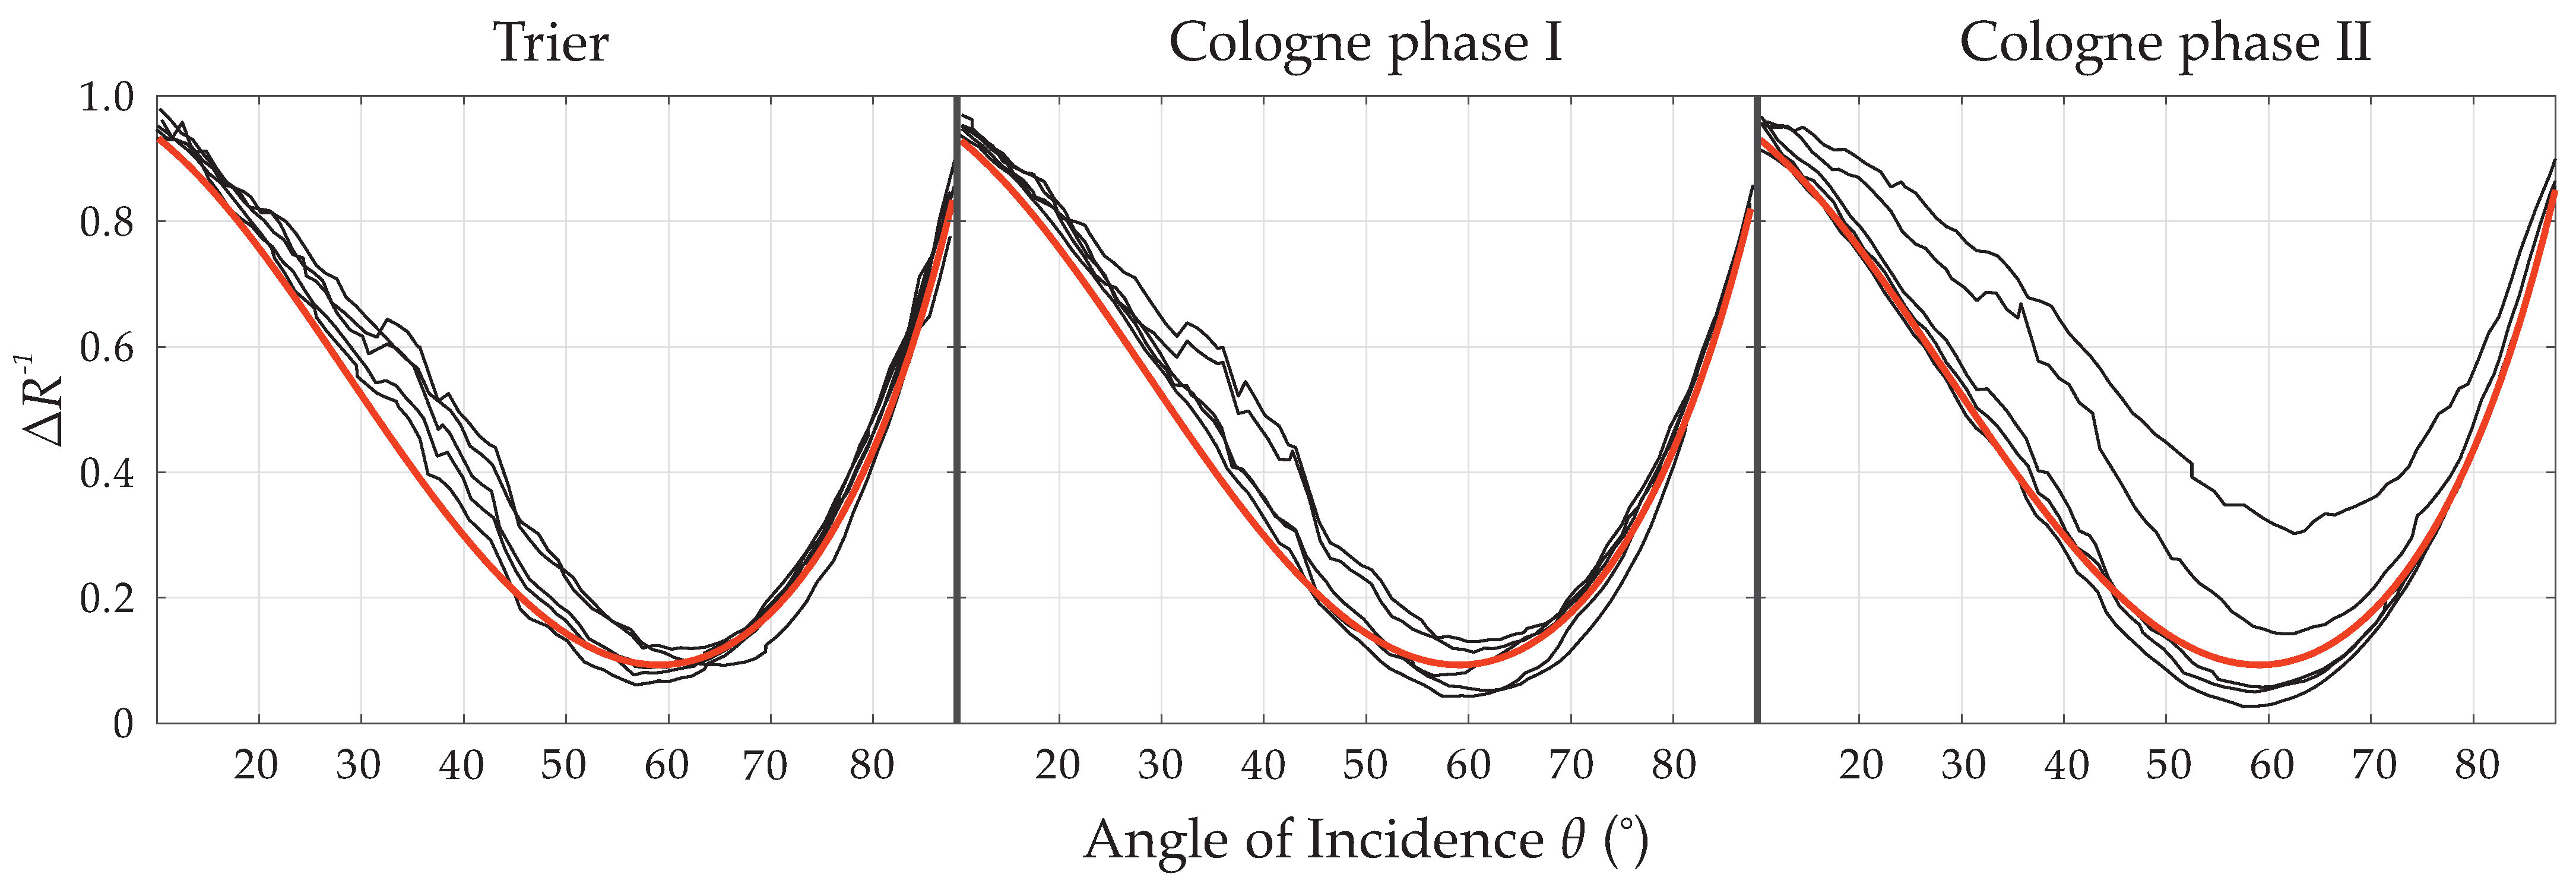
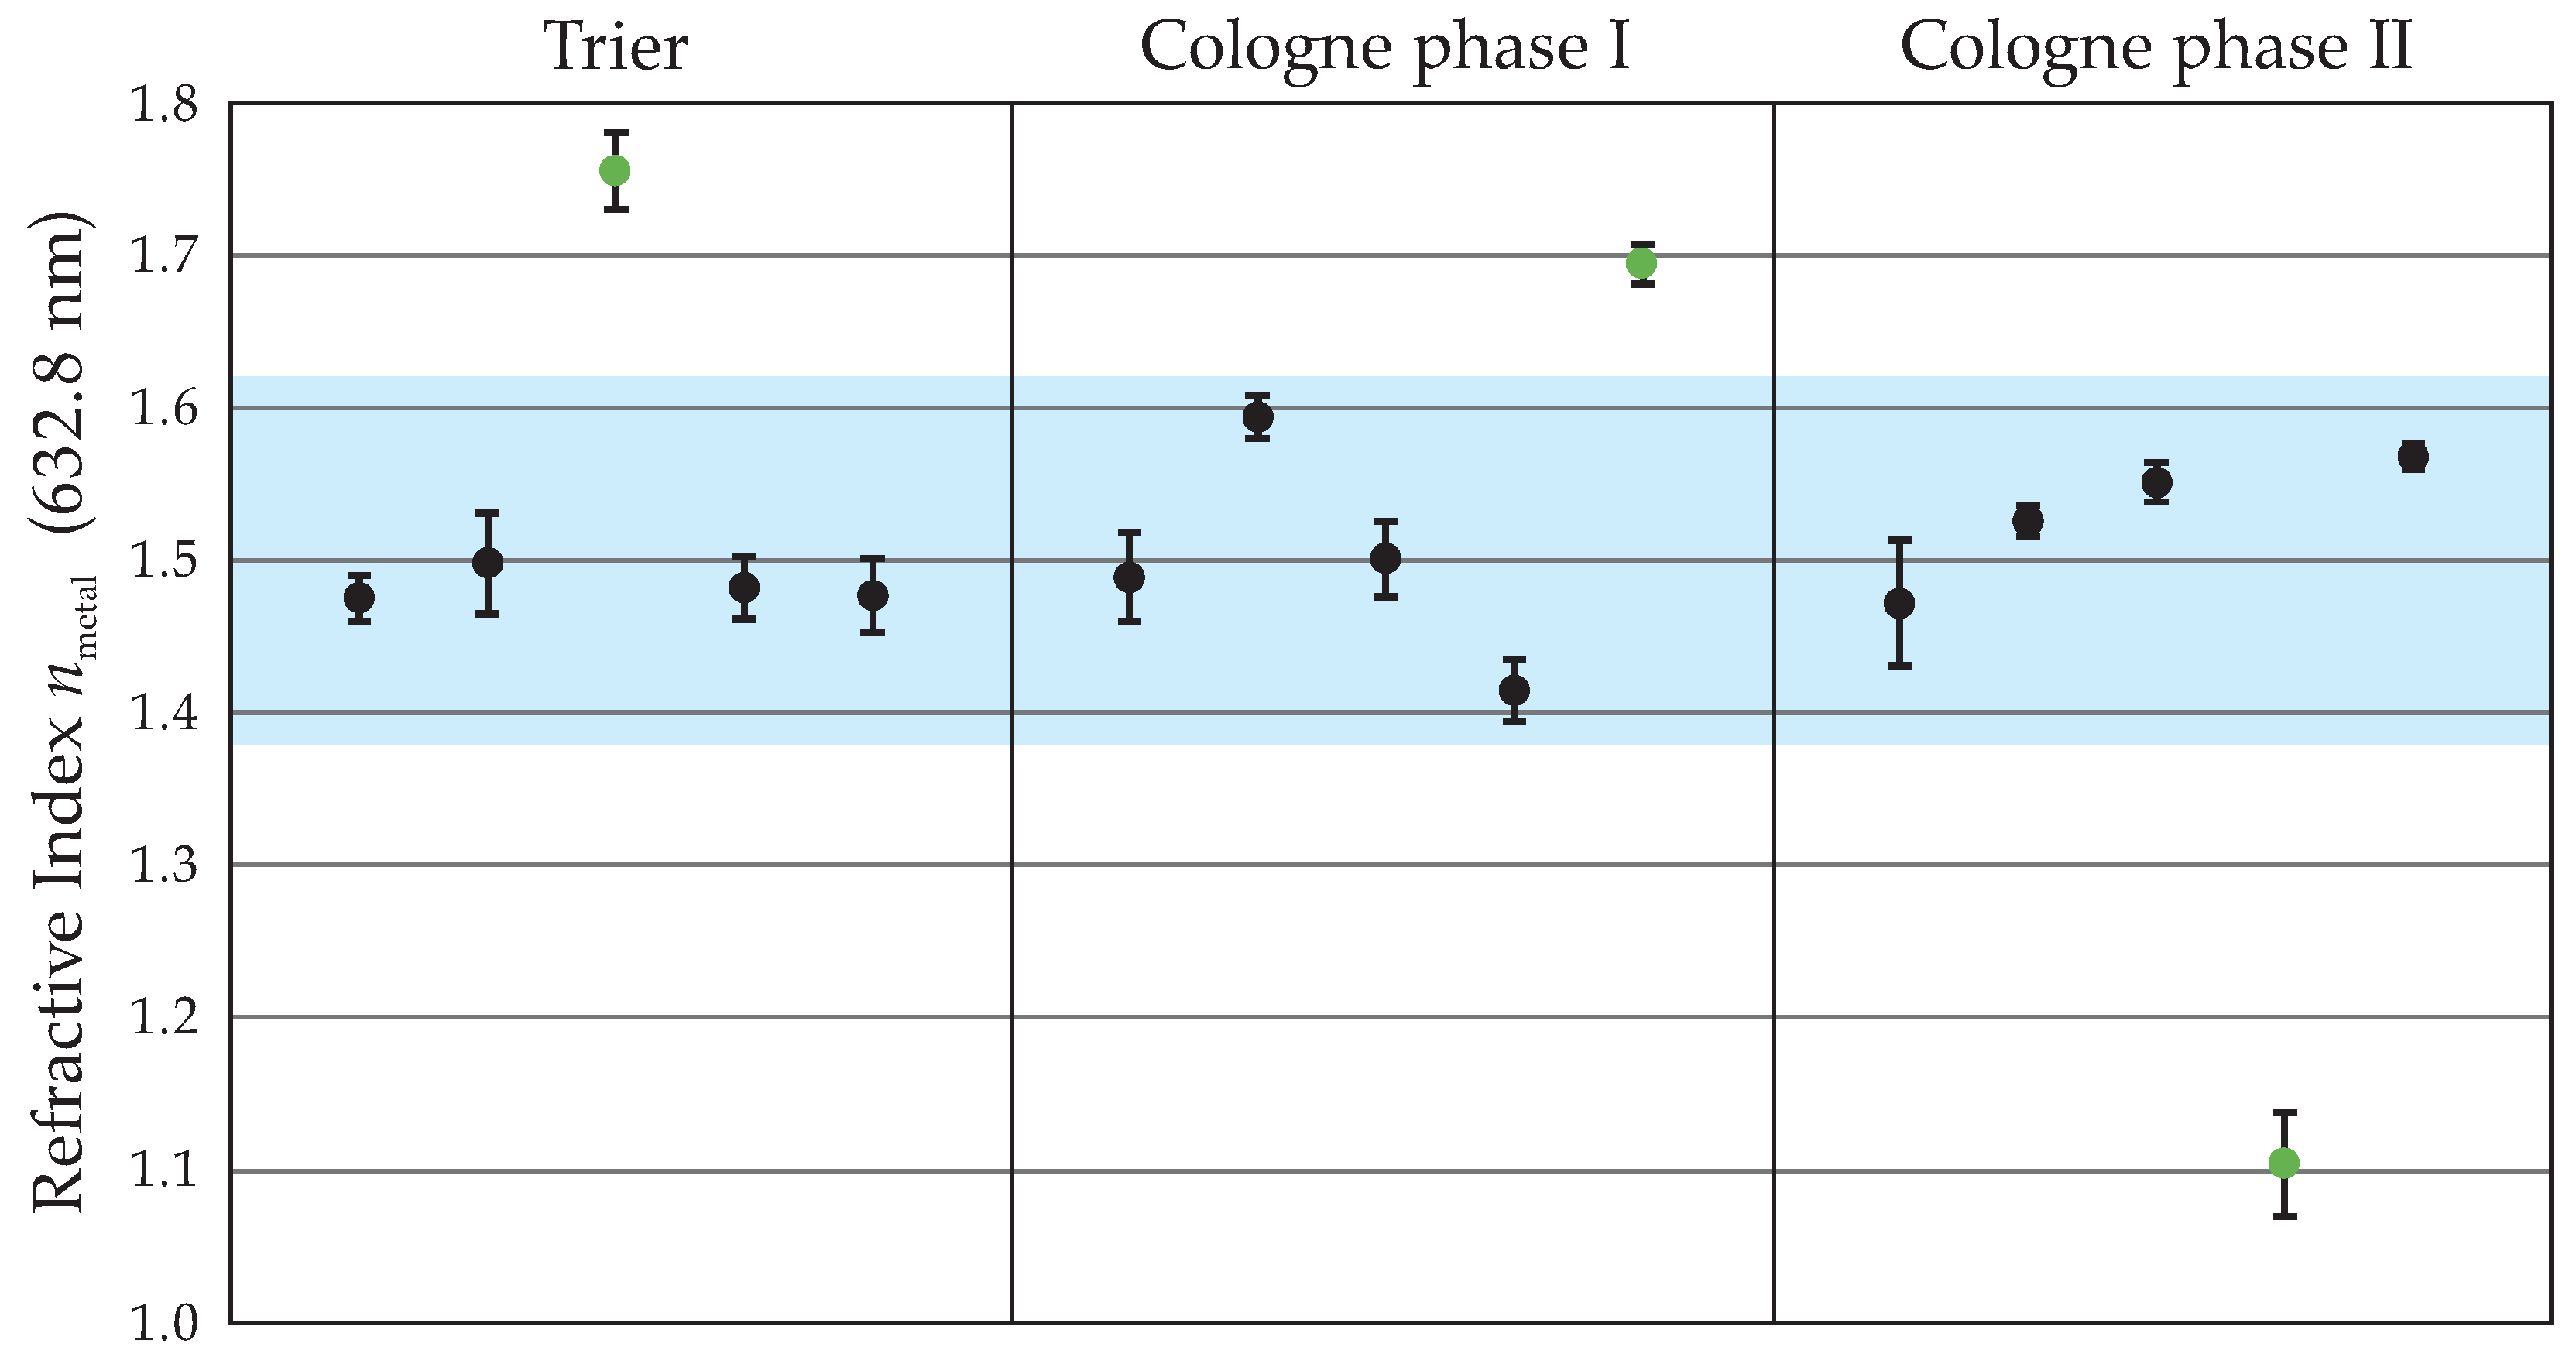
3. Results
3.1. Specular Laser Reflectometry
3.2. X-Ray Fluorescence Analysis
4. Discussion
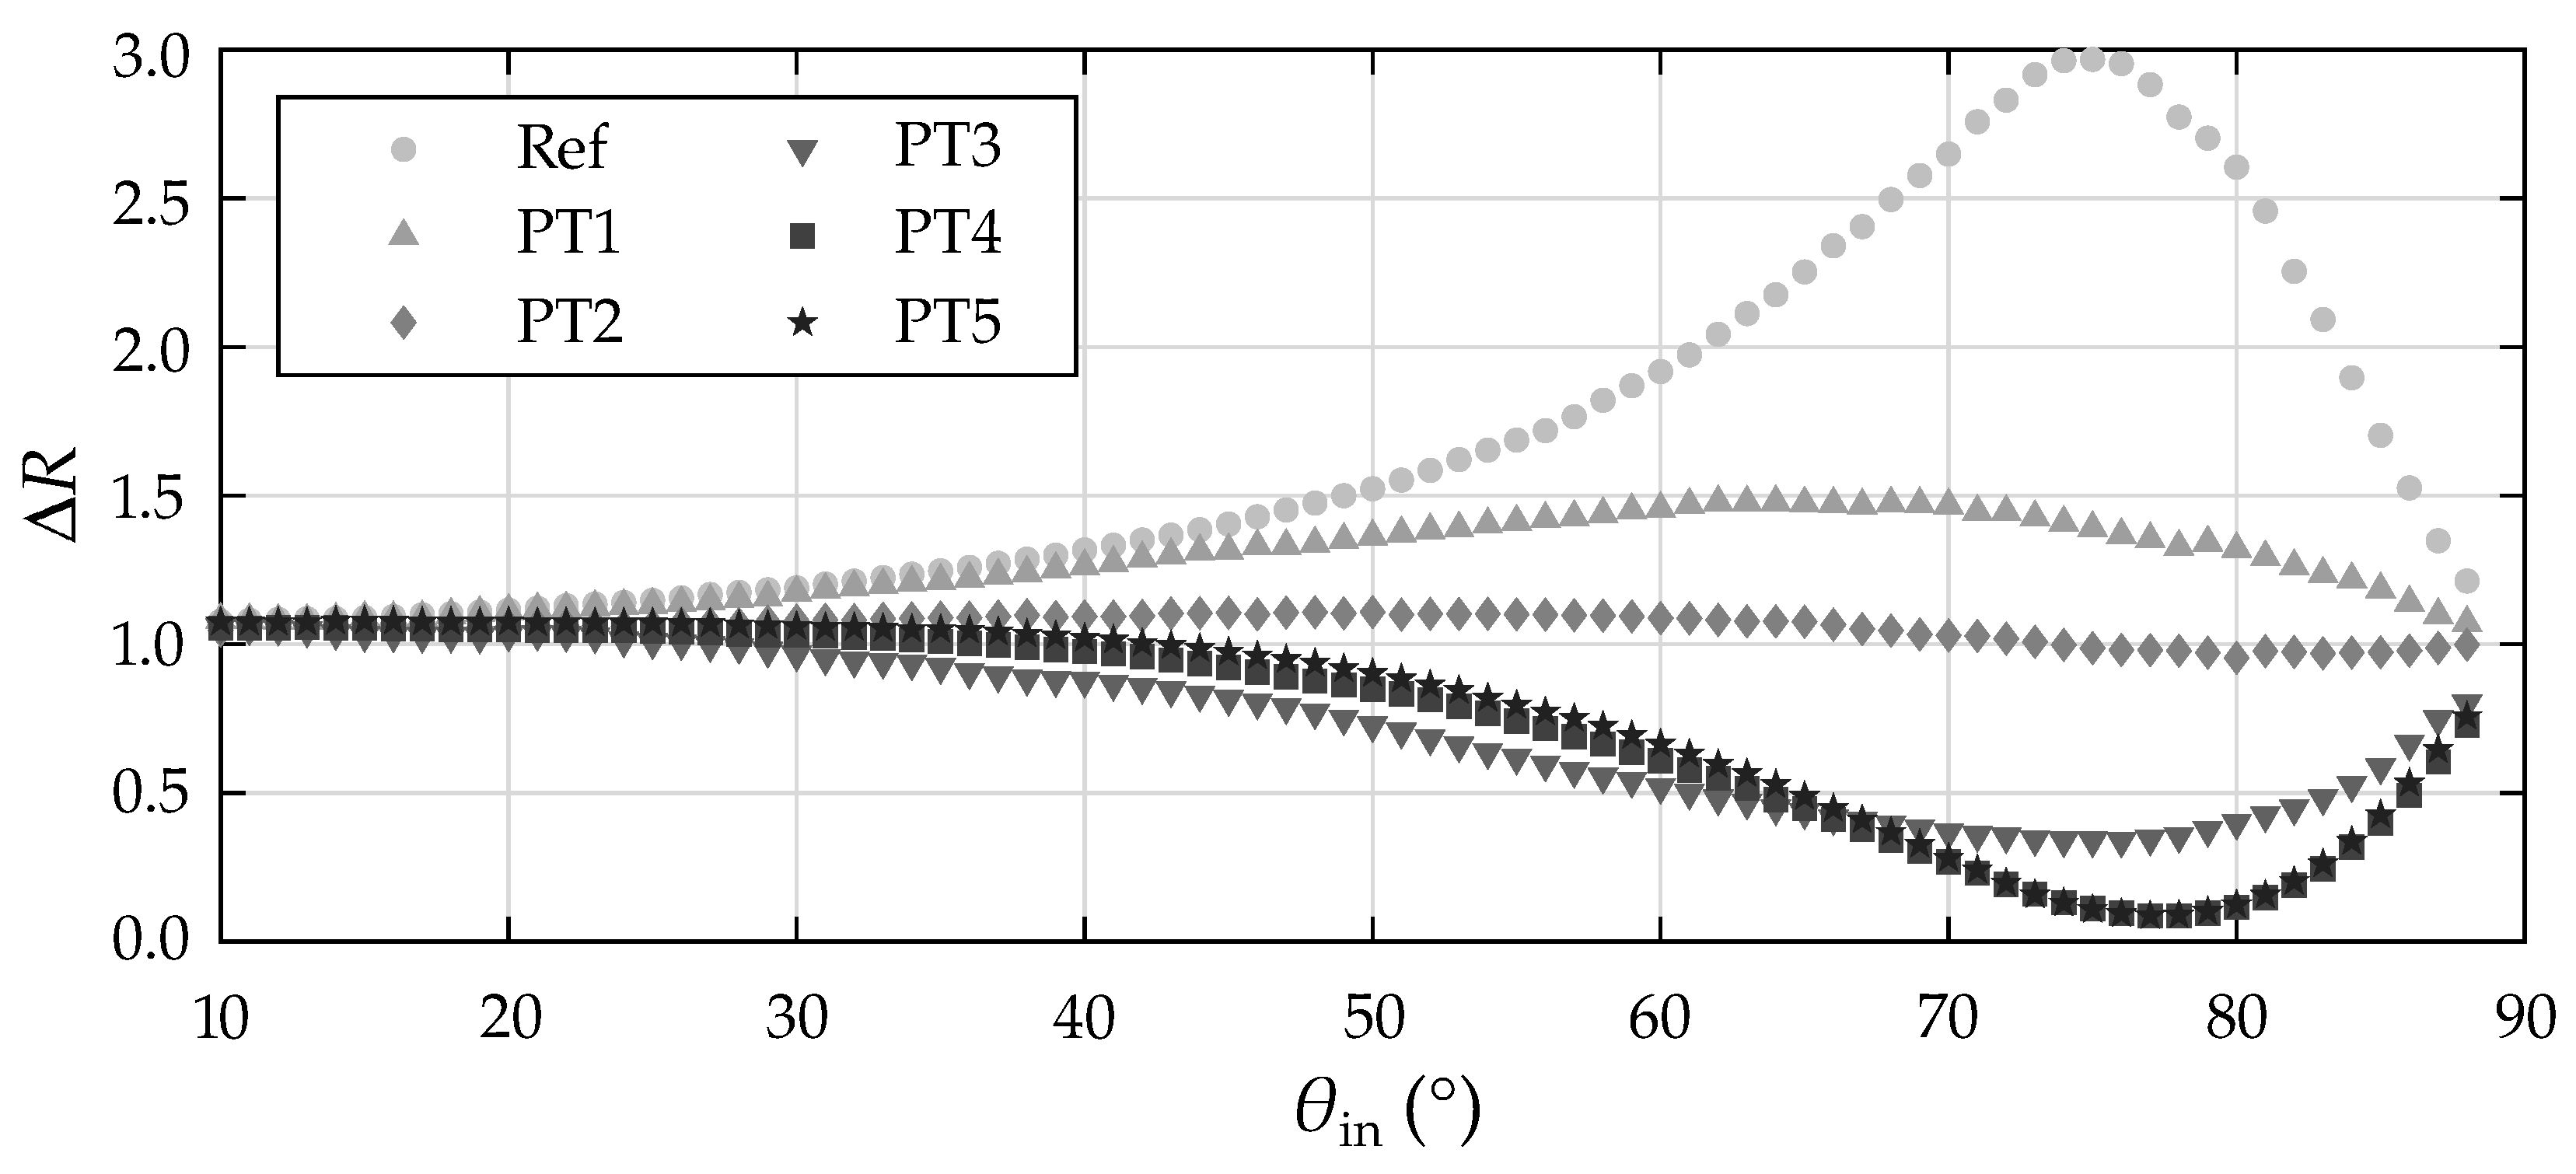
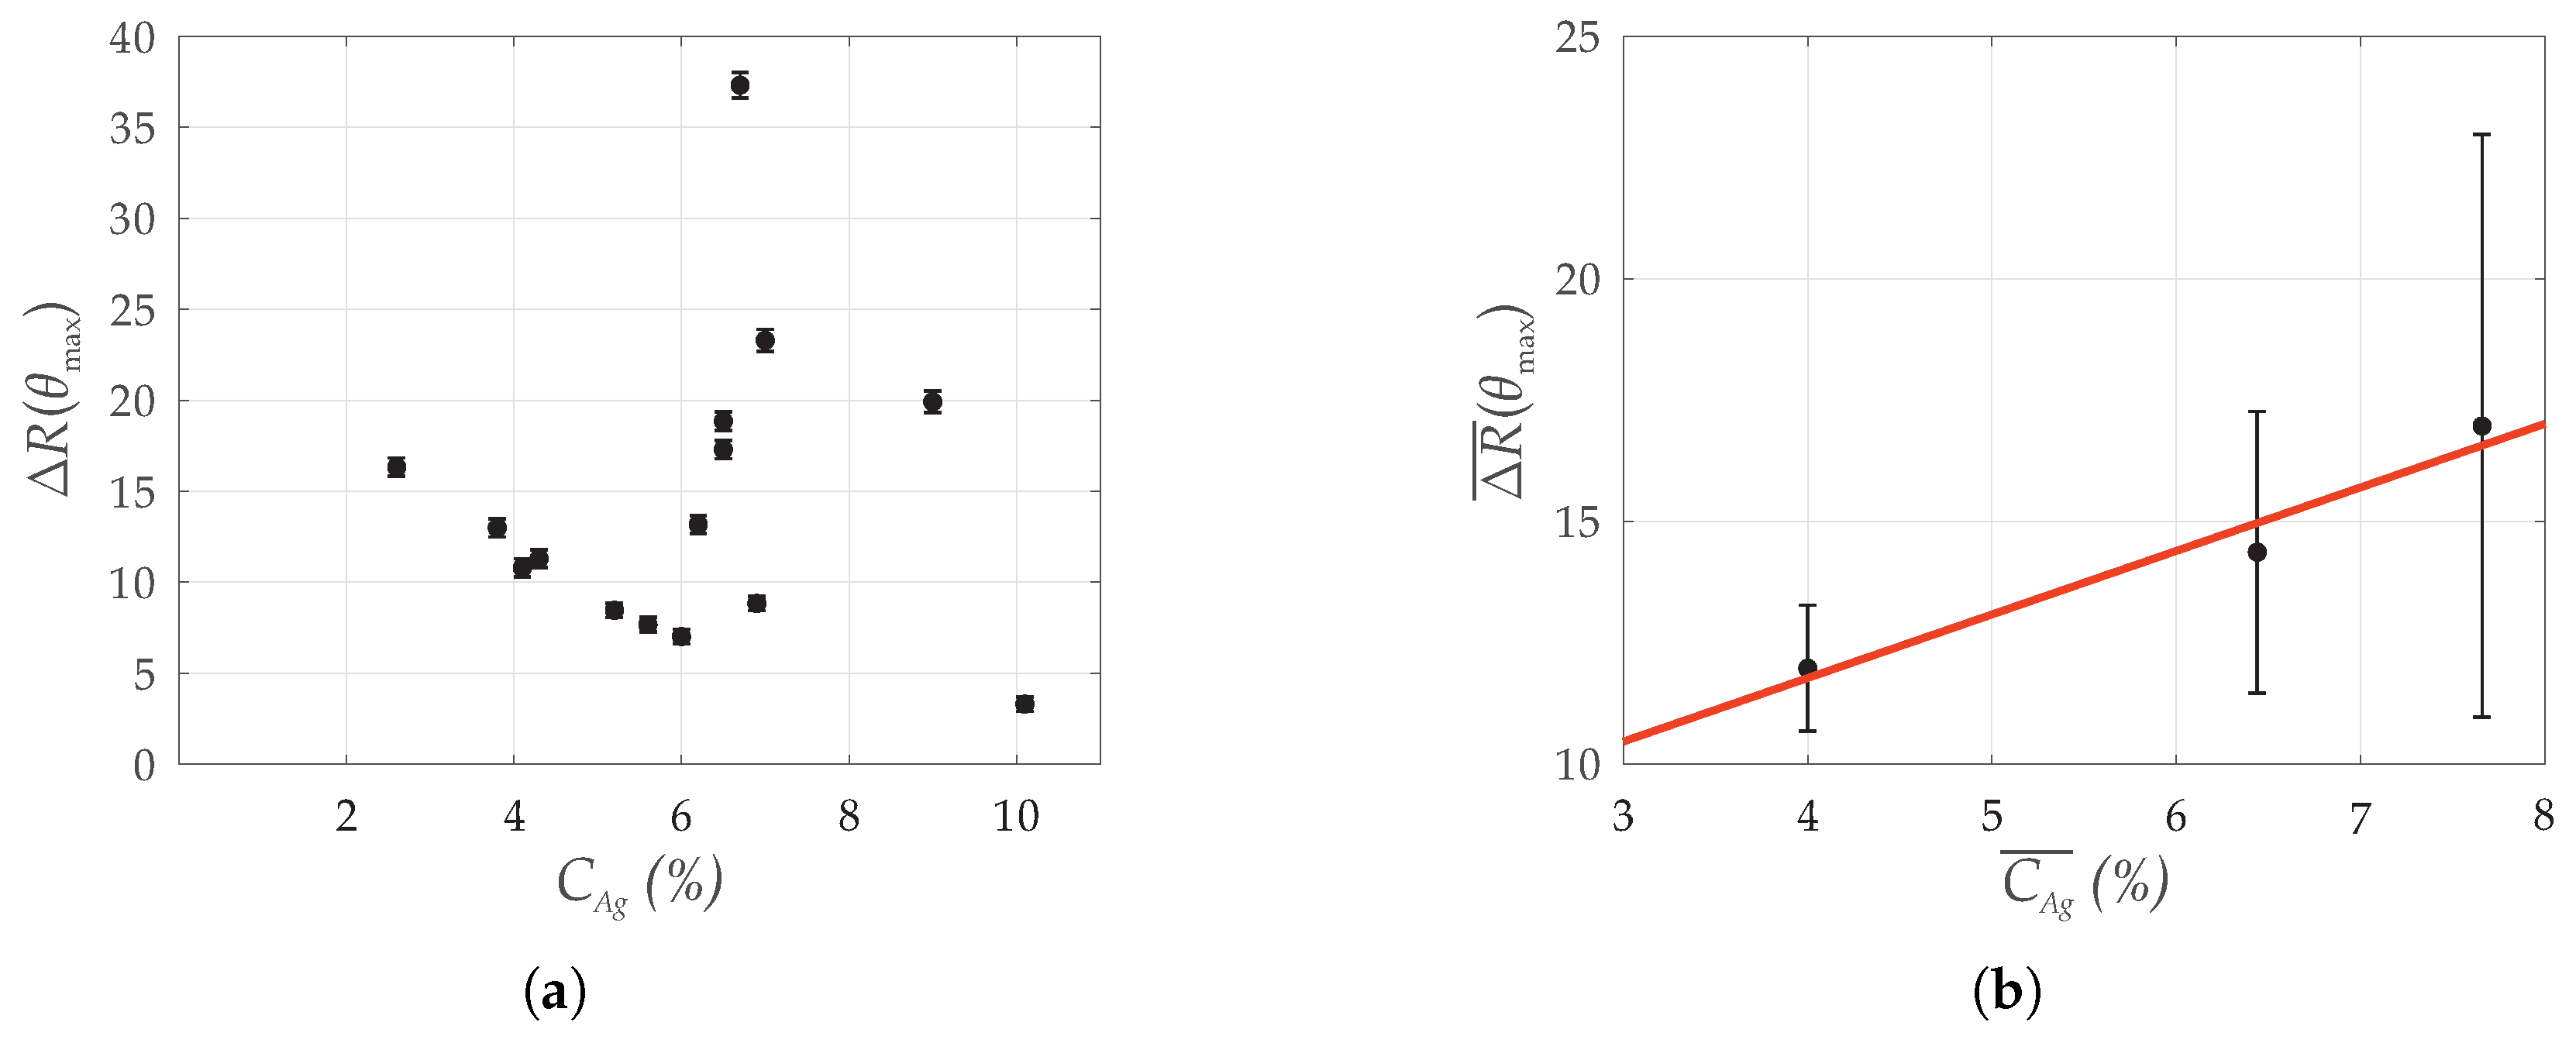
4.1. Reflectometric Ratio
4.2. Layer Inspection
4.3. X-Ray Fluorescence
5. Conclusions
Author Contributions
Funding
Data Availability Statement
Acknowledgments
Conflicts of Interest
Appendix A

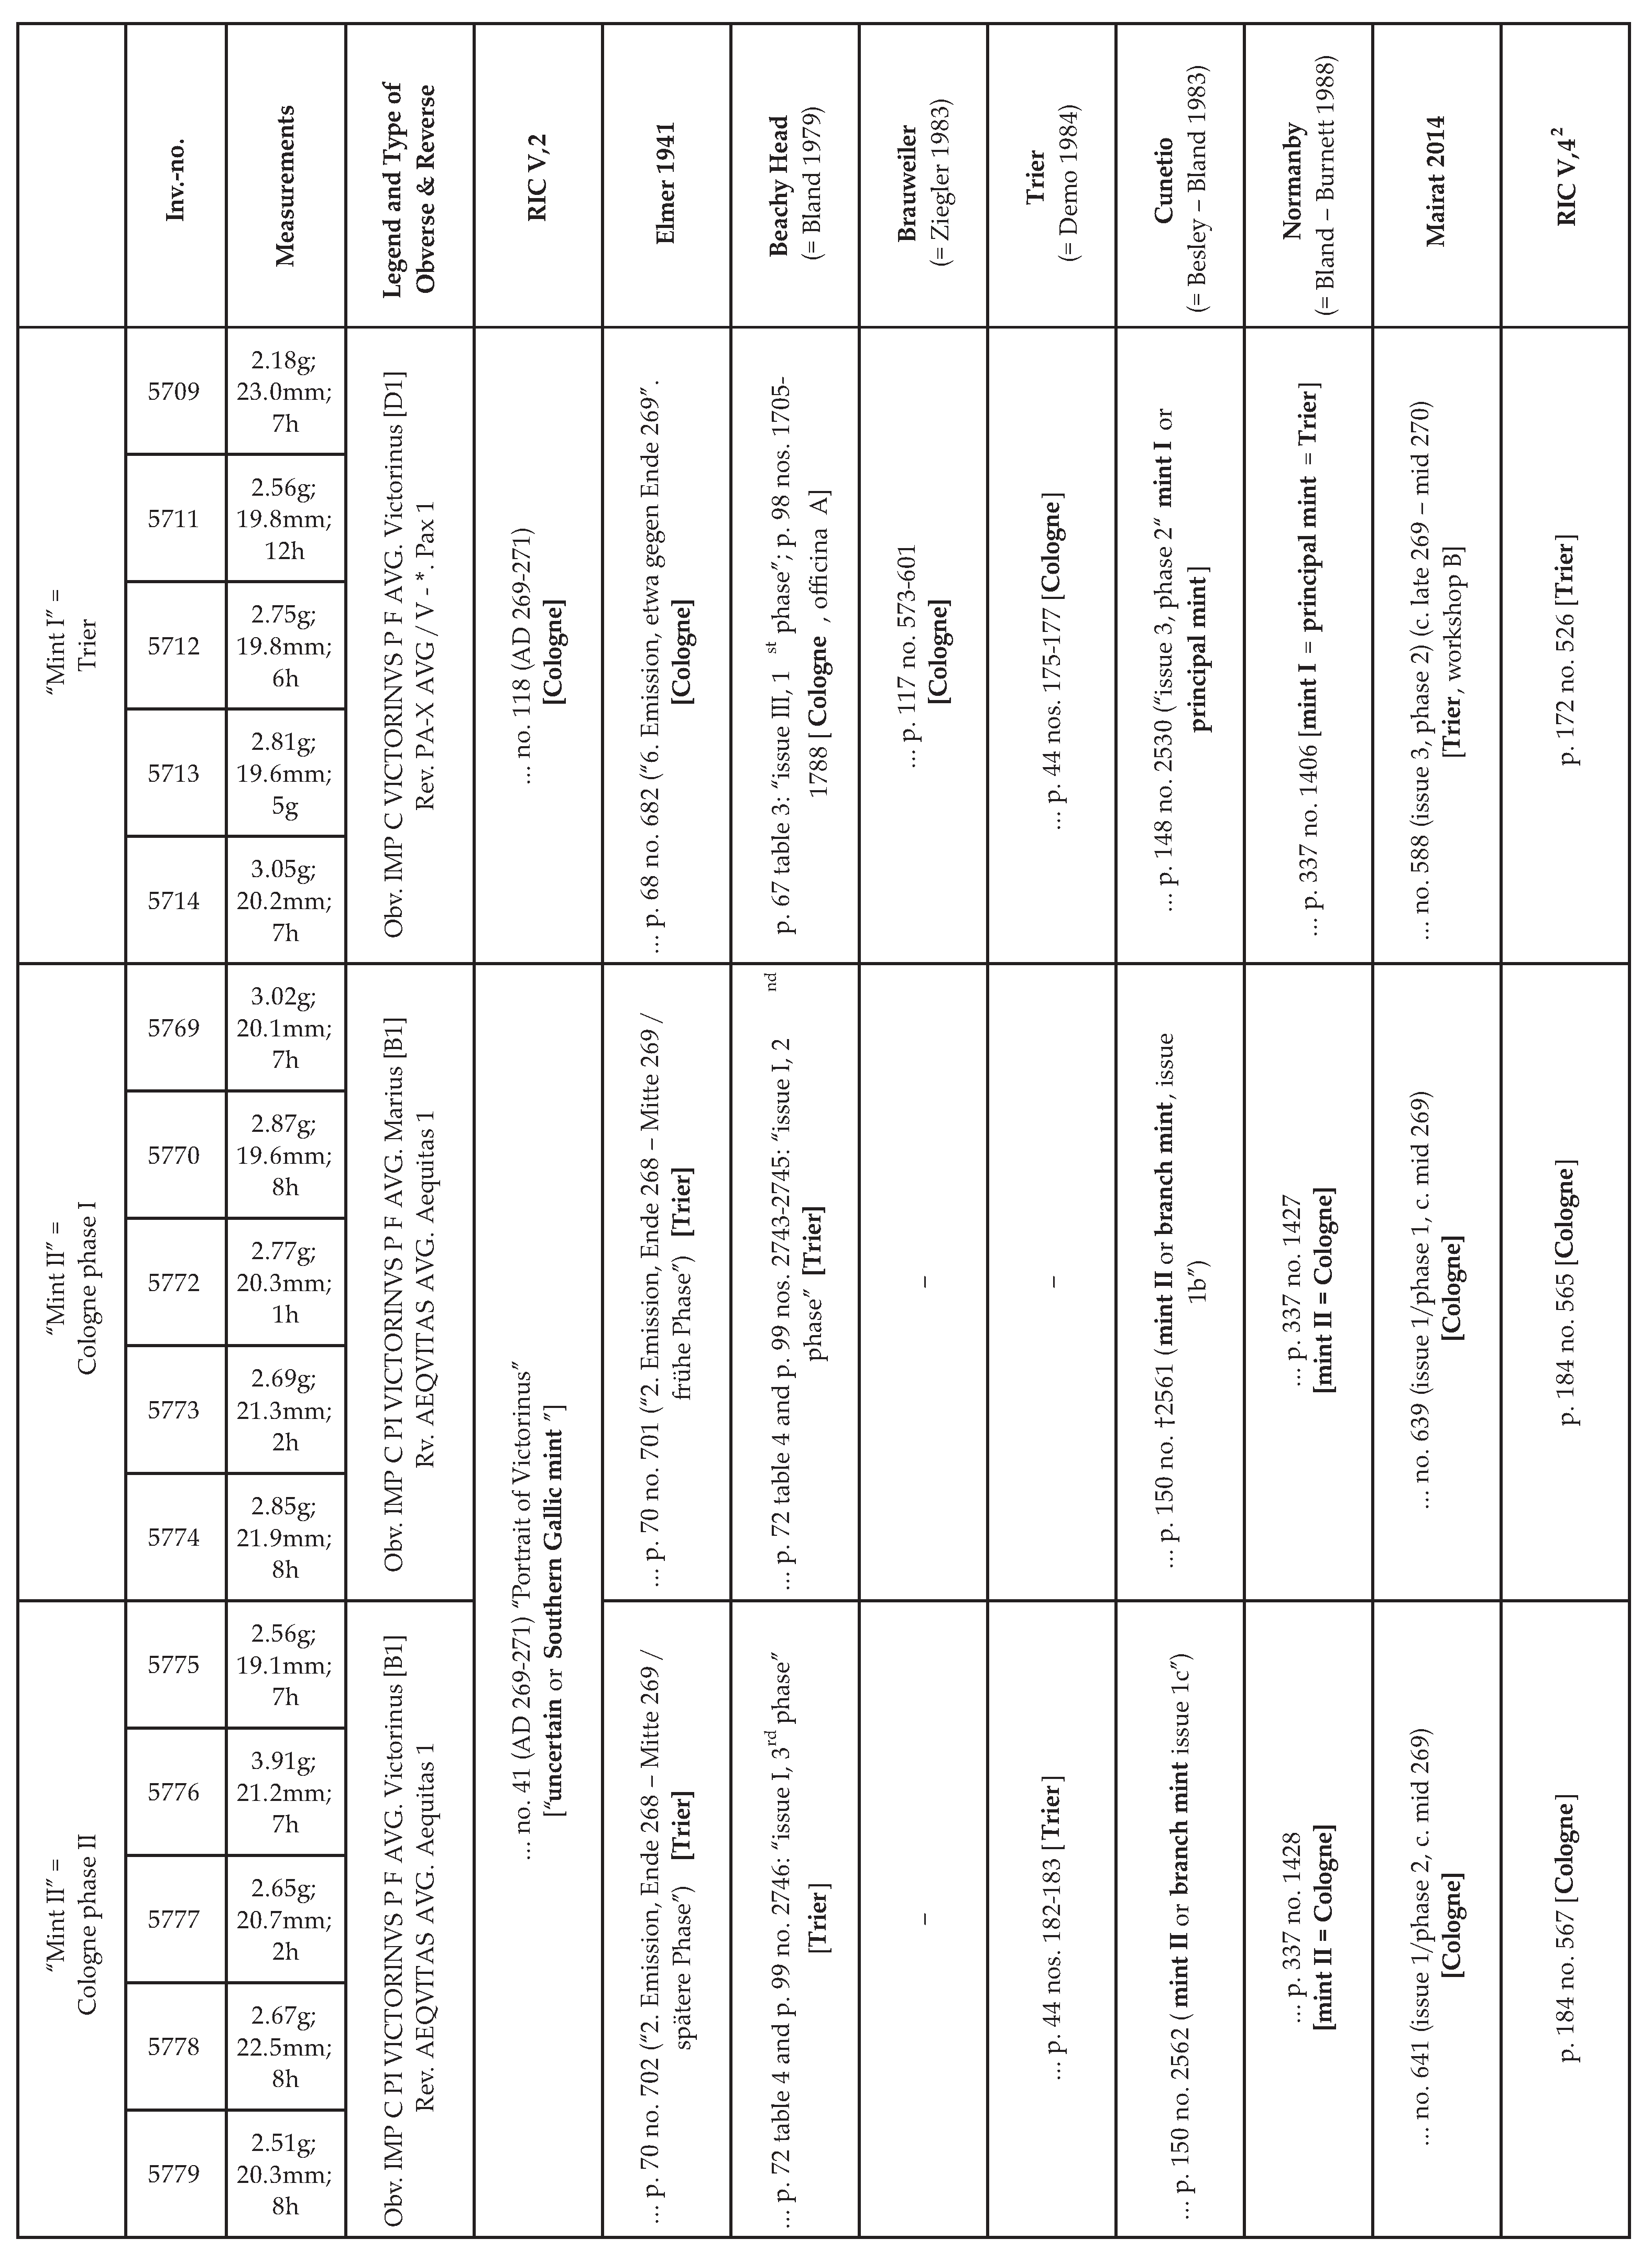
| Trier | |||||
|---|---|---|---|---|---|
| M 5709 | M 5711 | M 5712 | M 5713 | M 5714 | |
| obverse | 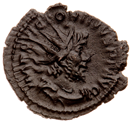 | 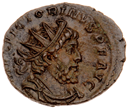 | 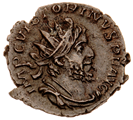 | 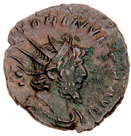 | 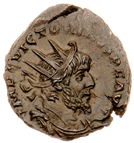 |
| reverse | 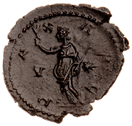 | 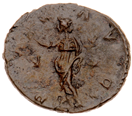 | 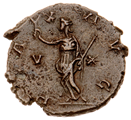 | 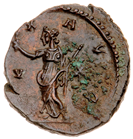 | 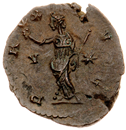 |
| Cologne Phase I | |||||
| M 5769 | M 5770 | M 5772 | M 5773 | M 5774 | |
| obverse | 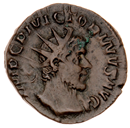 | 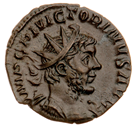 | 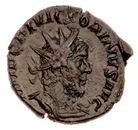 | 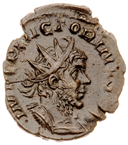 | 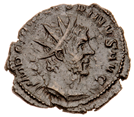 |
| reverse |  | 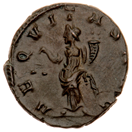 | 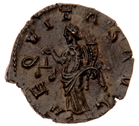 | 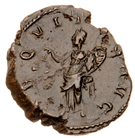 | 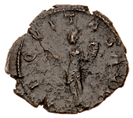 |
| Cologne Phase II | |||||
| M 5775 | M 5776 | M 5777 | M 5778 | M 5779 | |
| obverse | 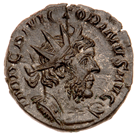 | 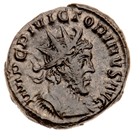 | 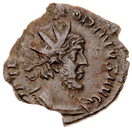 | 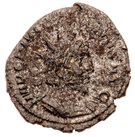 | 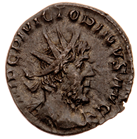 |
| reverse | 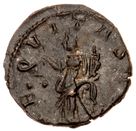 | 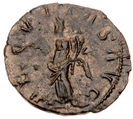 | 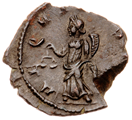 | 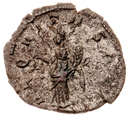 | 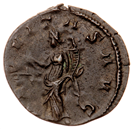 |
| 1 | |
| 2 | Cf. Kienast et al. [11], p. 237. |
| 3 | For the coins cf. Mairat [12], pp. 82–84, 163–181 and 648–724, and RIC V,4 [13] pp. 165–194. Radiates are coins with a value of two denarii, also named “antoniniani” after the emperor M. Aurelius Antoninus (Caracalla) who established this new over-rated coin in AD 215. The name “radiates” originates from the rays on the emperor’s head instead of the regular laurel wreath; this formal character usually doubles the value of a coin. |
| 4 | Already Elmer [21], p. 14, describes different styles: “Die Hauptmerkmale für Trier sind: höheres Relief, aufgelockertes Haar, breiterer Schrötling und größere Buchstaben, für Köln: flacheres Relief (seit 267), kleinere und zierlichere Buchstaben und auch kleinerer Schrötling”—variations, that are often hardly recognisable. Only two types of Victorinus’ predecessor Postumus mark Cologne (Colonia Claudia Ara Agrippinensium) as minting place: Webb [22] (Postumus) no. 286 = Mairat [13] no. 425 (COL CL AGRIP) and Webb [22] (Postumus) no. 285 = Mairat [13] no. 426 (C C A A). The reverse motif of a personification holding scales and cornucopia is subsequently attributed to Cologne. |
| 5 | Cf. the estimation in Bland [18], p. 78 “the mint officials of Trier, who were always slightly more cut off from the mainstream of political events in the Gallic Empire than their Cologne colleagues”. |
| 6 | Introduced by Elmer in [21], pp. 9, 12 f. Cologne had been a military mint for the Central Empire before. For Trier as the second mint, see ibidem p. 14 following scarce literary and epigraphic evidence. |
| 7 | |
| 8 | Mairat [12], pp. 35 f. Cf. Ziegler [24] (Brauweiler, near Cologne) as well as Demo [25]; R.-Alföldi [26], pp. 192 f. nos. 3064.3 and 3064.8 (hoards from Trier) and Gilles [27] on the remains of the official Trier mint, excavated in 2005. Among these artifacts were objects of different stages of completion (“Vorprodukte”), see Knickrehm [28], p. 26. |
References
- dos Santos Rodrigues, M.P.T. Analytical Chemistry for Cultural Heritage: Material Analysis of Archaeological Silver Coins Using X-Ray Based Techniques. Doctoral Thesis, Technical University of Vienna, Vienna, Austria, 2011. Available online: http://hdl.handle.net/20.500.12708/161112 (accessed on 25 May 2025).
- Hrnjić, M.; Hagen-Peter, G.A.; Birch, T.; Barfod, G.H.; Sindbæk, S.M.; Lesher, C.E. Non-destructive identification of surface enrichment and trace element fractionation in ancient silver coins. Nucl. Instruments Methods Phys. Res. Sect. B Beam Interact. Mater. Atoms 2020, 478, 11–20. [Google Scholar] [CrossRef]
- Ponting, M.; Evans, J.A.; Pashley, V. Fingerprinting of roman mints using laser-ablation MC-ICP-MS lead isotope analysis. Archaeometry 2003, 45, 591–597. [Google Scholar] [CrossRef]
- Zwicker, H.U.; Hedrich, D.; Wendler-Kalsch, E.; Stahl, B. Untersuchungen über Plattierungen antiker Münzen mit Hilfe der Metallographie, der Spektral-und Mikroröntgenfluoreszenzanalyse. In Berichte aus der Geld-, Münzen- und Medaillenkunde, 43; Kircheldorf-Verlag: Freiburg, Germany, 1968; pp. 371–380. [Google Scholar]
- Corsi, J.; Giudice, A.L.; Re, A.; Agostino, A.; Barello, F. Potentialities of X-ray fluorescence analysis in numismatics: The case study of pre-Roman coins from Cisalpine Gaul. Archaeol. Anthropol. Sci. 2018, 10, 431–438. [Google Scholar] [CrossRef]
- Marussi, G.; Crosera, M.; Prenesti, E.; Cristofori, D.; Callegher, B.; Adami, G. A Multi-Analytical Approach on Silver-Copper Coins of the Roman Empire to Elucidate the Economy of the 3rd Century A.D. Molecules 2022, 27, 6903. [Google Scholar] [CrossRef]
- Liritzis, I.; Zacharias, N. Portable XRF of Archaeological Artifacts: Current Research, Potentials and Limitations. In X-Ray Fluorescence Spectrometry (XRF) in Geoarchaeology; Shackley, M., Ed.; Springer: New York, NY, USA, 2011. [Google Scholar] [CrossRef]
- Rischmueller, J.; Toschke, Y.; Imlau, M.; Schlag, M.; Brüning, H.; Brune, K. Inspection of Trivalent Chromium Conversion Coatings Using Laser Light: The Unexpected Role of Interference on Cold-Rolled Aluminium. Sensors 2020, 20, 2164. [Google Scholar] [CrossRef]
- König, I. Die gallischen Usurpatoren von Postumus bis Tetricus; Vestigia 31; Beck: München, Germany, 1981; ISBN 3406048013. [Google Scholar]
- Drinkwater, J.F. The Gallic Empire. Separatism and Continuity in the North-Western Provinces of the Roman Empire A.D. 260–274; Historia EZ 52; Steiner Verlag: Wiesbaden, Germany; Stuttgart, Germany, 1987; ISBN 351-5-04806-5. [Google Scholar]
- Kienast, D.; Eck, W.; Heil, M. Römische Kaisertabelle. Grundzüge einer römischen Kaiserchronologie, 6th ed.; Wissenschaftliche Buchgemeinschaft: Darmstadt, Germany, 2017; ISBN 978-3-534-26724-8. [Google Scholar]
- Mairat, J. Coinage of the Gallic Empire. Ph.D. Thesis, Oxford University, Oxford, UK, 2014. Available online: https://ora.ox.ac.uk/objects/uuid:58eb4e43-a6d5-4e93-adeb-f374b9749a7f (accessed on 11 March 2025).
- Mairat, J. The Gallic Empire (AD 260–274), Roman Imperial Coinage V,4; Spink & Son Ltd.: London, UK, 2023; ISBN 978-1-912-66799-4. [Google Scholar]
- Petzholdt, H.; Strobel, M. 2000 Jahre Stadtentwicklung Trier; Katalog zur Ausstellung—Tuchfrabrik Wberbach 6.5.-10.11.1984; Selbstverlag der Stadt: Trier, Germany, 1984. [Google Scholar]
- Klosterkämper, R. Zum Nachweis von Oberflächenanreicherungen durch Röntgenspektralanalyse. Silberanreicherungen an der Oberfläche römischer Silbermünzen. Fresenius’ Z. Anal. Chem. 1978, 290, 212–216. [Google Scholar] [CrossRef]
- Zwicky-Sobczyk, C.N.; Stern, W.B. X-RAY fluorescence and density measurements on surface-treated Roman silver coins. Archaeometry 1997, 39, 393–405. [Google Scholar] [CrossRef]
- Kraft, G. Chemisch-analytische Charakterisierung römischer Silbermünzen. Ph.D. Thesis, TU Darmstadt, Darmstadt, Germany, 2005. Available online: https://tuprints.ulb.tu-darmstadt.de/609/1/KraftGunther_01.pdf (accessed on 25 May 2025).
- Bland, R.F. The 1973 Beachy Head Treasure Trove of Third-Century Antoniniani. Numis. Chron. 1979, 19, 61–107. [Google Scholar]
- Besley, E.; Bland, R. The Cunetio Treasure. Roman Coinage of the Third Century AD; British Museum Publications: London, UK, 1983; ISBN 978-0-714-10857-5. [Google Scholar]
- Bland, R.F.; Burnett, A.M. Normanby, Lincolnshire. In The Normanby Hoard and other Roman Coin Hoards; Bland, R.F., Burnett, A.M., Eds.; CHRB VIII; British Museum Publication: London, UK, 1988; pp. 114–215. ISBN 978-0-714-10870-4. [Google Scholar]
- Elmer, G. Die Münzprägung der gallischen Kaiser in Köln, Trier und Mailand. Bonn. Jahrbücher 1941, 146, 1–106. [Google Scholar]
- Webb, P.H. Roman Imperial Coinage V,2; [Contents Central Empire, Gallic Empire, British Empire, and Usurpers]; Spink & Son Ltd.: London, UK, 1933; ISBN 0-907-60543-5. [Google Scholar]
- Bland, R.; Besly, E.; Burnett, A. The Cunetio and Normanby Hoards; Spink & Son Ltd.: London, UK, 2018; ISBN 978-1-907-42795-4. [Google Scholar]
- Ziegler, R. Der Schatzfund von Brauweiler. Untersuchungen zur Münzprägung und zum Geldumlauf im gallischen Sonderreich; Bonner Jahrbücher, Beihefte 42; Rheinland-Verlag: Köln, Germany, 1983; ISBN 3-7927-0662-8. [Google Scholar]
- Demo, Ž. Trier—ostava antoninijana druge 3. stoljeća [Trier—A hoard of Antoniniani from the late third century, Croatian]. Numiz. Vijesti 1984, 34, 30–51. [Google Scholar]
- R.-Alföldi, M. Die Fundmünzen der römischen Zeit in Deutschland. Abt. IV, Rheinland-Pfalz 3,4. Stadt und Reg.-Bez. Trier, Stadt Trier, Straßen rechts der Mosel A–K (3022–3110); Zabern: Mainz, Germany, 2007; ISBN 978-3-805-33814-1. [Google Scholar]
- Gilles, K.-J. Die Münzstätte der Gallischen Kaiser in Trier. In Archäologie in Rheinland-Pfalz; Landesamt für Denkmalpflege Rheinland-Pfalz: Mainz, Germany, 2007; pp. 74–77. [Google Scholar]
- Knickrehm, W. Offizielle und lokale Münzprägestätten des gallischen Sonderreichs in und um Trier; Kleine numismatische Reihe der Trierer Münzfreunde, 15; Trierer Münzfreunde: Trier, Germany, 2014; ISBN 978-3-923-57545-9. [Google Scholar]
- Anderson, C. Makers: The new industrial revolution; Crown Business (Crown Publishing Group): New York, NY, USA, 2012; ISBN 978-0-307-72095-5. [Google Scholar]
- Bass, M. (Ed.) Handbooks of Optics. Volume I—Fundamentals, Techniques, and Design, 2nd ed.; McGraw-Hill Professional Publishing: New York, NY, USA, 1995; ISBN 007-0-47740-7. [Google Scholar]
- Hecht, E. Optics; Pearson Education: Upper Saddle River, NJ, USA, 2017; ISBN 978-0-133-97722-6. [Google Scholar]
- Toschke, Y. Leveraging Additive Manufacturing for Optical Quality Control: Open Source Hardware Meets Open Innovation. Doctoral Thesis, Osnabrück University, Osnabrück, Germany, 2024. [Google Scholar] [CrossRef]
- Tompkins, H.G. A User-Guide to Ellipsometry; Elsevier Science: Chantilly, VA, USA, 1993; ISBN 978-0-126-93950-7. [Google Scholar]
- Murphy, J.; Ritter, G.J. Laser-induced damage in copper crystals. Appl. Phys. Lett. 1966, 9, 272–273. [Google Scholar] [CrossRef]
 : Position of Mint I, archaeologically confirmed.
  : Position of the two hoards FMRD IV, 3/4, 3068.3 and 3068.8 (Petzholdt [14], p. 37). (c) Map 3: Geographical location of Cologne and Brauweiler.
  : Position of Mint II, not archaeologically confirmed.
  : Position of the Brauweiler hoard.
: Position of Mint I, archaeologically confirmed. : Position of the two hoards FMRD IV, 3/4, 3068.3 and 3068.8 (Petzholdt [14], p. 37). (c) Map 3: Geographical location of Cologne and Brauweiler. : Position of Mint II, not archaeologically confirmed. : Position of the Brauweiler hoard.
: Position of the Brauweiler hoard.
: Position of Mint I, archaeologically confirmed. : Position of the two hoards FMRD IV, 3/4, 3068.3 and 3068.8 (Petzholdt [14], p. 37). (c) Map 3: Geographical location of Cologne and Brauweiler. : Position of Mint II, not archaeologically confirmed. : Position of the Brauweiler hoard.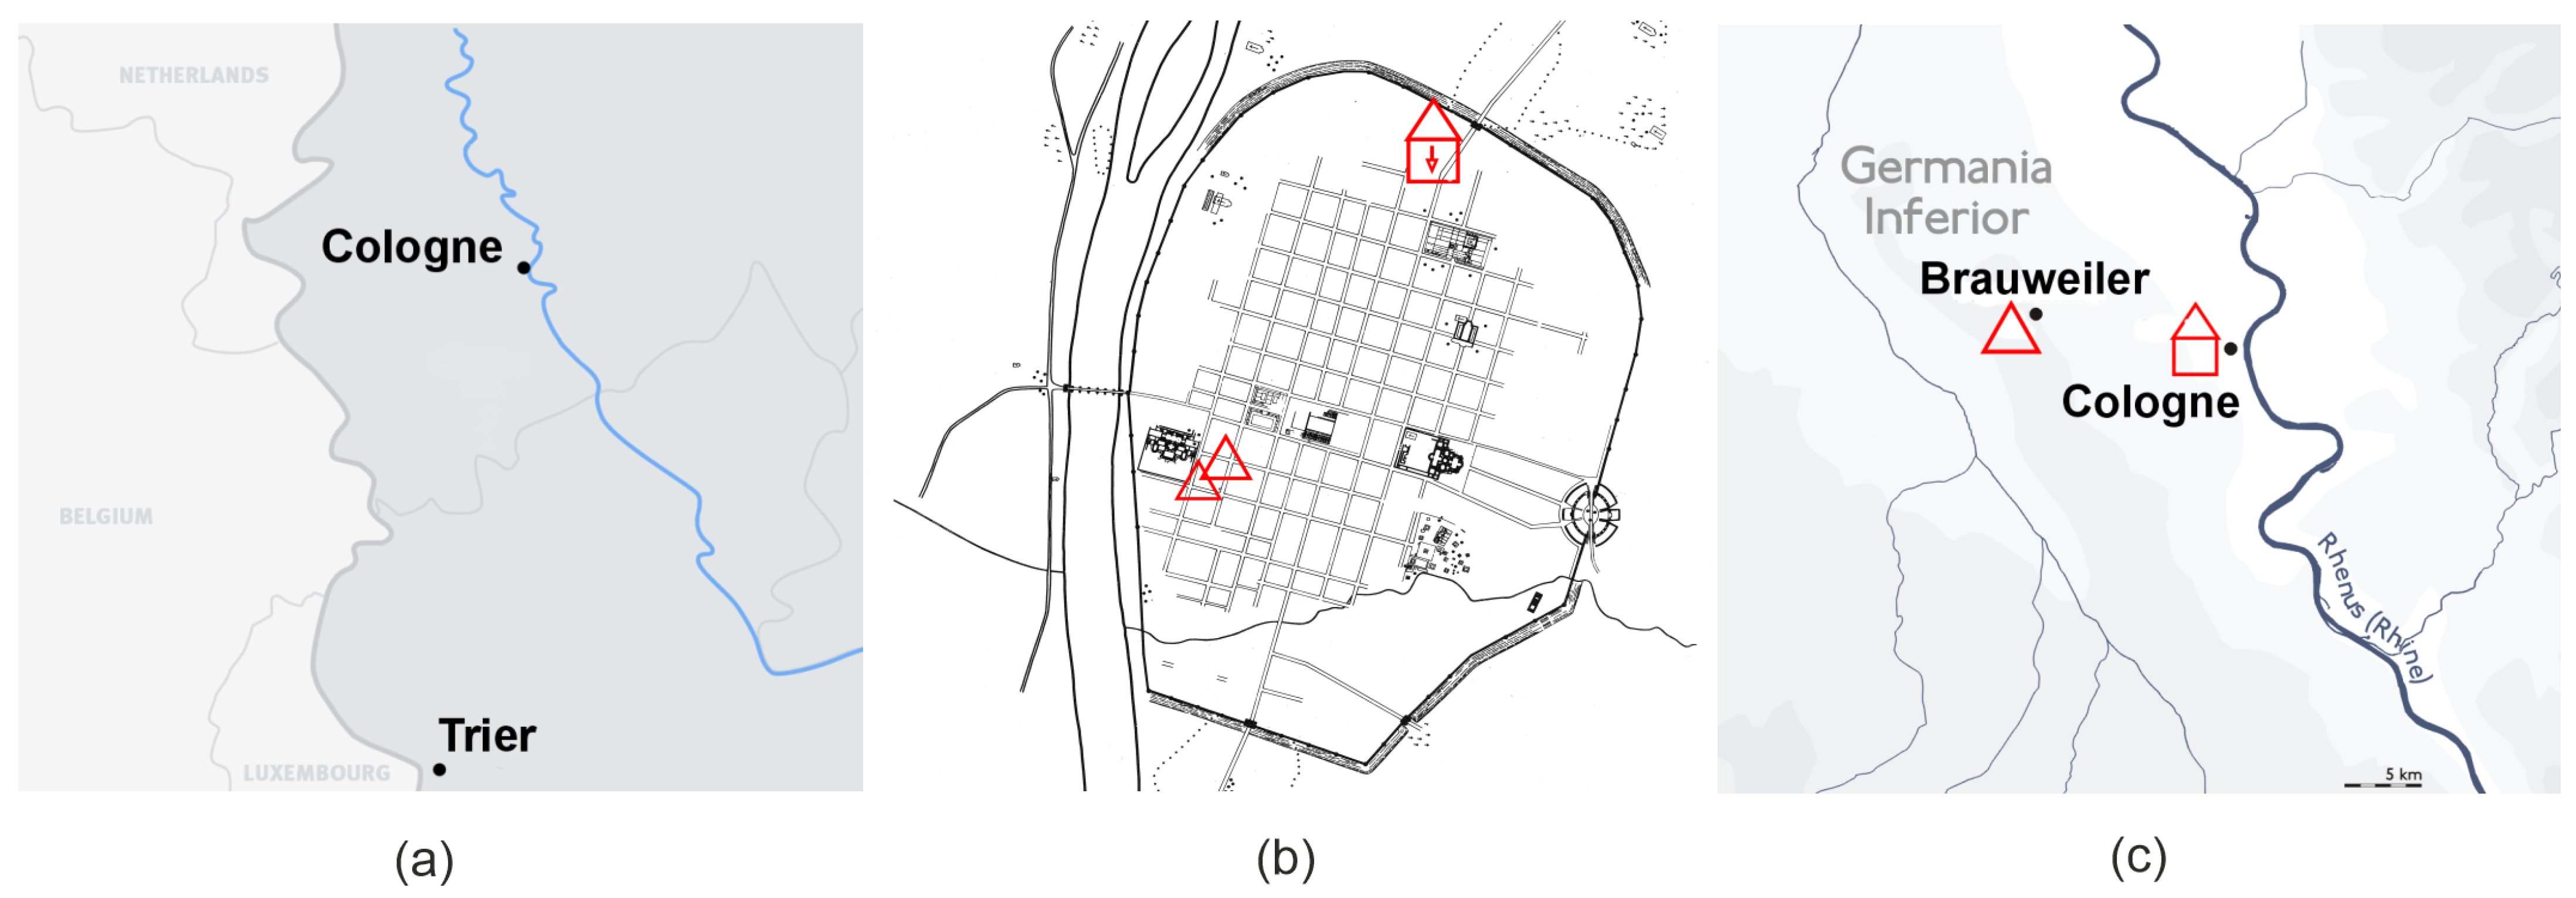

| Hoard | Mint I | Mint II |
|---|---|---|
| Brauweiler (near Cologne) | 36% | 63% |
| FMRD IV no. 3064.3 (Trier) | 85% | 15% |
| FMRD IV no. 3064.8 (Trier) | 88% | 12% |
| Obverse Types | |
|---|---|
| B1: | Cuirassed bust of the emperor right, radiate |
| D1: | Draped and cuirassed bust of emperor right, radiate |
| Reverse Types | |
| Aequitas 1: | Aequitas (personification of equity) standing l., |
| holding scales in her right hand | |
| and cornucopia in her left arm | |
| Pax 1: | Pax (personification of peace) standing l., |
| holding olive-branch in her right hand | |
| and a transverse scepter in her left arm |
| Trier | Cologne Phase I | Cologne Phase II | |
|---|---|---|---|
| M 5709 | M 5769 | M 5775 | |
| obverse |  |  | 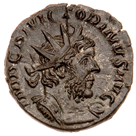 |
| reverse | 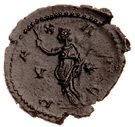 | 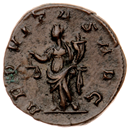 | 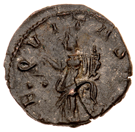 |
| Mint | Sample | (°) | FWHM(°) | |
|---|---|---|---|---|
| Trier | M 5709 | 56.8 ± 0.6 | 15.9 ± 0.8 | 16.3 ± 0.5 |
| M 5711 | 60.3 ± 0.6 | 21.9 ± 0.9 | 08.5 ± 0.4 | |
| M 5712 | 65.5 ± 0.6 | 19.7 ± 0.9 | 10.8 ± 0.5 | |
| M 5713 | 56.6 ± 0.6 | 18.1 ± 0.9 | 13.0 ± 0.5 | |
| M 5714 | 57.9 ± 0.6 | 19.2 ± 0.9 | 11.3 ± 0.5 | |
| Average | 59.4 ± 1.7 | 19.0 ± 1.0 | 12.0 ± 1.3 | |
| Cologne phase I | M 5769 | 60.9 ± 0.6 | 24.5 ± 1.0 | 07.7 ± 0.4 |
| M 5770 | 59.8 ± 0.6 | 13.9 ± 0.8 | 23.3 ± 0.6 | |
| M 5772 | 60.5 ± 0.6 | 21.7 ± 0.9 | 08.8 ± 0.4 | |
| M 5773 | 56.6 ± 0.6 | 18.9 ± 0.9 | 13.2 ± 0.5 | |
| M 5774 | 62.1 ± 0.6 | 16.1 ± 0.8 | 18.8 ± 0.5 | |
| Average | 60.0 ± 0.9 | 19.0 ± 1.9 | 14.4 ± 2.9 | |
| Cologne phase II | M 5775 | 61.5 ± 0.6 | 23.8 ± 1.0 | 07.0 ± 0.4 |
| M 5776 | 58.7 ± 0.6 | 15.9 ± 0.8 | 19.9 ± 0.6 | |
| M 5777 | 59.4 ± 0.6 | 16.5 ± 0.8 | 17.3 ± 0.5 | |
| M 5778 | 62.5 ± 0.6 | 38.6 ± 1.2 | 03.3 ± 0.4 | |
| M 5779 | 57.5 ± 0.6 | 11.3 ± 0.7 | 37.3 ± 0.7 | |
| Average | 59.9 ± 0.9 | 21.0 ± 5.0 | 17.0 ± 6.0 |
| Mint | Sample | Ag | Al | Ca | Cl | Cu | Fe | Ni | Pb | S | Si | Sn | Sum |
|---|---|---|---|---|---|---|---|---|---|---|---|---|---|
| Trier | M 5709 | 2.6 | 0.6 | 1.5 | 0.8 | 81.3 | 2.0 | 0.4 | 0.7 | 5.1 | 2.2 | - | 97.2 |
| M 5711 | 5.2 | - | - | 14.8 | 76.8 | - | - | 1.0 | 1.0 | - | - | 98.8 | |
| M 5712 | 4.1 | 0.4 | - | 2.3 | 87.6 | - | - | 1.2 | 1.3 | 1.1 | 0.5 | 98.5 | |
| M 5713 | 3.8 | 0.9 | - | 0.9 | 85.8 | - | - | 3.8 | - | 3.9 | - | 99.1 | |
| M 5714 | 4.3 | - | - | 5.9 | 83.7 | - | - | 3.3 | 0.4 | 0.7 | - | 98.3 | |
| CGN I | M 5769 | 5.6 | 0.7 | 0.9 | 2.2 | 84.6 | - | - | 0.9 | 1.0 | 2.6 | - | 98.5 |
| M 5770 | 7.0 | - | 0.5 | 12.3 | 74.3 | - | - | 3.0 | 1.2 | 0.8 | - | 99.1 | |
| M 5772 | 6.9 | - | - | 7.6 | 72.7 | - | - | 10.2 | 1.0 | 0.8 | - | 99.2 | |
| M 5773 | 6.2 | 0.4 | - | 3.6 | 85.7 | - | - | 1.7 | 0.7 | 1.1 | - | 99.4 | |
| M 5774 | 6.5 | 0.4 | - | 5.1 | 82.7 | - | - | 0.9 | 0.8 | 0.8 | 1.7 | 98.9 | |
| CGN II | M 5775 | 6.0 | 0.4 | 0.7 | 0.8 | 88.5 | - | - | 1.0 | 0.5 | 1.0 | - | 98.9 |
| M 5776 | 9.0 | 0.5 | - | 0.9 | 85.1 | - | - | 3.5 | - | 1.0 | - | 100.0 | |
| M 5777 | 6.5 | 1.3 | - | 1.4 | 79.8 | - | - | 4.1 | 0.5 | 4.8 | - | 98.4 | |
| M 5778 | 10.1 | - | - | 0.7 | 85.4 | - | - | 2.6 | - | 0.7 | - | 99.5 | |
| M 5779 | 6.7 | 0.6 | 0.5 | 2.2 | 85.9 | - | - | 0.9 | 0.9 | 1.1 | - | 98.8 |
Disclaimer/Publisher’s Note: The statements, opinions and data contained in all publications are solely those of the individual author(s) and contributor(s) and not of MDPI and/or the editor(s). MDPI and/or the editor(s) disclaim responsibility for any injury to people or property resulting from any ideas, methods, instructions or products referred to in the content. |
© 2025 by the authors. Licensee MDPI, Basel, Switzerland. This article is an open access article distributed under the terms and conditions of the Creative Commons Attribution (CC BY) license (https://creativecommons.org/licenses/by/4.0/).
Share and Cite
Toschke, Y.; Wolke-Hanenkamp, S.; Wolf, E.; Lichtenberger, A.; Martin, K.; Nieswandt, H.-H.; Imlau, M. Non-Destructive, Specular Laser Reflectometry and X-Ray Fluorescence Analysis Applied to Coins of the Gallic Roman Empire. Heritage 2025, 8, 202. https://doi.org/10.3390/heritage8060202
Toschke Y, Wolke-Hanenkamp S, Wolf E, Lichtenberger A, Martin K, Nieswandt H-H, Imlau M. Non-Destructive, Specular Laser Reflectometry and X-Ray Fluorescence Analysis Applied to Coins of the Gallic Roman Empire. Heritage. 2025; 8(6):202. https://doi.org/10.3390/heritage8060202
Chicago/Turabian StyleToschke, Yannic, Steffen Wolke-Hanenkamp, Eugen Wolf, Achim Lichtenberger, Katharina Martin, H.-Helge Nieswandt, and Mirco Imlau. 2025. "Non-Destructive, Specular Laser Reflectometry and X-Ray Fluorescence Analysis Applied to Coins of the Gallic Roman Empire" Heritage 8, no. 6: 202. https://doi.org/10.3390/heritage8060202
APA StyleToschke, Y., Wolke-Hanenkamp, S., Wolf, E., Lichtenberger, A., Martin, K., Nieswandt, H.-H., & Imlau, M. (2025). Non-Destructive, Specular Laser Reflectometry and X-Ray Fluorescence Analysis Applied to Coins of the Gallic Roman Empire. Heritage, 8(6), 202. https://doi.org/10.3390/heritage8060202