Abstract
This experimental study analyses the extent of chemo-mineralogical changes that occur when a building stone encounters a cycling isothermal treatment at 600 °C. Four carbonate and two silicate European building stones were analysed in their fresh quarried and thermally treated conditions by means of colour measurements, in situ X-ray diffraction (XRD), and optical microscopy. Furthermore, powdered samples were characterised by Fourier-transform infrared spectroscopy, simultaneous thermal analysis, and cycling thermogravimetry (TG). The in situ XRD spectra revealed a surface-limited phase transformation of solid calcite and dolomite under isothermal conditions during the first 10 min at 600 °C and 500 °C, respectively. The onset of thermal decomposition and extent of phase transformation were governed by the microstructure of the solid samples. Inter- and intragranular microcracks are induced to varying degrees, and their incidence depended on the stone’s microstructure. Discolouration indicated a transformation of minor elements across the entire analysed sample volumes. Kaolinite was preserved even after three hours of thermal treatment at its dehydroxylation temperature due to its sheltering in confined pore spaces. Mass loss was more pronounced when cyclic treatment was employed compared to a non-periodic treatment, as determined by a TG analysis performed at same time intervals. Examining the chemo-mineralogical and microstructural changes caused by heat treatment allows us to study how and if regaining mechanical strength and restoring physical properties are possible for purposes of heritage restoration after fire damage.
1. Introduction
The thermal treatment of stone and mineral materials is a wildly studied phenomenon in many areas of research and applications. It has been used to determine the effect of fire damage on civil and building structures [1,2], in concrete technology [3], geotechnical engineering [4], and ceramic firing [5] or to study the dynamics of the Earth’s interior [6], among others. In the built cultural heritage, it can be used to study the dating of ancient fires [7], the provenance of materials [8], and mixed-material design [9], combat microbiological growth on stone surfaces [10], or as an artificial ageing technique prior to study conservation treatments [11,12]. Physical changes in building stone (e.g., Young’s modulus, flexural strength, porosity, etc.) caused by thermal treatment are well-studied phenomena [13,14,15,16,17]. Research on chemo-mineralogical alterations (e.g., decomposition onset, mass loss in different conditions, chemical alterations, etc.) is lacking, especially regarding transition temperatures, transformation extent, and consequent influences on the stone’s structural integrity [18,19]. Stones that share the same chemical and mineralogical composition might differ in terms of genesis and, therefore, microstructure, which means that their resistance towards thermal treatment is also likely to vary. Moreover, the understanding of stone as an agglomerate of minerals, even when monomineralic, differs from single crystals in their susceptibility to thermal treatment [20]. The most common methods to study chemo-mineralogical changes induced through various forms of thermal treatment include simultaneous thermal analysis (STA), X-ray diffraction (XRD), Fourier-transform infrared spectroscopy (FTIR), and scanning electron and optical microscopy (SEM and OM), while physical changes can be studied with numerous petrophysical tests (e.g., compressive and tensile strength, ultrasonic pulse velocity, etc.) [21].
The main mineral components of most building stones are either of carbonate (i.e., calcite and dolomite) and/or silicate (i.e., quartz, mica, feldspars, etc.) nature. Furthermore, a significant number of stones contain clay minerals like kaolinite, illite, or smectite. Iron oxides, such as hematite and limonite, are the main colour-giving minerals, which make up minor and trace components of natural building stones. These minor and trace components are important because they are most likely to influence the visual appearance of the building stone upon thermal treatment, a phenomenon which has been well studied [22]. Minerals present in a minor amount can still have a strong influence on the stone’s integrity, as demonstrated by a recent study [23], where pyrite oxidation was responsible for an explosion-like decay starting at 400 °C. All aforementioned minerals are susceptible to heat degradation by varying degrees, and their abundance can influence chemo-mineralogical alterations in texture. Thermal decomposition of kaolinite (Al2Si2O5(OH)4) can be initiated at temperatures >400 °C, depending on experimental conditions and the structural properties of the mineral [24]. When kaolinite is calcined, dehydration is followed by dehydroxilation, which is irreversible when the crystal structure collapses to form amorphous, reactive metakaolin (Al2Si2O7). If the temperature further increases, transformation of the intermediate amorphous Al2O3 and SiO2 takes place, forming crystalline γ-alumina or a blend of amorphous silica with an alumina–silicon spinel, whereas temperatures >900 °C cause further transformations into mullite (Al6Si2O13) and α-cristobalite [25]. All quartz (SiO2)-bearing stones require a temperature of 573 °C to undergo a sudden change in volume due to α-to-β phase conversion. This thermal expansion, while reversible, is the primary cause of permanent physical changes in silicates. If heated further (>870 °C), β-quartz that contains impurities forms the high-temperature polymorph α-tridymite, while the latter causes a neoformation of β-cristobalite [26,27]. If tridymite formation does not occur, the β-quartz directly forms cristobalite. Regarding carbonates, the thermal expansion of calcite and dolomite increases progressively starting from room temperature, until their decomposition. The calcination of calcite (trigonal polymorph of CaCO3) begins at 600 °C [28], while dolomite (CaMg(CO3)2) can decompose earlier, starting from 500 °C [29,30]. However, such processes differ and are influenced by many extrinsic and intrinsic parameters. Major extrinsic influences include the atmospheric conditions, the peak temperature, the partial pressure, the residence time, the nature and duration of exposure, and the physical state of a material (i.e., powder, solid, or aggregates). Intrinsic parameters include the mineralogical composition, content, and chemical reactivity, as well as the microstructural properties of the material, such as crystallinity, grain-size distribution, porosity, etc. The thermal decomposition of calcite is a well-studied phenomenon due to its industrial importance [31]. Calcite decomposes into its solid calcium oxide and gaseous carbon dioxide reaction products. The solid product of the reaction is highly reactive and re-carbonates under atmospheric conditions, under the influence of moisture and carbon dioxide, back to calcium carbonate, a process known as the lime cycle. If calcined at temperatures >900 °C and in the presence of quartz, the formation of Larenite (Ca2SiO4) is possible [32]. Similarly to calcite, the thermal decomposition of dolomite has been extensively studied with numerous thermoanalytical techniques. However, unlike calcite, the decomposition reaction of dolomite is a more complex, multi-step reaction [33,34,35].
Throughout history, heritage structures constructed out of natural stone have suffered fire damage around the world [36]. Following recent events at Notre Dame de Paris, the Glasgow School of Arts, and New York’s Saint Sava Cathedral [37], the topic of how to remedy the damage caused by higher temperature on stone monuments still remains. A recent study [38] investigated the challenges that post-fire restoration poses, with a focus on Notre Dame de Paris. The same study assumed that the interior stone conditions indicated maximal temperatures of 500 to 600 °C. Fire-related peak temperatures can vary in range and duration; however, 600 °C is a temperature high enough to reduce the stone’s structural soundness and is, therefore, a widely studied peak temperature in many heat-related studies. Such temperatures are important for investigations of potential phase changes, while higher temperatures have also relevance in industrial use and the understanding of planetary dynamics. Siegesmund [39] describes that, for thermal expansion in building stone, temperatures of up to 120 °C are relevant; however, elevated temperatures still result in a much higher residual strain and, therefore, more damage. He further notes that, with temperatures below 500 °C, the pore radii do not change significantly, and, with the exception of very porous stones (>15%), it can be said that the higher the temperature, the higher the residual strain. Therefore, at 600 °C, mineral decomposition is likely, depending on the mineral constitutes present in the texture and their exposure conditions.
This experimental study analyses chemo-mineralogical changes in six silicate and carbonate European building stones caused by cyclic thermal treatment during a static peak temperature of 600 °C. The purpose of this study is to determine the extent of chemo-mineralogical changes that occur in solid macroscopic samples based on their most abundant minerals, that is, calcite, dolomite, quartz, and kaolinite. A multi-analytical approach was used, combining OM, in situ XRD, and colour measurements, to study alterations in solid samples. Furthermore, ground samples were also analysed by means of STA, cycling thermogravimetric analysis (TGA), and FTIR to determine the main chemo-mineralogical modifications.
2. Materials and Methods
2.1. Petrographic Characterisation of the Lithotypes
Petrographic description was carried out by the examination of thin sections, while the mineralogical and chemical composition was examined by X-ray diffraction and X-ray fluorescence analyses. The porosity of all the studied lithotypes was examined by mercury intrusion porosimetry (MIP), as determined by a Porosimeter Porotec Pascal 140/440 developed by Thermo Fisher Scientific Inc., Waltham, MA, USA.
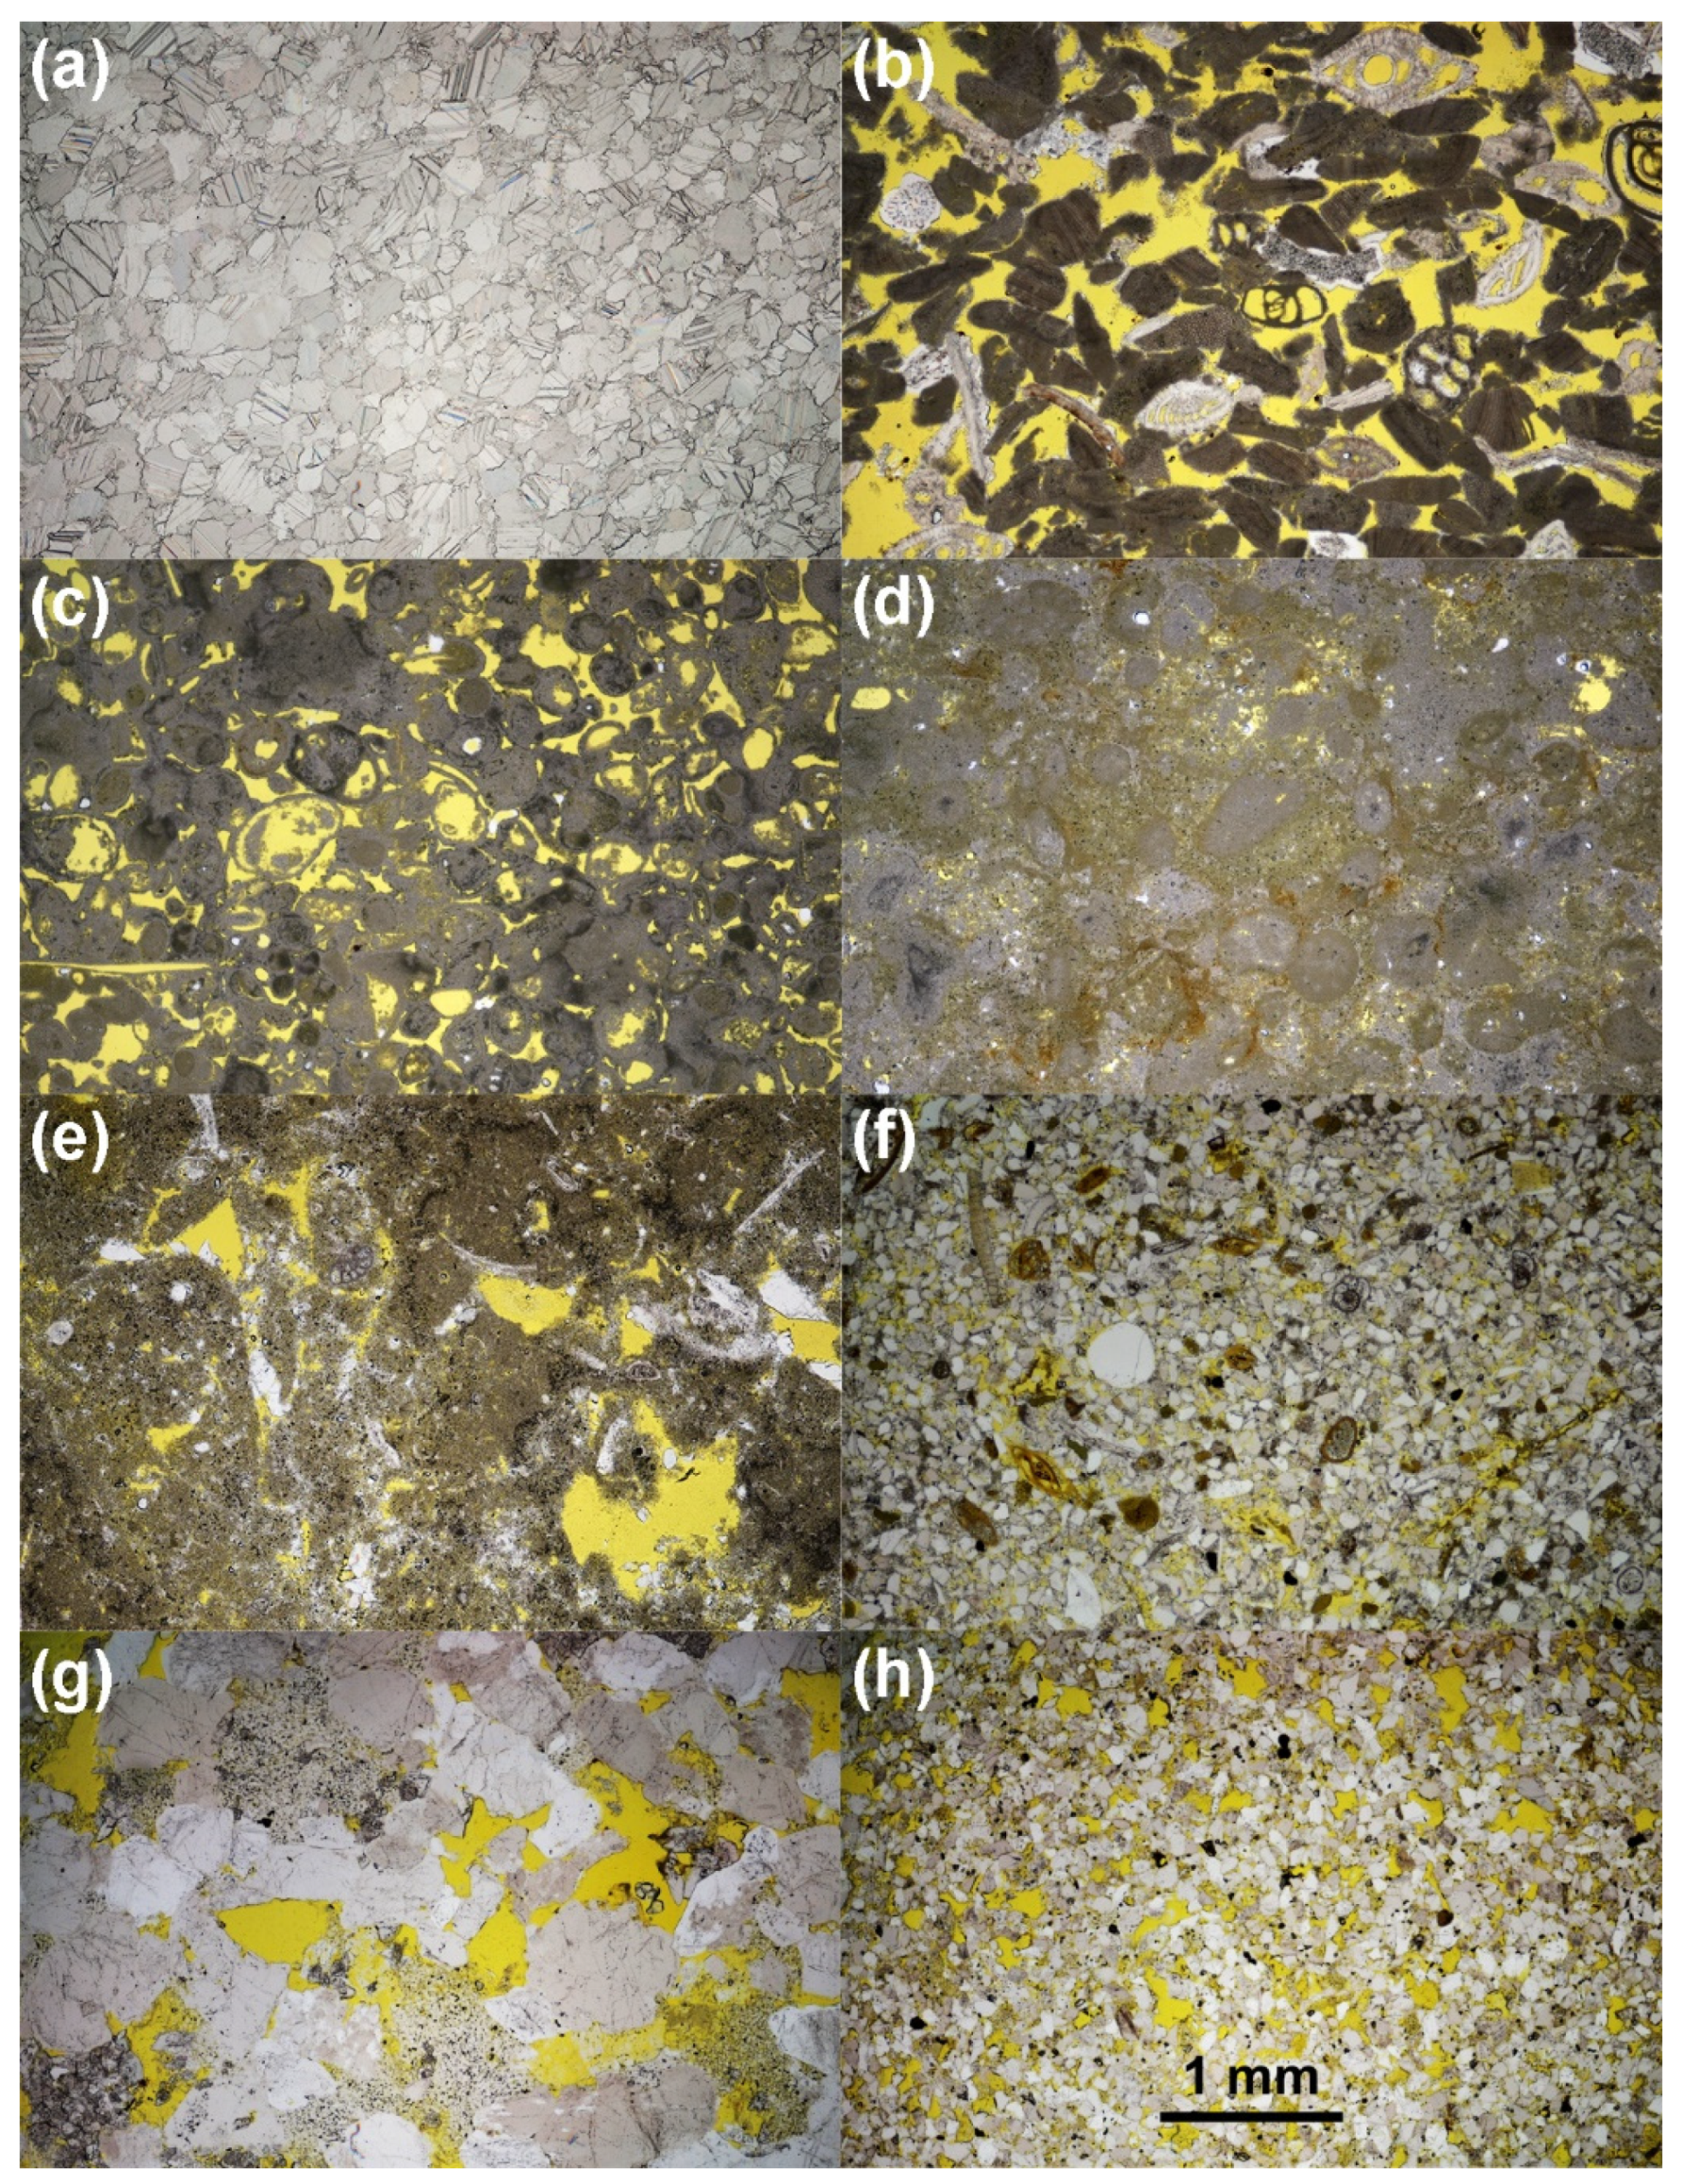
Figure 1a shows the characteristic texture of one of the most renowned white marbles, the Apuan Marble (AM), quarried from the Apuan Alps in northern Tuscany, Italy. This fine-grained metamorphic rock consists of calcite, with traces of dolomite as well as quartz, and is also known under the name of Carrara marble. Its granulometry is equi- to inequigranular, and the grain contacts are polygonal to interlobate, with an approx. size of 0.2 mm. Apuan Marble is dense, which is why its porosity amounts to approx. 0.7%.

Figure 1.
Petrographic overview of the studied lithotypes: (a) Apuan Marble, (b) St. Margarethen calcarenite, (c,d) images of the same thin section of Lumaquela de Ajarte Dolostone of two microstructural varieties, (e) Lumaquela de Ajarte Calcite, (f) Balegem, (g) Schlaitdorf, and (h) Obernkirchen. Details on the textural features can be viewed under Supplementary Information. The yellow resin displays the porosity of the samples. All images were taken under plane-polarised light (PPL). The scale bar applies to all images.
The porous, biogenic sedimentary rock called St. Margarethen (SM) is a biosparite, or calcarenite, that is quarried in the Leitha Mountains, at the border between Lower Austria and Burgenland, in Austria. The colour of this detritic limestone ranges from yellow-brownish to light grey. The micrograph (Figure 1b) displays a texture that is composed of small fragments of fossils of coralline red algae, foraminifera, serpulides, ostracods, and echinoderms, some of which can reach a size of up to few centimetres in hand specimens. Additionally, SM contains detritic quartz in traces. The grain contacts of this calcarenite are cemented with coarse crystalline (i.e., >10 μm) calcite cement. Its total open porosity (measured by MIP) is approx. 22%.
Ajrate Trevino in Spain is the home of two carbonate varieties, located in the same quarry. The beige-to-yellowish Ajarte Dolostone (AD) exhibits distinctive microstructural differences due to the varying abundance of the binding matrix (Figure 1c,d). Its total open porosity amounts to 25% (measured by MIP). The creamy greyish calcite variety of Ajarte (AC) is classified as a poorly sorted biomicrite to biosparite. Figure 1e shows the carbonate matrix that consists of recrystalised fossils and shell fragments, but the stone’s microstructure makes it difficult to distinguish between the components and the matrix. Furthermore, this stone has a high amount of intercrystalline pores and, in general, pores filled with sparite cement. The porosity, as determined by MIP, of the calcite variety of Ajarte is approx. 23%. A clear mineralogical and chemical distinction of the two Ajarte varieties extracted from the same quarry can be seen in Table 1. For the XRD diffractograms, the reader is referred to Supplementary Information (Figure S1).

Table 1.
Mineralogical composition as examined by X-ray diffraction analysis.
The clastic sedimentary rock Balegem (BL), from Oost-Vlaanderen, Gemeente Balegem, in Belgium, is normally light greyish in colour, and its main components are calcite, quartz, feldspar, and many different types of foraminifera. This detritic limestone, also known as Lede stone, is classified as a fossilifereous, siliclastic arenite. Due to its almost equal ratio of calcite to quartz, this stone is often referred to as a sandy limestone. The siliceous clasts are predominantly composed of angular quartz, approx. 0.1 to 0.2 mm in size. Occasionally, larger grains of siltstone, inclusions of goethite, and glauconite can be observed too. It has no preferred bedding orientation, and the matrix between the aggregates is a microsparitic to sparitic cement. Figure 1f shows the homogeneous texture of the Balegem stone, but it should be noted that this lithotype is quite inhomogeneous and occurs in varying qualities and petrophysical properties [40]. The porosity by MIP for the Balegem stone used in the present study amounts to 10%.
The coarse-grained Schlaitdorf sandstone (SQ), from Württemberg, Germany, is light-to-reddish in colour. Its detrital fraction consists of quartz, feldspar, rock fragments, and a cement that consists of a sparitic dolomite and microcrystalline silica, with smaller amounts of kaolinite and illite (Figure 1g). The cement is homogeneously distributed in the well-sorted, not-layered homogenous texture. The average grain size is about 0.5 mm and reaches a size of up 1 mm, while the grains are very angular to subangular and exhibit an average sphericity. Schlaitdorf’s main accessory minerals are apatite, tourmaline, zircon, and opaque minerals with less than 1% occurrence [41]. The open porosity of the stone, measured by MIP, is 16%.
The second silicate variety, the Obernkirchen quartz sandstone (OQ), is located in Lower Saxony’s Brückeberge in Germany, and its colour ranges from whitish over greyish to yellowish and orange. It is a fine-grained clastic sedimentary rock with a grain size averaging between 0.05 and 0.1 mm, as can be seen in Figure 1h. This quartzarenite has no obvious layering nor a bedding orientation, and the grain contacts are manly planer to lobated with a slight authigenic growth of quartz. The lithotype is grain-supported, containing approx. 5% of homogeneously distributed kaolinite. The open porosity of OQ measured by MIP is 24%.
The studied lithotypes played an important role as historical building stones in Europe’s built cultural heritage and are still actively quarried for purposes of restoration and reconstruction work [42,43,44]. It should be noted that two of the studied lithotypes (Carrara marble and Lede stone) are designated by the IUGS (International Union of Geological Sciences) as heritage stones [45]. A recent review on high-temperature effects on global heritage stone resources highlighted the need for research to better understand how these heritage stone materials behave when exposed to high temperatures [46].
The abundance of the main mineralogical components as analysed by XRD are listed in Table 1, while Table 2 exhibits the chemical analysis of the studied lithotypes assessed by means of XRF (the device used for XRF analysis was a Bruker AXS Pioneer S4 device equipped with a rhodium tube and developed by Bruker AXS Inc., Madison, WI, USA.
Table 2.
Chemical compositions reported in wt.-% and determined through X-ray fluorescence.
The major and minor element concentrations obtained for the studied lithotypes are summarised in Table 2. For AM, SM, and AC, the most important element content corresponded to CaO with a concentration range of 55.40 to 52.51%. These results were expected, as the petrographic description, assessed by thin-section microscopy, and phase analysis, performed using XRD, confirmed the presence of calcite. The dolostone (AD) had the highest MgO concentrations of 20.21% and a CaO content of 31.91%, as expected. The MgO content of SQ should have been higher than 0.04%, as XRD and thin-section microscopy had revealed the presence of dolomite in scarce amounts (an average was estimated between 2 and 5%, according to the analysed stone variety). This discrepancy was a result of the variability of natural stone, as only 4 g of the material was used for the XRF analysis. However, as SQ is a well-studied construction material, the abundance of dolomite had already been described in the published literature (e.g., [44]). The varieties SQ and OQ had the highest content of SiO2 (95.95 to 95.09%), followed by the sandy limestone BL, in which the SiO2 content amounted to 45.54% and the CaO content to 27.94%. Minor concentrations of Al2O3 (3.85–3.22% for SQ and OQ and 1.25–1.13% for BL and AC) and Fe2O3 (1.16% for BL) were recorded. The concentration of the remaining elements, i.e., K, Na, Ti, Mn, Sr, S, and P, and corresponding oxides did not play a governing role in any of the minerals identified; they were present in small concentrations (<1 wt.-%), as can be seen in Table 2. The XRF results supported the petrographic description and mineralogical findings.
2.2. Calcination
Quarried stone specimens with a dimension of 50 × 50 × 25 mm were exposed to three thermal cycles at a static peak temperature of 600 °C. Therefore, a Thermo Scientific Heraeus K 114 electrically heated furnace with a 3.5 L internal volume was used. The heating rate was set to 40 °C min−1 until the isothermal conditions were met and subsequently kept for one hour at 600 °C. Following a cooling phase to approx. 35 °C with an opened front door to overcome differential stresses caused likely by rapid cooling, this procedure was repeated three times overall. The residence time was established by experimental pre-screenings for all the studied lithotypes [47]. The chosen time showed sufficient strength of the materials to overcome thermal gradients and, thus, complete breakdown of the specimens by the formation of larger cracks. Moreover, three cycles displayed the highest threshold for the reduction in structural soundness examined in terms of physical changes by means of sound speed propagation and water absorption. Even though the stagnation of the reduction in structural soundness for all lithotypes was not comparable to the same degree, the goal was to reduce the structural soundness of the material to the lowermost degree and study the chemo-mineralogical changes at this transition temperature. However, it is important to note that the residence time deviates with the shape of the specimen used and the volume of the oven. This needs to be adapted accordingly to achieve the same degradation effect, like in the present study. For some characterisation techniques, where the alterations were difficult to analyse, additional calcination for a prolonged time at 600 °C and 900 °C was also performed and used to cross-validate chemo-mineralogical transformations. All these changes in experimental conditions are indicated in the corresponding graphs.
2.3. Analytical Techniques
Simultaneous thermal analysis (STA) was carried out employing a Netzsch device type STA 409 PC Luxx (Netzsch-Gerätebau GmbH, Selb, Germany). The freshly quarried and ground samples were heated at a constant rate of 10 K min−1, while the weight change (TGA: thermogravimetric analysis) and heat flow (DSC: differential scanning calorimetry) were recorded simultaneously. For the analysis, 50 mg of sample was weighted into a Pt-pan and heated from room temperature to 1000 °C. The controlled atmosphere consisted of air, in an amount of 50 mL min−1, and N2, in an amount of 15 mL min−1. Prior to testing, the powdered samples were stored in a drying oven at 65 °C for 72 h in order to remove free water from the surface.
The rate of weight change as a function of temperature was recoded with a TA instrument type 2050 equipped with an EGA furnace (TA Instruments, New Castle, DE, USA), while the analysis was carried out using the TA Universal Analysis 2000 Software (Version 4.5A). The thermogravimetric analysis (TGA) was performed under static air conditions without the flow of gas. It should be noted that the type of furnace (especially its volume) is important, as the CO2 partial pressure during carbonate decomposition will vary with the type of equipment used. The 50 mg weighted sample was placed in a Pt-pan and heated under two experimental conditions to study the difference between cyclic and constant exposure time, both under isothermal conditions. The two setups included (i) three cycles under isothermal conditions at 600 °C (3 × 60 min) to simulate the thermal conditions in the furnace during calcination and (ii) one cycle under isothermal conditions at 600 °C, employing the same exposure time (1 × 180 min).
Fourier-transform infrared spectroscopy (FTIR) was performed by placing the powdered samples between two diamond plates and applying pressure to obtain a transparent film of the solid. Prior to the analysis of the sample, the diamond grid was analysed by itself to subtract the background signal. The spectra were recorded using a Thermo Scientific Nicolet iN10 MX Microscope (Thermo Fisher Scientific, Waltham, MA, USA) equipped with an MCT/A detector. The measurement range was set to 4000–675 cm−1, while the spectral collection was made in transmission mode, accumulating 16 scans in 3.07 s at a resolution of 8 cm−1, using Ominc Picta Software (Thermo Fisher Scientific, Waltham, MA, USA). The stones were analysed in their freshly quarried and thermally treated conditions. The samples were analysed within 20 min after thermal treatment.
All samples used for the STA, cycling TGA, and FTIR analyses were ground in the same manner. Prior to grinding, the samples were crushed manually to an approx. size of 1 cm3. Afterwards, they were placed in a Fritsch pulverisette 9 Vibrating Cup Mill (Fritsch GmbH, Idar-Oberstein, Germany) for a duration of 4 min. Only the silicate-bearing stones were milled for an additional 2 min until the sample material was haptic powdery and no granularity was sensed.
For measuring the colour difference before and after thermal treatment, a Konica Minolta spectrophotometer type CM700d was used with a spot diameter of 8 mm, and the test was performed according to EN 15886 [48]. Here, a standard daylight illuminant D65 with a 10° observer was applied. The results were analysed in the CIE 1976 L*, a*, and b* colour space to obtain the overall colour change (ΔE*). Three to five spots per sample area and condition were averaged to obtain the colour change.
Optical microscopy was used on polished thin sections of standard thickness (i.e., 30 μm) with an Olympus BX41 microscope (Olympus Europa, Hamburg, Germany). Furthermore, fluorescence light microscopy (Zeiss AxioSCOPE A1) was employed to study crack inducement after thermal treatment. The sampling was performed on a cube of 50 × 50 × 50 mm to assure similar structural features and divided into three prisms (25 × 25 × 50 mm) to analyse (i) the pristine condition, (ii) thermally treated conditions (three cycles under isothermal conditions at 600 °C, 60 min per cycle), and (iii) 900 °C (one cycle under isothermal conditions at 900 °C for 60 min). A temperature of 900 °C was employed for purposes of highlighting certain effects like colour change, microcracks inducement, and transformation front, among others. As the samples heated at 900 °C experienced severe changes, including volumetric expansion, one week passed before sample preparation was possible. The samples were embedded in a yellow (fluorescent) dyed epoxy resin and cured overnight at 40 °C.
In situ XRD spectra were collected using a PANalytical X’Pert MPD Pro powder diffractometer (Malvern Panalytical B.V. - Almelo, Netherlands) equipped with a high-temperature oven chamber (Anton Paar HTK 1200N) to study real-time phase transformations at high temperatures. The samples were first measured at room temperature, followed by heating steps up to 600 °C (40 °C min−1 heating ramp), simulating the calcination conditions used beforehand in the laboratory. Six subsequent XRD patterns were collected under isothermal conditions by stopping the heating ramp for 10 min at temperatures of 100, 200, 300, 400, and 500 °C, respectively. Please note that the heating ramp was stopped for 10 min so that a diffraction pattern could be collected at a certain temperature. At 600 °C, we held the temperature for 60 min, which corresponded to six patterns collected (i.e., one hour under isothermal treatment at 600 °C). After the isothermal treatment at 600 °C, the sample was cooled down to room temperature. This heating/cooling cycle was repeated three times to produce a sufficiently extended surface layer of transition phases. A BBHD mirror was used to select the CuKα1/2 characteristic lines (λα1 = 1.54060 Å, λα2 = 1.54443 Å) for the experiment. The instrument was set up for Bragg–Brentano reflection geometry in the θ/θ-mode. The working distance between the sample and the position-sensitive one-dimensional X’Celerator detector was 200 mm. The high-temperature sample stage operating in air under ambient pressure was used to track the thermal decomposition of disc-shaped stone specimens 18 mm in diameter and approx. 2.5 mm thick. Following dedicated temperature steps, the diffraction diagrams were recorded in situ. Therefore, we were able to observe in situ the phase evolution with temperature. For each temperature step, the data were continuously collected in a range from 15 to 90° with a diffraction angle of 2θ and a speed of 0.01°∆2θ/s. Subsequently, the data were analysed, including also Rietveld refinement, by the HighScore Plus software package [49] using the Powder Diffraction File (PDF4+ [50,51]; International Centre for Diffraction Data in Philadelphia, PA, USA). Rietveld refinement is a full-profile fitting method in which the difference between the experimental XRD profile and the calculated one is minimised by a least-squares procedure in order to match the patterns and account for variations, such as those induced by temperature changes. Prior to in situ XRD, a conventional XRD Panalytical XPert Pro MPD diffractometer was also employed. The samples analysed with the latter instrument were ground as described above.
3. Results and Discussion
3.1. Powdered Sample Analysis: Simultaneous Thermal Analysis, Cyclic Thermal Gravimetric Analysis, and Fourier-Transform Infrared Spectroscopy
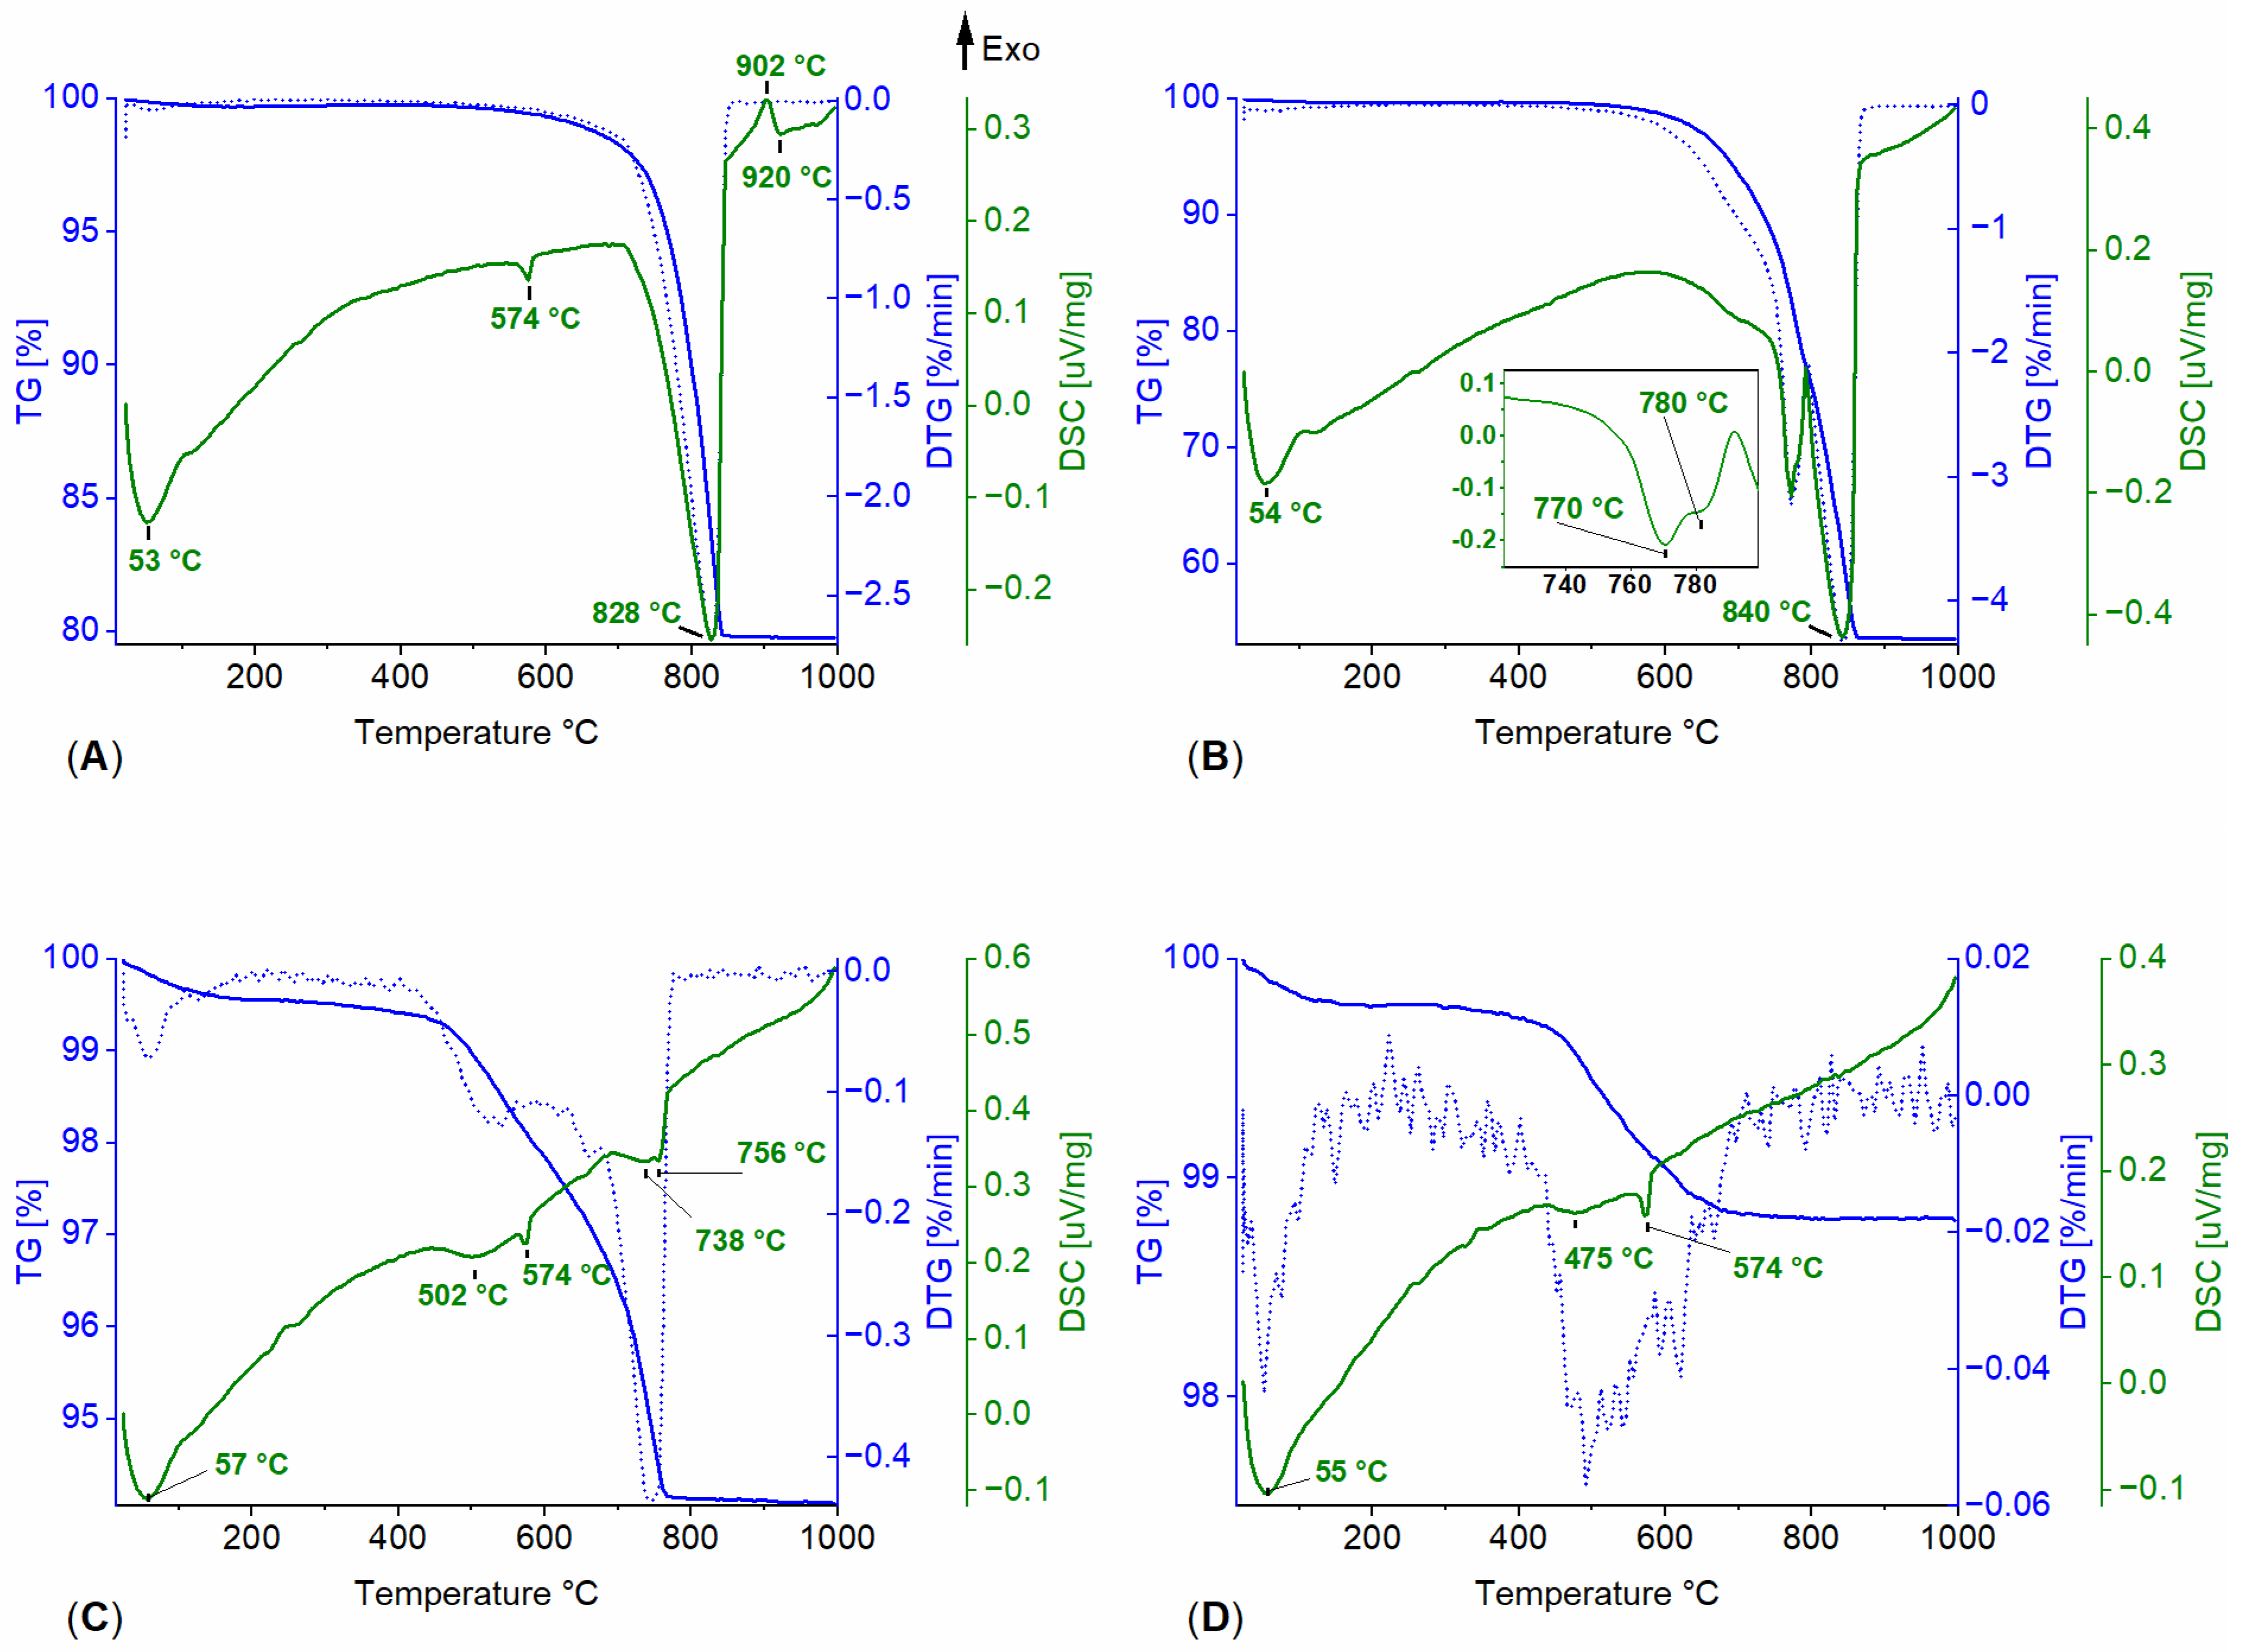
In addition to XRD, STA provided additional information on the mineralogical composition of the stones and was able to indicate differences in mass change between the materials. The calcium carbonate’s prominent endothermic peak that corresponded to its decomposition occurred at 863 °C for AM, SM, and AC, despite their differences in genesis and, thus, microstructure (see Figures S2–S4). However, the onset for the AC variety was lower and started just above 600 °C, while the two remaining carbonates’ onset initiated at 650 °C. This difference was possibly explained through a much finer calcite microstructure, with more surface area in the variety AC, compared to AM and SM, where no difference between the cement and carbonate microfossils could be distinguished. Moreover, sample characteristics (e.g., amount, packing density, particle size, thermal conductivity, etc.) are known to influence thermoanalytical recordings [52,53], although all stones in our study had been ground in the same manner, regardless of their differing mineral habitus. The total weight loss of carbonates was attributed to the release of gaseous carbon dioxide due to calcite thermal decomposition, as examined by means of TGA. The variety BL differed in both the onset and decomposition peak from the remaining carbonates (see Figure 2A). A possibility for the early decomposition onset at 560 °C could have been its minor mineralogical contents, that is, the presence of glauconite, which amounted to approx. 3.4 wt.-% [40]. Glauconite, similarly to mica and kaolinite, starts to eliminate chemically bound water between 300 °C and 400 °C, while a change in structure occurs only above 550 °C [54]. The shift in the endothermic calcite peak to a lower temperature of 828 °C might have been related to the overall heterogeneous mineralogical content and the fine-grained calcite matrix, similarly to AC. While glauconite could not be detected in the XRD spectra, its occurrence was visible in the thin-section analysis (see Supplementary Information). The exothermic peak above 900 °C could be attributed to recrystallisation processes, but it could not be assigned to a certain phenomenon, even more so as an overlap was possibly present, indicated by the endothermic peak at 920 °C. At this temperature range, glauconite is known to collapse, the decomposition of micas’ crystalline structure and the formation of spinel can occur, and the formation of hematite is possible, all phenomena which might have occurred [55,56]. The formation of hematite could take place either through the decomposition of glauconite or a transformation of goethite [22], both minerals which were present in the BL stone variety. The presence of goethite was found in BL as a natural phase, as confirmed by XRD measurements (see Figure S5). The dolomite in AD exhibited two distinct endothermic peaks (Figure 2B). The first, a double peak corresponding to dolomite decomposition, occurred at 770 °C, with a second peak located at 780 °C, while the second peak corresponded to calcite decomposition, with a rapid decomposition rate, occurring at 840 °C. The presence of dolomite in the cement of the silicate variety of SQ also led to a prominent double peak (738/756 °C), but without the subsequent calcite decomposition, which was either absent or overlapping (Figure 2C). In either case, the dolomite’s double peak present in SQ occurred at lower temperatures compared to that occurring in the dolostone (AD). However, it cannot be excluded that the decomposition onset of the dolomite present in SQ might have overlapped with the dehydroxilation of kaolinite, which would have influenced the readings concerning the temperatures of degradation onset. Comparing the kaolinite present in both silicate varieties, its dehydroxilation initiated at 450 for SQ and 420 °C for OQ, while the endothermic peak hill was located at 502 °C for SQ and 475 °C for OQ. Only the OQ variety allowed us to extract information regarding the completed dehydroxilation at approx. 685 °C (see the derivative of the mass change in Figure 2D). For SQ, completed dehydroxilation could not be observed as dolomite decomposition ariso, as stated previously. Regarding the kaolinite onset and peak temperatures, grain size and structural order–disorder are known to influence the shift and form of the peak patterns [57]. The difference between a sharp endotherm, as observed within a reference clay (KGa-2 kaolinite [58]), and the broad endotherms, as within the clayey matrices inside the quartz sediments, can be viewed in Figure S6. Moreover, the SQ variety was composed of a rather variegated marly clay consisting mainly of kaolinite and small amounts of illite, so it exhibited more impurities in terms of mineralogical content compared to the kaolinite present in OQ [44]. Regarding the quartz-bearing stones, quartz inversion was always exhibited at 574 °C. This so-called “quartz peak” is normally reported at a temperature of 573 °C (e.g., [59]), and the recorded 574 °C fell in the range of experimental error. A comparison of the residual mass after heating to 1000 °C can be extracted from Table 3, along with the results of mass change as analysed periodically and non-periodic by means of TGA.
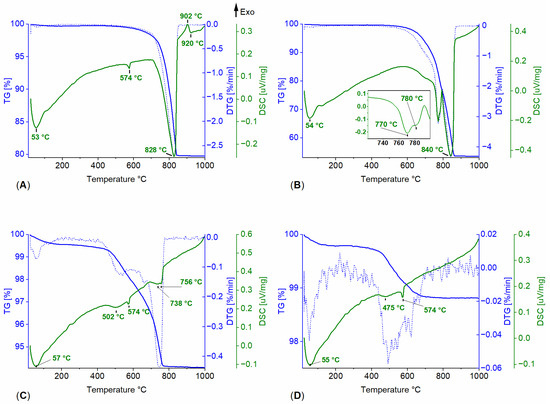
Figure 2.
Simultaneous thermal analysis of building stones: (A) Balegem, (B) Ajarte Dolostone, (C) Schlaitdorf, and (D) Obernkirchen.
Table 3.
Mass change in wt.-% calculated from thermogravimetric analysis (TGA) and simultaneous thermal analysis (STA). Note that, only for the samples where mass change was pronounced (with >1 wt.-% weight alterations), a non-periodic thermal treatment was additionally employed to cross-validate the results if mass alterations remained in the same order. Samples for which this procedure was not employed are labelled with N/A.
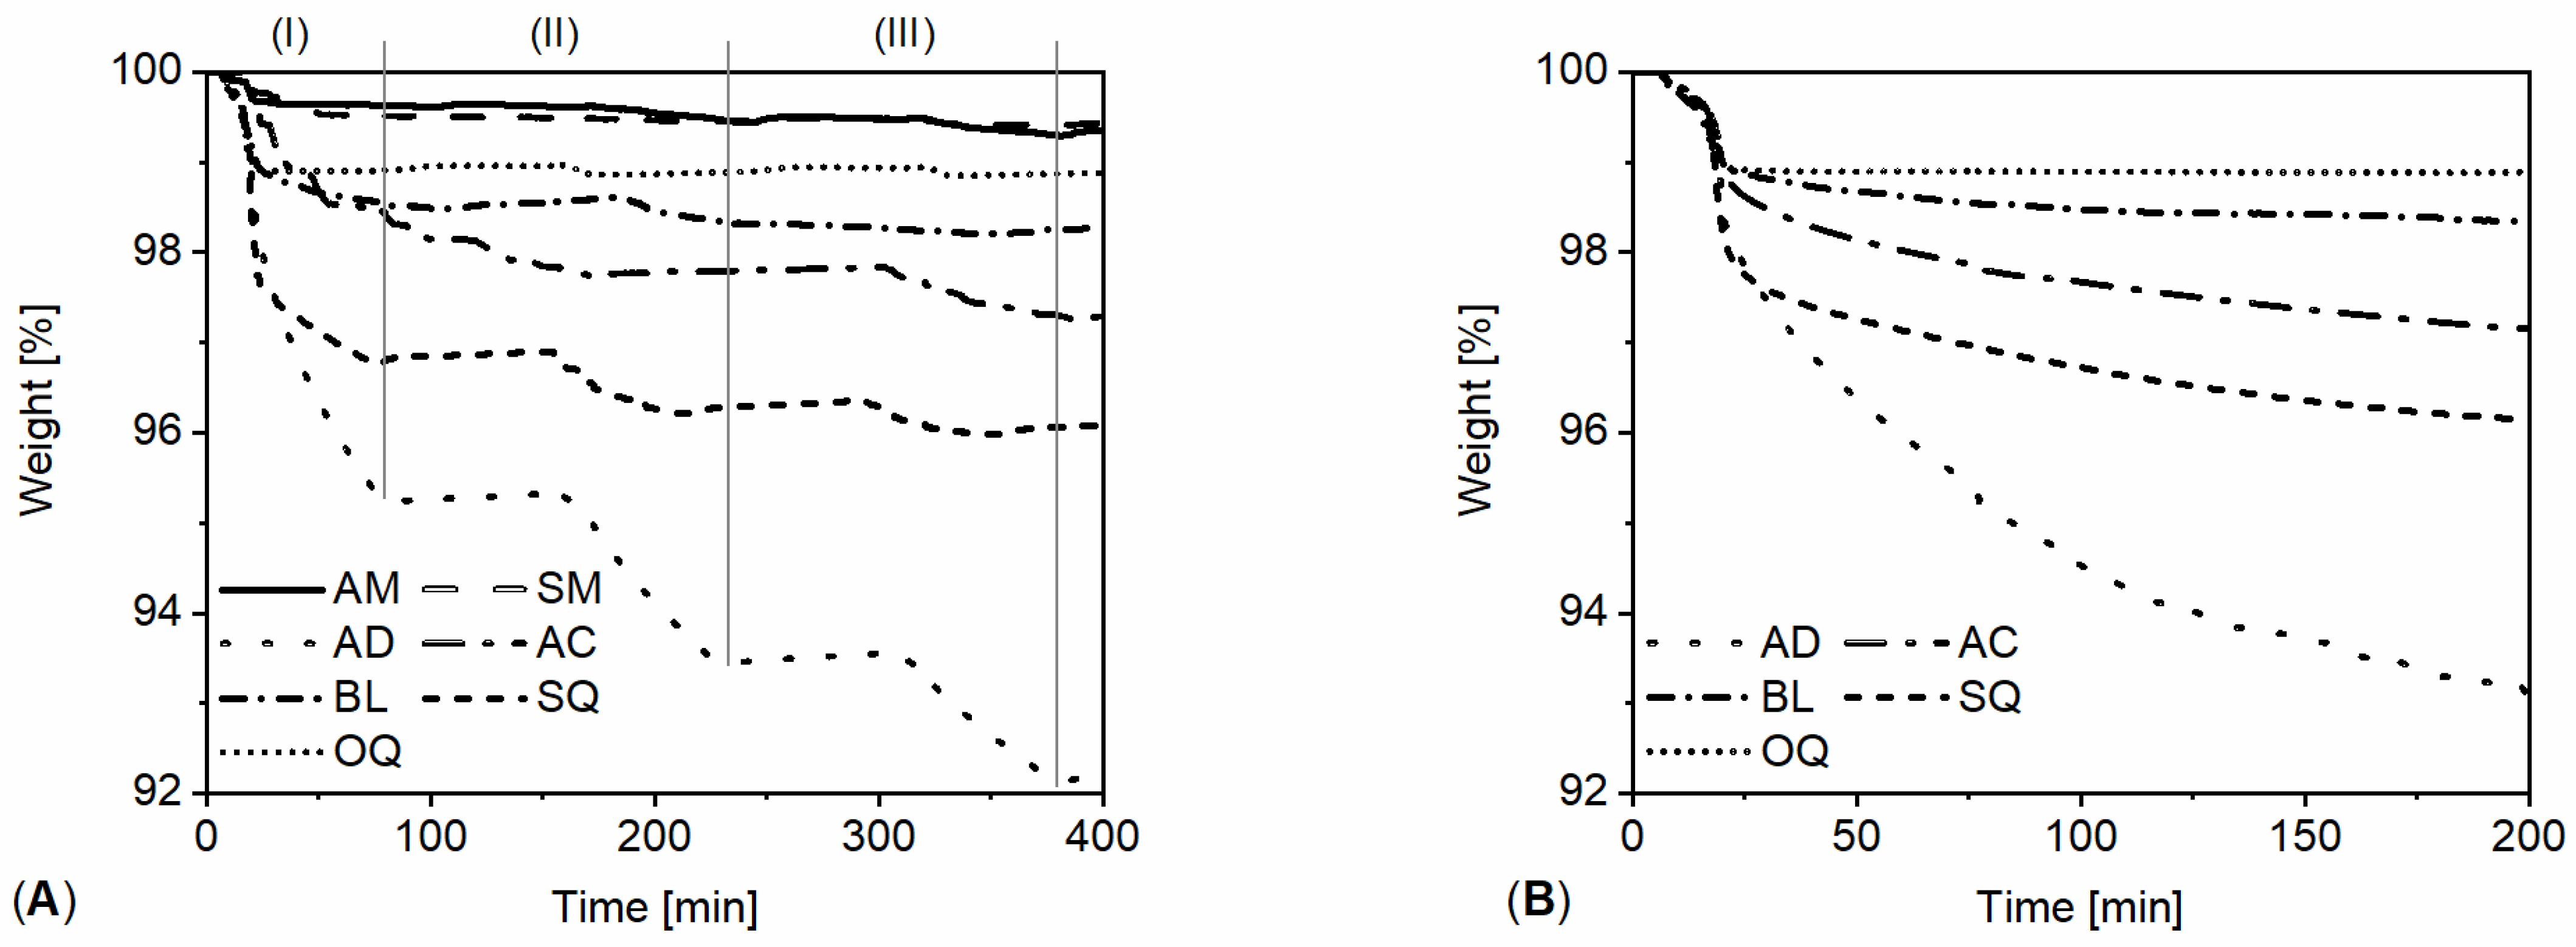
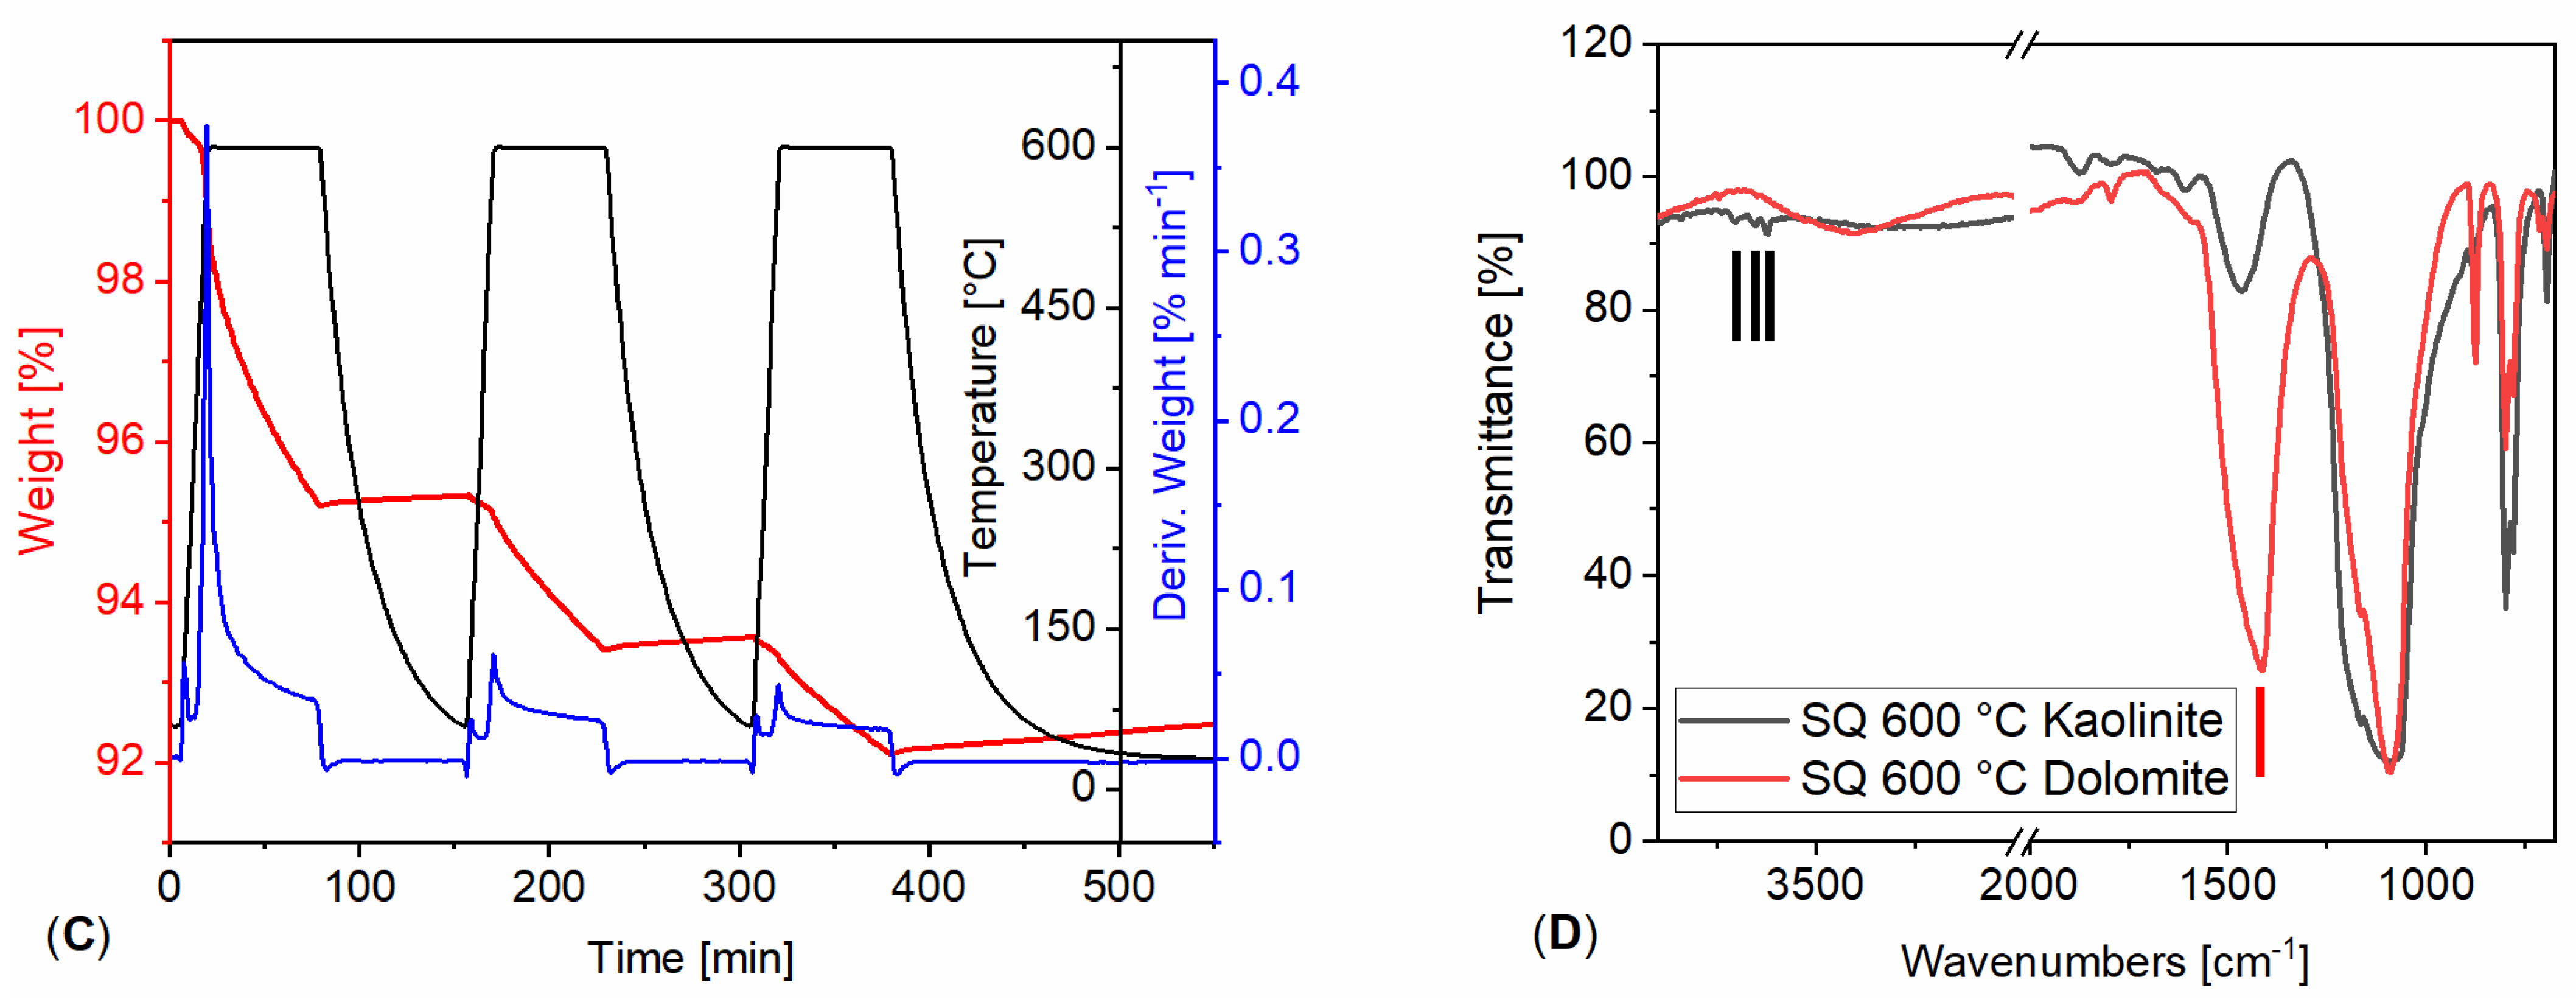
Cyclic TGA was in agreement with STA, as it confirmed that the carbonate varieties of AC and BL were more prone to thermal decomposition than AM and SM (see Table 3 and Figure 3A,B). TGA and STA, despite having different heating rates, atmospheric conditions, and residence times, had a similar trend regarding the mass change, with the exception for AM and SM, whose values lied in close proximity according to cyclic TGA data. Experiments concerning cyclic (i.e., three cycles at 60 min) and non-periodic (i.e., one cycle at 180 min) thermal treatment by means of TGA differed slightly in total mass change, but the trend was the same for all the samples. However, the cyclic treatment always exhibited a more pronounced effect on the mass change than the non-periodic treatment when employing the same residence time for both experimental setups. The results further showed that thermal cycling did not have the same effect on all stone varieties in relation to the weight loss per cycle applied. In the case of AM and SM, the first cycle was when the weight change occurred, while the remaining cycles could be characterised as fluctuations (Figure 3A). Nevertheless, in all cases, the first thermal cycle was when the most severe change occurred, followed by a reduction in mass change in each subsequent cycle. The dolostone (AD) underwent the most pronounced weight change, having the lowest residual mass and the highest weight loss with each thermal cycle, as can be viewed in Figure 3A,C. The susceptibility to thermal decomposition, starting from the most susceptible stone, followed the order of AD < SQ < AC < BL < OQ < AM < SM in the case of both cyclic and non-periodic exposure conditions. Regarding SQ and OQ, the entire weight reduction was associated with kaolinite and, in the case of SQ, also decomposed dolomite. The exact amount of kaolinite and dolomite in the analysed sample was not known, hindering statements on the completeness of their decomposition.
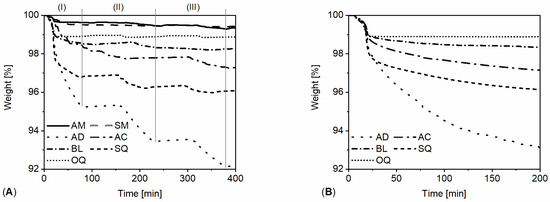
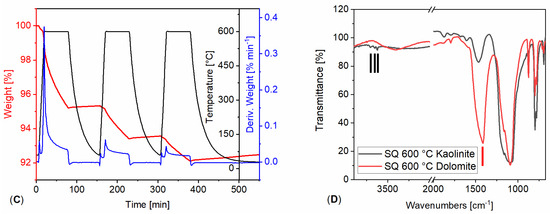
Figure 3.
(A) Cyclic (first (I) cycle, second (II) cycle and third (III) cycle) and (B) non-periodic TGA of all lithotypes and (C) Ajarte Dolostone, as examined by cyclic TGA. The weight loss curve is red, the derivative weight loss curve is blue and the temperature curve is black. (D) Fourier-transform infrared spectra of Schlaitdorf after cyclic isothermal treatment at 600 °C, showing the presence of dolomite and kaolinite as indicated by the carbonate vibrations (red line) and the hydroxyl groups (black lines), respectively. Details of this spectrum at smaller wavenumbers can be seen in Figure S7.
FTIR showed the presence of dolomite and kaolinite in SQ (Figure 3D) and kaolinite in OQ after the thermal treatment. The most prominent vibrational modes that confirmed the presence of dolomite were the broad v3 vibration at 1415 cm−1 (asymmetric stretching of the carbonate group and the sharper v2 vibration at 875 cm−1 (out-of-plane bending of the carbonate group). The easiest indices of kaolinite presence were the bands assigned to the hydroxyl groups at 3621, 3660, and 3706 cm−1. Furthermore, a 913 cm−1 shoulder (Al-OH vibrations) also indicated the presence of kaolinite (Figure S7a). The formation of metakaolin, a reactive amorphous phase, often resulted in the disappearance of the 3621–3706 cm−1 and 913 cm−1 bands. However, it should be noted that, in few cases, the absence of kaolinite and dolomite was recorded, which showed that, due to the inhomogeneity of the powdered samples, multiple spectra needed to be recorded to exclude the presence and/or absence of phases. For cross-validation, solid samples were subjected to thermal treatment for 10 h of exposure at 600 °C, followed by grinding of their surface layers (<1 cm3). Within the latter samples, the presence of dolomite was also confirmed (Figure S7b). These results confirmed that cyclic isothermal treatment at 600 °C did not entirely decompose kaolinite and dolomite constituents in a building stone, two of the minerals most susceptible to thermal decomposition. The latter statement was true for the employed thermal conditions and stone volumes used.
3.2. Solid-Sample Analysis: In Situ X-Ray Diffraction, Colour Measurements, and Microscopy
3.2.1. X-Ray Diffraction
Initially, XRD was performed on samples freshly quarried and subsequently heated under a cyclic isothermal treatment at 600 °C. Due to the transition temperature of 600 °C, the calcium oxide that originated was highly reactive and rapidly formed calcium hydroxide, which subsequently re-carbonated during the cooling and sample preparation processes, hindering the detection of eventual decomposition phases. The only building stone that showed a permanent difference was the dolostone variety of AD, where a calcium magnesium carbonate phase was developed which showed broad peaks next to the dolomite peaks (see Figure S8). The broad peaks could be attributed to concentration gradients due to non-stoichiometry compounds of the newly created phase [60]. The recording of highly reactive phases (i.e., calcium or magnesium oxides) was only possible through the use of in situ XRD (Figure 4). Here, a real-time analysis of phase changes on the surfaces of the building stones was made possible using the Rietveld method [61]. Through the Rietveld method, we were able to calculate the amount of decomposition and formation phases in wt.-% (see Figure 5).
Figure 4.
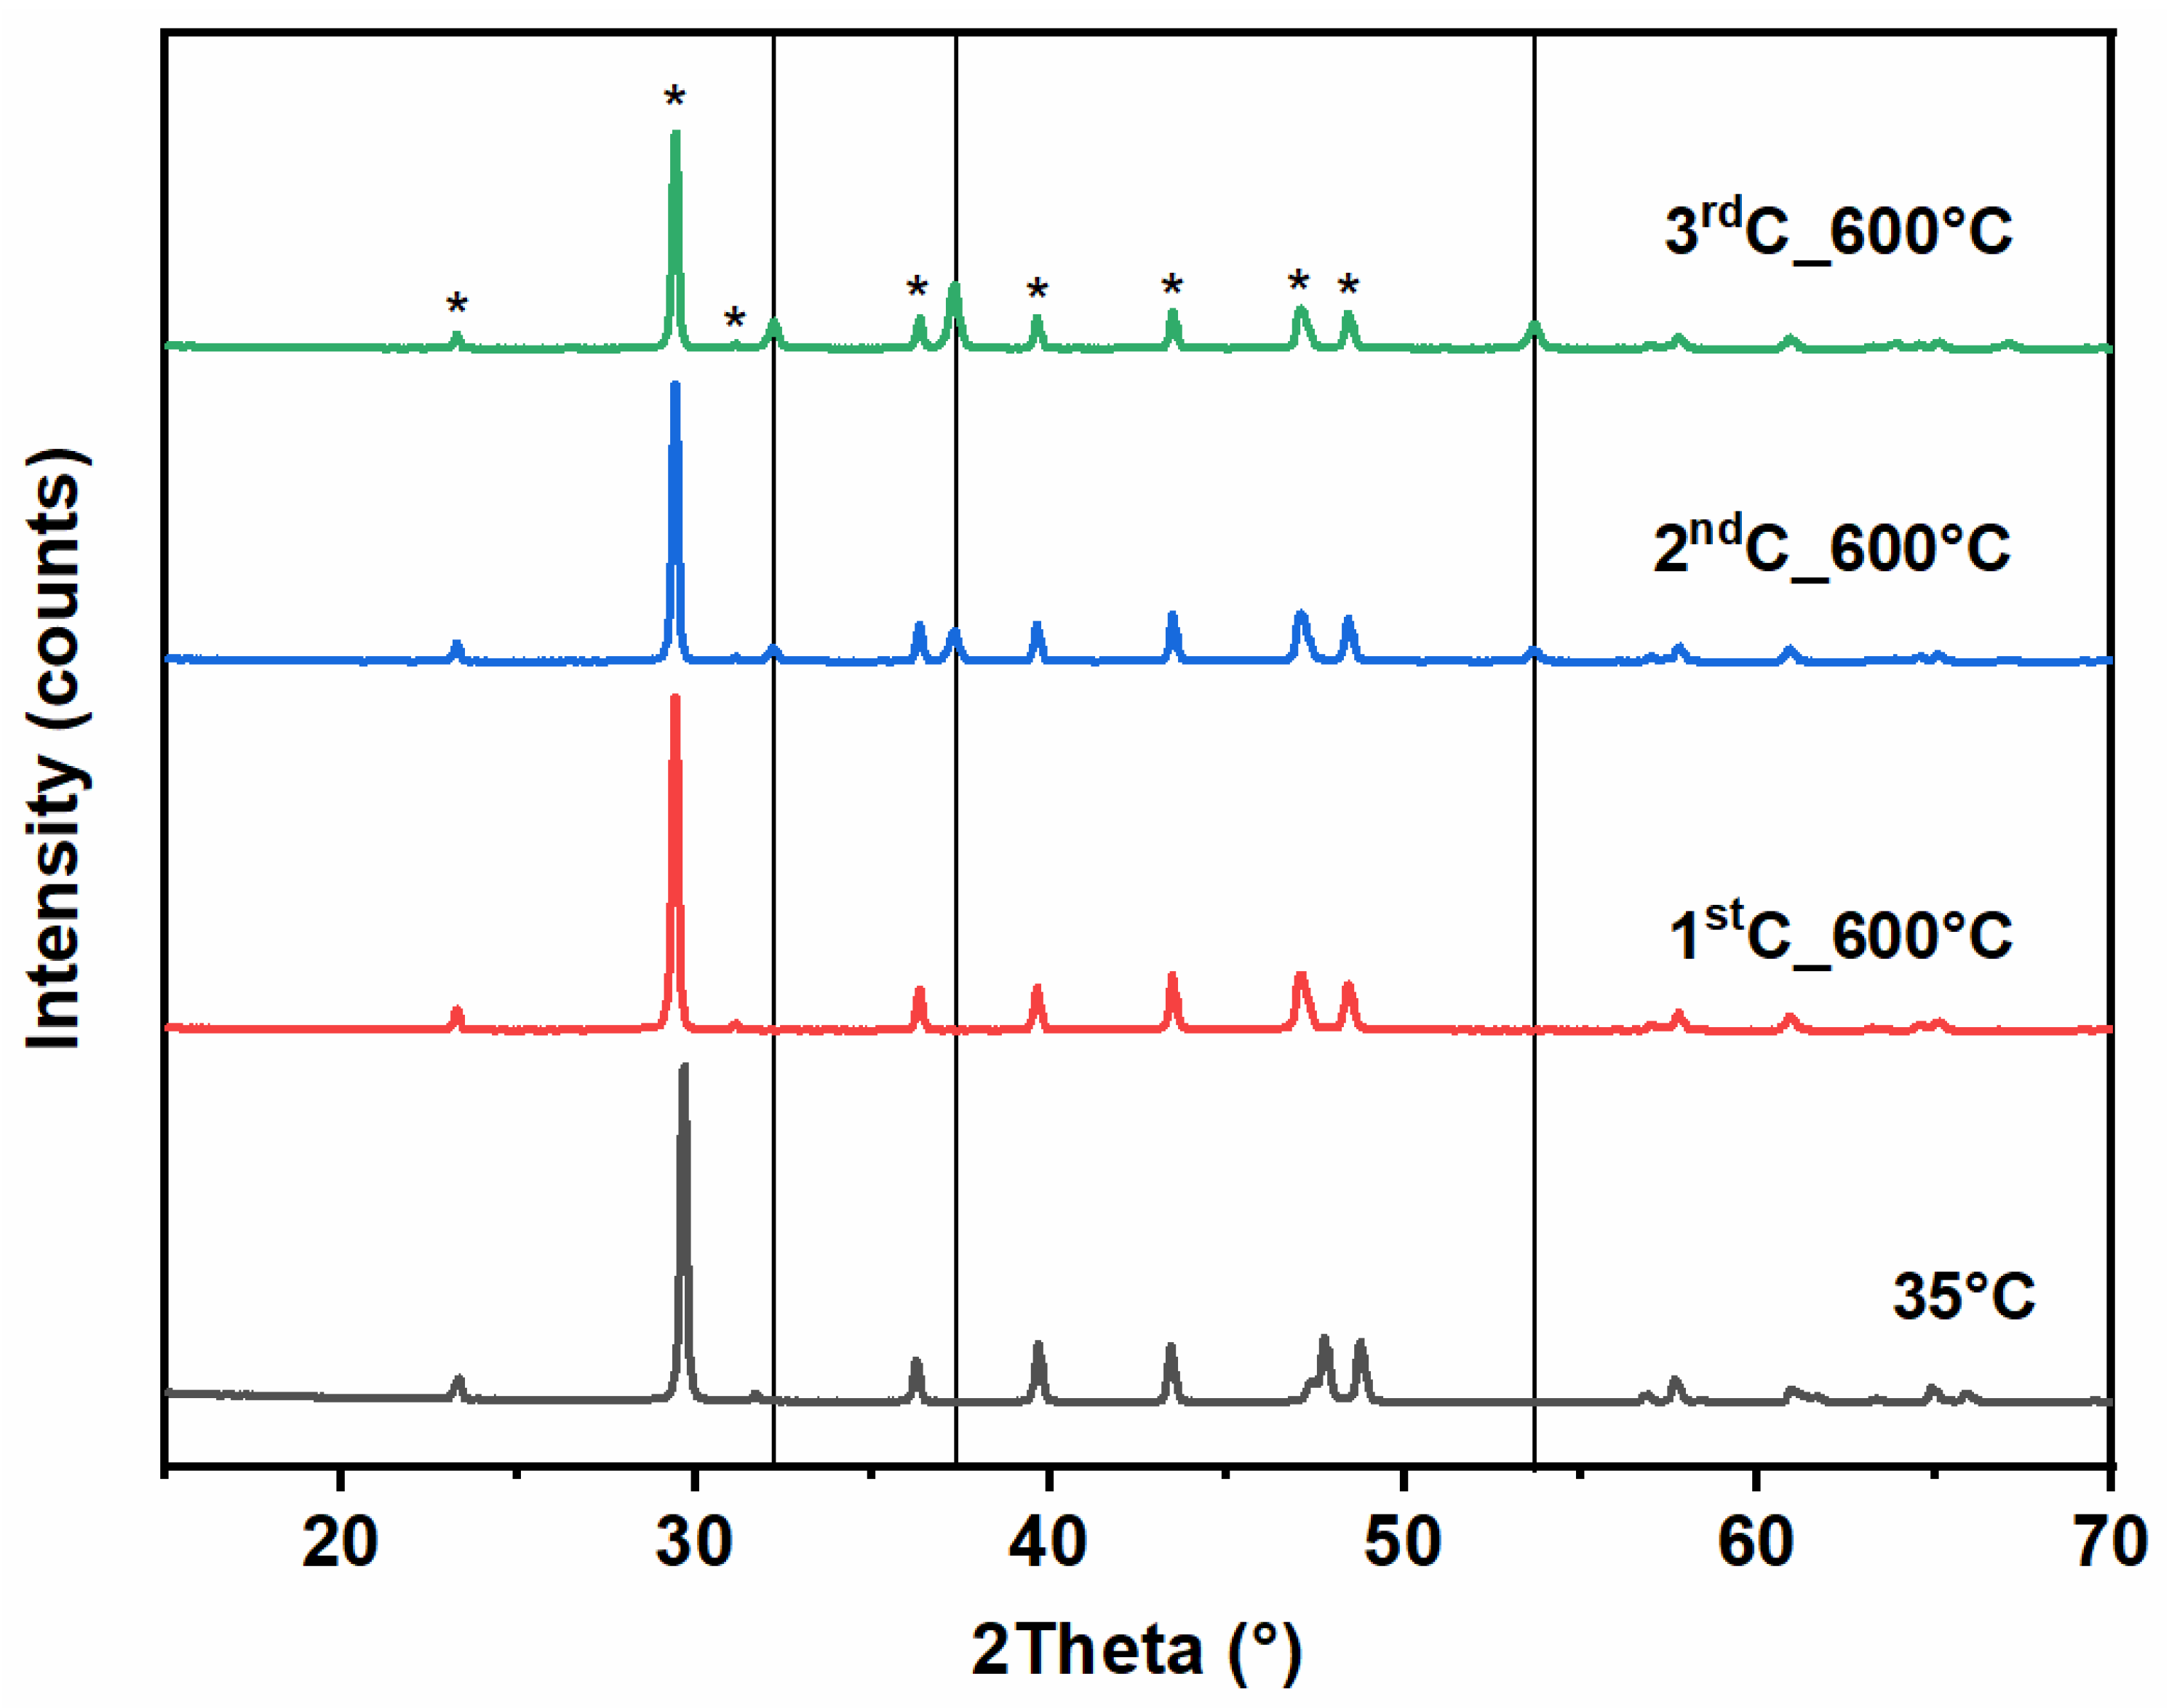
St. Margarethen stone diffractograms at 35 °C and the first patterns (out of six) collected during the isothermal condition at 600 °C per cycle. The most prominent reflexes for calcite are indicated with an asterisk, while the position of lime reflexes is shown along the line.
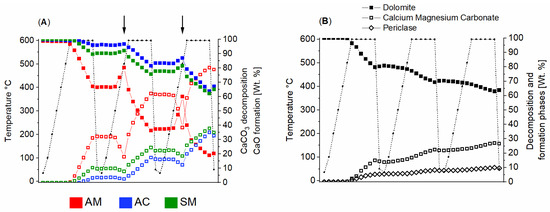
Figure 5.
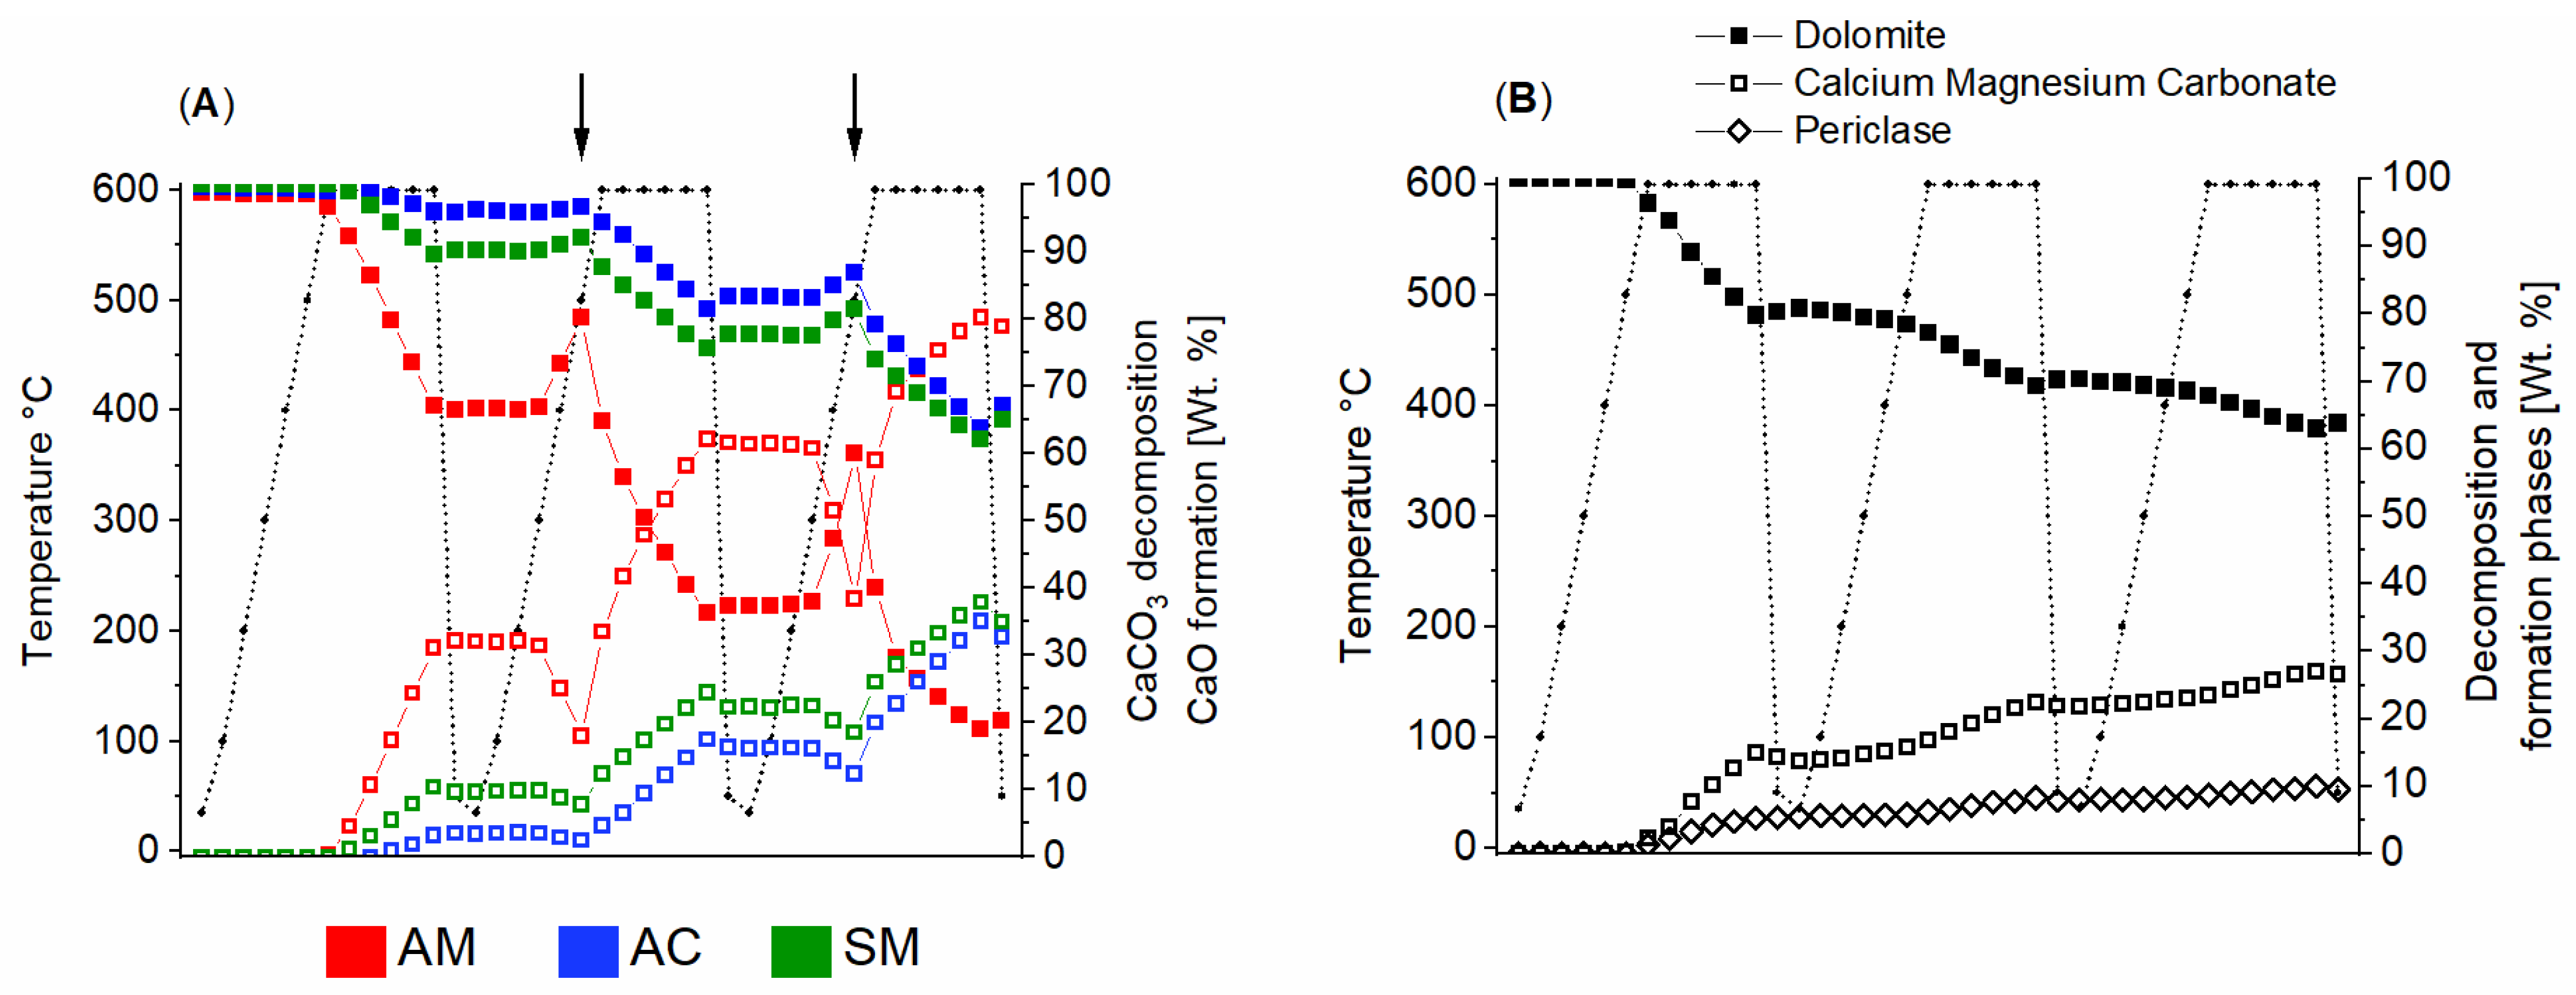
(A) Quantitative analysis by means of Rietveld refinement on Apuan Marble (AM), Ajarte Calcite (AC), and St. Margarethen (SM) (arrows point to the retrograde reaction during heating between approx. 400 °C and 500 °C) and (B) Ajarte Dolostone. The heating ramps provide an easier reading of the weight loss per cycle employed.
The most intriguing transformation that could be observed was a retrograde reaction during calcite decomposition. This phenomenon was observed on all studied calcium carbonates but was most pronounced on surfaces of AM (Figure 5A). The activation energy for the retrograde reaction was provided by temperatures ranging from 400 °C to 500 °C during the second and third cycle of heating. The formation of calcium carbonate was detected without the intermediate calcium hydroxide phase. Such a phenomenon had already been observed in another study [62]. Comparing the phase evolution with temperature for all calcium carbonate samples, it was evident that the onset of thermal decomposition started earlier for the variety AM, followed closely by SM and AC. This was likely associated with the surface samples’ topography, as lithotypes with grain-to-grain contact were capable to transfer heat more efficiently compared to sparse grain contacts accompanied by porosity and surfaces roughness. These differences in topography were most likely also responsible for the amount of phase transformation. At this point, it should be noted that there was a distinctive difference between the decomposition of calcite in solid and powdered samples. This issue was most easily displayed in data obtained with in situ XRD and TGA. Namely, when analysed by TGA, AM exhibited the lowest weight loss, which corresponded to degradation processes, while AC had the highest among the calcium carbonate stones. In contrary, in situ XRD displayed an opposite trend, with AM being the most prone to degradation, while AC yielded the best resistance towards heat decomposition. These opposing trends could be explained by the sample conditions, that is, the use of powder versus solid materials. AC and AM were ground for the same period of time, which most probably resulted in different powder sizes and, therefore, reactivity, with AC being the more reactive one when ground.
While Rietveld refinement was easily performed on (predominantly) monomineralic stones like carbonates (see the phase development with temperature displayed in Figure 6), marble veining could not be quantified by Rietveld refinement due to fluctuations in the phases caused by thermal expansion of the substrate. Such a diffractogram of AM having a dolomite vein is shown in Figure S9. The dolomite vein was easily degraded, and periclase was formed. Regarding the silicate variety, the typical alpha or low quartz that was stable until 573 °C and the beta or high quartz that appeared under the isothermal treatment at 600 °C can be seen in Figure 7. To explain this phenomenon, it is important to know that interatomic distances are correlated with unit cell lattice parameters, and employing higher temperatures results in changes in these interatomic distances, which is reflected in change in the peak position. The transition from low-to-high quartz is a sudden phase transition (change in crystal structure due to displacement, but no bonds are broken), accompanied by a linear expansion [63]. This linear expansion, along with the linear expansion of calcite, was responsible for the variations analysed by Rietveld refinement (normally <2 wt.-%). The expansion of the minerals caused changes in the penetration depth of the X-rays, which added to the fluctuation in qualitative analysis. As quartz inversion was reversible, phase decomposition in the XRD pattern could only be seen in dolomite and kaolinite (see Figure S10). SQ exhibited a lowering of both phases—dolostone and kaolinite—but not a complete decomposition, which could also be confirmed by FTIR analysis. While a temperature of 600 °C is high enough to cause an irreversible loss of hydroxyl groups of kaolinite, this process depends strongly on the structural state of the kaolinite (e.g., particle size, packing density, pressure of water, experimental conditions, among others) [24]. For SQ, the complete breakdown of kaolinite was not observed, and as a consequence, it could be assumed that the kaolinite present deeper within the material was also preserved. This could partially be explained by its protection in the confined spaces between the quartz grains. Furthermore, these results showed that a comparison between powdered and solid samples was not reliable regarding the transition temperatures for dehydroxylation processes’ onset. Pre- and post-calcination XRD diffractograms of all the studied lithotypes are included in Supplementary Information, along with the corresponding phase changes after three cycles.
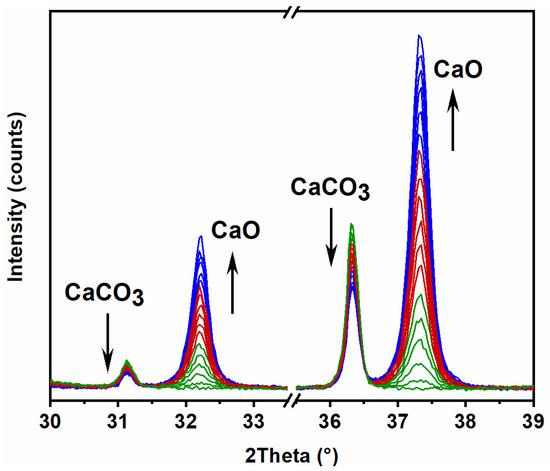
Figure 6.
Overview of St. Margarethen stone diffractograms as analysed by in situ XRD under isothermal conditions at 600 °C (corresponding to six patterns per cycle). The decomposition of calcite and the formation of calcium oxide under cyclic thermal treatments are displayed (green: first isothermal cycle at 600 °C, red: second isothermal cycle at 600 °C; and blue: third isothermal cycle at 600 °C). Each cycle consisted of six consecutive diffractograms.

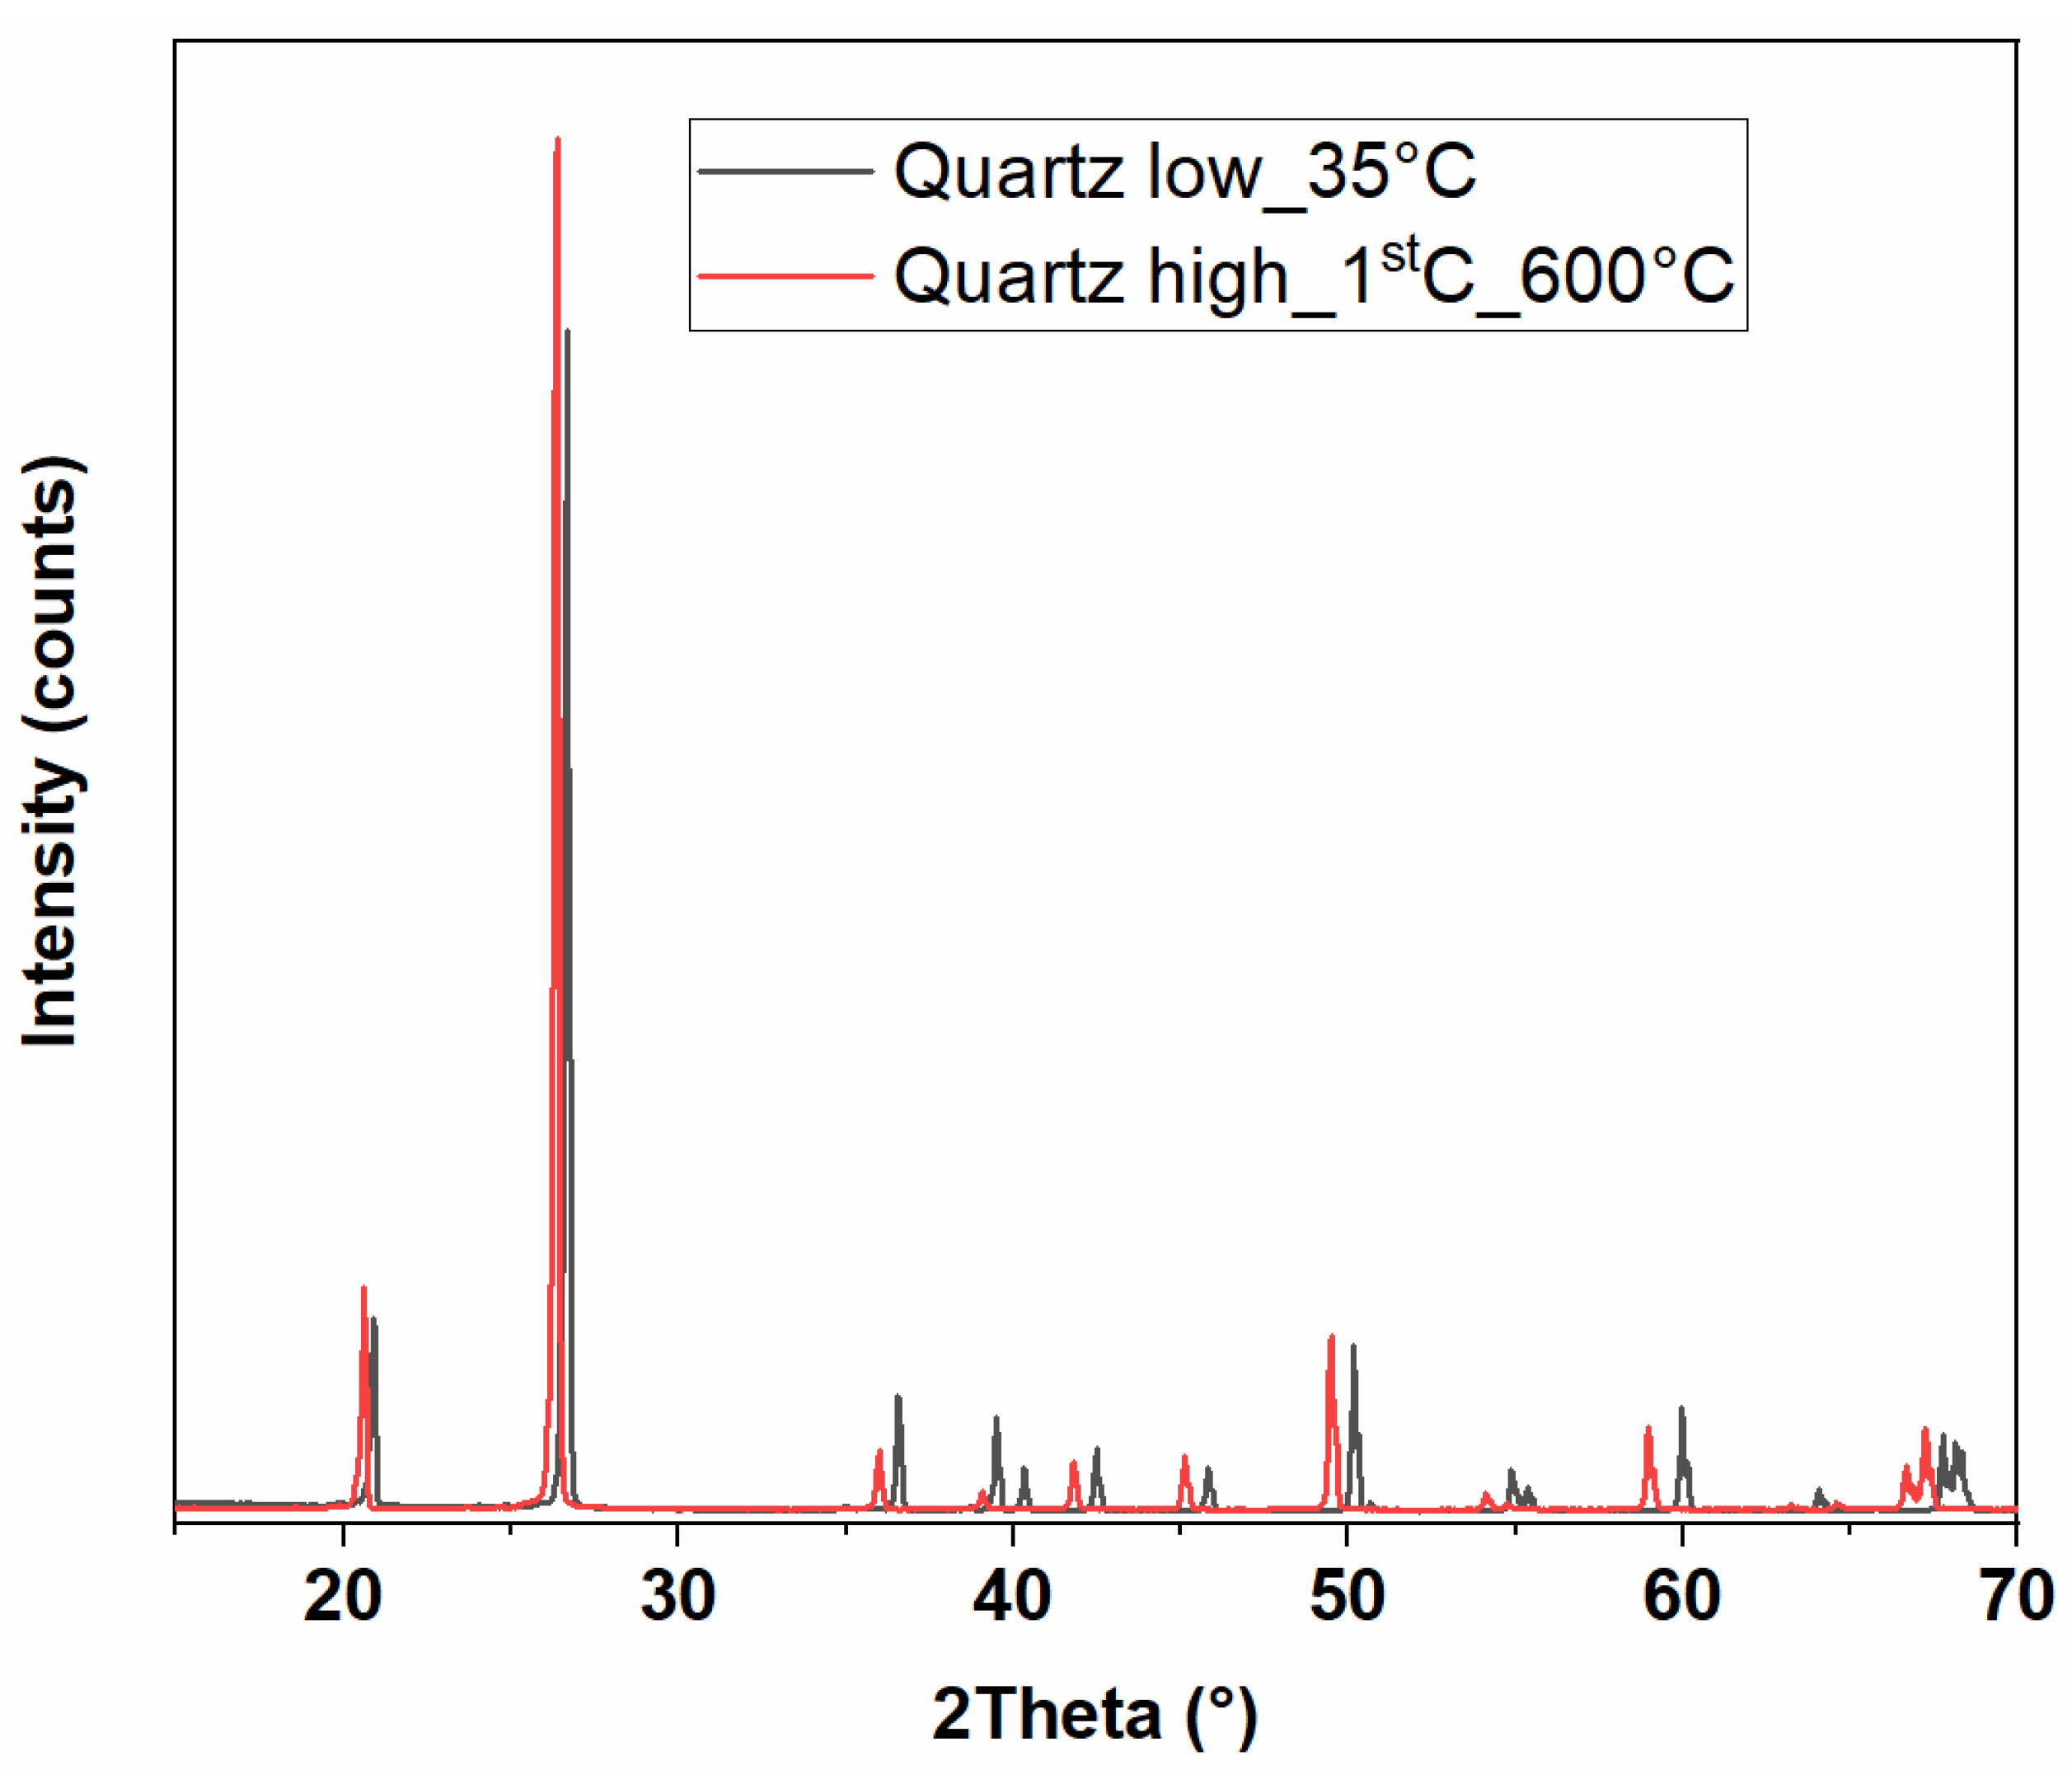
Figure 7.
The structural evolution of quartz inversion during thermal treatment as observed by patterns collected with in situ XRD on Obernkirchen stone. Note that kaolinite was absent on the surface area analysed.
In situ XRD had the advantage of using macroscopic solid samples, which investigated the real-world conditions during heating under atmospheric conditions. The number of patterns collected and the heating ramp used allowed for the collection of phase decomposition and formation but no intermediate phases like brucite or portlandite.
3.2.2. Colour Measurements
Visual alterations in natural stones that have encountered thermal treatments are among the widely studied modifications. Minerals responsible for colour changes include phyllosilicates and iron oxides, such as goethite and calcium hydroxide. Colour changes could be observed on all stones in our study (see Table 4), and they ranged from yellow–reddish over greyish to white.
Table 4.
ΔL*, Δa*, Δb*, and ΔE* values and standard deviations calculated through sample variance on three to five specimens before and after thermal treatment: Apuan Marble (AM), St. Margarethen (SM), Ajarte Dolostone (AD), Ajarte Calcite (AC), Balegem (BL), Schlaitdorf (SQ), and Obernkirchen (OQ).
Yellow, reddish, and greyish discolouration originates from iron-bearing minerals and is among the most prominent types when it comes to visual changes due to thermal treatments. Changes due to iron oxide–oxyhydroxides have been described before in published studies (e.g., [64]). A white veil could be ascribed to the decomposition of calcium carbonate and the formation and subsequent carbonation of calcium hydroxide. Such a phenomenon has also been observed and described in the published literature (e.g., [37]). The white surface present on a discoloured material is often the only indication of a transformation having taken place when sensing with analytical techniques fails due to the high reactivity of the products and their fast carbonation. AM was the only lithotype that turned brighter, while the remaining stone varieties appeared to be darker after the thermal treatment (see the lightness coordinates ΔL*). All stone varieties indicated more redness, with the only exception being SM, which indicted more greenness after the thermal treatment. SM was also the stone variety that underwent the most severe colour change after the thermal treatment, as can be seen by ΔE* and the indication of blueness.
3.2.3. Optical Microscopy
Analyses of textural changes after thermal treatment were performed with the help of OM. The colour, phase, and microstructural changes were the most prominent differences that could be observed by means of OM, and they could be observed throughout the whole sample volume analysed. As colour measurements were carried out only on the surface of the stones, optical microscopy confirmed that the mineralogical changes affected the entire specimen volume. A darkening of the microfossils in, e.g., BL seemed to be present, which could only be seen by OM, as colour measurements averaged the visual alterations on the surface. AM displayed a whitish precipitate on its surface, derived from the subsequent carbonation process of thermally decomposed calcium carbonate. The latter change on the AM was limited to the surface, which could be explained by the diffusion-limited escape of CO2 which resulted from calcium carbonate decomposition. Namely, when CO2 escaped during decomposition, its concentration in the pores was able to act back on the calcite lattice, thus preventing the occurrence of phase transformations [65].
Regarding changes in the clayey matrix, interpretations of OM micrographs were limited, because the clayey structure could be inhomogeneous due to a complex diagenetic history. Most often, a darkening of the clayey matrix could be seen in thin sections under plane-polarised light, an effect which could only be confirmed by employing the 900 °C heating conditions. To confirm the chemo-mineralogical transformations caused by the thermal treatment at 600 °C, the stones were additionally heated at 900 °C to ensure the presence of severe changes and allow us to recognise alterations caused by lower temperatures. With the comparison of these two temperatures, it was visible that the higher the temperature, the more striking the damage in the natural stones, especially colour change and microcrack inducement, independent of the stones’ genesis and mineralogy.
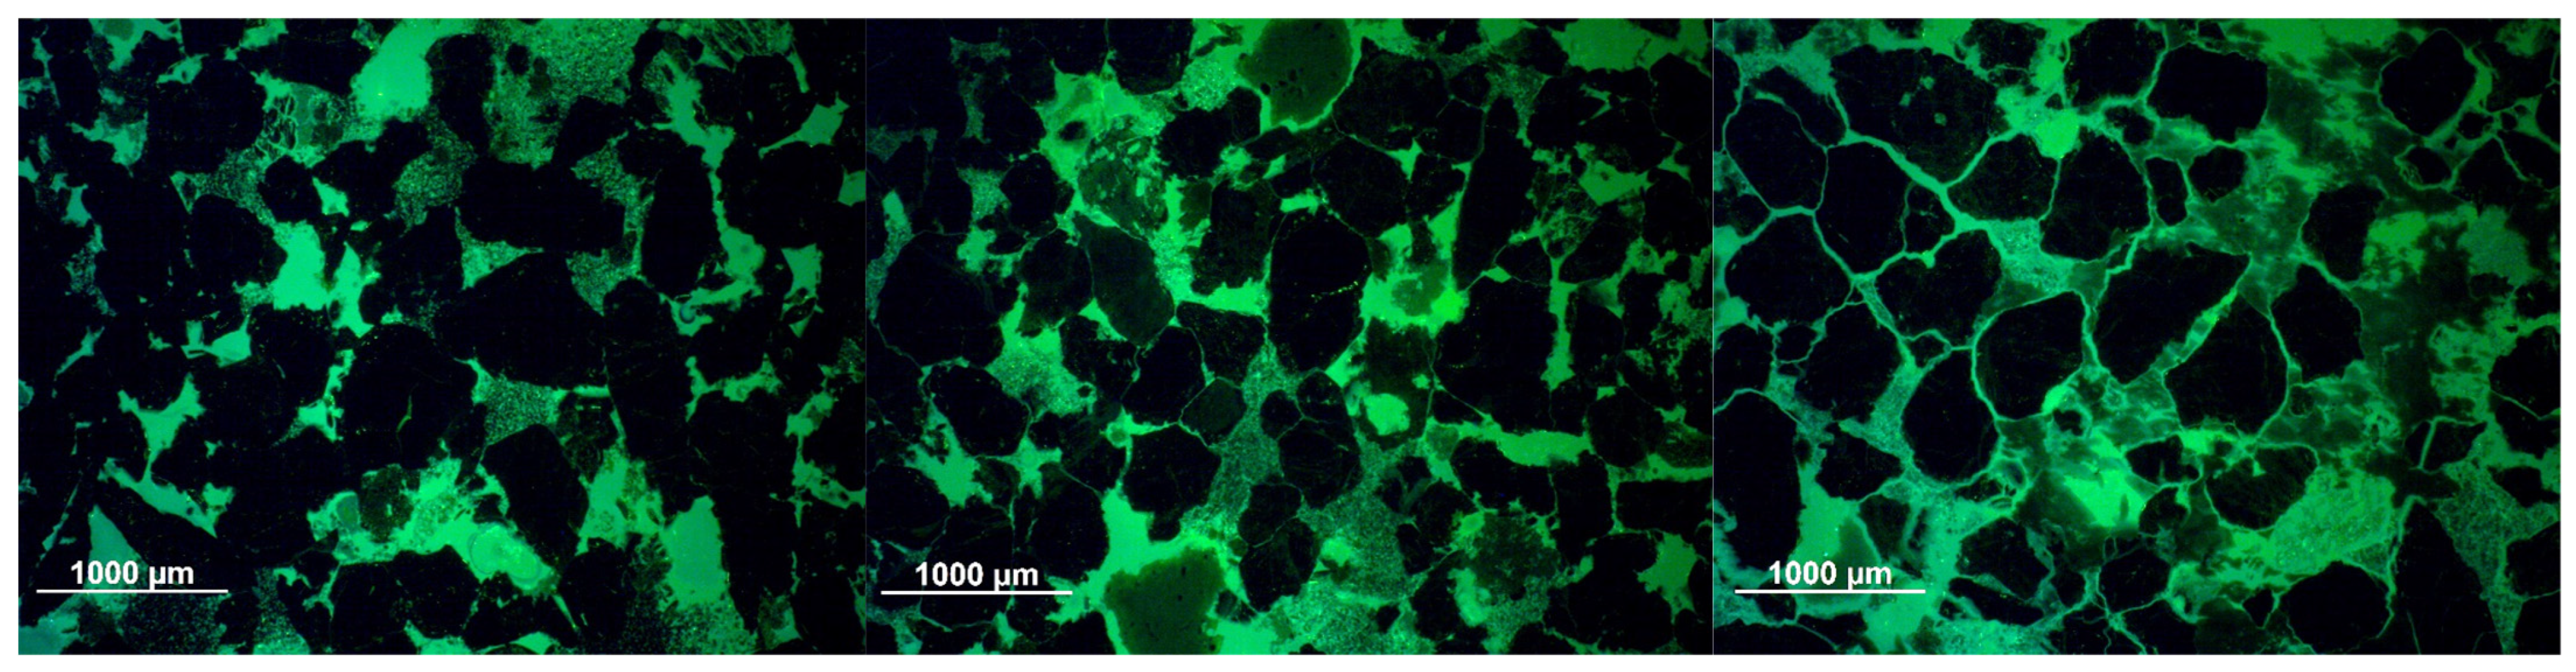
Microcracks were visible and most noticeable within the dense stone variety of AM but also within the silicate substrates of SQ and OQ (see Figure 8). Using UV light on thin sections imbedded in a fluorescent resin, the extent of microcrack inducement was easily noticeable (see Figure A1 and Figure A2). The higher the temperature employed, the more severe the inducement of inter- and intragranular cracks. The inducement of microcracks was less pronounced on the porous carbonates SM, AC, and AD, as well as on BL (see Figures in the Supplementary Information). This might have been related to the stones’ structure. Namely, coarse-grained porous stones can accommodate more of the stresses formed by the expansion of minerals. Meanwhile, denser stones that are grain-supported are more susceptible to crack development as there is no space for expansion. Moreover, the induced microcracks in quartz come with a sudden change in volume, due to quartz inversion. Furthermore, fine-grained porous stones are prone to crack development throughout the specimen (most often observable within OQ in our study). The latter is the case when differential expansion surpasses the strength of the stone, leading to the formation of large cracks and the breakdown of the specimen. Nonetheless, induced microcracks cause a reduction in mechanical strength and an increase in water absorption, leading to changes in mechanical and petrophysical properties [66].
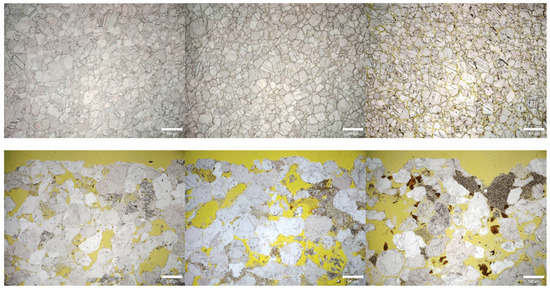
Figure 8.
(Upper panel, on the left): Crystalline structure of fresh and dense Apuan Marble as seen in the thin section. (Middle): Apuan Marble after the cyclic isothermal treatment at 600 °C. The grain boundaries are enhanced in their appearance, indicating the formation of inter- and intragranular microcracks. (Right): Apuan Marble after thermal treatment at 900 °C. The higher temperature causes greater damage, that is, the formation of new microcracks and the widening of existing microcracks. Note that the yellow resin is more prominent. (Lower panel, on the left): Freshly quarried Schlaitdorf sandstone, as seen in the thin section. (Middle): Schlaitdorf after the cyclic isothermal treatment at 600 °C. Colour changes on kaolinite and dolomite can be seen (brownish areas). (Right): Schlaitdorf after thermal treatment at 900 °C. A more severe discoloration of the kaolinite and dolomite can be seen, as well as dolomite degradation. The most prominent is the formation of larger cavities and pores caused by the rearrangement of the single grains due to heat stresses. The scale bars for all micrographs are 500 µm in size. All images were taken under plane-polarised light (PPL).
At temperatures of 900 °C, microstructurally driven decompositions that depended on the studied stone were observed. At such high temperatures, the changes in the material were caused by three key characteristics, namely (1) the thermal expansion and retraction of single aggregates, (2) the differential stresses in the whole specimen under study, and (3) the volumetric changes caused by the chemo-mineralogical transformation during the decomposition and subsequent carbonation processes. However, even though the stones were exposed to 900 °C, sound fragments in terms of mineralogy and physical appearance were still present. Prominent changes were visible on SQ and OQ, with a pore radius change, where larger cavities and pores were created due to the expansion and contraction stresses and the rearrangement of the single grains (see Figure 8). Microstructure rearrangement was also visible in the sedimentary carbonate stones but in the form of a blending effect of the microcrystalline calcite cement, along with abundant crack formation through the microfossils (see Figure 9). The most intriguing alterations were observed on the microfossils of SM. A thermally induced pitting decomposition could be seen, presenting itself as sharp round islands (Figure 10). These phenomena did not follow the typical degradation profile, being most severe on the surface, with a continuous reduction towards the inner bulk. Instead, the preferential pitting decomposition raised along the formed cracks and microfossil structural features. As for AD, specifically in the microcrystalline calcite cement, pitting degradation was visible in the form of blurry patches. These phenomena appeared almost black under cross-polarised light (see Figure 10), due to very small, needle-like hydroxides (in the case of the carbonate Ca(OH)2), which, in turn, exhibited, due to their grain sizes, a very low birefringence and, thus, an almost-isotropic optical character. Additional micrographs of the studied conditions, including those for the herein less described stone varieties of AD, AC, and OQ, can be viewed under Supplementary Information.

Figure 9.
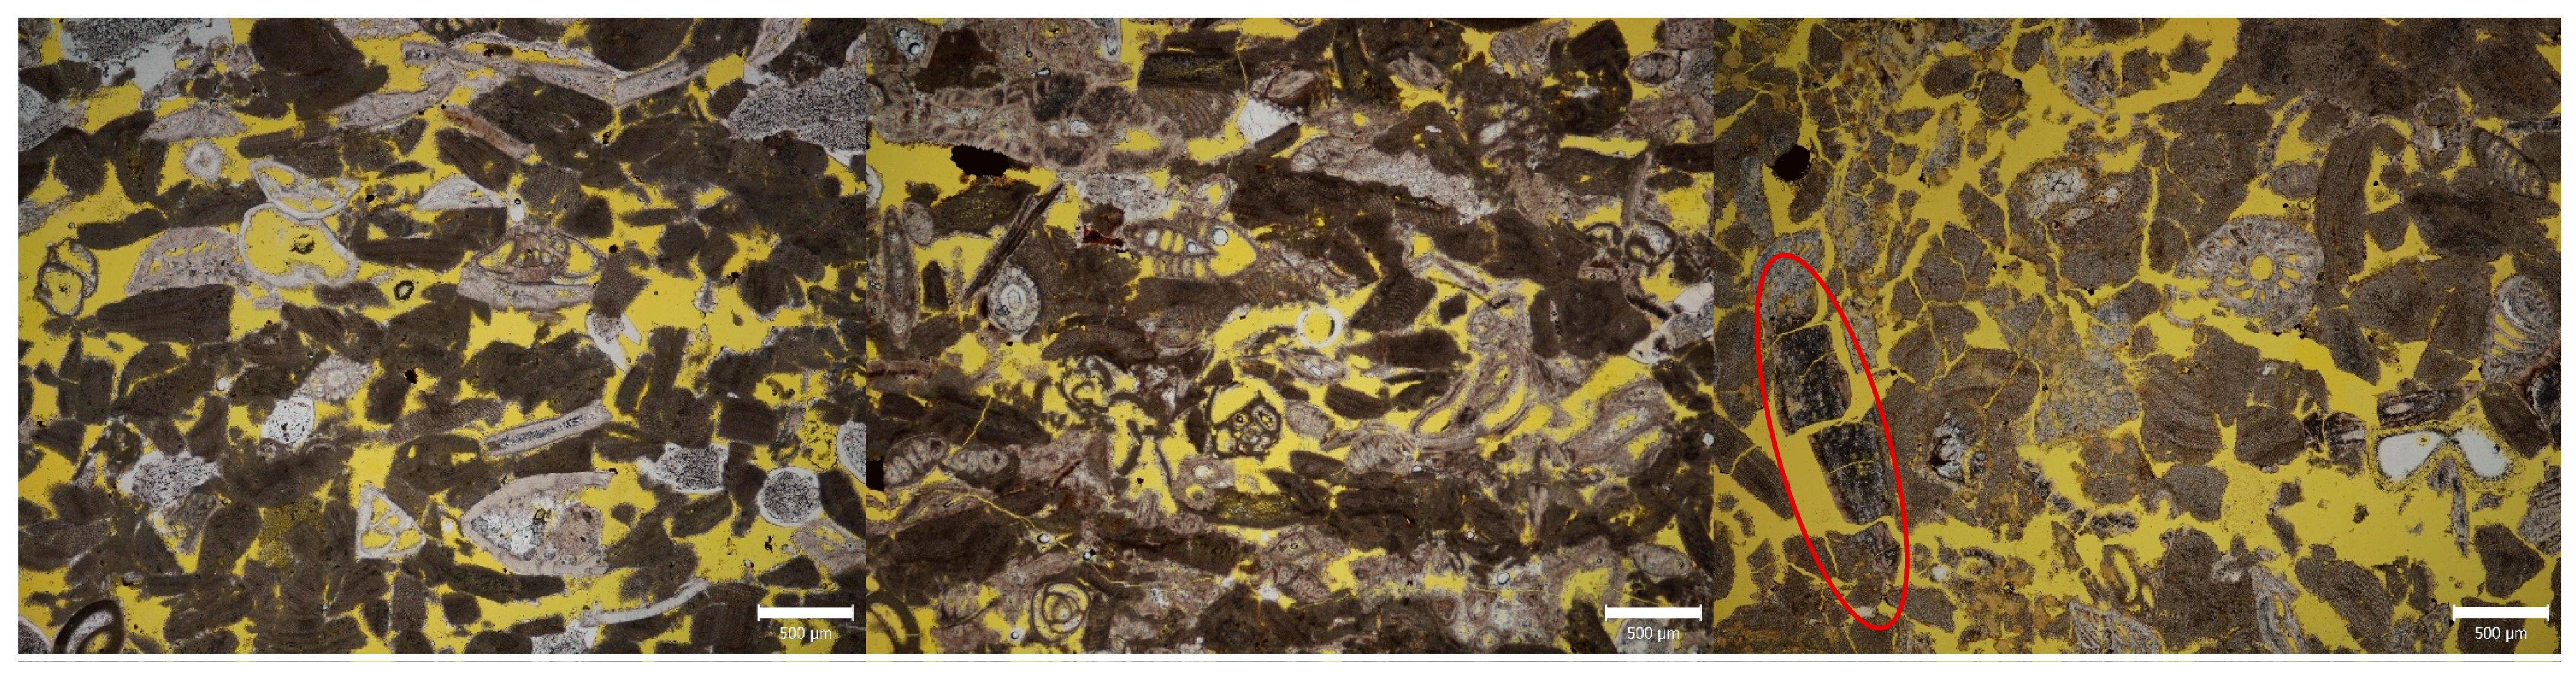
(Left): Micrograph of the fresh St. Margarethen. (Middle): St. Margarethen after the cyclic isothermal treatment at 600 °C. The microstructure seems denser. The brown components (i.e., microcrystalline calcium carbonate) exhibit more intragranular cracks and can be classified as more prone to thermal stresses, while a darkening of the white (i.e., coarse-grained carbonate) components is observable. (Right): St. Margarethen after thermal treatment at 900 °C. The susceptibility of the brown components can be confirmed since more cracks are observable in these fragments. Single fragments are not only displaying intragranular cracks but are also shifted or displaced (marked in red). The scale bars are 500 µm in size. The images were taken under PPL.
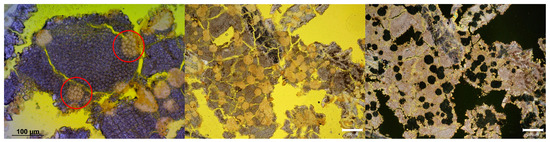
Figure 10.
(Left): St. Margarethen after thermal treatment at 900 °C. The microstructure of the fossil fragments is preserved even after thermal decomposition, as shown by the red-marked areas. The scale bar is 100 µm in size. The image was taken under PPL. (Middle): St. Margarethen after thermal treatment at 900 °C. A thermally induced pitting decomposition in the form of round spots (typical only for this lithotype) can be observed. This decomposition seems to be a crack-driven process. The scale bar is 200 µm in size. The image was taken under PPL. (Right): Under cross-polarised light, the decomposed material appears (almost) black, caused by the very fine, needle-like crystals of calcium hydroxide. The scale bar is 200 µm in size. The image was taken under XPL.
4. Conclusions
The present study analysed chemo-mineralogical changes occurring at transition temperatures of 600 °C on six European monumental stones. TGA confirmed that mass loss was more pronounced when cyclic treatment was employed compared to non-periodic thermal conditions when considering the same residence time to heat exposure. FTIR was sensitive in detecting kaolinite and dolomite, confirming the retention of these minerals inside the stone fabric even though their dehydroxylation and decomposition temperature was exceeded. As assessed by microscopy, apart from the formed microcracks (petrophysical changes) and colour alterations (chemo-mineralogical alterations), no evident changes could be observed within the stone specimens when exposed to cyclic isothermal treatment at 600 °C. Only higher temperatures (i.e., 900 °C) allowed us to observe decomposition phenomena in the texture by means of thin-section analysis. In carbonates, microcrack inducement was more severe in dense metamorphic lithotypes compared to sedimentary varieties. Grain-supported silicates generated larger cracks, causing a macroscopic failure of the samples. In situ XRD analysis revealed that temperatures of 600 °C caused phase transformations on calcite, while the threshold for dolomite decomposition was found to be 500 °C. For the same minerals, phase transformation was not initiated at the same temperature. An earlier onset was favoured by denser substrates exhibiting more grain-to-grain contacts. Kaolinite was preserved even though its phase transient temperatures were exceeded, which could be explained by its occurrence in the confined stone matrix, making it more protected from transformations. The use of powder and solid stone substrates could not be correlated. While STA, TGA, and FTIR gave a needed overview of possible changes under certain conditions, in situ XRD had the advantage of using macroscopic solid samples, which investigated the real-world conditions during the heating of monumental stone under atmospheric conditions. Thin-section microscopy is a powerful tool to describe heat-related alterations ranging from the surface to the inner bulk of a material, especially when employing higher temperatures. The calcination protocol and analytical approach allowed us to collect a precise record of phase decomposition and formation, as well as microstructural alterations. The verified irreversible chemo-mineralogical and microstructural changes should be linked to the loss of mechanical strength and other physical alterations (e.g., water-related properties). Understanding these interactions would allow us to study how and if mechanical strength could be regained and whether restoration of physical properties is possible. Besides structural integrity management, this would also lay the foundation for effective preservation and maintenance strategies.
Supplementary Materials
The following supporting information can be downloaded at https://www.mdpi.com/article/10.3390/heritage8030107/s1: Figure S1: XRD of Ajarte Calcite and Ajarte Dolostone. Figure S2: Simultaneous thermal analysis of Apuan Marble. Figure S3: Simultaneous thermal analysis of St. Margarethen. Figure S4: Simultaneous thermal analysis of Ajarte Calcite. Figure S5: XRD diffractogram of goethite in Balegem. Figure S6: Simultaneous thermal analysis of Schlaitdorf and KGa-2 kaolinite. Figure S7a: Fourier-transform infrared spectroscopy of Schlaitdorf after cycling isothermal treatment at 600 °C. Figure S7b: Fourier-transform infrared spectra of Schlaitdorf after 10h of isothermal treatment at 600 °C. Figure S8: XRD diffractogram of Ajarte Dolostone before and after cyclic isothermal treatment at 600 °C and in situ XRD after the third cycle of isothermal treatment at 600 °C. Figure S9: XRD diffractogram of the dolomite vein on Apuan Marble after cyclic isothermal treatment at 600 °C. Figure S10: XRD diffractograms of Schlaitdorf before and after isothermal treatment at 600 °C. Microscopy documentation. Figures S11–S17: Pre- and post-calcination (in situ) XRD diffractograms of all the studied lithotypes, along with the corresponding phase changes after three cycles.
Author Contributions
Conceptualization, M.U.; methodology, M.U.; formal analysis, M.U. and F.O.; investigation, M.U.; resources, W.A. and F.O.; data curation, M.U., K.W. and F.P.; writing—original draft preparation, M.U.; writing—review and editing, K.W., W.A., F.P. and F.O.; and visualisation, M.U. All authors have read and agreed to the published version of the manuscript.
Funding
This research received no external funding.
Data Availability Statement
The datasets used and/or analysed during the current study are available from the corresponding author upon reasonable request. The data are not publicly available as they form part of an ongoing study. Additional electronic Supplementary Materials accompany this paper.
Acknowledgments
We gratefully acknowledge Klaudia Hradil from the X-ray centre of Vienna’s University of Technology for the unrestricted access to in situ XRD instruments. The authors further thank the Opera della Primaziale Pisana team from Pisa, Italy, the Fundacio Catedral Santa Maria in Vitoria-Gasteiz, Spain, Architectenbureau Bressers from Ghent, Belgium, Dombausekretariat St. Stephan from Vienna, Austria, and Metropolitankapitel der Hohen Domkirche Köln, Dombauverwaltung, in Köln, Germany, for supplying the freshly quarried monumental stone. Alberto Viani from the Institute of Theoretical and Applied Mechanics of the Czech Academy of Sciences is gratefully acknowledged for hosting the OM analyses. Giancarlo Sidoti is gratefully acknowledged for hosting M.U. at the Istituto centrale per il restauro in Rome. Two paragraphs from the introduction, the in situ XRD description, and four images of the stones from the Materials and Methods Section have been extracted from the first author’s publicly defended Ph.D. [67].
Conflicts of Interest
The authors declare no conflicts of interest and no competing financial interests. The funders had no role in the design of the study; in the collection, analyses, or interpretation of data; in the writing of the manuscript; or in the decision to publish the results.
Appendix A
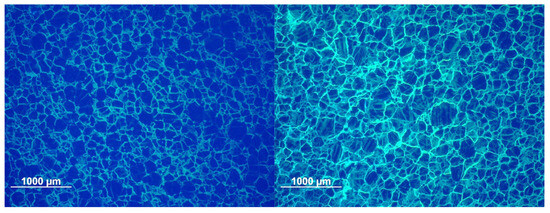
Figure A1.
(Left): Apuan Marble after the cyclic isothermal treatment at 600 °C, as observed in a thin section under UV light. Note that there is no sound (i.e., pristine) stone to see here, as it would appear uniformly dark, while the stone treated at 600 °C shows visible cracks (visible through the formation of cracks and the subsequent penetration of the fluorescent resin). The cracks are of both inter- and intragranular nature. (Right): Apuan Marble thermally treated at 900 °C, as observed in a thin section under UV light. Overview of the crack network development when the specimen is treated at 900 °C. The picture was taken from the inner part of the specimen. The width of the cracks is increased by a noticeable magnitude. Moreover, the width of the cracks does not seem as uniform as in the case of the sample threated at 600 °C. In addition, it becomes evident that the cracks are both of inter- and intragranular nature.
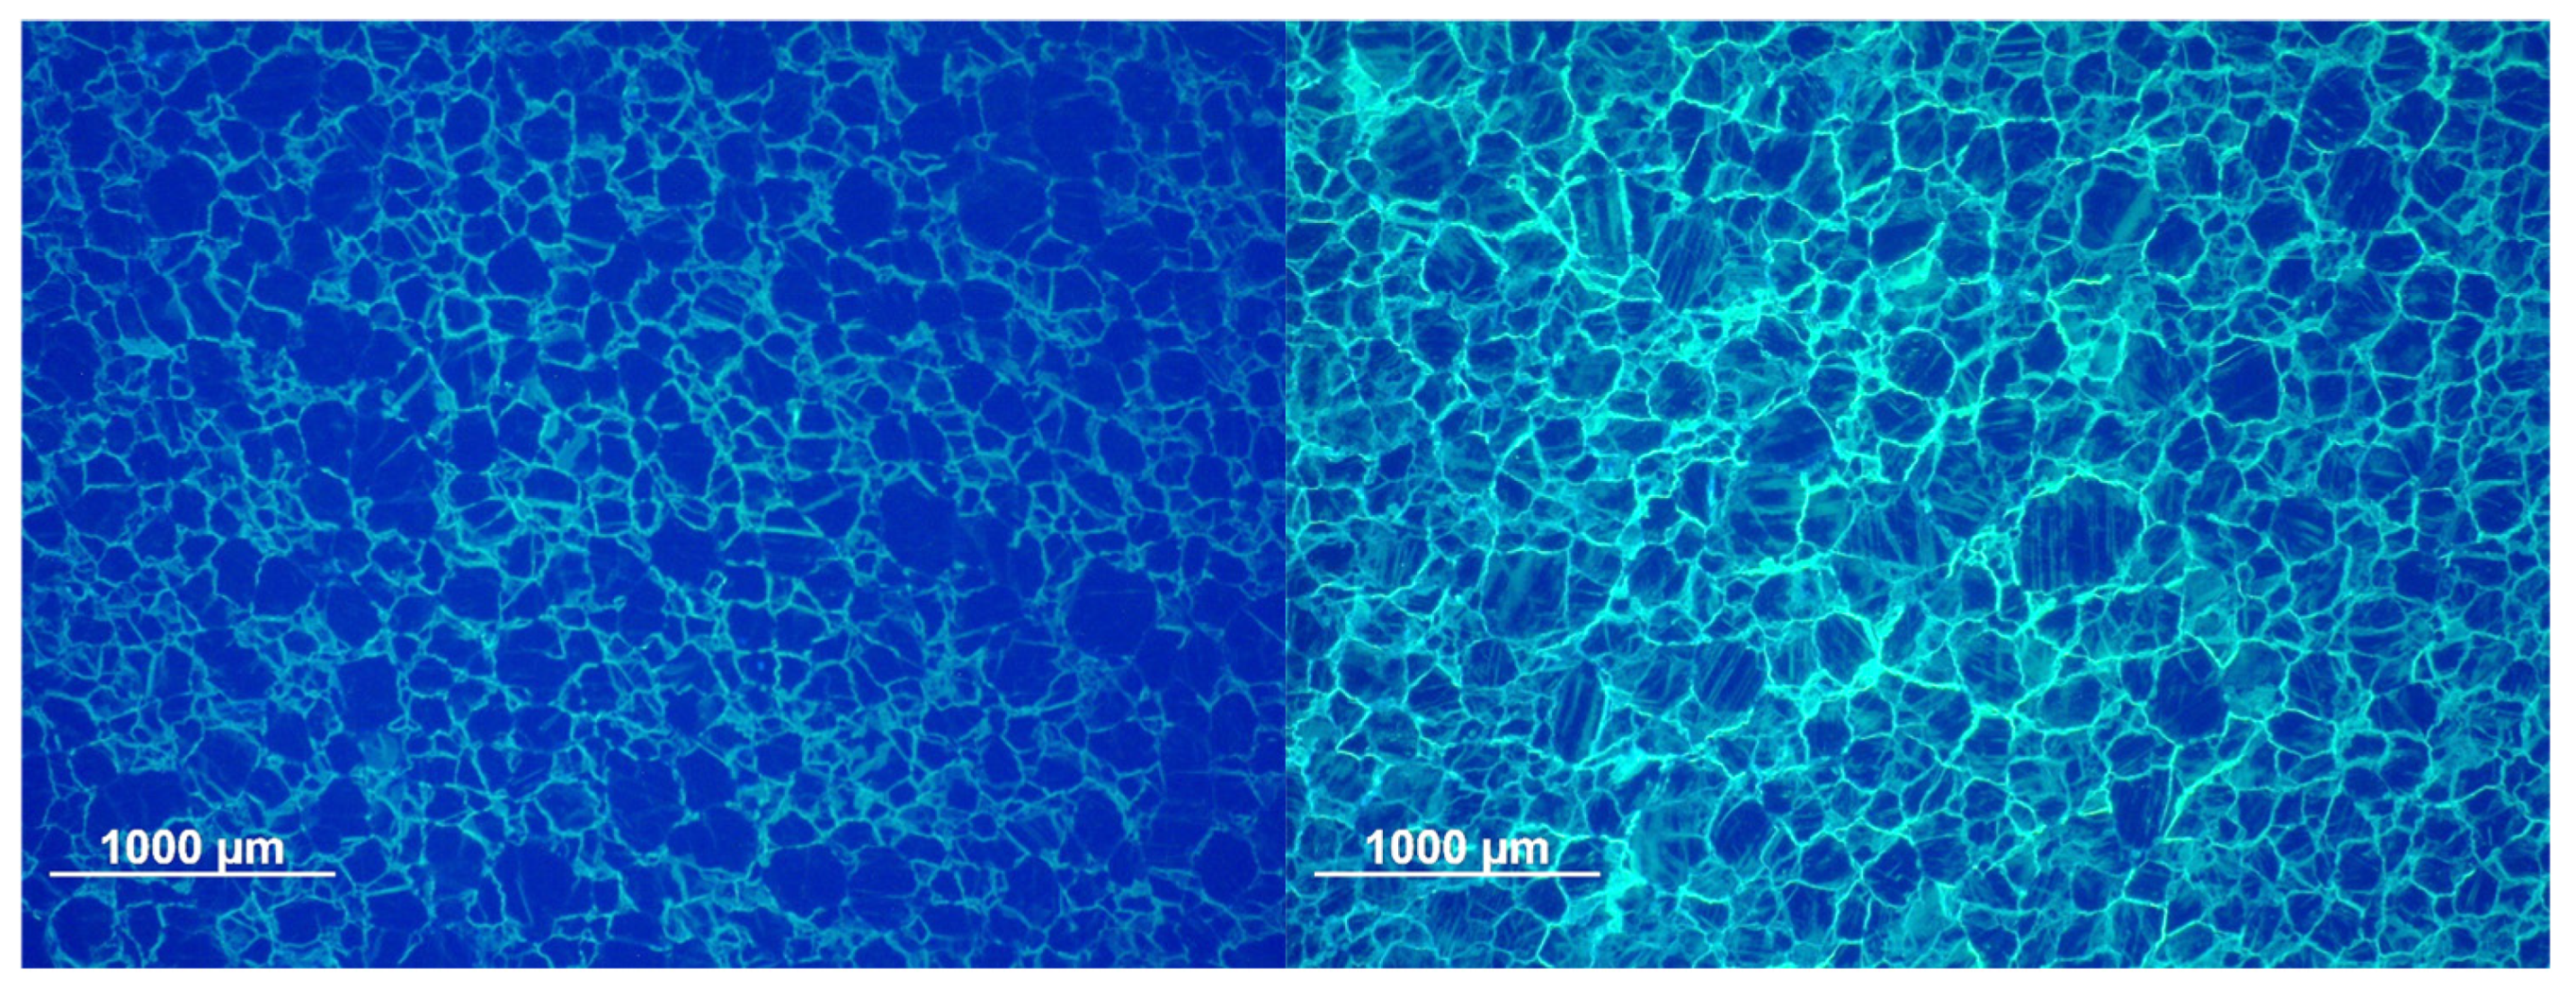
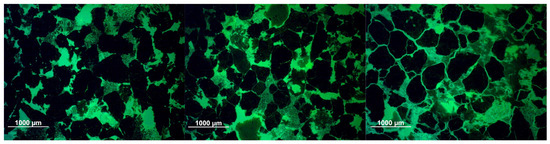
Figure A2.
(Left): Overview of the sound (i.e., pristine) Schlaitdorf specimen, as seen in a thin section under UV light. (Middle): Schlaitdorf after the cyclic isothermal treatment at 600 °C as observed in a thin section under UV light. The initial microcracks formed are mainly intergranular cracks. (Right): Schlaitdorf thermally treated at 900 °C, as observed in a thin section under UV light. Few intragranular cracks can be observed, but most of the newly formed cracks are of intergranular nature. The kaolinite and dolomite change their appearance by becoming more transparent and distorted.
References
- Gomez-Heras, M.; McCabe, S.; Smith, B.J.; Fort, R. Impacts of Fire on Stone-Built Heritage. J. Archit. Conserv. 2009, 15, 47–58. [Google Scholar] [CrossRef]
- Garlock, M.; Paya-Zaforteza, I.; Kodur, V.; Gu, L. Fire hazard in bridges: Review, assessment and repair strategies. Eng. Struct. 2012, 35, 89–98. [Google Scholar] [CrossRef]
- Vazzoler, J.d.S.; Vieira, G.L.; Teles, C.R.; Degen, M.K.; Teixeira, R.A. Investigation of the potential use of waste from ornamental stone processing after heat treatment for the production of cement-based paste. Constr. Build. Mater. 2018, 177, 314–321. [Google Scholar] [CrossRef]
- Tang, C.-S.; Cui, Y.-J.; Tang, A.-M.; Shi, B. Experiment evidence on the temperature dependence of desiccation cracking behavior of clayey soils. Eng. Geol. 2010, 114, 261–266. [Google Scholar] [CrossRef]
- Maritan, L.; Nodari, L.; Mazzoli, C.; Milano, A.; Russo, U. Influence of firing conditions on ceramic products: Experimental study on clay rich in organic matter. Appl. Clay Sci. 2006, 31, 1–15. [Google Scholar] [CrossRef]
- Cerantola, V.; Bykova, E.; Kupenko, I.; Merlini, M.; Ismailova, L.; McCammon, C.; Bykov, M.; Chumakov, A.I.; Petitgirard, S.; Kantor, I.; et al. Stability of iron-bearing carbonates in the deep Earth’s interior. Nat. Commun. 2017, 8, 15960. [Google Scholar] [CrossRef]
- Sanjurjo-Sánchez, J.; Gomez-Heras, M.; Fort, R.; Alvarez de Buergo, M.; Izquierdo Benito, R.; Bru, M.A. Dating fires and estimating the temperature attained on stone surfaces. The case of Ciudad de Vascos (Spain). Microchem. J. 2016, 127, 247–255. [Google Scholar] [CrossRef]
- Gatta, T.; Gregori, E.; Marini, F.; Tomassetti, M.; Visco, G.; Campanella, L. New approach to the differentiation of marble samples using thermal analysis and chemometrics in order to identify provenance. Chem. Cent. J. 2014, 8, 35. [Google Scholar] [CrossRef]
- Zhao, C.; Zhang, Y.; Wang, C.-C.; Hou, M.; Li, A. Recent progress in instrumental techniques for architectural heritage materials. Herit. Sci. 2019, 7, 1–50. [Google Scholar] [CrossRef]
- Tretiach, M.; Bertuzzi, S.; Candotto Carniel, F. Heat shock treatments: A new safe approach against lichen growth on outdoor stone surfaces. Env. Sci. Technol. 2012, 46, 6851–6859. [Google Scholar] [CrossRef]
- Franzoni, E.; Sassoni, E.; Scherer, G.W.; Naidu, S. Artificial weathering of stone by heating. J. Cult. Herit. 2013, 14, E85–E93. [Google Scholar] [CrossRef]
- Ban, M.; De Kock, T.; Ott, F.; Barone, G.; Rohatsch, A.; Raneri, S. Neutron Radiography Study of Laboratory Ageing and Treatment Applications with Stone Consolidants. Nanomaterials 2019, 9, 635. [Google Scholar] [CrossRef]
- Martinho, E.; Mendes, M.; Dionisio, A. 3D imaging of P-waves velocity as a tool for evaluation of heat induced limestone decay. Constr. Build. Mater. 2017, 135, 119–128. [Google Scholar] [CrossRef]
- Ozguven, A.; Ozcelik, Y. Effects of high temperature on physico-mechanical properties of Turkish natural building stones. Eng. Geol. 2014, 183, 127–136. [Google Scholar] [CrossRef]
- Tian, H.; Kempka, T.; Xu, N.-X.; Ziegler, M. Physical Properties of Sandstones After High Temperature Treatment. Rock. Mech. Rock. Eng. 2012, 45, 1113–1117. [Google Scholar] [CrossRef]
- Wang, F.; Frühwirt, T.; Konietzky, H. Influence of repeated heating on physical-mechanical properties and damage evolution of granite. Int. J. Rock. Mech. Min. 2020, 136, 104514. [Google Scholar] [CrossRef]
- Vagnon, F.; Colombero, C.; Colombo, F.; Comina, C.; Ferrero, A.M.; Mandrone, G.; Vinciguerra, S.C. Effects of thermal treatment on physical and mechanical properties of Valdieri Marble–NW Italy. Int. J. Rock. Mech. Min. 2019, 116, 75–86. [Google Scholar] [CrossRef]
- McCabe, S.; Smith, B.J.; Warke, P.A. Exploitation of inherited weakness in fire-damaged building sandstone: The ‘fatiguing’ of ‘shocked’ stone. Eng. Geol. 2010, 115, 217–225. [Google Scholar] [CrossRef]
- Delegou, E.T.; Apostolopoulou, M.; Ntoutsi, I.; Thoma, M.; Keramidas, V.; Papatrechas, C.; Economou, G.; Moropoulou, A. The Effect of Fire on Building Materials: The Case-Study of the Varnakova Monastery Cells in Central Greece. Heritage 2019, 2, 1233–1259. [Google Scholar] [CrossRef]
- Rosenholtz, J.L.; Smith, D.T. Linear thermal expansion of calcite, var. Iceland spar, and Yule Marble. Am. Mineral. J. Earth Planet. Mater. 1949, 34, 846–854. [Google Scholar]
- Martinho, E.; Dionísio, A. Assessment Techniques for Studying the Effects of Fire on Stone Materials: A Literature Review. Int. J. Archit. Herit. 2018, 14, 275–299. [Google Scholar] [CrossRef]
- Hajpál, M.; Török, A. Mineralogical and colour changes of quartz sandstones by heat. Env. Geol. 2004, 46, 311–322. [Google Scholar] [CrossRef]
- Martínez-Ibáñez, V.; Benavente, D.; Hidalgo Signes, C.; Tomás, R.; Garrido, M.E. Temperature-Induced Explosive Behaviour and Thermo-Chemical Damage on Pyrite-Bearing Limestones: Causes and Mechanisms. Rock. Mech. Rock. Eng. 2020, 54, 219–234. [Google Scholar] [CrossRef]
- Erasmus, E. The influence of thermal treatment on properties of kaolin. Hem. Ind. 2016, 70, 595–601. [Google Scholar] [CrossRef]
- Liu, X.; Liu, X.; Hu, Y. Investigation of the thermal behaviour and decomposition kinetics of kaolinite. Clay Miner. 2018, 50, 199–209. [Google Scholar] [CrossRef]
- Hartlieb, P.; Toifl, M.; Kuchar, F.; Meisels, R.; Antretter, T. Thermo-physical properties of selected hard rocks and their relation to microwave-assisted comminution. Miner. Eng. 2016, 91, 34–41. [Google Scholar] [CrossRef]
- Heaney, P.J. Structure and chemistry of the low-pressure silica polymorphs. In Silica: Physical Behavior, Geochemistry, and Materials Applications; Walter de Gruyter GmbH: Berlin, Germany; Munich, Germany; Boston, MA, USA, 1994; pp. 1–40. [Google Scholar]
- Chakrabarti, B.; Yates, T.; Lewry, A. Effect of fire damage on natural stonework in buildings. Constr. Build. Mater. 1996, 10, 539–544. [Google Scholar] [CrossRef]
- Kristóf-Makó, É.; Juhász, A. The effect of mechanical treatment on the crystal structure and thermal decomposition of dolomite. Thermochim. Acta 1999, 342, 105–114. [Google Scholar] [CrossRef]
- De Aza, A.H.; Rodríguez, M.A.; Rodríguez, J.L.; De Aza, S.; Pena, P.; Convert, P.; Hansen, T.; Turrillas, X. Decomposition of dolomite monitored by neutron thermodiffractometry. J. Am. Ceram. Soc. 2002, 85, 881–888. [Google Scholar] [CrossRef]
- Rodriguez-Navarro, C.; Ruiz-Agudo, E.; Luque, A.; Rodriguez-Navarro, A.B.; Ortega-Huertas, M. Thermal decomposition of calcite: Mechanisms of formation and textural evolution of CaO nanocrystals. Am. Mineral. 2009, 94, 578–593. [Google Scholar] [CrossRef]
- Shahraki, B.; Mehrabi, B.; Gholizadeh, K.; Mohammadinasab, M. Thermal behavior of calcite as an expansive agent. J. Min. Metall. B Metall. 2011, 47, 89–97. [Google Scholar] [CrossRef]
- Rodriguez-Navarro, C.; Kudlacz, K.; Ruiz-Agudo, E. The mechanism of thermal decomposition of dolomite: New insights from 2D-XRD and TEM analyses. Am. Mineral. 2012, 97, 38–51. [Google Scholar] [CrossRef]
- Valverde, J.M.; Perejon, A.; Medina, S.; Perez-Maqueda, L.A. Thermal decomposition of dolomite under CO2: Insights from TGA and in situ XRD analysis. Phys. Chem. Chem. Phys. 2015, 17, 30162–30176. [Google Scholar] [CrossRef]
- McIntosh, R.; Sharp, J.; Wilburn, F. The thermal decomposition of dolomite. Thermochim. Acta 1990, 165, 281–296. [Google Scholar] [CrossRef]
- Kieslinger, A. Zerstörungen an Steinbauten: Ihre Ursachen und ihre Abwehr; Franz Deuticke: Leipzig, Germany, 1932. [Google Scholar]
- Biró, A.; Hlavička, V.; Lublóy, É. Effect of fire-related temperatures on natural stones. Constr. Build. Mater. 2019, 212, 92–101. [Google Scholar] [CrossRef]
- Praticò, Y.; Ochsendorf, J.; Holzer, S.; Flatt, R.J. Post-fire restoration of historic buildings and implications for Notre-Dame de Paris. Nat. Mater. 2020, 19, 817–820. [Google Scholar] [CrossRef] [PubMed]
- Siegesmund, S.; Snethlage, R. Stone in architecture: Properties, Durability; Springer: Berlin/Heidelberg, Germany, 2011. [Google Scholar]
- De Kock, T.; Turmel, A.; Fronteau, G.; Cnudde, V. Rock fabric heterogeneity and its influence on the petrophysical properties of a building limestone: Lede stone (Belgium) as an example. Eng. Geol. 2017, 216, 31–41. [Google Scholar] [CrossRef]
- Graue, B.J. Stone Deterioration and Replacement of Natural Building Stones at the Cologne Cathedral-A Contribution to the Preservation of Cultural Heritage. Doctoral Degree, Georg-August-Universität Göttingen, Göttingen, Germany, 2013. [Google Scholar]
- Rohatsch, A. Neogene Bau-und Dekorgesteine Niederösterreichs und des Burgenlandes. In “Junge” Kalke, Sandsteine und Konglomerate—Neogen; Schwaighofer, B., Eppensteiner, W., Eds.; Mitteilungen IAG BOKU: Vienna, Austria, 2005; pp. 27–31. [Google Scholar]
- De Kock, T.; Boone, M.; Dewanckele, J.; De Ceukelaire, M.; Cnudde, V. Lede Stone: A Potential “global Heritage Stone Resource” from Belgium. Episodes 2015, 38, 91–96. [Google Scholar] [CrossRef] [PubMed]
- Graue, B.; Siegesmund, S.; Middendorf, B. Quality assessment of replacement stones for the Cologne Cathedral: Mineralogical and petrophysical requirements. Env. Earth Sci. 2011, 63, 1799–1822. [Google Scholar] [CrossRef]
- Ehling, A.; Kaur, G.; Wyse Jackson, P.N.; Cassar, J.; Aparecida Del Lama, E.; Heldal, T. The First 55 IUGS Heritage Stones. 2024. Available online: https://iugs-geoheritage.org/designations-stones/ (accessed on 1 February 2025).
- Lobarinhas, R.; Dionísio, A.; Paneiro, G. High Temperature Effects on Global Heritage Stone Resources: A Systematic Review. Heritage 2024, 7, 6310–6342. [Google Scholar] [CrossRef]
- Ban, M.; Baragona, A.; Ghaffari, E.; Weber, J.; Rohatsch, A. Artificial aging techniques on various lithotypes for testing of stone consolidants. In Proceedings of the Science and Art: A Future for Stone: Proceedings of the 13th International Congress on the Deterioration and Conservation of Stone, Volume 1; Hughes, J., Howind, T., Eds.; University of the West of Scotland: Paisley, UK, 2016; pp. 253–260. [Google Scholar]
- Standard EN 15886; Conservation of cultural Property. Colour Measurement of Surfaces. CEN Brussels: Bruxelles, Belgium, 2010.
- Degen, T.; Sadki, M.; Bron, E.; König, U.; Nénert, G. The HighScore suite. Powder Diffr. 2014, 29, S13–S18. [Google Scholar] [CrossRef]
- Faber, J.; Fawcett, T. The powder diffraction file: Present and future. Acta Crystallogr. Sect. B Struct. Sci. 2002, 58, 325–332. [Google Scholar] [CrossRef]
- Kabekkodu, S.N.; Faber, J.; Fawcett, T. New Powder Diffraction File (PDF-4) in relational database format: Advantages and data-mining capabilities. Acta Crystallogr. Sect. B Struct. Sci. 2002, 58, 333–337. [Google Scholar] [CrossRef]
- Wendlandt, W.W. Thermal Methods of Analysis; Wiley: New York, NY, USA, 1974. [Google Scholar]
- Haines, P.J. Thermal Methods of Analysis: Principles, Applications and Problems; Springer Science & Business Media: Berlin/Heidelberg, Germany, 2012. [Google Scholar]
- Haaland, M.M.; Friesem, D.E.; Miller, C.E.; Henshilwood, C.S. Heat-induced alteration of glauconitic minerals in the Middle Stone Age levels of Blombos Cave, South Africa: Implications for evaluating site structure and burning events. J. Archaeol. Sci. 2017, 86, 81–100. [Google Scholar] [CrossRef]
- Mashlan, M.; Martinec, P.; Kašlík, J.; Kovářová, E.; Scucka, J. Mössbauer study of transformation of Fe cations during thermal treatment of glauconite in air. In Proceedings of AIP Conference Proceedings; American Institute of Physics: College Park, MD, USA, 2012; pp. 169–173. [Google Scholar]
- Fanning, D.S.; Keramidas, V.Z.; El-Desoky, M.A. Micas. In Minerals in Soil Environments; Wiley: Hoboken, NJ, USA, 1989; Volume 1, pp. 551–634. [Google Scholar]
- Stoch, L. Significance of structural factors in dehydroxylation of kaolinite polytypes. J. Therm. Anal. Calorim. 1984, 29, 919–931. [Google Scholar] [CrossRef]
- Heide, K.; Földvari, M. High temperature mass spectrometric gas-release studies of kaolinite Al2[Si2O5(OH)4] decomposition. Thermochim. Acta 2006, 446, 106–112. [Google Scholar] [CrossRef]
- Singh, V.; Tathavadkar, V.; Denys, M.B.; Venugopal, R. Application of quartz inversion phenomenon in mineral processing–A case study of siliceous manganese ores. Miner. Eng. 2012, 32, 8–11. [Google Scholar] [CrossRef]
- Ungár, T. Industrial Applications of X-ray Diffraction; Chung, F.H., Smith, D.K., Eds.; Marcel Dekker: New York, NY, USA, 2000. [Google Scholar]
- Rietveld, H.M. A profile refinement method for nuclear and magnetic structures. J. Appl. Crystallogr. 1969, 2, 65–71. [Google Scholar] [CrossRef]
- Sippel, J.; Siegesmund, S.; Weiss, T.; Nitsch, K.H.; Korzen, M. Decay of natural stones caused by fire damage. Geol. Soc. Lond. Spec. Publ. 2007, 271, 139–151. [Google Scholar] [CrossRef]
- Ban, M.; Luxbacher, T.; Lützenkirchen, J.; Viani, A.; Bianchi, S.; Hradil, K.; Rohatsch, A.; Castelvetro, V. Evolution of calcite surfaces upon thermal decomposition, characterized by electrokinetics, in-situ XRD, and SEM. Colloids Surf. A Physicochem. Eng. Asp. 2021, 624. [Google Scholar] [CrossRef]
- Dionisio, A.; Sequeirabraga, M.; Waerenborgh, J. Clay minerals and iron oxides-oxyhydroxides as fingerprints of firing effects in a limestone monument. Appl. Clay Sci. 2009, 42, 629–638. [Google Scholar] [CrossRef]
- Stanmore, B.R.; Gilot, P. Review—Calcination and carbonation of limestone during thermal cycling for CO2 sequestration. Fuel Process. Technol. 2005, 86, 1707–1743. [Google Scholar] [CrossRef]
- Ban, M.; Mascha, E.; Weber, J.; Rohatsch, A.; Rodrigues, J.D. Efficiency and Compatibility of Selected Alkoxysilanes on Porous Carbonate and Silicate Stones. Materials 2019, 12, 156. [Google Scholar] [CrossRef] [PubMed]
- Ban, M. Chemo-Mineralogical and Petrophysical Alterations on Lithotypes Due to Thermal Treatment Before Stone Consolidation. Doctoral dissertation, Technische Universität Wien, Vienna, Austria, 2021. [Google Scholar] [CrossRef]


Disclaimer/Publisher’s Note: The statements, opinions and data contained in all publications are solely those of the individual author(s) and contributor(s) and not of MDPI and/or the editor(s). MDPI and/or the editor(s) disclaim responsibility for any injury to people or property resulting from any ideas, methods, instructions or products referred to in the content. |
© 2025 by the authors. Licensee MDPI, Basel, Switzerland. This article is an open access article distributed under the terms and conditions of the Creative Commons Attribution (CC BY) license (https://creativecommons.org/licenses/by/4.0/).