


Tourism Competitiveness in Eastern Africa: RCA and TTCI


Abstract
:1. Introduction
- Q1:
- Do the natural and cultural endowments of the analyzed countries contribute significantly to the performance of tourism in the analyzed countries?
- Q2:
- Do the transport and tourism services enhance tourism receipts and arrivals?
- Q3:
- Does the revealed comparative advantage of the tourism sector (RCA) reveal the same tendencies as the facilities of the tourism industry (TTCI)?
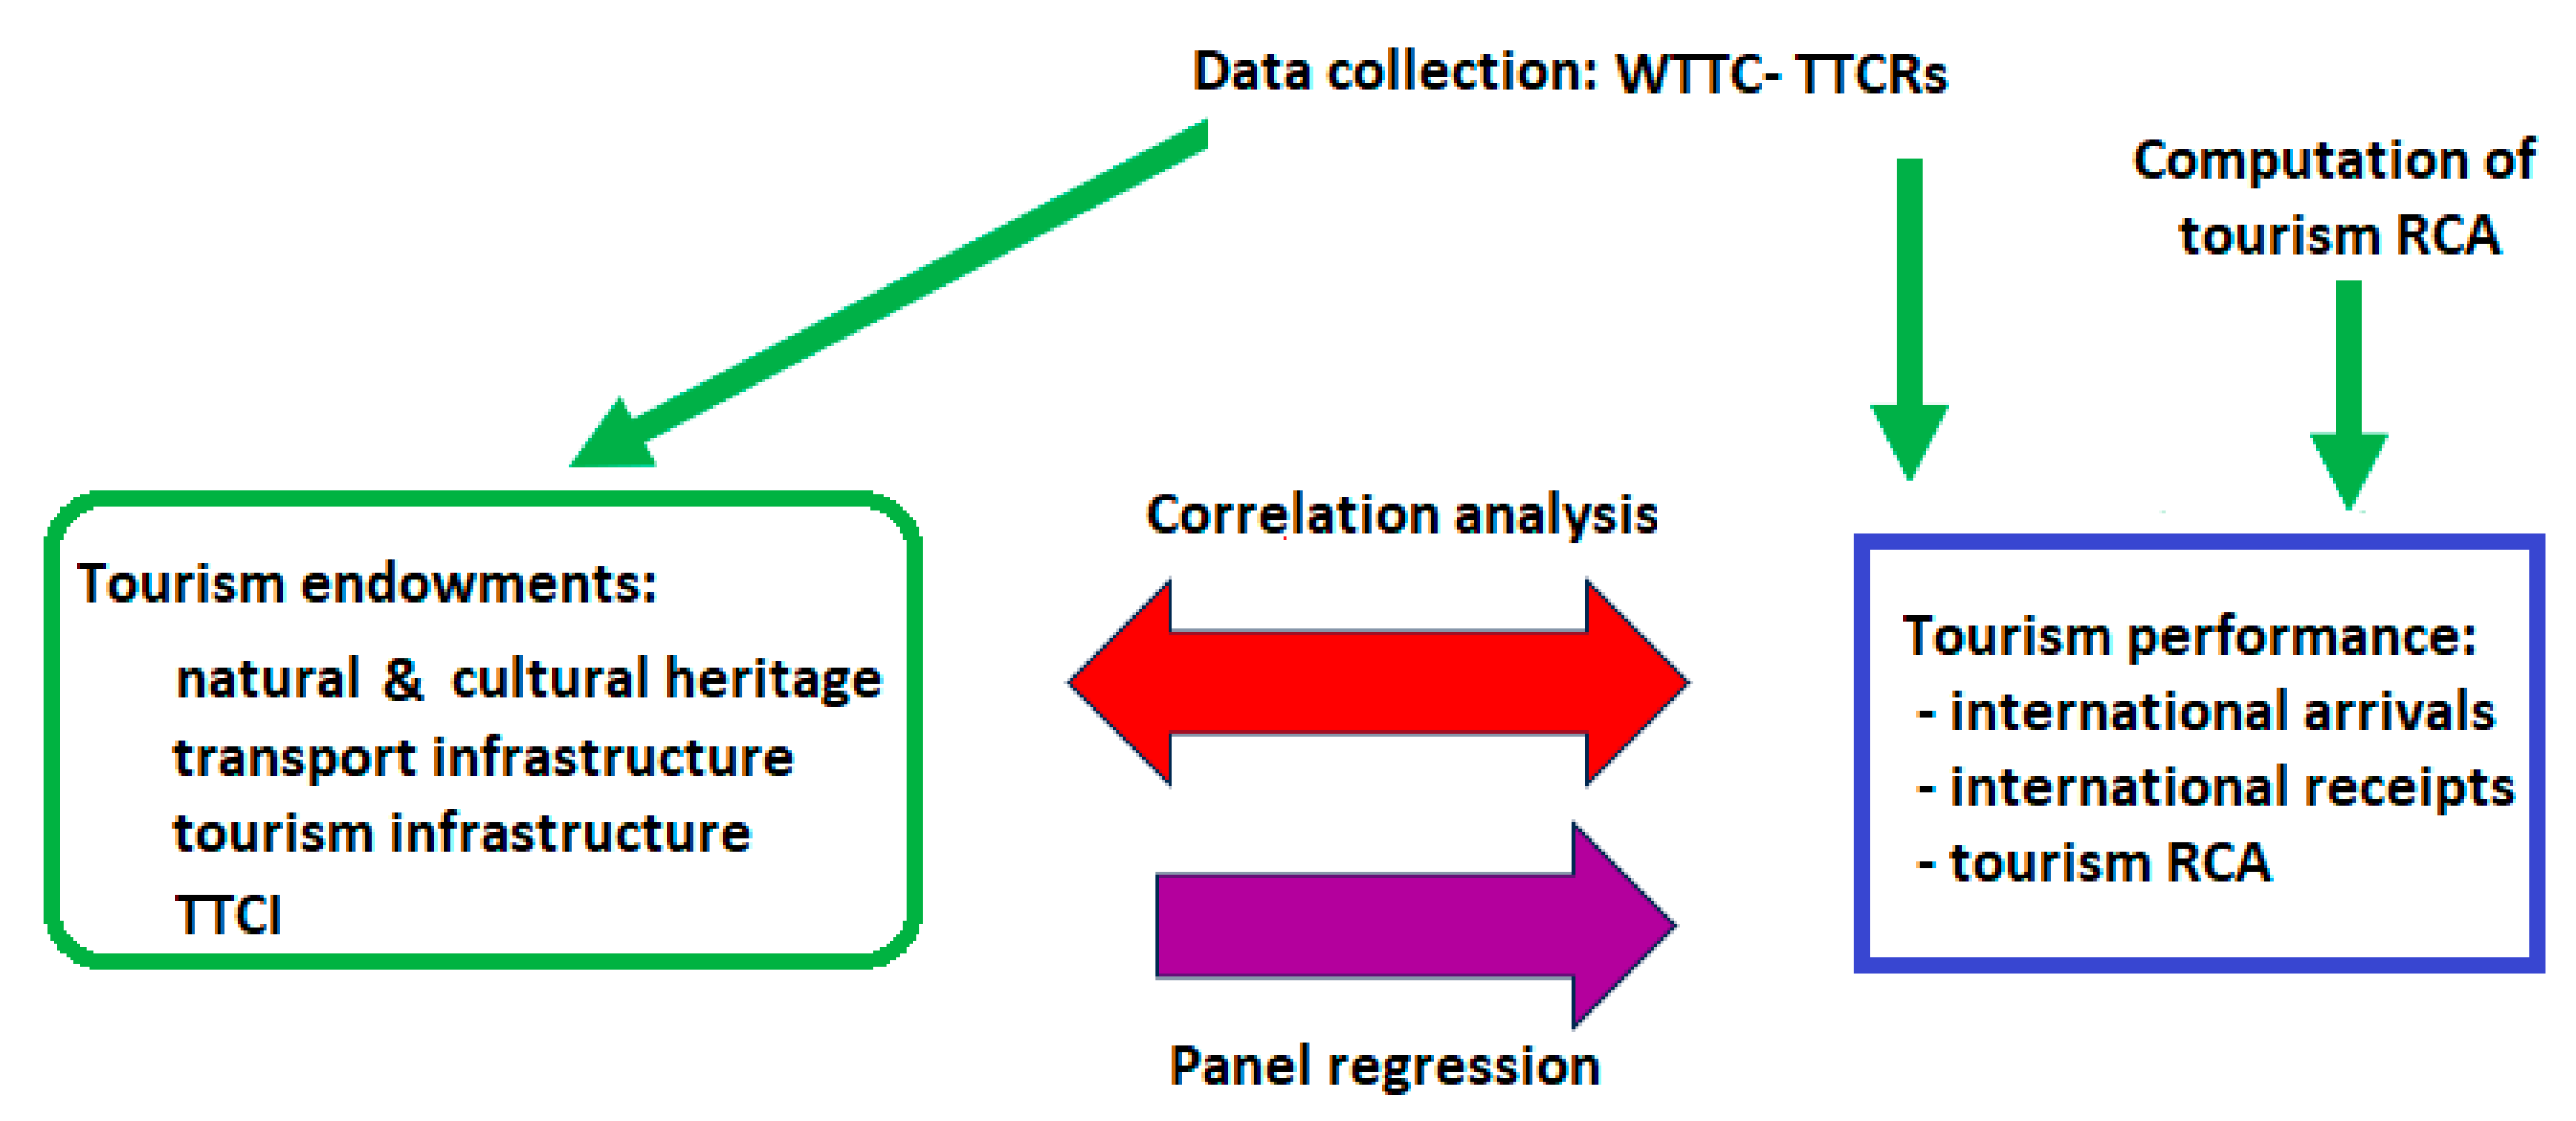
2. Materials and Methods
2.1. Methodology
- EiT: the export value of the tourism sector in country “i”;
- Ei: the export value of all products and services in country “i”;
- EwT: the export value of the tourism sector in the world (sum of all countries);
- Ew: the total world export value of all products and services (sum of all countries).
- Countries with 0 < RCA ≤ 1 are without comparative advantage;
- Countries with 1 < RCA ≤ 2 are of slight comparative advantage;
- Countries with 2 < RCA ≤ 4 are of average comparative advantage;
- Countries with RCA > 4 are of strong comparative advantage.
2.2. Data
- P1_BusEnv: Business environment
- P2_SafSec: Safety and security
- P3_Health: Health and hygiene
- P4_HumRes: Human resources
- P5_ICT: ICT infrastructure /ICT readiness
- P6_PriTu: Prioritisation of travel and tourism
- P7_Open: International openness
- P8_PriceC: Price competitiveness
- P9_EnvSus: Environmental sustainability
- P10_AirInf: Air travel infrastructure
- P11_GrouInf: Ground travel infrastructure
- P12_TourInf: Tourism services infrastructure
- P13_NatRes: Natural resources
- P14_CultRes: Cultural resources
- NatWHS—the number of natural World Heritage Sites, a component of P13
- CultWHS—the number of cultural (built) World Heritage Sites, a component of P14.
- Arriv: International tourism, number of arrivals
- Receipt: International tourism, receipts (current USD)
- RecPct: International tourism, receipts % GDP
- RCA: the revealed comparative advantage of tourism.
3. Results
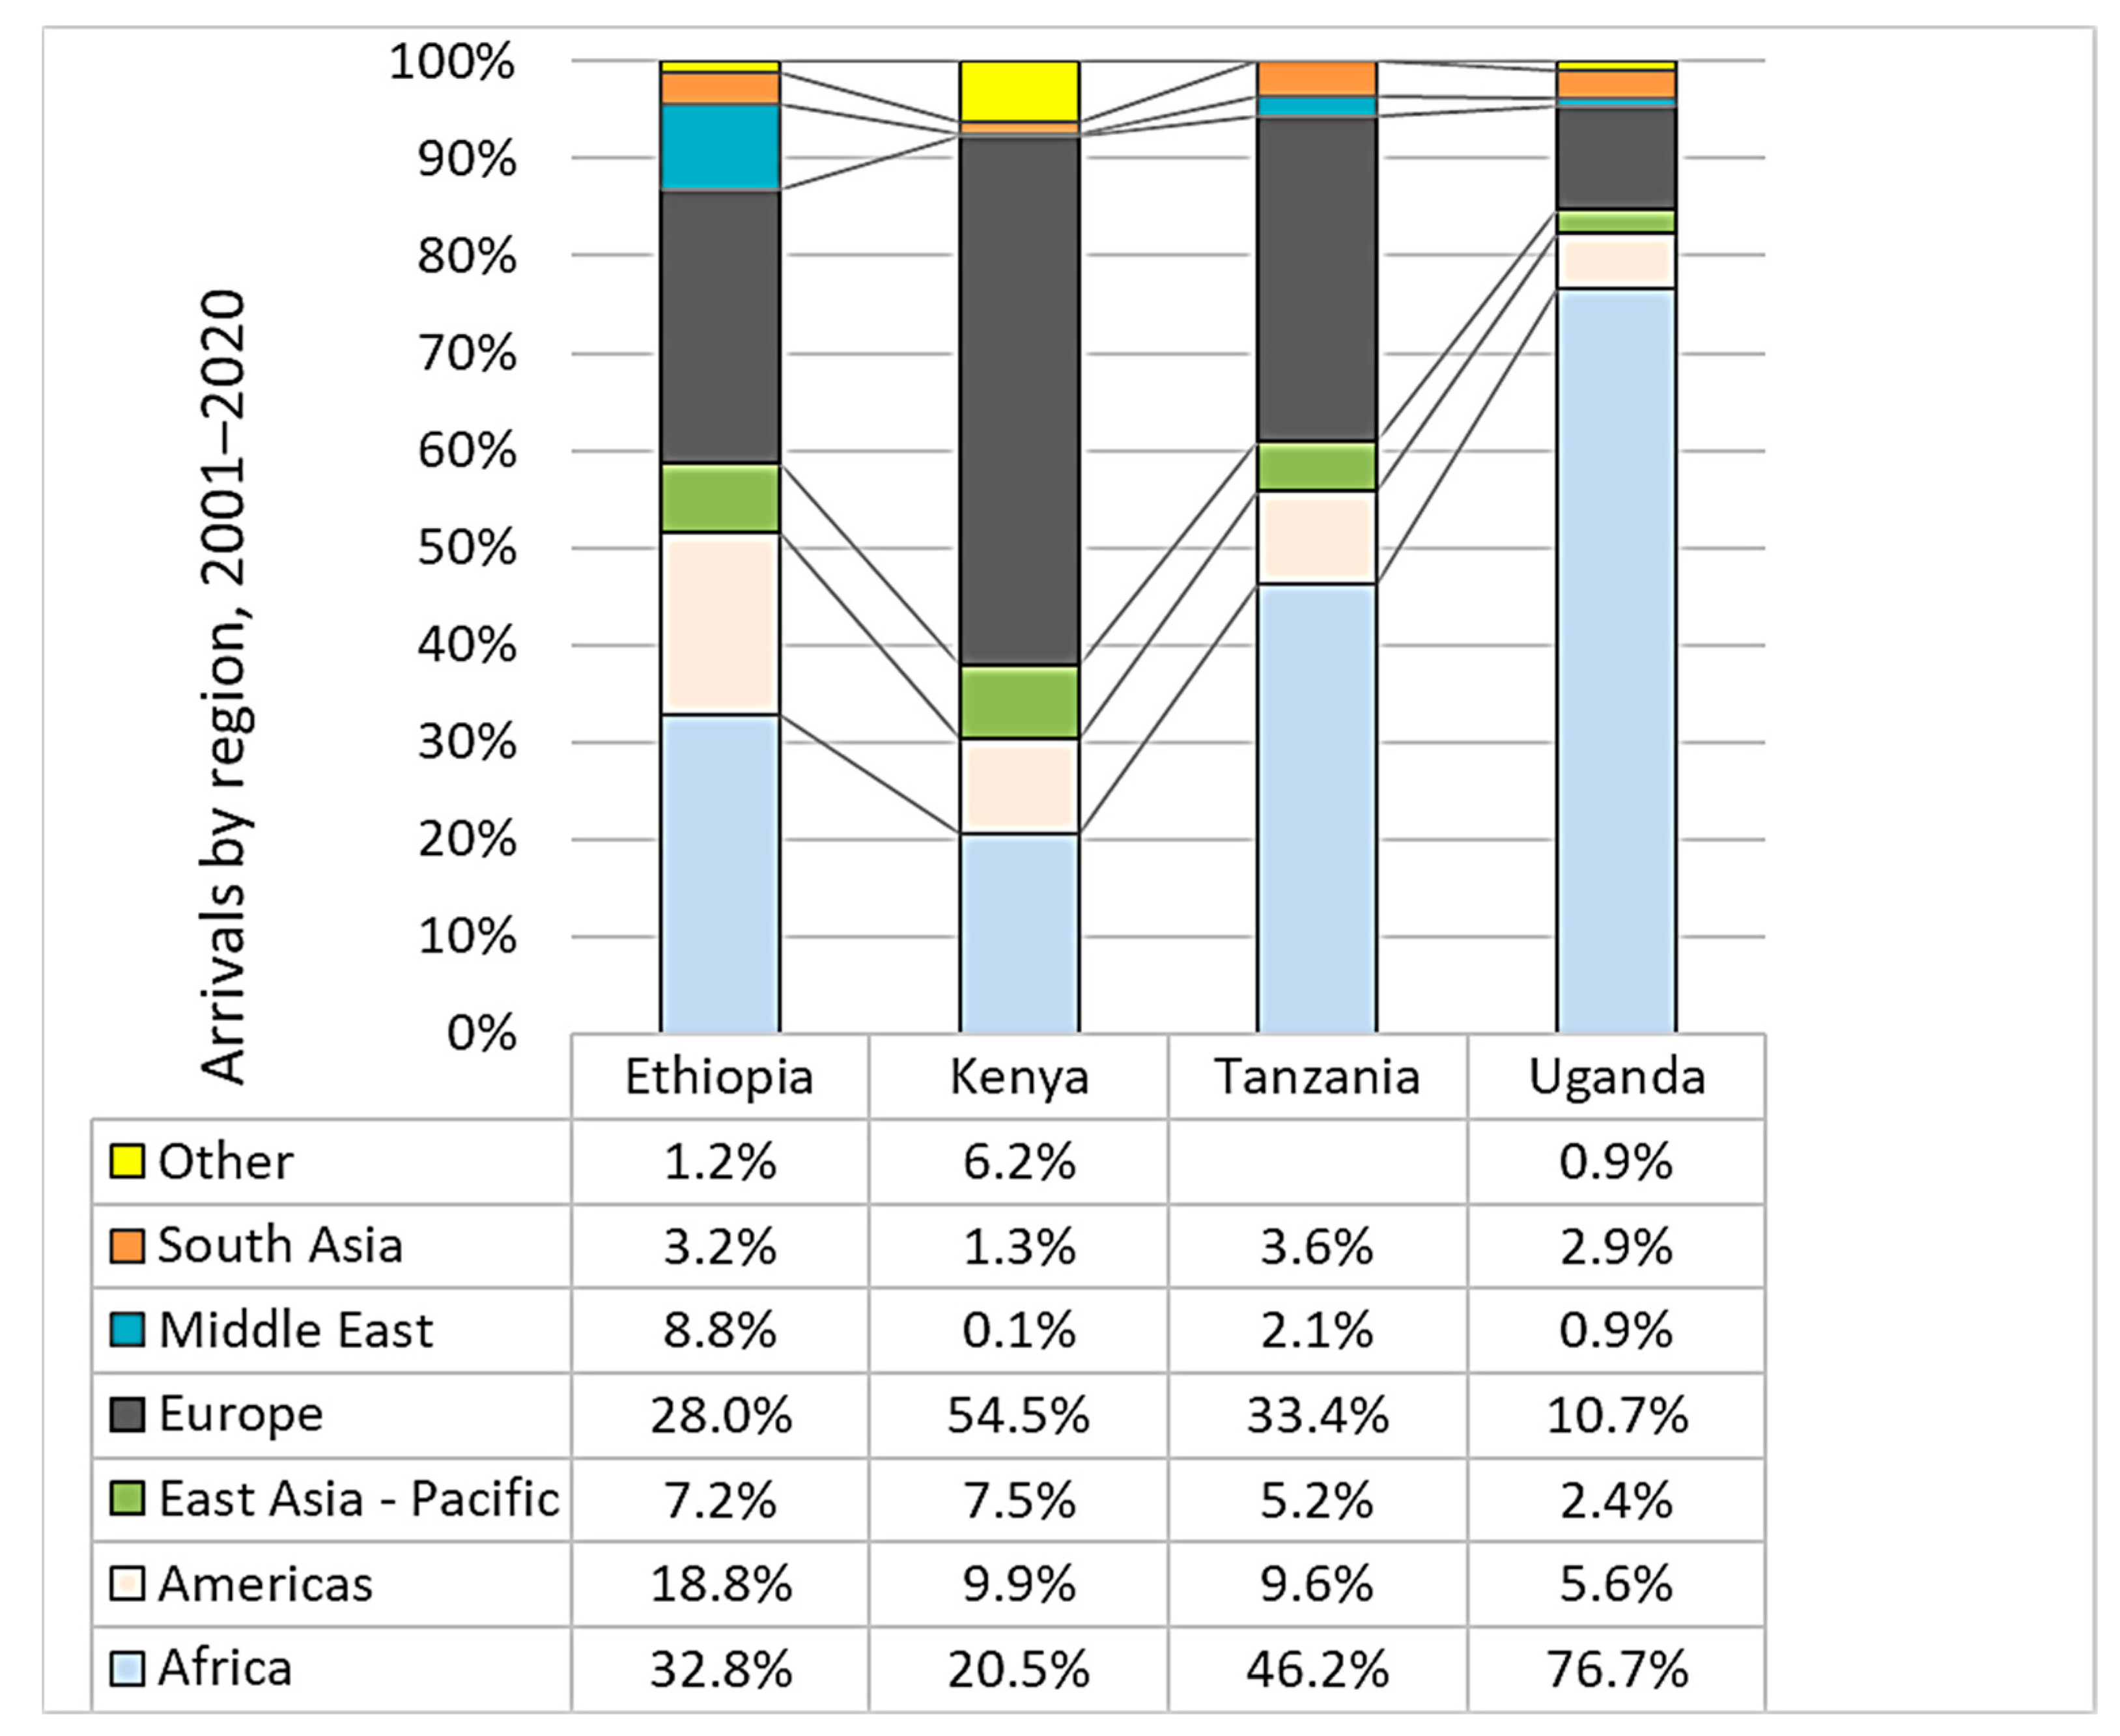
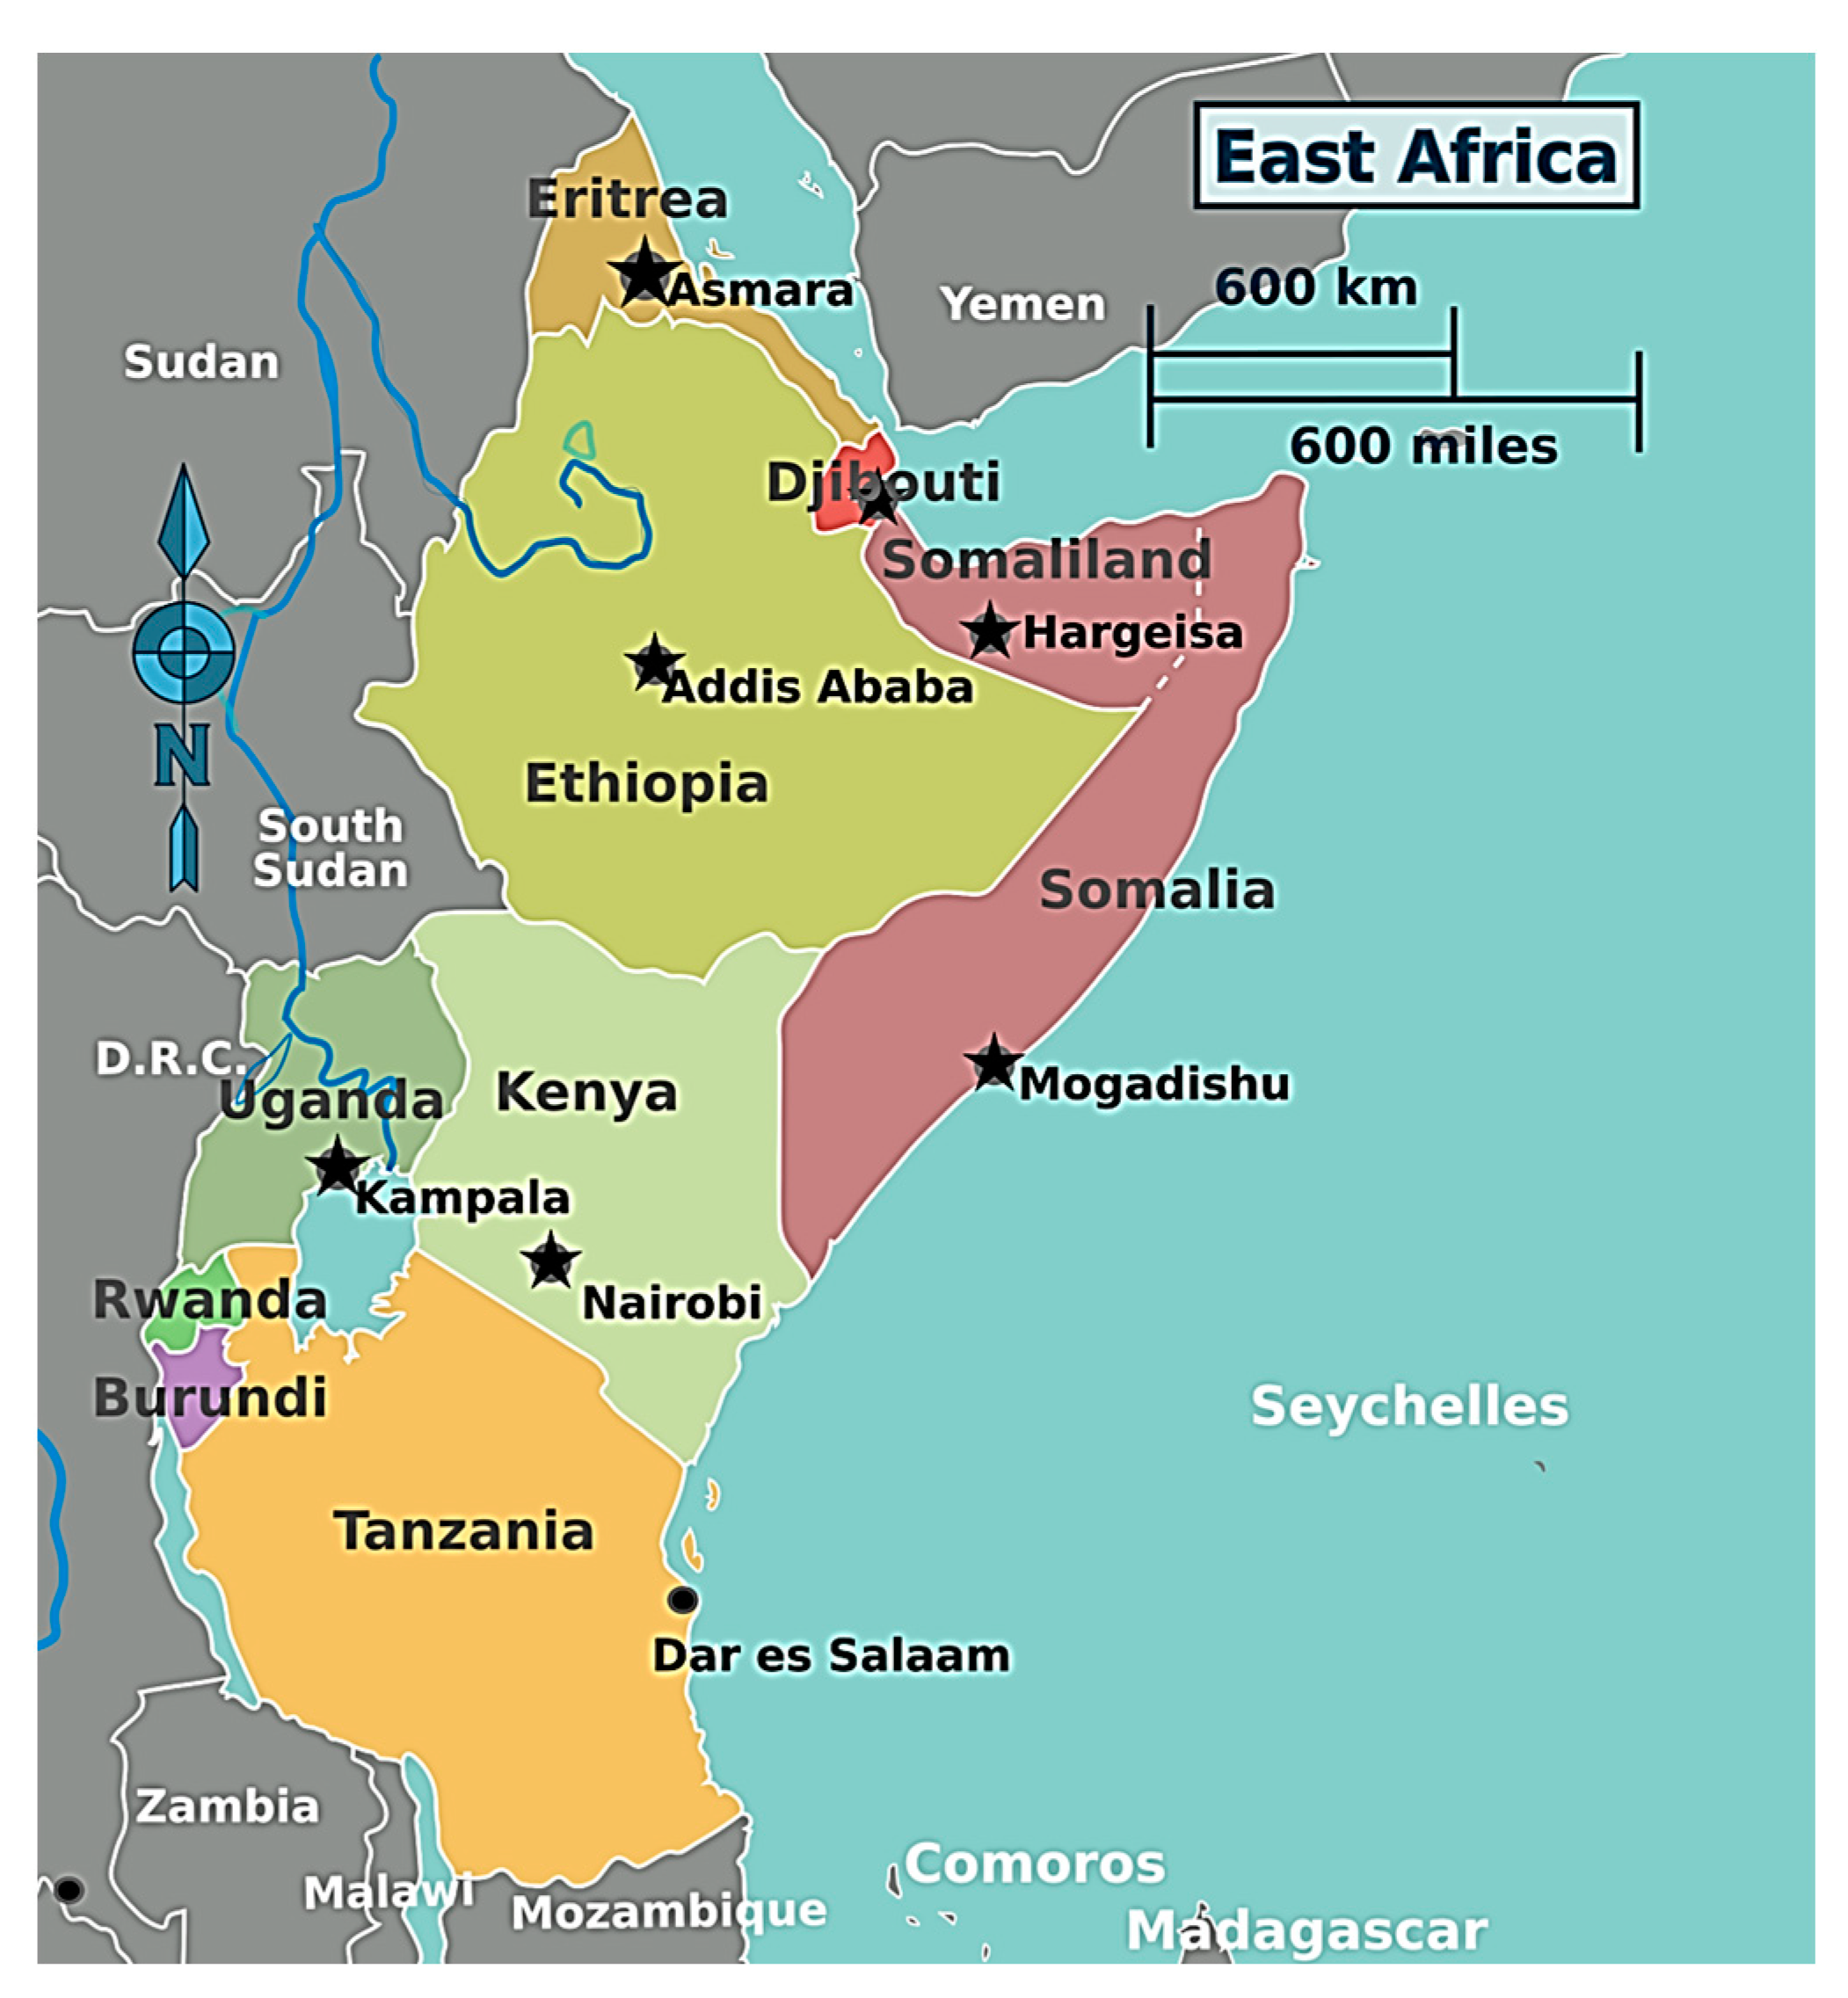
3.1. The Study Area
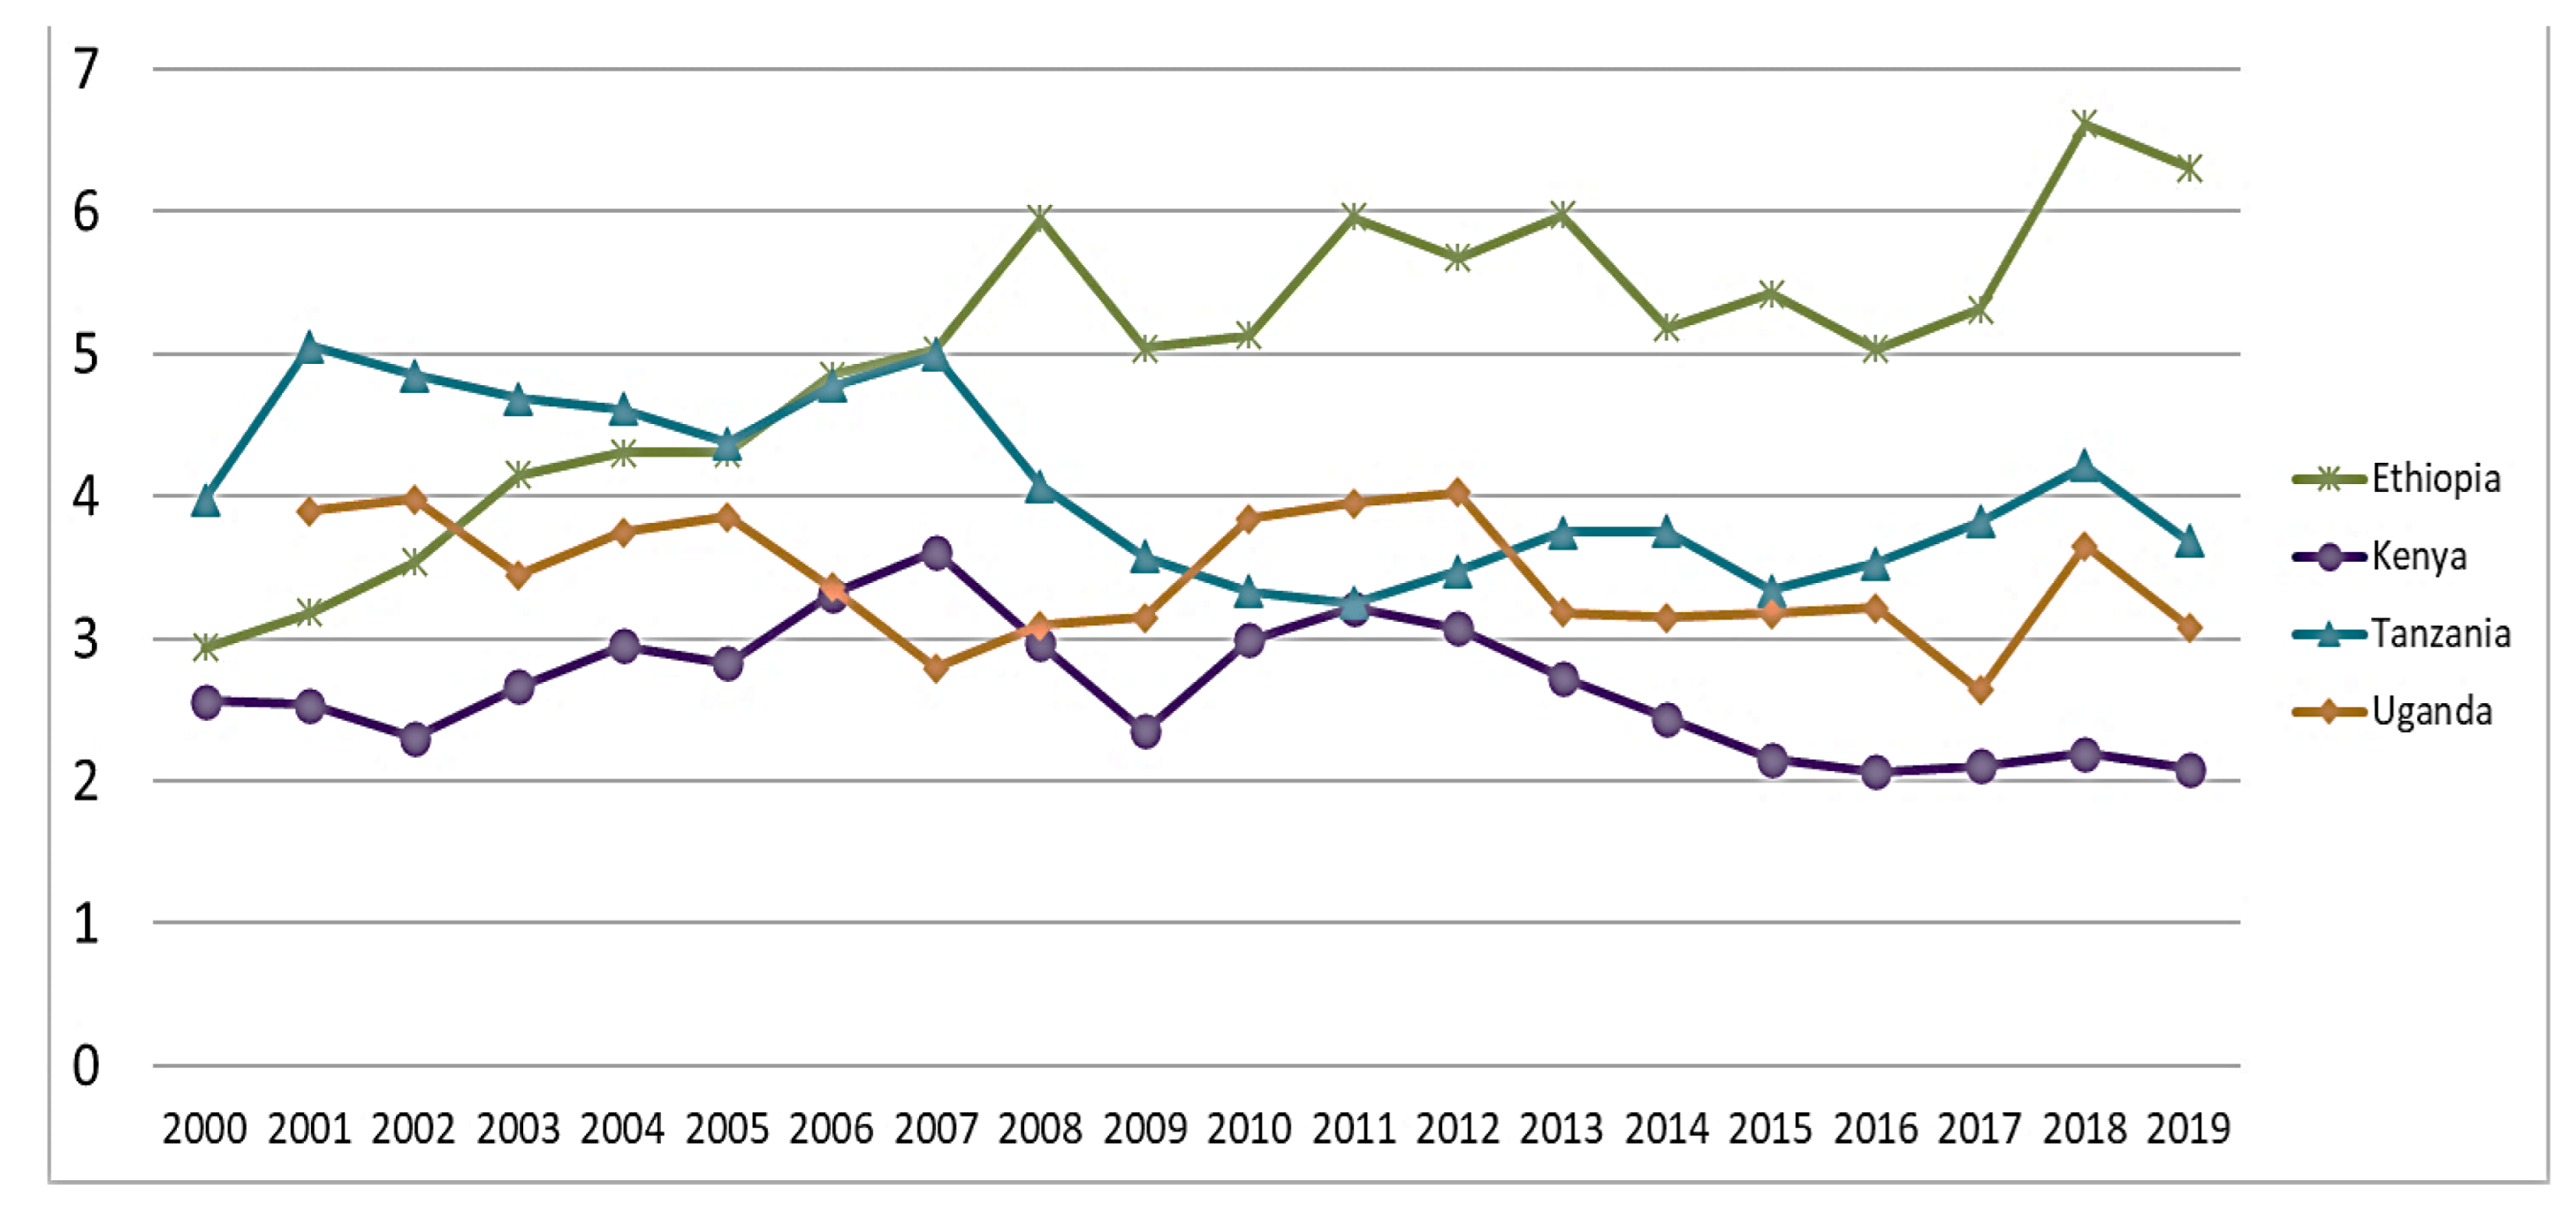
3.2. RCA Analysis of International Tourism Receipts
3.3. Relationship between RCA and TTCI and Components
4. Discussion
5. Conclusions
Author Contributions
Funding
Data Availability Statement
Acknowledgments
Conflicts of Interest
References
- Signé, L.; Johnson, C. Africa’s Tourism Potential Trends, Drivers, Opportunities, and Strategies. Africa Growth Initiative, Brookings Institution. 2018. Available online: https://www.brookings.edu/wp-content/uploads/2018/12/Africas-tourism-potential_LandrySigne1.pdf (accessed on 15 December 2022).
- Juma, L.O.; Khademi-Vidra, A. Community-Based Tourism and Sustainable Development of Rural Regions in Kenya; Perceptions of the Citizenry. Sustainability 2019, 11, 4733. [Google Scholar] [CrossRef]
- Kimeria, C. Africa’s Tourism Industry Is Now the Second Fastest Growing in the World. 2019. Available online: https://qz.com/africa/1717902/africas-tourism-industry-is-second-fastest-growing-in-world (accessed on 5 December 2022).
- Chisadza, C.; Clance, M.; Gupta, R.; Wanke, P. Uncertainty and tourism in Africa. Tour. Econ. 2022, 28, 964–978. [Google Scholar] [CrossRef]
- Njoya, E.T.; Efthymiou, M.; Nikitas, A.; O’Connell, J.F. The Effects of Diminished Tourism Arrivals and Expenditures Caused by Terrorism and Political Unrest on the Kenyan Economy. Economies 2022, 10, 191. [Google Scholar] [CrossRef]
- Soliku, O.; Kyiire, B.; Mahama, A.; Kubio, C. Tourism amid COVID-19 pandemic: Impacts and implications for building resilience in the eco-tourism sector in Ghana’s Savannah region. Heliyon 2021, 7, e07892. [Google Scholar] [CrossRef] [PubMed]
- Okello, M.M.; Novelli, M. Tourism in the East African Community (EAC): Challenges, opportunities, and ways forward. Tour. Hosp. Res. 2014, 14, 53–66. [Google Scholar] [CrossRef]
- Tekalign, M.; Groot Zevert, N.; Weldegebriel, A.; Poesen, J.; Nyssen, J.; Van Rompaey, A.; Norgrove, L.; Muys, B.; Vranken, L. Do Tourists’ Preferences Match the Host Community’s Initiatives? A Study of Sustainable Tourism in One of Africa’s Oldest Conservation Areas. Sustainability 2018, 10, 4167. [Google Scholar] [CrossRef]
- Iacopino, S.; Piazzi, C.; Opio, J.; Muhwezi, D.K.; Ferrari, E.; Caporale, F.; Sitzia, T. Tourist Agroforestry Landscape from the Perception of Local Communities: A Case Study of Rwenzori, Uganda. Land 2022, 11, 650. [Google Scholar] [CrossRef]
- Melubo, K.; Lovelock, B. Living Inside a UNESCO World Heritage Site: The Perspective of the Maasai Community in Tanzania. Tour. Plan. Dev. 2019, 16, 197–216. [Google Scholar] [CrossRef]
- Hoogendoorn, G.; Meintjes, D.; Kelso, C.; Fitchett, J. Tourism as an incentive for rewilding: The conversion from cattle to game farms in Limpopo province, South Africa. J. Ecotourism 2019, 18, 309–315. [Google Scholar] [CrossRef]
- Kyara, V.C.; Rahman, M.M.; Khanam, R. Tourism expansion and economic growth in Tanzania: A causality analysis. Heliyon 2021, 7, e06966. [Google Scholar] [CrossRef]
- Spenceley, A.; Snyman, S.; Rylance, A. Revenue sharing from tourism in terrestrial African protected areas. J. Sustain. Tour. 2017, 27, 720–734. [Google Scholar] [CrossRef]
- Kaoga, J.; Olago, D.; Ouma, G.; Ouma, G.; Onono, J. Cultural heritage as a pathway for sustaining natural resources in the Maasai’s Pastoral Social-Ecological System in Kajiado County, Kenya. Afr. J. Agric. Res. 2021, 17, 844–852. [Google Scholar] [CrossRef]
- Kieti, D.; Nthiga, R.; Plimo, J.; Sambajee, P.; Ndiuini, A.; Kiage, E.; Mutinda, P.; Baum, T. An African dilemma: Pastoralists, conservationists and tourists—Reconciling conflicting issues in Kenya. Dev. S. Afr. 2020, 37, 758–772. [Google Scholar] [CrossRef]
- Osano, P.M.; Said, M.Y.; de Leeuw, J.; Ndiwa, N.; Kaelo, D.; Schomers, S.; Birne, R.; Ogutu, J.O. Why keep lions instead of livestock? Assessing wildlife tourism-based payment for ecosystem services involving herders in the Maasai Mara, Kenya. Nat. Resour. Forum 2013, 37, 242–256. [Google Scholar] [CrossRef]
- Sindiga, I. Tourism and African Development—Change and Challenge of Tourism in Kenya; Research Series, 14/1999; African Studies Centre: Leiden, The Netherlands, 2020. [Google Scholar] [CrossRef]
- Holechek, J.; Valdez, R. Wildlife Conservation on the Rangelands of Eastern and Southern Africa: Past, Present, and Future. Rangel. Ecol. Manag. 2017, 71, 245–258. [Google Scholar] [CrossRef]
- UNECASRO-EA. Ecotourism in the Intergovernmental Authority on Development (IGAD) Region—An Untapped Potential with Considerable Socio-Economic Opportunities. Economic Commission for Africa Sub-Regional Office for Eastern Africa (SRO-EA). United Nations Economic Commission for Africa, Sub-Regional Office for Eastern Africa, Kigali, Rwanda. 2011. Available online: www.uneca.org (accessed on 21 February 2023).
- Tapper, R. Wildlife Watching and Tourism: A Study on the Benefits and Risks of a Fast-Growing Tourism Activity and Its Impacts on Species; UNEP/CMS Secretariat: Bonn, Germany, 2006. [Google Scholar]
- Mtapuri, O.; Giampiccoli, A. Tourism, community-based tourism and ecotourism: A definitional problematic. S. Afr. Geogr. J. 2018, 101, 22–35. [Google Scholar] [CrossRef]
- WTTC. The Economic Impact of Global Wildlife Tourism—Travel & Tourism as an Economic Tool for the Protection of Wildlife. World Travel and Tourism Council. August 2019. Available online: https://wttc.org/Portals/0/Documents/Reports/2019/Sustainable%20Growth-Economic%20Impact%20of%20Global%20Wildlife%20Tourism-Aug%202019.pdf (accessed on 14 August 2023).
- WEF. WTTC-TTCR Reports 2007–2019; World Economic Forum: Geneva, Switzerland, 2023. [Google Scholar]
- World Bank Database. Economic Data. 2023. Available online: https://data.worldbank.org/indicator/%20NY.GDP.MKTP.CD (accessed on 25 February 2023).
- World Bank Database. Tourism Arrivals Data. 2023. Available online: https://data.worldbank.org/indicator/ST.INT.ARVL (accessed on 25 February 2023).
- Su, Y.-W.; Lin, H.-L. Analysis of international tourist arrivals worldwide: The role of world heritage sites. Tour. Manag. 2014, 40, 46–58. [Google Scholar] [CrossRef]
- Farid, S.M. Tourism management in world heritage sites and its impact on economic development in Mali and Ethiopia. Procedia Soc. Behav. Sci. 2015, 211, 595–604. [Google Scholar] [CrossRef]
- Kalenjuk Pivarski, B.; Grubor, B.; Banjac, M.; Đerčan, B.; Tešanović, D.; Šmugović, S.; Radivojević, G.; Ivanović, V.; Vujasinović, V.; Stošić, T. The Sustainability of Gastronomic Heritage and Its Significance for Regional Tourism Development. Heritage 2023, 6, 3402–3417. [Google Scholar] [CrossRef]
- Karray, S.; Ruiz Pulpón, Á.R.; Rejeb, H. New Socio-Spatial Reading of a Remarkable Landscape Located in Testour, toward a Heritage Setting of a Moorish Site. Heritage 2023, 6, 2247–2267. [Google Scholar] [CrossRef]
- Bacsi, Z.; Tóth, É. World Heritage Sites as soft tourism destinations—Their impacts on international arrivals and tourism receipts. Bull. Geogr. Socio-Econ. Ser. 2019, 45, 25–44. [Google Scholar]
- UNESCO. Convention Concerning the Protection of the World Cultural an Natural Heritage. Paris. 16 November 1972. Available online: https://whc.unesco.org/archive/convention-en.pdf (accessed on 14 August 2023).
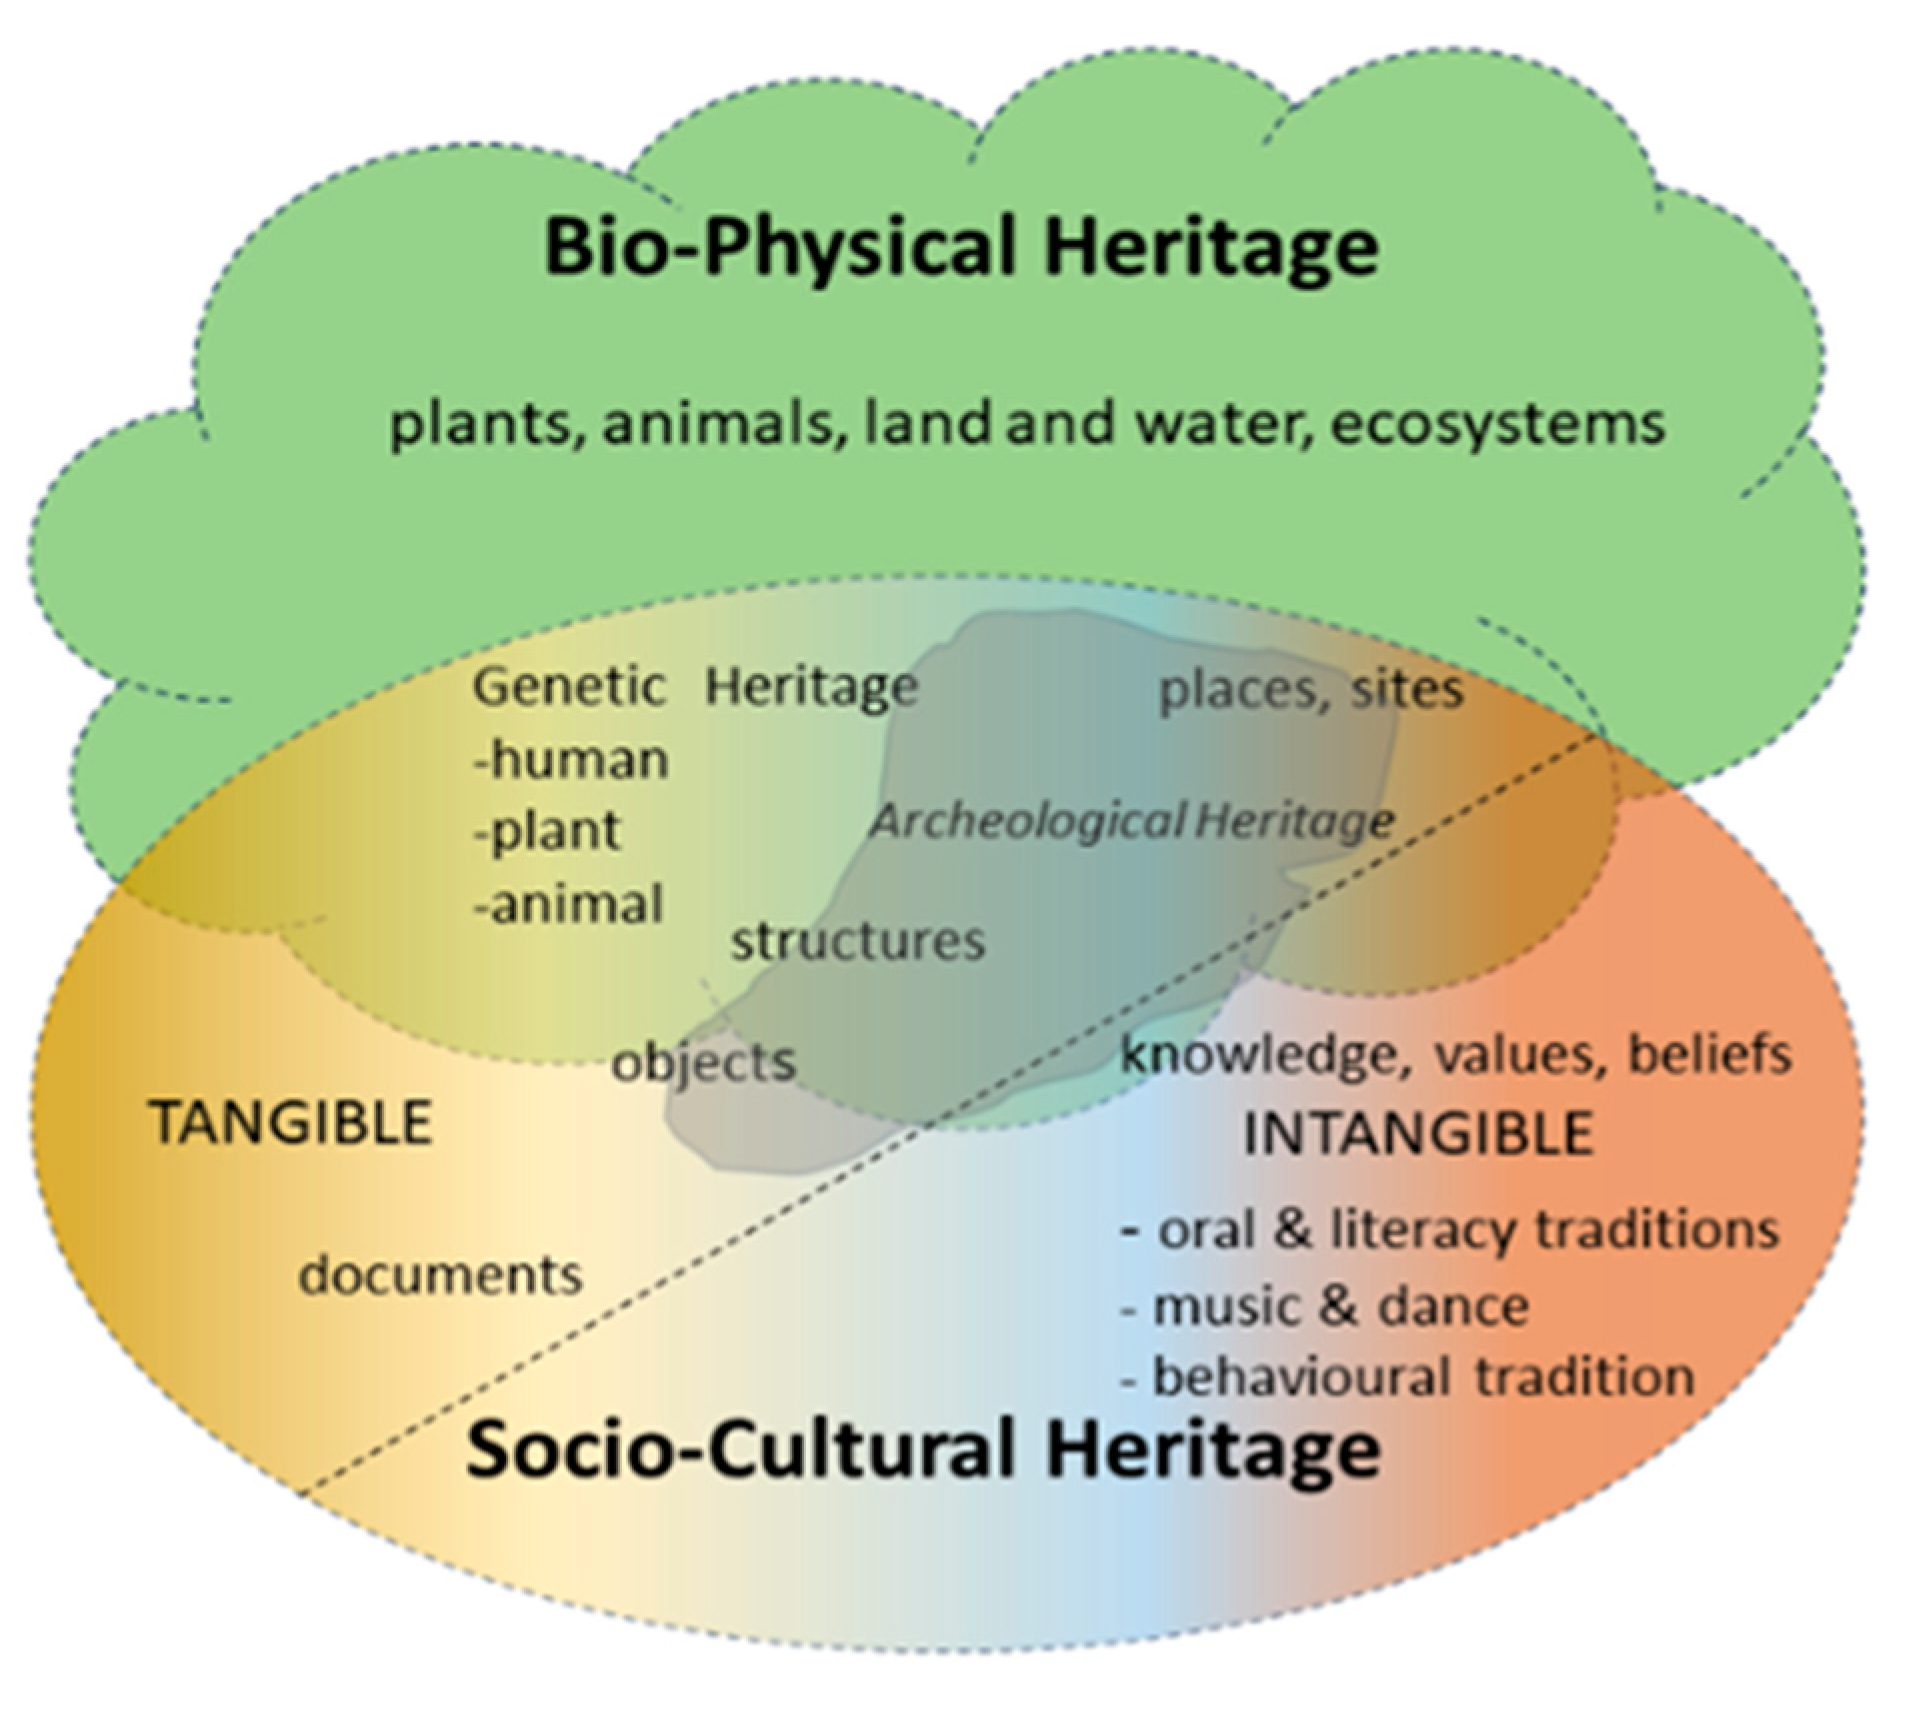
- Brumann, C. Cultural Heritage. In International Encyclopedia of the Social & Behavioral Sciences, 2nd ed.; Wright, J.D., Ed.; Elsevier: Oxford, UK, 2015; Volume 5, pp. 414–419. ISBN 9780080970868. Available online: https://www.academia.edu/20176284/Cultural_heritage (accessed on 16 August 2023).
- Central European University. The Concept and History of Cultural Heritage. Available online: https://culturalheritagestudies.ceu.edu/concept-and-history-cultural-heritage (accessed on 15 August 2023).
- UNESCO. Institute for Statistics, 2009 UNESCO Framework for Cultural Statistics. Available online: https://uis.unesco.org/en/glossary-term/cultural-heritage (accessed on 15 August 2023).
- UNESCO. Convention for the Safeguarding of the Intangible Cultural Heritage. 2003. Available online: https://ich.unesco.org/en/convention#art2 (accessed on 16 August 2023).
- Rogers, A.P. Values and Relationships between Tangible and Intangible Dimensions of Heritage Places. In Values in Heritage Management: Emerging Approaches and Research Directions, 1st ed.; Avrami, E., Macdonald, S., Mason, R., Myers, D., Eds.; The Getty Conservation Institute: Los Angeles, CA, USA, 2019; pp. 172–185. [Google Scholar]
- Welch, J.R.; Intellectual Property Issues in Cultural Heritage Project. Cultural Heritage What Is It? Why Is It Important? Factsheet. 7 February 2014. Available online: https://www.sfu.ca/ipinch/sites/default/files/resources/fact_sheets/ipinch_chfactsheet_final.pdf (accessed on 15 August 2023).
- Willis, K.G. The Use of Stated Preference Methods to Value Cultural Heritage. In Handbook of Economics of Art and Culture; Ginsburgh, V.A., Thorsby, D., Eds.; Elsevier: Amsterdam, The Netherlands, 2014; Volume 2, pp. 145–181. ISSN 1574-0676. ISBN 9780444537768. [Google Scholar] [CrossRef]
- Congress of Local and Regional Authorities of the Council of Europe. Culture without Borders: Cultural Heritage Management for Local and Regional Development. Report. Available online: https://rm.coe.int/culture-without-borders-cultural-heritage-management-for-local-and-reg/1680a28883 (accessed on 15 August 2023).
- Feilden, B.M.; Jokilehto, J. Management Guidelines for World Cultural Heritage Sites, 2nd ed.; ICCROM-International Centre for the Study of the Preservation and Restoration of Cultural Property: Rome, Italy, 1998; p. 120. ISBN 92-9077-150-X. Available online: https://www.iccrom.org/sites/default/files/2018-02/1998_feilden_management_guidelines_eng_70071_light_0.pdf (accessed on 15 August 2023).
- Peacock, A. Future for the Past: The Political Economy of Heritage. Keynes Lecture in Economics. Proc. Br. Acad. 1995, 87, 189–243, reprinted in Cult. Econ. Arts Herit. Media Ind. 1997, 80, 1387–1424. [Google Scholar]
- Throsby, D. Heritage Economics: Coming to Terms with Value and Valuation In Values in Heritage Management: Emerging Approaches and Research Directions, 1st ed.; Avrami, E., Macdonald, S., Mason, R., Myers, D., Eds.; The Getty Conservation Institute: Los Angeles, CA, USA, 2019; pp. 199–209. ISBN 9781606066188. Available online: https://www.getty.edu/publications/heritagemanagement/downloads/Avrami_etal_ValuesinHeritageManagement.pdf (accessed on 16 August 2023).
- United Nations Environment Programme; World Trade Organization (WTO). Making Tourism more Sustainable: A Guide for Policy Makers. 2005. Available online: https://wedocs.unep.org/20.500.11822/8741 (accessed on 16 August 2023).
- Dupeyras, A.; MacCallum, N. Indicators for Measuring Competitiveness in Tourism: A Guidance Document; OECD Tourism Papers, 2; OECD Publishing: Paris, France, 2013. [Google Scholar]
- Balassa, B. Trade liberalization and revealed comparative advantage. Manch. Sch. Econ. Soc. Stud. 1965, 33, 92–123. [Google Scholar]
- The World Bank. Tourism in Africa: Harnessing Tourism for Growth and Improved Livelihoods. 2013. Available online: http://www.worldbank.org/content/dam/Worldbank/document/Africa/Report/africa-tourism-report-2013-overview.pdf (accessed on 20 December 2014).
- Krstic, B.; Jovanovic, S.; Jankovic-Milic, V.; Stanisic, T. Examination of travel and tourism competitiveness contribution to national economy competitiveness of sub-Saharan Africa countries. Dev. S. Afr. 2016, 33, 470–485. [Google Scholar] [CrossRef]
- González-Rodríguez, M.R.; Díaz-Fernández, M.C.; Pulido-Pavón, N. Tourist destination competitiveness: An international approach through the travel and tourism competitiveness index. Tour. Manag. Perspect. 2023, 47, 101127. [Google Scholar] [CrossRef]
- Webster, A.; Fletcher, J.; Hardwick, P.; Morakabati, Y. Tourism and Empirical Applications of International Trade Theory: A Multi-Country Analysis. Tour. Econ. 2007, 13, 657–674. [Google Scholar] [CrossRef]
- Yu, R.; Cai, J.; Leung, P. The normalized revealed comparative advantage index. Ann. Reg. Sci. 2009, 43, 267–282. [Google Scholar] [CrossRef]
- Bogale, M.; Ayalew, M.; Mengesha, W. The Competitiveness of Travel and Tourism Industry of Sub-Saharan African Countries in the World Market. Afr. J. Hosp. Tour. Leis. 2021, 10, 131–144. [Google Scholar] [CrossRef]
- Jackman, M.; Lorde, T.; Lowe, S.; Alleyne, A. Evaluating tourism competitiveness of small island developing states: A revealed comparative advantage approach. Anatolia 2011, 22, 350–360. [Google Scholar] [CrossRef]
- Navickas, V.; Malakauskaite, A. The possibilities for the identification and evaluation of tourism sector competitiveness factors. Eng. Econ. 2009, 61, 37–43. [Google Scholar]
- Fourie, J. Evaluating Africa’s Comparative Advantage in Travel Service Exports; Stellenbosch Economic Working Papers: 06/09; Dept. of Economics and the Bureau for Economic Research, University of Stellebosch: Stellenbosch, South Africa, 2009; Available online: https://core.ac.uk/download/pdf/6318461.pdf (accessed on 17 August 2023).
- Wondowossen, T.; Nakagoshi, N.; Yukio, Y.; Jongman, H.; Dawit, A. Competitiveness as an indicator of sustainable development of tourism: Applying destination competitiveness indicators to Ethiopia. J. Sustain. Dev. 2014, 6, 71–95. [Google Scholar]
- Rodyu, S.; Wetprasit, P. An Analysis of the Comparative Advantage of Thai Tourism with Chinese Tourists Compared to Other ASEAN + 6 Countries. Eur. J. Manag. Bus. Econ. 2018, 10, 160–182. [Google Scholar]
- Zeleke, A.F.; Biwota, S.M. Factors affecting tourism competitiveness of Ethiopia: International tourist destination choice perspective. J. Hosp. Tour. Manag. 2020, 9, 446–459. [Google Scholar]
- Labanauskaitė, D.; Gedvilas, E. Lithuanian tourism competitiveness in the context of Baltic States. RURDS Rev. Urb. Reg. Dev. Stud. 2013, 10, 111–122. [Google Scholar]
- Majidli, F. International Comparative and Competitive Advantage of Post-Soviet Countries in Tourism. Res. World Econ. 2020, 11, 369–379. [Google Scholar] [CrossRef]
- Le, N.H. International trade in travel of selected ASEAN nations from comparative advantage theory and value-added trade approach. Proc. Next Gener. Glob. Workshop 2020, 13, 1–16. [Google Scholar] [CrossRef]
- FAOSTAT-QA Database. 2023. Available online: https://www.fao.org/faostat/en/#data/QA (accessed on 12 January 2023).
- Okech, R.; Kieti, D.; van der Duim, V.R. (Eds.) Tourism, Climate Change and Biodiversity in Sub-Saharan Africa; African Studies Centre Leiden (ASCL): Leiden, The Netherlands, 2022; Volume 46, Available online: https://hdl.handle.net/1887/3514070 (accessed on 25 February 2023).
- Altes, C. Analysis of Tourism Value Chain in Ethiopia—Final Report; CBI-Ministry of Foreign Affairs: Nairobi, Ethiopia, 2018. [Google Scholar]
- UNESCO World Heritage Convention. United Republic of Tanzania. Available online: https://whc.unesco.org/en/statesparties/tz (accessed on 17 August 2023).
- Lwoga, N.B.; Cultural Heritage Tourism and the Community in Tanzania. Lecture. Department of Archaeology and Heritage Studies, University of Dar es Salaam, Tanzania. Available online: https://heritagestudies.eu/wp-content/uploads/2017/08/3.2-NLwoga_final_clean_13.10.pdf (accessed on 17 August 2023).
- Wineaster, A. Cultural tourism and poverty alleviation in rural Kilimanjaro, Tanzania. J. Tour. Cult. Chang. 2015, 13, 208–224. [Google Scholar] [CrossRef]
- Mgonja, J.T.; Sirima, A.; Backman, K.F.; Backman, S.J. Cultural community-based tourism in Tanzania: Lessons learned and way forward. Dev. S. Afr 2015, 32, 377–391. [Google Scholar] [CrossRef]
- Kalavar, J.M.; Buzinde, C.N.; Melubo, K.; Simon, J. Intergenerational Differences in Perceptions of Heritage Tourism Among the Maasai of Tanzania. J. Cross Cult. Gerontol. 2014, 29, 53–67. [Google Scholar] [CrossRef]
- UNESCO World Heritage Convention. Uganda. Available online: https://whc.unesco.org/en/statesparties/ug (accessed on 17 August 2023).
- Ahebwa, W.M.; Aporu, J.P.; Nyakaana, J.B. Bridging community livelihoods and cultural conservation through tourism: Case study of Kabaka heritage trail in Uganda. Tour. Hosp. Res. 2016, 16, 103–115. [Google Scholar] [CrossRef]
- Mafukata, M.A.; Khan, A.; Moseki, M. Developing a Viable Cultural Heritage Tourism Site at the Tombs of the Masingo at Swongozwi: Lessons Drawn from the Muzibu-Azaala-Mpanga, Kasubi, Uganda. Afr. J. Hosp. Tour. 2021, 10, 1257–1274. [Google Scholar] [CrossRef]
- FAOSTAT-MK Database. 2023. Available online: https://www.fao.org/faostat/en/#data/MK (accessed on 19 February 2023).
- Wassie, S.B. Natural resource degradation tendencies in Ethiopia: A review. Environ. Syst. Res. 2020, 9, 33. [Google Scholar] [CrossRef]
- IUNC. Pastoralism in Ethiopia: Its Total Economic Values and Development Challenges; IUNC: Gland, Switzerland; UNEP: Nairobi, Kenya, 2006. [Google Scholar]
- UNESCO World Heritage Convention, Ethiopia. Available online: https://whc.unesco.org/en/statesparties/et/ (accessed on 17 August 2023).
- Worku Tadesse, G. Heritage resources as a driver of cultural tourism development in Ethiopia: A review. Cogent Arts Humanit. 2023, 10, 2158623. [Google Scholar] [CrossRef]
- ELCI. Pastoralism as a Conservation Strategy and Contributor to Livelihood Security—Kenya Country Study; Environment Liaison Centre International (ELCI): Bruxelles, MB, Canada, 2006. [Google Scholar]
- UNESCO. World Heritage Covenant. Kenya. Available online: https://whc.unesco.org/en/statesparties/ke (accessed on 17 August 2023).
- Akama, J. The Creation of the Maasai Image and Tourism Development. In Kenya Cultural tourism in Africa: Strategies for the new millennium, Proceedings of the ATLAS Africa International Conference, Mombasa, Kenya, 1 December 2000; Akama, J., Sterry, P., Eds.; Association for Tourism and Leisure Education: Arnhem The Netherlands, 2022; pp. 43–53. ISBN 90-75775-12-1. Available online: http://www.atlas-euro.org/pages/pdf/Cultural%20tourism%20in%20Africa%20Deel%201.pdf (accessed on 17 August 2023).
- Wahome, E.W.; Gathungu, J.J.W. Redefining Sustainability in the Conservation and Promotion of the Cultural Heritage Tourism Product in Kenya. In Tourism Destination Management in a Post-Pandemic Context (Tourism Security-Safety and Post Conflict Destinations); Gowreesunkar, V.G., Maingi, S.W., Roy, H., Micera, R., Eds.; Emerald Publishing Limited: Bingley, UK, 2021; pp. 257–271. [Google Scholar] [CrossRef]
- Reisinger, Y.; Michael, N.; Hayes, J.P. Destination competitiveness from a tourist perspective: A case of the United Arab Emirates. Int. J. Tour. Res. 2019, 21, 259–279. [Google Scholar] [CrossRef]
- Bacsi, Z.; Gebbisa, M.B.; Dávid, L.D.; Hollósy, Z. Pastoralism and Tourism in Eastern Africa—Quantitative Analysis from 2004 to 2018. Sustainability 2023, 15, 9723. [Google Scholar] [CrossRef]
- Rodríguez-Díaz, B.; Pulido-Fernández, J.I. Sustainability as a Key Factor in Tourism Competitiveness: A Global Analysis. Sustainability 2020, 12, 51. [Google Scholar] [CrossRef]
- Goffi, G.; Cucculelli, M.; Masiero, L. Fostering tourism destination competitiveness in developing countries: The role of sustainability. J. Clean. Prod. 2019, 209, 101–115. [Google Scholar] [CrossRef]


| Ethiopia | Kenya | Uganda | Tanzania | |||||
|---|---|---|---|---|---|---|---|---|
| Year | 2005 | 2017 | 2005 | 2017 | 2005 | 2017 | 2005 | 2017 |
| GDP, billion USD | 48.9 | 215.1 | 78.3 | 211.1 | 41.8 | 85.4 | 60.8 | 134.2 |
| Total population million | 77.5 | 108.2 | 35.8 | 48.9 | 27.9 | 40.1 | 39.4 | 56.3 |
| Area, thousand km2 | 1129 | 1129 | 569 | 569 | 200 | 200 | 886 | 886 |
| International arrivals, million | 0.227 | 0.933 | 1.479 | 1.449 | 0.468 | 1.402 | 0.613 | 1.327 |
| Int’l tourism receipts, billion USD | 0.533 | 2.500 | 0.969 | 1.560 | 0.382 | 0.954 | 0.835 | 2.270 |
| Tourism receipts as % of GDP | 1.09 | 1.16 | 1.24 | 0.74 | 0.91 | 1.12 | 1.37 | 1.69 |
| Tourism value-added as % of GDP | 6.78 | 6.30 | 12.20 | 8.80 | 9.20 | 5.90 | 9.70 | 10.60 |
| TTCI (score on 1–7 scale) | 3.3 | 3.02 | 3.62 | 3.63 | 3.56 | 3.19 | 3.86 | 3.43 |
| Natural resources (score on 1–7 scale) | 4.2 | 3.01 | 4.5 | 4.45 | 5.1 | 3.7 | 6.1 | 4.75 |
| Number of cultural WHS | 6 | 7 | 1 | 4 | 1 | 1 | 2 | 3 |
| Number of natural WHS | 1 | 1 | 2 | 3 | 2 | 2 | 3 | 3 |
| Protected areas, as % of total land area | 11.06 | 11.06 | 11.40 | 11.40 | 48.20 | 48.20 | 17.80 | 17.80 |
| N | Minimum | Maximum | Mean | Std. Dev. | |
|---|---|---|---|---|---|
| GDP per capita (USD) | 28 | 305.98 | 1550.20 | 868.29 | 346.47 |
| Arriv, (persons) | 28 | 227,000 | 1,823,000 | 1,008,036 | 440,436 |
| Receipt (USD), million | 25 | 562.146 | 2525.187 | 1616.440 | 618.108 |
| RecPct (%) | 25 | 1.91 | 5.78 | 3.76 | 1.018 |
| RCA | 28 | 2.11 | 5.970 | 3.780 | 1.117 |
| TTCI | 28 | 3.020 | 3.900 | 3.40286 | 0.219981 |
| P13_NatRes | 28 | 2.99 | 6.10 | 4.566 | 0.8562 |
| P14_CultRes | 28 | 1.25 | 5.00 | 1.963 | 1.009 |
| P12_TourInf | 28 | 1.30 | 3.30 | 2.151 | 0.5950 |
| P11_GrouInf | 28 | 2.10 | 3.40 | 2.779 | 0.3352 |
| Kolmogorov–Smirnov | Shapiro–Wilk | |||||
|---|---|---|---|---|---|---|
| Statistic | df | Sig. | Statistic | df | Sig. | |
| P11_GrouInf | 0.151 | 22 | 0.200 | 0.952 | 22 | 0.352 |
| P12_TourInf | 0.132 | 22 | 0.200 | 0.953 | 22 | 0.357 |
| P13_NatRes | 0.178 | 22 | 0.068 | 0.943 | 22 | 0.230 |
| P14_CultRes | 0.166 | 22 | 0.119 | 0.895 | 22 | 0.024 |
| TTCI | 0.165 | 22 | 0.123 | 0.939 | 22 | 0.191 |
| Arriv | 0.115 | 22 | 0.200 | 0.961 | 22 | 0.501 |
| RCA | 0.173 | 22 | 0.085 | 0.898 | 22 | 0.027 |
| Tourism RCA | Ethiopia | Kenya | Tanzania | Uganda |
|---|---|---|---|---|
| 2000 | 2.9377 | 2.5615 | 3.9806 | |
| 2001 | 3.1846 | 2.5368 | 5.0504 | 3.8958 |
| 2002 | 3.5373 | 2.3004 | 4.8503 | 3.9801 |
| 2003 | 4.1467 | 2.6625 | 4.6826 | 3.4442 |
| 2004 | 4.3035 | 2.9518 | 4.6097 | 3.7447 |
| 2005 | 4.3014 | 2.8244 | 4.3753 | 3.8574 |
| 2006 | 4.8485 | 3.3134 | 4.7735 | 3.3579 |
| 2007 | 5.0252 | 3.6129 | 4.9918 | 2.7907 |
| 2008 | 5.9477 | 2.9608 | 4.0704 | 3.0961 |
| 2009 | 5.0385 | 2.3505 | 3.5727 | 3.1452 |
| 2010 | 5.1259 | 2.9938 | 3.3332 | 3.8390 |
| 2011 | 5.9592 | 3.2176 | 3.2514 | 3.9532 |
| 2012 | 5.6735 | 3.0722 | 3.4730 | 4.0267 |
| 2013 | 5.9746 | 2.7228 | 3.7459 | 3.1813 |
| 2014 | 5.1801 | 2.4366 | 3.7559 | 3.1493 |
| 2015 | 5.4240 | 2.1510 | 3.3386 | 3.1716 |
| 2016 | 5.0356 | 2.0654 | 3.5277 | 3.2153 |
| 2017 | 5.3117 | 2.1068 | 3.8213 | 2.6352 |
| 2018 | 6.6155 | 2.1931 | 4.2183 | 3.6489 |
| 2019 | 6.3080 | 2.0834 | 3.6857 | 3.0768 |
| Spearman’s Rho | Arriv | GDP per Cap | Receipt | RecPct | RCA | TTCI | P11_GrouInf | P12_TourInf | P13_NatRes |
|---|---|---|---|---|---|---|---|---|---|
| Arriv | 1.0 | ||||||||
| GDP per Cap | 0.917 ** | 1.0 | |||||||
| Receipt | 0.219 | 0.108 | 1.0 | ||||||
| RecPct | −0.277 | −0.315 | 0.506 ** | 1.0 | |||||
| RCA | −0.639 ** | −0.764 ** | 0.390 | 0.593 ** | 1.0 | ||||
| TTCI | 0.361 | 0.542 ** | −0.024 | 0.150 | −0.422 * | 1.0 | |||
| P11_GrouInf | 0.368 | 0.466 * | 0.063 | −0.119 | −0.360 | 0.607 ** | 1.0 | ||
| P12_TourInf | 0.685 ** | 0.744 ** | 0.093 * | −0.326 | −0.581 ** | 0.234 | 0.344 | 1.0 | |
| P13_NatRes | −0.038 | 0.197 | −0.214 | 0.315 | −0.137 | 0.722 ** | 0.276 | −0.081 | 1.0 |
| P14_CultRes | −0.447 * | −0.393 * | 0.127 | 0.223 | 0.270 | 0.020 | −0.052 | −0.247 | 0.066 |
| by county | Ethiopia | Kenya | Tanzania | Uganda | |||||
| TTCI vs. RCA | −0.356 | 0.252 | 0.357 | 0.334 |
| Information Criteria | Model 1 | Model 2 | Model 3 | ||||||
|---|---|---|---|---|---|---|---|---|---|
| Akaike’s (AIC) | 90.060 | 66.175 | 63.732 | ||||||
| Schwarz’s Bayesian (BIC) | 92.652 | 75.501 | 65.914 | ||||||
| Fixed effects | Estimate | Std. Err | Sig. | Estimate | Std. Err | Sig. | Estimate | Std. Err | Sig. |
| TTCI | −2.01747 | 0.84916 | 0.025 | ||||||
| P13_NatRes | 1.26094 | 0.20935 | 0.000 | 2.4409 | 0.6276 | 0.001 | |||
| P14_CultRes | −0.68477 | 0.41263 | 0.109 | −2.45837 | 0.90736 | 0.013 | |||
| P12_TourInf | 1.95540 | 0.49916 | 0.001 | −0.33433 | 0.27462 | 0.236 | |||
| P12_TourInf × P13_NatRes | −0.65043 | 0.15030 | 0.000 | ||||||
| P12_TourInf × P14_CultRes | 0.35484 | 0.19536 | 0.082 | ||||||
| P11_GrouInf | 1.57854 | 0.61209 | 0.018 | ||||||
| P11_GrouInf × P13_NatRes | −0.86308 | 0.22057 | 0.001 | ||||||
| P11_GrouInf × P14_CultRes | 0.87699 | 0.31463 | 0.011 | ||||||
| Residual | 1.03685 | 0.28757 | 0.000 | 0.23978 | 0.07025 | 0.001 | 0.26132 | 0.08539 | 0.002 |
Disclaimer/Publisher’s Note: The statements, opinions and data contained in all publications are solely those of the individual author(s) and contributor(s) and not of MDPI and/or the editor(s). MDPI and/or the editor(s) disclaim responsibility for any injury to people or property resulting from any ideas, methods, instructions or products referred to in the content. |
© 2023 by the authors. Licensee MDPI, Basel, Switzerland. This article is an open access article distributed under the terms and conditions of the Creative Commons Attribution (CC BY) license (https://creativecommons.org/licenses/by/4.0/).
Share and Cite
Bacsi, Z.; Yasin, A.S.; Bánhegyi, G. Tourism Competitiveness in Eastern Africa: RCA and TTCI. Heritage 2023, 6, 5997-6015. https://doi.org/10.3390/heritage6090316
Bacsi Z, Yasin AS, Bánhegyi G. Tourism Competitiveness in Eastern Africa: RCA and TTCI. Heritage. 2023; 6(9):5997-6015. https://doi.org/10.3390/heritage6090316
Chicago/Turabian StyleBacsi, Zsuzsanna, Abdi Shukri Yasin, and Gabriella Bánhegyi. 2023. "Tourism Competitiveness in Eastern Africa: RCA and TTCI" Heritage 6, no. 9: 5997-6015. https://doi.org/10.3390/heritage6090316
APA StyleBacsi, Z., Yasin, A. S., & Bánhegyi, G. (2023). Tourism Competitiveness in Eastern Africa: RCA and TTCI. Heritage, 6(9), 5997-6015. https://doi.org/10.3390/heritage6090316