Article

Structured-Light Scanning and Metrological Analysis for Archaeology: Quality Assessment of Artec 3D Solutions for Cuneiform Tablets

Historical Studies Department, University of Turin, Via Sant’Ottavio 20, 10124 Torino, Italy
Heritage 2023, 6(9), 6016-6034; https://doi.org/10.3390/heritage6090317
Submission received: 31 July 2023 / Revised: 20 August 2023 / Accepted: 21 August 2023 / Published: 24 August 2023
(This article belongs to the Special Issue Non-invasive Technologies Applied in Cultural Heritage)

Abstract

:
This paper deals with a metrological and qualitative evaluation of the Artec 3D structured-light scanners: Micro and Space Spider. As part of a larger European project called ITSERR, these scanners are tested to reconstruct small archaeological artefacts, in particular cuneiform tablets with different dimensions. For this reason, Micro and Space Spider are compared in terms of the entire workflow, from preparatory work to post-processing. In this context, three cuneiform replica tablets will serve as examples on which the Artec scanners will have to prove their worth. Metric analyses based on distance maps, RMSe calculations and density analyses will be carried out to understand metrological differences between these tools. The creation of 3D models of cuneiform tablets is the first step in developing a virtual environment suitable for sharing the archaeological collection with collaborators and other users. The inclusion of semantic information through specific ontologies will be the next step in this important project.

1. Introduction

This manuscript explores the possibilities that the latest optical scanning technologies can offer for the high-quality 3D digitization of small archaeological finds. This research is part of a European Project called ITSERR—Italian Strengthening of ESFRI RI Resilience [1]. ITSERR was developed to strengthen the existing ESFRI RI RESILIENCE project, which supports the needs of the Religious Studies scientific community with a higher level of involvement in technology. In this scenario, the dedicated Work Package (TAURUS—University of Turin, project manager Prof. Stefano De Martino) aims to develop a software toolkit for 3D visualization and fruition of historical heritage artefacts and materials. The toolkit is intended for specialized researchers in the field of Religious Studies and Archaeology: in fact, main actors to be analysed and digitalized are related to cuneiform tablets, seals and sealings from the Near East/Western Asia [1].
This project focuses not only on the faithful and metrological 3D reconstruction of archaeological artefacts (especially cuneiform tablets), but also on the inclusion of important semantic metadata in dedicated open-access repositories [2,3,4]. Then, the creation of Common Data Environments (CDEs) for Digital Informative Twins [5,6] will be the future focus of the project. CDEs are briefly related to virtual/online spaces on which there is sharing of 3D models and their semantic data among stakeholders. As it happens with BIM and HBIM [6], the inclusion of semantic data into CDEs is fundamental for obtaining informative twin models of the original archaeological artefacts. This will ensure proper further development and implementation of models as well as related information.
Why the 3D digitization of cuneiform tablets? Cuneiform tablets are referred to as important written documents based on complex inscriptions on clay material (raw and cooked). The inscriptions and signs of the instruments could be linear, simple and chaotic due to the amount of text and the available space on the surfaces. At the same time, tablets are witnesses of stories and important events: tablets enclose semantic information on society, politics and social life. Digitization methods (including 3D reconstruction) help to transcribe cuneiform characters and signs, and are also essential for the identifying evidence and traces that are normally invisible to the human eye. For this reason, these particular archaeological finds represent significant historical and sensitive data to be preserved, digitalized and collected inside informative and collaborative virtual platforms [7,8,9,10].
The presented analysis is based on the metrological comparison of two different structured-light scanners designed for similar purposes, even if they are built for opposing scenarios. The presented benchmark and metric evaluation compare Artec 3D scanners: Micro and Space Spider [11].
In this research, Artec 3D scanners are being tested to reconstruct cuneiform replica tablets coming from museums, especially from the University of Pennsylvania Museum of Archaeology and Anthropology—©UPM. The main operative workflow began with the preliminary steps, from scanner calibration to light and object setup, to post-processing mandatory operations, and from alignment to metric analyses (Figure 1). Scanning replicas will be used to understand how these scanners work and how far they can go in terms of precision and accuracy from the perspective of the ITSERR project.
Depending on different purposes, several methodologies can be applied to the digitization and virtual reconstruction of cuneiform tablets.
In addition to the structured-light scanning methodology, widely described in the following chapter, particular analyses can be carried out by creating high-quality 2D/2D+ images (also including High Dynamic Range—HDR filter) for helping transcription and transliteration of cuneiform texts. These images can be obtained with highly detailed photos, orthophotos and ortho-mosaics. At the same time, images are fundamental for producing photogrammetric and micro-photogrammetric surveys on tablets. Although the photogrammetric approach can be extremely lengthy and complex for small objects, it can produce excellent results in terms of precision and radiometric accuracy (RGB value).
Furthermore, ad hoc image-based systems for cuneiform tablets digitization can be inscribed inside this panorama: for example, the Portable Light Dome system (developed at the Katholieke Universiteit Leuven in Belgium) focuses on a hemisphere with LED lights and an on-board camera for acquiring photographs and creating 2D+ models [12,13].
Reflectance Transformation Imaging (RTI) technology, based on dynamic digitally controlled illumination, aids in the digital analysis of archaeological artefacts: the manipulation of light sources (especially light impact angles) and related casted shadows is fundamental for recording almost invisible micrometric evidence. In this scenario, important analyses are present in the literature [14,15,16].
For specific analyses, these methods are not equally useful to achieve the given objective: methods and tools have to be chosen based on their specifications and final outputs. The instruments must be adapted to the research analysis and not the opposite.
When possible, the metric comparison and the flexible integration of different techniques should be key points for achieving better results on specific analyses through virtual digitization [17].

2. Materials and Methods

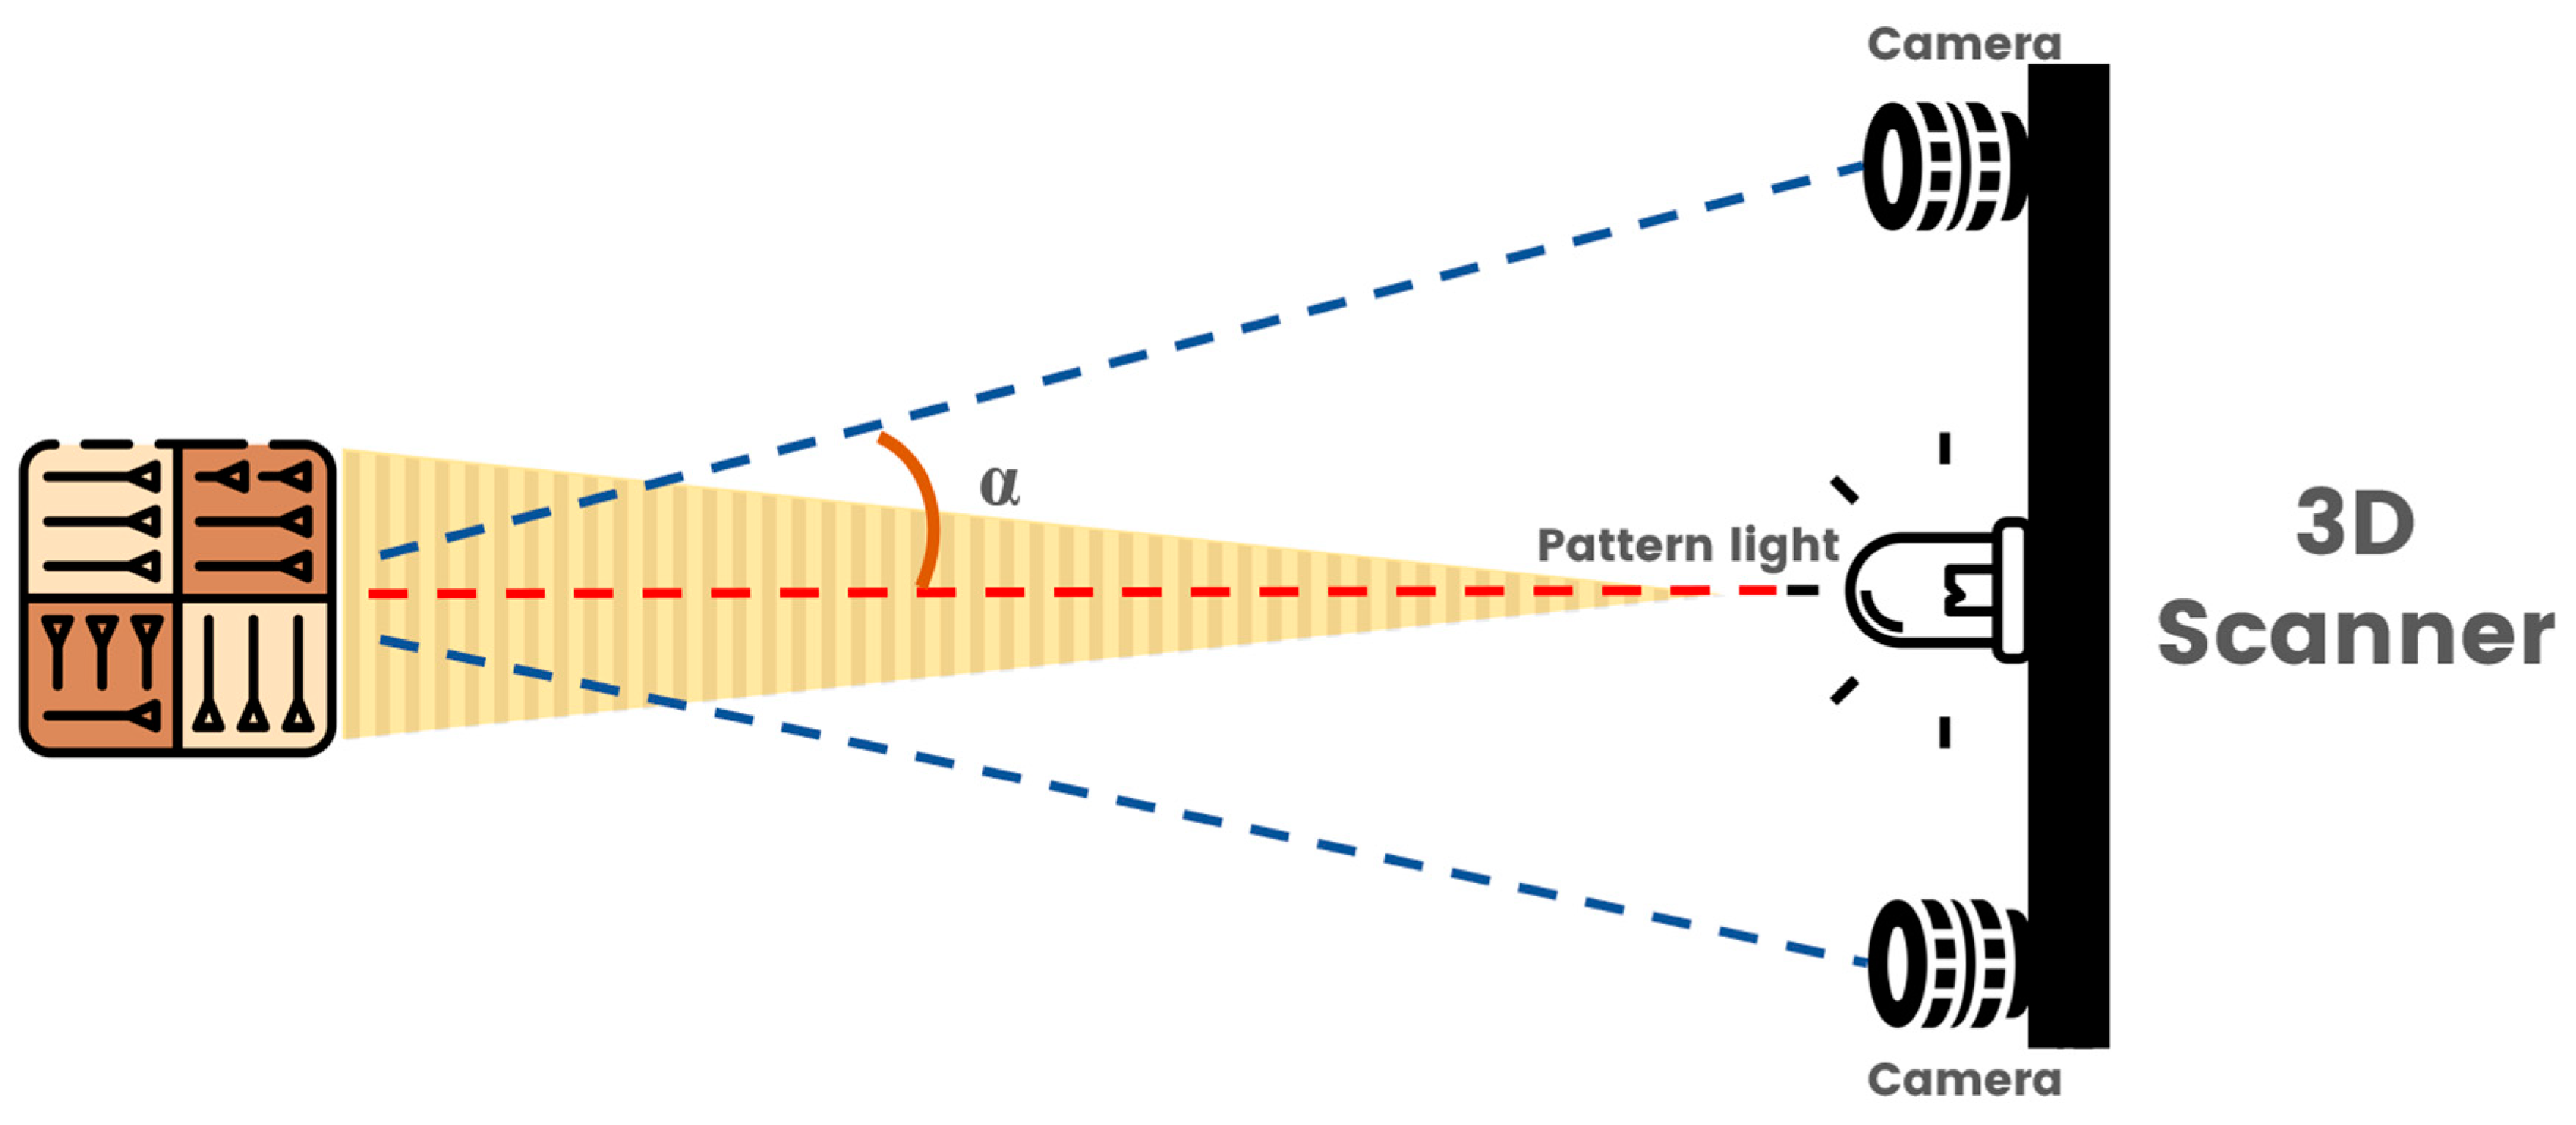
2.1. Structured-Light Scanning

Structured-light scanners (SLS) are non-invasive instruments that, unlike touch trigger probes, digitally acquire objects without touching them. Detector probes, based on radio-waves, are extremely precise and valuable instruments for surveying industrial and mechanical components with micrometric accuracy. However, these instruments are designed for directly touching objects: by approaching a workpiece surface, the stylus detector deflects and a trigger radio signal is transmitted to the receiver and then converted into an electric signal. For this reason, this category of detectors cannot be applied to heritage assets as well as fragile archaeological finds.
Being non-invasive, the SLS is widely applied to the cultural heritage domain, having incredible positive results: during the last ten years, SLS-based 3D reconstruction of archaeological artefacts and pieces of evidence experienced an incredible interest, especially for creating virtual environments and for sharing knowledge [18,19,20,21]. SLS can achieve incredible 3D accuracy and precision for digitalizing complex objects and artefacts, but the creation control and replicability of the process are still challenging [22]. Although it is well established for heritage digitization, the SLS technique is constantly at the centre of sensors innovation and improvement.
SLS is based on light pattern emission—a LED source—with a grid for capturing deformations on the object: depending on light deformations on the object, the scanner can record distances and angles for reconstructing the volumetric morphology of the object. The projected light pattern can be linear (one-dimensional) or a squared grid (two-dimensional) and may also be white or blue. Structured-light scanners have camera sensors for recording shapes of the lines, acquiring radiometry, as well as for stereoscopic acquisition. Having almost a camera and lens, the calibration process is mostly a mandatory operation to be conducted for accuracy and precision control [23].
The operative principle is, therefore, based on trigonometric triangulation between the light source, the camera and the object (Figure 2). Consequently, the scanner reads and calculates the triangulation angle (α) generated by the three elements [19]. Depending on particular situations, SLS could also be affected by the environment illumination and related shadows [24]. At the same time, the configuration of the onboard camera and the related distance plays a fundamental role in optical scanning: depending on distances and focal length, the SLS could achieve different results [25].
Going deeper, SLS outputs are 3D meshes based on the triangulated irregular network (TIN): unlike laser scanners, polygonal surfaces are automatically generated instead of point clouds. Then, the most common file formats are STL for non-textured models, and OBJ for textured models (including MTL and texture files).

2.2. Artec Micro

Artec Micro is a small-size desktop scanner based on blue structured light (Figure 3A). Thanks to its fixed sensors and the roto-tilting arm, Artec Micro is completely automatic in its scanning operations. However, the roto-tilting movement can be also managed and customized by using preliminary scan options on Artec Studio software (v. 17.0).
The instrument is designed for a very small object, especially used in jewellery and dentistry, and for this reason, it is incredibly accurate in its scanning operation: it can achieve up to 0.01 mm of 3D accuracy, while the final resolution of digital outputs is 0.029 mm (Table 1). These values make the Artec Micro one of the most precise and accurate metrological 3D scanners.
Being a micrometric and precise instrument, the Artec Micro requires the preliminary camera calibration phase. The calibration step (including improvement and corrections) is fundamental in nearly all optical scanners [25,26]. This process is based on the 3D scanning of a calibrated grid/chessboard for estimating and fixing the radial and tangential distortions of the equipped lens.
Regarding the acquisition phase, there are limitations on object dimension: Artec Micro was designed for objects having a maximum dimension of 60 mm × 90 mm; objects bigger than this limitation could not be surveyed properly and they might even bang on the internal walls.
Micro is based on quick frame capturing: in fact, the scanning speed reaches 30 frames per second. Furthermore, the onboard camera has 6.4 megapixels for capturing colours and textures.
Furthermore, objects having reflective surfaces could be hardly acquired by the instrument, unless a matting agent is used. This could be an important limitation for archaeological artefacts even if the agent is delicate, invisible and removable.

2.3. Artec Space Spider

Artec Space Spider is an optical handheld scanner based on blue light, designed for capturing small and medium objects having complex surfaces, sharp edges and details (Figure 3B). The flexibility and ease of use make this scanner perfect for archaeological assets and Digital Humanities analysis. The declared 3D point accuracy is 0.05 mm, while the 3D resolution of models reaches 0.1 mm (Table 1). For this reason, its application is wide: from industrial objects to mechanical components, from anatomical parts for medical analysis [27] to cultural heritage applications. Radiometric values (RGB colourimetric values) are correctly captured thanks to the built-in camera (1.3 megapixels). This sensor can acquire 8 frames per second. Being a manual 3D scanning, the acquisition phase is intended to be carried out by using the PC monitor connected to Artec Studio. The visual feedback is essential as a reference for the scanning area and for reducing the drift error caused by wrong distances.
Although the Space Spider can be used by rotating it around the object, with a converging path, a turntable makes the 3D acquisition easier and more precise: in fact, by rotating the object with the turntable, the Space Spider scans different surfaces automatically orienting frames. However, before the scanning operation, the initial warm-up is important to scan in the best possible way: the scanner should reach 36°/37° degrees for acquiring surfaces within the error range. At the same time, the environment should be properly illuminated [24], without shadows or other noisy elements.
During the acquisitions, right distances and scanning areas are graphically reported in a scale bar to the left of the Artec Studio monitor to correctly maintain the scanning trajectory.
Reflective surfaces could be hardly acquired by the instrument. However, during the preliminary scanning setup, the command complex surface scanning could be a proper solution to solve the reflectiveness issue by using a particular algorithm.
Whether Micro and Spider base their 3D scanning promptly, in just minutes, it is possible to acquire and reconstruct with micrometric precision every object, even if with complex surfaces or features. At the same time, they are compatible with a wide range of applications in reverse engineering and quality control. Artec 3D outputs can be easily exported and post-produced in CAD or CAM software for manipulating them and performing other specific analyses [11,28]. Furthermore, 3D models—exported from Artec Studio—are extremely suitable and compatible with high-quality 3D printing based on different materials.
Comparing 3D models from Micro and Spider is challenging: as recently described in the literature [29,30,31], these scanners produce similar outputs, but with micrometric differences. In this regard, the Space Spider—designed for small and medium objects—might work better when approaching the maximum limit of the Micro scanner. But, as we shall see going forward, this may not always be the case.

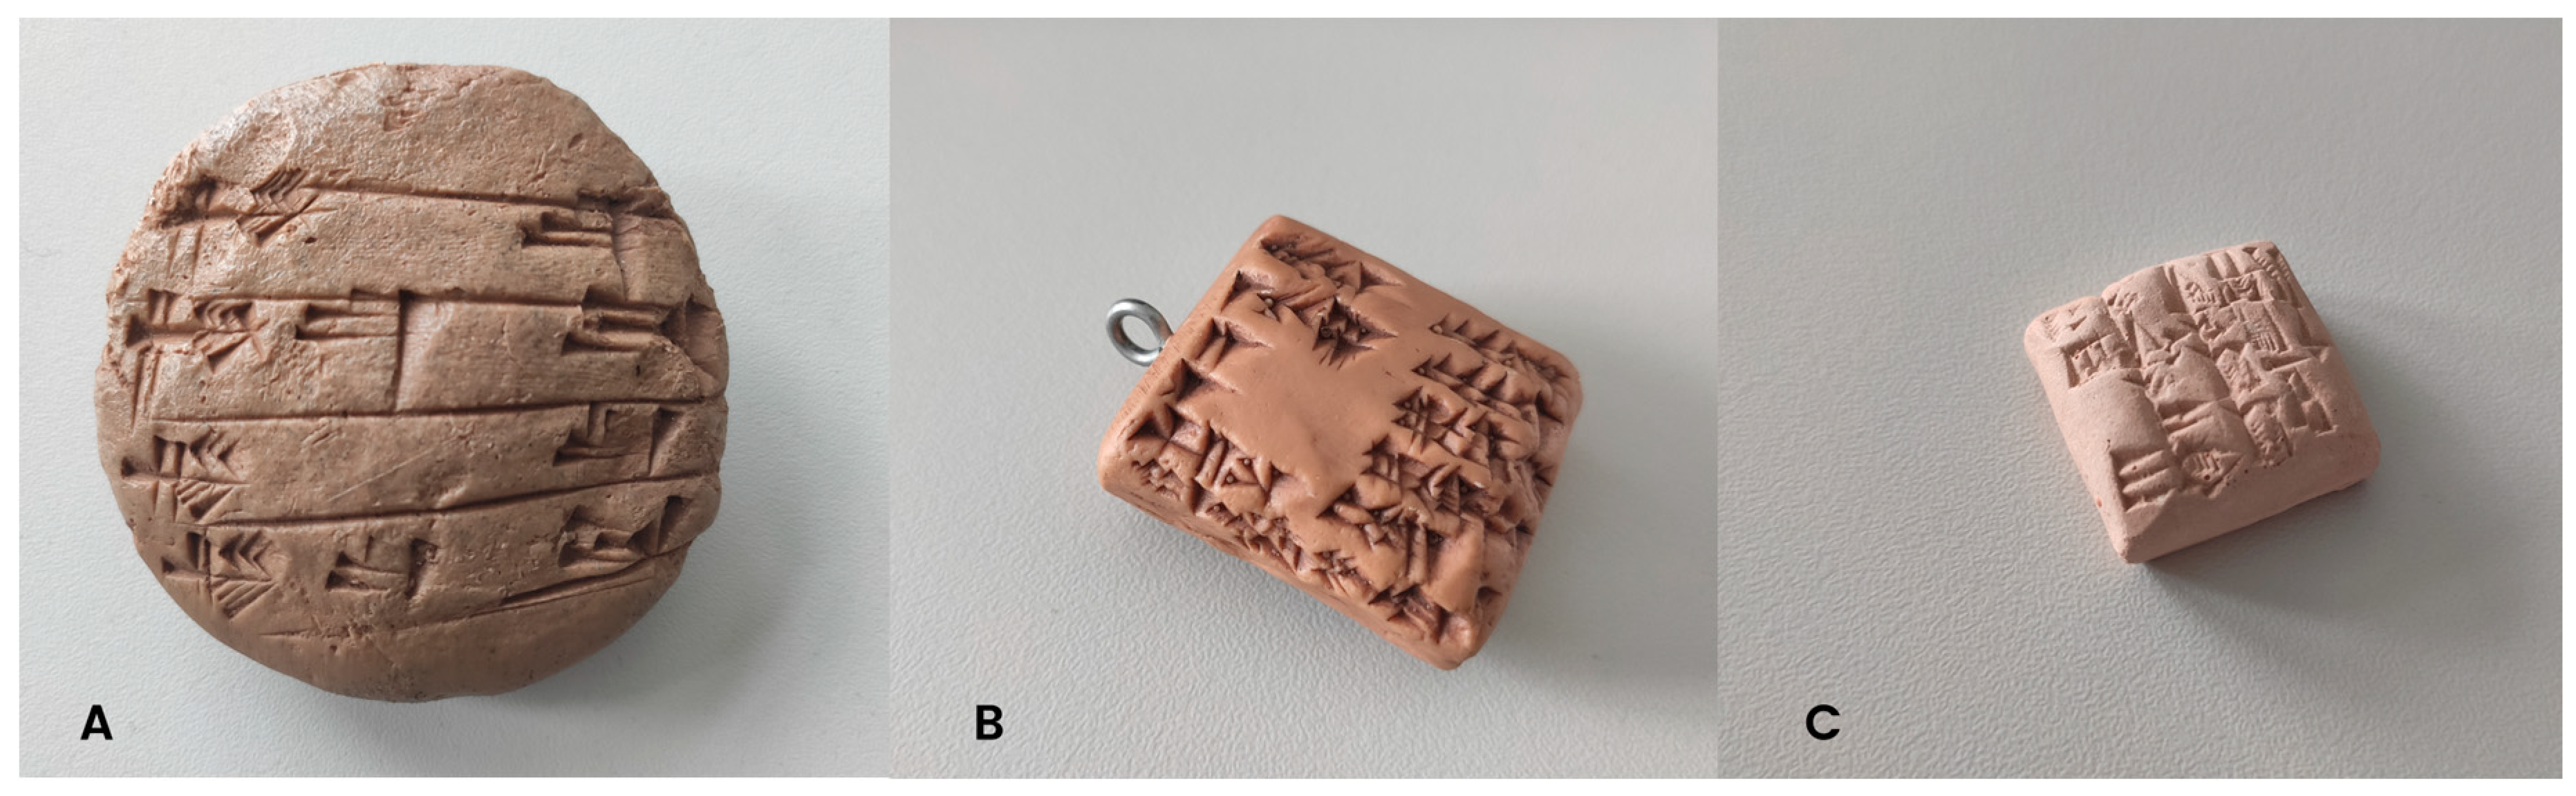
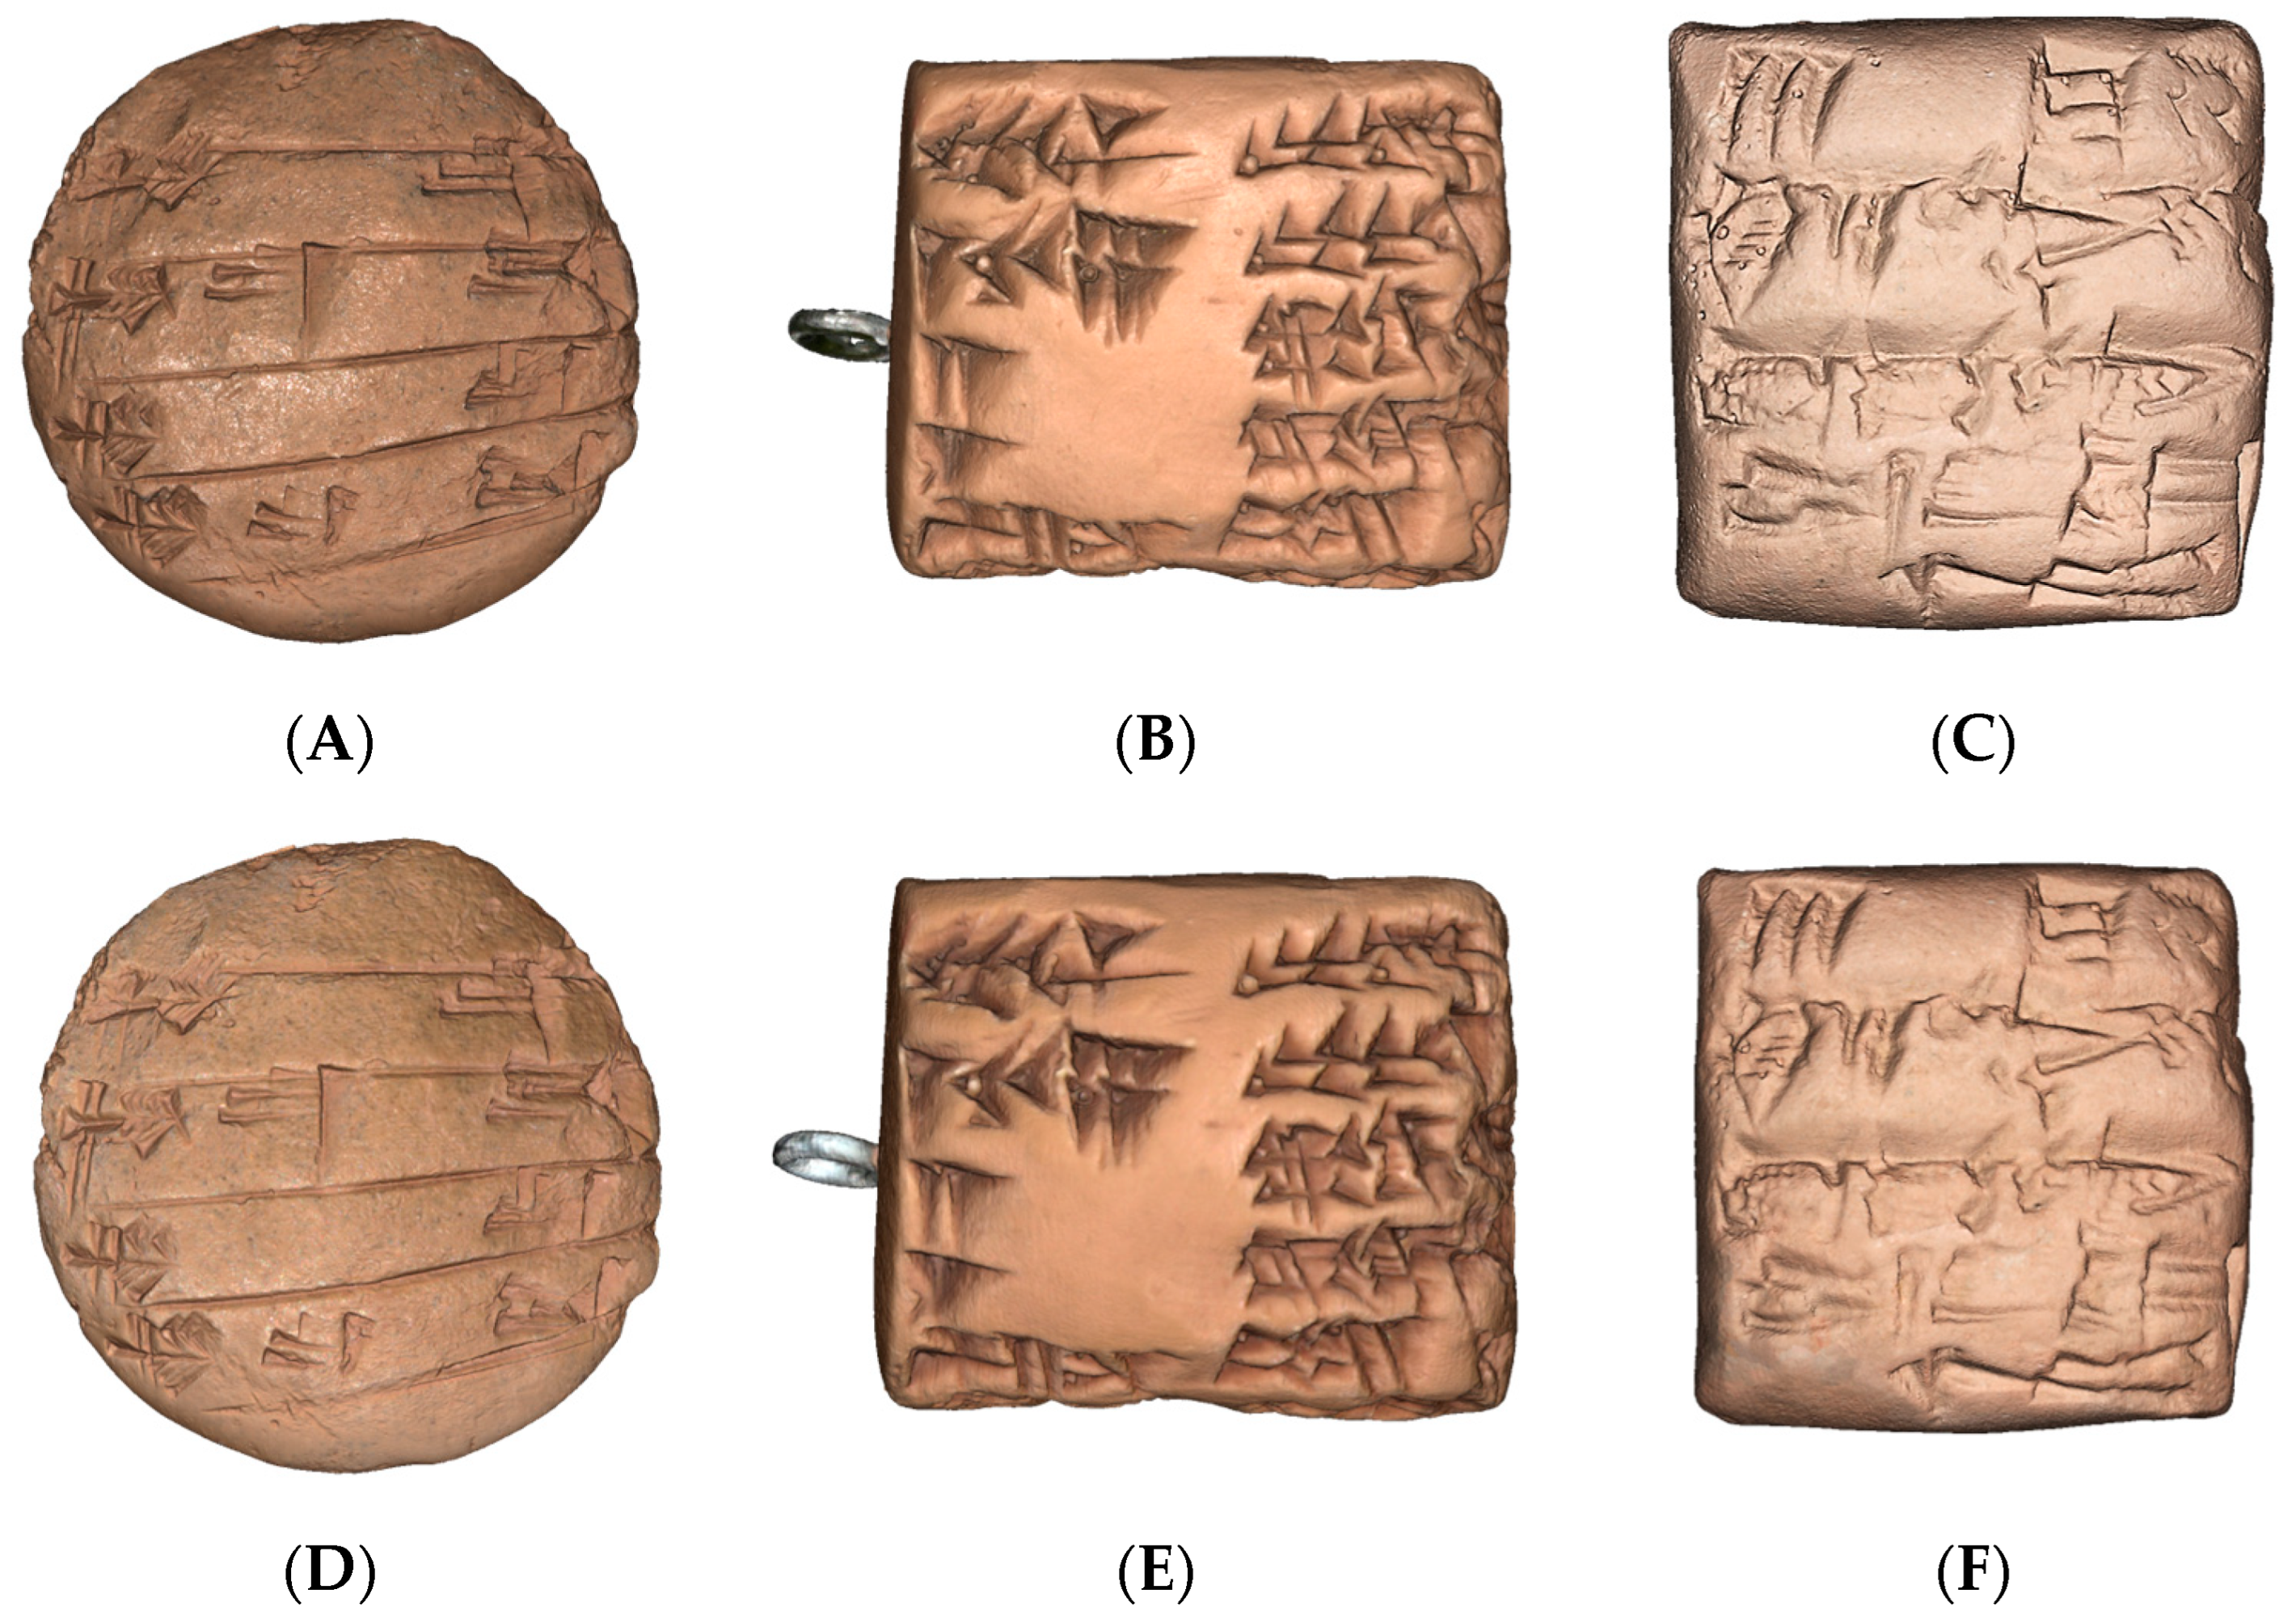
2.4. Cuneiform Replica Tablets

This analysis focuses on three examples of replica tablets. These tablets were selected to test Artec 3D scanner with objects having different dimensions, as well as for documenting different depths of wedge grooves.
The first example is a lenticular cuneiform replica tablet coming from the University of Pennsylvania Museum of Archaeology and Anthropology—©UPM (Figure 4A). It refers to a lenticular clay tablet recording a scribal exercise from the Old Babylonian period (from Nippur, modern Nuffar, in Iraq). Such tablets were used in the first stages of scribal education and typically include a few lines of a model text written by the teacher, followed by a copy of the same text by the pupil.
The tablet has the following dimensions: a diameter of 70 mm; max thickness of about 27 mm (centre of the tablet). Its dimensions are perfectly compatible with the Artec Micro possibility, though almost to the limit permitted by the instrument. This replica is principally composed of semi-glossy plastic material echoing the clay colouring.
Cuneiform signs can be found on the obverse, while on the reverse, there are erased traces of cuneiform signs. Signs have different depth values and the highest value is around 1.7 mm. This replica also shows micrometric details related to evidence of instruments.
The second example is referred to as a keychain replica of a cuneiform clay tablet, having a rectangular morphology, coming from the University of Pennsylvania Museum of Archaeology and Anthropology—©UPM (Figure 4B). It is an administrative document dated in the Middle Babylonian period (1595-1155 BCE) from Nippur (modern Nuffar, Iraq), recording an expenditure of different types of beer. The personal name mentioned in the last line of the reverse might correspond to that of the scribe who wrote the text.
This faithful reproduction has small dimensions: length of about 35 mm; width of about 30 mm; thickness of about 16 mm. The replica tablet is composed of two materials: semi-glossy plastic material for the body and a steel hook on the top. Cuneiform signs can be found on three of the six faces of the tablet, and they have micrometric depth: the biggest depth is about 1.0–1.5 mm. Despite it being a commercial replica, this tablet is fairly similar to the original, also showing fingerprints traces.
The third example is related to a squared replica tablet (Figure 4C) with the following dimensions: length of about 25 mm; width of about 25 mm; thickness of about 9 mm. The material is a mixture of plaster and resin. The analysed cuneiform inscriptions, very dense and numerous, are located on the recto of the tablet, while on the back, there is only the classification number. From a sematic point of view, it is an administrative tablet discovered at Umma (Tello Jokha), in southern Mesopotamia, and currently preserved at the Iraq Museum in Baghdad. It is written in Sumerian and dates to the last century of the third millennium BCE, i.e., to the time of the kingdom of the Third Dynasty of Ur.

2.5. Scanning Session

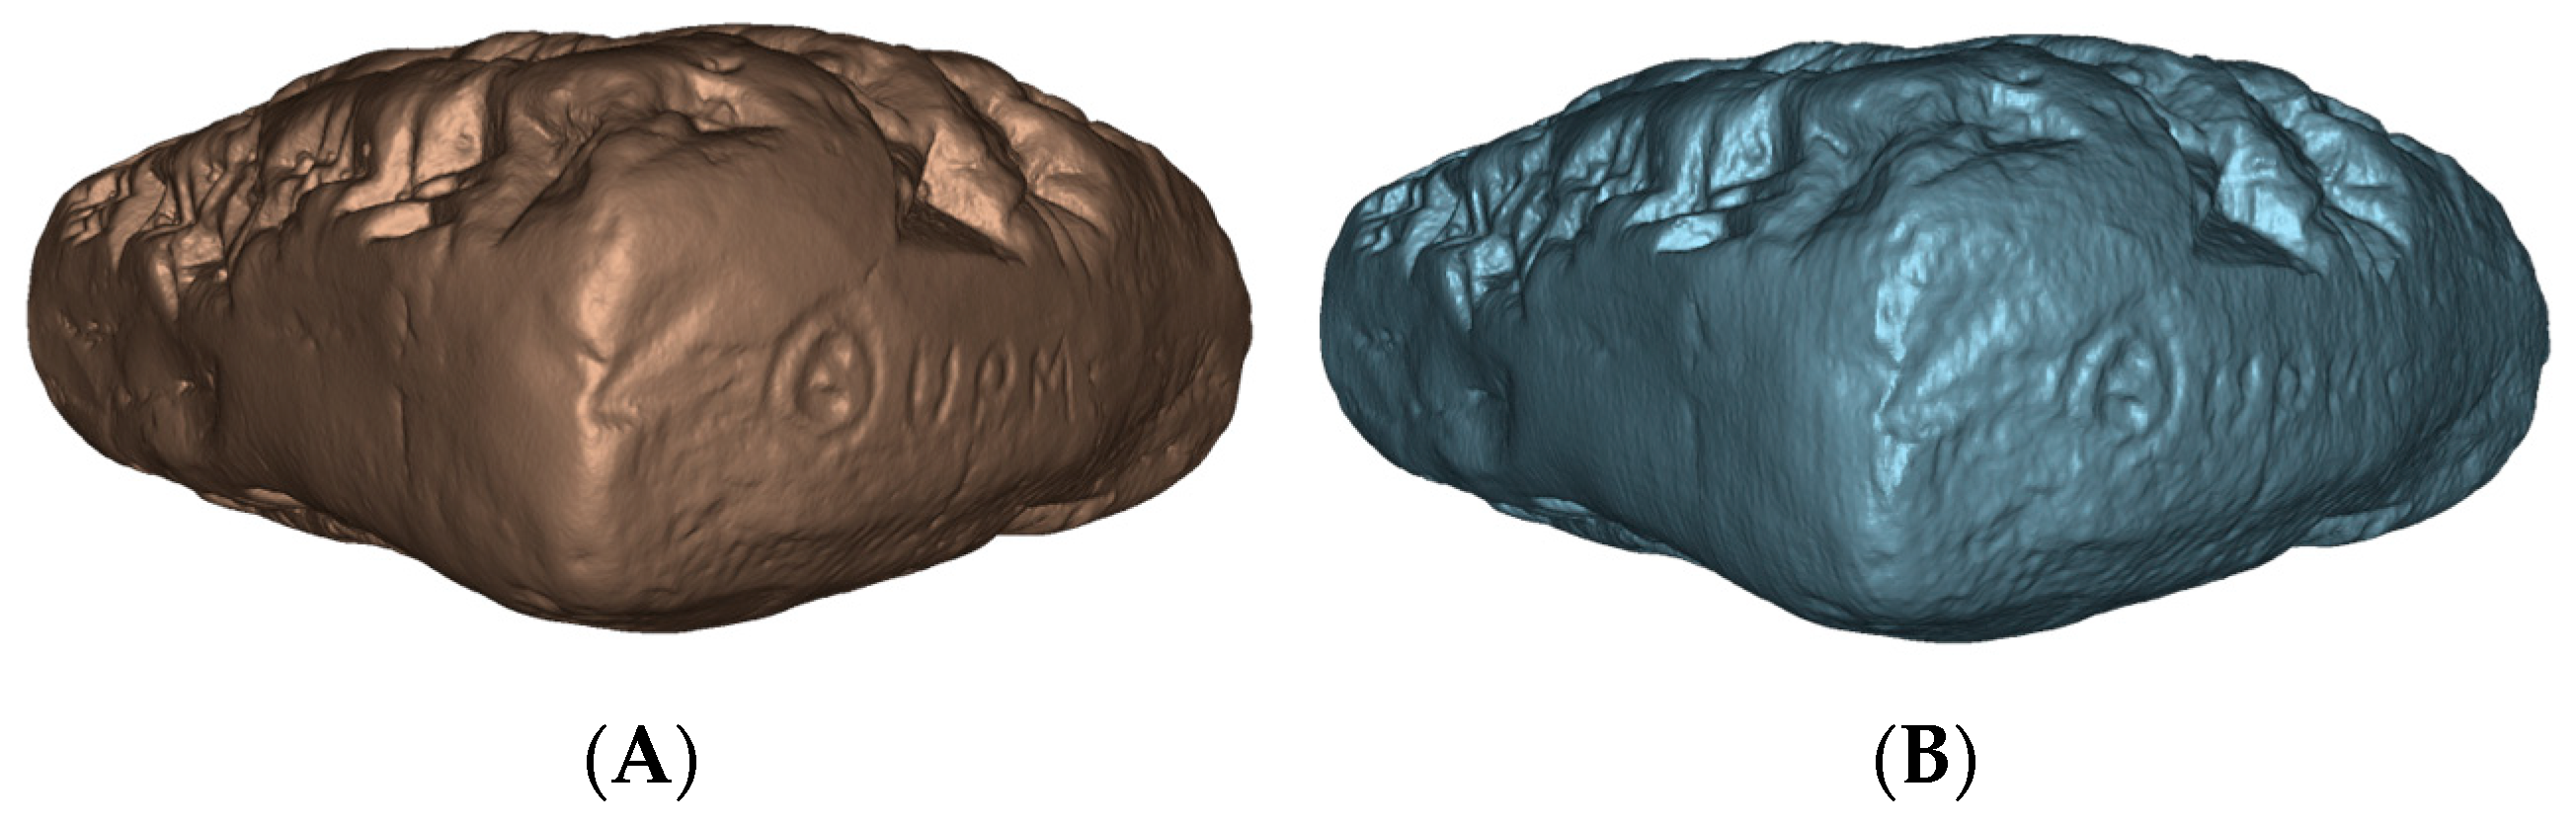
2.5.1. Lenticular Cuneiform Tablet

This replica tablet was initially scanned with Artec Micro. Regarding the preliminary setup, the brightness value was set to about 25–30% because the preview did not show anomalies. The scanning process was designed by performing two scans (collecting 50 frames): the roto-tilting arm, which was secured with modelling plasticine to secure the object and prevent falls and movements. A cleaning operation was necessary to clean scans from the detected plasticine; the global registration was launched for reducing the automatic alignment error. Sharp fusion, the process for merging scans and creating a solid mesh, was designed with a 3D resolution of 0.03 mm. In this way, the final polygonal model was created with 29,270,798 triangles (Figure 5). This is an incredible number of polygons with only two scans and 50 frames captured, obviously also related to the tablet dimensions.
The next step was the scanning operation with Artec Space Spider. The tablet was fixed into a rotating plate with the modelling plasticine at 45 degrees. Five scans were performed to cover all surfaces and edges of the replica tablet; then, 3526 frames were collected with a maximum error of 0.1 mm. The cleaning operation was the following step for removing unwanted elements from the 3D scene, for example, the base (rotating plate). Then, the alignment and global registration were set for refining the alignment of the acquired scans. The final model was obtained with the sharp fusion command by setting the 3D resolution to 0.08 mm and the error threshold to 0.16 mm. The merged model has 4,003,584 polygons and it has a good details quality (Figure 6). Compared details of both models can be noticed in Figure 7.

2.5.2. Rectangular Cuneiform Tablet

The acquisition with the Artec Micro phase was carried out by performing six scans: the replica tablet was placed in the roto tilting arm with modelling plasticine to secure the object during rotations. Then, the obtained scans were cleaned from the unwanted plasticine and then automatically merged. The global registration was the following step after preliminary scans and then the alignment was performed. The next phase was the scan merging operation, conducted by selecting the sharp fusion command. The final model was reconstructed with a 3D resolution of 0.03 mm. This command allows merging draft scans into a unique and detailed model (Figure 8). Then, the acquired frames were 96 in total and the final model had more than 10,457,596 polygons (triangles).
Despite the micrometric details that have been successfully acquired (replicas of fingerprint and instrument evidence), the steel hook shows some gaps and noisy elements.
The scanning operation with Artec Space Spider was designed by enabling the complex surface scanning command because of the presence of the steel hook.
Despite that the tablet can be directly placed on the base (a simple white desk), it was fixed with the modelling plasticine vertically to acquire the main faces perpendicularly. The tablet was placed into the rotating plate for acquiring the surfaces of the object while the instrument stands still. The scanning strategy was the following: performing as few scans as possible and making convergent scans for each face of the tablet. Then, the replica was scanned in a different position to cover the entire volume: four total scans were performed and 3606 frames were collected at a resolution of 0.1–0.15 mm. The acquired base was removed by using the base selection smart command: it removes planar data depending on selected triangles. The cleaning operation also involved frames with a bigger metric deviation, by keeping only frames with 0.1 mm of error. In the end, the final merged model (by using sharp fusion) was created with 1,480,838 triangles (Figure 9). Compared details of both models can be noticed in Figure 10.

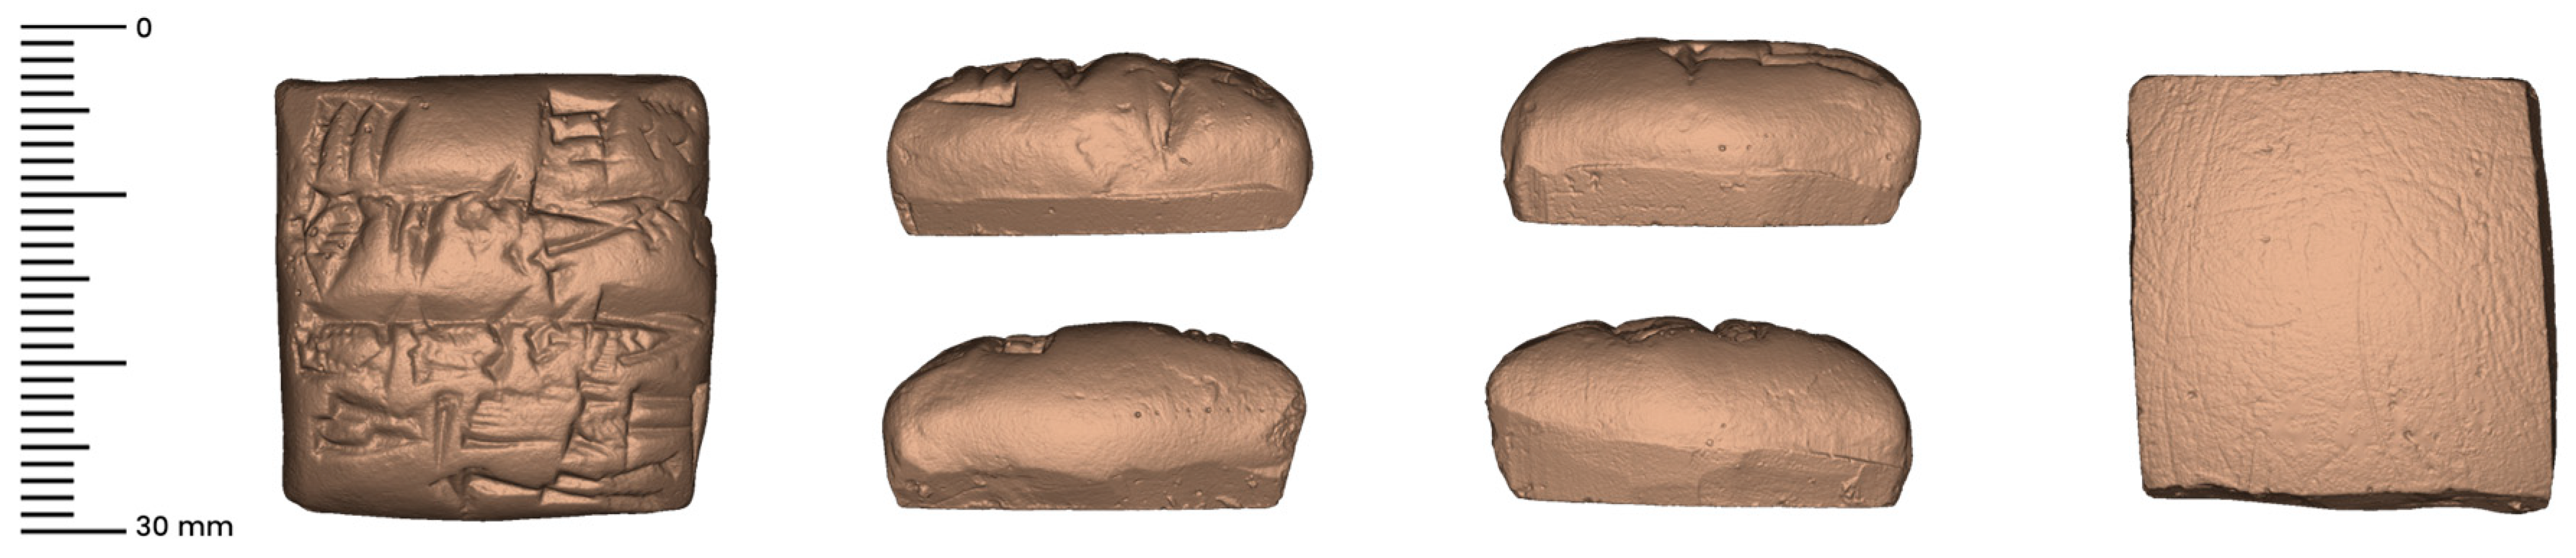
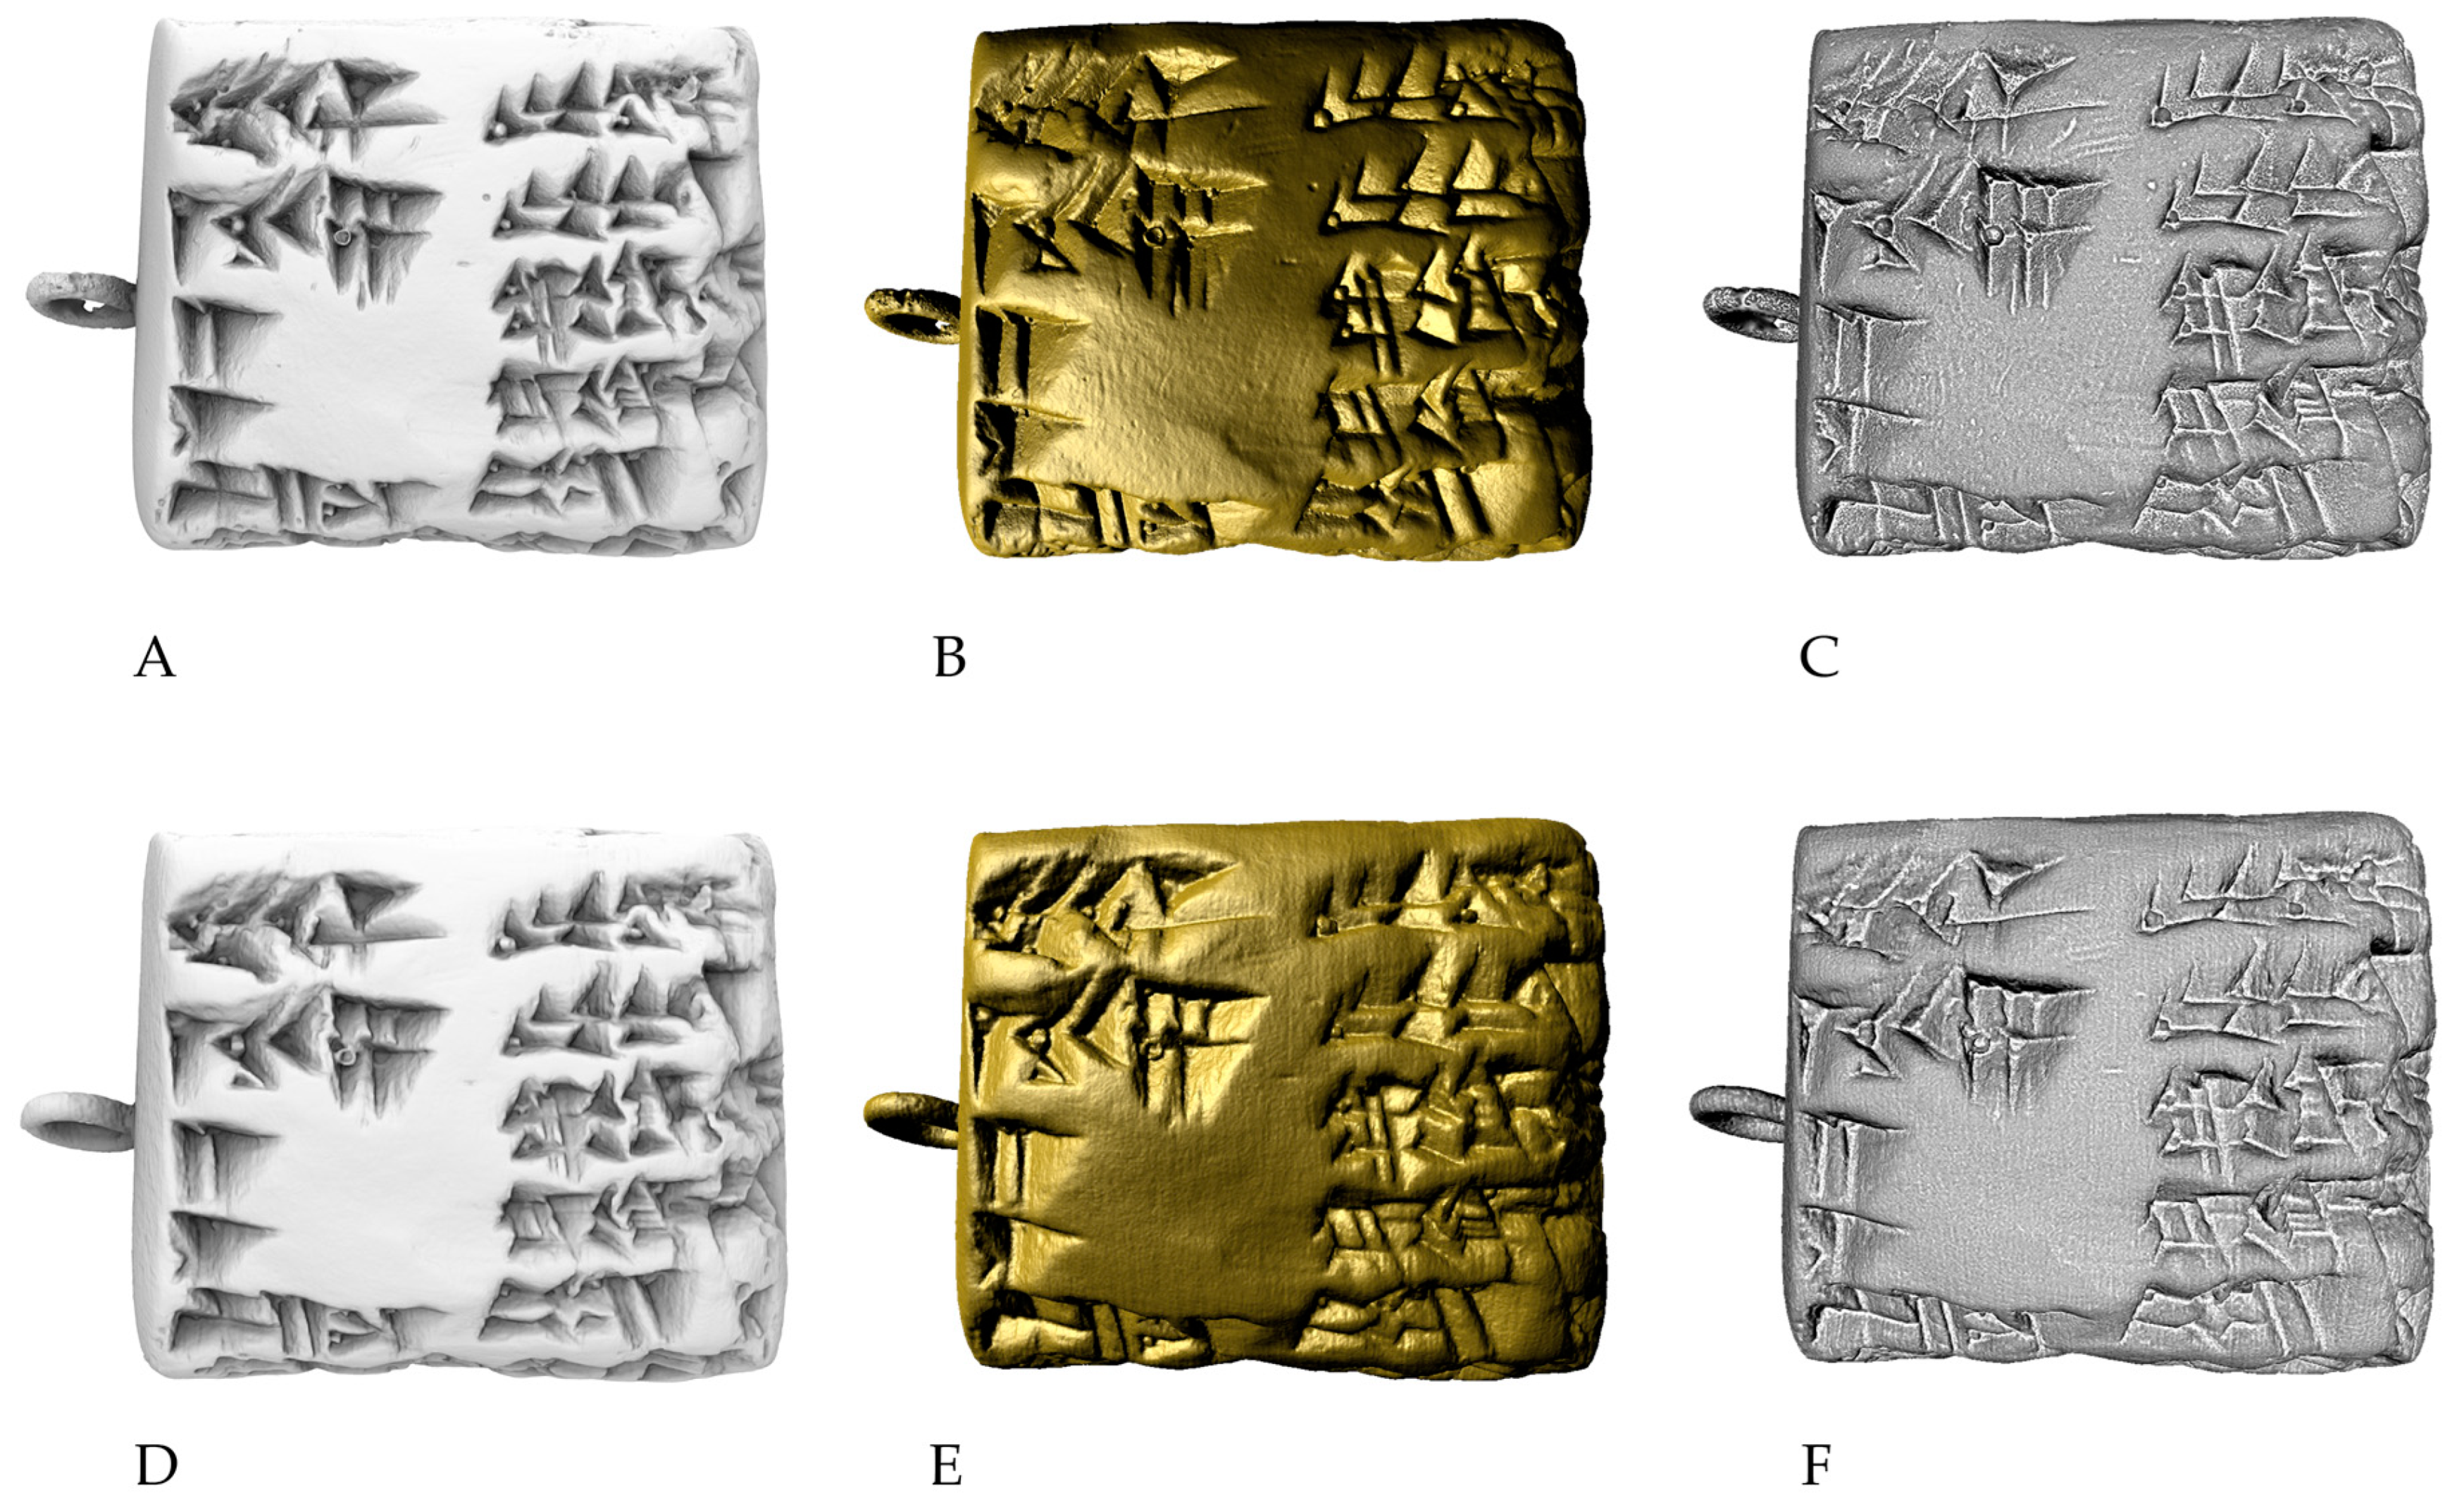
2.5.3. Squared Cuneiform Tablet

Despite the reduced dimension, which makes this object perfect for the Artec Micro, the 3D scanning with Artec Space Spider can be challenging for benchmark tests. The marks located here show different sizes, from a few millimetres to micrometre tracks. This example tablet was taken into consideration for its dimension as well as numbers and depth of signs.
Artec Micro scanning operation was designed for performing two scans. The preliminary brightness value was set to about 25–30%. After the automatic alignment and the global registration, the 3D final resolution was set almost at a minimum: 0.03 mm. The sharp fusion process returned an incredibly high-detailed mesh counting more than 5 M polygons (Figure 11).
The acquisition phase with Space Spider was carried out by collecting three scans, by using the rotating plate. This strategy was taken for evaluating the Spider output resulting in only three scans of a very small object. After the required cleaning operation, alignment and registration of scans, the 3D resolution of the Spider output has been pushed up to 0.08 mm with a threshold error of 0.16 mm. Although the fixed 3D scanning accuracy is 0.05 mm, through Artec Studio and post-processing the related output, the 3D resolution can be pushed further (also by using the isotropic mesh function). The process (sharp fusion) returned a good quality mesh with more than 1 M polygons.
Although the front of the tablet could seem similar to Micro and Spider (cuneiform signs are clear and readable in both cases), the back and the side show clear differences in details on micro depth signs and scratches (Figure 12 and Figure 13). Regarding the Spider output, the classification number on the back of the tablet was returned (incorrectly) with a pronounced depth. The black marker inscription caused this issue during the reconstruction.
Concerning the three examples, the sharp fusion operation was set by excluding erroneous frames and by enabling the max error threshold (managing this value to twice the 3D resolution). Then, after the fusion, automatic post-processing steps were performed: small and isolated mesh removal and fill holes, to achieve watertight models). Acting in this way, the obtained 3D models are ready to be analysed as well as 3D printed.

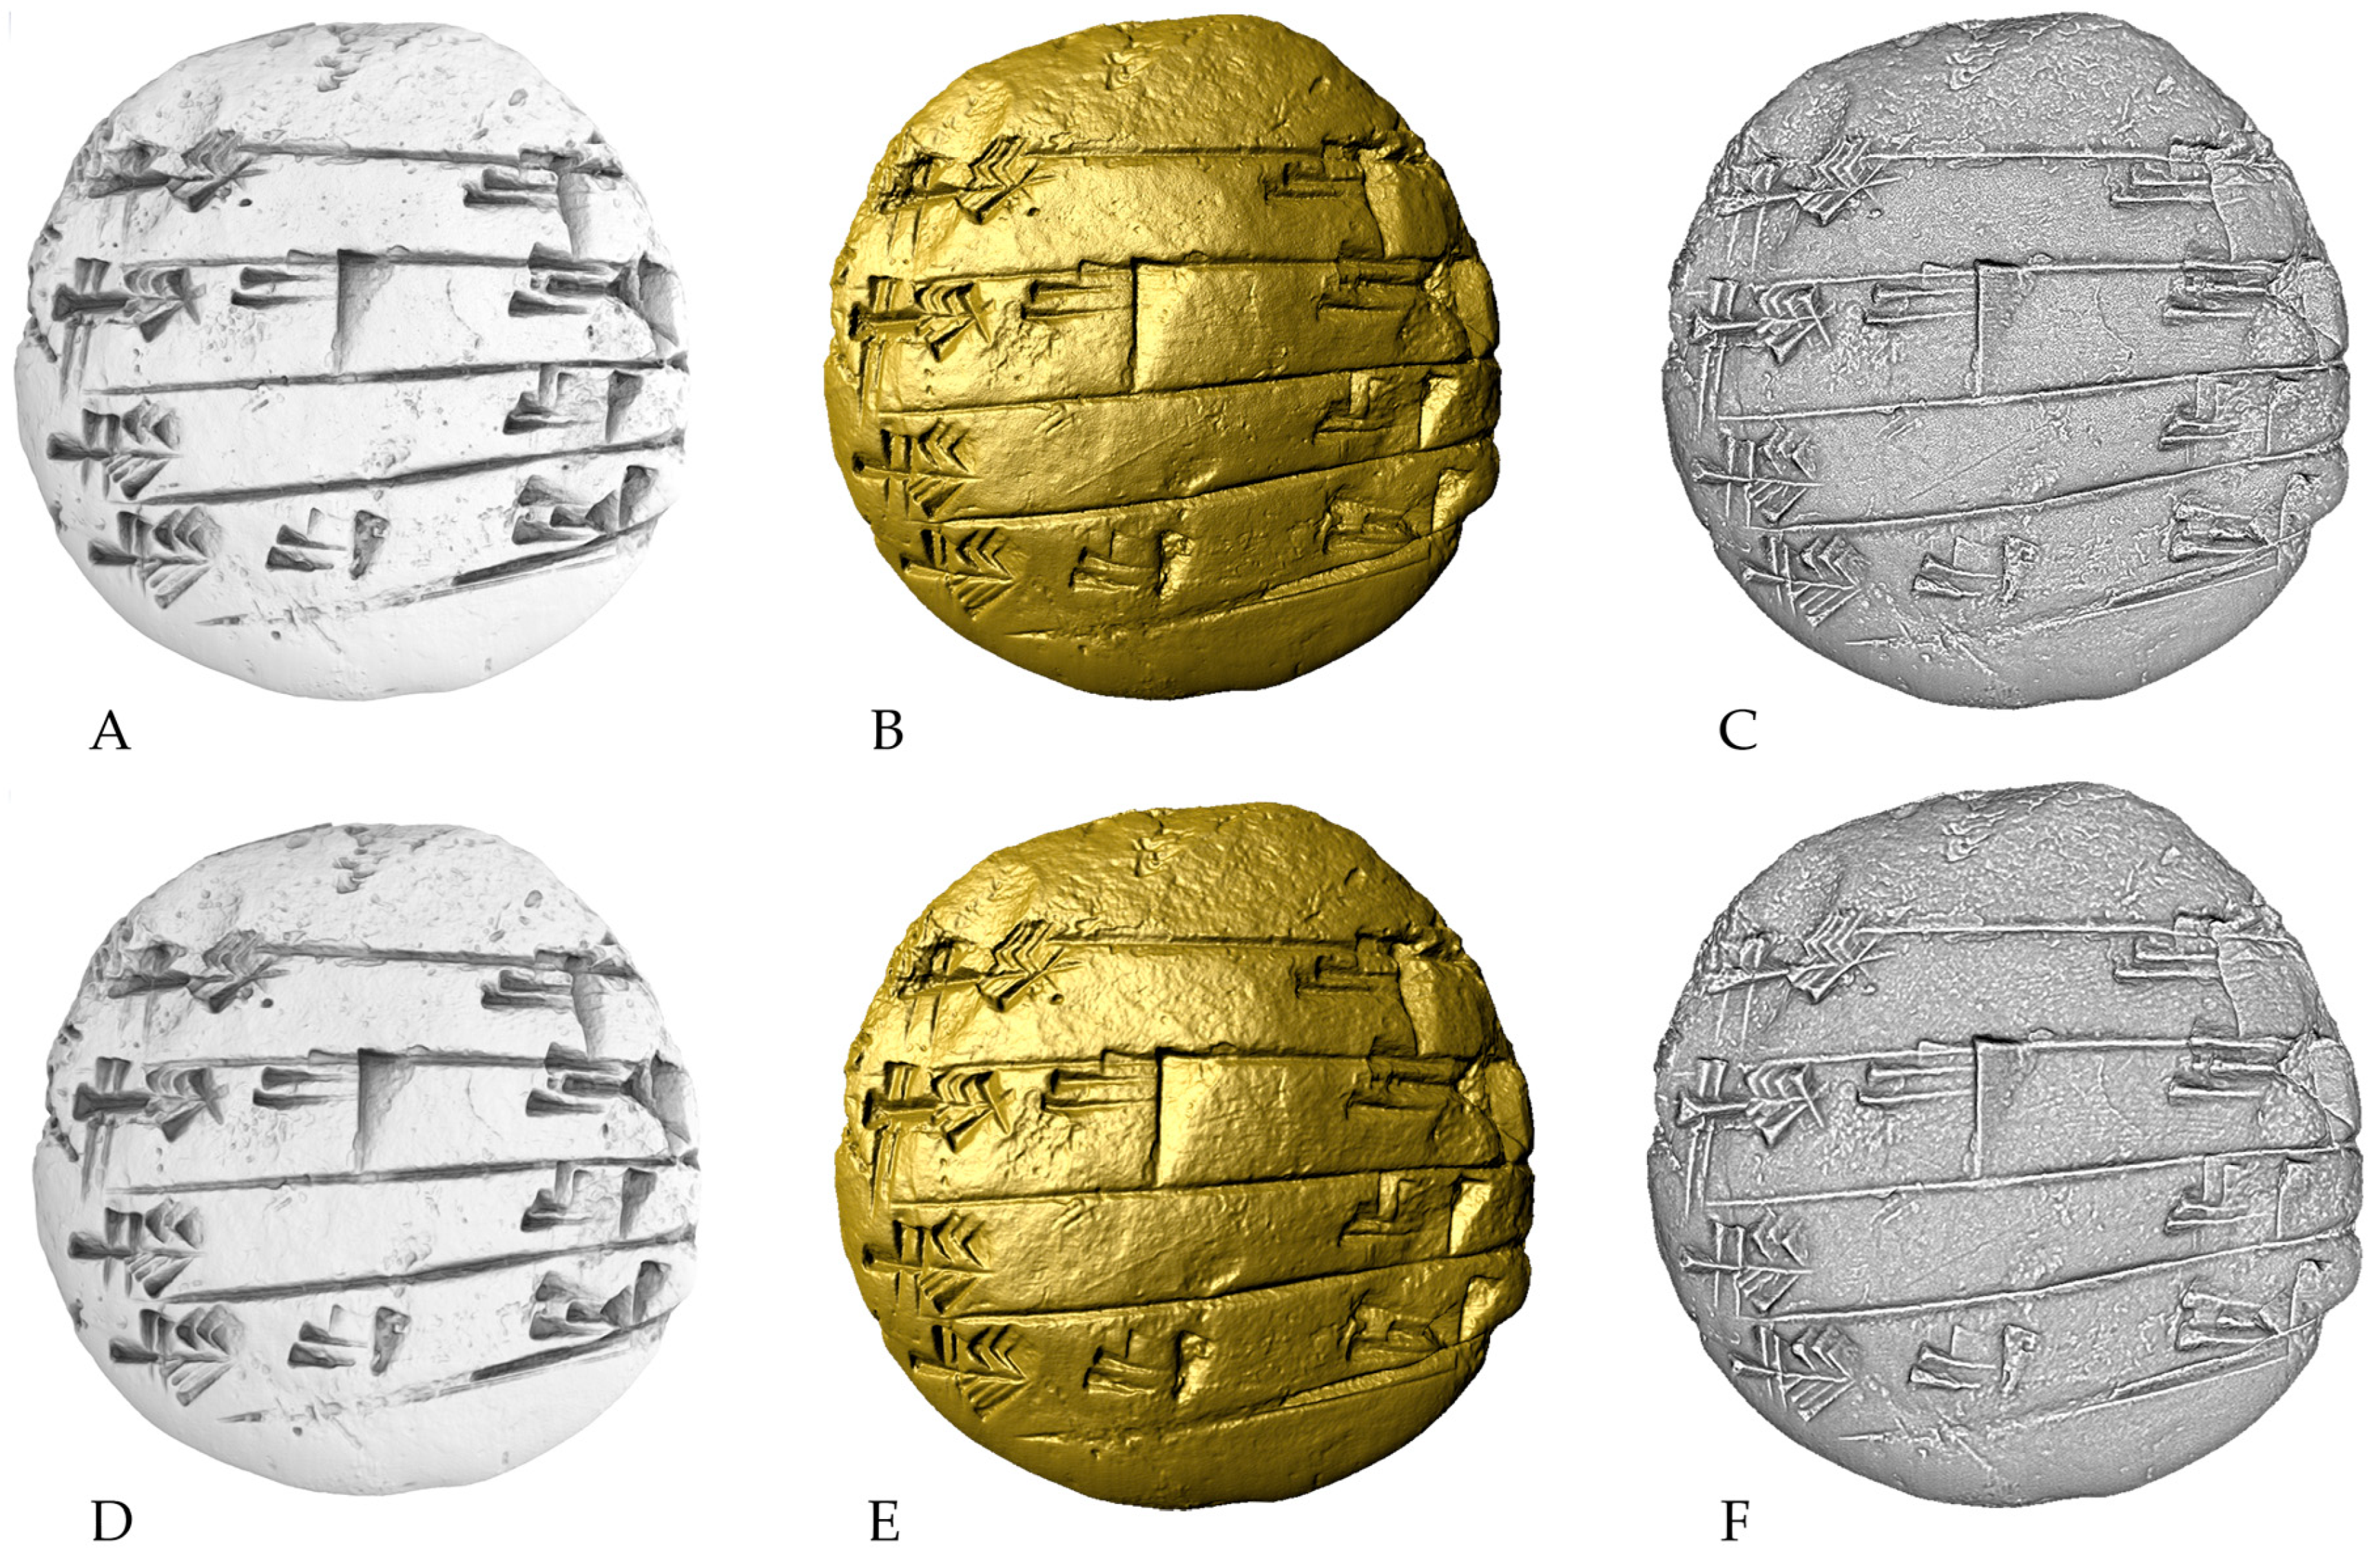
2.5.4. Texture Mapping

3D models of cuneiform tablets were enriched with texture information (Figure 14). For both the Artec Space Spider and Artec Micro, the texture mapping and manipulation were performed by generating a 4K RGB texture (4096 × 4096 pixels). Artec Studio software allows colour manipulation in terms of saturation, hue, contrast, brightness and gamma. This feature could be essential in particular acquisition situations and light conditions to fix some colour anomalies. This phase, not exactly essential for the assessment of metric discrepancies, was carried out mainly because faithful 3D models (digital twin) need to be included inside CDEs and online viewers for helping fruition and data sharing. Texture related to Micro scans has more details since the onboard camera (6.4 megapixels) is a more qualitative sensor than the Spider one (1.3 megapixels).

3. Results

The presented 3D reconstructions of cuneiform replica tablets are characterized by different resolutions, metric precision as well as graphic details. For this reason, the digital outputs produced were compared metrically to understand discrepancies between the Micro and Spider output of the same cuneiform tablet. The distance map (mesh to mesh) was calculated by using the dedicated tool inside Artec Studio software.
Furthermore, the polygon density was calculated as a function of the volume of the objects. This analysis is important to understand the average number of triangles per mm3.
As all cuneiform tablets are concerned, 3D scanning performed with Artec Micro was handled by choosing sufficient scan sessions that generate a good quantity of frames: for the former example, two scans and 50 frames were collected; for the second example, six scans and 96 frames were collected; for the latter, only two scans and 60 frames were recorded. Then, the final model resolution was set to 0.03 mm to compare different models with the same micrometric resolution (Table 2, Table 3 and Table 4). At the same time, the scanning process with Space Spider was designed to have enough coverage of scanned surfaces: for the first example, five scans and 3526 were recorded; for the next example, four scans and 3606 frames were collected; for the smallest tablet, three scans and 2221 revealed sufficient for generating a good 3D model (Table 2, Table 3 and Table 4). All Space Spider models were reconstructed with a 3D resolution of 0.08 mm.

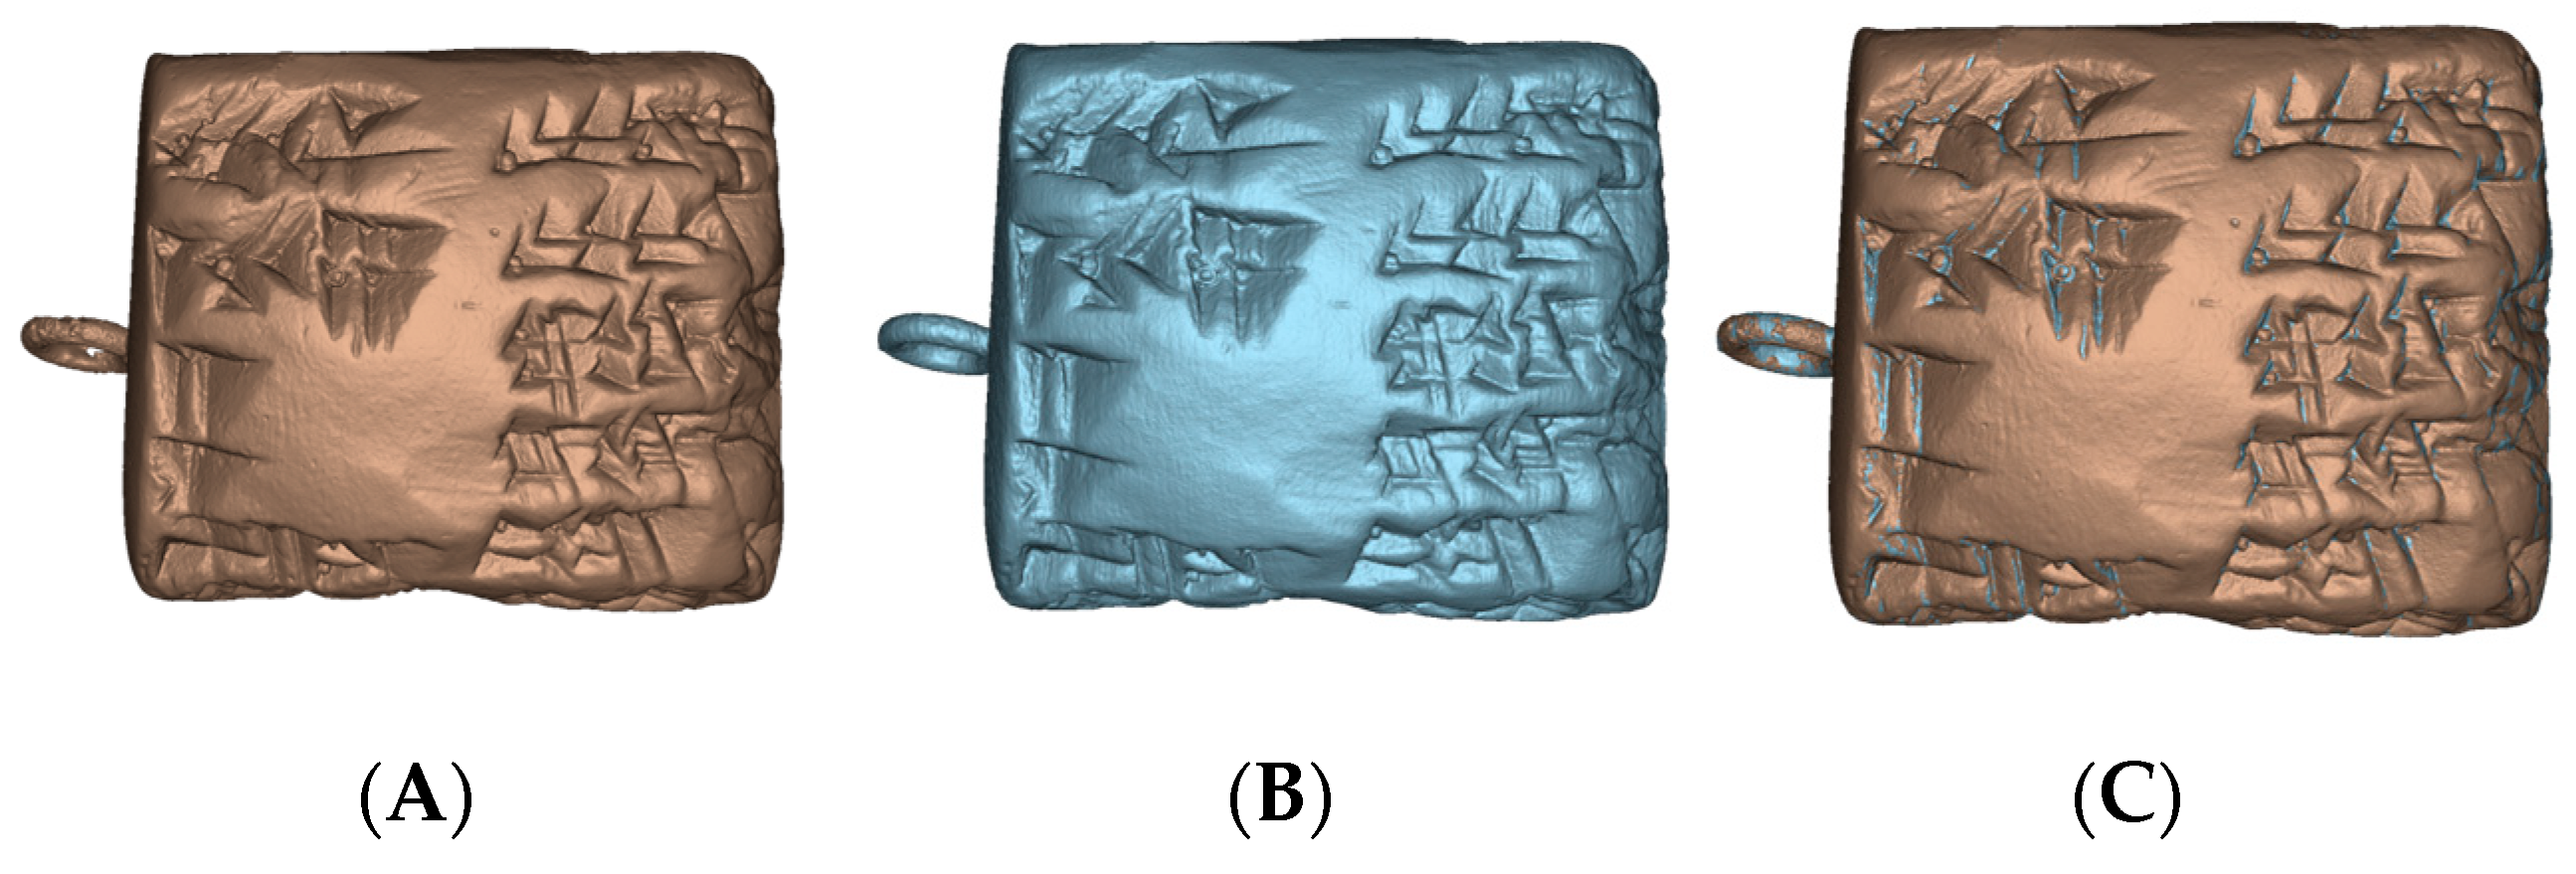
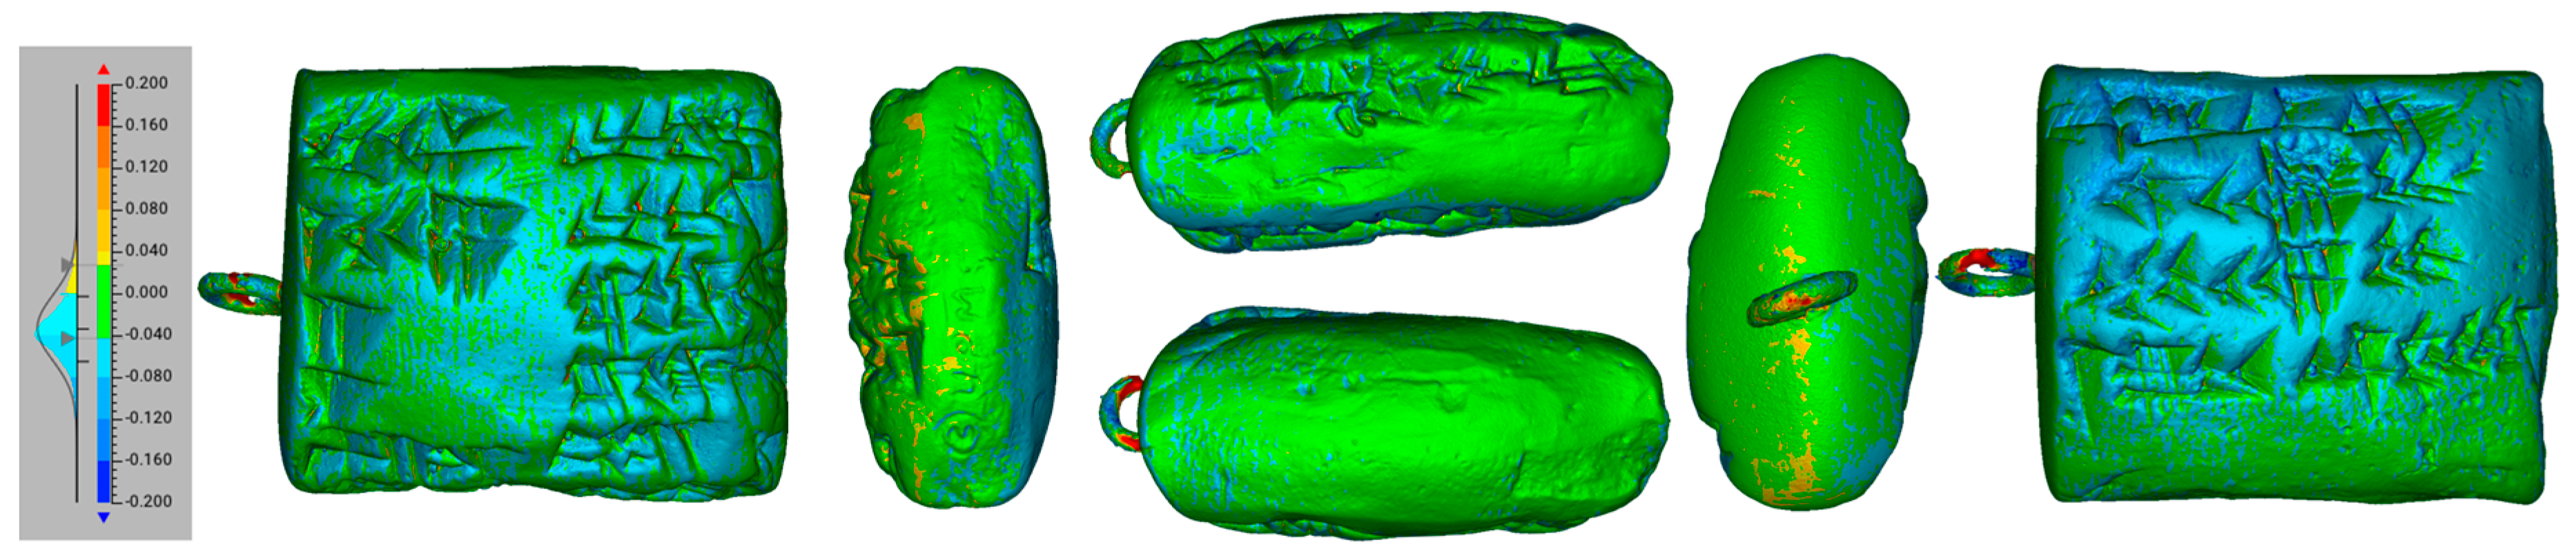
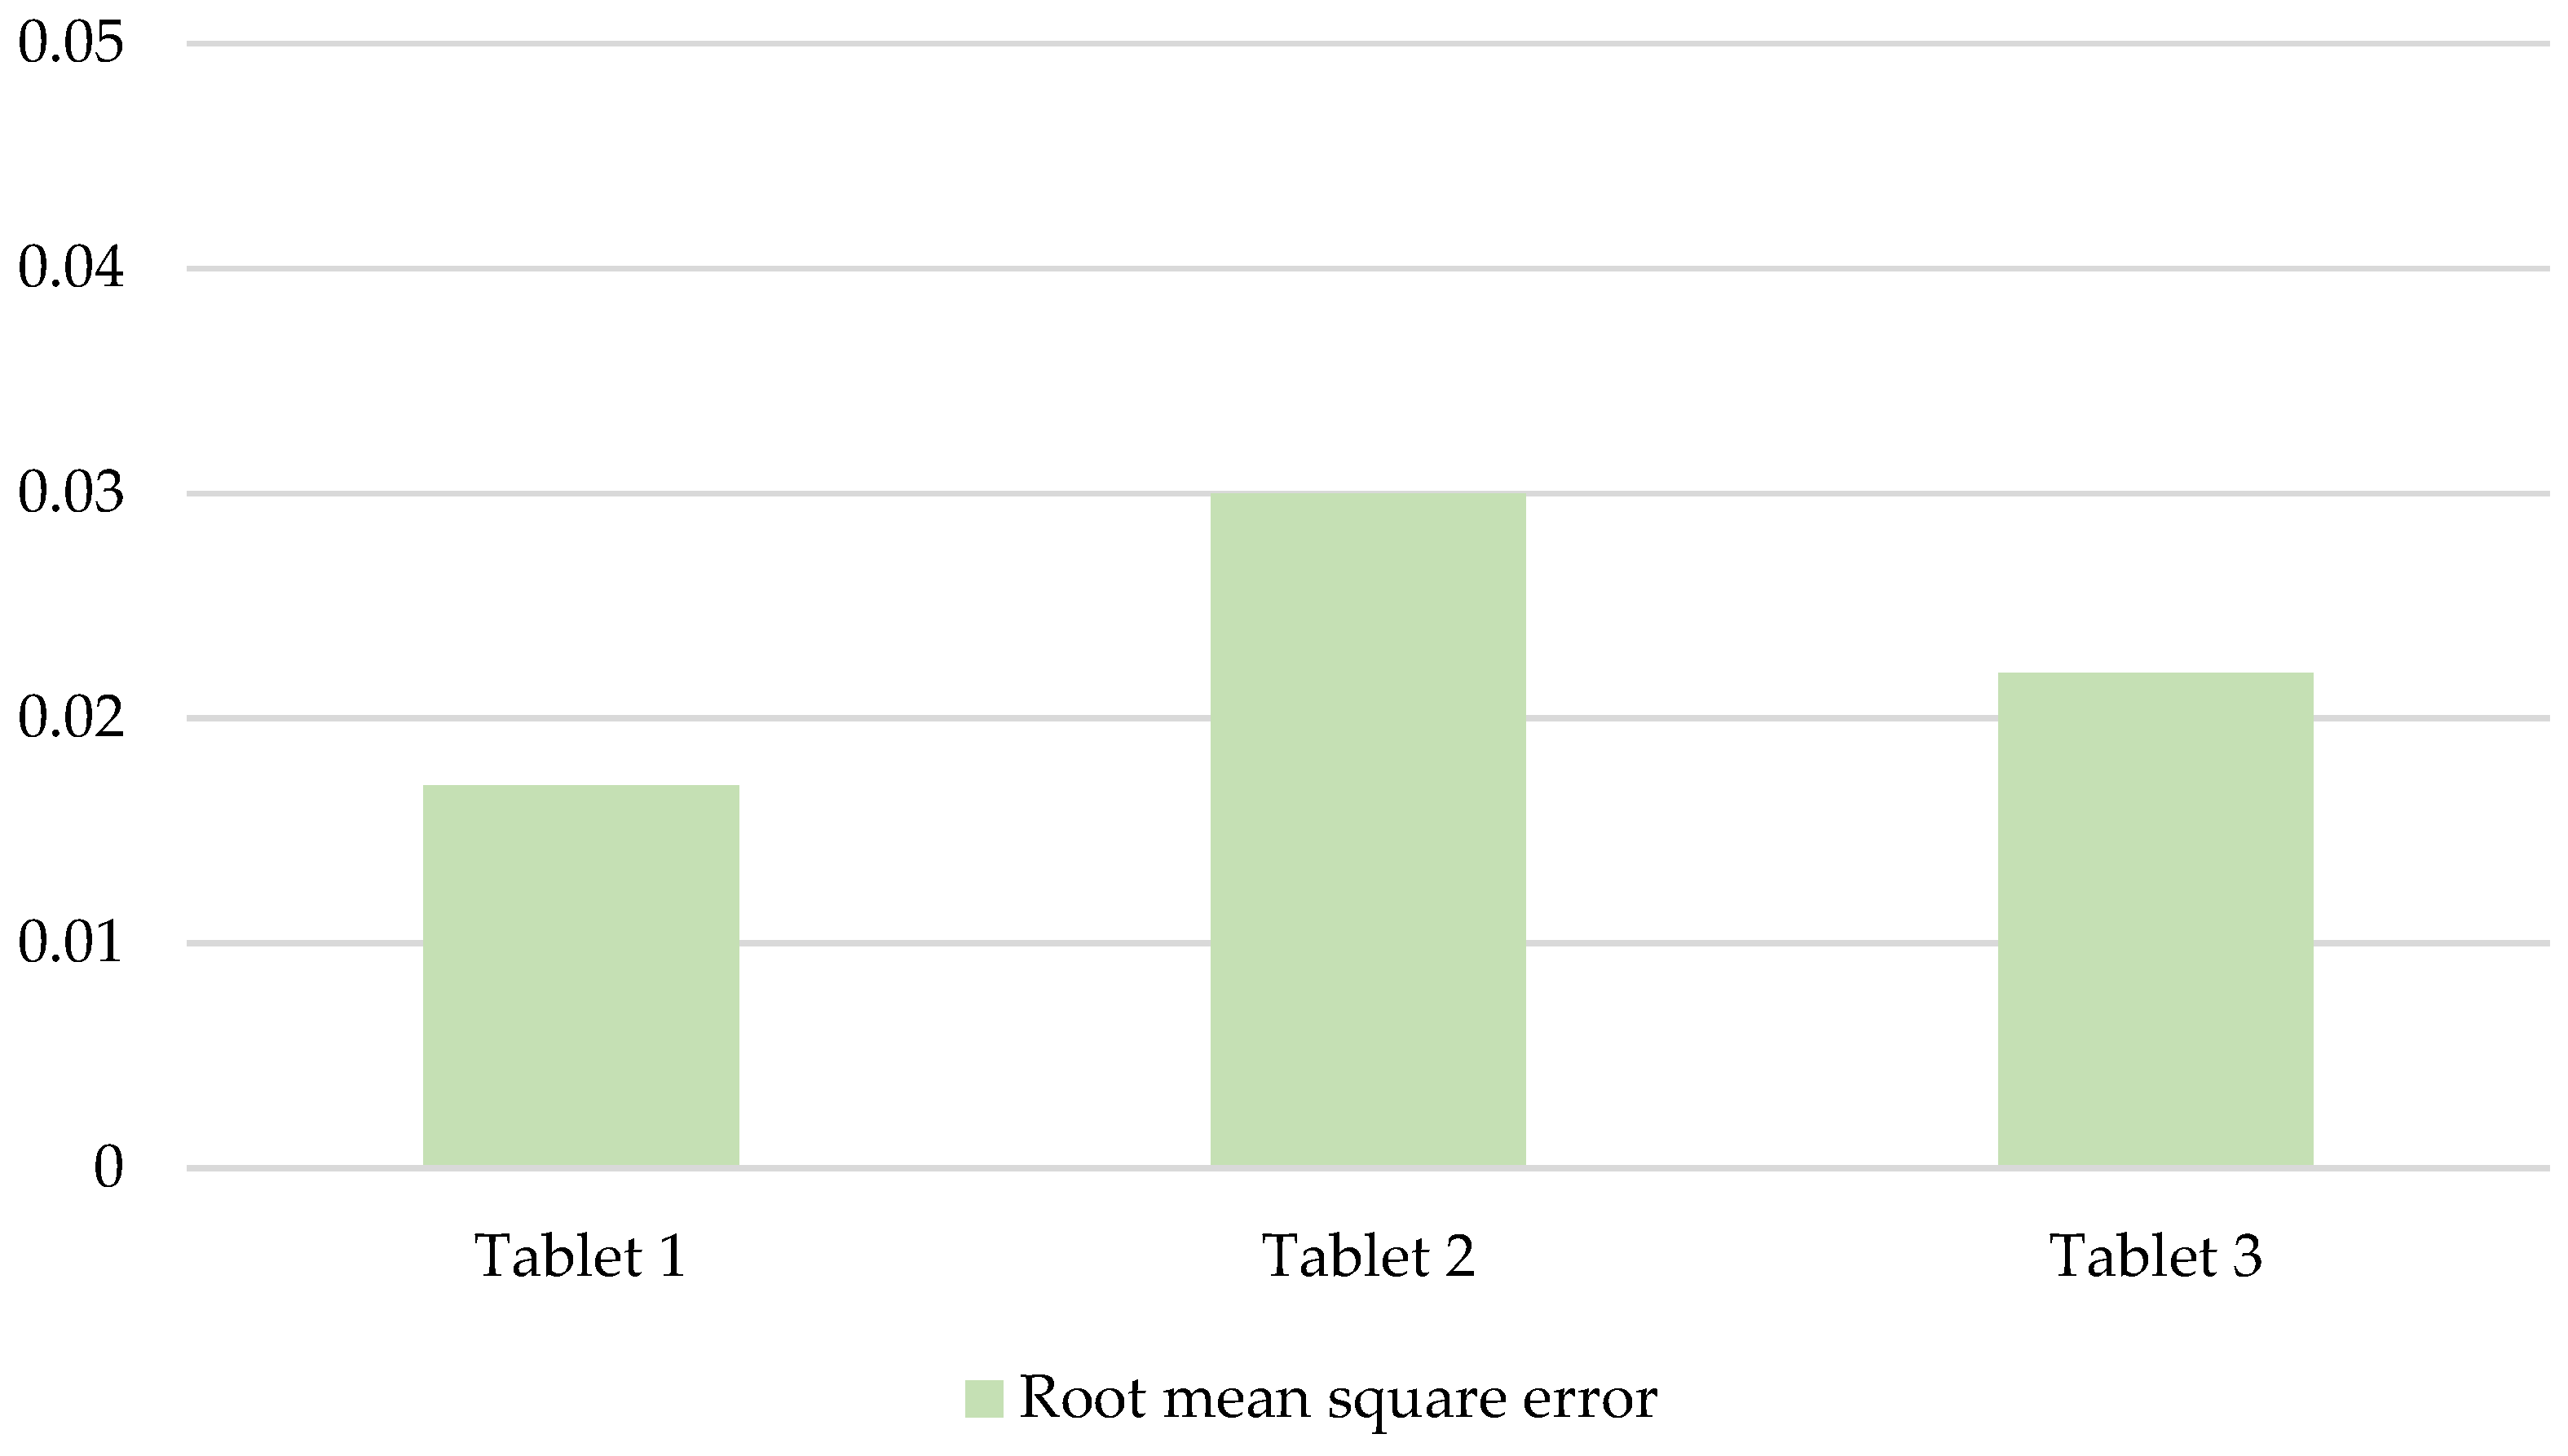
3.1. Distance Map (Mesh to Mesh)

Distance map calculation is a fundamental operation for comparing two or more instruments and related outputs. This operation is extremely useful for comprehending the mean/absolute distance and the Root Mean Square Error (RMSe) between two 3D models having the same morphology but generated with different hardware. This analysis can be applied to clouds, cloud vs. mesh or two meshes. In this case, distance map analysis—performed with Artec Studio software—was based on the comparison of two meshes (Micro and Spider).
Before the distance map process, the automatic alignment and global registration (based on geometry) of Micro and Spider models were operated. In this way, models of the same tablet but created with two different instruments were aligned (Figure 15, Figure 16, Figure 17, Figure 18 and Figure 19). Then, the following distance map, based on the mesh-to-mesh distance, was designed to calculate the average metrological distance between the two models. This metrological analysis was operated for all the cuneiform replica tablets.
During this analysis, the Micro outputs were chosen as reference meshes because they show more reliable metrological accuracy and measurements. Then, Space Spider outputs were metrically compared with previous models.
This calculation generates two important metrics: the absolute distance between two meshes and the Root Mean Square error (RMSe), referred to as a statistical dispersion (residual errors) between two values. Graphically, a colourimetric scalar field map is generated for comparing metric confidences and discrepancies (green colour represents the most faithful overlap, while red and blue represent the greater distances).
As the lenticular tablet is concerned, the maximum distance target was set to 0.25 mm to concentrate the analysis on details. The distance map process returned an absolute distance of 0.012 mm and an RMSe of 0.017 mm (Figure 16). For the following replica tablets, the maximum distance target was set to 0.20 mm because of the smaller size as well as the concentration of polygons. For the rectangular tablet, Artec Studio calculated an absolute distance of 0.039 mm and an RMSe of 0.031 mm; for the squared tablet, the absolute distance is 0.023 mm and the RMSe is 0.022 mm (Figure 18 and Figure 20).

3.2. Density Analysis

A deeper analysis was focused on the calculation of the density of polygons on cuneiform tablets. To perform this operation, the classic density formula was adopted:
d = P V
P denotes the polygons count (digital mass) and V refers to the real volume (mm3) of the object. Then, density d indicates the ratio of polygons per mm3.
Thus, cuneiform replica tablets were investigated as the volume is concerned (in mm3). This operation was conducted by using the specific command in Artec Studio software (Table 5).
The lenticular cuneiform tablet has a volume of 61,412.31 mm3. The density formula allows us to obtain the following results: the Micro density is 477 poly/mm3, while the Spider density is 65 poly/mm3. The ratio (r) between these values is 7.34. Through the Artec Studio software, the other volumes of the replica tablets were calculated: the rectangular one has 14,870.54 mm3 of volume, while the smallest one is 5,582.57 mm3. Then, the values are, respectively, 7.10 and 4.03 (Table 6).
This analysis demonstrates the unexpected polygons population related to the small squared tablet: the ratio is around 4; 3 points smaller than the expected value. In fact, according to previous tablets, the expected ratio should have been around 7 points. From this, we can deduce that, as also shown by triangles density, the Space Spider survey has been excellently conducted, allowing a 3D reconstruction with 237 poly/mm3 density with only three scans and 2221 frames. These differences in details, triangles populations and metric distance can be noticed in Figure 21.

3.3. Post-Processing Analyses

Post-processing investigations were conducted to try to improve the readability of traces and cuneiform signs, especially for future transcriptions studies. These operations concerned the application of shaders and filters to polygonal meshes through Meshlab open-source software [32]. Three shaders were applied (Figure 22, Figure 23 and Figure 24): depth map in render mode for understanding the general profoundness of traces; dimple shader with custom light direction for capturing slightest traces and evidence, also by changing light angles; radiance map shader with inverted normal direction. The latter revealed to be extremely useful to boost the readability of cuneiform text, making the smallest signs even more readable (especially on the squared tablet).

4. Discussion

The presented structured-light scanners are designed to capture micrometric detail, although they are intended for different applications: the Artec Micro is essentially a desktop scanner to be used in certain environments, especially laboratories; the Space Spider is a portable instrument that can easily be taken on board for investigations and on missions.
Scanning with Artec Micro means paying attention to the size of the object. Depending on dimension and morphology, before the acquisition phase, the object should be securely placed on the scanning platform by using fixed clamps or plasticine material (modelling artificial clay) before the imaging phase. In this way, the object can be rotated and translated with the built-in arm. Objects that exceed the suggested dimension could fall down and be damaged, and also damage the scanner.
Although it seems easier than the previous procedure, scanning with Space Spider requires some caution. Scanning a small object as best as possible with the Space Spider means fixing the object on a desk or turntable by using clamps and/or plasticine. The scanner and the dedicated software automatically oriented in real-time the already operated scans. Space Spider is a portable tool that becomes a smart and flexible piece of hardware to be easily carried on missions and surveys. By contrast, the Micro scanner was designed as desktop hardware and can be hardly transported, especially due to its fragility (unless the use of a tailor-made rigid and reinforced case). At the same time, transporting the Micro also involves calibrating the sensors, mainly because of the random shocks the machine may be exposed to.
Apart from the incredible polygon tessellation and density ratio (Figure 25 and Figure 26), the number of triangles affects the creation of texture maps: the average threshold of 5–6 million polygons could affect Artec Studio software during the diffuse map generation. Nevertheless, the importance of texture information is relative. For the performed analyses, RGB data was not necessary, unlike extremely populated meshes. Even without metric analysis like the Distance Map and RMSe calculation (Figure 27), visual details differences are more detectable by comparing 3D models on solid scan colours. The application of textures reveals the basic way to increase the quality of low-poly models, for example, by integrating them inside 3D viewer or CDEs. For this purpose, the simplification and reduction of the polygons count is a mandatory process.
Furthermore, the acquisition of black or very dark surfaces may be difficult, even if the scanning preview can be also edited by the brightness: in fact, by increasing this value (up to 80–100%), the acquisition of dark surfaces can be differently managed to allow the instrument to measure more data.

5. Conclusions

The aim of this study was to evaluate procedures and results of both scanners as well as metric analysis. Non-invasive solutions are fundamental for archaeological artefacts: delicate and unique witnesses of the past must not be damaged in any way during the scanning process. SLS for archaeology is inscribed inside this thought.
These scanning systems are very flexible solutions for the recording of small and detailed objects. As far as small archaeological finds are concerned, the ability to digitally reproduce every detailed feature, inscription and evidence is an essential requirement for researchers. In this regard, Artec instruments could be fitting solutions, even if they are designed for different scopes: Micro for automated scanning operations from the desk, and Space Spider for extreme portability. Despite the first one having the advantage of being fully automatic, it is not as agile and flexible as a handy scan. In this regard, transportation could be dangerous for the device.
By contrast, the Space Spider has the advantage of being fully portable (which is essential for abroad surveys), although it is not an automated solution: indeed, the manual scanning and pulling has to be done by the surveyor (and requires a steady hand).
Conducted tests confirmed differences in precision and resolution. Although not at its best, Micro captured more details and evidence related to tablet surfaces (more triangles in terms of scanned data). The 3D model generated by Space Spider shows fewer polygons compared to the Micro output. However, both 3D models were not manipulated as the isotropic mesh option is concerned: it allows to re-build the mesh by increasing the resolution and inserting new polygons.
The 3D digitization and reconstruction of archaeological assets nowadays is a compelling solution for the preservation and enhancement of the worldwide heritage: in this regard, virtual museums and CDEs are increasingly in demand by project collaborators. CDEs are not only intended for sharing extremely accurate 3D models (polygon number and HD textures). These smart environments should also be designed for semantic data-exchange and for helping project management and revisions. Three-dimensional models of cuneiform tablets should include informative data, such as the material, the instrument used for signs and transcriptions. At the same time, analyses on 3D models could reveal new sensitive information related to the archaeological and historical contexts. Semantic information has to be dynamically included in 3D models, passing from bare models to Digital Informative Twins [6]. Creating digital models not only means to build up metrically detailed 3D replicas, but also to include sensitive information about the artefact and the context. The 3D digitization is, therefore, the early step: further phases for the preservation of cuneiform tablets, seals and sealings are related to specific analyses on 3D models as well as the semantic data-exchange via CDEs. In this regard, one of the future aims of this project is to develop and share a suitable virtual and collaborative environment (CDE) for cuneiform tablets, seals and sealings: this shared and open environment (more than a virtual museum)—also based on specific ontologies—will be designed for enhancing the fruition as well as collaboration processes, a required step of the ITSERR project [4,6,9,10].

Funding

This work was supported by the PNRR (National Recovery and Resilience Plan) project Italian Strengthening of ESFRI RI Resilience (ITSERR) founded by the European Union—NextGenerationEU (CUP:B53C22001770006).

Data Availability Statement

Not applicable.

Acknowledgments

The author would like to acknowledge Stefano de Martino (ITSERR TAURUS reference and Full Professor in Anatolian Studies), Elena Devecchi (Associated Professor in History of Ancient Near East) and Maurizio Viano (Associated Professor in Assyriology) of the University of Turin for the constant support and review on the analyses of the presented cuneiform tablets.

Conflicts of Interest

The author declares no conflict of interest.

References

  1. Resilience Europen Project Website. Available online: https://www.resilience-ri.eu (accessed on 28 July 2023).
  2. Anderson, S.E.; Levoy, M. Unwrapping and visualizing cuneiform tablets. IEEE Comput. Graph. Appl. 2002, 22, 82–88. [Google Scholar] [CrossRef]
  3. Kotoula, E.; Akoglu, K.G.; Frahm, E.; Simon, S. QR Coded 3D Prints of Cuneiform Tablets. Int. J. Art Cult. Des. Technol. 2017, 6, 1–11. [Google Scholar] [CrossRef]
  4. Homburg, T.; Zwick, R.; Mara, H.; Bruhn, K.-C. Annotated 3D-Models of Cuneiform Tablets. J. Open Archaeol. Data 2022, 10, 1–8. [Google Scholar] [CrossRef]
  5. Diara, F.; Rinaudo, F. ARK-BIM: Open-Source Cloud-Based HBIM Platform for Archaeology. Appl. Sci. 2021, 11, 8770. [Google Scholar] [CrossRef]
  6. Diara, F. HBIM Open Source: A Review. ISPRS Int. J. Geoinf. 2022, 11, 472. [Google Scholar] [CrossRef]
  7. Cohen, J.D.; Duncan, D.D.; Snyder, D.; Cooper, J.; Kumar, S.; Hahn, D.V.; Chen, Y.; Purnomo, B.; Graettinger, J. iClay: Dig-itizing Cuneiform. In Proceedings of the IEEE Conference on Visual Analytics Science and Technology, Norkköping, Sweden, 7 December 2004. [Google Scholar]
  8. Mara, S.H.; Krömker, S.; Breuckmann, J.-B. GigaMesh & Gilgamesh: 3D Multiscale Integral Invariant Cuneiform Character Extraction. In Proceedings of the VAST: International Symposium on Virtual Reality, Archaeology and Intelligent Cultural Heritage, The Eurographics Association, Paris, France, 21–24 September 2010. [Google Scholar] [CrossRef]
  9. Ch’Ng, E.; Woolley, S.I.; Hernandez-Munoz, L.; Collins, T.; Lewis, A.; Gehlken, E. The Development of a Collaborative Virtual Environment for 3D Reconstruction of Cuneiform Tablets. In Proceedings of the International Conference on Virtual Systems & Multimedia (VSMM), Hong Kong, China, 9–12 December 2014; pp. 35–42. [Google Scholar] [CrossRef]
  10. Fisseler, D.; Müller, G.G.W.; Weichert, F. Web-Based Scientific Exploration and Analysis of 3D Scanned Cuneiform Datasets for Collaborative Research. Informatics 2017, 4, 44. [Google Scholar] [CrossRef]
  11. Artec3D Website. Available online: https://www.artec3d.com (accessed on 28 July 2023).
  12. Willems, G.; Verbiest, F.; Moreau, W.; Hameeuw, H.; Van Lerberghe, K.; Van Gool, L. Easy and Cost-Effective Cuneiform Digitizing. In Proceedings of the 6th International Symposium on Virtual Reality, Archaeology and Cultural Heritage (VAST 2005), Pisa, Italy, 8–11 November 2005; Mudge, M., Ryan, N., Scopigno, R., Eds.; ACM: New Tork, NY, USA, 2005; pp. 73–80. [Google Scholar]
  13. Hameeuw, H.; Geert, W. New Visualization Techniques for Cuneiform Texts and Sealings. Akkadica 2011, 132, 163–178. [Google Scholar]
  14. Earl, G.; Martinez, K.; Malzbender, T. Archaeological applications of polynomial texture mapping: Analysis, conservation and representation. J. Archaeol. Sci. 2010, 37, 2040–2050. [Google Scholar] [CrossRef]
  15. Marengo, E.; Manfredi, M.; Zerbinati, O.; Robotti, E.; Mazzucco, E.; Gosetti, F.; Bearman, G.; France, F.; Shor, P. Technique Based on LED Multispectral Imaging and Multivariate Analysis for Monitoring the Conservation State of the Dead Sea Scrolls. Anal. Chem. 2011, 83, 6609–6618. [Google Scholar] [CrossRef]
  16. Ouimet, M. Ancient Cuneiform in the Digital Age: Curating the Oriental Institute’s Tablet Collection. In Proceedings of the University of Chicago Undergraduate Research Symposium, Online, 21 May 2021. [Google Scholar]
  17. Antinozzi, S.; Fiorillo, F.; Surdi, M. Cuneiform Tablets Micro-Surveying in an Optimized Photogrammetric Configuration. Heritage 2022, 5, 3133–3164. [Google Scholar] [CrossRef]
  18. Antinozzi, S.; Fiorillo, F. Optimized configurations for micro-photogrammetric surveying adaptable to macro optics and digital microscope. Int. Arch. Photogramm. Remote Sens. Spat. Inf. Sci. 2022, 46, 25–32. [Google Scholar] [CrossRef]
  19. Georgopoulos, A.; Ioannidis, C.; Valanis, A. Assessing the performance of a structured light scanner. Int. Arch. Photogramm. Remote Sens. Spat. Inf. Sci. 2010, XXXVIII, 5. [Google Scholar]
  20. Soile, S.; Adam, K.; Ioannidis, C.; Georgopoulos, A. Accurate 3D textured models of vessels for the improvement of the educational tools of a museum. Int. Arch. Photogramm. Remote Sens. Spat. Inf. Sci. 2013, 40, 211–217. [Google Scholar] [CrossRef]
  21. Mugnai, F.; Tucci, G.; Da Re, A. Digital image correlation in assessing structured-light 3D scanner’s gantry stability: Performing David’s (Michelangelo) high-accuracy 3D survey. Int. Arch. Photogramm. Remote Sens. Spat. Inf. Sci. 2021, 46, 463–469. [Google Scholar] [CrossRef]
  22. Polo, M.E.; Cuartero, A.; Felicísimo, A.M. Study of uncertainty and repeatability in structured-light 3D scanners. Electrical Engineering and Systems Science. arXiv 2019, arXiv:1910.13199. [Google Scholar] [CrossRef]
  23. Eiríksson, E.R.; Wilm, J.; Pedersen, D.B.; Aanæs, H. Precision and accuracy parameters in structured light 3-D scanning. Int. Arch. Photogramm. Remote Sens. Spat. Inf. Sci. 2016, 40, 7–15. [Google Scholar] [CrossRef]
  24. Voisin, S.; Foufou, S.; Truchetet, F.; Page, D.L.; Abidi, M.A. Study of ambient light influence for three-dimensional scanners based on structured light. Opt. Eng. 2007, 46, 030502. [Google Scholar] [CrossRef]
  25. Schild, L.; Sasse, F.; Kaiser, J.-P.; Lanza, G. Assessing the optical configuration of a structured light scanner in metrological use. Meas. Sci. Technol. 2022, 33, 085018. [Google Scholar] [CrossRef]
  26. Dhillon, D.S.; Govindu, V.M. Geometric and radiometric estimation in a structured-light 3D scanner. Mach. Vis. Appl. 2015, 26, 339–352. [Google Scholar] [CrossRef]
  27. Latz, D.; Oezel, L.; Taday, R.; Gehrmann, S.V.; Windolf, J.; Schiffner, E. Defining the region of interest of the knee for perioperative volumetric assessment with a portable 3D scanner in orthopedic and trauma surgery. PLoS ONE 2022, 17, e0270371. [Google Scholar] [CrossRef]
  28. Somogyi, Á.J.; Lovas, T.; Szabó-Leone, Á.; Fehér, A. Steels Specimens’ Inspection with Structured Light Scanner. Period. Polytech. Civ. Eng. 2022, 66, 1241–1247. [Google Scholar] [CrossRef]
  29. Göldner, D.; Karakostis, F.A.; Falcucci, A. Practical and technical aspects for the 3D scanning of lithic artefacts using micro-computed tomography techniques and laser light scanners for subsequent geometric morphometric analysis. Introducing the StyroStone protocol. PLoS ONE 2022, 17, e0267163. [Google Scholar] [CrossRef] [PubMed]
  30. Marić, I.; Šiljeg, A.; Domazetović, F. Precision Assessment of Artec Space Spider 3D Handheld Scanner for Quantifying Tufa Formation Dynamics on Small Limestone Plates (PLs). In Proceedings of the 8th International Conference on Geographical Information Systems Theory, Applications and Management—GISTAM, Online, 27–29 April 2022; SciTePress: Vienna, Austria, 2022; pp. 67–74. [Google Scholar] [CrossRef]
  31. Kalinowski, P.; Hindmarch, J.; Luhmann, T. Accuracy investigations of hand-held scanning systems using different dumbbell artefacts. Int. Arch. Photogramm. Remote Sens. Spat. Inf. Sci. 2022, 43, 401–407. [Google Scholar] [CrossRef]
  32. Meshlab Web Site. Available online: https://www.meshlab.net/ (accessed on 28 July 2023).
Figure 1. Schematic operative workflow applied to this research analysis: from preliminary steps to post-processing procedures.
Heritage 06 00317 g001
Figure 2. Schematic representation of structured-light scanning operation: trigonometric triangulation between the object, the camera and the light source. The scanner calculates the triangulation angle α and light deformation on the object.
Heritage 06 00317 g002
Figure 3. The tested structured-light scanners: (A) Artec Micro; (B) Artec Space Spider.
Heritage 06 00317 g003
Figure 4. Cuneiform replica tablet considered for this analysis: (A) lenticular tablet from UPM, diameter 70 mm, max-thickness 27 mm; (B) rectangular tablet from UPM, length 35 mm, width 30 mm, thickness 16 mm; (C) squared tablet, length 25 mm, width 25 mm, thickness 9 mm.
Heritage 06 00317 g004
Figure 5. 3D model of the lenticular tablet created with Artec Micro: 3D resolution 0.03 mm.
Heritage 06 00317 g005
Figure 6. 3D model of the lenticular tablet created with Artec Space Spider: 3D resolution 0.08 mm.
Heritage 06 00317 g006
Figure 7. Details of 3D models related to the lenticular tablet created with Artec Micro (A) and Space Spider (B). Here can be noticed differences between 3D resolutions: 0.03 mm and 0.08 mm.
Heritage 06 00317 g007
Figure 8. 3D model of the rectangular tablet created with Artec Micro: 3D resolution 0.03 mm.
Heritage 06 00317 g008
Figure 9. 3D model of the rectangular tablet created with Artec Space Spider: 3D resolution 0.08 mm.
Heritage 06 00317 g009
Figure 10. Details of 3D models related to the rectangular tablet created with Artec Micro (A) and Space Spider (B). Here can be noticed differences between 3D resolutions: 0.03 mm and 0.08 mm.
Heritage 06 00317 g010
Figure 11. 3D model of the squared tablet created with Artec Micro: 3D resolution 0.03 mm.
Heritage 06 00317 g011
Figure 12. 3D model of the rectangular tablet created with Artec Space Spider: 3D resolution 0.08 mm.
Heritage 06 00317 g012
Figure 13. Details of 3D models related to the squared tablet created with Artec Micro (A) and Space Spider (B). Here can be noticed differences between 3D resolutions: 0.03 mm and 0.08 mm.
Heritage 06 00317 g013
Figure 14. Texture diffuse mapping: Micro models (AC); Space Spider models (DF).
Heritage 06 00317 g014
Figure 15. Lenticular tablet. Comparison between two different outputs: (A) Micro model; (B) Spider model; (C) two models aligned and registered (models overlapped, error 0.001 mm).
Heritage 06 00317 g015
Figure 16. Lenticular tablet. Distance Map (mesh to mesh) between Micro and Spider models: maximum distance (error scale) 0.250 mm; absolute distance 0.012 mm; RMSe 0.017 mm.
Heritage 06 00317 g016
Figure 17. Rectangular tablet. Comparison between two different outputs: (A) Micro model; (B) Spider model; (C) two models aligned and registered (models overlapped, error 0.001 mm).
Heritage 06 00317 g017
Figure 18. Rectangular tablet. Distance Map (mesh to mesh) between Micro and Spider models: maximum distance (error scale) 0.200 mm; absolute distance 0.039 mm; RMSe 0.031 mm.
Heritage 06 00317 g018
Figure 19. Rectangular tablet. Comparison between two different outputs: (A) Micro model; (B) Spider model; (C) two models aligned and registered (models overlapped, error 0.001 mm).
Heritage 06 00317 g019
Figure 20. Rectangular tablet. Distance Map (mesh to mesh) between Micro and Spider models: maximum distance (error scale) 0.200 mm; absolute distance 0.023 mm; RMSe 0.022 mm.
Heritage 06 00317 g020
Figure 21. Micrometric details of 3D cuneiform tablet. Zoom and metric evaluation of Micro (brown) and Space Spider (blue) models: lenticular tablet (A,D); Rectangular tablet (B,E); squared tablet (C,F).
Heritage 06 00317 g021
Figure 22. Lenticular replica tablet. Post-processing render and shader filters. Micro model: (A) rendered depth map, (B) dimple shader with custom light direction, (C) shader related to the radiance inverted map. Spider model: (D) rendered depth map, (E) dimple shader with custom light direction, (F) shader related to the radiance inverted map.
Heritage 06 00317 g022
Figure 23. Rectangular replica tablet. Post-processing render and shader filters. Micro model: (A) rendered depth map, (B) dimple shader with custom light direction, (C) shader related to the radiance inverted map. Spider model: (D) rendered depth map, (E) dimple shader with custom light direction, (F) shader related to the radiance inverted map.
Heritage 06 00317 g023
Figure 24. Squared replica tablet. Post-processing render and shader filters. Micro model: (A) rendered depth map, (B) dimple shader with custom light direction, (C) shader related to the radiance inverted map. Spider model: (D) rendered depth map, (E) dimple shader with custom light direction, (F) shader related to the radiance inverted map.
Heritage 06 00317 g024
Figure 25. Schematic analysis on polygons (triangles) count (million) for each cuneiform tablet.
Heritage 06 00317 g025
Figure 26. Graphic schema on density ratio related to polygons per mm3 for each cuneiform tablet.
Heritage 06 00317 g026
Figure 27. Schematic analysis RMSe related to distance map Micro/Space Spider for each cuneiform tablet.
Heritage 06 00317 g027
Table 1. Metric information concerning acquisition processes of Artec Micro and Space Spider.
3D Scanner3D Accuracy3D ResolutionAcquisition Speed
Artec Micro0.01 mm0.029 mm1 mln points/s
Artec Space Spider0.05 mm0.1 mm1 mln points/s
Table 2. Example 1. Lenticular cuneiform tablet. Metric information concerning acquisition processes of Artec Micro and Space Spider.
3D ScannerMax. ErrorScans/FramesResolutionPolygons
Micro0.00 mm2/500.03 mm29,270,798
Space Spider0.1 mm5/35260.08 mm4,003,584
Table 3. Example 2. Rectangular cuneiform tablet. Metric information concerning acquisition processes of Artec Micro and Space Spider.
3D ScannerMax. ErrorScans/FramesResolutionPolygons
Micro0.00 mm6/960.03 mm10,457,596
Space Spider0.1 mm4/36060.08 mm1,480,838
Table 4. Example 3. Squared cuneiform tablet. Metric information concerning acquisition processes of Artec Micro and Space Spider.
3D ScannerMax. ErrorScans/FramesResolutionPolygons
Micro0.00 mm2/600.03 mm5,328,852
Space Spider0.1 mm3/22210.08 mm1,322,622
Table 5. Volume in mm3 related to all the analysed cuneiform replica tablets.
Lenticular TabletRectangular TabletSquared Tablet
Volume 61,412.31 mm314,870.54 mm35,582.57 mm3
Table 6. Differences between Micro and Space Spider models related to density of polygons per mm3.
3D ScannerLenticular TabletRectangular TabletSquared Tablet
Micro477 poly/mm3703 poly/mm3955 poly/mm3
Space Spider65 poly/mm399 poly/mm3237 poly/mm3
ratio7.347.104.03
Disclaimer/Publisher’s Note: The statements, opinions and data contained in all publications are solely those of the individual author(s) and contributor(s) and not of MDPI and/or the editor(s). MDPI and/or the editor(s) disclaim responsibility for any injury to people or property resulting from any ideas, methods, instructions or products referred to in the content.

