1. Introduction
A large proportion of cultural heritage collections exist outside of air-conditioned spaces. These include historic houses, religious buildings, and archaeological sites, amongst many others. Whilst attempts have been made to install air conditioning in such buildings, without a good understanding of the building envelope performance, many of these have resulted in very poor control. The standards and guidelines for preventive conservation have, on the whole, been written for large institutions, explicitly or implicitly assuming air conditioning. They specify bands for temperature and relative humidity (RH), and sometimes for maximum pollution concentrations and light levels [
1,
2,
3]. The assessment of compliance is fairly straightforward. Unfortunately, such an approach is extremely energy-intensive and has a large carbon footprint. These concerns recently prompted a major alteration to a modern art museum in Berlin that is under construction [
4]. Assessing monitored environmental data in naturally ventilated buildings is more complex. The environment is complex, with the temperature, RH, and both gaseous and particulate pollution levels varying over several time periods and frequently with strong seasonal variations [
5,
6]. In naturally lit buildings, the light, UV, and NIR levels also vary strongly. Damage functions are well-suited to assess environmental data in such situations. The term originated in engineering and does not translate directly to material cultural heritage, although it is widely used. In engineering, the materials and their processing are generally well-characterised, and the required properties and failure levels are well-known. The materials forming cultural heritage are almost never fully characterised (possibly with the exception of some iconic objects), and their processing methods are only roughly known. Their response to the environment depends on their exact composition—copper responds differently to bronze, and the response of wood depends on the species and cut. Whilst historical techniques can provide some indication, only close analysis (often instrumental) can provide the necessary information. This issue is compounded for portable collections, which often have several potential forming techniques and a long history of materials masquerading as other materials. The values ascribed to cultural heritage objects are complex, and deterioration may affect different values in very different ways. The superimposition of a value function on top of a damage function has been suggested as a way to overcome this [
7]. Determining such value functions requires significant social science research. Perhaps the term response function is better suited for the numerical description of changes in cultural heritage objects. It is probably best to consider the results of such functions in terms of the magnitude of risk and not exact change, as the materials are very variable, and small differences can lead to very different amounts of change. For example, the main deterioration reaction in archaeological iron is the transformation of iron chlorides into akageneite. This reaction generates a volume increase that can lever layers of wrought iron apart. The extent to which this occurs depends on the size of the void in which the iron chlorides are located. The amount of akageneite generated is a function of the RH, but the same amount in two objects can cause no or a catastrophic loss of material [
8,
9,
10].
Response functions can be determined through various routes.
A property or series of properties of an object or surrogate can be measured through aging under various levels in laboratory experiments. The change in properties is related mathematically to the levels using a variety of models. The complexity of cultural heritage objects means there are many issues with surrogates and there are ethical issues to using objects [
6,
11]. The slow deterioration rates of many objects under ambient conditions mean some form of acceleration is generally required, and the issues of relating deterioration rates at higher temperatures, RH values, pollution concentrations, or light doses to those under ambient conditions are well-recognised [
12,
13]. The complexity of environments in naturally ventilated buildings also generates a need for many levels to be produced. The dimensional change and mould functions developed by the Image Permanence Institute (IPI) in their eClimateNotebook software are examples of this approach. The dimensional change function maps the RH onto the United States Forest Products Laboratory isotherms for an average wood, with a user-selectable equilibrium time (the data are averaged over this period) [
14]. The mould function slightly adapts published microbiological growth studies on dried beans, grains, and grasses and relative growth studies on agar plates using observations in archival collections [
14].
With sensitive methods to determine changes in properties, similar work can be undertaken in the actual environments of interest. This requires long exposures and multivariate methods to generate the response functions. Most functions determined in this way have been for outdoor exposure, where the deterioration rate is much faster [
15]. However, improvements in analytical methods and their in situ application has allowed a limited number of indoor functions to be generated [
16,
17,
18]. The functions developed are only valid under the range of conditions the materials were exposed to.
The modelling of the physical, chemical, or combined properties of a material or materials in an object and their response to environmental conditions provides a third general approach. Capturing sufficiently the complexity of the objects is a significant challenge. This approach requires a degree of expertise, and the models are difficult to make available for non-expert users. The wide number of possible environmental conditions limits the utility of providing a series of scenarios, and some way of inputting the user’s actual data is the best outcome. This has only been developed with one model for two materials and a limited number of geometries so far [
19,
20]. Many other models have been or are being developed [
21,
22,
23,
24,
25]. It is possible to model the decay processes themselves, and the ECOS model for salt activity has been used quite widely. It does have some limitations, however, as recently described [
26].
There has been a reluctance in the conservation field to accept modelling results to make environmental decisions [
27]. There are legitimate concerns regarding surrogates or models capturing the complexity of cultural heritage objects and the impact of natural aging and especially burial. Measurements of deterioration rates to verify modelled data are therefore important. A number of examples are included in this work.
The use of response functions to answer a number of preventive conservation questions in different scenarios will be illustrated through a series of case studies. The examples were selected to illustrate the different types of questions faced in preventive conservation and are limited by the available damage functions. The work is structured according to the three main deterioration routes observed: physical damage (mechanical), biological damage, and chemical damage, with one or more examples given for each.
Materials science effectively dictates the value of preventive conservation, since its outcomes define criteria applied by practitioners. The conservation and care of collections increasingly uses specified values and ranges for variables such as relative humidity (RH), temperature, and light to delineate safe criteria for the storage and display of materials, as well as for identifying regions of risk. These values form the preventive conservation evidence that is used to argue for resources and design specifications within the heritage sector. Their value in practice is related to the strength of the data used to derive them. Understanding structure and decay mechanisms and rates of change is an essential factor for deriving preservation standards. This paper focuses on the individuality of objects and what this may mean for setting standards.
2. Physical Damage to Rigid Hygroscopic Organic Materials
The expansion and contraction of materials such as wood through interaction with water vapour is acknowledged as a major cause of deterioration. In most situations, the response to RH dominates this interaction. Temperature has an effect on isotherms, but this is much smaller. The response is complicated by the slow response of thick materials to environmental RH changes, induced moisture gradients, and creep and fatigue. The physical properties and water vapour uptake and transport alter with aging. There is evidence of objects acclimatising to their environments, as demonstrated by various approaches [
19,
28,
29]. Three response functions are readily accessible, HERIe [
20], IPI [
30], and Climate toolbox [
31].
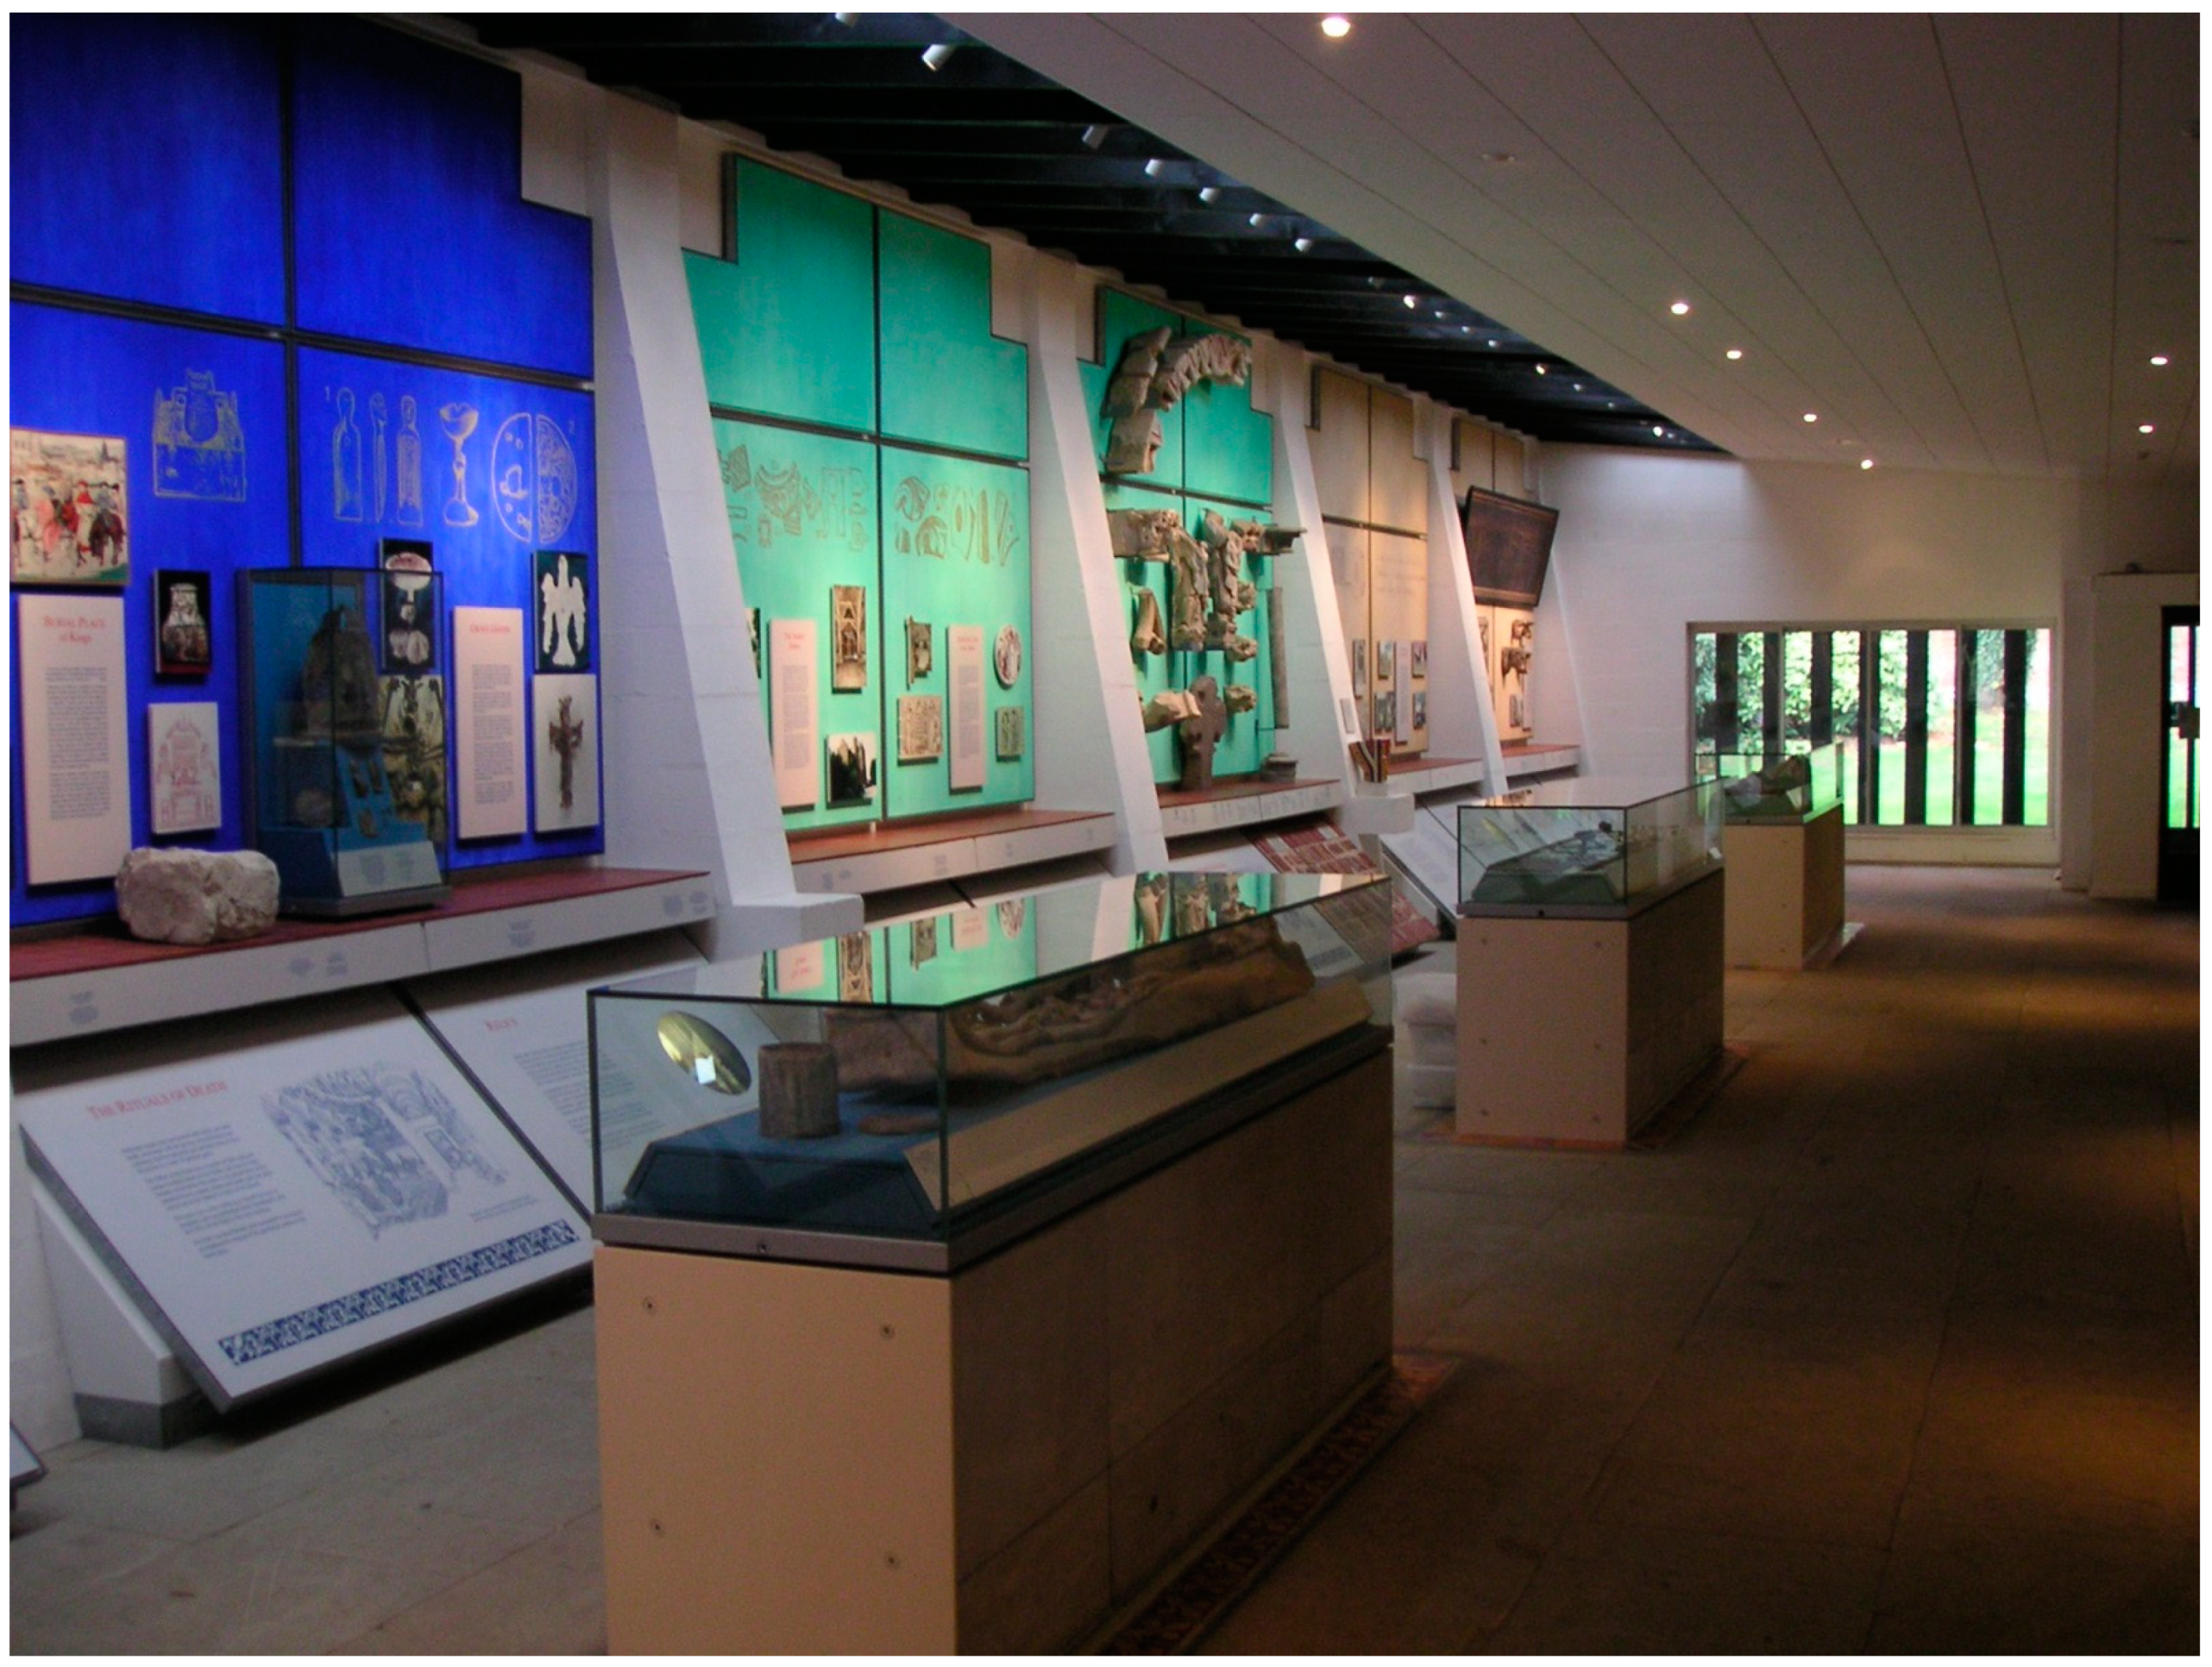
Probably the most common question is as follows: is the monitored environment acceptable, or does it require modification? The ruins of St Augustine’s Abbey, Canterbury, UK contain a small, modern museum and visitor centre built in 1998. A contemporary (1960s) panel painting with a view of the Abbey ruins is part of the collection displayed (
Figure 1).
The building has thermostatically controlled underfloor heating. The painting was in poor condition when displayed on opening. Several years of modifications to the underfloor heating set points eventually yielded an acceptable winter RH in the space, above 35%. In the recent unprecedentedly hot summer in the UK, the RH dropped below 35% on four short occasions (less than 6 h), reaching as low as 28% on one of those occasions. The RH data (Rotronic Hydroclip probe) were input into the HERIe mechanical damage module, using the parameters for a 5 mm oak panel with soft gesso and water ingress from both faces (the lacquer only remains as small patches on the painted surface). The panel was clearly re-used carpentry from an unknown source and date. The results are shown in
Figure 2.
The modelled strain did not exceed the elastic limit for gesso (0.002) for the majority of the data. There was a slight exceedance for a short period at the lowest RH, generating a risk index of 0.08.
Another common task is to compare two environments, often prior to a potential object move or when deciding where an object is displayed, if several suitable locations are available. A common approach to assess environments is to set a percentage time in certain limits specification [
32,
33]. Kenwood house, London, UK has many rooms used to display objects. RH data (Rotromic hygroclip II probe) from two rooms (
Figure 3) were assessed from June 2020 to September 2020 using a 40–65% RH range. Room A was within the range for 2.25% of the period, and room B for 2.47% of the period. Despite these very similar metrics, the RH in room B clearly reached much higher values, and the drops in RH value were also larger. The data were also fed into the HERIe mechanical damage model for 5 mm oak, tangentially cut, and with water ingress from one side. Two oak cabinets are displayed in the abovementioned rooms, with approximately the same 5 mm thickness of wood. The limit was set to 0.02% strain. Acoustic emission monitoring was undertaken over the period described. Two Physical Acoustics Micro II systems were used, each with two WD sensors in anti-correlation mode [
34]. The energy detected was proportional to the increase in crack area occurring in the wood [
35]. Acoustic emission energy was only detected from the cabinet in room B, and the energy of each event is included in
Figure 3. The acoustic emission events occurred rapidly after the RH dropped from a high value. These corresponded with the points at which the HERIe model exceeded a strain of 0.004.
Given the large scale of many collections (the English Heritage Trust cares for over one million objects) and the limited conservation time, it is not unusual for small instances of deterioration to take some time to be observed on display. When deterioration is observed, a frequent question is: when did that event happen? Response functions can give an indication of this. In November 2008, an existing crack in a Cattaro panel painting displayed at Rangers House, London, UK was observed to have extended by approximately 2 mm (
Figure 4).
RH data from January to November that year were input into IPI climate notebook, and the % dimensional change index was calculated. This was the only response function available at that date. An equilibrium time of 3 days was selected from unpublished measurements of changes in panel painting dimensions. This figure is consistent with the dimensional changes measured by Wilk et al. [
36]. The zero dimension change is set at the value calculated from the average RH over the period used. The RH and dimensional change index from the IPI software are shown in
Figure 5.
As can be seen, two instances reached an index of 1, in early July and late October. IPI documentation states that: “%DC numbers identify areas of significant fluctuations in the environment, <1% the wood will go back to its actual form”. This seems to indicate a value above 1 may risk plastic deformation.
3. Biological Damage—Mould Growth
Mould growth is a significant problem, and outbreaks consume significant resources and have a large carbon footprint to remediate [
37]. Future climate models also predict an increasing risk of mould growth in many areas. The material has a strong influence on the likelihood of mould growth, as does the deposited dust (which can have a lower water activity than the material itself [
38]) and nutrients from gaseous pollution or contamination from prior use or handling. Environmentally, the temperature and RH, the time of exposure, and (probably) the ventilation rate are known to contribute, although the effect and mechanism of ventilation are not clear. Four response functions for mould growth were compared to observed mould and, in particular, outbreaks in more than fifty instances [
38]. The functions produced by the IPI and Wufi were found to best correlate with observed mould outbreaks and growth. Many historic environments are damp and encourage mould growth, but using the building enhances its chance of long-term preservation. A series of chalk tunnels beneath Dover Castle, UK were used as a hospital and combined operations centre during World War II and are dressed with collections from those dates, but not original to the tunnels. These are accessioned as props and not museum objects. However, the extreme environment means understanding the mould risk is essential to managing the site, and very significant mould outbreaks caused long closures in 2002 and 2006 (
Figure 6).
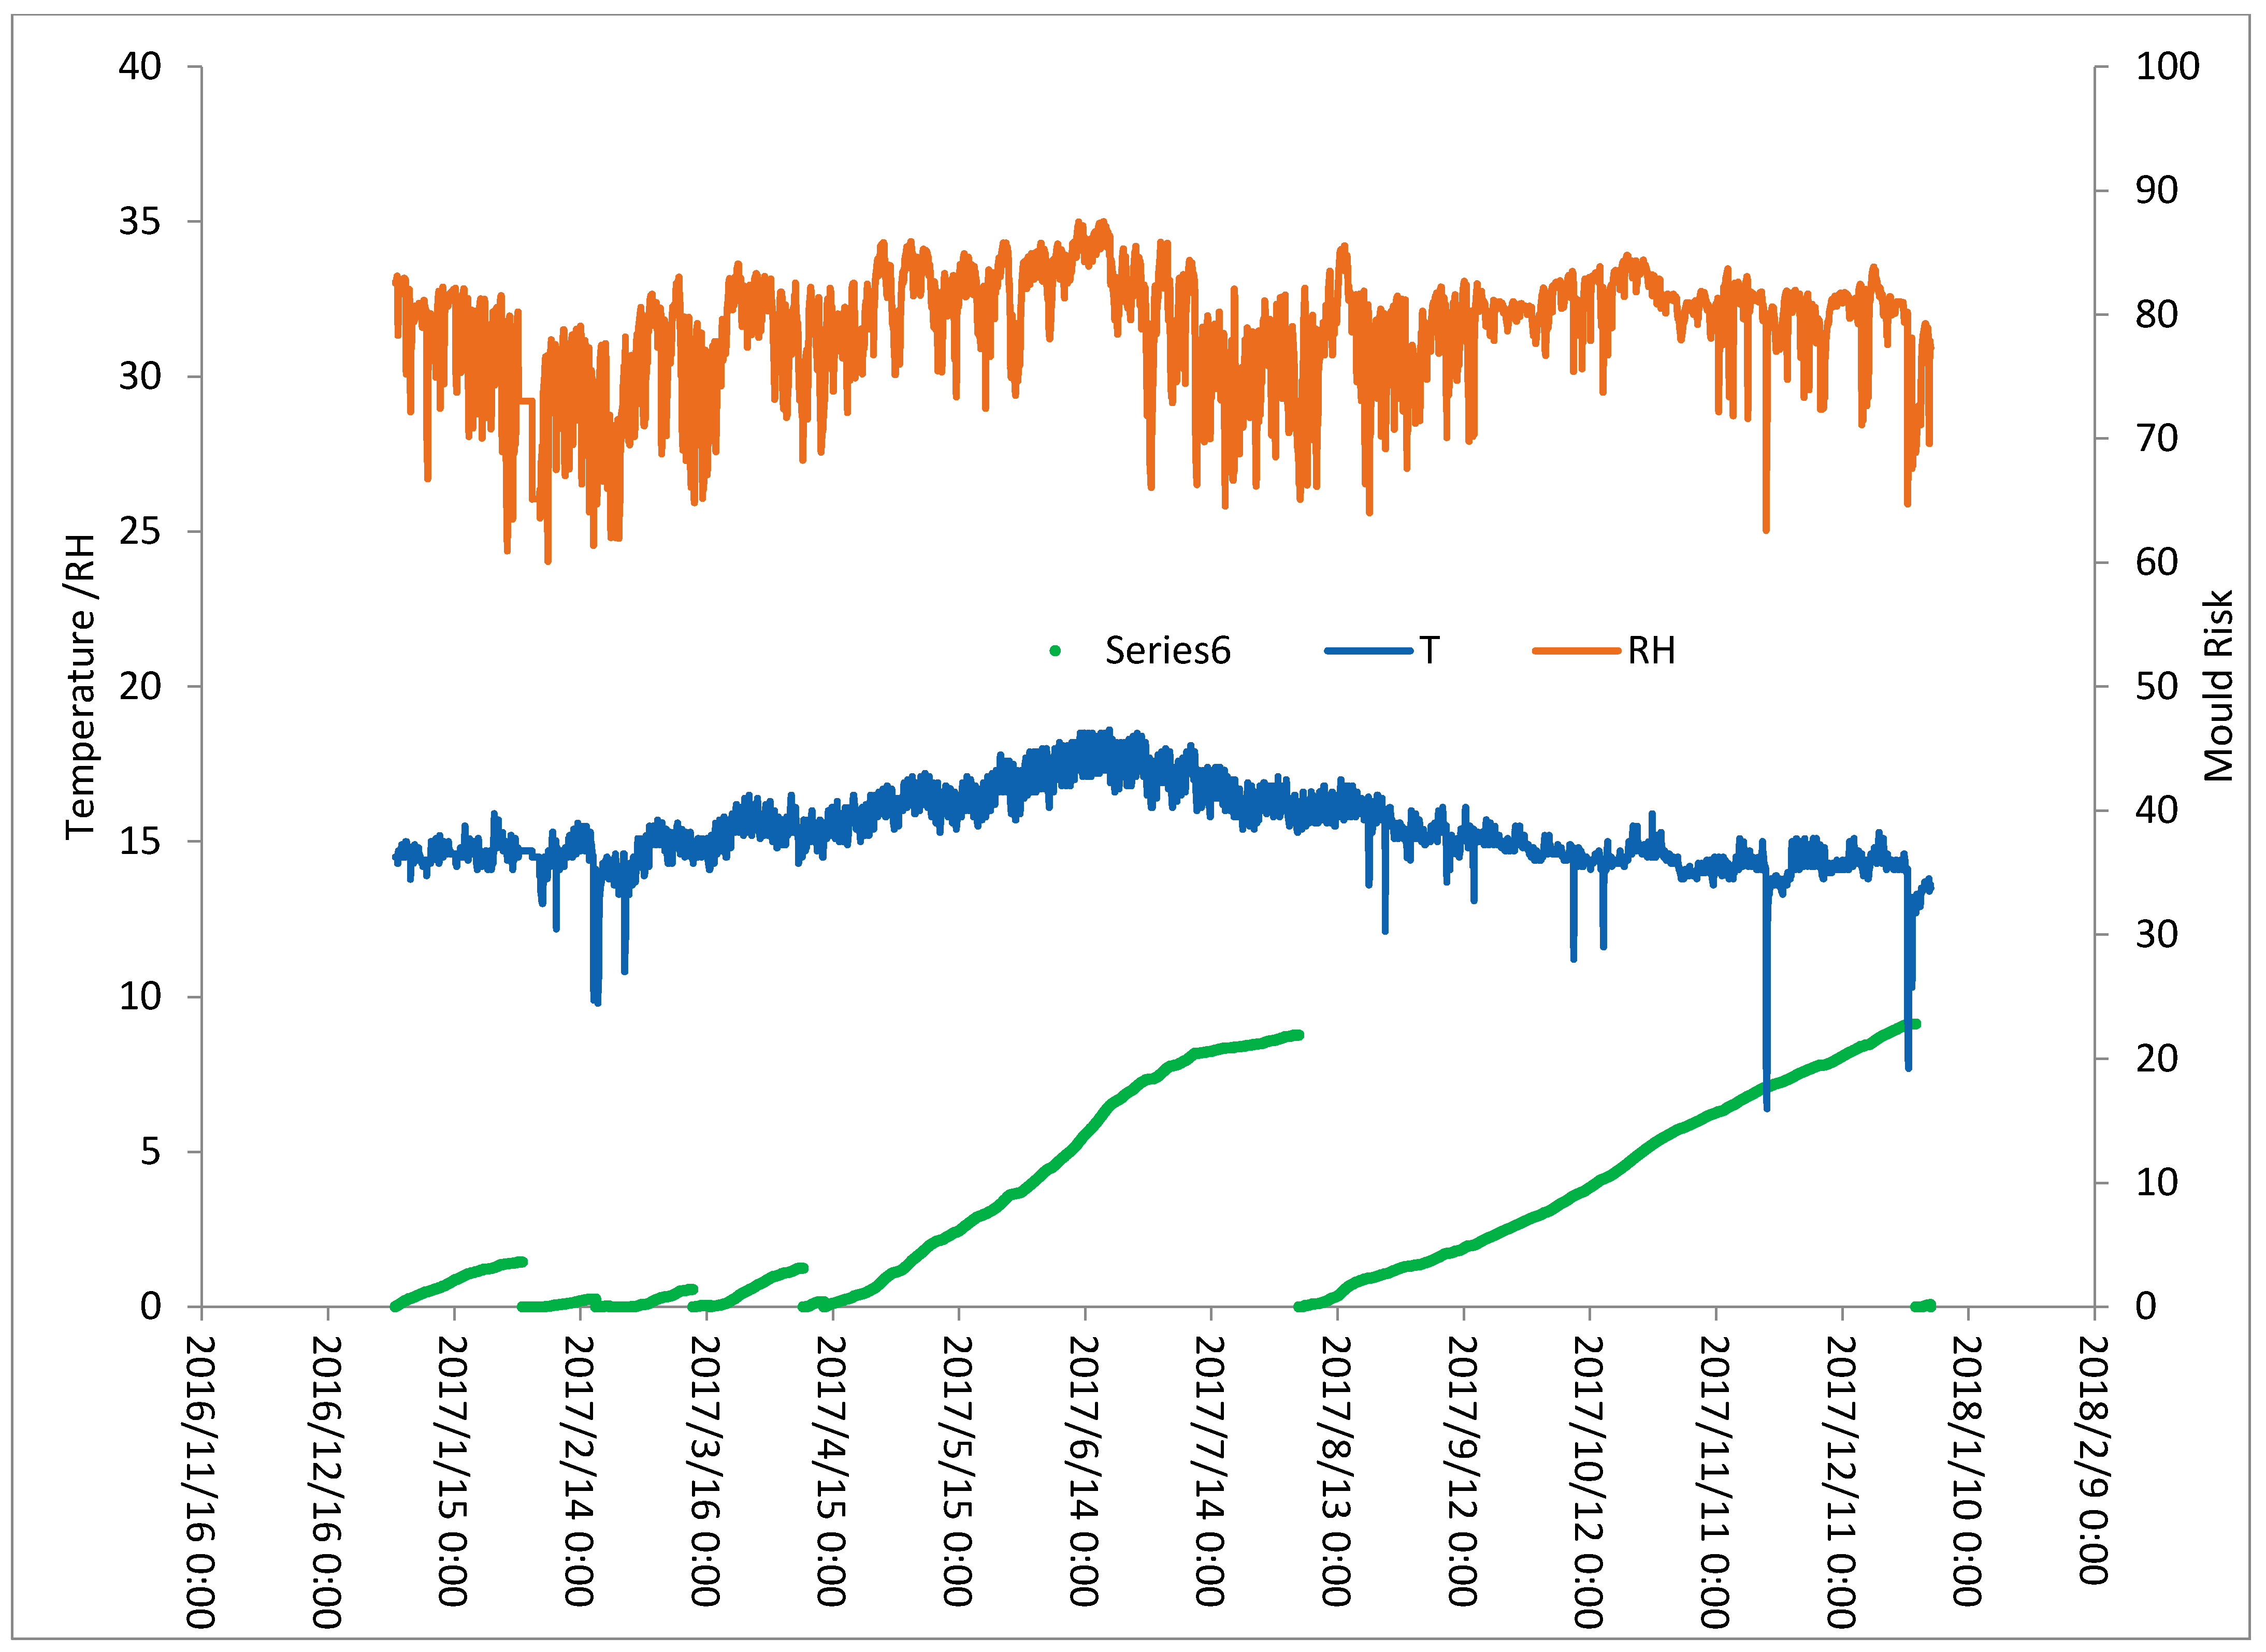
After remediation in 2006, a number of strategies were suggested to reduce the risk of mould in the future. The additional heating of the air was suggested, updating the 1940s heating elements to warm air circulated by a circulation system installed from a decommissioned battleship. Monitored temperature and RH data (ACR SR002 logger) from Gun Operations in the middle-level Casemate of the tunnels from 2007 were assessed with the IPI mould function (
Figure 7).
The mould risk was highest in the summer months. The large number of drops in RH was caused by the ventilation system bringing outside air into the tunnels. The distribution of mould risk would have made heating an inefficient strategy, as its strongest effect would be in the colder winter months. The ventilation system was upgraded to remove dead areas and controlled with an adaptive system so that it brought external air into the tunnels when the external absolute humidity was below that measured internally. When this was not the case (approximately 32% of the time), it recirculated the internal air. The inlet filtration was upgraded to remove complex hydrocarbon pollution from the adjacent ferry port.
4. Chemical Damage—Metal Corrosion
Metal corrosion is strongly affected by the presence of pollutant gases. For most metals, the RH also has a strong synergistic effect with pollution. Many metals have a critical RH, above which the corrosion rate increases dramatically [
39]. Depending on the pollutant concentrations present, this is frequently between 60 and 80% RH. Many locations housing cultural heritage metals reach such values at some point in the year. In the UK, this is often over the summer/autumn. With the exception of silver, temperature has much less impact on corrosion rates.
A copper alloy sculpture, shown in
Figure 8, was proposed for loan to Aplsey House, London, UK.
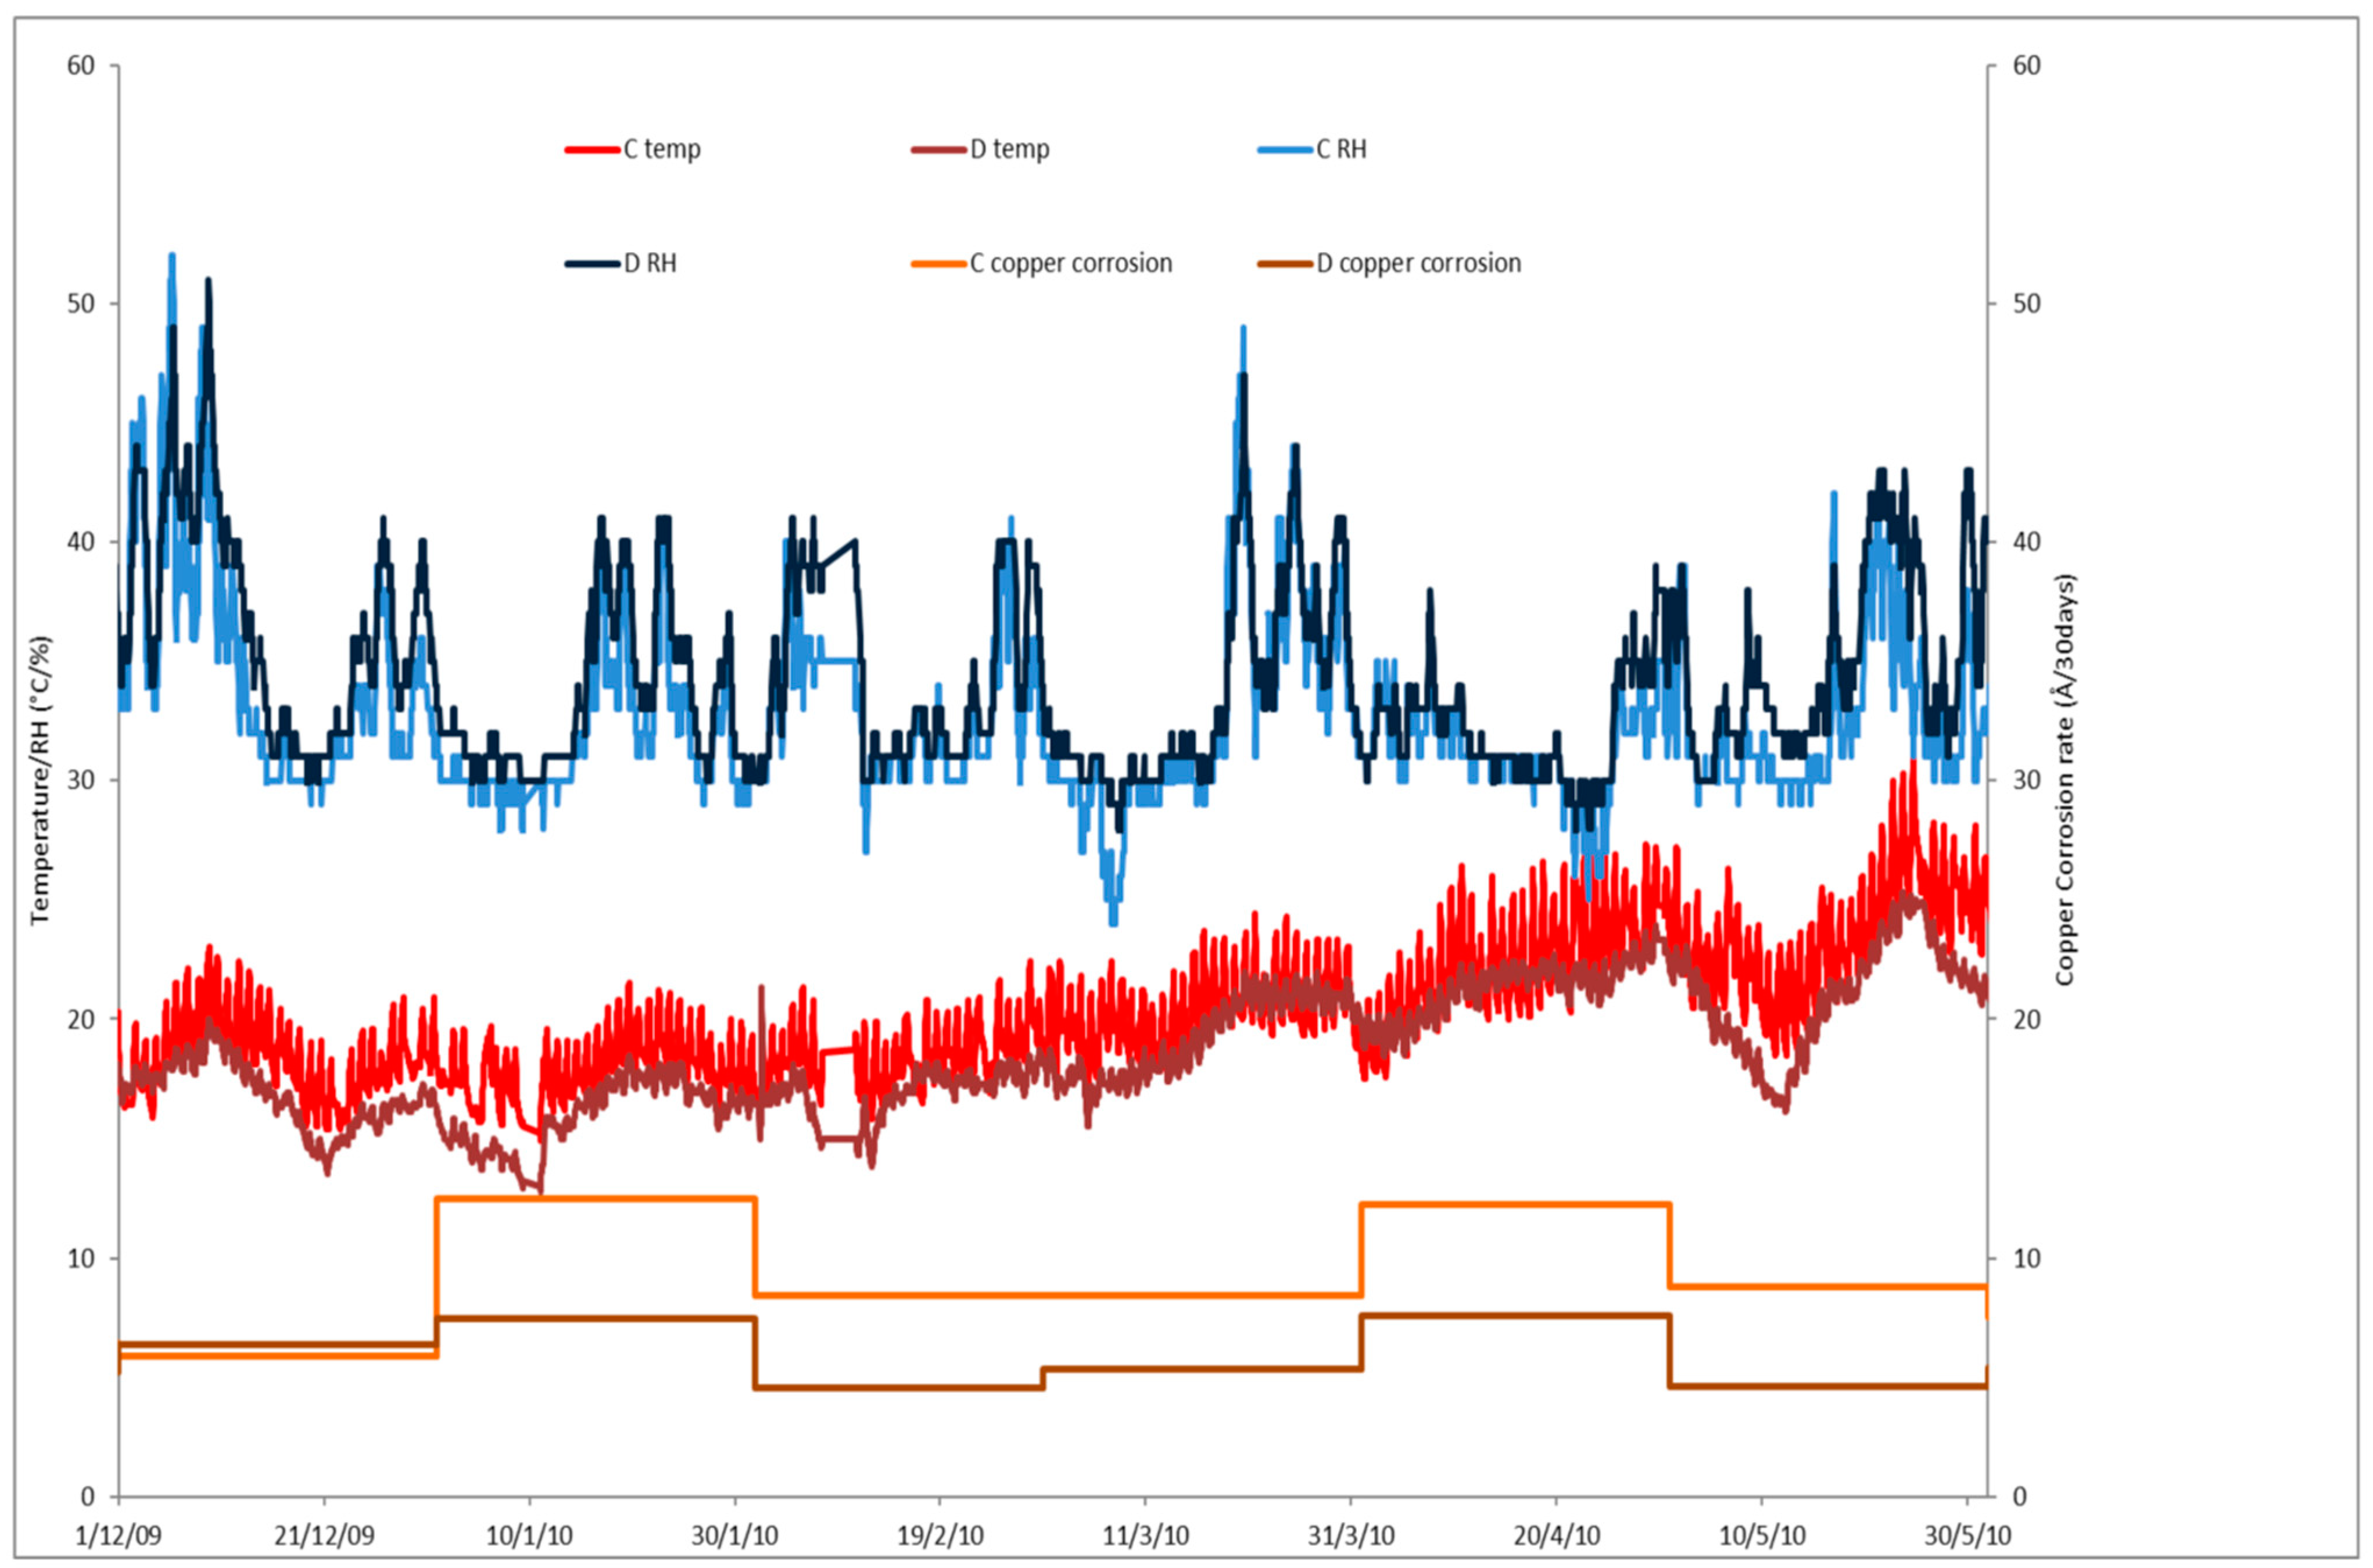
It could be accommodated in two rooms. The corrosion risk in the two rooms was assessed from temperature and RH data (Rotronic hydroclip II) and nitrogen dioxide, ozone, hydrogen chloride, sulfur dioxide, and hydrogen sulfide concentrations (diffusion tubes) [
40,
41]. The pollution data were collected from 30-day exposures, and average temperatures and RH values were calculated from the 60 min of measured data. The response function for copper developed by Thickett et al. was used with the data to estimate monthly corrosion rates over the proposed display period [
16]. Whilst resembling bronze and catalogued as such, portable XRF analysis (Bruker Tracer III/IV) indicated a relatively pure copper composition, over 98%, with the colouration presumably derived from patination. The results are shown in
Figure 9.
Solely considering the temperature and RH data, it is likely one would conclude that room C was better than room D. However, the calculated functions clearly showed that room C had the higher estimated corrosion rate for ten of the twelve months assessed (one month being equal). The sculpture was displayed in room D. To assess the reliability of the calculations, a series of copper alloy corrosion rate measurements were run near the object during the six-month duration of the display. AirCorr loggers with pure copper and copper/tin CnSn8 sensors were deployed along with a Purafil Onguard 4000 logger with a pure copper sensor. The corrosion rate estimates were also repeated with temperature, RH, and pollution measurements taken in the six-month period. The results are shown in
Figure 10.
The estimated values for the two six-month periods were slightly different in consecutive years, as would be expected, with January showing the largest difference, at almost 20%. The three measured corrosion rates showed the same trends and followed the estimated rates. The AirCorr copper showed a higher corrosion rate than the Onguard. This was, possibly due to the influence of particles on the copper corrosion rate. The Onguard system is essentially an extremely sensitive balance. As the copper corrodes, the coating mass increases, but the system has no way of differentiating from the mass gain caused by dust deposition. The sensor has a cover to reduce this and is deployed facing downwards, as per the manufacturer’s recommendations. The AirCorr works on increased resistance as the metal track corrodes, and dust deposition does not interfere with the measurement but can increase the corrosion rate [
42]. The copper tin alloy, as expected, showed significantly less corrosion than pure copper for all months. The function correctly predicted the corrosion rate trends, and the accuracy is probably sufficient for this use in preventive conservation. Historical copper alloys have a very wide range of compositions, and this has been shown to affect the corrosion rate. This emphasizes that the uncertainties in response functions in this area necessitate considering the results in terms of risk, and not as exact predictions. The statue was from a private lender and had not been analysed for composition.
Another common preventive conservation task is predicting the response in new builds or refitted existing buildings. Predicted environmental data can be obtained from building modelling for new builds (modelling is becoming increasing common in the design phase) or from the previous monitoring and experience of the likely changes from the refitting of existing buildings. Pollution data can be calculated from nearby automated station results and ingress modelling, such as the IMPACT model [
16,
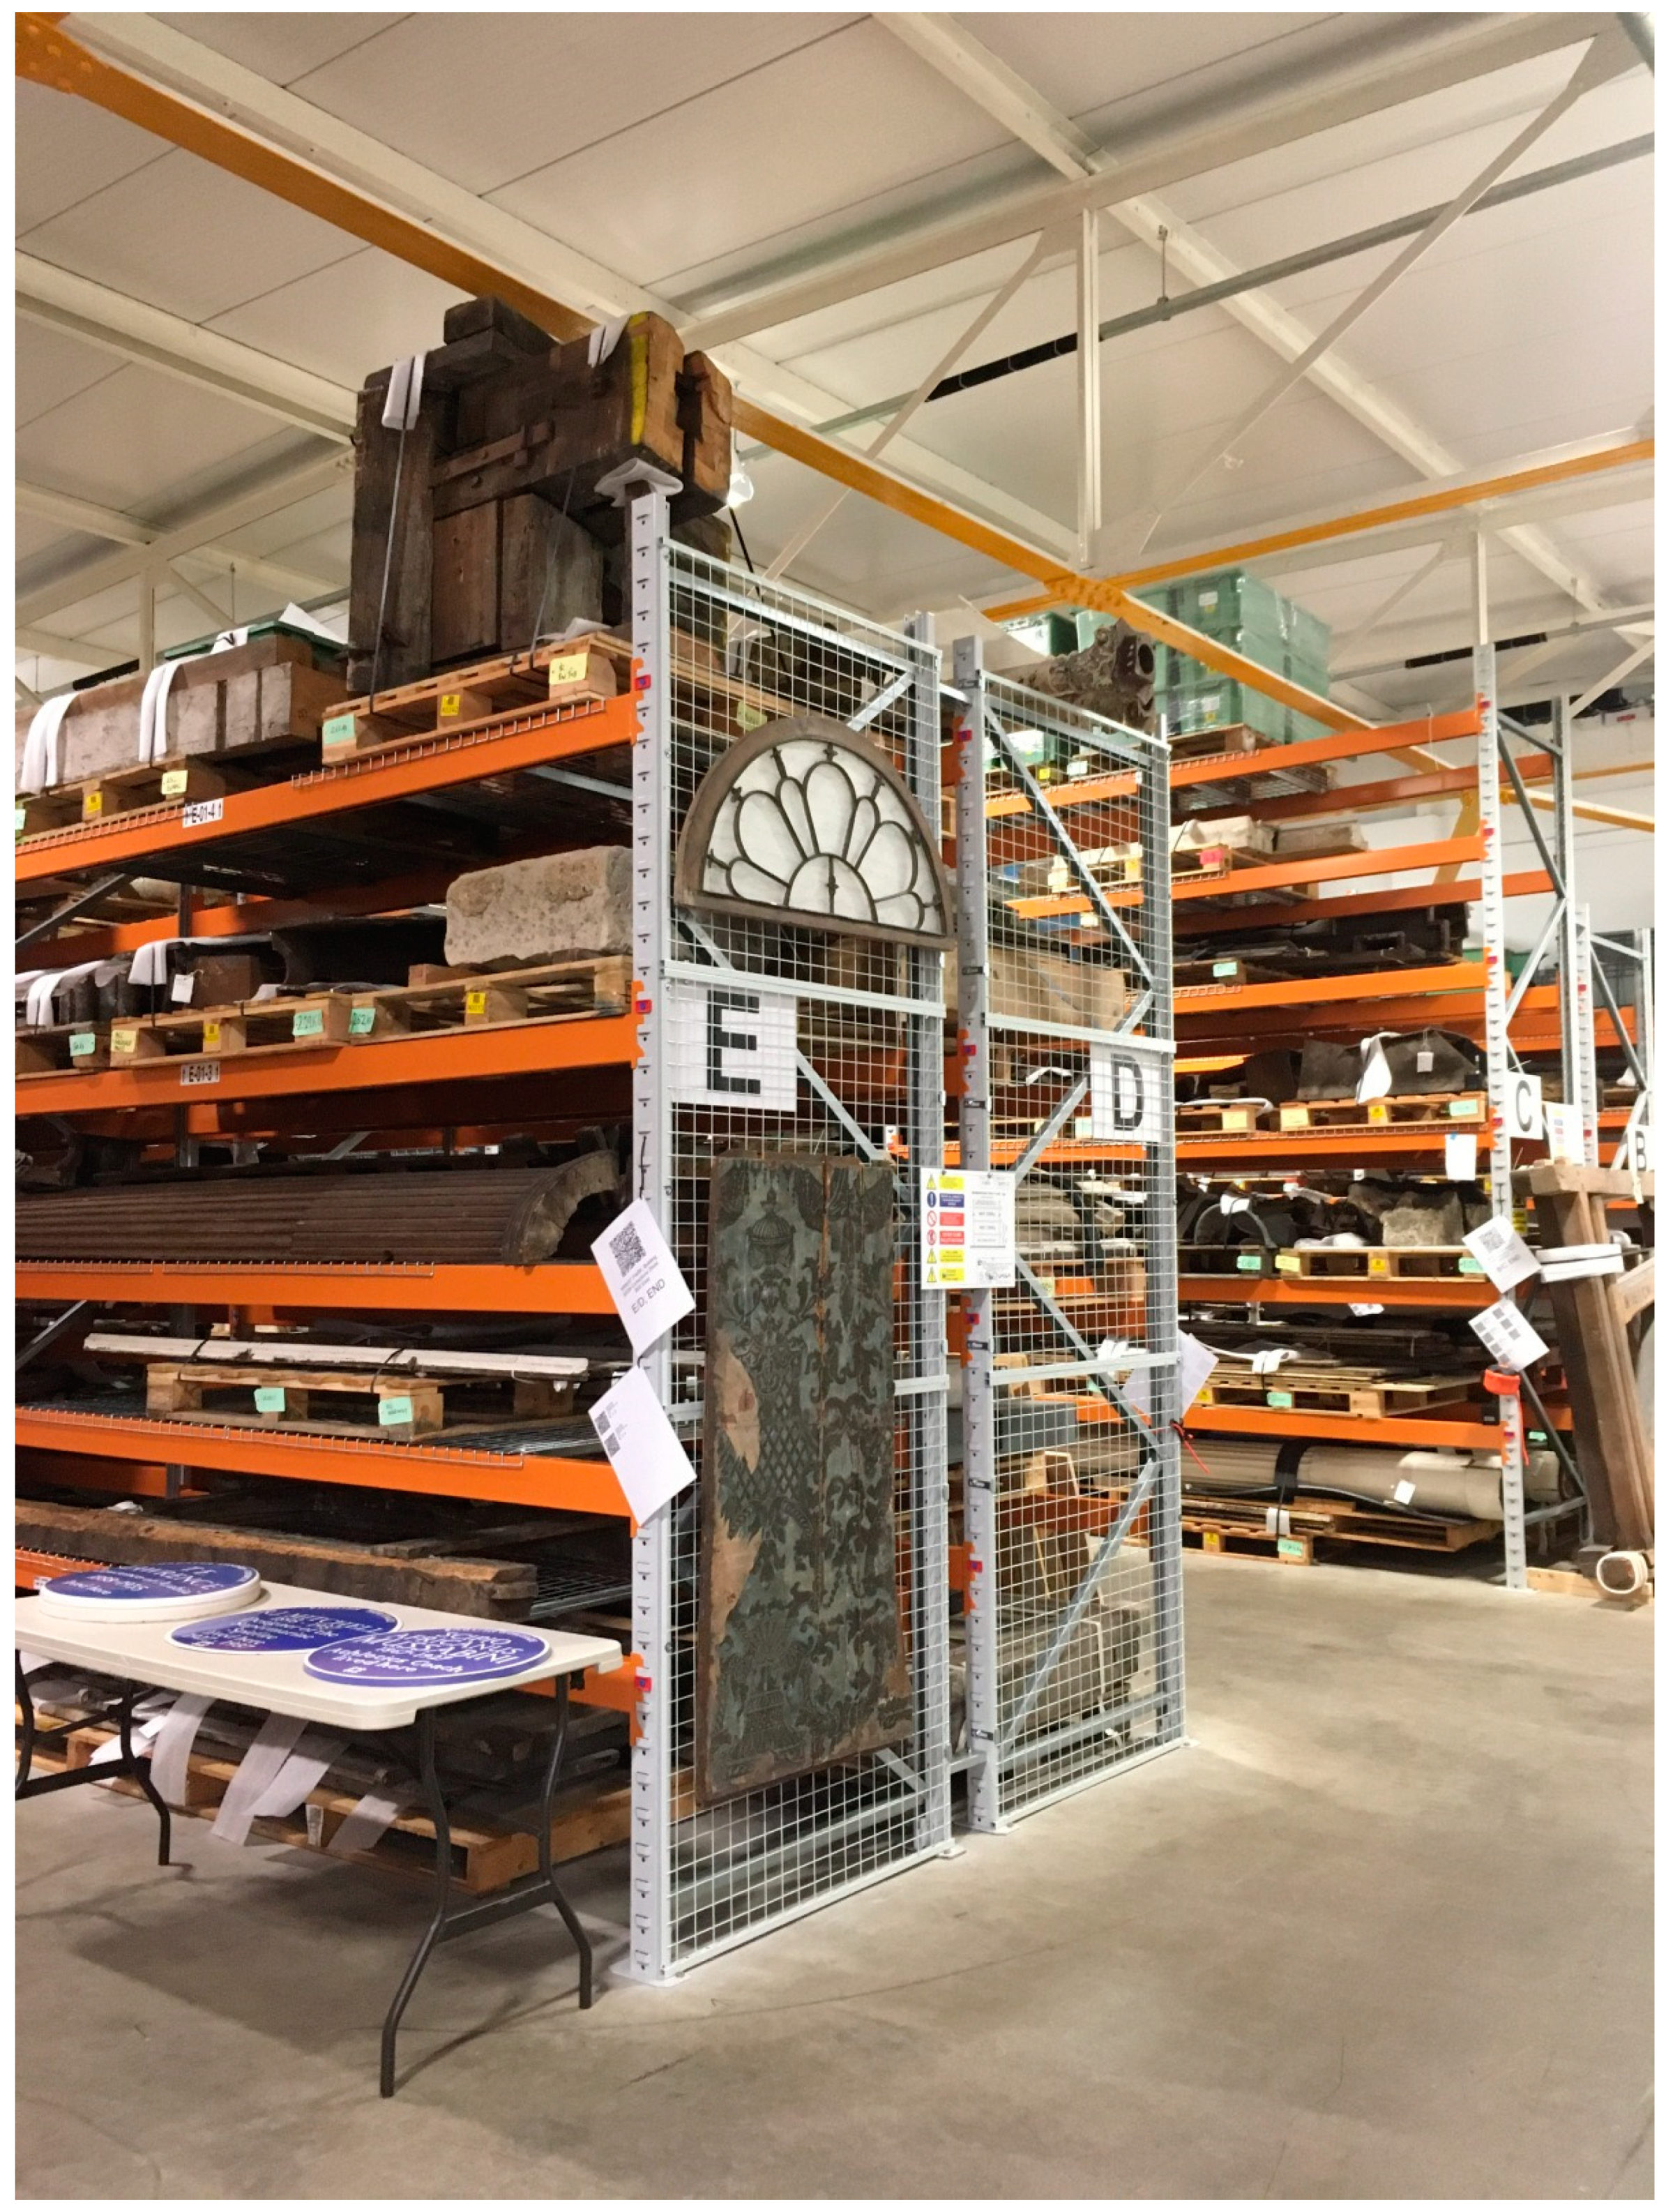
43]. English Heritage refitted a 1950s industrial building at Wrest Park as a collection store in 2011. The refit incorporated many features of the Danish passive storage concept [
44]. No mechanical conditioning was installed in the larger-volume space in the new store. Two smaller-volume spaces were dehumidified to house more sensitive collections (
Figure 11).
Collections were planned to move from four buildings at two sites. The predicted environments were compared with the measured environments at the existing sites via four response functions: the multiassess functions for carbon steel, cast bronze, and Portland limestone; an internally derived function for sodium-sulfate-laden polychrome limestone [
45], and a European standard for hygroscopic material [
14]. These functions were selected from those available to cover the majority of the collections present. For example, very little copper, zinc, or cast iron was to be stored there. To validate the approach, annual corrosion rates were measured at one of the existing stores by exposing mild steel and copper tin alloy coupons to ISO 9223 [
46]. After exposure, the coupons were chemically or electrochemically stripped, and the mass of metal lost was calculated [
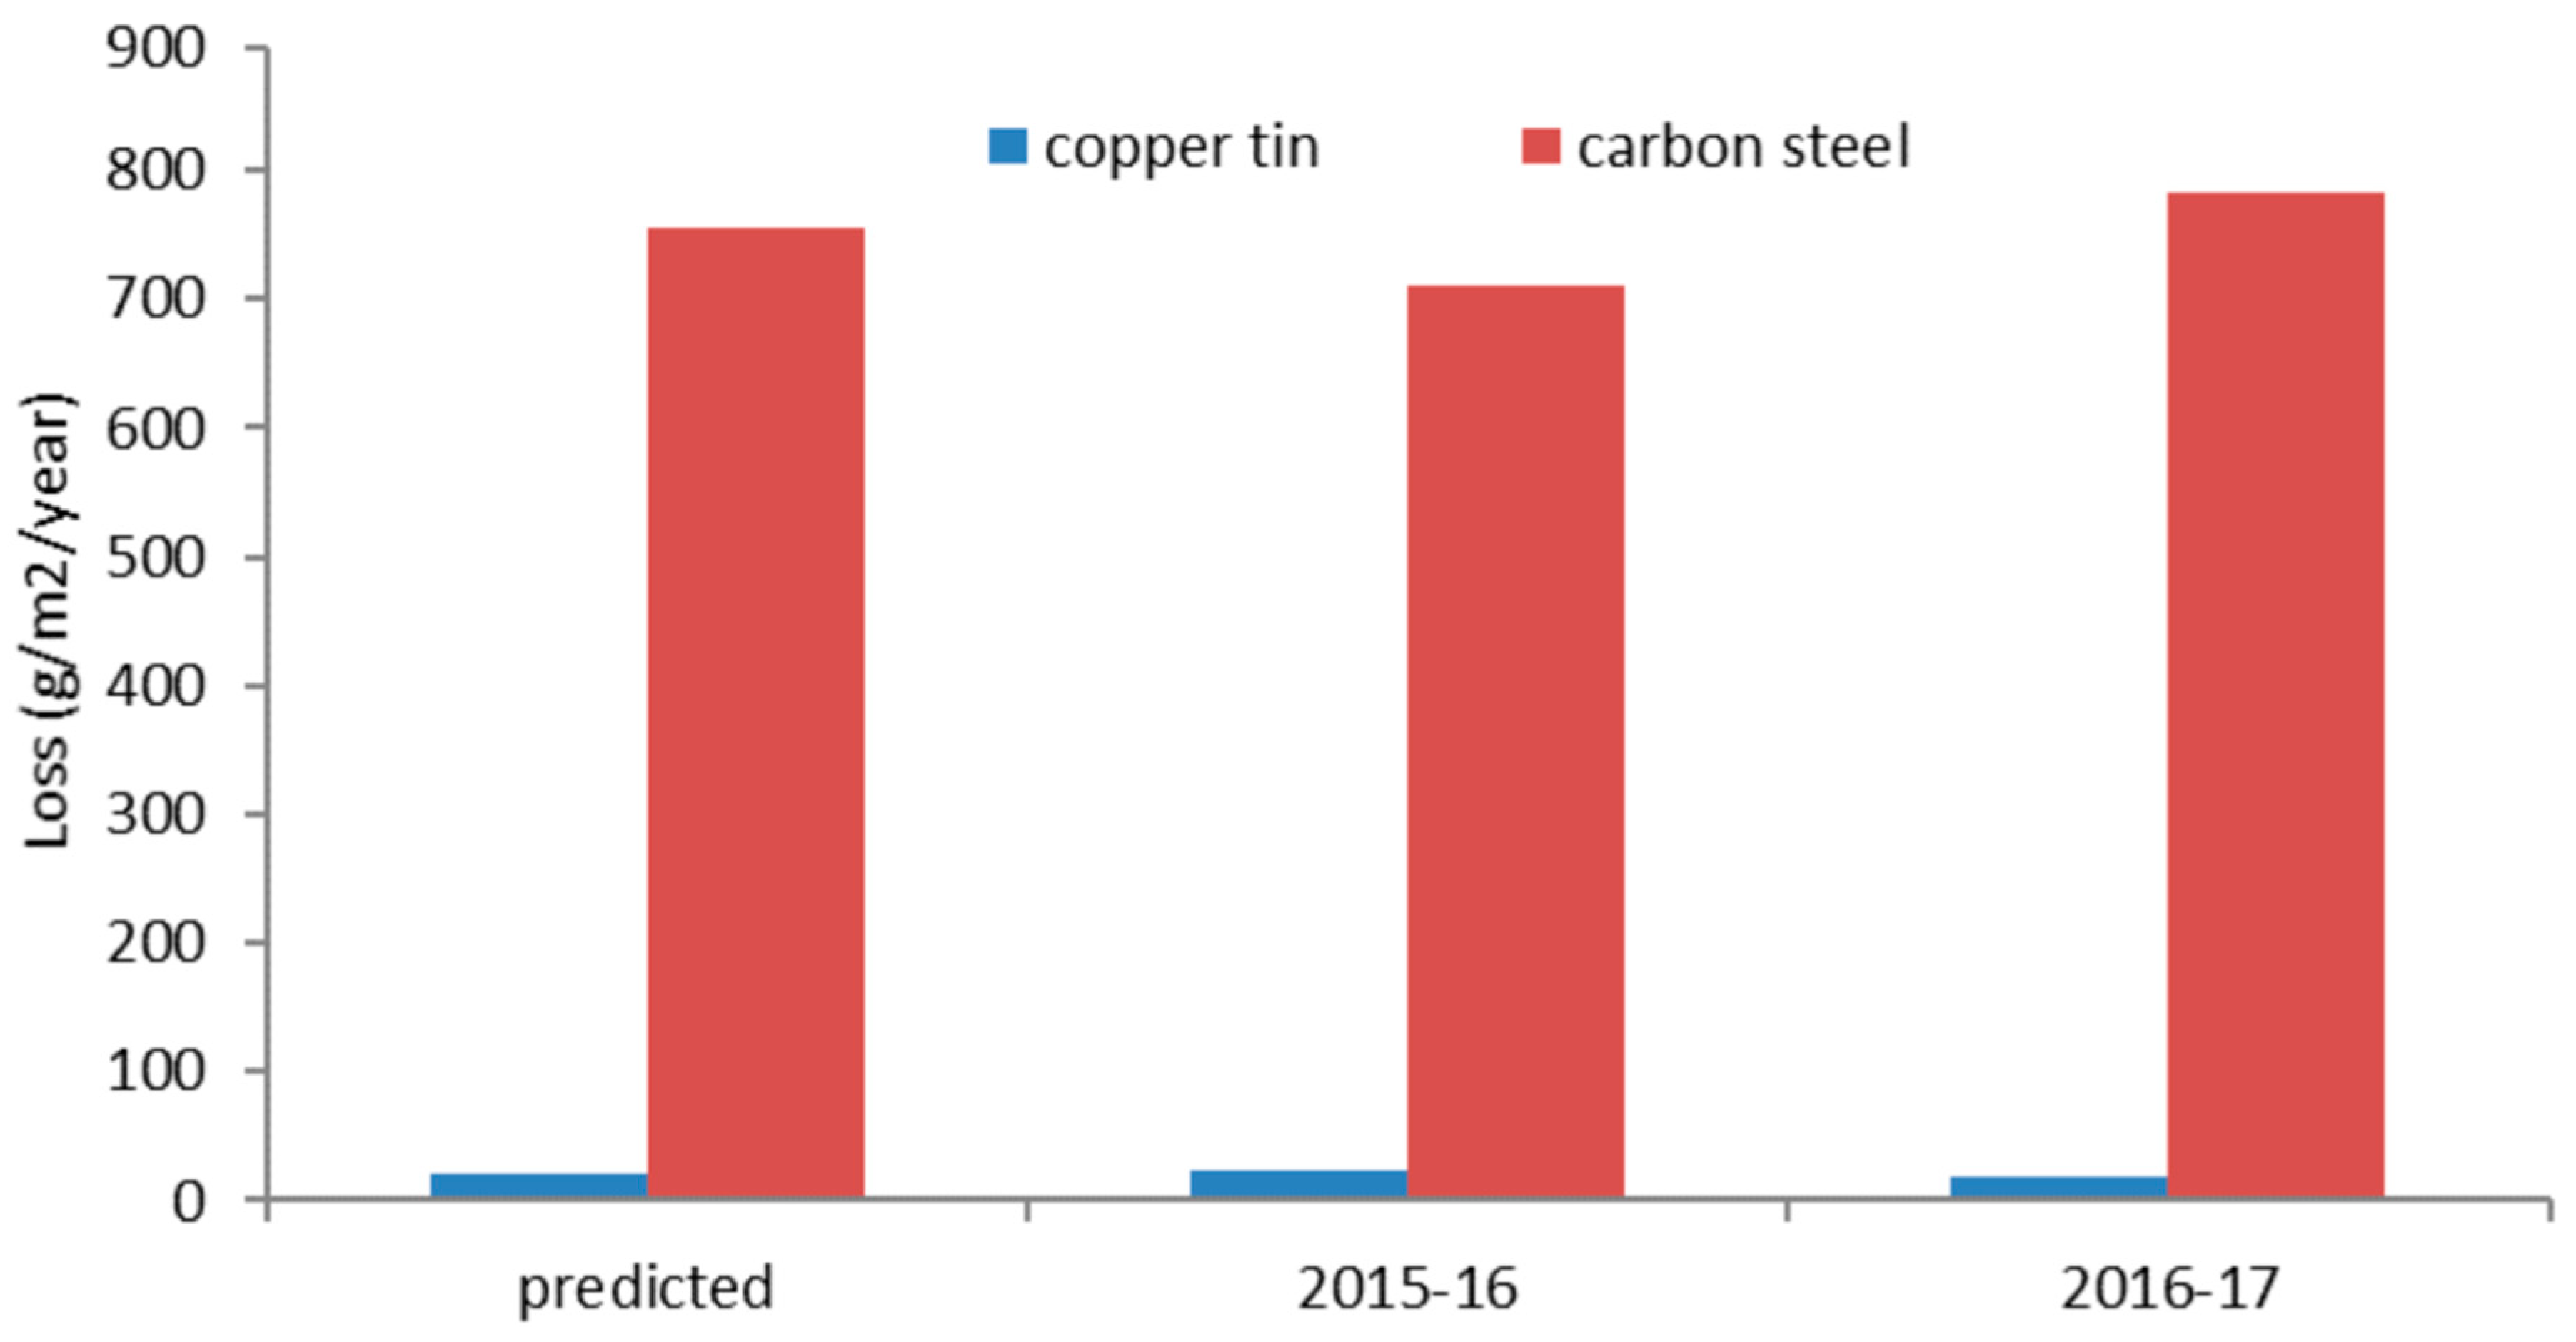
47]. Temperature and RH were measured (ACR SR002 loggers) and pollution measurements performed, as described previously. For the existing store, estimates were calculated for 2010-11 and compared to measured corrosion rates. Corrosion rates were also measured in 2011-12 to gauge year-to-year variation. The results are shown in
Figure 12.
The Wrest Park and Atcham estimated rates were similar. The predicted and measured corrosion rates were in reasonable agreement for 2010-11. There was some variation in the corrosion rate for 2011-12, but it was within 12% of the 2011-12 rates. The carbon steel corrosion rates were much higher than the copper tin alloy, and further measurements were only undertaken with carbon steel.
Prior to the move in 2012, a comparison was made between estimates based on IMPACT-modelled pollution data, estimates based on measured pollution data, and carbon steel corrosion rate measurements.
Figure 13 shows the measured carbon steel and cast bronze rate, along with the estimated corrosion rate based on measured gas concentrations in one room.
Good correlations were observed between the estimates and the measured corrosion rates. The new store showed comparable estimated corrosion rates to the existing store rooms, within the uncertainties of the method. This data helped the business case for the new store.
5. Sustainability
The use of response functions can aid sustainability in a number of ways. They can be used to inform an initial assessment of an environment for a collection and determine how much mitigation is required. This can involve microclimates such as showcases; full air conditioning; or less carbon-intensive room-conditioning solutions, conservation heating, dehumidification, or adaptive ventilation. Proposed approaches to reduce energy consumption and carbon footprints for existing air-conditioning systems include: seasonal shifts in set points; variable fan speeds; and reducing fresh air intake and periodic shut downs. These can produce short periods outside of the original temperature and RH ranges, the impact of which can be assessed with response functions. Reducing fan speeds and fresh air intake can increase pollutant levels, the impact of which can be assessed.
This can be combined with performance models of mitigation systems to generate estimated carbon footprints for different approaches. Performance models have been published for showcases and some dehumidifiers [
48,
49]. Building modelling frequently includes energy usage estimates for heating or air-conditioning systems. A model for managing silver tarnish has recently been developed [
50]. This combines the results of a response function for the silver tarnish rate [
16] with the perception level at which decision makers determine that silver needs cleaning to ascertain how frequently silver needs to be cleaned in a particular environment. Previous measurements are used to convert the response function rate in nm/year into the colorimetric co-ordinate b*, which best correlates with observers perception of early silver tarnish. The performance (expressed as the reduction in the tarnish rate) and carbon footprint of a number of different preventive conservation approaches are then calculated. The reference time period is set for the calculations. The embedded carbon of the materials used to clean the silver are calculated for the number of cleaning instances required in that period. For preventive conservation approaches, the embedded carbon and carbon footprint of the estimated energy and maintenance required are calculated. The model presently includes the following situations:
Room mitigation approaches—room filtration unit (Blue Clima), lacquering with Cannings Frigilene, a combination of both.
Display in showcases—showcase (based on air exchange rate), showcase filtration units (Camfil or Dynamx 5).
Cleaning approaches—prelim polish, silver dip (Cannings Frigilene removal).
Table 1 shows a set of data from an example calculated for Apsley House, London, UK.
The different approaches had a very wide range of carbon footprints. The model only considered the embedded carbon in the cleaning materials and did not include the scope-two emissions of running a conservation workshop and scope-three emissions of staff travel to work. The carbon footprint is only one factor feeding into decisions. Economics/resources are also clearly important and often the limiting factor. Each time a silver object is cleaned, there is a small loss of the original material, which will dramatically effect plated or finely detailed objects with repeated cleanings.
6. Conclusions
Damage functions clearly have a role in improving preventive conservation decisions by strengthening the evidence base. The very wide variety of cultural heritage material, the mainly unknown effects of aging and previous conservation treatments, and the different values ascribed to cultural heritage mean that care is required in interpreting these functions’ results in this field. For organic materials, whose responses are predominantly determined by RH fluctuations, functions exist that can assess environmental data, determine the impact of short-term deviations from control limits, and provide an indication of when cracking is likely to have occurred in the recent past. For multi-parameter phenomena, such as mould growth, they rationalise a complex dataset into something that has been shown to reasonably approximate observed risk. The combination of temperature and RH thresholds and time dependence means that the visual assessment of such data is extremely challenging and prone to errors in intermediate situations. Such an approach is adequate when there is a very high mould risk, but many cultural heritage environments fall into the intermediate range. For metal corrosion and other pollutant-induced degradation processes, response functions allow an understanding of the synergistic effects taking place. Reliance on purely temperature and RH data can be misleading when comparing environments for these processes. The functions tested showed good correspondence to measured responses, at least in the instances tested.
To be widely utilised, beyond being representative of the collections investigated, a good user interface, allowing the easy input of environmental data, is essential. Comprehensive descriptions and, ideally, the underlying equations, assumptions, and potential issues are critical to build user confidence. Indications about the confidence and use of the results would also be extremely useful.
Response functions are well-suited to predicting environmentally induced effects. Their use allows new building/space specifications to extend beyond the rigid ranges and limits that are often applied presently, and they have been widely used in climate change studies. The more refined risk assessment of complex environments they engender can significantly benefit sustainability. Combined with control performance models and lifecycle data, they can be used to predict carbon and other sustainability measures for different approaches to preventive conservation.
