Abstract
As organisations, museums are responsible for conserving, protecting, and displaying artwork and artefacts. Museum buildings must deliver an environment that will continue to provide this facility for both current and future generations. This research focused on presenting a museum with quantifiable and measurable data to help with climate adaptation planning. A methodology was developed using monitored data. Subhourly data for both indoor and outdoor temperature and humidity spanning the years 2012–2021 was used to produce a daily maximum, daily minimum, and daily average dataset. A sensitivity analysis determined which years to use to derive the indoor-outdoor relationships used in climate modelling. Future impacts were calculated using UK Climate Projections 2018 (UKCP18) data (12 models on a 2.2 km scale), as published by the Met Office Hadley Centre. The data contained within the 12 models was overlayed with the relationships derived to calculate the projected indoor temperature and humidity conditions within the museum. The results presented indicate that temperature and humidity conditions are projected to exceed design conditions more frequently in the coming decades. Consequently, adaptation plans must consider the potential impacts that include indoor environmental deterioration, leading to discomfort and health implications, increased energy costs, and system upgrade costs, as well as the potential for accelerated degradation of artwork and artefacts.
Keywords:
adaptation; comfort; climate change; buildings; indoor environmental quality; modelling; museum 1. Introduction
Climate mitigation aims to reduce greenhouse gas emissions, whilst climate adaptation seeks to reduce the impacts felt by climate change. In this paper, we discuss the results of a study aimed at evaluating the advantages of using longitudinal monitored data to quantify the vulnerability of a museum’s indoor environment to changes in outdoor temperature and humidity to support climate adaptation planning. Very few studies have used measured weather data to help determine future impacts to support climate adaptation planning.
1.1. Museum Buildings
Energy efficiency and greenhouse gas reduction have become all too familiar targets within the public sector, including the museum environment, to encourage the development of climate mitigation strategies [1]. Indeed, museums can address climate change directly through their operations, as they often consume vast amounts of energy and resources that contribute to climate change, and curtailing their own emissions is one of the most important ways they can play their part in addressing the climate crisis [2]. However, short–medium term climate change impacts are already ‘locked in’ because of past greenhouse gas emissions. Therefore, even if mitigation targets are met, the projected climate change will affect buildings and occupant comfort via extreme weather events and higher internal temperatures [3]. Consequently, changes in museum building conditions due to climate change are an unescapable phenomenon for both movable and immovable cultural heritage [4], and less thought has been given to climate adaptation despite an acknowledgement that climate change is expected to have a significant impact on heating and cooling demand and the role of active vs. passive cooling strategies. Larsen et al. [5] have examined climate change impacts on future heating and cooling demands across Europe up to 2050, using two GHG emission climate scenarios (RCP 2.6 and RCP 4.5). Unsurprisingly, temperature changes are predicted to lead to a general decrease in heating demand and a corresponding increase in cooling demand. The largest decrease in heating demand from 2010 to 2050 is observed for western and northern Europe, whilst the largest cooling demand change ratios are seen to be the highest in northern Europe, with the UK’s increased projected cooling demand described as vast. This is significant for buildings that already require substantial environmental monitoring and technical control over their indoor conditions to protect their collections of artefacts, artwork, etc., and there is a growing recognition that the appropriate choices of heating, ventilating and air conditioning (HVAC) systems, as well as their regulation and maintenance, will enhance environmental and energy behaviours significantly [1].
Less emphasis has been placed on climate adaptation [6]. Whilst government policies have begun to promote climate change adaptation measures to reduce vulnerabilities and enhance resilience, these are not fully understood nor acknowledged by building professionals [3], and more research is needed. Climate change is relevant to all museums, and museums can both address climate change directly through their operations, leading by example to embed adaptation and fulfilling roles in addressing climate change through education and community engagement. Museums must now incorporate climate change into their exhibitions, events, and educational programmes, whatever their subject matter [2].
1.2. Museum Environments
“A museum is a not-for-profit, permanent institution in the service of society that researches, collects, conserves, interprets and exhibits tangible and intangible heritage. Open to the public, accessible and inclusive, museums foster diversity and sustainability. They operate and communicate ethically, professionally and with the participation of communities, offering varied experiences for education, enjoyment, reflection and knowledge sharing” [7]. They inform, educate, and, importantly, challenge. Museum buildings must deliver an environment that will continue to provide this service for both current and future generations.
1.3. Museums and Environmental Modelling
There are very few studies where the future projections of the impacts of climate change have been undertaken at the local-building scale, and this remains a gap to overcome [8]. The small number of studies that have used future climate scenarios to understand the impacts of climate change on museums and other heritage buildings containing art/artefacts are all in Europe. For example, Huijbregts et al. [9] proposed a method for assessing the damage risk of future climate change to two historic museum buildings in The Netherlands and Belgium. The predicted indoor environment from 1950 to 2099 in four museum rooms was assessed based on the ASHRAE guidelines for indoor conditions related to museum collections. The results showed that climate change will considerably increase the indoor temperature in both historic buildings. Besides that, the projected increasing precipitation will also lead to considerably higher indoor relative humidity. The latter is predicted to have the largest impact on the damage potential to museum objects as high relative humidity values may cause mould growth, and large relative humidity fluctuations may lead to the mechanical degradation of museum objects.
Gonzáleza et al. [10] adopted an approach combining analytical formulations, on-site measurements, and HVAC to identify the adequate hygrothermal parameters for three churches with art collections in the province of Seville. The climate change scenario predicted for 2050 was based on projected temperature variation. The case studies were Baroque churches and historic buildings located in the south of Europe. The data obtained from a monitoring campaign carried out in these churches was used to validate dynamic simulation models. The churches analysed showed an increase in cooling demand and a decrease in heating demand. Furthermore, to ensure human comfort and the preservation of artwork, it was necessary to implement active systems in operation for 12 h periods. These results suggest energy overconsumption, as the energy consumption for human comfort and artwork preservation was 50% higher than the energy consumption of active systems for the preservation of valuable historic objects. In addition, the annual energy consumption decreases for future scenarios up to 2050 in the case of artwork preservation and thermal comfort but increases by almost 15% for the preservation of works of art due to higher levels of relative humidity. Before historic buildings can be adapted, it is essential to understand the influence of the future climate on their design, construction, and environmental condition [10].
Similarly, Schito et al. [11] monitored a museum in Pisa to understand the effectiveness of current building plant systems and management to avoid future artwork deterioration. They used five simple performance indexes with monitored data to estimate the suitability of the whole museum system in the maintenance of benchmark values of temperature, humidity, and light, including mean temperature (°C); maximum daily and seasonal temperature difference (°C); mean relative humidity (%); maximum daily and seasonal relative humidity difference (%); maximum allowed illuminance (lx). The indexes show an acceptable instantaneous microclimate, but HVAC system improvement was deemed necessary to avoid a high thermo-hygrometric daily span. The analysis of the indexes revealed that the instantaneous current microclimate is acceptable for artwork preservation, but the daily span should be reduced. Relative humidity needs stricter controls to cope with visitor numbers, which would require dehumidification of the air supply, even during winter. Huerto-Cardenas et al. [12] used a range of diagnostic tools to forecast future climate risks relating to the Duomo di Milano and its artefacts in Italy. The researchers found that, as a consequence of climate change, the protective varnish layer of some paintings was at greater risk of chemical deterioration; some artworks were at greater risk of biological deterioration, owing to mould (due to prolonged periods with high indoor relative humidity); artefacts were at greater risk of biological deterioration caused by insects; the mechanical damage of painted wooden panels would be higher in the future. In the two forecasted climate scenarios (RCP 4.5 and RCP 8.5), they also determined that there would be events in which the low relative humidity reached during summer (very hot and dry) could generate an excessive shrinkage of the surface layer of wooden panels, which could result in cracks forming. All these potential risks require strategies to prevent further or future damage from occurring. The results of studies such as these can help adaptation planning aimed at reducing future risks for heritage conservation.
1.4. Museums as Learning Environments
Museums hold a unique position in the media and political landscape as trusted information sources and are emerging as key players in climate change debates [13]. Museums have inherent capabilities, resources, and opportunities that position them to influence public responses to climate change. Attention to energy efficiency and greenhouse gas reduction in relation to museum collections began a little over a decade ago when the field began to critique the significant annual costs of energy in managing storage and exhibition climates [14]. Sutton [14] highlights innovative ways in which energy-efficient practices and thoughtful approaches to engaging communities with collections, exhibitions, and programs can increase climate literacy and call people to action. Sutton [14] argues that these ‘bright spots’ in the sector’s work signal capacity but not widespread commitment. This is a critical time to promote the importance of integrating museums more completely with social action. Indeed, Hamilton and Rooning [15] argue that museums are places where issues, such as climate change, can be brought forward to large, and sometimes diverse, public audiences because of the privileged position and critical role museums play as social centres for informal learning. Given the positionality of museums as public-facing institutions that address topics of social, scientific, and historical significance, it is argued that the museum should be a key convener of discussions around climate change [15].
2. Methodology
This study concentrated on one art gallery in the National Museum Cardiff, Wales: a UK museum building that is over 100 years old, constructed of Portland limestone. This research aimed to provide museum personnel with quantifiable and measurable data to assist them with future climate adaptation planning. A methodology was developed using monitored data. A total of 10 years of monitored temperature and relative humidity data was provided from museum-owned sensors located outside the museum, as well as within a sampling of spaces inside the museum. The gallery used in this study was an art gallery with full environmental control (temperature and humidity), an exterior envelope, and windows. As a result of these characteristics, the gallery was a suitable space to analyse, as the envelope qualities make the gallery’s conditions susceptible to changes in outdoor conditions, and sensitive contents are negatively impacted by such changes. Summaries of the monitored data can be found in Figure 1 and Figure 2.
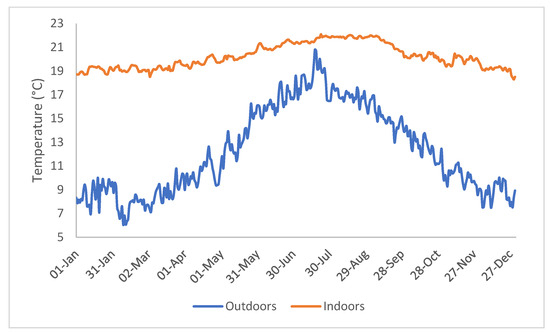
Figure 1.
Daily average temperature from 2012–2021. Based on monitored data provided by the museum.

Figure 2.
Daily average relative humidity from 2012–2021. Based on monitored data provided by the museum.
In addition to historical temperature and humidity data, setpoint information was also provided by the museum. The setpoint is the temperature or humidity by which the air conditioning system abidesfor assessing the impact of projected changes in future indoor conditions.
Changes in outdoor temperature and humidity can have varying levels of influence on the temperature and humidity within a building. The magnitude of this influence in a space at any given time depends on the area and orientation of exterior building envelopes and glazing, the presence or absence of air conditioning and ventilation, to condition the space and is useful occupant quantity and activity type, and lighting heat output, as well as a host of other factors. Therefore, to achieve indoor temperature and humidity estimates that are most applicable to a specific space, it is beneficial to incorporate a space’s characteristics into the analysis. In the case of this gallery, monitored temperature and humidity data serve to capture the characteristics specific to the space. Figure 3 begins to illustrate the influence that the outdoor temperature has on the temperature within the gallery. It shows that a warmer outdoor temperature results in a higher likelihood of the indoor temperature exceeding the deadband temperature setpoint. The deadband is the acceptable range above or below the setpoint within which the temperature and humidity are allowed to fluctuate. The cooling system operation is programmed to keep the temperature and humidity within the deadband range. While there were only 39 days in the monitoring period where outdoor temperatures exceeded 25 °C, the prevalence of such temperatures is projected to increase to 50 days per year by 2030 (95th percentile model; median year in the time studied). By 2070, projections for the median year in the era show a range from 77 days per year over 25 °C (50th percentile model) to 109 days per year (95th percentile model).
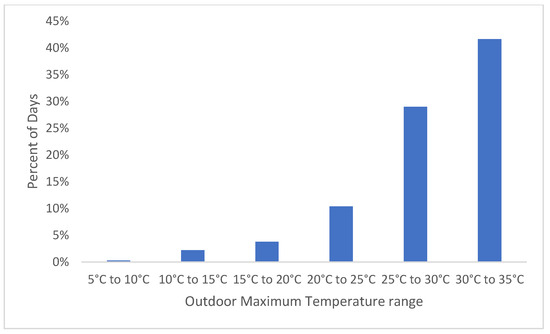
Figure 3.
Percentage of days with outside air maximum temperature range, where the indoor setpoint plus deadband is exceeded by the maximum indoor daily temperature. Depicts monitored data from 2012–2021.
Historic humidity data had been recorded as relative humidity. Various studies [16,17] have concluded that indoor-specific humidity demonstrates a better correlation with outdoor-specific humidity when compared to indoor-outdoor relative humidity. This is partially due to the temperature-dependent nature of relative humidity, which is the measure of the amount of water vapour present in air expressed as a percentage of the amount needed to achieve saturation at the same temperature. On the contrary, specific humidity is the mass of water vapour in a unit mass of moist air and is not temperature dependent.
In order to verify which humidity metric most accurately modelled indoor conditions for the gallery, a relationship between indoor- and outdoor-specific humidity was derived and compared to that for relative humidity (Figure 4). It was found that specific humidity provided a more accurate estimate of indoor conditions (R2 = 0.51) than relative humidity (R2 = 0.02). For this reason, the relation between indoor- and outdoor-specific humidity was used to estimate indoor conditions. Indoor relative humidity was then calculated using psychrometric relationships.

Figure 4.
Daily average specific humidity from 2012–2021. Specific humidity is calculated from monitored temperature and relative humidity data provided by the museum.
Subhourly data for both indoor and outdoor temperature and humidity spanning the years 2012–2021 was supplied by the museum. Data processing included scrubbing outlier data from the dataset and converting subhourly data into daily maximum, daily minimum, and daily average data. Lastly, a sensitivity analysis was conducted to determine which years to use for the relationship development. In order to do so, outdoor vs. indoor relationships were developed using the monitored data from 55 combinations of years. When comparing the results, it was evident that the final results were sensitive to years with warmer temperatures or years with limited data. As a result, all monitoring years were used so that the analysis was based on long-term stable trends rather than the more volatile shorter-term or annual trends.
By using the monitored data from 2012–2021, the relationships between indoor and outdoor temperature and humidity were derived using average, maximum, and minimum values for each day in the monitoring period. Plots illustrating the outdoor vs. indoor relationship are shown below for temperature in Figure 5, relative humidity in Figure 6, and specific humidity in Figure 7. The R2 values demonstrate the degree to which the relationship fits the observed data. The variance between the relationship and historic data stems from the influence on indoor conditions from factors other than outdoor conditions, such as occupants, lighting, equipment, etc.
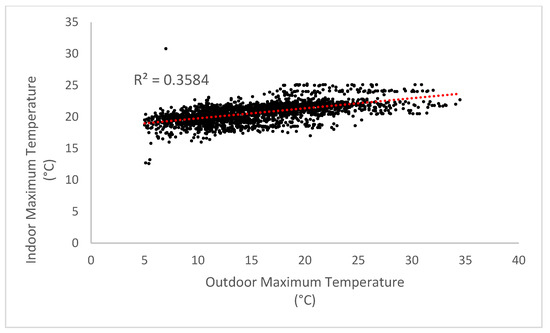
Figure 5.
Outdoor daily maximum temperature vs. indoor daily maximum temperature. Data points represent monitored data from 2012–2021.

Figure 6.
Outdoor daily maximum relative humidity vs. indoor daily maximum relative humidity. Data points represent monitored data from 2012–2021.

Figure 7.
Outdoor daily average specific humidity vs. indoor daily minimum specific humidity. Data points represent monitored data from 2012–2021.
The climate data used for this study are the 12 models on a 2.2 km scale within the UK Climate Projections 2018 (UKCP18), as published by the Met Office Hadley Centre [18]. The data contained within the 12 models was overlayed with the relationships discussed in the previous section to calculate projected indoor temperature and humidity conditions within the museum. Each model’s output represents the representative concentration pathway (RCP) 8.5 scenario, which is a business-as-usual scenario. Each model contains data for the time periods of 1981–2000, 2021–2040, and 2061–2080. The years 1981–2000 are reported as the baseline time period in this study, and the other two time periods are reported as the 2030 and 2070 future projections, respectively. The models contain data for 2.2 km grids across the UK. The data for this study were pulled from the 2.2 km grid containing the museum.
3. Results
The results are presented in Figure 8, Figure 9, Figure 10, Figure 11, Figure 12 and Figure 13. Firstly, the 5th, 50th, and 95th percentiles of the 12-model suite are reported to provide an understanding of the spread of the climate modelling results, which are each equally likely to occur. Similarly, when reporting the results for the baseline, 2030, or 2070 time periods, the 50th or 95th percentile years of the 20 years in each time period are typically reported.

Figure 8.
Projected daily indoor maximum temperature plot of the 50th percentile year based on monitored data from 2012–2021. The solid, coloured lines represent the 50th percentile model. The shaded region represents the spread from the 5th to the 95th percentile models.

Figure 9.
Projected daily indoor maximum temperature plot of the 95th percentile year based on monitored data from 2012–2021. The solid, coloured lines represent the 50th percentile model. The shaded region represents the spread from the 5th to the 95th percentile models.

Figure 10.
Projected daily indoor maximum relative humidity plot of the 50th percentile year based on monitored data from 2012–2021. The solid, coloured lines represent the 50th percentile model. The shaded region represents the spread from the 5th to the 95th percentile models.

Figure 11.
Projected daily indoor maximum relative humidity plot of the 95th percentile year based on monitored data from 2012–2021. The solid, coloured lines represent the 50th percentile model. The shaded region represents the spread from the 5th to the 95th percentile models.

Figure 12.
Projected number of annual days where the indoor maximum temperature exceeds the setpoint plus the deadband. Results are based on monitored data from 2012–2021. Box plots indicate the spread across the 12 UKCP18 climate models, with each box plot showing the minimum, 25th percentile, 50th percentile, 75th percentile, and maximum values.

Figure 13.
Projected number of annual days where the indoor maximum relative humidity exceeds the setpoint plus deadband. Results are based on monitored data from 2012–2021. Box plots indicate the spread across the 12 UKCP18 climate models, with each plot showing the minimum, 25th percentile, 50th percentile, 75th percentile, and maximum values.
Figure 8 shows the model output for the daily maximum indoor temperature for the median year of each of the three eras, as well as the spread of models. Overlayed over these data are the temperature setpoint and deadband temperatures. From this, it is evident that all models uniformly project temperature increases, with larger increases seen in the summer months. That said, the maximum daily temperature generally stays within the deadband temperatures during the median year for each of the time periods.
Figure 9 shows the 95th percentile year, during which the deadband temperature is often exceeded during the summer months. It is important to note that the 95th percentile year is not an actual modelled scenario but rather a consolidation of near-worst-case days likely scattered across many of the models. Additionally, because of the method used to formulate the relationships between outdoor and indoor temperature and humidity, it is important not to interpret the maximum temperature and humidity as if they occur simultaneously but rather as separate variables meant for individual interpretation. Similarly, Figure 10 shows the daily indoor maximum relative humidity. Unlike the temperature setpoint, the relative humidity setpoint does not reset each month. Rather, it stays constant at 50% year-round with a 10% deadband. While temperature projections depict a clear warming trend, relative humidity trends are less consistent. The spread across the models increases from baseline to 2030 and 2070, and so the 95th percentile model on any given day in the future time periods is generally higher than the baseline. At the same time, the 5th percentile models do depict relative humidity values lower than the baseline in some cases. It is also evident that the most pronounced change is projected to occur from June through November. In general, the 50th percentile year remains within the deadband range for the gallery, even in 2070. The same cannot be said for the 95th percentile year shown in Figure 11. The output for the 95th percentile year shows the relative humidity deadband only narrowly being met in the baseline era, with exceedance occurring even for the median models in 2030 and 2070 between June and November.
Another way to view the results is to look at the number of days per year that the indoor maximum temperature exceeds the setpoint and deadband temperatures. Figure 12 shows this with a full spread of results across all 12 UKCP18 models displayed as a box plot for each year in each era in the study. The trend of an increasing number of days where the air conditioning setpoints are exceeded is clearly depicted. These exceedances start gradually, with most models showing less than five per year in the 2030 era. However, the rate of increase in exceedances increased in the 2070 era, with over 10 exceedances per year by the latter part of the era. The dynamic nature of the annual changes can be seen as the projections change not only between eras but also within eras. This figure also helps to illustrate the significant spread in results between the 12 UKCP18 models, especially in the later time periods. Again, the scenarios represented by each model are equally likely to occur.
From a humidity perspective, the number of exceedances per year is slightly higher than they are for temperature. Even in the baseline and 2030 eras, there are around five exceedances per year. By the 2070 era, exceedances for the median models follow an upward trajectory from about seven per year at the beginning of the era to 15 per year by the end of the era. More humid models show up to 35 exceedances per year in the 2070 time period.
4. Discussion
4.1. Museums as Buildings to Decarbonise and Adapt
When serving any given space, much like that in the gallery at the National Museum Cardiff, the HVAC system is tasked with maintaining predetermined temperature and humidity parameters. The severity of the consequences related to not meeting said conditions varies by space type. For example, a system serving temperature-sensitive research labs would have a stricter set of setpoints and, therefore, a more robust control system than an office that is only conditioned to a temperature tied to occupant comfort. Failure to keep conditions within the design range can occur for a wide range of reasons, many of which stem from scenarios that cause the cooling load to exceed the design value in some way. This can happen if more people occupy a room than was anticipated, if windows or doors are left open, allowing for increased outside air infiltration, or if the outdoor conditions are warmer or more humid than was assumed in the design; the last of these is the primary concern of this study. Outdoor conditions that are hotter or more humid than the conditions used to size the system can result in the inability of the system to meet intended condition requirements. Air conditioning systems are typically designed around a published set of outdoor temperature and humidity conditions that are characteristic of a location’s historic weather data. However, such weather data can be decades old. As climate shifts towards the climate model projections used in this study, the historically based design conditions are exceeded more frequently, causing the air conditioning system to operate outside of its intended range.
Like most national museums, the National Museum Cardiff is located in a major city, where ‘heat islands’ have started to become an issue, as large, accumulated masses of stone and concrete absorb radiation and concentrate heat. Controlling the indoor environment contributes to the underlying causes of climate change as well as the financial burdens of institutions, so it is both in the interest and the responsibility of museums to monitor, understand, and manage their environments as accurately and efficiently as possible [19]. As identified by both Saunders [19] and Gonzáleza et al. [10], significant challenges will come from extreme heat, extreme humidity, and fluctuations between extremes. Climate change will affect the buildings themselves, the preservation of artworks and artefacts contained within, the thermal comfort of users, and, ultimately, lead to increased energy consumption. Gonzáleza et al. [10] emphasise the pressing need to measure risks and build adaptation strategies, whereas Saunders [19] contends that long-term thinking is needed for building systems, which are major investments with a 20–30-year service life. The capital investment is known at the beginning, the operating and energy costs will increase with time, and successive institutional administrations will bear the financial burden of the environmental criteria set today. The designs of buildings, building improvements, and systems should be adaptable to avoid climatic or financially driven obsolescence; there are many institutions that do not operate their systems to specification because they cannot afford to.
As observed by Shen et al. [20], the optimal retrofit strategy and selection of the best energy conservation measures under current climate conditions will be subject to change in the future under climate change, which is why climate adaptation strategies must build in flexibility.
Certainly, in this instance, the results indicate that temperature and humidity conditions in the art gallery at the National Museum Cardiff are projected to exceed design conditions more frequently in the coming decades. The potential detrimental effects of these projections are
- Human discomfort stemming from temperature and humidity conditions that exceed those recommended by CIBSE in the UK and other leading building services organizations.
- Human health implications related to extended time spent in spaces with elevated temperatures and/or humidity, which can lead to overheating.
- Increased energy costs from operating the air conditioning system at a higher capacity to meet cooling loads that are elevated because of increased outdoor temperature and humidity.
- System upgrade costs that may be realized if the air conditioning system does not have enough additional cooling capacity to meet the increased cooling loads.
- The accelerated degradation of artwork and artefacts stored within the space due to extended time in conditions not suitable for historical art and artefact preservation.
While the indication is that such implications will become a reality, the National Museum Cardiff must invest in climate adaptation planning to fully understand the ramifications. In the meantime, the results of the study have been shared with key stakeholders.
It is possible that the air conditioning system has the additional cooling capacity to be able to maintain the desired indoor conditions even in periods of extreme outdoor conditions. Further investigation is necessary to determine whether this is the case. If it is not, the museum may pursue a wide range of adaptation options to mitigate the impacts of elevated interior conditions. Adaptation options include the installation of additional cooling capacity, the alteration of the control setpoints, and the installation of passive cooling measures, among others.
However, it is worth acknowledging that climate conditions will likely increase the use of HVAC going forward, which will potentially impact indoor air quality [21]. Consequently, the influence of climate change on exposure to poorer indoor air quality, e.g., increased volatile organic compounds (VOCs), remains largely unknown, and the evolution of many influencing factors is unpredictable.
4.2. Museums as Catalysts for Change
Climate change is relevant to all museums, and they can all fulfil roles in addressing climate change directly and indirectly. Museums can address climate change directly through their operations, as they frequently consume vast amounts of energy and resources that contribute to climate change: curtailing their own emissions is one of the most important ways they can play their part in addressing the climate crisis [2].
In addition to managing its own building estates, the big task for the museum sector is to both inform the public on the science of climate change and equip citizens with the skills and knowledge that engender agency and enable participation in debate and action on climate change [13]. One way to do this is to be transparent about how they are managing and adapting their own estates and collections. Indeed, dialogue is prized over the one-way transmission of facts [22], and in museums, the language of climate science, decarbonisation (mitigation) and adaptation can be translated and given a more accessible form. This is important as we look to museums to provide new ways to communicate the challenges of climate change where others have been inadequate [23,24,25,26]. Using museum buildings as ‘living labs’ is one way of achieving this aim.
5. Future Work and Limitations
This study aimed to evaluate the use of extensive monitored data in quantifying the vulnerability of a building’s indoor environment to changes in outdoor temperature and humidity. A similar methodology may be applied to additional spaces within the museum, other museums, and expanded building types. Further work is needed to incorporate the impact of heat sources other than outdoor air temperature (people, lighting, equipment, etc.) into the indoor condition modelling. Spaces of particular interest for future study are those whose characteristics vary from the gallery, which is conditioned to both a temperature and a humidity setpoint. A space that is only conditioned to a temperature setpoint would likely experience more drastic fluctuations in humidity. Further, a space without conditioning may experience such an effect on both temperature and humidity. Exterior envelope exposure and construction type are other room characteristics that may amplify the effects of a changing climate on interior conditions. A similar methodology could be applied to monitor energy usage data and cooling degree days. Such a study could evaluate changes in cooling energy as a result of rising temperature and humidity. Further steps can be taken to better understand the implications of increased internal temperature and humidity in the gallery and beyond. For example, how does the additional time spent at elevated humidity impact the longevity of artwork or historical artefacts housed within such a space? While interpreting the results of this study, whether for the purposes of climate change adaptation planning or something else, consideration should be given to the study’s limitations that stem from assumptions, data gaps, and the scope of the study. First, a space’s temperature and humidity are impacted by factors other than outdoor conditions. These factors include people, equipment, lighting, etc., and help to account for the R2 values and imperfect nature of the single degree relationships used in this study to calculate indoor conditions. It was assumed that fluctuations in heat and humidity from sources other than outside air are captured by the relationships used to calculate indoor conditions based on outdoor conditions. However, a dynamic thermal simulation of the gallery would have the ability to capture these additional heat and humidity sources more accurately, but the use of such a tool was outside of the scope of this study. Additionally, the results are sensitive to the data time period that is used to formulate the relationships between indoor and outdoor conditions. Specifically, changes in outdoor conditions have varying levels of influence on indoor conditions, depending on which years of the monitoring period are used. Given the focus on long-term trends, all monitored years were used in this study to formulate these relationships. However, future indoor conditions will behave similarly and, therefore, the conditions in any given future year will likely vary from the presented results. It is, therefore, best for the results to be interpreted as a projected long-term trend rather than a set of short-term forecasts.
Monitored data exist for temperature and relative humidity. However, as discussed, the relationship between indoor and outdoor relative humidity is less reliable than that for specific humidity. Indoor-specific humidity was, therefore, calculated and then converted to relative humidity using a set of psychrometric calculations. In order to do so, the daily minimum indoor temperature and specific humidity were used to calculate the maximum daily relative humidity based on the assumption that these psychrometric variables occur simultaneously on any given day. This is generally true in an outdoor environment but may not hold true in an indoor environment where the humidity is influenced by moisture sources other than outdoor air.
Finally, the UKCP18 2.2 km data only includes RCP8.5, but if other scenarios had been available, this would have allowed for a more robust spread of possible outcomes.
6. Conclusions
As organisations, museums are responsible for conserving, protecting, and displaying art and artefacts from our past and present, thus preserving our rich heritage that might otherwise be lost. They inform, educate, and challenge. Museum buildings must deliver an environment that will continue to provide this service for both current and future generations. The onus on public building estate managers to meet climate targets through decarbonisation and energy efficiency measures means that there has been a focus on building performance, measurement, and monitoring to ensure planning, design, and maintenance are targeted at zero carbon. Museums must now focus some of their efforts on climate adaptation, which has long been neglected both in discussion and policy, by preparing their buildings for projected changes in indoor environmental quality as a consequence of irreversible climate change. The results presented in this paper indicate that temperature and humidity conditions in a gallery in the National Museum Cardiff are projected to exceed design conditions more frequently in the coming decades. Consequently, adaptation plans must consider potential impacts, which include indoor environmental deterioration, leading to discomfort and health implications, increased energy costs, and system upgrade costs, as well as the potential for the accelerated degradation of artwork and artefacts.
Author Contributions
Conceptualization C.H.; methodology, C.H., M.H., P.C. and J.H.; software, M.H., P.C. and J.H.; formal analysis, C.H., M.H., P.C. and J.H.; investigation, C.H., M.H., P.C. and J.H.; resources, C.H. and M.H.; data curation, C.H., M.H., P.C. and J.H.; writing—original draft preparation, C.H. and M.H.; writing—review and editing, C.H.; project administration, C.H.; funding acquisition, C.H. All authors have read and agreed to the published version of the manuscript.
Funding
This research was funded by Cardiff Metropolitan University’s Global Academies Interdisciplinary Research and Innovation Development Fund and Cardiff School of Art and Design Research and Innovation Funding.
Data Availability Statement
Restrictions apply to the availability of these data. Whilst some publicly available climate data were used (UK Met Office Data). Other data were obtained from a third party and are not publicly available. Please contact the corresponding author for further information.
Acknowledgments
The authors would like to thank staff at National Museum Cardiff, Amgueddfa Cymru—Museum Wales for providing access to the monitored temperature and relative humidity data.
Conflicts of Interest
Author Matt Huddleston, Paul Chinowsky and Jacob Helma were employed by the company Resilient Analytics. The remaining authors declare that the research was conducted in the absence of any commercial or financial relationships that could be construed as a potential conflict of interest.
References
- Lucchi, E. Review of preventative conservation in museum buildings. J. Cult. Herit. 2018, 29, 180–193. [Google Scholar] [CrossRef]
- McGhie, H. Evolving climate change policy and museums. Mus. Manag. Curatorship 2020, 35, 653–662. [Google Scholar] [CrossRef]
- Georgiadou, M.C.; Hacking, T.; Guthrie, P. A conceptual framework for future-proofing the energy performance of buildings. Energy Policy 2012, 47, 145–155. [Google Scholar] [CrossRef]
- Bertolin, C. Preservation of cultural heritage and resources threatened by climate change. Geosciences 2019, 9, 250. [Google Scholar] [CrossRef]
- Larsen, M.A.D.; Petrovic, S.; Radoszynski, A.M.; McKenna, R.; Balyk, O. Climate change impacts, trends and extremes in future heating and cooling demands over Europe. Energy Build. 2020, 226, 110397. [Google Scholar] [CrossRef]
- Hallegatte, S.; Lecocq, F.; de Perthuis, C. Designing Climate Change Adaptation Policies: An Economic Framework; Policy Research Working Paper 5568; The World Bank: Washington, DC, USA, 2011. [Google Scholar]
- ICOM International Council of Museums. Museum Definion. 2022. Available online: https://icom.museum/en/resources/standards-guidelines/museum-definition/ (accessed on 23 November 2023).
- Bonazza, A.; Sardella, A.; Kaiser, A.; Cacciotti, R.; De Nuntiis, P.; Hanus, C.; Maxwell, I. Safeguarding cultural heritage from climate change related hydrometeorological hazards in central Europe. Int. J. Disaster Risk Reduct. 2021, 63, 102455. [Google Scholar] [CrossRef]
- Huijbregts, Z.; Kramer, R.P.; Martens, M.H.J.; van Schijndel, A.W.M.; Schellen, H.L. A proposed method to assess the damage risk of future climate change to museum objects in historic buildings. Build. Environ. 2012, 55, 43–56. [Google Scholar] [CrossRef]
- Muñoz Gonzáleza, C.M.; León Rodríguez, A.L.; Suárez Medina, R.; Ruiz Jaramillo, J. Effects of future climate change on the preservation of artworks, thermal comfort, and energy consumption in historic buildings. Appl. Energy 2020, 276, 115483. [Google Scholar] [CrossRef]
- Schito, E.; Testi, D.; Grassi, W. A proposal for new microclimate indexes for the evaluation of indoor air quality in museums. Buildings 2016, 4, 41. [Google Scholar] [CrossRef]
- Huerto-Cardenas, H.E.; Aste, N.; Del Pero, C.; Della Torre, S.; Leonforte, F. Effects of Climate Change on the Future of Heritage Buildings: Case Study and Applied Methodology. Climate 2021, 9, 132. [Google Scholar] [CrossRef]
- Cameron, F.; Hodge, B.; Salazar, J.F. Representing climate change in museum space and places. WIREs Clim. Chang. 2013, 4, 9–21. [Google Scholar] [CrossRef]
- Sutton, S. The evolving responsibility of museum work in the time of climate change. Mus. Manag. Curatorship 2020, 35, 618–635. [Google Scholar] [CrossRef]
- Hamilton, P.; Ronning, E.C. Why Museums? Museums as Conveners on Climate Change. J. Mus. Educ. 2020, 45, 16–27. [Google Scholar] [CrossRef]
- Tamerius, J.D.; Perzanowski, M.S.; Acosta, L.M.; Jacobson, J.S.; Goldstein, I.F.; Quinnn, J.W.; Rundle, A.G.; Shaman, J. Socioeconomic and Outdoor Meteorological Determinants of Indoor Temperature and Humidity in New York City Dwellings. Weather. Clim. Soc. 2013, 5, 168–179. [Google Scholar] [CrossRef] [PubMed]
- Nguyen, J.L.; Dockery, D.W. Daily indoor-to-outdoor temperature and humidity relationships: A sample across seasons and diverse climatic regions. Int. J. Biometeorol. 2016, 60, 221–229. [Google Scholar] [CrossRef] [PubMed]
- Centre for Environmental Data Analysis. Met Office Hadley Centre (2019): UKCP Local Projections at 2.2 km Resolution for 1980–2080. 2021. Available online: https://catalogue.ceda.ac.uk/uuid/d5822183143c4011a2bb304ee7c0baf7 (accessed on 23 November 2023).
- Saunders, D. Climate Change and Museum Collections. Stud. Conserv. 2008, 53, 287–297. [Google Scholar] [CrossRef]
- Shen, P.; Braham, W.; Yi, Y. The feasibility and importance of considering climate change impacts in building retrofit analysis. Appl. Energy 2019, 233–234, 254–270. [Google Scholar] [CrossRef]
- Mansouri, A.; Wei, W.; Alessandrini, J.-M.; Mandin, C.; Blondeau, P. Impact of Climate Change on Indoor Air Quality: A Review. Int. J. Environ. Res. Public Health 2022, 19, 15616. [Google Scholar] [CrossRef] [PubMed]
- Salazar, J.F. The Mediations of climate change: Museums as citizens’ media. Mus. Soc. 2011, 9, 123–135. [Google Scholar]
- Gardiner, S.M. The Perfect Moral Storm: The Ethical Tragedy of Climate Change; Oxford University Press: Oxford, UK, 2013. [Google Scholar]
- Marshall, G. Don’t Even Think about It: Why Our Brains Are Wired to Ignore Climate Change; Bloomsbury: New York, NY, USA, 2014. [Google Scholar]
- Stoknes, P.E. What We Think about When We Try Not to Think about Global Warming; Chelsea Green Publishing: London, UK, 2015. [Google Scholar]
- Rees, M. Museums as catalysts for change. Nat. Clim. Chang. 2017, 7, 166–167. [Google Scholar] [CrossRef]
Disclaimer/Publisher’s Note: The statements, opinions and data contained in all publications are solely those of the individual author(s) and contributor(s) and not of MDPI and/or the editor(s). MDPI and/or the editor(s) disclaim responsibility for any injury to people or property resulting from any ideas, methods, instructions or products referred to in the content. |
© 2023 by the authors. Licensee MDPI, Basel, Switzerland. This article is an open access article distributed under the terms and conditions of the Creative Commons Attribution (CC BY) license (https://creativecommons.org/licenses/by/4.0/).