Article

Characterization and Degradation Analysis of Pigments in Paintings by Martiros Sarian: Attenuated Total Reflection Fourier Transform Infrared Spectroscopic Imaging and X-ray Fluorescence Approach

Department of Chemical Engineering, Imperial College London, South Kensington Campus, London SW7 2AZ, UK
*
Author to whom correspondence should be addressed.
Heritage 2023, 6(10), 6777-6799; https://doi.org/10.3390/heritage6100354
Submission received: 14 August 2023 / Revised: 13 October 2023 / Accepted: 15 October 2023 / Published: 17 October 2023

Abstract

:
This paper presents a preliminary scientific investigation of pigments used by Martiros Sarian, a prominent Armenian artist known for his vibrant and evocative paintings. The study focuses on five of Sarian’s paintings from different periods of his career, namely, Morning in Stavrino, Arabian Dancer, Caravan, Yerevan Zangu River, and Kirovakan, dated between 1909 and 1948. Non-destructive techniques, including micro-attenuated total reflection Fourier transform infrared (ATR-FTIR) spectroscopic imaging and X-ray fluorescence (XRF), were employed to characterize the pigments in the samples extracted from these paintings. The results reveal the presence of various pigments, including ultramarine blue, cobalt blue, cobalt cerulean blue, viridian, emerald green, cobalt green, celadonite green, cadmium yellow, chrome yellow, Venetian red, yellow ochre, red ochre, lead white, zinc white, and calcium carbonate. Additionally, metal carboxylates and oxalates, degradation products associated with the paint layers, were observed and discussed. The findings contribute to a better understanding of Sarian’s artistic technique and provide valuable insights for the conservation and restoration of his artworks.

1. Introduction

Martiros Sarian (1880–1972) is a highly influential figure in twentieth-century Armenian art, often regarded as the key proponent of the Armenian national style of painting [1]. Sarian received his artistic training at the Moscow School of Painting, Sculpture, and Architecture from 1897 to 1903, where he honed his skills under renowned painters Konstantin Korovin and Valentin Serov [2]. He promptly joined a circle of Symbolist artists in Moscow and began showcasing his vibrant and vividly colored paintings. Throughout his journeys to Constantinople (now Istanbul) in 1910, Egypt in 1912, southwestern Armenia in 1913, and Persia (now Iran) in 1914, Sarian drew inspiration for a series of large-scale fresco-like works, aiming to convey the evocative qualities of Middle Eastern landscapes. These experiences also led to the incorporation of Persian motifs into several of his paintings. Similar to many Russian artists in the early 20th century, Sarian drew significant inspiration from Impressionism. Furthermore, his admiration for the French artists Henri Matisse (1869–1954) and Paul Gauguin (1848–1903) is evident in his utilization of areas of simplified, flat colors [3].
Despite being acknowledged as a symbolic Armenian artist, there exists limited information regarding Sarian’s painting technique and the materials he utilized. The acquisition of such knowledge through scientific investigation plays a pivotal role in unraveling the methodologies employed in creating these artworks and ensuring their optimal preservation. Remarkably, prior to this paper, no scientific research had been conducted on this subject, underscoring the novelty and significance of this contribution in shedding light on the color palette employed by Sarian.
This paper aims to characterize pigments from paintings created by Martiros Sarian, which are housed at the Martiros Sarian House-Museum in Yerevan, the capital of the Republic of Armenia. To our knowledge, these paintings have never been studied using scientific techniques before. Due to the unavailability of scientific equipment at the museum and the inability to transport the paintings, small fragments were carefully extracted from the edges and corners of the artwork by the curators and the conservators at the museum. The edges and corners of the artwork contained pigments and were chosen to minimize any invasive harm to the paintings. It is worth noting that the samples were exclusively taken from the upper layers of the paintings; however, it remains plausible that these extracted pigment samples might contain tiny portions of components from the underlying ground layers. The extracted pigment samples were then brought to the authors’ laboratory at Imperial College London, UK, for scientific analysis. The analyzed paintings in this paper include Morning in Stavrino, Arabian Dancer, Caravan, Yerevan Zangu River, and Kirovakan, dated 1909, 1913, 1926, 1931, and 1948, respectively. These specific paintings were selected to investigate the artist’s evolving techniques and materials over distinct 10-year periods: the 1910s, 1920s, 1930s, and 1940s. Characterization of the pigments is conducted using non-destructive methods, including micro-attenuated total reflection Fourier transform infrared (ATR-FTIR) spectroscopic imaging [4] and X-ray fluorescence (XRF) [5]. The application of micro-ATR-FTIR imaging [6,7,8,9] and XRF [10,11] for pigment characterization in oil paintings has been well-established, demonstrating the suitability of these techniques for non-destructive analysis. The present study demonstrates how the combination of ATR-FTIR spectroscopic imaging and XRF offers significant guidance in the preliminary characterization of oil paint layers that are from museums where access to scientific investigation is limited.

2. Materials and Methods

Pigment samples were extracted from 17 locations at the edges and corners of the paintings: Morning in Stavrino (blue, green, and yellow pigments), Arabian Dancer (blue, green, and red pigments), Caravan (brown, red, yellow, blue, green, and blue-green pigments), Yerevan Zangu River (blue, green, and dark green pigments), and Kirovakan (orange and light blue pigments), as displayed in Supplementary Materials (SM), Figure S1. The extracted pigment samples each weigh around 200 mg, except for the dark green pigment from Yerevan Zangu River, which consists of merely two powders. The extracted pigment samples were first subjected to XRF analysis, followed by investigation using micro-ATR-FTIR spectroscopic imaging.

2.1. Micro-Attenuated Total Reflection Fourier Transform Infrared (ATR-FTIR) Spectroscopic Imaging

The pigment samples extracted from the paintings were placed onto a 2 mm thick CaF2 window (Crystran Ltd., Poole, UK) for micro-ATR-FTIR spectroscopic imaging measurements, as shown in Figure S2. The micro-ATR-FTIR imaging measurements were conducted using an Agilent 670 FTIR spectrometer operating in continuous scan mode with a 64 × 64-pixel 2D focal plane array (FPA) detector (Santa Barbara, CA, USA). In the micro-ATR configuration, the spectrometer and the FPA detector were coupled with a Cary 620 IR microscope (Agilent Technologies, Inc., Santa Clara, CA, USA) with a 15× Cassegrain objective and a slide-on germanium (Ge) crystal as the internal reflective element (IRE). The Ge crystal (refractive index n ~ 4.00) enables a high spatial resolution of 2–4 μm depending on wavelength. Spectra were collected with 4 cm−1 spectral resolution in the range of 3900–750 cm−1 using 64 scans. The chemical images of the measured compounds were obtained by plotting the integrated absorbance of the spectral bands of interest in all 4096 spectra as a function of all pixels of the array, representing the spatial distribution of the absorbance of the spectral band of interest. These chemical images are presented in a color map (~70 × 70 μm2) spanning from high absorbance (red) to low absorbance (blue).

2.2. X-ray Fluorescence (XRF)

The XRF measurements were performed using an ED-XRF Epsilon 3XLE (Malvern Panalytical Ltd., Almelo, Netherlands) equipped with an Ag anode tube (maximum voltage = 50 keV) at 1200 s acquisition time for each pigment sample. Five set-ups of voltage/current intensity/filter/medium were employed for each measurement, contributing to final data collection: 50 keV/300 μA/Ag/air, 50 keV/300 μA/Cu/air, 20 keV/750 μA/Al/air, 12 keV/1250 μA/Al/air, and 9 keV/1666 μA/Ti/He. The system was equipped with a 10-position sample holder allowing sample spinning during measurement. The samples were placed in holders with 4 µm polypropylene films. The qualitative and semi-quantitative analyses of the XRF spectral data were performed and calibrated using an analytical program, Omnian software (Malvern Panalytical Ltd., Almelo, Netherlands). The Omnian software was used to search, align, and manually inspect peaks from the scanning atlas, after which the data were processed to obtain the final results. It should be noted that XRF is a semi-quantitative technique, requiring a reasonable amount of material—typically 2 to 3 g—to ensure sufficient counts for quantitative analysis. In this study, the XRF results are utilized for providing qualitative compositional information, while the quantitative results are for reference. Detected elements were categorized based on their concentration as major (>1%), minor (0.1–1%), and trace (<0.1%) for each pigment, as detailed in Table 1, Table 2, Table 3 and Table 4. The primary lines (Kα and/or Lα) in the spectra of the minor and trace elements were utilized for manual inspection to confirm the presence of these elements.

3. Results

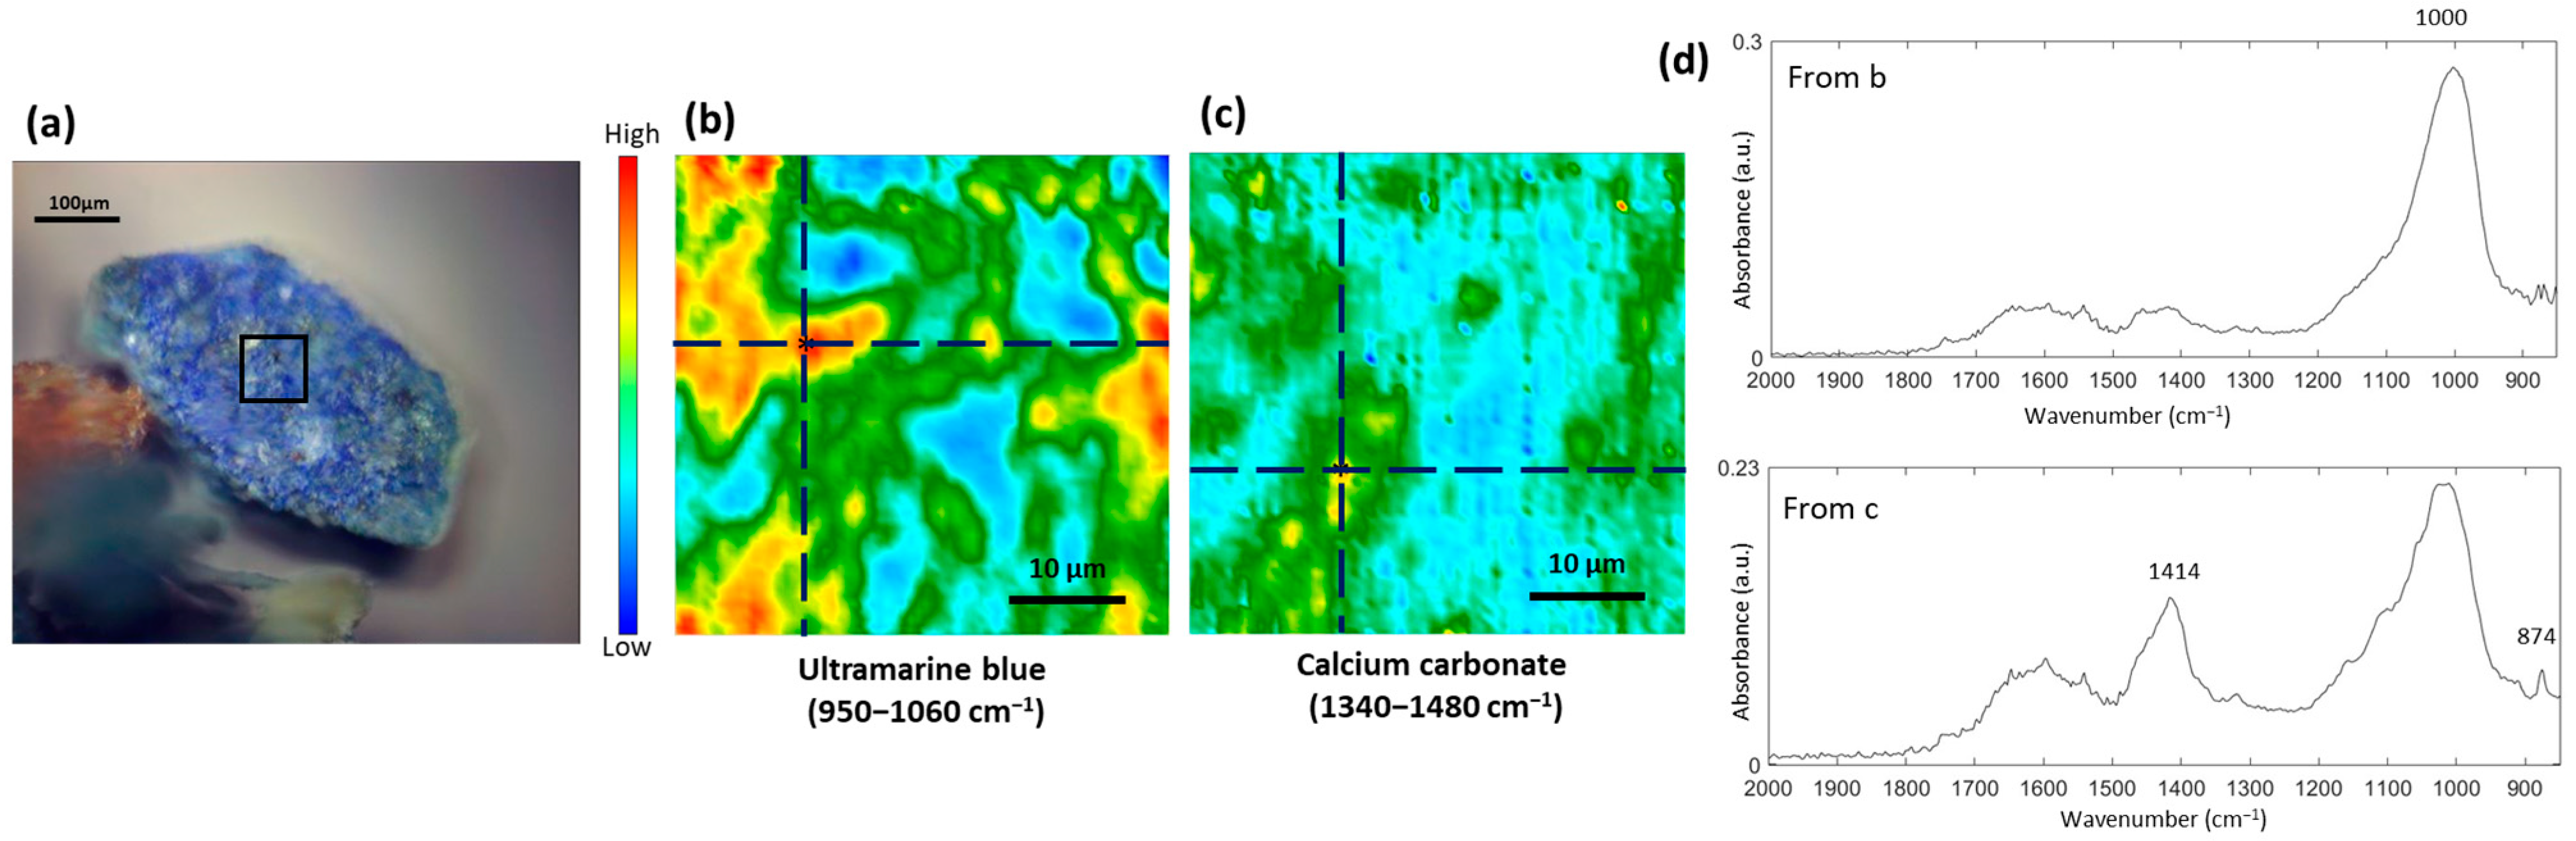
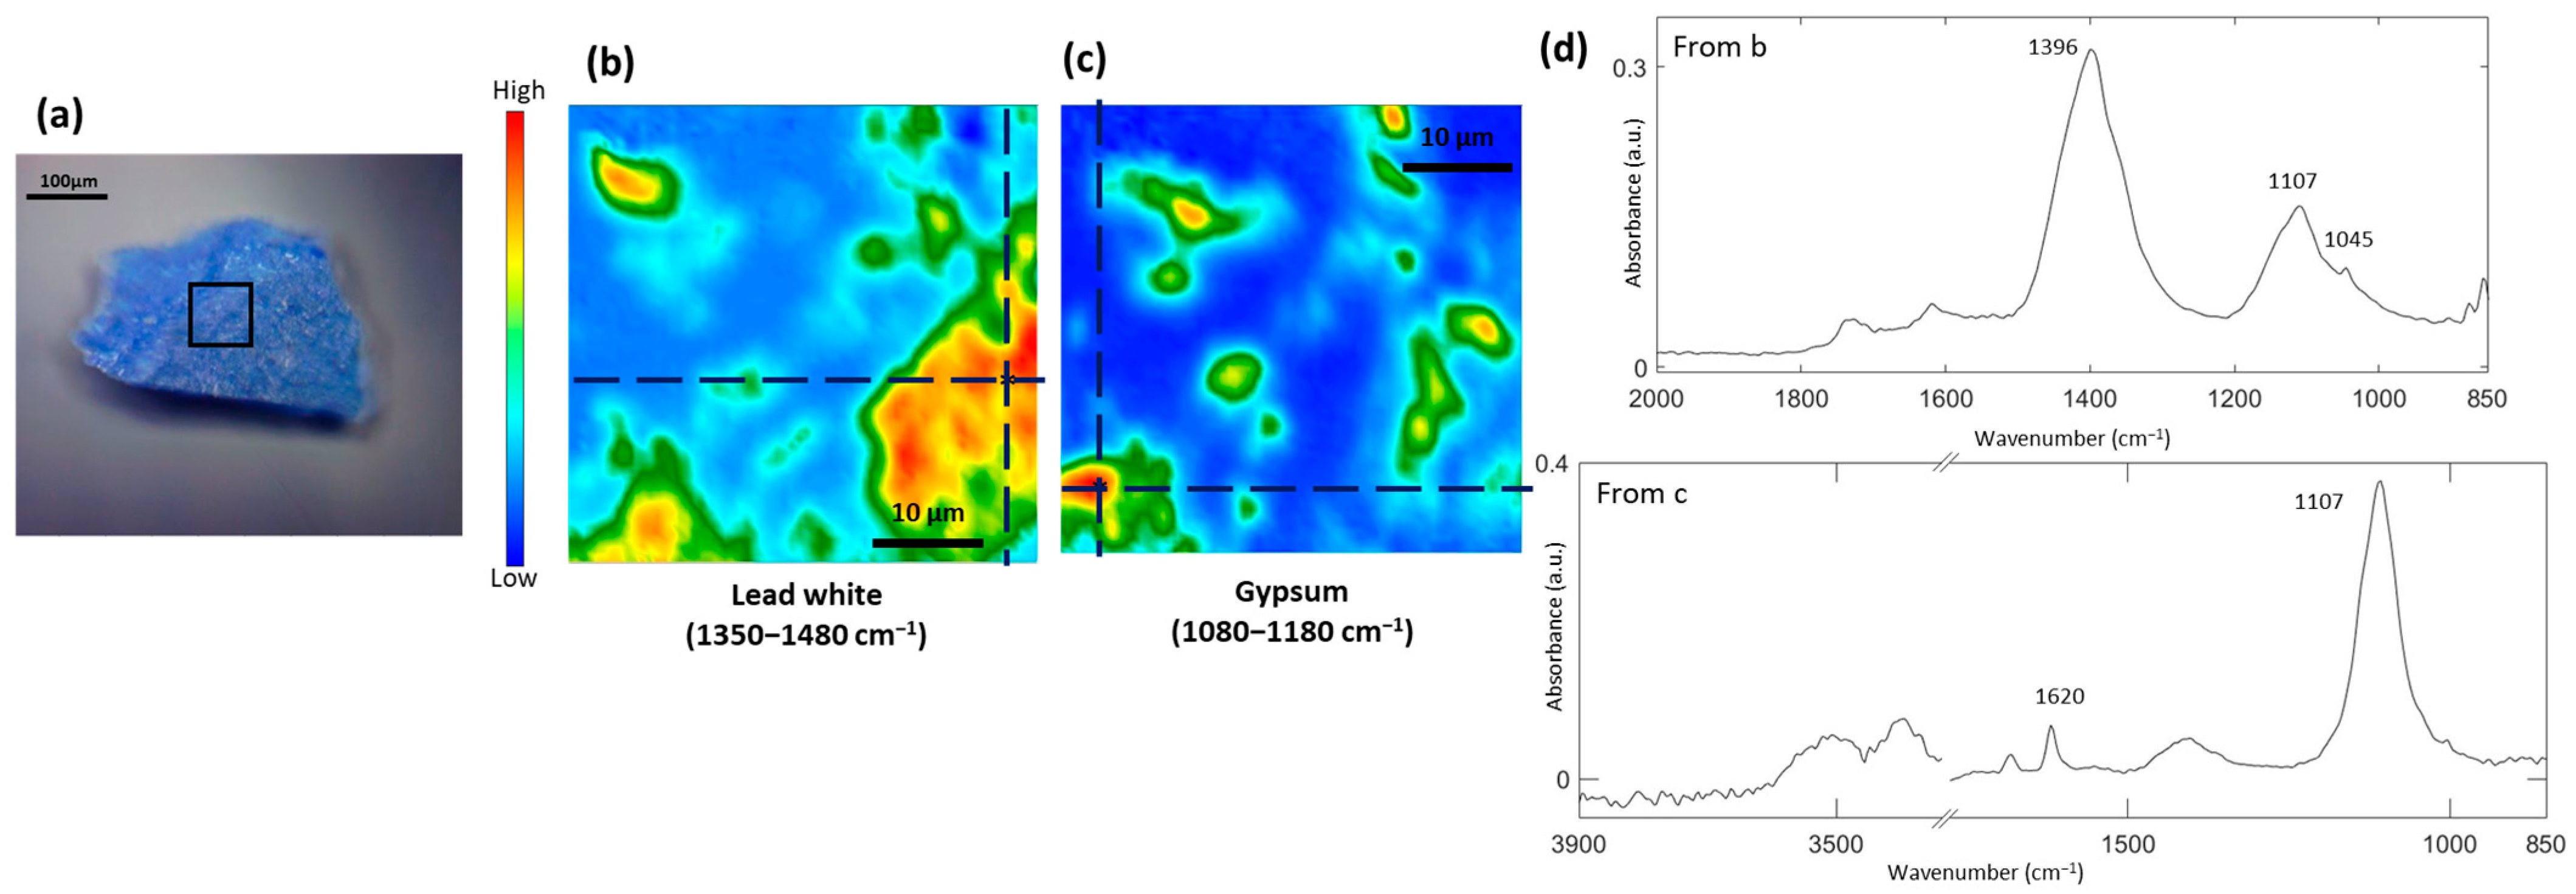
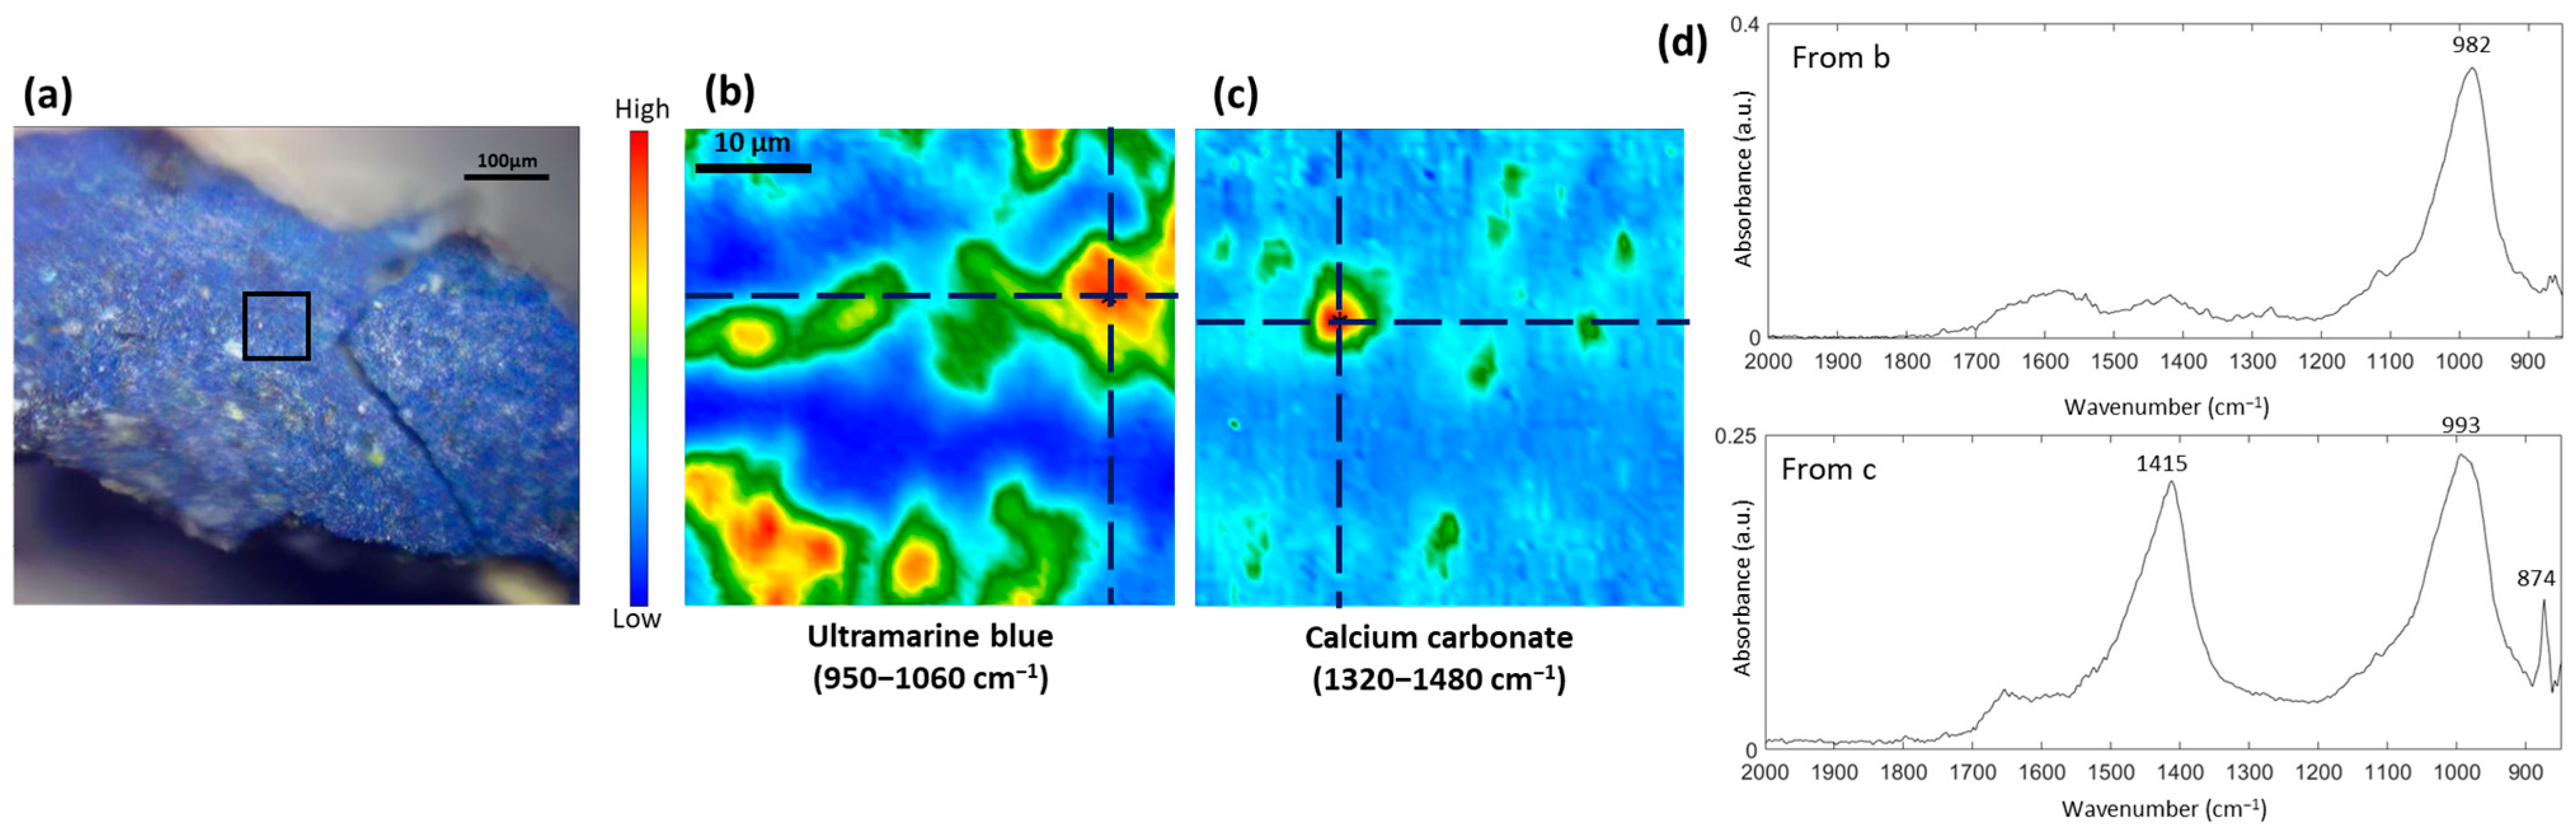
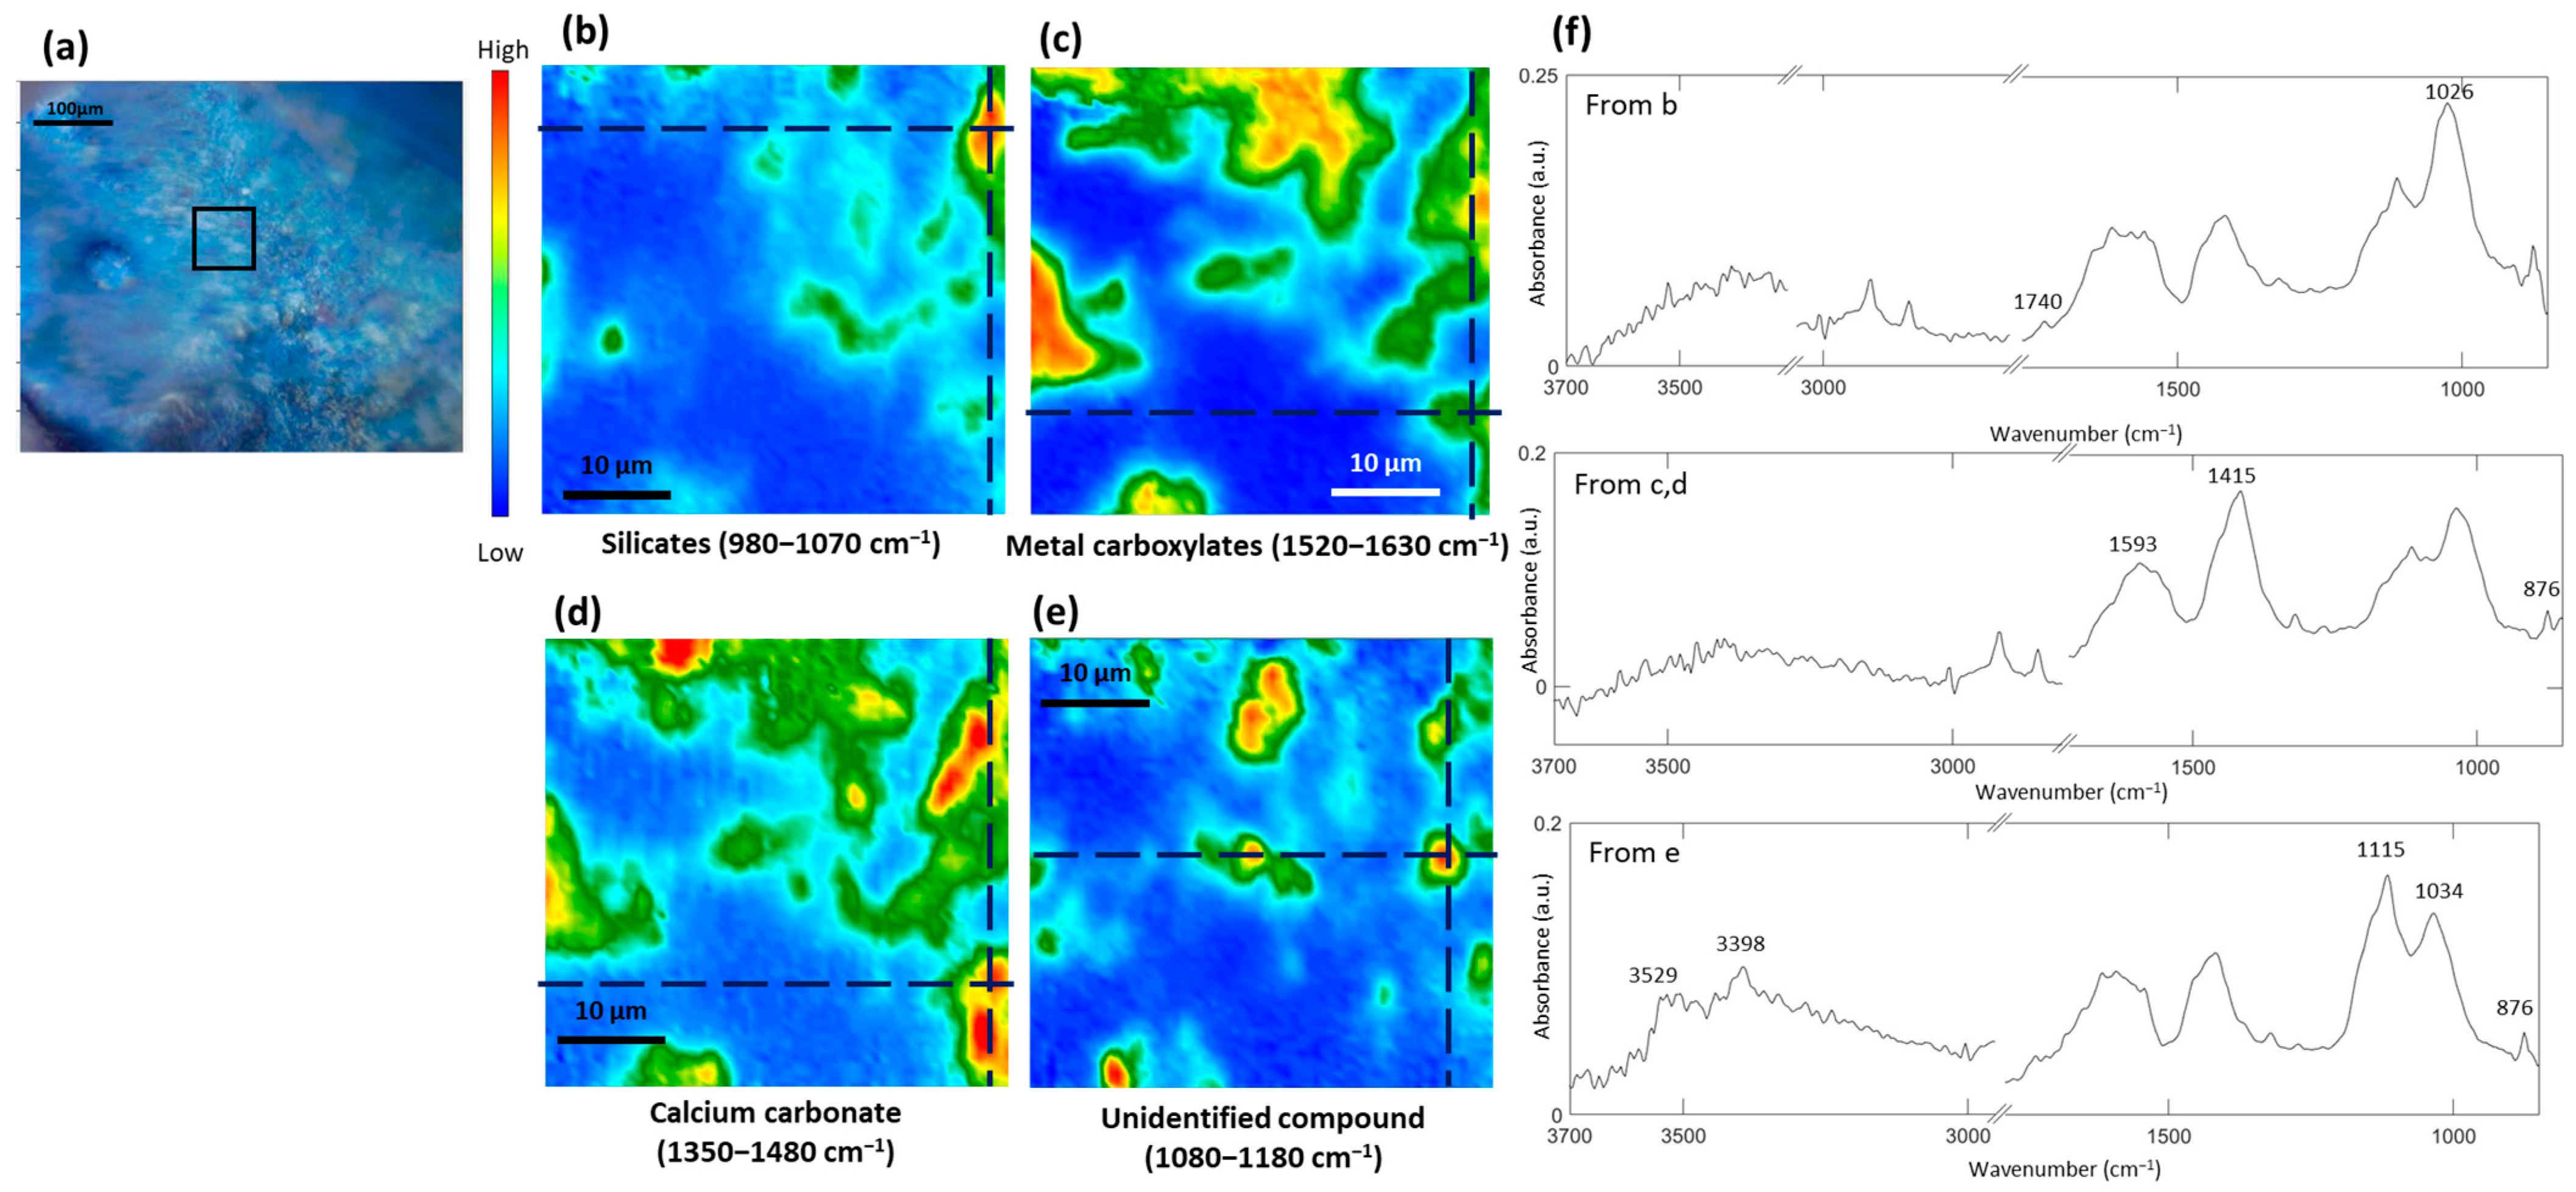
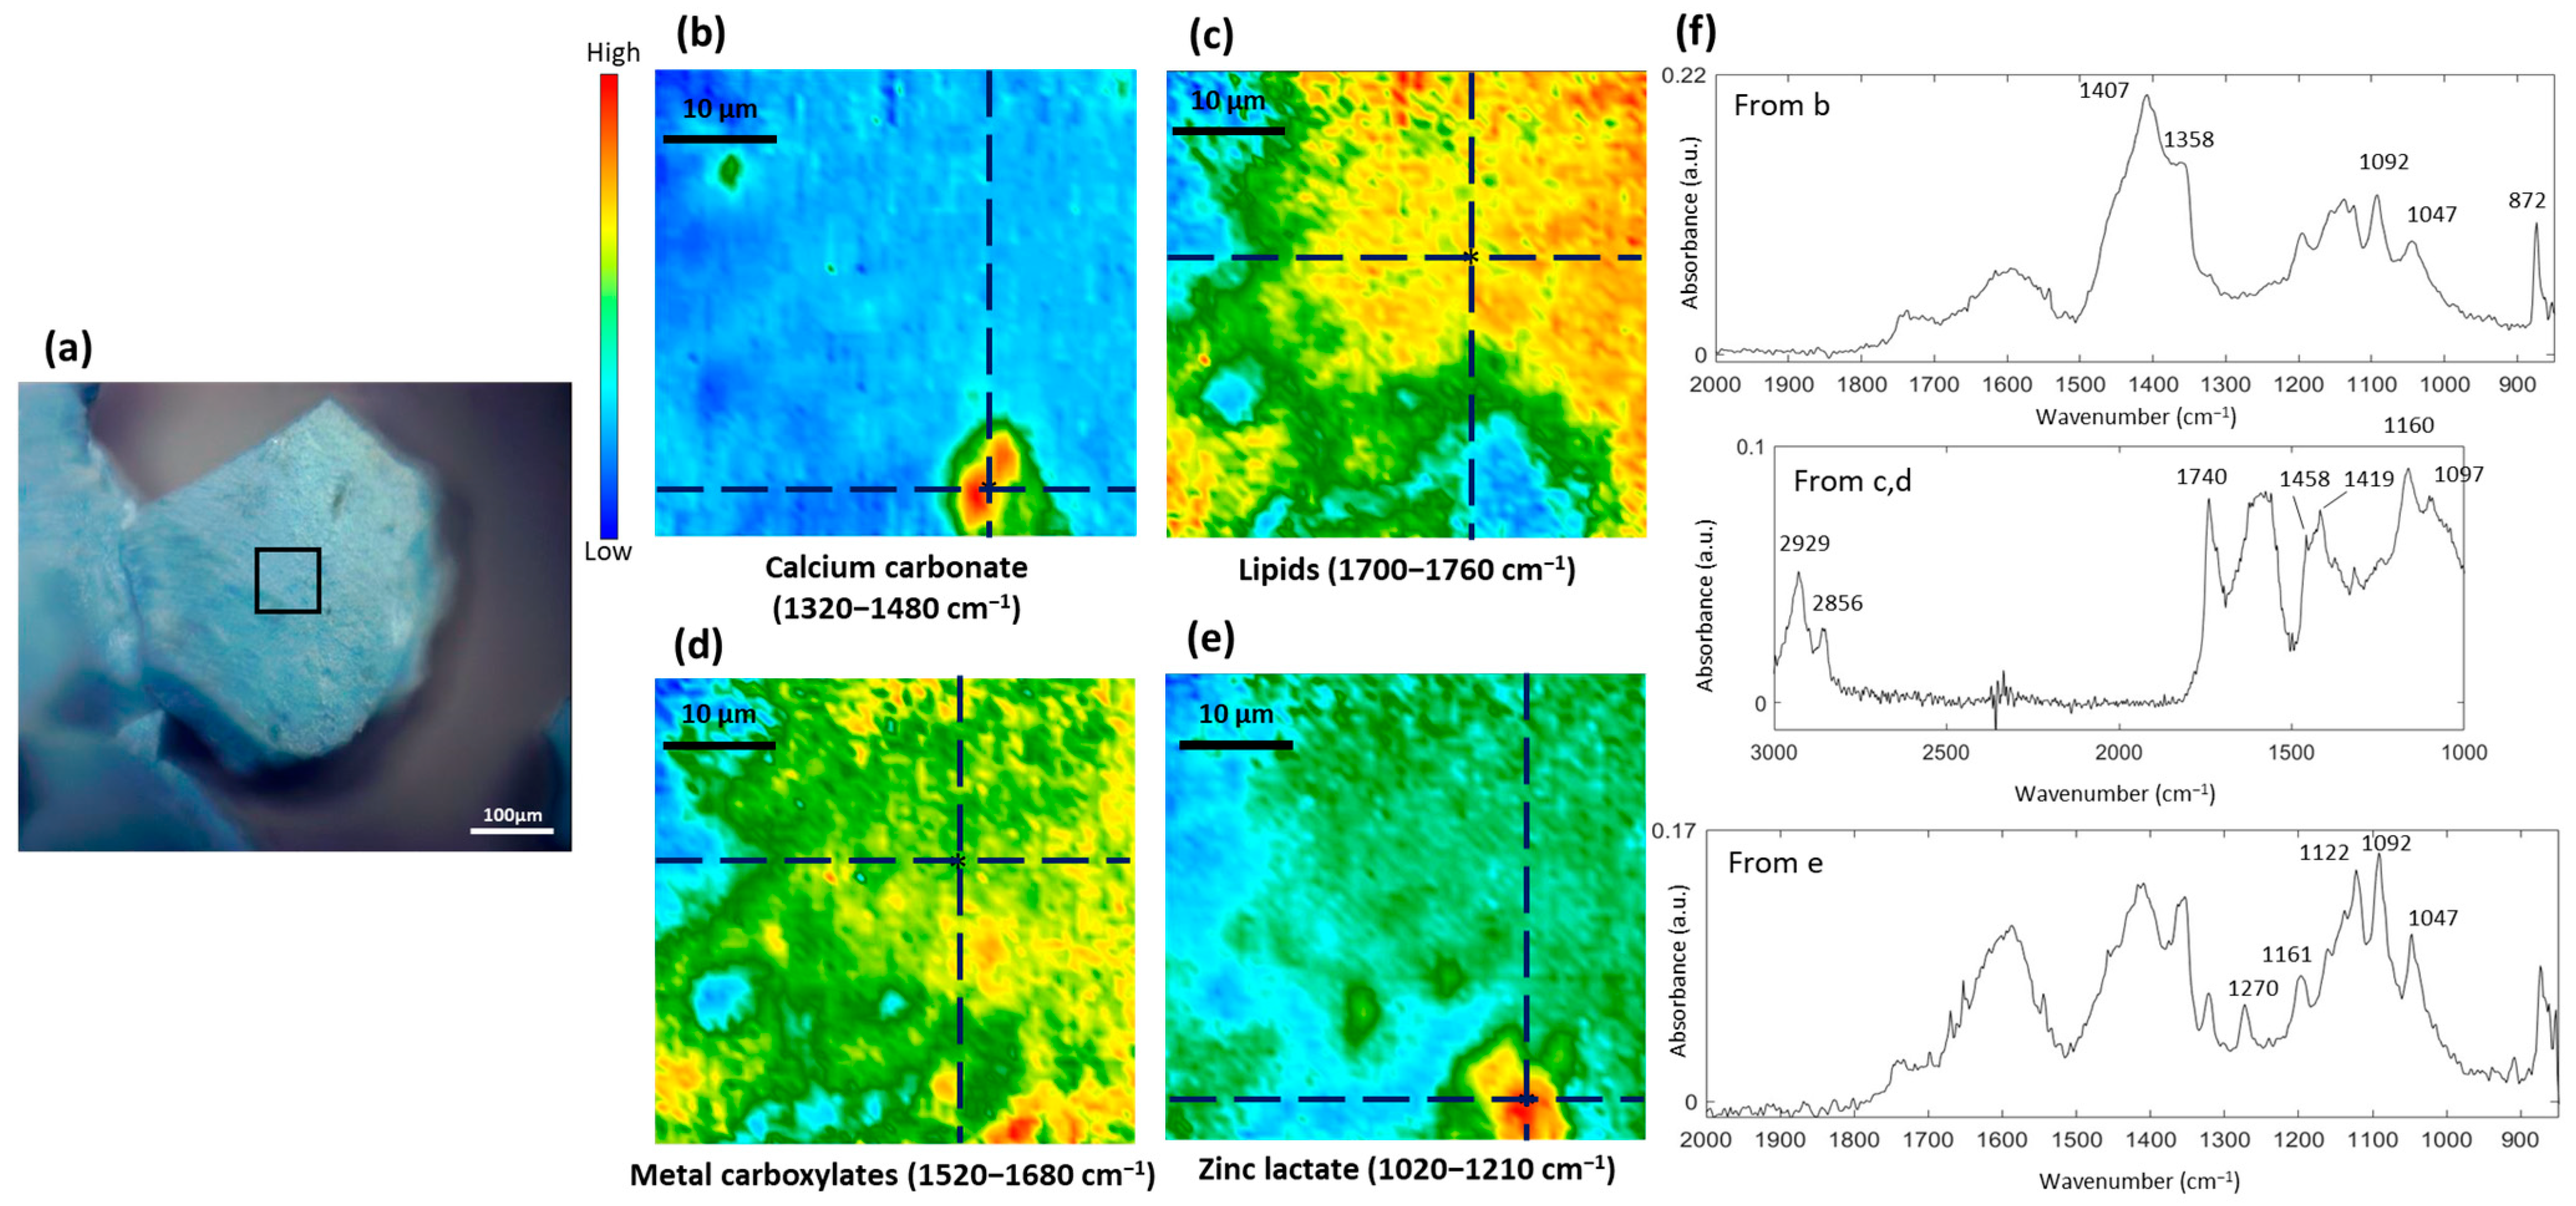
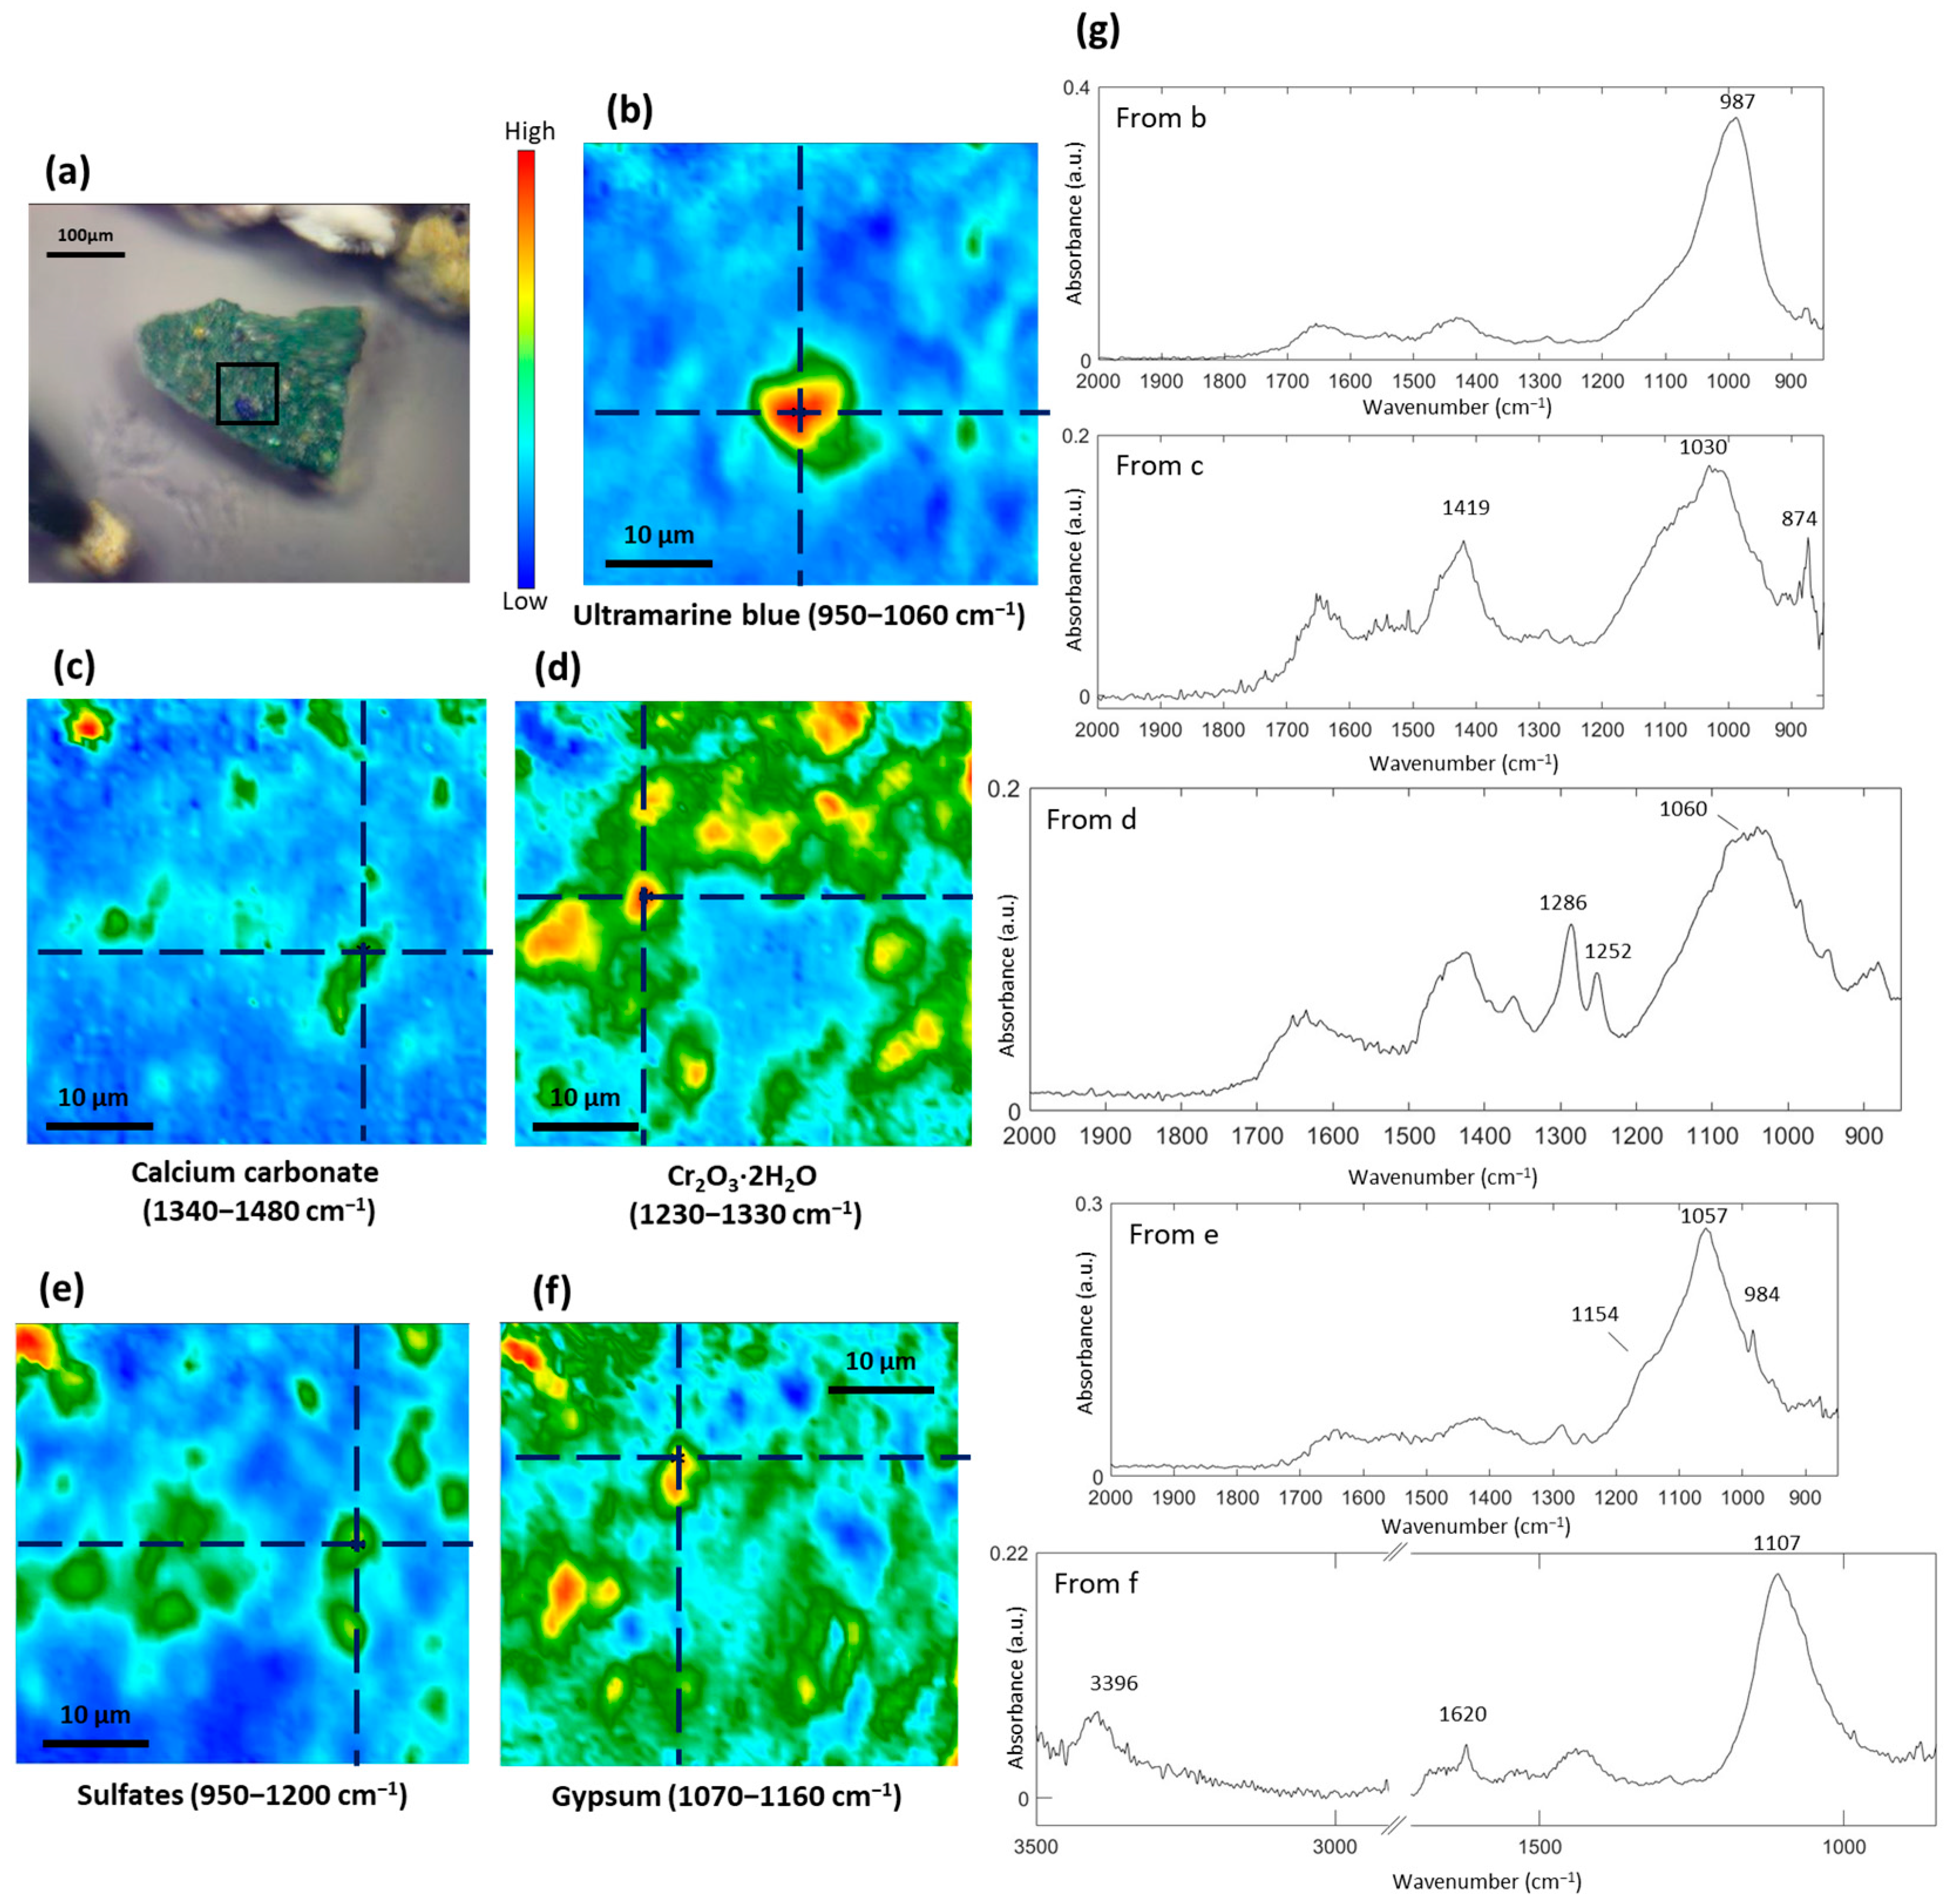
3.1. Study of the Blue Pigments

In this section, the blue pigments under investigation include those extracted from Morning in Stavrino, Arabian Dancer, Yerevan Zangu River, Caravan, Yerevan Zangu River, and the light blue pigments extracted from Kirovakan. The XRF results of these pigments are detailed in Table 1.
The blue pigment sample extracted from Morning in Stavrino and Arabian Dancer can be identified as ultramarine, which was traditionally acquired from the mineral lapis lazuli [12]. Lapis lazuli is a complex mineral that contains sodium, calcium, aluminum, silicon (Na, Ca, Al, Si)-based minerals such as lazurite (major), and other mineral impurities such as calcium carbonate (CaCO3) and pyrite (FeS). Synthetic ultramarine, which was invented in 1826, is a more likely candidate and is chemically identical to lapis lazuli but boasts even more vibrant colors. Figure 1 and Figure 2 show the ATR-FTIR chemical images of ultramarine blue and calcium carbonate. The band of νas(O–Si–O) at around 1000 cm−1 is assigned to lazurite [13,14], while the bands at 1414 cm−1as(CO32−)) and at 874 cm−1out-of-plane(CO32−)) are assigned to calcium carbonate [15]. XRF results (Table 1) show the detection of iron (Fe) and sulfur (S), which may support the existence of pyrite. However, it is important to note that S is also present in ultramarine blue. Future research may employ other molecular techniques to further elucidate the source of S. Chromium (Cr) was detected as a major element from the XRF results, implying the sample may contain Cr-based components. Chloride was also detected as a major element in the XRF results of this blue pigment and is commonly found in other pigment samples as well (Table 1, Table 2, Table 3 and Table 4). This presence could be attributed to chlorinated salts or Cl-containing degradation products. However, these compounds were not identified using the ATR-FTIR spectroscopic imaging technique. Further analysis is required to elucidate these Cr-based components and Cl-containing degradation products.
The ATR-FTIR imaging results show the presence of lead white and gypsum in the blue pigment from Caravan (Figure 3a). This observation finds support in the identification of high concentrations of Pb and Ca, as indicated by the XRF results (Table 1). Notably, there is no apparent detection of ultramarine blue, recognizable by its characteristic bands at approximately 1000 cm−1 in the ATR-FTIR spectrum. The use of XRF analysis enabled the detection of Co and Sn (Table 1), thereby corroborating the prevalence of cobalt cerulean blue (CoO·nSnO2, cobalt stannate) [16] as one of the components of this blue pigment sample. The detection of Al from the XRF results indicates the possibility that cobalt blue (CoO·Al2O3) might also have been used in the painting. The ATR-FTIR imaging results show the presence of lead white and gypsum by assigning the spectral bands at 1396 cm−1 [6,9,17] and 1107 cm−1 [18,19], respectively (Figure 3b–d). The detection of cadmium (Cd) and sulfur (S) as major elements in the XRF results implies that this blue pigment may contain cadmium yellow (CdS), which is uncommon for blue pigments. This could be attributed to the artist’s blending of colors, although microscopic images do not reveal any apparent greenish hues. Cd was also detected as a minor element in other blue and green pigments in this study (Table 1 and Table 2), which may be due to contamination from brushes or the palette.
The ATR-FTIR imaging results of the blue pigment sample from Yerevan Zangu River (Figure 4) show chemical images of silicates, calcium carbonate, metal carboxylates, and an unidentified compound. The presence of silicates was identified by assigning the absorbance at 1026 cm−1 and 1034 cm−1 (Figure 4b,f) and the detection of Si from the XRF results. These detected silicates may be fillers mixed with the blue pigment. The presence of Co and Sn detected with XRF may suggest that cobalt cerulean blue (CoO·nSnO2) is the main component of this blue pigment from the paint layer. It is noteworthy that metal carboxylates, characterized by distinct bands of νas(COO) within the spectral range of 1520 cm−1 to 1630 cm−1, were notably abundant within this blue pigment sample. The broad band of νas(COO) in this blue pigment sample indicates these metal carboxylates have a non-crystalline structure. The unidentified compound identified in this blue pigment shows characteristic bands at 1115 cm−1, which may indicate the presence of gypsum (Figure 4e,f). Nonetheless, this absorbance, assumed to be νas(SO42−), is at a higher wavenumber compared to the gypsum detected in the other samples, which is around 1107–1111 cm−1. The other absorbance peaks of gypsum, such as the one at 1620 cm−1, and water absorption at 3398 and 3529 cm−1, overlap with the absorbance of the metal oxalates detected in the blue pigment from Yerevan Zangu River. Furthermore, the detection of S is absent from the XRF results. As a result, gypsum cannot be identified in this blue pigment.
The presence of lipids, metal soaps, and calcium carbonate was identified in the light blue pigment sample from Kirovakan using ATR-FTIR spectroscopic imaging (Figure 5). The detection of Sn and Co using XRF may suggest that cobalt cerulean blue (CoO·nSnO2) is the primary component of the light blue pigment (Table 1). The possibility of cobalt blue (CoO·Al2O3) is not considered due to the absence of Al detection using XRF. The relatively strong vibrational bands located at 1740 cm−1, 2856 cm−1, and 2929 cm−1, assigned to the νsy(C=O ester), νsy(CH2), and νas(CH2), respectively, suggest the presence of a lipidic binder (Figure 5c,f), most likely associated with a siccative oil, such as linseed oil. The extensive distribution of this lipidic binder detected within the light blue pigment as shown from the ATR-FTIR image could be associated with the widespread occurrence of metal carboxylates (Figure 5d), which exhibit a broad νas(COO) peak in the ATR-FTIR spectrum (in Figure 5f), indicating their non-crystalline structure. These metal carboxylates can be amorphous zinc carboxylates as XRF detected a high amount of Zn (Table S1). In addition, zinc lactate, another degradation product of oil paints, was detected as demonstrated by the spectral bands at 1047 cm−1, 1092 cm−1, 1122 cm−1, and 1270 cm−1 (Figure 5e,f), which closely resemble the spectrum of zinc lactate [20,21]. It is known that zinc lactate can form as localized aggregates infused into the matrix of zinc soaps, in accordance with descriptions in the literature [20]. This observation is consistent with our ATR-FTIR chemical images (Figure 5d,e).
XRF analysis reveals Zn as the most abundant element detected in the blue pigments from Morning in Stavrino, Arabian Dancer, Yerevan Zangu River, and Kirovakan, suggesting the possible presence of zinc white (ZnO). However, it is worth noting that the spectral band of zinc white typically appears around 450 cm−1, which falls beyond the spectral range detectable by our ATR-FTIR spectroscopic technique. To validate the presence of zinc white in these blue pigments, further investigations could involve the use of FTIR spectroscopy with the far-IR region, capable of detecting spectral bands at lower wavenumbers. Additionally, complementary techniques like Raman spectroscopy could also be employed.

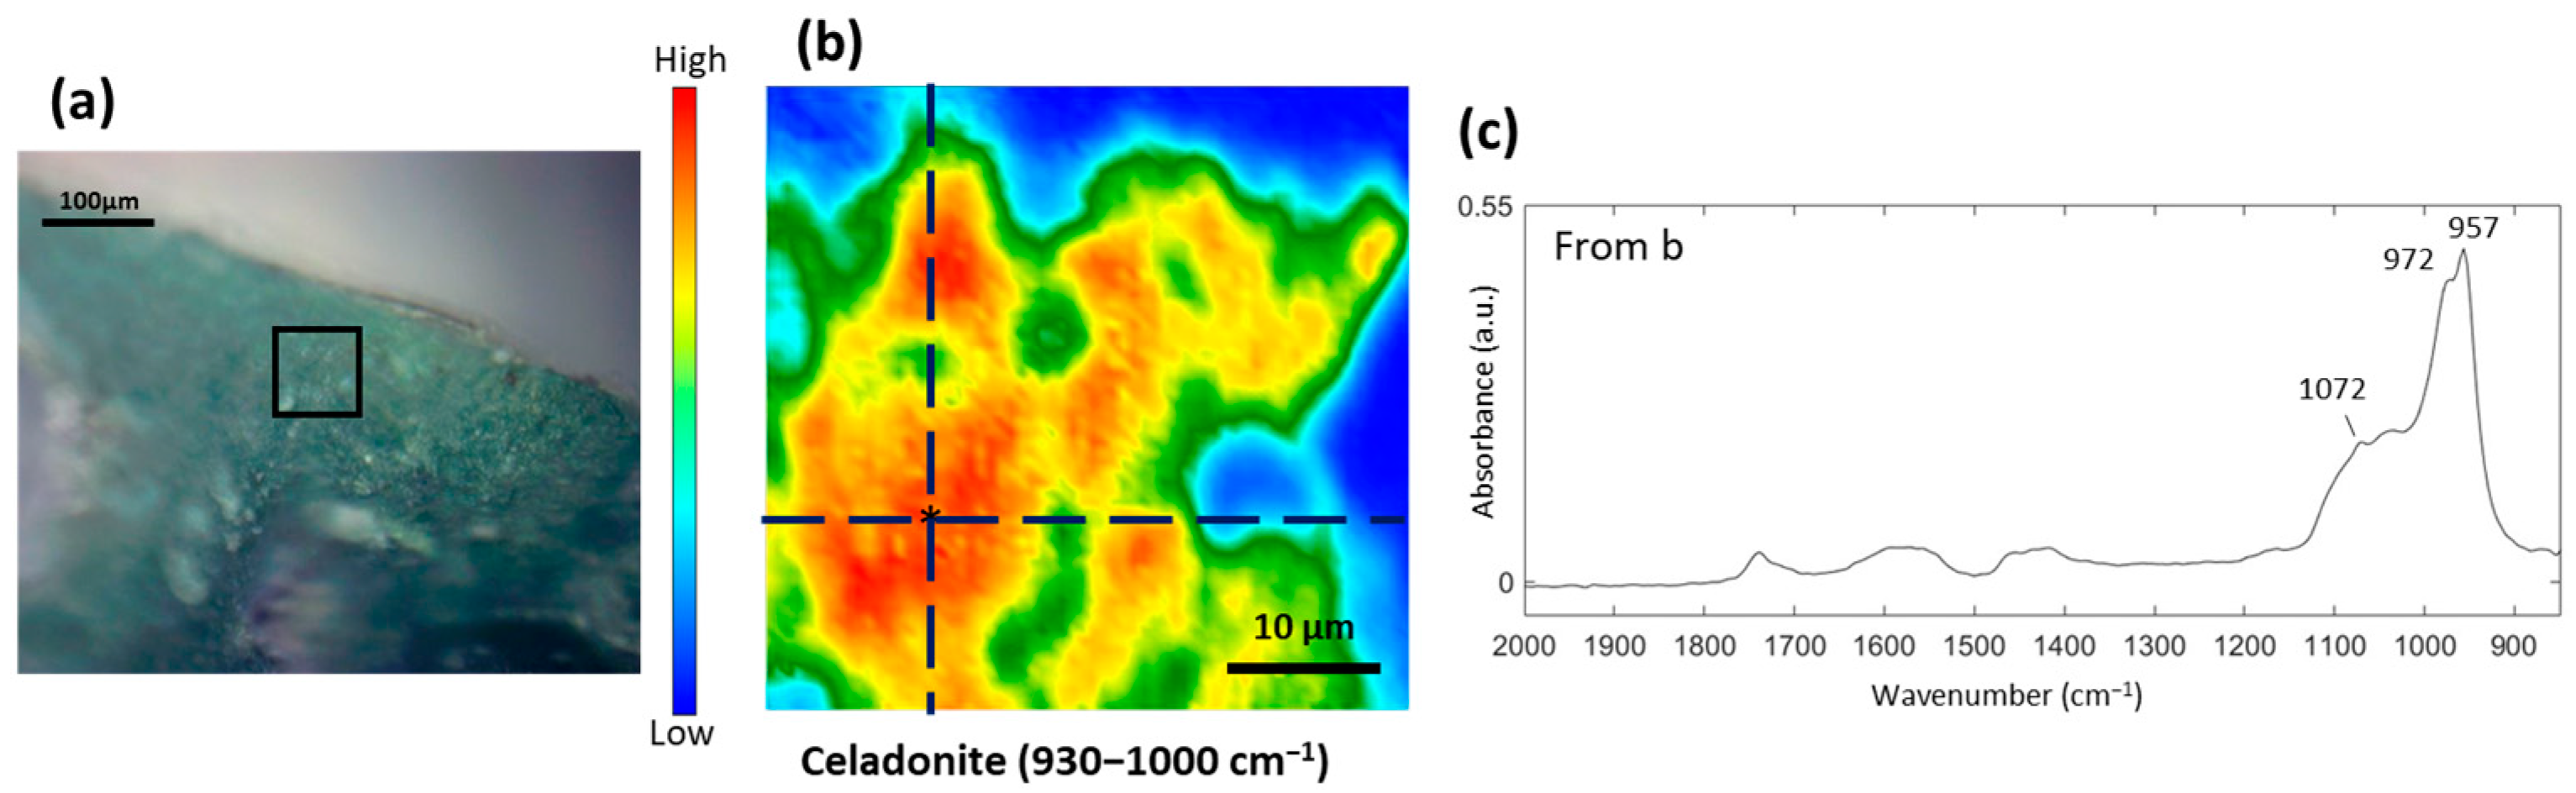
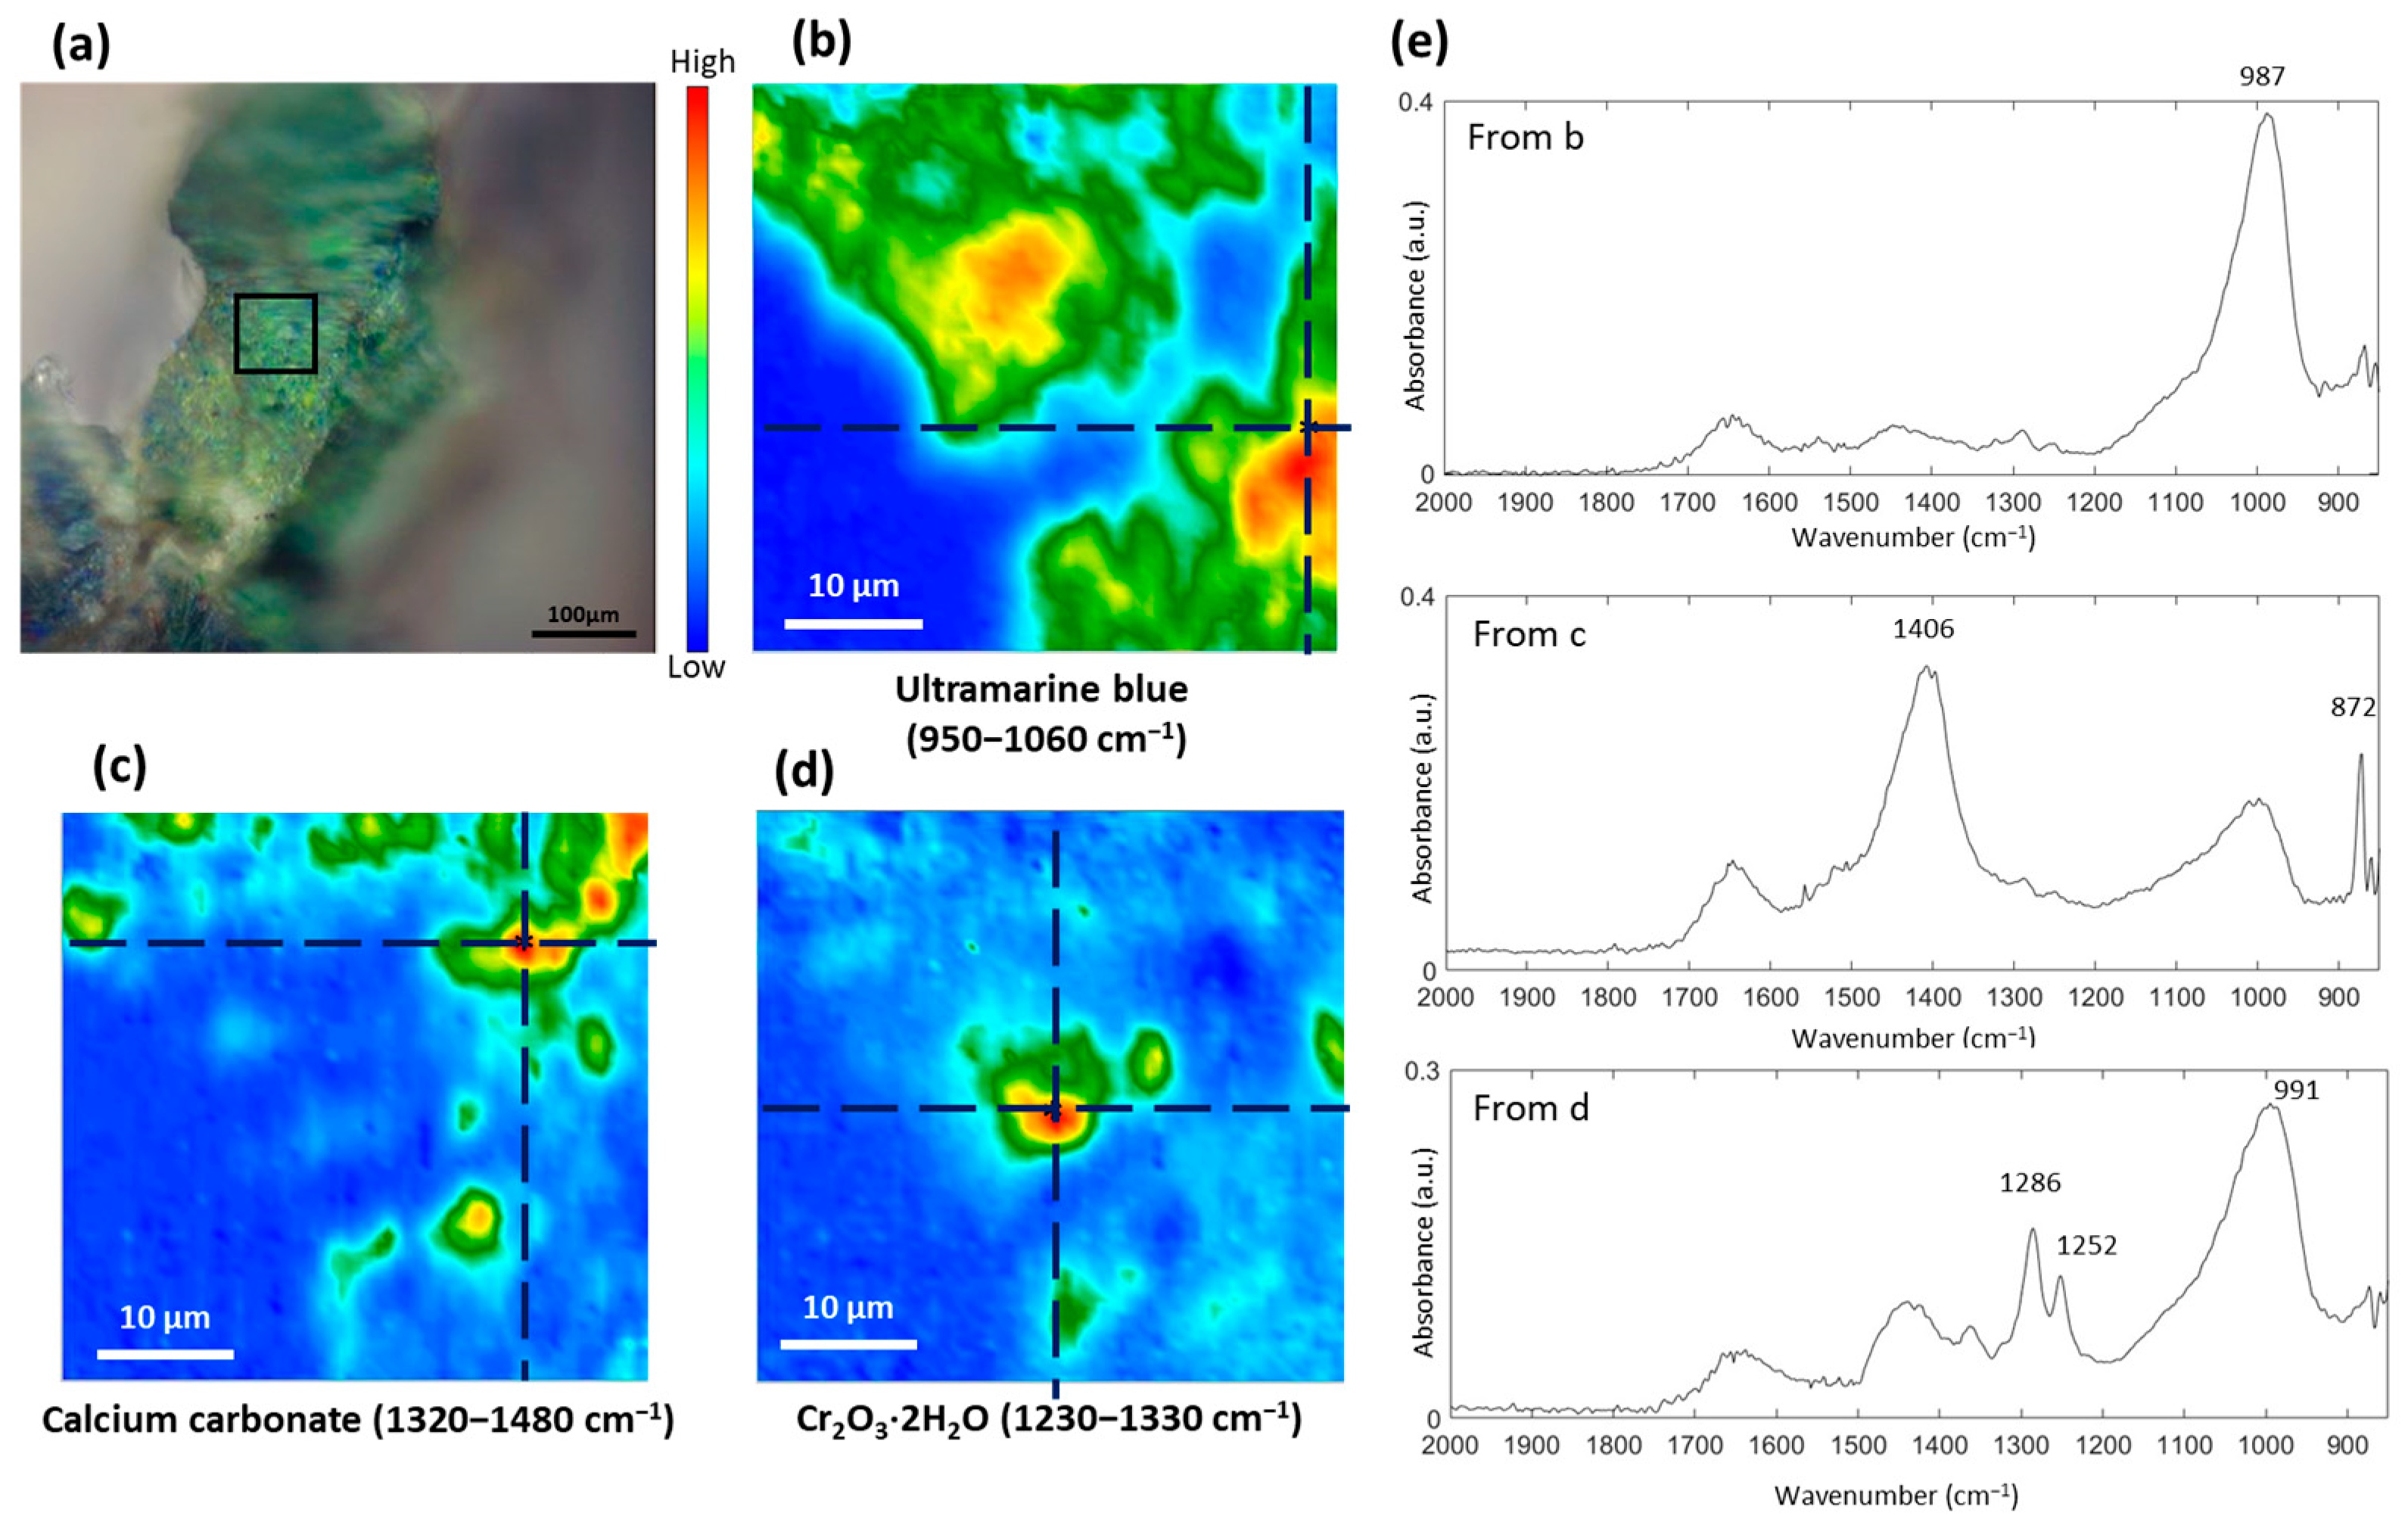
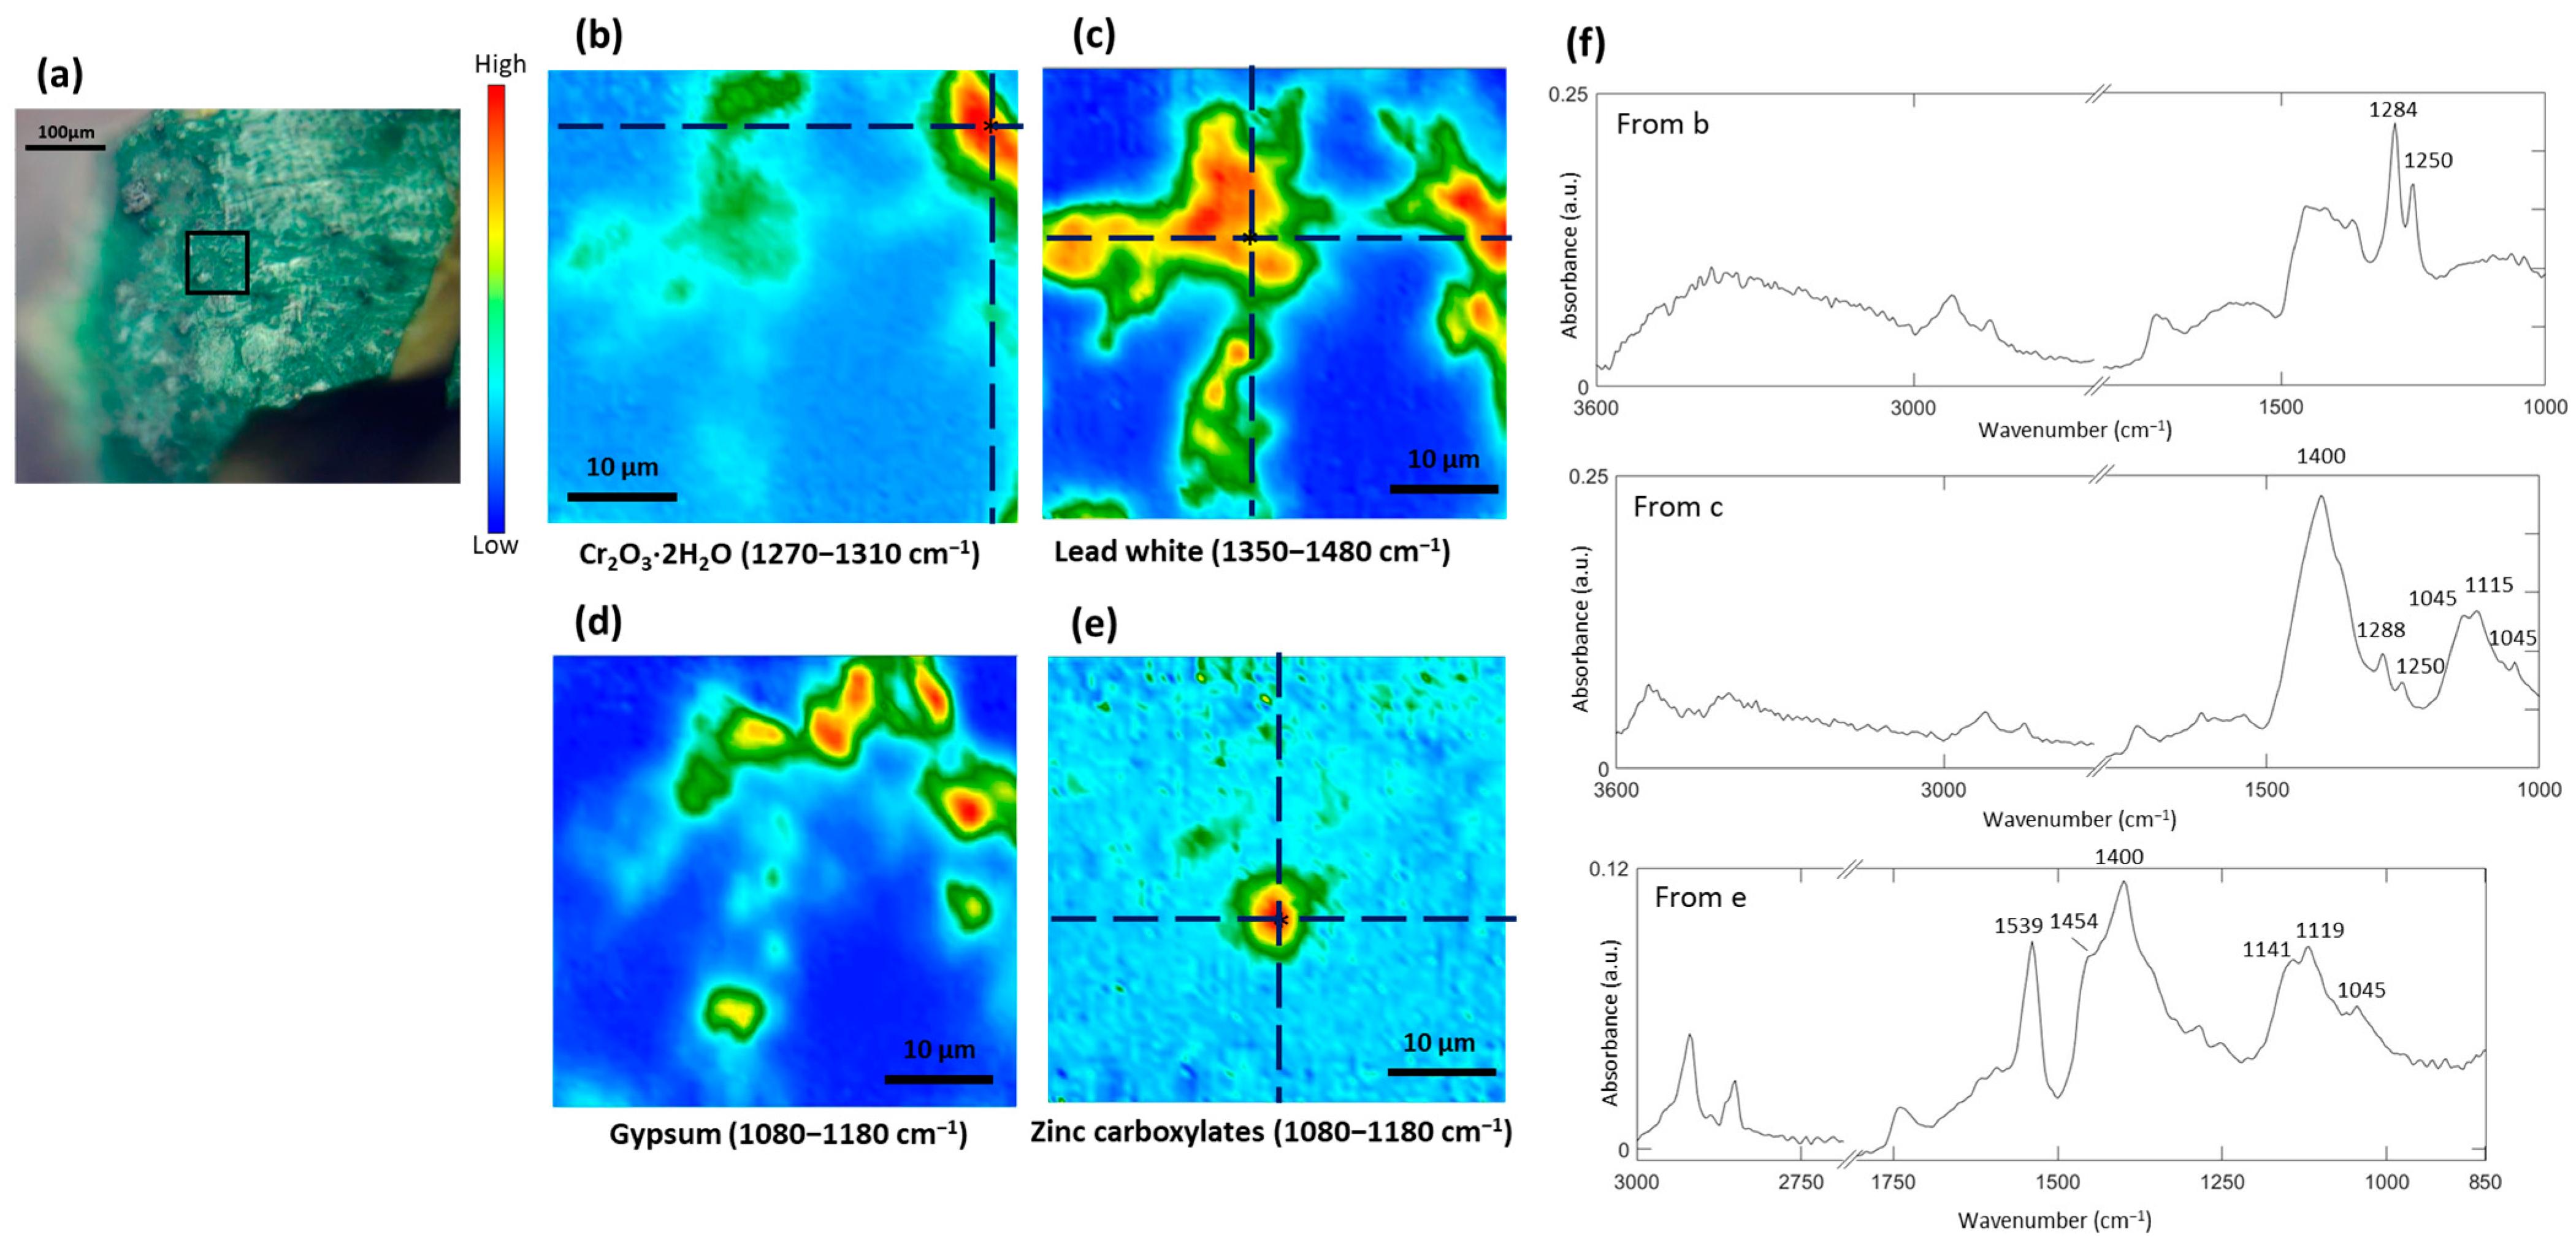
3.2. Study of the Green Pigment

In this section, the focus turns to the exploration of green pigments, encompassing those derived from Morning in Stavrino, Arabian Dancer, Yerevan Zangu River, Caravan, and the dark green pigments from Yerevan Zangu River. The XRF results of these pigments are detailed in Table 2.
The ATR-FTIR images (Figure 6b,c) show chemical distributions of ultramarine blue and calcium carbonate in the green pigment from Morning in Stavrino, which is in line with the results of the blue pigment sample from Morning in Stavrino. Our XRF results (Table 2) reveal a high concentration of calcium (Ca), aligning with our identification of calcium carbonate in the blue pigments. In addition, a spectrum extracted from the measured area of this green pigment sample exhibits two absorption bands at 1252 cm−1 and 1286 cm−1, indicating a presence of hydrated chromium oxide (Cr2O3∙2H2O) [14], also known as viridian (Figure 6d). The spectra also exhibit an O–H bending band at approximately 1640 cm−1, which confirms the presence of water molecules in the hydrated chromium oxide. The absorption bands at 1252 cm−1 and 1286 cm−1 are attributed to a by-product, which was assumed to be a chromium-bearing borate in the literature [22]. Interestingly, these two absorption bands are not commonly identified in modern post-war samples, possibly due to the application of different manufacturing techniques in the production of viridian pigments [23]. However, our XRF results do not detect boron (Table 2) due to the limitations of XRF in detecting light elements. The XRF results of this green pigment sample do confirm the presence of Cr, supporting the presence of viridian. It should be noted that in certain literature [14], Cr2O3·2H2O exhibits distinct peaks at approximately 1063 cm−1 and 792 cm−1, which are not observed in our results. The absence of absorption bands at 1063 cm−1 and 792 cm−1 may be explained by the specific synthesis conditions of this viridian pigment, involving a higher temperature range and a prolonged calcination period [22].
The ATR-FTIR analysis reveals the presence of ultramarine blue, calcium carbonate, and hydrated chromium oxide in the green pigment from Arabian Dancer (Figure 7b–d), which is consistent with the results obtained for the green pigment used in Morning in Stavrino (Figure 6), except for the detection of sulfates and gypsum (Figure 7e,f). The sulfates observed in the green pigment sample may be attributed to the presence of chrome yellow, as yellow hues are visible on the mineral particles of this green pigment (Figure 7a). Gypsum (CaSO4·2H2O) could either be an original material or a product of degradation. The spectral band at 1107 cm−1 is assigned to the anti-symmetric stretching mode of sulfate (νas(SO42−)), while the bands at 3396 cm−1 and 1620 cm−1 correspond to the stretching and bending vibrational modes of water, respectively. The detection of Cr revealed in the XRF results (Table 2) may provide supporting evidence for the potential existence of chrome yellow (Figure 7e,g) and hydrated chromium oxide (Figure 7d,g) within the green pigment, as indicated by the ATR-FTIR results. The detection of Zn as the element with the highest concentration in the XRF results could be attributed to the potential utilization of zinc white. This hypothesis needs verification through additional complementary techniques, such as FTIR spectroscopy within the far-IR spectral region or Raman spectroscopy.
The distribution of Cr2O3·2H2O in the green pigment from Caravan was obtained by plotting the integrating absorbance bands at 1250 cm−1 and 1284 cm−1 (Figure 8b). XRF analysis also confirmed the presence of Cr (Table 2). Lead white and gypsum were identified from the ATR-FTIR imaging results (Figure 8c), and Pb and Ca were detected from the XRF results.
The ATR-FTIR imaging results (Figure 9) show chemical images of metal oxalates as a degradation product, and the distribution of calcium metal carboxylates, calcium carbonate, gypsum, and silicates in the green pigment from Yerevan Zangu River. The presence of silicates in this green pigment sample was identified by assigning Si-O stretching modes [24] at 1030 cm−1 (Figure 9f,h) or at 957 cm−1 (Figure 9g,h). The detection of Zn, Cr, and Co from the XRF results (Table 2) implies that the green pigments may contain cobalt green (CoO·ZnO) and chromium oxide green (Cr2O3). We do not observe the spectral bands at 1252 cm−1 and 1286 cm−1 that are attributed to boron-containing by-products in hydrated chromium oxide, which can be seen in the green pigments from Arabian Dancer (Figure 7f,g) and Caravan (Figure 8b,f). In addition to the cobalt green pigment, which was relatively uncommon, a more plausible explanation could involve the mixture of small amounts of cobalt blue (CoO·Al2O3) into this green pigment to achieve the desired hue.
The substantial presence of As (9.722%, Table S2) from the XRF results of the blue-green pigment from Caravan (Table 2) suggests a high likelihood of a Cu-based pigment, emerald green (copper acetoarsenite, 3Cu(AsO2)2·Cu(CH3COO)2) [25]. Emerald green was highly esteemed by artists in the 19th century due to its vividness and long-lasting properties. Nevertheless, its production was ultimately discontinued by the 1960s due to the severe toxicity associated with the pigment [26]. Other possibilities of Cu-based green pigments could include malachite (CuCO3·Cu(OH)2) and azurite (2CuCO3·Cu(OH)2), potentially indicated by the identification of carbonates by assigning the spectral bands of the carbonate group at 1400 cm−1 and 862 cm−1 in our ATR-FTIR results (Figure 10b,d). However, it is worth noting that malachite, an ancient pigment, was not commonly employed in the 20th century. Furthermore, both malachite and azurite exhibit multiple peaks of νas(CO32−) in the region of 1380 cm−1 and 1490 cm−1 [14], these carbonates are more likely to be attributed to lead white. The substantial presence of Pb, as evident in the XRF results, further supports the assumption that the carbonates within this blue-green pigment are primarily derived from lead white. Additionally, the detection of Co and Zn also suggests the possible presence of a small amount of cobalt green (CoO·ZnO) [27]. Zinc carboxylates, characterized by spectral bands of νas(COO), were identified as a degradation product in this blue-green pigment, exhibiting a split doublet at 1531 cm−1 and 1546 cm−1 [21] (Figure 10c,d). The spectral bands of νas(COO) at 1454 and 1546 cm−1 may also be attributed to the carboxylic group of copper acetoarsenite [28], thus supporting the presence of emerald green.
Apart from the green pigment, another green pigment that is darker was also taken from Yerevan Zangu River (Figure 11a). The ATR-FTIR spectrum extracted from a chemical image was created by plotting absorbance between 930 and 1000 cm−1 and shows two spectral bands at 957 cm−1, 972 cm−1 and a shoulder at 1072 cm−1, which can be ascribed to a distortion of the Si−O bond in plane [29]. The ATR-FTIR imaging results show that the dark green pigment used in Yerevan Zangu River may be celadonite (K(Mg, Fe2+)(Fe3+, Al)[Si4O10](OH)2) (Figure 11). However, the amount of dark green sample (two separate powders) is too low to get reliable results to confirm the presence of K, Mg, and Al.

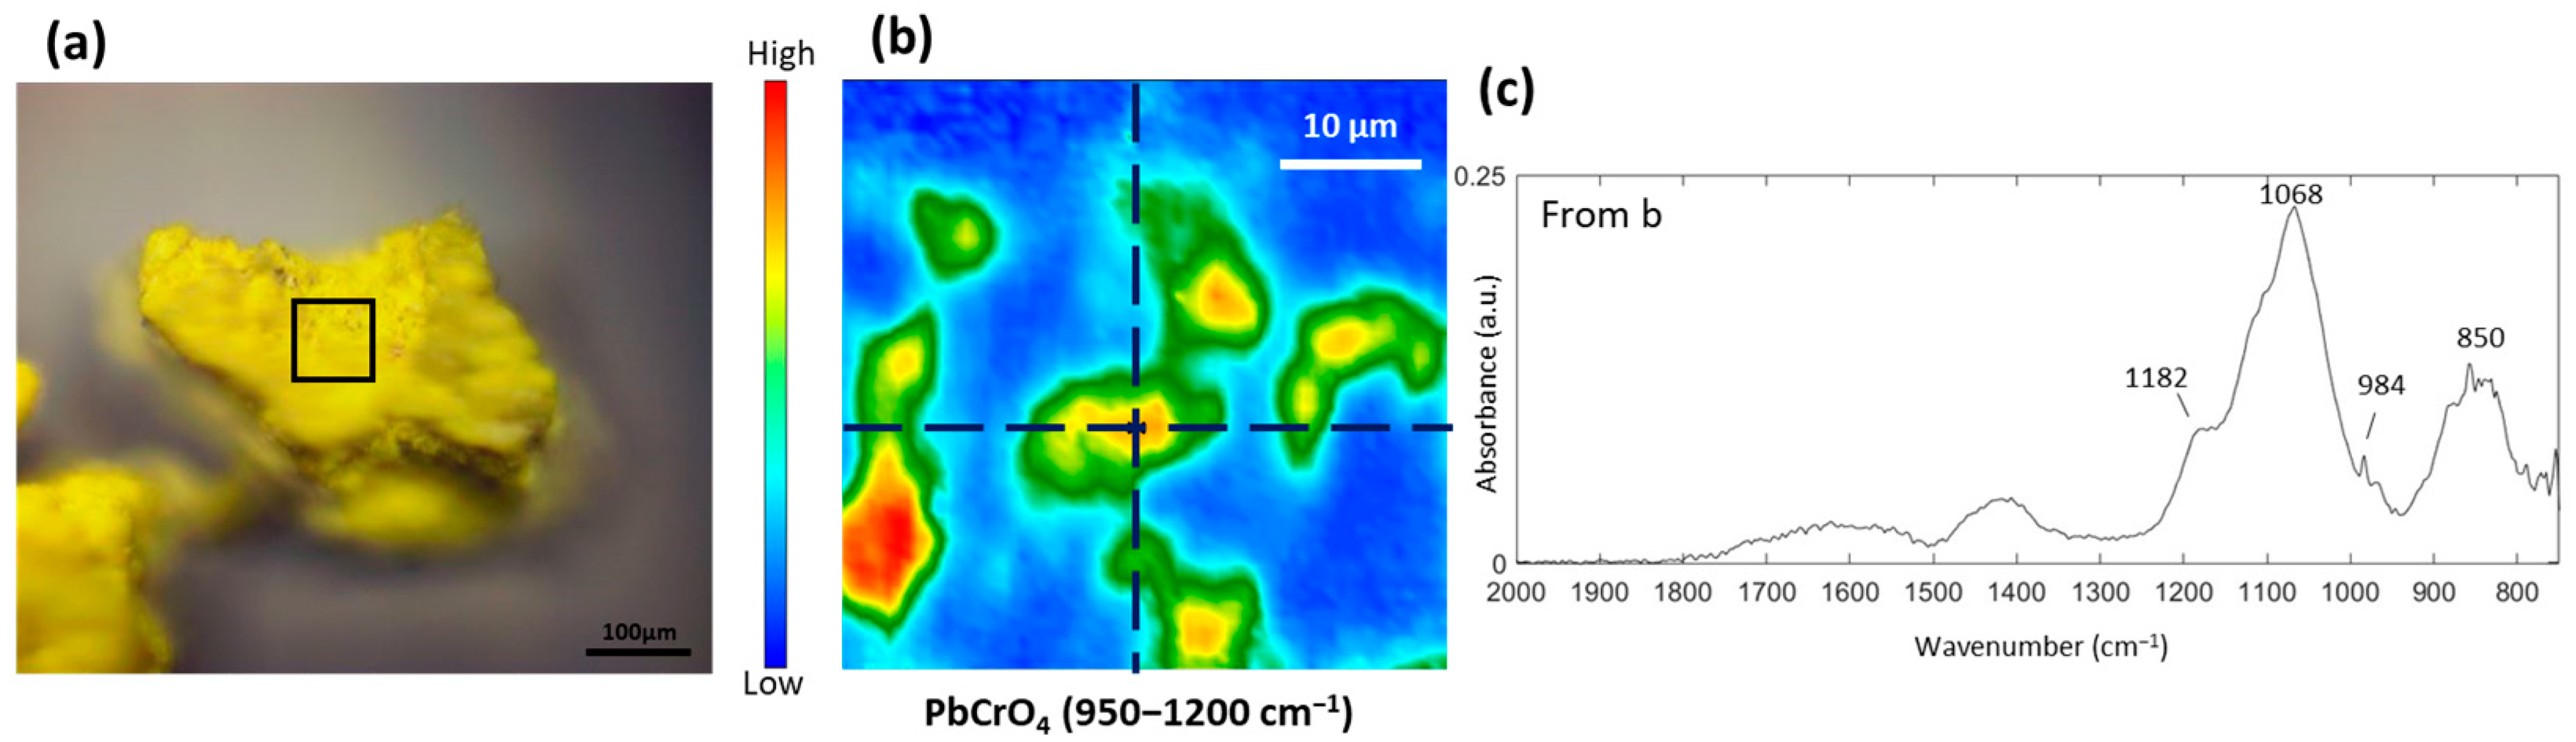
3.3. Study of the Yellow and Brown Pigments

In this section of the pigment investigation, we delve into the analysis of yellow pigments from Morning in Stavrino and Caravan, and a brown pigment from Caravan. The XRF results of these pigments are detailed in Table 3.
The ATR-FTIR imaging results (Figure 12) reveal the detection of sulfates in the yellow pigment sample taken from Morning in Stavrino, as indicated by the spectral bands at 984 cm−1, 1068 cm−1, and 1182 cm−1 (ν(SO42−)). The bands at 1068 cm−1 and 1182 cm−1 are attributed to νas(SO42−), while the band at 984 cm−1 corresponds to νsy(SO42−) [30]. The XRF results (Table 3) do not detect any cadmium (Cd), indicating that the possibility of cadmium yellow can be ruled out. Additionally, chrome yellow is composed of PbCrO4 and PbSO4 [31]. The ATR-FTIR spectra display the presence of νsy(CrO42−) at approximately 850 cm−1. The detection of Cr from the XRF results suggests that chrome yellow may be the main component of the yellow pigment. It is important to emphasize that a substantial amount of Si, Ca, Zn, and Fe was detected using XRF (Table S3). The presence of Si and Fe could suggest the inclusion of Fe-containing yellow earth in this chrome yellow pigment. Similarly, the identification of Ca and Zn might indicate the incorporation of CaCO3 and zinc white (ZnO), respectively, into the yellow pigment. However, the absorption bands associated with Fe-containing yellow earth and CaCO3 are obscured by the strong spectral bands of ν(SO42−) and νsy(CrO42−) originating from the chrome yellow pigment. Verification of this hypothesis may necessitate the utilization of alternative techniques.
The brown-colored sample extracted from Caravan has a pale almond tone mixing with an orange matrix (Figure 13a). ATR-FTIR analysis reveals the presence of carbonates, potentially lead white and calcium carbonate (Figure 13b), which was supported by the detection of Pb and Ca from the XRF results (Table 3). The presence of Cd and Zn in the XRF results may indicate the identification of cadmium yellow (CdS and ZnS) in the brown-colored sample. However, the absence of S in the XRF results may raise concerns regarding the identification of cadmium yellow. Unfortunately, the Cd–S vibrational bands fall within the spectral range of 300–230 cm−1 [32], which exceeds the capability of our ATR-FTIR technique. Consequently, the verification of CdS through the ATR-FTIR results is unattainable. Nonetheless, the presence of CdCO3 and CdSO4 is commonly observed when identifying CdS in cadmium yellow pigment. This is due to the utilization of CdSO4 and CdCO3 as reagents in the wet and dry process syntheses of CdS, respectively [33,34]. Furthermore, CdSO4 and CdSO3 are degradation products resulting from the photooxidation of CdS [35]. Therefore, the detection of carbonates in this yellow pigment sample can also be assigned to CdCO3.
Despite the slightly different colors exhibited by the yellow pigment and brown pigments from Caravan (Figure 13a and Figure 14a), their ATR-FTIR imaging and XRF results are similar. Carbonates, including lead carbonate (lead white), calcium carbonate, and cadmium carbonate, were identified, as shown in Figure 14b and Table 3. The measured Zn content in the brown pigment sample from XRF results is 1.055% (Table S3), categorizing it as a major element. However, the yellow pigment sample contains 0.737% of Zn (Table S3), designating it as a minor element.

3.4. Study of the Red and Orange Pigments

Red pigments from Arabian Dancer and Caravan and an orange pigment extracted from Kirovakan are examined and discussed in this section. The XRF results of these pigments are detailed in Table 4.
The ATR-FTIR imaging results demonstrate the presence of gypsum in the red pigment from Arabian Dancer (Figure 15b), indicating that the red pigment may be composed of Venetian red. Venetian red is typically produced by combining gypsum with iron oxide (Fe2O3) derived from red ochre [36]. The detection of silicates (Figure 15c) further supports the presence of red ochre since ochre is a mixture of ferric oxide, clay, and silicate-containing sand. The detection of iron (Fe) and silicon (Si) in the XRF results (Table 4) also corroborates the hypothesis that the red pigment contains red ochre. It is important to note that based on the XRF results, the presence of cadmium (Cd), zinc (Zn), and sulfur (S) was also detected. Therefore, the possibility of cadmium yellow (CdS and ZnS) should not be excluded. Additionally, the identification of oxalates as degradation products was observed (Figure 15d).
ATR-FTIR imaging results reveal the presence of silicates, gypsum, an unidentified compound, and carbonates in the red pigment from Caravan (Figure 16). By assigning spectral bands at 934 cm−1, 1018 cm−1, and 1033 cm−1 attributed to different silicates and clay mixtures, red ochre can be identified (Figure 16b,g). The detection of Fe from the XRF results supports the possibility of red ochre, but the lack of Si detection may weaken this hypothesis. The unidentified compound identified in this red pigment displays characteristic bands at 927 cm−1, 976 cm−1, 1431 cm−1, and 1462 cm−1 (Figure 16d,e,g). These bands may suggest a potential association with the elevated levels of chlorine (Cl), phosphorus (P), and erbium (Er) detected in the XRF results (Table 4). However, due to the limited existing literature on the application of Er-based components in oil paintings, confirming whether this unidentified compound is genuinely related to the Er-based components remains challenging. A pixel from this red pigment shows the presence of an intense band at 1400 cm−1 that may be characteristic carbonates [15] (Figure 16f,g). Combined with the XRF results indicating a high concentration of Pb and Ca, we cannot exclude the presence of lead white and CaCO3. Notably, Co was detected in the XRF results. Therefore, it is reasonable to hypothesize that Co-based pigments were mixed with this red pigment to give it a somewhat violet appearance.
Red ochre (Fe2O3 + kaolin) was identified in the orange pigment from Kirovakan by assigning spectral bands at 912 cm−1 (inner-surface OH in-plane bending), 1005 cm−1, and 1028 cm−1 (equatorial Si−O bond anti-symmetric stretching) (Figure 17b,d). The detection of Fe and Si further supports the presence of red ochre in the orange pigment. Impurities such as calcium carbonate [37] were also identified (Figure 17c).

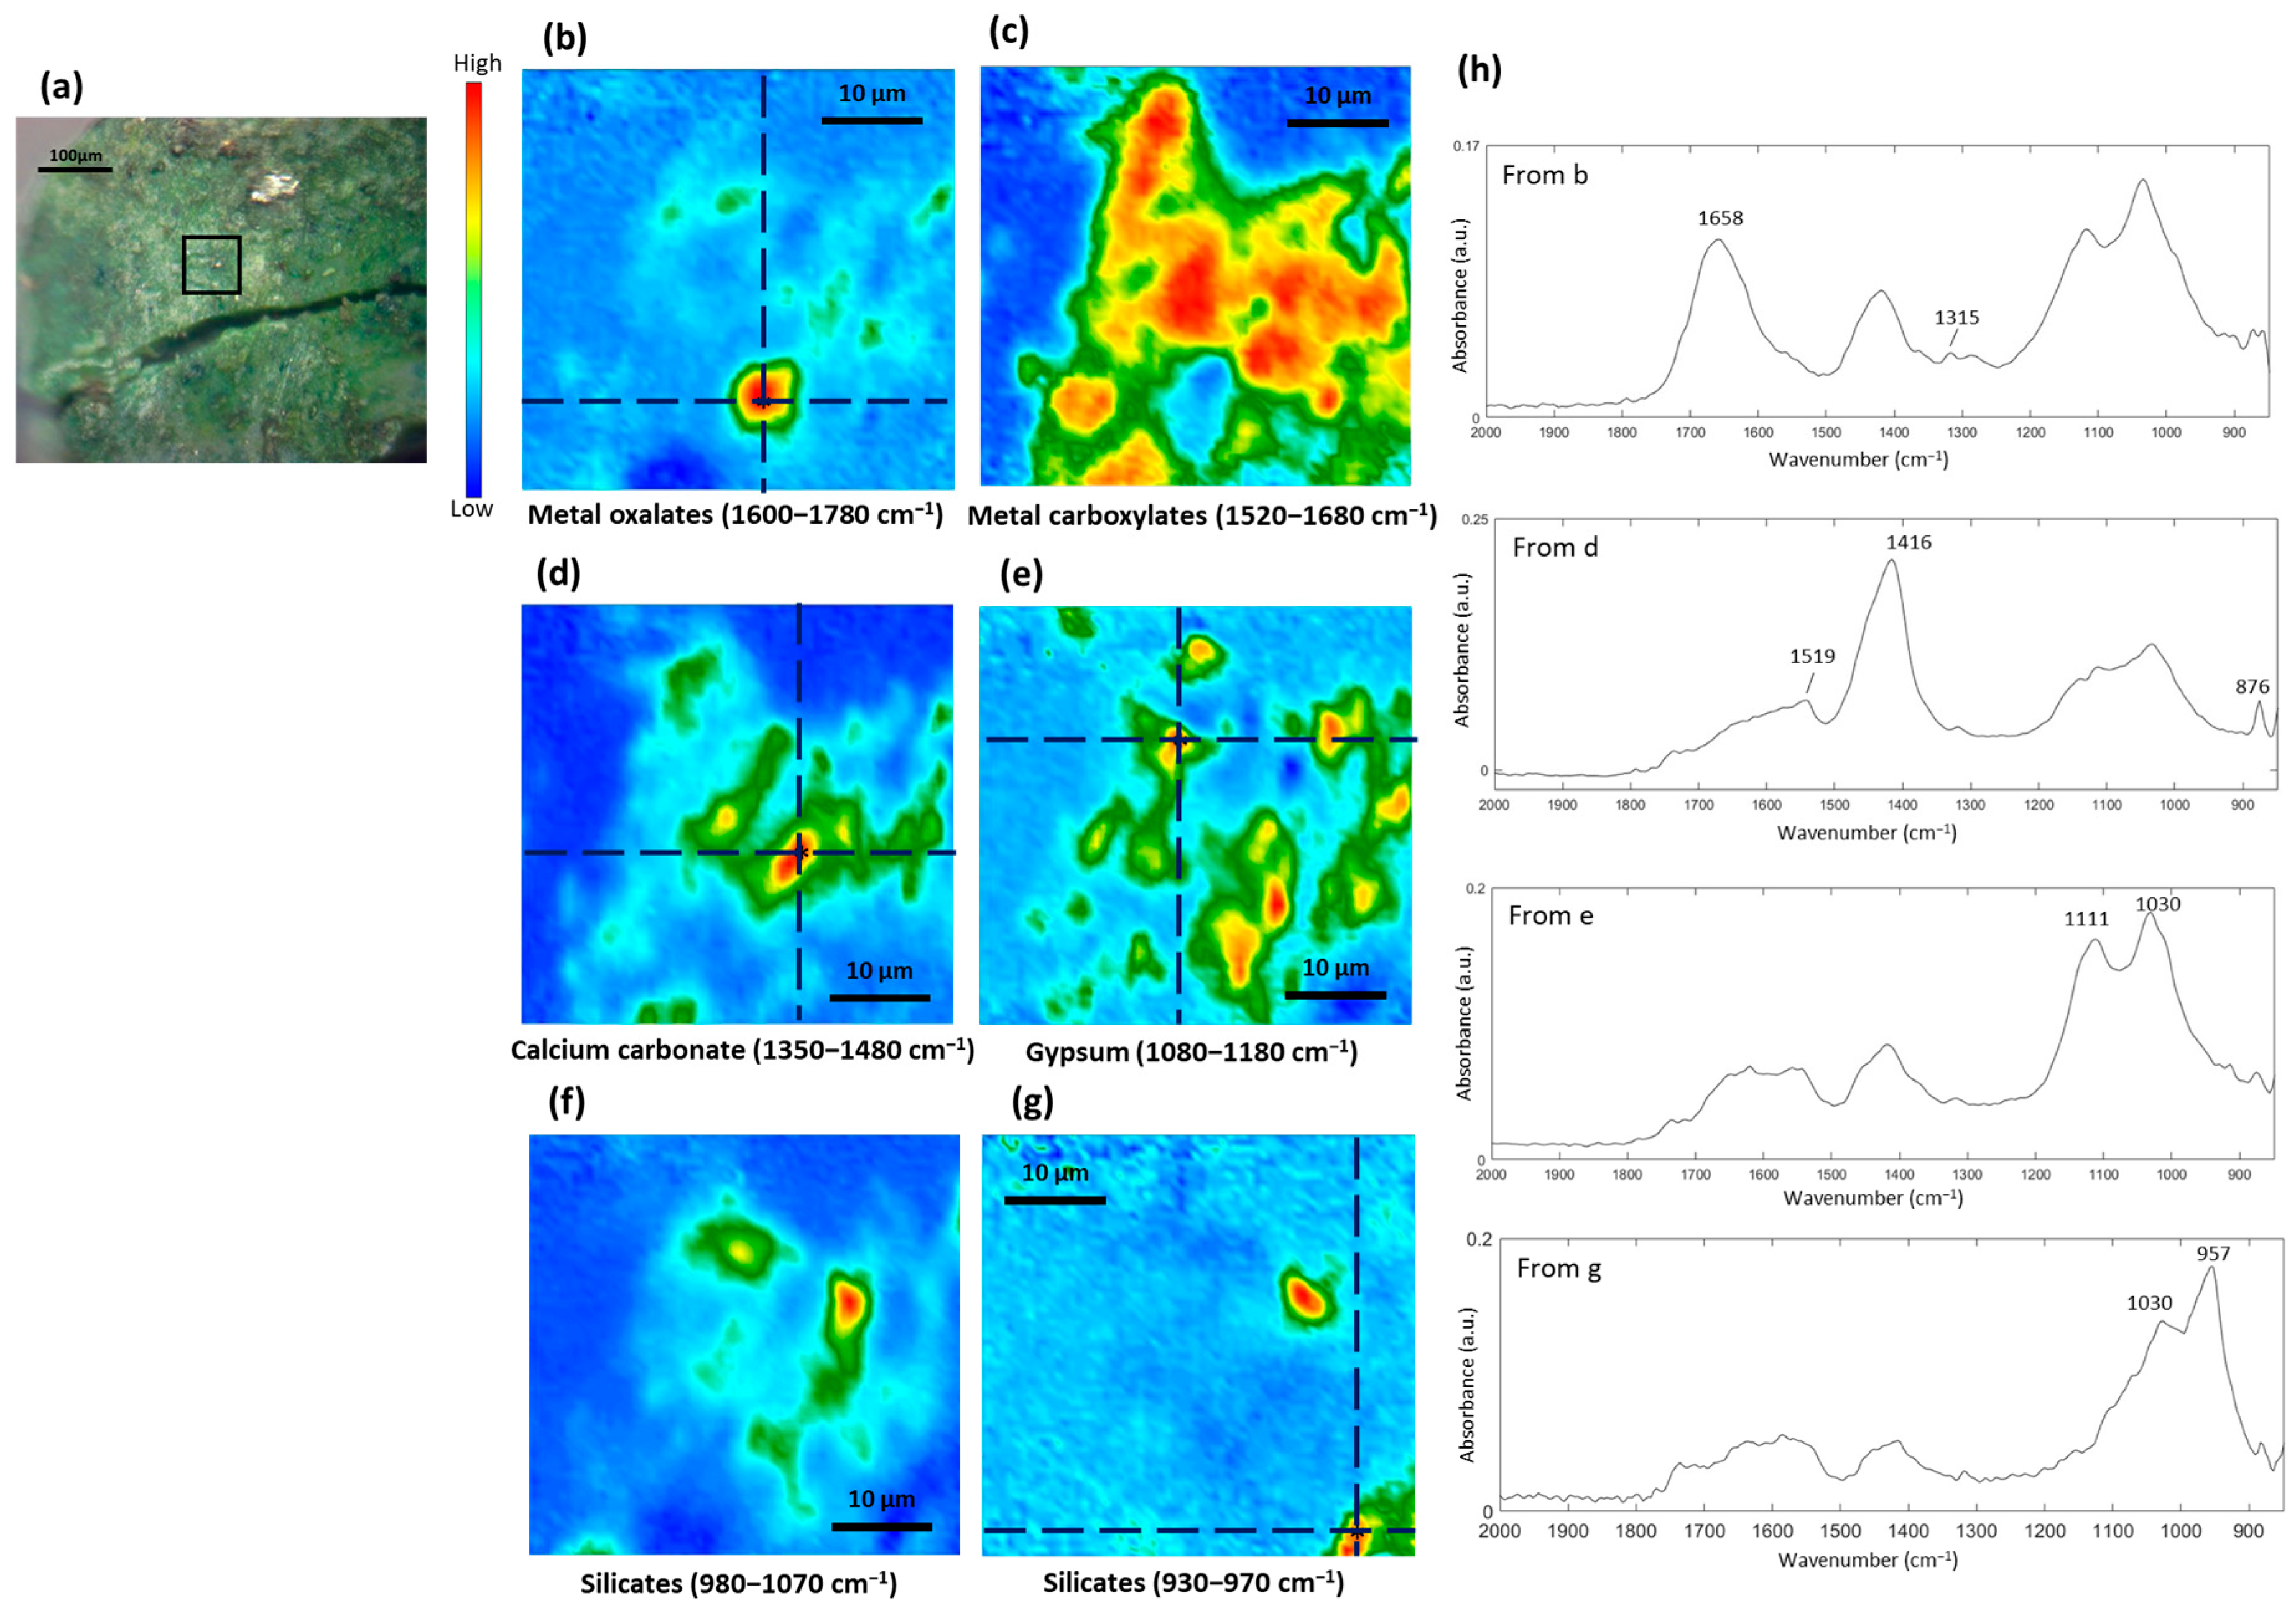
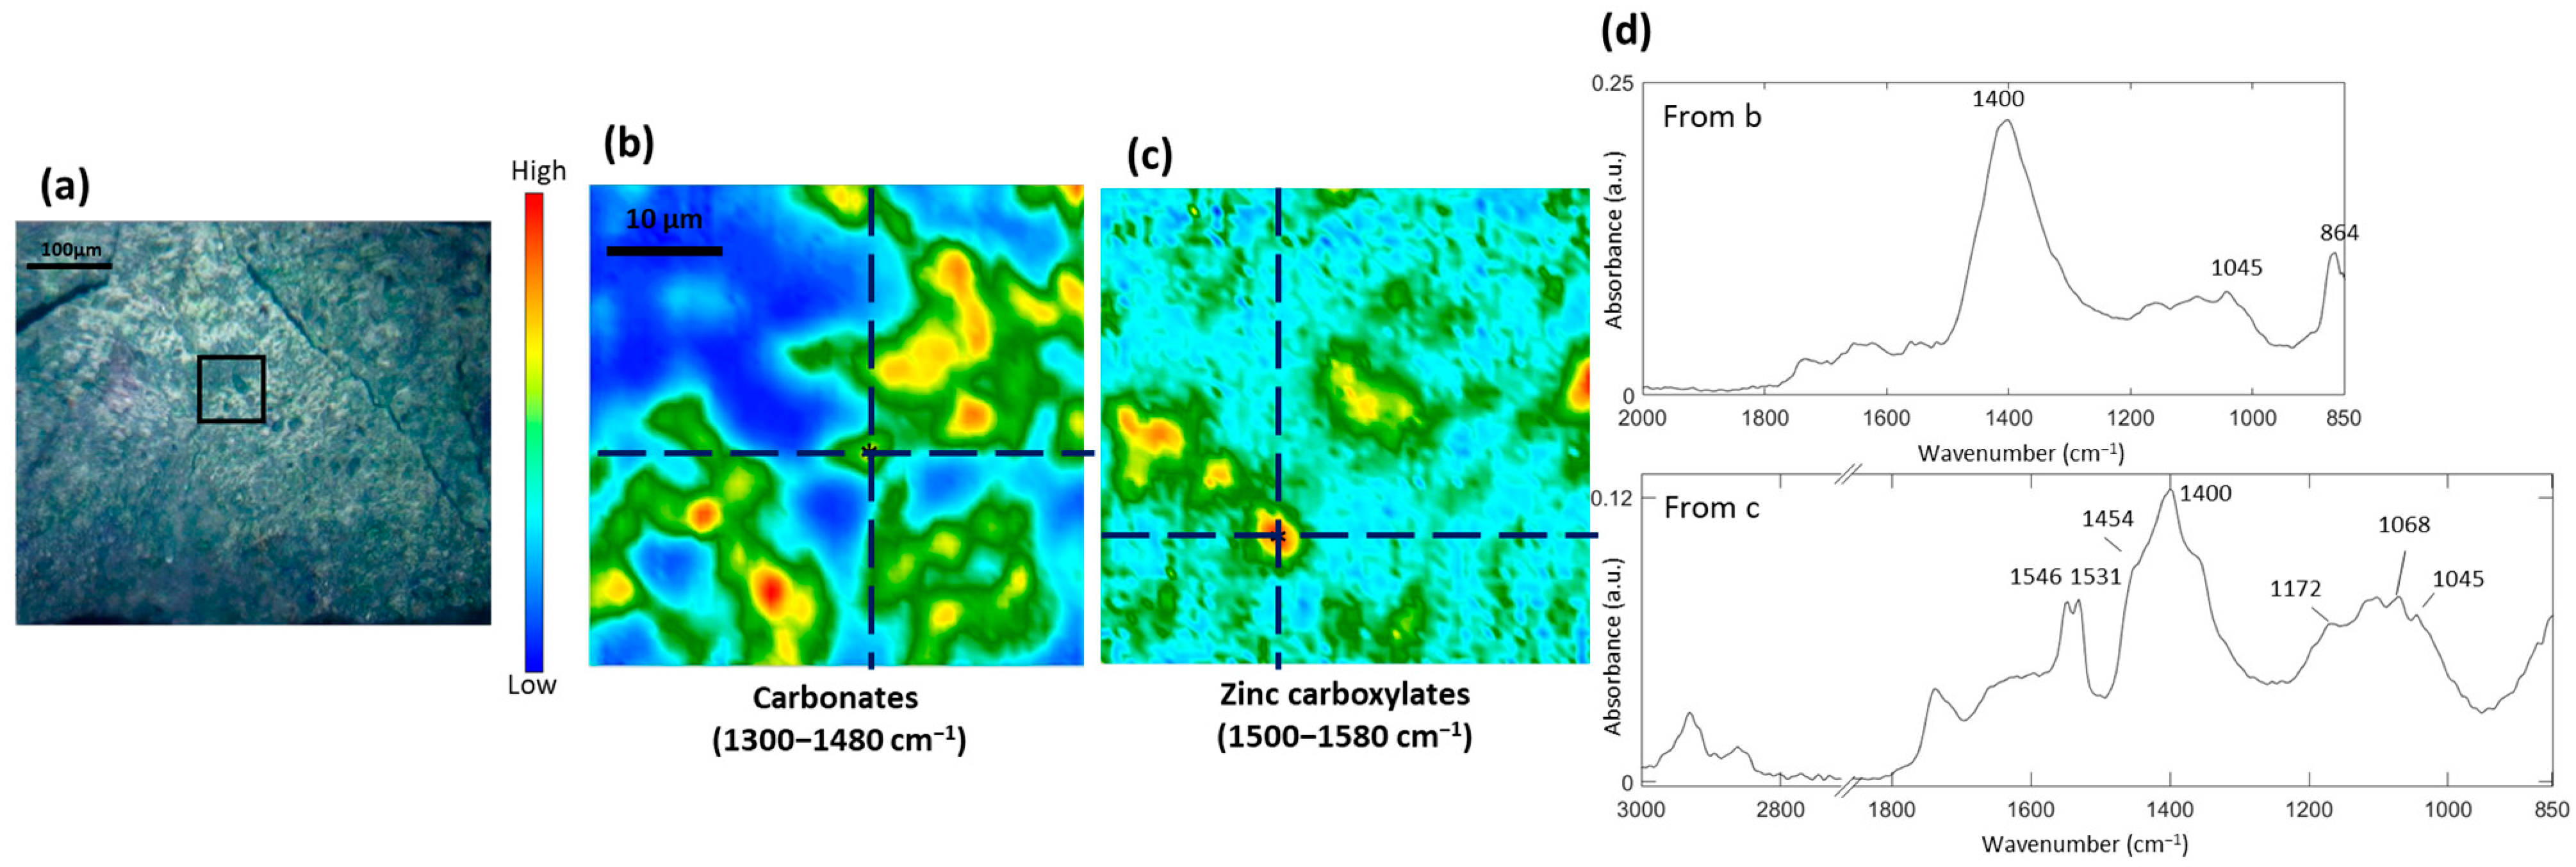
3.5. Formation of Metal Carboxylates and Oxalates in Oil Paints

Calcium carbonate is commonly found in all ochres [37]. Our results confirmed the presence of calcium carbonate in the ochre pigments through the identification of specific vibrational modes. The band of νas(CO3) was observed within the range of 1404–1415 cm−1, accompanied by a distinct peak at approximately 872 cm−1 (δ(CO3)). Calcium carbonate in oil paintings has been found to form degradation products such as calcium carboxylate [38,39] and calcium oxalate [40]. Identification of calcium carboxylate and calcium oxalate can be acquired by assigning to a doublet of νas(COO) at around 1540/1575 cm−1 [19] and a spectral band of νas(C=O) at 1650 cm−1 [41], respectively.
The formation of metal soaps in oil paintings occurs spontaneously due to the interaction between the fatty acid constituents of drying oils used as binders and the cations present in inorganic pigments [42,43]. These metal soaps play a significant role in the generation of protrusions and distortions within the paint layers [7]. Similarly, the calcium ions present in the calcium carbonate within the analyzed pigment samples potentially undergo a saponification reaction with the fatty acids present in an oil-based binder, resulting in the formation of calcium soaps or calcium carboxylates. Upon conducting a detailed examination, a notable observation was made: the absorbance of carbonate decreased while the absorbance of metal carboxylates increased (Figure 18a). However, the data revealed that these metal carboxylates exhibit the broad spectral band of νas(COO) at 1570 cm−1, indicating the presence of a non-crystalline structure [44]. Additionally, a shoulder at 1454 cm−1, attributed to δ(CH2) of the typical soap aliphatic chain, was observed in the spectra, which represents a characteristic spectral pattern of metal carboxylates.
In addition to the saponification of CaCO3 that gives rise to metal soaps, CaCO3 is also responsible for the formation of metal oxalates, as illustrated in Figure 18b. It was observed that the carbonate absorbance at 1415 cm−1 decreased as the oxalate absorbance at 1655 cm−1 increased. It is noteworthy that the intensity of the νas(COO) of calcium soaps at 1543 cm−1 decreased in the region where the metal oxalates were identified, as depicted in P4 and P5 in the ATR-FTIR image of metal oxalates (Figure 18b). Therefore, calcium is likely to be the metal ion present in these oxalates. Metal oxalates are predominantly found in association with organic binding media, indicating their probable formation as a result of the degradation of organic matter [45]. However, some studies have also reported that metal oxalates can originate from metal carboxylates [46].

4. Discussion

The results of ATR-FTIR spectroscopic imaging coupled with XRF made it possible to identify the chromatic palette used by Martiros Sarian. The pigments identified in Sarian’s works during this research are comparable to the ones employed by his influential artists, Henri Matisse [47,48,49] and Paul Gauguin [50,51,52], as well as other notable Impressionist and Post-Impressionist painters of the era [53,54]. As described in the results section, these pigments include ultramarine blue, cobalt blue, cobalt cerulean blue, viridian or chromium oxide, emerald green, cobalt green, celadonite green, cadmium yellow, chrome yellow, Venetian red, yellow ochre, red ochre, lead white, zinc white and calcium carbonate. Due to the high spatial resolution of ATR-FTIR spectroscopic imaging (~3–4 μm), the mixture of pigments within a single color can be successfully resolved, and each component can be identified. The green pigments like viridian and emerald green have been frequently mentioned in technical studies of Impressionist and Post-Impressionist artists, including Monet, Pissarro, and Munch [27,55,56,57]. However, it is worth noticing that in these five investigated paintings created by Sarian, no presence of Prussian blue was identified. Prussian blue (Fe7(CN)18, or Fe4[Fe(CN)6]3·nH2O), a vivid blue pigment that emerged during the early 18th century, has been recognized as the pioneering pigment among its modern counterparts [58]. The presence of this pigment has been identified in numerous Impressionist paintings. Notably, Matisse and Gauguin demonstrated an affinity for Prussian blue [47,50,51,59]. Further research should examine additional paintings by Sarian to ascertain whether Prussian blue was absent from his palette, despite its common usage among other Impressionist artists. Additionally, it is important to note that the XRF results (Table 1, Table 2, Table 3 and Table 4) demonstrate a significant presence of Pb in the pigments from Caravan. It appears that Sarian used both lead white and zinc white simultaneously in some paintings, but only Caravan showed a higher abundance of lead compared to zinc in this study. Caravan was painted in 1926. From 1926 to 1928, Matiro Sarian lived and worked in Paris, but most works from this period were destroyed in a fire aboard the boat on which he returned to the Soviet Union. Future work may also focus on investigation of paintings produced in this period to understand Sarian’s choice of white.
Ultramarine blue was identified in Morning in Stavrino (1909) and Arabian Dancer (1913), while cobalt-containing blue pigments, such as cerulean blue and/or cobalt blue, were identified in Caravan (1926), Yerevan Zangu River (1931), and Kirovakan (1948). It remains uncertain whether Sarian utilized different blue pigments during different periods of his artistic career. However, our findings indicate that Sarian incorporated ultramarine blue in paintings created during earlier years (1909 and 1913), whereas he employed cobalt-containing blue pigments in paintings from later years (1926, 1931, and 1948). Furthermore, chromium-containing green pigments were used in the paintings from 1909, 1913, 1926, and 1931, albeit with slight variations in their combinations. In the paintings from 1909 and 1913, Viridian (hydrated Cr2O3) was mixed with ultramarine blue, while in the painting from 1926, it was mixed with lead white. The painting from 1931 featured a dehydrated form of chromium-containing pigment, likely Cr2O3, which was mixed with cobalt green and celadonite. Regarding red pigments, variations were observed in the paintings dating from 1926, 1931, and 1948. The painting from 1926 featured Venetian red, while erbium red and red ochre were identified in the paintings from 1931 and 1948, respectively. It is worth noting that while ultramarine blue was identified using ATR-FTIR spectroscopic imaging, the XRF results did not quantify Na in the blue pigment and the green pigment from Morning in Stavrino, as can be seen in Table 1 and Table 2. This could be attributed to the fact that, although Na is among the lightest elements detectable using ED-XRF [60], its detection is sometimes hindered due to its very low energy fluorescence (<1 keV). The air between the sample and the detector may be too dense for the fluorescence to pass through. To better confirm the presence of Na, other techniques such as atomic absorption spectroscopy or inductively coupled plasma optical emission spectroscopy (ICP-OES) can be conducted in future work.
Degradation products, such as metal oxalates and metal carboxylates, were successfully identified in the pigments of this paper. The detected metal carboxylates exhibited either a crystalline nature, characterized by a sharp νas(COO) band, or a non-crystalline nature, indicated by a broad νas(COO) band in the ATR-FTIR spectra. Zinc carboxylates described in this study displayed a single peak (Figure 12) or a doublet (Figure 13) in the ATR-FTIR spectra, which may be attributed to the different symmetry of the components [21]. As demonstrated in Section 3.5, the formation of metal carboxylates and metal oxalates may be attributed to the presence of CaCO3, as revealed by the ATR-FTIR spectroscopic imaging results displayed in Figure 18. Previous research has primarily focused on investigating calcium oxalate due to its high occurrence in cultural heritage objects, including oil paintings and stone artifacts [61]. Although gypsum (CaSO4·2H2O) could potentially serve as a source of Ca ions for the formation of calcium oxalate, we did not observe a decrease in gypsum absorbance at around 1110 cm−1 with increasing oxalate absorbance at 1655 cm−1, as observed in the case of CaCO3 (Figure 18b). Ca ions derived from CaCO3 are more likely to form calcium oxalate, which is consistent with previous literature findings [62] that demonstrated CaCO3 can react with even very low concentrations of oxalic acid to produce calcium oxalate.
To support these findings regarding the paint surfaces and to achieve a more comprehensive understanding of the utilized color palette by Sarian, further investigation into the compositional analysis of the oil paintings is needed. This should encompass the identification of additional pigment samples extracted from Sarian’s artworks spanning the 1950s, 1960s, and 1970s, as well as stratigraphic imaging through cross-sectional analysis. Non-invasive portable XRF is recommended for the museum to conduct in situ semi-quantitative investigations of their paintings. Additionally, the application of additional scientific techniques like Raman spectroscopy and SEM-EDX is recommended to complement and strengthen the outcomes presented in the present study.

5. Conclusions

This study has provided valuable insights into the pigments used by Martiros Sarian in five of his paintings. By employing micro-ATR-FTIR spectroscopic imaging in conjunction with XRF, successful characterization of pigments was achieved. The analysis revealed the presence of several different pigments commonly used by Sarian, which were consistent with those used by Sarian’s influential artists, Henri Matisse and Paul Gauguin. Ultramarine blue was identified in earlier paintings, while cobalt-containing blue pigments, including cerulean blue and cobalt blue, were present in later works. Chromium-containing green pigments, including viridian and chromium oxide, were utilized with slight variations in combination. Different red pigments, namely Venetian red, and red ochre, were observed in three of the paintings.
This study also investigated the formation of degradation products in the pigments, such as metal carboxylates and metal oxalates. Calcium carbonate was found to play a significant role in the formation of these compounds. Zinc and lead carboxylates were identified as crystalline structure carboxylates by the presence of the sharp band of νas(COO). Other amorphous metal carboxylates exhibited broad νas(COO) bands in the ATR-FTIR spectra.
It was noted that Prussian blue, a commonly used blue pigment among Impressionist artists, was not identified in Sarian’s works examined in this study. Further research on additional paintings by Sarian would help determine if Prussian blue was absent from his palette.
Overall, this study enhances our understanding of Sarian’s artistic techniques and materials. The findings contribute to the preservation and conservation of his artworks, providing valuable information for art historians, conservators, and curators. Further research and analysis of additional paintings by Sarian would expand our knowledge of his artistic style and pigment choices.

Supplementary Materials

The following supporting information can be downloaded at: https://www.mdpi.com/article/10.3390/heritage6100354/s1, Figure S1: Five paintings housed at the Martiros Sarian House-Museum in Armenia; Figure S2: Pigment powder samples on the CaF2 plate; Table S1: XRF data of the blue and the light blue pigments; Table S2: XRF data of the green and the blue-green pigments; Table S3: XRF data of the yellow and the brown pigments; Table S4: XRF data of the red and the orange pigments.

Author Contributions

G.-L.L.: Conceptualization, formal analysis, investigation, writing—original draft; S.G.K.: Conceptualization, writing—review and editing, supervision. All authors have read and agreed to the published version of the manuscript.

Funding

This research received no external funding.

Data Availability Statement

Not applicable.

Acknowledgments

We are grateful to Sophie Sarian, at Martiros Sarian House-Museum, for facilitating our first investigation of the composition of pigments used by Martiros Sarian in some of his paintings created in 1909–1948. We thank Tatevik Amirkhanyan, from department of the National Art Gallery of Armenia, for extracting samples from the paintings. Our thanks to Patricia Carry, from Analytical Services at the Department of Chemical Engineering, Imperial College London, for her consultation on the XRF analyses. S.G.K. thanks the Science Committee of RA (№ 23RL-1D001).

Conflicts of Interest

The authors declare no conflict of interest.

References

  1. Azatyan, V. Disintegrating Progress: Bolshevism, National Modernism, and the Emergence of Contemporary Art Practices in Armenia. ARTMargins 2012, 1, 62–87. [Google Scholar] [CrossRef]
  2. Sahakyan, N. The Late Soviet Charm of Kantianism: Wilhelm Matevosyan’s Art History. Ph.D. Thesis, American University of Beirut, Beirut, Lebanon, 2021. [Google Scholar]
  3. The Editors of Encyclopaedia Britannica. Martiros Saryan. Available online: https://www.britannica.com/biography/Martiros-Saryan (accessed on 30 June 2023).
  4. Liu, G.-L.; Kazarian, S.G. Recent advances and applications to cultural heritage using ATR-FTIR spectroscopy and ATR-FTIR spectroscopic imaging. Analyst 2022, 147, 1777–1797. [Google Scholar] [CrossRef] [PubMed]
  5. Streli, C.; Wobrauschek, P.; Kregsamer, P. X-ray Fluorescence Spectroscopy, Applications. In Encyclopedia of Spectroscopy and Spectrometry, 3rd ed.; Lindon, J.C., Tranter, G.E., Koppenaal, D.W., Eds.; Academic Press: Oxford, UK, 2017; pp. 707–715. [Google Scholar]
  6. Spring, M.; Ricci, C.; Peggie, D.A.; Kazarian, S.G. ATR-FTIR imaging for the analysis of organic materials in paint cross sections: Case studies on paint samples from the National Gallery, London. Anal. Bioanal. Chem. 2008, 392, 37–45. [Google Scholar] [CrossRef] [PubMed]
  7. Gabrieli, F.; Rosi, F.; Vichi, A.; Cartechini, L.; Pensabene Buemi, L.; Kazarian, S.G.; Miliani, C. Revealing the Nature and Distribution of Metal Carboxylates in Jackson Pollock’s Alchemy (1947) by Micro-Attenuated Total Reflection FT-IR Spectroscopic Imaging. Anal. Chem. 2017, 89, 1283–1289. [Google Scholar] [CrossRef]
  8. Kaszowska, Z.; Malek, K.; Pańczyk, M.; Mikołajska, A. A joint application of ATR-FTIR and SEM imaging with high spatial resolution: Identification and distribution of painting materials and their degradation products in paint cross sections. Vib. Spectrosc. 2013, 65, 1–11. [Google Scholar] [CrossRef]
  9. Liu, G.-L.; Guerreiro, E.; Babington, C.; Kazarian, S.G. ATR-FTIR spectroscopic imaging of white crusts in cross sections from oil cartoons by Edward Poynter in the Heritage Collections at UK Parliament. J. Cult. Herit. 2023, 62, 251–267. [Google Scholar] [CrossRef]
  10. Pięta, E.; Proniewicz, E.; Szmelter-Fausek, B.; Olszewska-Świetlik, J.; Proniewicz, L.M. Pigment characterization of important golden age panel paintings of the 17th century. Spectrochim. Acta Part A Mol. Biomol. Spectrosc. 2015, 136, 594–600. [Google Scholar] [CrossRef]
  11. Van der Snickt, G.; Janssens, K.; Dik, J.; De Nolf, W.; Vanmeert, F.; Jaroszewicz, J.; Cotte, M.; Falkenberg, G.; Van der Loeff, L. Combined use of Synchrotron Radiation Based Micro-X-ray Fluorescence, Micro-X-ray Diffraction, Micro-X-ray Absorption Near-Edge, and Micro-Fourier Transform Infrared Spectroscopies for Revealing an Alternative Degradation Pathway of the Pigment Cadmium Yellow in a Painting by Van Gogh. Anal. Chem. 2012, 84, 10221–10228. [Google Scholar] [CrossRef]
  12. Plesters, J. Ultramarine blue, natural and artificial. In Artist’s Pigments: A Handbook of Their History and Characteristics; Roy, A., Ed.; Archetype Publications Ltd.: Washington, DC, USA; National Gallery of Art: New York, NY, USA, 1993; Volume 2. [Google Scholar]
  13. Silva, C.E.; Silva, L.P.; Edwards, H.G.M.; de Oliveira, L.F.C. Diffuse reflection FTIR spectral database of dyes and pigments. Anal. Bioanal. Chem. 2006, 386, 2183–2191. [Google Scholar] [CrossRef]
  14. Vahur, S.; Teearu, A.; Peets, P.; Joosu, L.; Leito, I. ATR-FT-IR spectral collection of conservation materials in the extended region of 4000-80 cm–1. Anal. Bioanal. Chem. 2016, 408, 3373–3379. [Google Scholar] [CrossRef]
  15. Salter, M.A.; Perry, C.T.; Smith, A.M. Calcium carbonate production by fish in temperate marine environments. Limnol. Oceanogr. 2019, 64, 2755–2770. [Google Scholar] [CrossRef]
  16. Haddad, A.; Rogge, C.E.; Martins, A.; Dijkema, D. “Foundations of a great metaphysical style”: Unraveling Giorgio de Chirico’s early palette. Herit. Sci. 2022, 10, 70. [Google Scholar] [CrossRef]
  17. Brooker, M.H.; Sunder, S.; Taylor, P.; Lopata, V.J. Infrared and Raman spectra and X-ray diffraction studies of solid lead(II) carbonates. Can. J. Chem. 1983, 61, 494–502. [Google Scholar] [CrossRef]
  18. Bishop, J.L.; Lane, M.D.; Dyar, M.D.; King, S.J.; Brown, A.J.; Swayze, G.A. What Lurks in the Martian Rocks and Soil? Investigations of Sulfates, Phosphates, and Perchlorates. Spectral properties of Ca-sulfates: Gypsum, bassanite, and anhydrite. Am. Mineral. 2014, 99, 2105–2115. [Google Scholar] [CrossRef]
  19. Vichi, A.; Eliazyan, G.; Kazarian, S.G. Study of the Degradation and Conservation of Historical Leather Book Covers with Macro Attenuated Total Reflection–Fourier Transform Infrared Spectroscopic Imaging. ACS Omega 2018, 3, 7150–7157. [Google Scholar] [CrossRef] [PubMed]
  20. Chua, L.; Banas, A.; Banas, K. Comparison of ATR-FTIR and O-PTIR Imaging Techniques for the Characterisation of Zinc-Type Degradation Products in a Paint Cross-Section. Molecules 2022, 27, 6301. [Google Scholar] [CrossRef]
  21. Helwig, K.; Poulin, J.; Corbeil, M.-C.; Moffatt, E.; Duguay, D. Conservation Issues in Several Twentieth-Century Canadian Oil Paintings: The Role of Zinc Carboxylate Reaction Products. In Issues in Contemporary Oil Paint; van den Berg, K.J., Burnstock, A., de Keijzer, M., Krueger, J., Learner, T., Tagle, D.A., Heydenreich, G., Eds.; Springer International Publishing: Cham, Switzerland, 2014; pp. 167–184. [Google Scholar]
  22. Zumbuehl, S.; Scherrer, N.C.; Berger, A.; Eggenberger, U. Early Viridian Pigment Composition CHARACTERIZATION OF A (HYDRATED) CHROMIUM OXIDE BORATE PIGMENT. Stud. Conserv. 2009, 54, 149–159. [Google Scholar] [CrossRef]
  23. Newman, R. Chromium Oxide Greens. In Artists’ Pigments, A Handbook of Their History and Characteristics; FitzHugh, E.W., Ed.; Archetype Publications Ltd.: Washington, DC, USA; National Gallery of Art: New York, NY, USA, 1997; Volume 3, pp. 273–286. [Google Scholar]
  24. Mineralogical Society of Great Britain and Ireland. The Infrared Spectra of Minerals; Mineralogical Society of Great Britain and Ireland: London, UK, 1974. [Google Scholar]
  25. Fiedler, I.; Bavard, M.A. Emerald Green and Scheele’s Green. In Artists’ Pigments, A Handbook of Their History and Characteristics; FitzHugh, E.W., Ed.; Archetype Publications Ltd.: Washington, DC, USA; National Gallery of Art: New York, NY, USA, 1997; Volume 3, pp. 219–271. [Google Scholar]
  26. Lipscher, J. ColourLex. Available online: https://colourlex.com/ (accessed on 10 July 2023).
  27. Vermeulen, M.; Miranda, A.S.O.; Tamburini, D.; Delgado, S.E.R.; Walton, M. A multi-analytical study of the palette of impressionist and post-impressionist Puerto Rican artists. Herit. Sci. 2022, 10, 44. [Google Scholar] [CrossRef]
  28. Klisińska-Kopacz, A.; Frączek, P.; Obarzanowski, M.; Czop, J. Non-Invasive Study of Pigment Palette Used by Olga Boznańska Investigated with Analytical Imaging, XRF, and FTIR Spectroscopy. Heritage 2023, 6, 1429–1443. [Google Scholar] [CrossRef]
  29. Moretto, L.M.; Orsega, E.F.; Mazzocchin, G.A. Spectroscopic methods for the analysis of celadonite and glauconite in Roman green wall paintings. J. Cult. Herit. 2011, 12, 384–391. [Google Scholar] [CrossRef]
  30. Lane, M.D. Mid-infrared emission spectroscopy of sulfate and sulfate-bearing minerals. Am. Mineral. 2007, 92, 1–18. [Google Scholar] [CrossRef]
  31. Monico, L.; Van der Snickt, G.; Janssens, K.; De Nolf, W.; Miliani, C.; Dik, J.; Radepont, M.; Hendriks, E.; Geldof, M.; Cotte, M. Degradation Process of Lead Chromate in Paintings by Vincent van Gogh Studied by Means of Synchrotron X-ray Spectromicroscopy and Related Methods. 2. Original Paint Layer Samples. Anal. Chem. 2011, 83, 1224–1231. [Google Scholar] [CrossRef] [PubMed]
  32. Vahur, S.; Teearu, A.; Leito, I. ATR-FT-IR spectroscopy in the region of 550–230 cm−1 for identification of inorganic pigments. Spectrochim. Acta Part A Mol. Biomol. Spectrosc. 2010, 75, 1061–1072. [Google Scholar] [CrossRef] [PubMed]
  33. Fiedler, I.; Bayard, M.A. Artist’s Pigments: A Handbook of Their History and Characteristics; Oxford University Press: New York, NY, USA, 1986; Volume 1. [Google Scholar]
  34. Topalova-Casadiego, B.; Plahter, U. Proceedings of the National Gallery Technical Bulletin 30th Anniversary Conference, London, UK, 16–18 September 2009; Archetype Publications Ltd.: Washington, DC, USA, 2011; pp. 244–252. [Google Scholar]
  35. Mass, J.L.; Opila, R.; Buckley, B.; Cotte, M.; Church, J.; Mehta, A. The photodegradation of cadmium yellow paints in Henri Matisse’s Le Bonheur de vivre (1905–1906). Appl. Phys. A 2013, 111, 59–68. [Google Scholar] [CrossRef]
  36. Helwig, K. Iron oxide pigments: Natural and synthetic. In Artists’ Pigments, A Handbook of Their History and Characteristics; Berrie, B.H., Ed.; Archetype Publications Ltd.: Washington, DC, USA; National Gallery of Art: New York, NY, USA, 2007; Volume 4. [Google Scholar]
  37. Elias, M.; Chartier, C.; Prévot, G.; Garay, H.; Vignaud, C. The colour of ochres explained by their composition. Mater. Sci. Eng. B 2006, 127, 70–80. [Google Scholar] [CrossRef]
  38. Higgs, S.; Burnstock, A. An Investigation into Metal Ions in Varnish Coatings. In Metal Soaps in Art: Conservation and Research; Casadio, F., Keune, K., Noble, P., Van Loon, A., Hendriks, E., Centeno, S.A., Osmond, G., Eds.; Springer International Publishing: Cham, Switzerland, 2019; pp. 123–140. [Google Scholar]
  39. Izzo, F.C.; Kratter, M.; Nevin, A.; Zendri, E. A Critical Review on the Analysis of Metal Soaps in Oil Paintings. ChemistryOpen 2021, 10, 904–921. [Google Scholar] [CrossRef]
  40. Rampazzi, L. Calcium oxalate films on works of art: A review. J. Cult. Herit. 2019, 40, 195–214. [Google Scholar] [CrossRef]
  41. Klaassen, L.; van der Snickt, G.; Legrand, S.; Higgitt, C.; Spring, M.; Vanmeert, F.; Rosi, F.; Brunetti, B.G.; Postec, M.; Janssens, K. Characterization and Removal of a Disfiguring Oxalate Crust on a Large Altarpiece by Hans Memling. In Metal Soaps in Art: Conservation and Research; Casadio, F., Keune, K., Noble, P., Van Loon, A., Hendriks, E., Centeno, S.A., Osmond, G., Eds.; Springer International Publishing: Cham, Switzerland, 2019; pp. 263–282. [Google Scholar]
  42. Peer Reviewed: Clarifying the Haze: Efflorescence on Works of Art. Anal. Chem. 1997, 69, 416A–422A. [CrossRef]
  43. Noble, P. A Brief History of Metal Soaps in Paintings from a Conservation Perspective. In Metal Soaps in Art: Conservation and Research; Casadio, F., Keune, K., Noble, P., Van Loon, A., Hendriks, E., Centeno, S.A., Osmond, G., Eds.; Springer International Publishing: Cham, Switzerland, 2019; pp. 1–22. [Google Scholar]
  44. Hermans, J.J.; Keune, K.; van Loon, A.; Corkery, R.W.; Iedema, P.D. Ionomer-like structure in mature oil paint binding media. RSC Adv. 2016, 6, 93363–93369. [Google Scholar] [CrossRef]
  45. Salvadó, N.; Butí, S.; Pradell, T.; Beltran, V.; Cinque, G.; Juanhuix, J. Identification and Distribution of Metal Soaps and Oxalates in Oil and Tempera Paint Layers in Fifteenth-Century Altarpieces Using Synchrotron Radiation Techniques. In Metal Soaps in Art: Conservation and Research; Casadio, F., Keune, K., Noble, P., Van Loon, A., Hendriks, E., Centeno, S.A., Osmond, G., Eds.; Springer International Publishing: Cham, Switzerland, 2019; pp. 195–210. [Google Scholar]
  46. Le Brun, H. Study of the Formation of Metal Oxalates and Soaps in Oil Paintings from the Southern Netherlands Using ToF-SIMS. Master’s Thesis, Université catholique de Louvain, Ottignies-Louvain-la-Neuve, Belgium, 2021. [Google Scholar]
  47. Haddad, A.; Pastorelli, G.; Ortiz Miranda, A.S.; Ludvigsen, L.; Centeno, S.A.; Duvernois, I.; Hoover, C.; Duffy, M.; Aviram, A.; Zycherman, L. Exploring the private universe of Henri Matisse in The Red Studio. Herit. Sci. 2022, 10, 168. [Google Scholar] [CrossRef]
  48. Pouyet, E.; Cotte, M.; Fayard, B.; Salomé, M.; Meirer, F.; Mehta, A.; Uffelman, E.S.; Hull, A.; Vanmeert, F.; Kieffer, J.; et al. 2D X-ray and FTIR micro-analysis of the degradation of cadmium yellow pigment in paintings of Henri Matisse. Appl. Phys. A 2015, 121, 967–980. [Google Scholar] [CrossRef]
  49. Mass, J.; Sedlmair, J.; Patterson, C.S.; Carson, D.; Buckley, B.; Hirschmugl, C. SR-FTIR imaging of the altered cadmium sulfide yellow paints in Henri Matisse’s Le Bonheur de vivre (1905–1906)—Examination of visually distinct degradation regions. Analyst 2013, 138, 6032–6043. [Google Scholar] [CrossRef] [PubMed]
  50. Defeyt, C.; Van Vyve, E.; Leen, F.; Vandepitte, F.; Gilbert, B.; Herens, E.; Strivay, D. Revealing Gauguin’s practice: Multi-analytical approach of the Portrait de Suzanne Bambridge. Herit. Sci. 2018, 6, 20. [Google Scholar] [CrossRef]
  51. Christensen, C. The Painting Materials and Technique of Paul Gauguin. Stud. Hist. Art 1993, 41, 62–103. [Google Scholar]
  52. Vermeulen, M.; Smith, K.; Eremin, K.; Rayner, G.; Walton, M. Application of Uniform Manifold Approximation and Projection (UMAP) in spectral imaging of artworks. Spectrochim. Acta Part A Mol. Biomol. Spectrosc. 2021, 252, 119547. [Google Scholar] [CrossRef]
  53. Januszczak, W. Techniques of the World’s Great Painters; Chartwell: Marlton, NJ, USA, 1980; pp. 132–135. [Google Scholar]
  54. Pollack, M. Odilon Redon, Paul Gauguin, and Primitivist Color. Art Bull. 2020, 102, 77–103. [Google Scholar] [CrossRef]
  55. Roy, A. Monet’s palette in the twentieth century: ‘Water-Lilies’ and ‘Irises’. Natl. Gallery Tech. Bull. 2007, 28, 58–68. [Google Scholar]
  56. Gutierrez, L.; Burnstock, A. Technical Examination of Works by Camille and Lucien Pissarro from the Courtauld Gallery. Art Matters 2013, 5, 13–16. [Google Scholar]
  57. Singer, B.; Aslaksby, T.E.; Topalova-Casadiego, B.; Tveit, E.S. Investigation of Materials Used by Edvard Munch. Stud. Conserv. 2010, 55, 274–292. [Google Scholar] [CrossRef]
  58. Berrie, B.H. Prussian Blue. In A Handbook of Their History and Characteristics; FitzHugh, E.W., Ed.; Archetype Publications Ltd.: Washington, DC, USA; National Gallery of Art: New York, NY, USA, 1997; Volume 3, pp. 191–217. [Google Scholar]
  59. Matisse, H.; Courthion, P. Chatting with Henri Matisse: The Lost 1941 Interview; Guilbaut, S., Ed.; Getty Trust Publications: Los Angeles, CA, USA, 2013; p. 368. [Google Scholar]
  60. Brouwer, P. Theory of XRF: Getting Acquainted with the Principles; PANalytical BV: Almelo, The Netherlands, 2010. [Google Scholar]
  61. Bordignon, F.; Postorino, P.; Dore, P.; Tabasso, M.L. The Formation of Metal Oxalates in the Painted Layers of a Medieval Polychrome on Stone, as Revealed by Micro-Raman Spectroscopy. Stud. Conserv. 2008, 53, 158–169. [Google Scholar] [CrossRef]
  62. Zoppi, A.; Lofrumento, C.; Mendes, N.F.C.; Castellucci, E.M. Metal oxalates in paints: A Raman investigation on the relative reactivities of different pigments to oxalic acid solutions. Anal. Bioanal. Chem. 2010, 397, 841–849. [Google Scholar] [CrossRef] [PubMed]
Figure 1. (a) Microscopic image of the blue pigment taken from Morning in Stavrino where the black square displays the area identified using ATR-FTIR imaging. ATR-FTIR chemical image of the blue pigments showing the distribution of (b) ultramarine blue and (c) calcium carbonate. (d) ATR-FTIR spectra extracted from pixels of the chemical images.
Heritage 06 00354 g001
Figure 2. (a) Microscopic image of the blue pigment sample taken from Arabian Dancer where the black square displays the area identified using ATR-FTIR imaging. ATR-FTIR chemical image of the blue pigment showing the distribution of (b) ultramarine blue and (c) calcium carbonate. (d) ATR-FTIR Spectra extracted from pixels of the chemical images.
Heritage 06 00354 g002
Figure 3. (a) Microscopic image of the blue pigment sample taken from Caravan where the black square displays the area identified using ATR-FTIR imaging. ATR-FTIR chemical image of the blue pigment showing the distribution of (b) lead white and (c) gypsum. (d) ATR-FTIR spectra extracted from pixels of the chemical images.
Heritage 06 00354 g003
Figure 4. (a) Microscopic image of the blue pigment taken from Yerevan Zangu River where the black square displays the area identified using ATR-FTIR imaging. ATR-FTIR chemical image of the blue pigments showing the distribution of (b) silicate, (c) metal carboxylates, (d) calcium carbonate, and (e) an unidentified compound of which images were produced by plotting integrated absorbance between 1080 and 1180 cm−1. (f) ATR-FTIR spectra extracted from pixels of the chemical images.
Heritage 06 00354 g004
Figure 5. (a) Microscopic image of the light blue pigment sample taken from Kirovakan where the black square displays the area identified using ATR-FTIR imaging. ATR-FTIR chemical image of the light blue pigment sample showing the distribution of (b) calcium carbonate, (c) lipids, (d) metal carboxylates and (e) zinc lactate. (f) ATR-FTIR spectra extracted from pixels of the chemical images.
Heritage 06 00354 g005
Figure 6. (a) Microscopic image of the green pigment taken from Morning in Stavrino where the black square displays the area identified using ATR-FTIR imaging. ATR-FTIR chemical image of the green pigments showing the distribution of (b) ultramarine blue (c) calcium carbonate and (d) Cr2O3·2H2O. (e) ATR-FTIR spectra extracted from pixels of the chemical images.
Heritage 06 00354 g006
Figure 7. (a) Microscopic image of the green pigments taken from Arabian Dancer where the black square displays the area identified using ATR-FTIR imaging. ATR-FTIR chemical image of the green pigments showing the distribution of (b) ultramarine blue, (c) calcium carbonate, (d) Cr2O3·2H2O, (e) sulfates, and (f) gypsum. (g) ATR-FTIR spectra extracted from pixels of the chemical images.
Heritage 06 00354 g007
Figure 8. (a) Microscopic image of the green pigment taken from Caravan where the black square displays the area identified using ATR-FTIR imaging. ATR-FTIR chemical image of the green pigments showing the distribution of (b) Cr2O3·2H2O, (c) lead white, (d) gypsum, and (e) zinc carboxylates. (f) ATR-FTIR spectra extracted from pixels of the chemical images.
Heritage 06 00354 g008
Figure 9. (a) Microscopic image of the green pigment taken from Yerevan Zangu River where the black square displays the area identified using ATR-FTIR imaging. ATR-FTIR chemical image of the green pigments showing the distribution of (b) metal oxalates, (c) metal carboxylates, (d) calcium carbonate, (e) gypsum, and silicates with absorbance at (f) 980–1070 cm−1 and (g) 930–970 cm−1. (h) ATR-FTIR spectra extracted from pixels of the chemical images.
Heritage 06 00354 g009
Figure 10. (a) Microscopic image of the blue-green pigment taken from Caravan where the black square displays the area identified using ATR-FTIR imaging. ATR-FTIR chemical image of the blue-green pigment showing the distribution of (b) carbonates and (c) zinc carboxylates. (d) ATR-FTIR spectra extracted from pixels of the chemical image are placed next to the chemical images.
Heritage 06 00354 g010
Figure 11. (a) Microscopic image of the dark green pigment taken from Yerevan Zangu River where the black square displays the area identified using ATR-FTIR imaging. (b) ATR-FTIR chemical image of the dark pigments showing the distribution of celadonite. (c) ATR-FTIR spectra extracted from pixels of the chemical images of celadonite.
Heritage 06 00354 g011
Figure 12. (a) Microscopic image of the yellow pigment sample taken from Morning in Stavrino where the black square displays the area identified using ATR-FTIR imaging. (b) ATR-FTIR chemical image of the yellow pigment sample showing the distribution of PbCrO4 and (c) ATR-FTIR spectrum extracted from a pixel of the chemical image.
Heritage 06 00354 g012
Figure 13. (a) Microscopic image of the brown pigment taken from Caravan where the black square displays the area identified using ATR-FTIR imaging. (b) ATR-FTIR chemical image of the brown pigments showing the distribution of lead white and calcium carbonate. (c) ATR-FTIR Spectra extracted from pixels of the chemical images.
Heritage 06 00354 g013
Figure 14. (a) Microscopic image of the yellow pigment sample taken from Caravan where the black square displays the area identified using ATR-FTIR imaging. (b) ATR-FTIR chemical image of the yellow pigment sample and (c) ATR-FTIR spectrum extracted from a pixel of the chemical image.
Heritage 06 00354 g014
Figure 15. (a) Microscopic image of the red pigments taken from Arabian Dancer where the black square displays the area identified using ATR-FTIR imaging. ATR-FTIR chemical image of the red pigments showing the distribution of (b) gypsum, (c) silicates, and (d) metal oxalates. (e) ATR-FTIR spectra extracted from pixels of the chemical images.
Heritage 06 00354 g015
Figure 16. (a) Microscopic image of the red pigments taken from Caravan where the black square displays the area identified using ATR-FTIR imaging. ATR-FTIR chemical image of the red pigments showing the distribution of (b) silicates, (c) gypsum, an unidentified compound of which images were produced by plotting integrated absorbance between (d) 890 and 950 cm−1 and (e) 1400 and 1500 cm−1, and (f) carbonates. (g) ATR-FTIR spectra extracted from pixels of the chemical images.
Heritage 06 00354 g016
Figure 17. (a) Microscopic image of the orange pigment sample taken from Kirovakan where the black square displays the area identified using ATR-FTIR imaging. ATR-FTIR chemical image of the orange pigments showing the distribution of (b) kaolin and (c) calcium carbonate. (d) ATR-FTIR spectra extracted from pixels of the chemical images.
Heritage 06 00354 g017
Figure 18. Micro-ATR−FTIR spectroscopic imaging of the top external surface of two pigment samples from Yerevan Zangu River: (a) blue pigment and (b) green pigment. The images of the integrated absorbance of calcium carbonate (1415/1408 cm−1), metal carboxylates (1570 cm−1), and metal oxalates (1655 cm−1) and the ATR-FTIR spectra extracted from pixels (P1 to P4 in (a) and P1 to P5 in (b)) clearly show that absorbance of the metal oxalates and metal carboxylates increases as absorbance of the calcium carbonate decreases.
Heritage 06 00354 g018
Table 1. Summary of XRF results of the blue pigments.
ColorPaintingDetected Chemical Elements with XRF
BlueMorning in Stavrino (1909)Major: Zn, Ca, S, Si, Cr, Al, Pb, Cl, Fe
Minor: Ti, Cu, As, P, Cd, Co
Trace: Mn, Ga, Ni, Sr
Arabian Dancer (1913)Major: Zn, Si, S, Al, Ca, Pb, Fe
Minor: K, Cl, P, Cd, Cr, As, Ga, Co, Cu
Trace: Ti, Mn, V
Caravan (1926)Major: Pb, Ca, Co, Al, Fe, Zn, S, Cd
Minor: Cl, Cr, V
Trace: Sr, Ga
Yerevan Zangu River (1931)Major: Zn, Sn, Co, Si, Ca, Fe, Cl, Cr
Minor: As
Light blueKirovakan (1948)Major: Zn, Ca, Sn, Co
Minor: Si, S, Cl, Fe,
Trace: Cu, As, Cr, P
Table 2. Summary of XRF results of the green pigments.
ColorPaintingDetected Chemical Elements with XRF
GreenMorning in Stavrino (1909)Major: Ca, Cr, Si, S, Al, Fe, Zn, Cl, P
Minor: Pb, Co, Ti, Cu
Trace: As, Mn
Arabian Dancer (1913)Major: Zn, Na, S, Si, Ca, Al, Cr, Fe, Pb, Ti
Minor: P, Cl, Co, Cd
Trace: Sn, As, Sr
Yerevan Zangu River (1931)Major: Zn, Pb, Si, Ca, Al, Fe, S, Cl, Cr, Co
Minor: As, Er, V, Ga
Trace: Mn
Caravan (1926)Major: Pb, Ca, Cr, Mg, Fe, Zn
Minor: Cd, Cl, Ti
Trace: Sr, Mn, Zr
Blue-greenCaravan (1926)Major: Pb, As, Cu, Ca, Co
Minor: Zn, Fe, Cl, Sn
Trace: Sr, Cr, Ti, Zr
Dark greenYerevan Zangu River (1931)N/A
Table 3. Summary of XRF results of the yellow and brown pigments.
ColorPaintingDetected Chemical Elements with XRF
YellowMorning in Stavrino (1909)Major: Si, Ca, Zn, Cl, Pb, S, Fe, Cr, Sn, Ti
Minor: As
Caravan (1926)Major: Pb, Ca, Cd, Ti, Cl
Minor: Fe, Zn, V, Cr
Trace: Sr, Zr
BrownCaravan (1926)Major: Pb, Ca, Cd, Zn
Minor: Al, Fe, Cr, Co
Trace: Sr, Ti, Cu, Zr, Rb
Table 4. Summary of XRF results of the red and orange pigments.
ColorPaintingDetected Chemical Elements with XRF
RedArabian Dancer (1913)Major: Zn, Na, S, Ca, Al, Si, Cd, Fe, P
Minor: Cl, K, As, Cr, Ti
Trace: Co, Mn
Caravan (1926)Major: Pb, Cl, Co, Ca, P, Fe, Zn, Er
Minor: Cr
Trace: Ga
OrangeKirovakan (1948)Major: Zn, Si, Ca, Fe, Cl, S
Minor: Ti, Cr, V, As, Co
Disclaimer/Publisher’s Note: The statements, opinions and data contained in all publications are solely those of the individual author(s) and contributor(s) and not of MDPI and/or the editor(s). MDPI and/or the editor(s) disclaim responsibility for any injury to people or property resulting from any ideas, methods, instructions or products referred to in the content.

