Article

Characterization of Chalcolithic Ceramics from the Lisbon Region, Portugal: An Archaeometric Study

by
Rute Correia Chaves
1,2,*,
João Pedro Veiga
1,3 and
António Monge Soares
4
1
Departamento de Conservação e Restauro, Faculdade de Ciências e Tecnologia, Universidade NOVA de Lisboa, Campus de Caparica, 2829-516 Caparica, Portugal
2
Unidade de Investigação VICARTE—Vidro e Cerâmica para as Artes, Faculdade de Ciências e Tecnologia, Universidade NOVA de Lisboa, Campus de Caparica, 2829-516 Caparica, Portugal
3
CENIMAT/i3N, Centro de Investigação de Materiais, Faculdade de Ciências e Tecnologia, Universidade NOVA de Lisboa, Campus de Caparica, 2829-516 Caparica, Portugal
4
C2TN—Centro de Ciências e Tecnologias Nucleares, Instituto Superior Técnico, Universidade de Lisboa, Estrada Nacional 10 (km 139.7), 2695-066 Bobadela LRS, Portugal
*
Author to whom correspondence should be addressed.
Heritage 2022, 5(3), 2422-2443; https://doi.org/10.3390/heritage5030126
Submission received: 5 August 2022 / Revised: 22 August 2022 / Accepted: 25 August 2022 / Published: 29 August 2022

Abstract

:
The Chalcolithic period in the Lisbon region, Portugal, is usually divided into three phases chronologically: the Early Chalcolithic, characterized by cylindrical corrugated cups, Full Chalcolithic by so-called acacia-leaf decoration, and Late Chalcolithic by Bell Beaker pottery. The aim of this research is to determine if Chalcolithic ceramic raw materials and production techniques have remained the same over time and whether the pottery is locally produced. Regarding the Lisbon region, 149 ceramic samples from four Chalcolithic settlements (Vila Nova de São Pedro, Penedo do Lexim, Espargueira and Baútas) were evaluated concerning textural, chemical and mineralogical compositions. Textural analysis was performed using optical microscopy, chemical characterization was achieved using micro-energy dispersive X-ray fluorescence spectrometry and mineralogical characterization was undertaken using X-ray powder diffraction and petrographic microscopy as main techniques. Results suggest that production techniques may have remained similar throughout all the Chalcolithic period, with firing temperatures between 700 and 800 °C. Multivariate analysis of results from chemical and mineralogical analyses suggests that multiple sources of raw materials must have been used in the manufacture of the pottery collected at the four Chalcolithic settlements.

1. Introduction

The archaeometric study of Portuguese Chalcolithic ceramics, i.e., ceramics of the third millennium BC, is still in its infancy [1,2]. Recently, archaeological research concerning Chalcolithic ceramics has grown, particularly regarding typologies, decorations, vessel sizes and chronologies [3,4,5,6]. However, very little is still known about its manufacture, provenance and trade. The Chalcolithic period in the Lisbon region is mainly characterized by an economic intensification and specialization in the production field with the introduction of new technologies, namely metallurgy, of which the building up of powerful defenses on habitat sites is thought to have been a repercussion [7].
The Chalcolithic period in this region is usually divided into three periods, each one characterized, among other items, by the ceramic decoration typology (Figure 1): the Early Chalcolithic with pottery consisting of cylindrical cups with a polished corrugated outer surface; the Full Chalcolithic essentially characterized by so-called acacia-leaf decoration in large containers; and the Late Chalcolithic with pottery with so-called Beaker decoration (Bell Beaker vessels). The formalization of this division arose between the years 1970 and 1980, when archaeologists came to know a significant number of Chalcolithic contexts, acquiring a better knowledge of their materials [8].
Nevertheless, the study of archaeological pieces from the Lisbon region is especially intricate, since there are few archaeological sites with modern stratigraphic archaeological studies, and even fewer with chemical and mineralogical ceramic characterization. On the other hand, there are also rare archaeological sites where all the three decorative typologies mentioned above can be found, so the interpretation of the evolution/continuity of these sites is sometimes questioned [9,10]. Thus, it can be argued whether the three classical typologies of the Chalcolithic region of Lisbon are in fact following one another, or if they are partially contemporary. It is also relevant to note that, at times, typologies of the Late Neolithic (characterized by carinated bowls and vessels with jagged rims) and of the Early Chalcolithic can be found together in the same archaeological context [11].
The aim of this research is to determine if raw materials and production techniques have remained the same over time regarding ceramic production in Chalcolithic settlements in the Lisbon area, and if ceramics can be considered a local production. For those purposes, pottery from four Chalcolithic settlements were studied: Vila Nova de São Pedro, Penedo do Lexim, Espargueira and Baútas (Figure 2). Through a multi-analytical approach, 149 ceramic samples were characterized texturally, chemically and mineralogically, and not just the three typologies mentioned above but also ceramics with no decoration (plain pottery) or with other kind of decoration.
The first archaeological site considered was the fortified settlement of Vila Nova de São Pedro (VNSP), in the Azambuja municipality, about 55 km (NE) from Lisbon. The hill (100 m of altitude) where it is located is surrounded, in part, by the Almoster rivulet, with the archaeological site and surrounding area located on a Miocene and Pliocene limestone plateau, with small Quaternary areas nearby. Geologically, this broad area corresponds to limestones, sandstones and clays with Hipparion gracile from Azambujeira (M5) [12]. In turn, this area is surrounded by limestones, sandstones and clays with vertebrates from Quinta do Marmelal and layers with Crassostrea crassissima from Calhariz and Alcanhão (M4). Its privileged location, not only in terms of defense but also resources, has contributed to the success of this community with a certain degree of economic and social complexity that was established there for almost a millennium. In this way, many remains, not only pottery but also metallic and lithic artefacts, make VNSP one of the best known and most important sites of this cultural period, not only in Portugal but also in Europe.
The second archaeological site chosen for this study was the Chalcolithic settlement of Penedo do Lexim (PL), in the municipality of Mafra. Penedo do Lexim is located on the right bank of the Cheleiros stream, at an altitude of 223 m and about 30 km (N) from Lisbon. The specific area where this archaeological site is located is the residue of an old monolithic basalt rock chimney (belonging to the Lisbon Vulcanic Complex) where alkaline basalts, trachybasalts, trachytes and rhyolites can be identified [13]. This zone contrasts, however, with the surrounding substrate constituted by sedimentary rocks, including limestones and marls from the “Belasian” (C2AC), as well as sandstones and clays (C1AS—“Superior sandstone”), both of the Mesozoic period [14]. PL is chosen as an example of a small-habitat site with less structural complexity than the previous one (VNSP) but, on the other hand, with the added value of a well-defined and recorded stratigraphy, since the site has been extensively investigated, recorded and studied from an archaeological point of view [6].
Finally, Espargueira (EPR) and Baútas (BAT), in the Amadora region, are located on small hills with altitudes of about 200 m, only 600 m apart, with the valley of the Carenque rivulet separating them. They are located about 13 km from Lisbon. The geological substrate of the zone consists of a sequence of limestone rocks and marls belonging to the Albian (C2AC), superimposed by limestones from the Cenomanian (C3C), and superimposed, in turn, by volcanic–sedimentary rocks of the Lisbon Vulcanic Complex (ꞵ1). These two archaeological sites have less expression than the previous two (VNSP and PL), but they have the advantage of being very close to each other, allowing multiple levels of comparison within the Lisbon region.

2. Materials and Methods

A representative sampling of the recovered archaeological ceramics was selected from the four settlements, taking into account the above-mentioned decoration typologies, also adding non-decorated ceramics (which are, as is usual, the most abundant ceramic species in all settlements), as well as ceramics with other decorations, not specific to one of the mentioned typologies.
Thus, a set of 149 sherds, 98 of VNSP (Early, Full and Late Chalcolithic), 29 of PL (Early and Full Chalcolithic) and 22 of EPR and BAT (Late Neolithic/Early Chalcolithic and Full Chalcolithic, respectively), were chosen for analysis. Each potsherd was identified by an inventory number and sampled to carry out the different analyses, namely those concerned with textural, mineralogical and chemical characterizations. The sherds had weights between 5 and 229 g and thickness between 0.3 and 1.5 cm. A macroscopic observation allowed the identification of some of the potsherd characteristics, namely surface treatments, decoration, paste color, and a general perception of the vessel type to which it belonged. Detailed pictures of all fragments were taken to document the potsherds before sampling. The selected potsherds comprise predominantly body sherds, but presenting part of the rim, and the polished cross-sections and thin sections were prepared by cutting the sherd parallel to its rim.

2.1. Textural Analysis

A stereomicroscope Zeiss SteREO Discovery, V20, fitted with a 7.5× to 150× objective lens was used to analyze a cross section of each sample. This analysis was performed using photomicrographs of the polished cross-sections with a 20× magnification using a digital camera AxioCam ERc5s coupled to the stereomicroscope. Using the image-editing program Adobe Photoshop®, it was possible to estimate the amount (percentage) of non-plastic inclusions in the ceramic matrix. Only non-plastic inclusions whose sizes were bigger than 0.01 mm were considered. The areas corresponding to inclusions were selected and, as each area corresponds to a certain number of pixels (the total number of pixels of the photomicrograph corresponds to 100%), it was possible to estimate the proportion of selected areas, i.e., the percentage of inclusions.

2.2. Chemical Analysis

The chemical characterization of the ceramic pastes was performed using micro-energy dispersive X-ray fluorescence spectrometry (μ-EDXRF) on compressed powder pellets, which were prepared using 300 mg of a total of 1 g of powder also milled for the XRD analysis. To do so, a sample of 1 g was collected from each potsherd and reduced to a fine powder using an electric mill consisting of a mortar and a pestle, both made of agate. The powder was ground to a granulometry of less than 63 µm, taking into account that the diameter of the incidence beam of the spectrometer is 70 µm.
To avoid contamination, the top layer of each sample was removed before milling using a Dremel 952 aluminum oxide grinding stone. During the entire milling process and manufacturing pellets, we took special care to avoid contamination between samples, so all materials and equipment were properly washed and decontaminated after each operation. The analysis was made using a spectrometer ArtTAX 800, Bruker (Billerica, MA, USA) [15] equipped with a 30 W Mo X-ray tube, focusing polycapillary lens (analysis area with diameter ≤ 100 μm) and an electro-thermally cooled silicon drift detector (FWHM of 160 eV at 5.9 keV). Each pellet was analyzed in three spots using a tube voltage of 40 kV, a current intensity of 600 μA and 300 s of live time. All analyses were performed in a helium atmosphere, to improve the detection of lighter elements (Si and Al). Quantifications were made with the WinAxil (version 4.5) software (https://winaxil.software.informer.com/ (accessed on 4 August 2022)) involving experimental calibration factors calculated from the analysis of reference materials, namely the certified clay standard NIST Brick Clay SRM 679 (National Bureau of Standards Certificate of Analysis (1987), Office of Standards Reference Materials), and normalization with the compound Na2MgO2CO3. The error associated with the analysis was calculated for each element. For the elements of interest, the uncertainty is lower than 5% for Al and Si, Ca, Fe, Zn, Th, lower than 15% for K and Ti, between 20 and 30% for Cr and the other trace elements, and higher than 50% just for Co.

2.3. Mineralogical Analysis

Mineralogical analysis, including plastic and non-plastic components, was made using X-ray diffraction (XRD), which allowed the identification of crystalline phases, namely clay minerals associated with the plastic matrix or other species that were possibly formed during the firing process or during the burial period. Diffractograms were obtained using a Rigaku Dmax III-c3 kW (Rigaku Corporation, Tokyo, Japan), using CuKα radiation under set conditions of 40 kV and 30 mA, in the 2 θ range of 10° to 65°, with a step of 0.08° and an acquisition time of 1 s per step, in continuous scan mode (detection limit under ~4%, in volume [16]. The identification of crystalline phases was carried out using EVA Software version 11.0.0.3 (Bruker AXS GmbH, Karlsruhe, Germany).
It is important to note that, with the XRD, we have a bulk vision of the minerals present in the sample, since the analysis is made after grinding the ceramic sample, with the plastic and non-plastic components mixed together. To understand which minerals are part of the clay and which could have been added as temper, it is essential to use petrographic microscopy. Raman microspectroscopy was also used to identify some of the dark opaque minerals (unseen by petrography) but also other minerals that appeared sporadically, with very specific colors, such as gold or blue.
Petrographic microscopy allows the obtaining of information about the mineralogical nature of inclusions through some of their characteristics, namely interference color and pleochroism. It also helps in the textural characterization, once it allows a better knowledge of the shape and eventual orientation of non-plastic inclusions. This analysis was performed using thin sections. A petrographic microscope OLYMPUS BX51, fitted with a 4× objective and coupled with a digital camera OLYMPUS DP20, was used. Minerals existing in the ceramic paste may be identified through their characteristics, including color and pleochroism, among others [17,18].
Raman microspectroscopy was performed using a Horiba Jobin Yvon Raman spectrometer, model Lab Raman 300. For the acquisition of spectra, a HeNe laser was used with an excitation line 632.8 nm and an output of 17 mW. The laser was focused with an Olympus objective (50× or 100×). The laser power at the sample is changed with neutral density filters. All analyses were performed with a filter allowing passage of 10% of the laser power. Calibration was made with silicon. The Raman spectra and respective bands/vibrations were analyzed by comparison with the Database of Raman spectra, X-ray diffraction and chemistry data for minerals—RRUFF [19].

2.4. Statistical Analysis

To obtain a better interpretation of the results, a statistical analysis was performed using R software (version 3.6.1) (Vienna, Austria) [20]. Thus, a multivariate analysis was carried out, with the starting data transformed to simplify and highlight the relationships between the variables through the analysis of a smaller number of characteristics or factors. Two tools were used: hierarchical ascending classification (HAC) and principal component analysis (PCA).
The HAC is a method of grouping the samples, which results in graphs with a tree structure (dendrograms). The configuration of the dendrogram is automatically defined according to the similarity coefficients between the groups, allowing the determination of which samples have the greatest relationship between each other, i.e., the ones that correspond to the smallest Euclidean distances between them [21], using the Ward method [22].
PCA consists of a data-analysis method that allows the transformation of a set of original uncorrelated (independent) variables into a new set of intercorrelated variables, the PCs, which are nothing more than linear combinations of the original variables. This analysis was performed using the 0.5% ellipse method, from the 14 variables (oxides) that were quantified. The main advantage of this method is the simplification of the data structure, through the transformation of correlated variables into two or more principal components, which will represent the original information.

3. Results

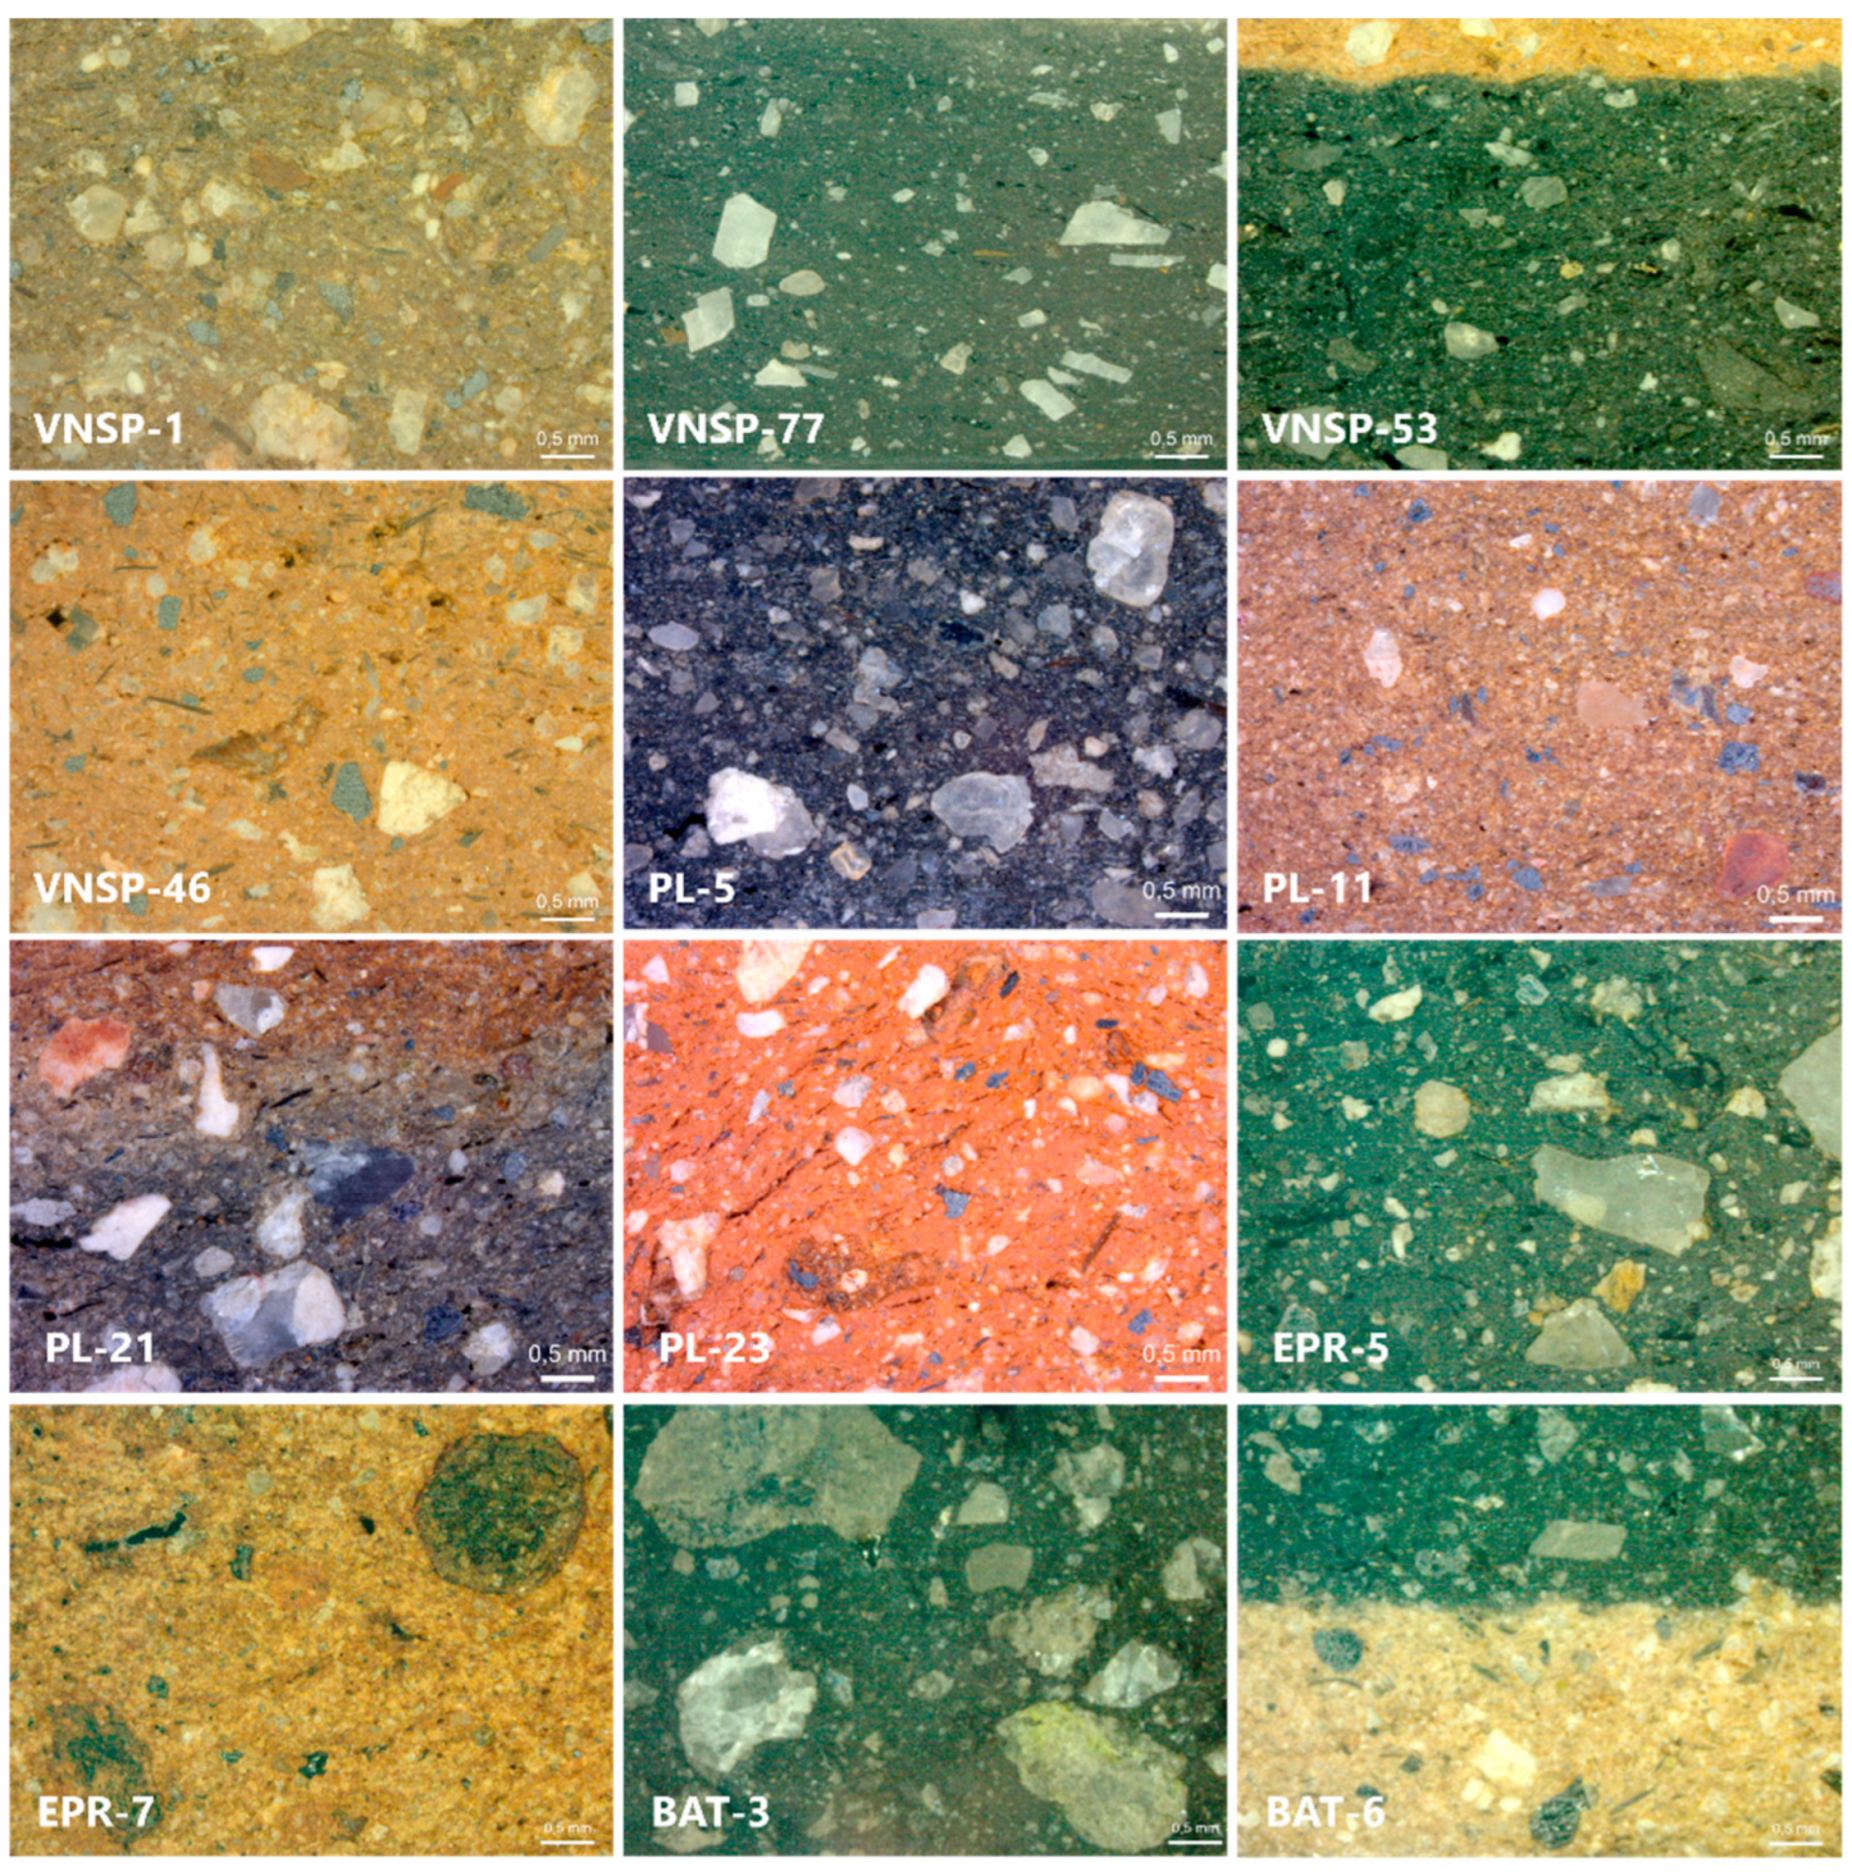
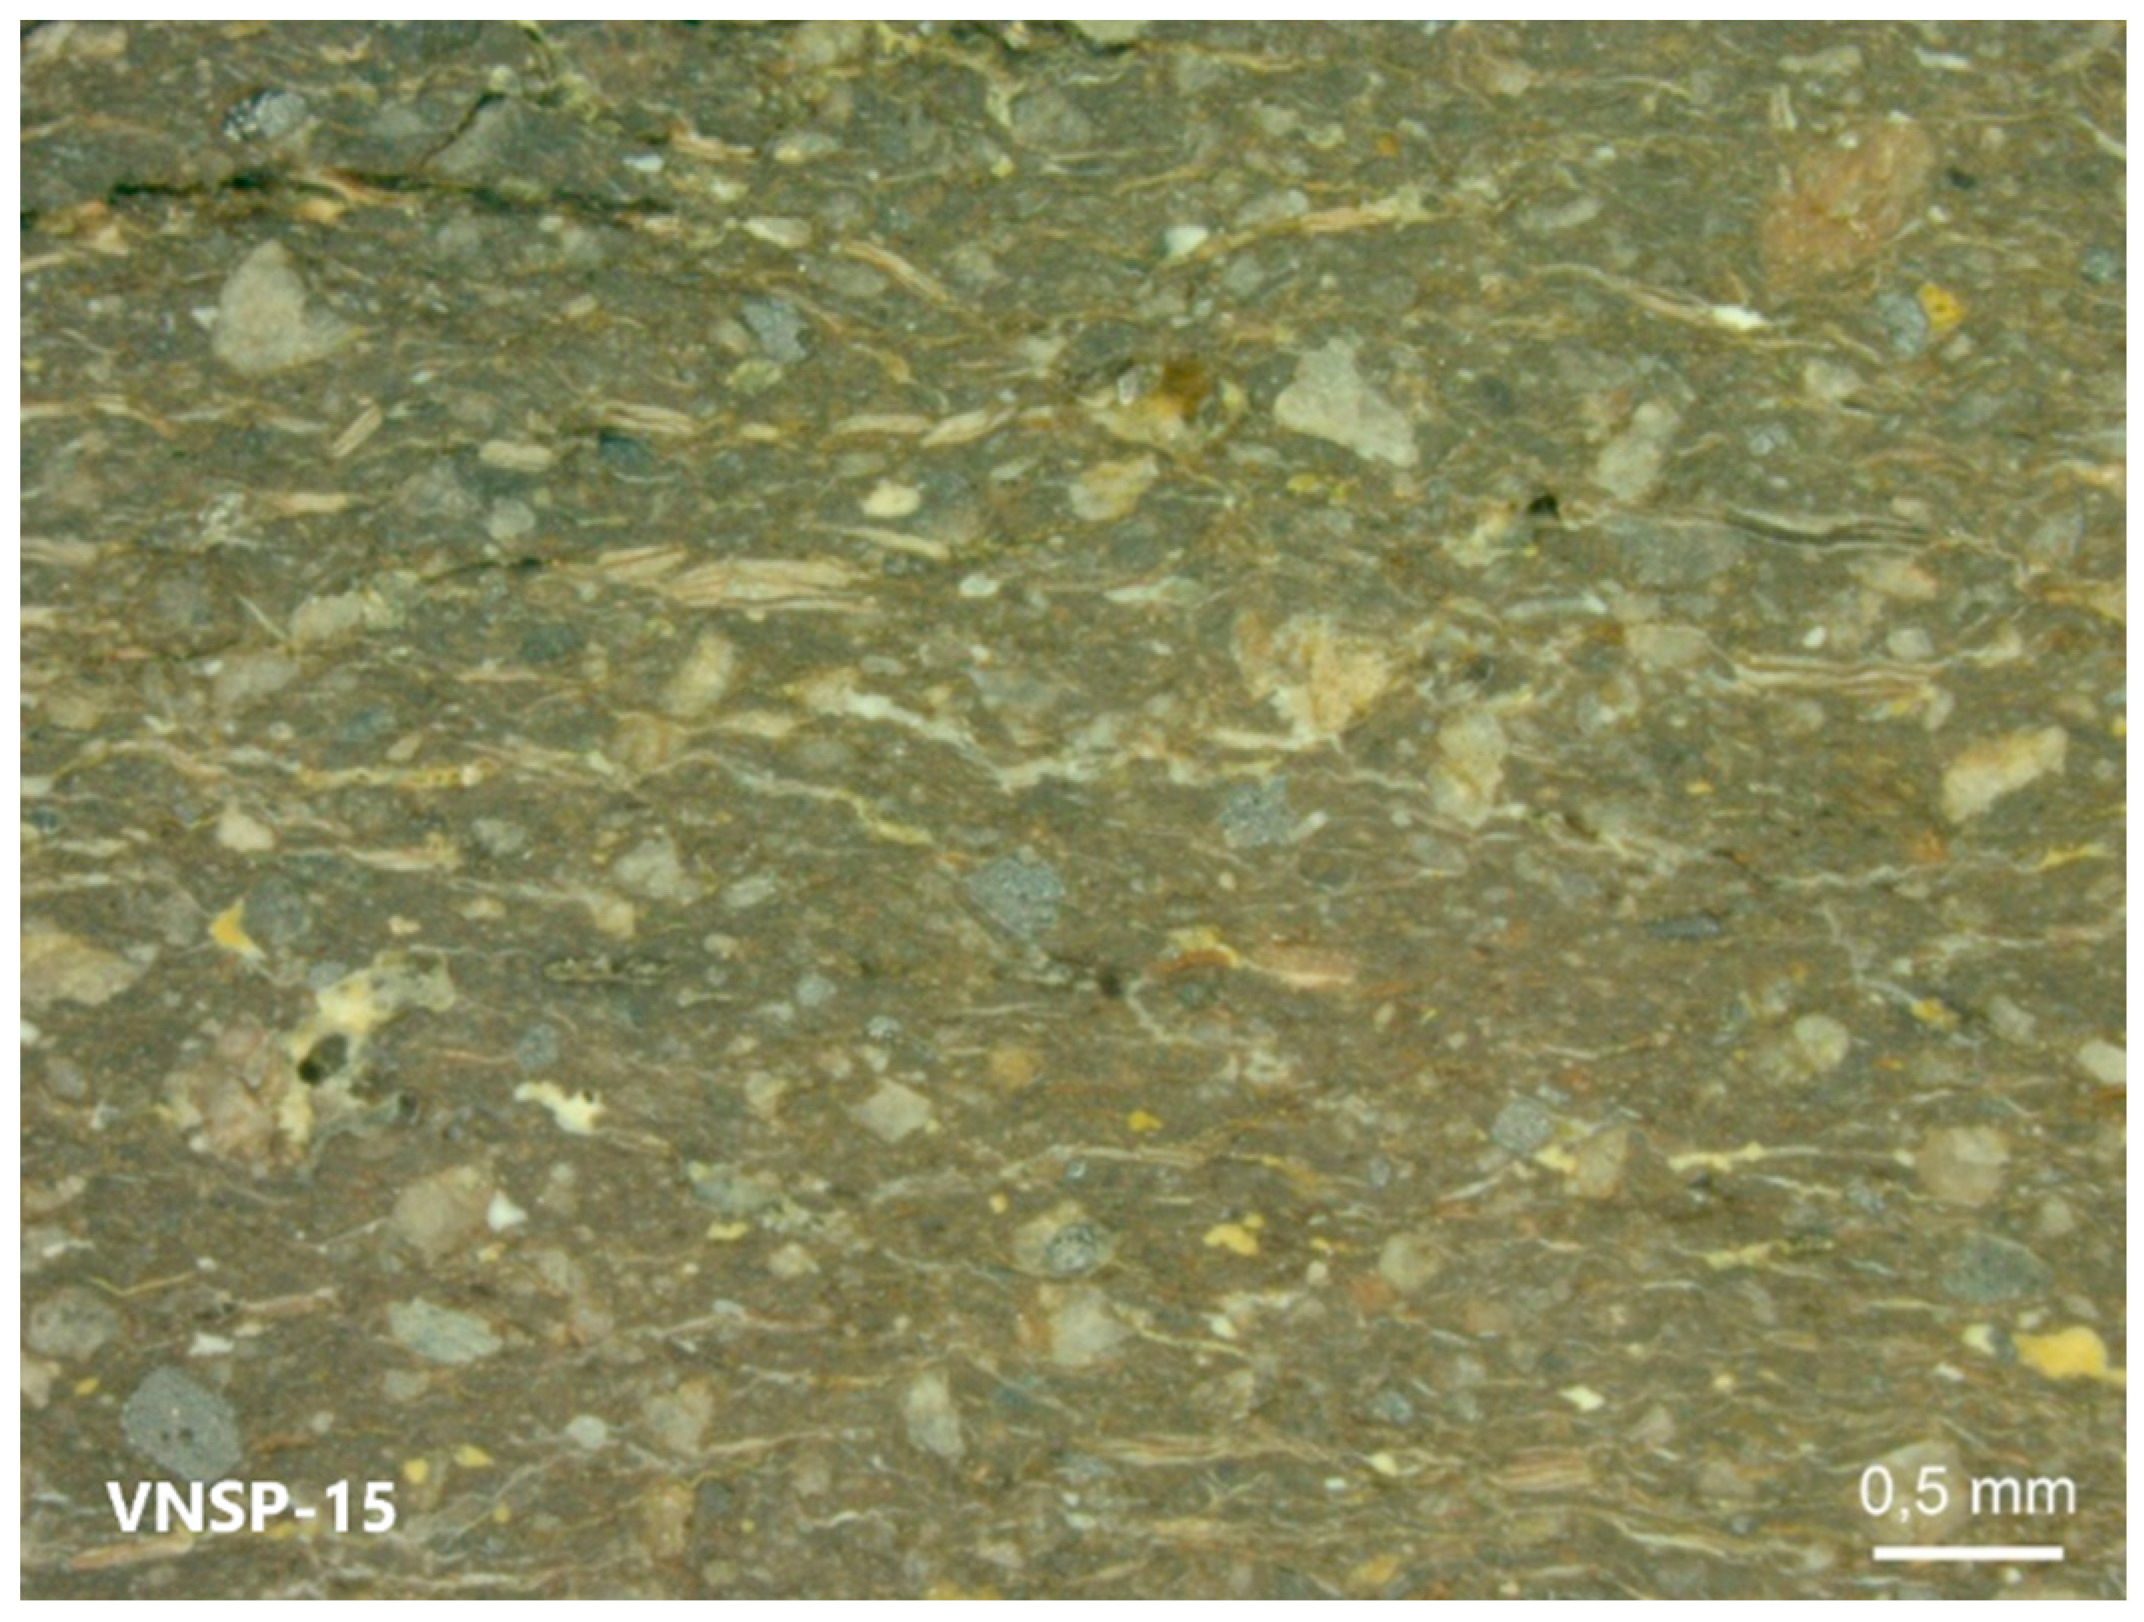
3.1. Textural Analysis

Through the observation of polished cross-sections (Figure 3), it was possible to characterize the texture of the ceramic paste and the distribution, size, and geometry of inclusions (Table 1).

3.2. Chemical Analysis

Chemical analysis of pastes resulted in the identification and quantification of Al, Si, K, Ca and Fe (major elements), Ti (minor element), and Cr, Mn, Co, Zn, Rb, Sr, Ce and Th (trace elements). Table 2 presents a summary of the chemical composition of the 149 samples analyzed, obtained by μ-EDXRF, and divided by settlements and decoration typologies.

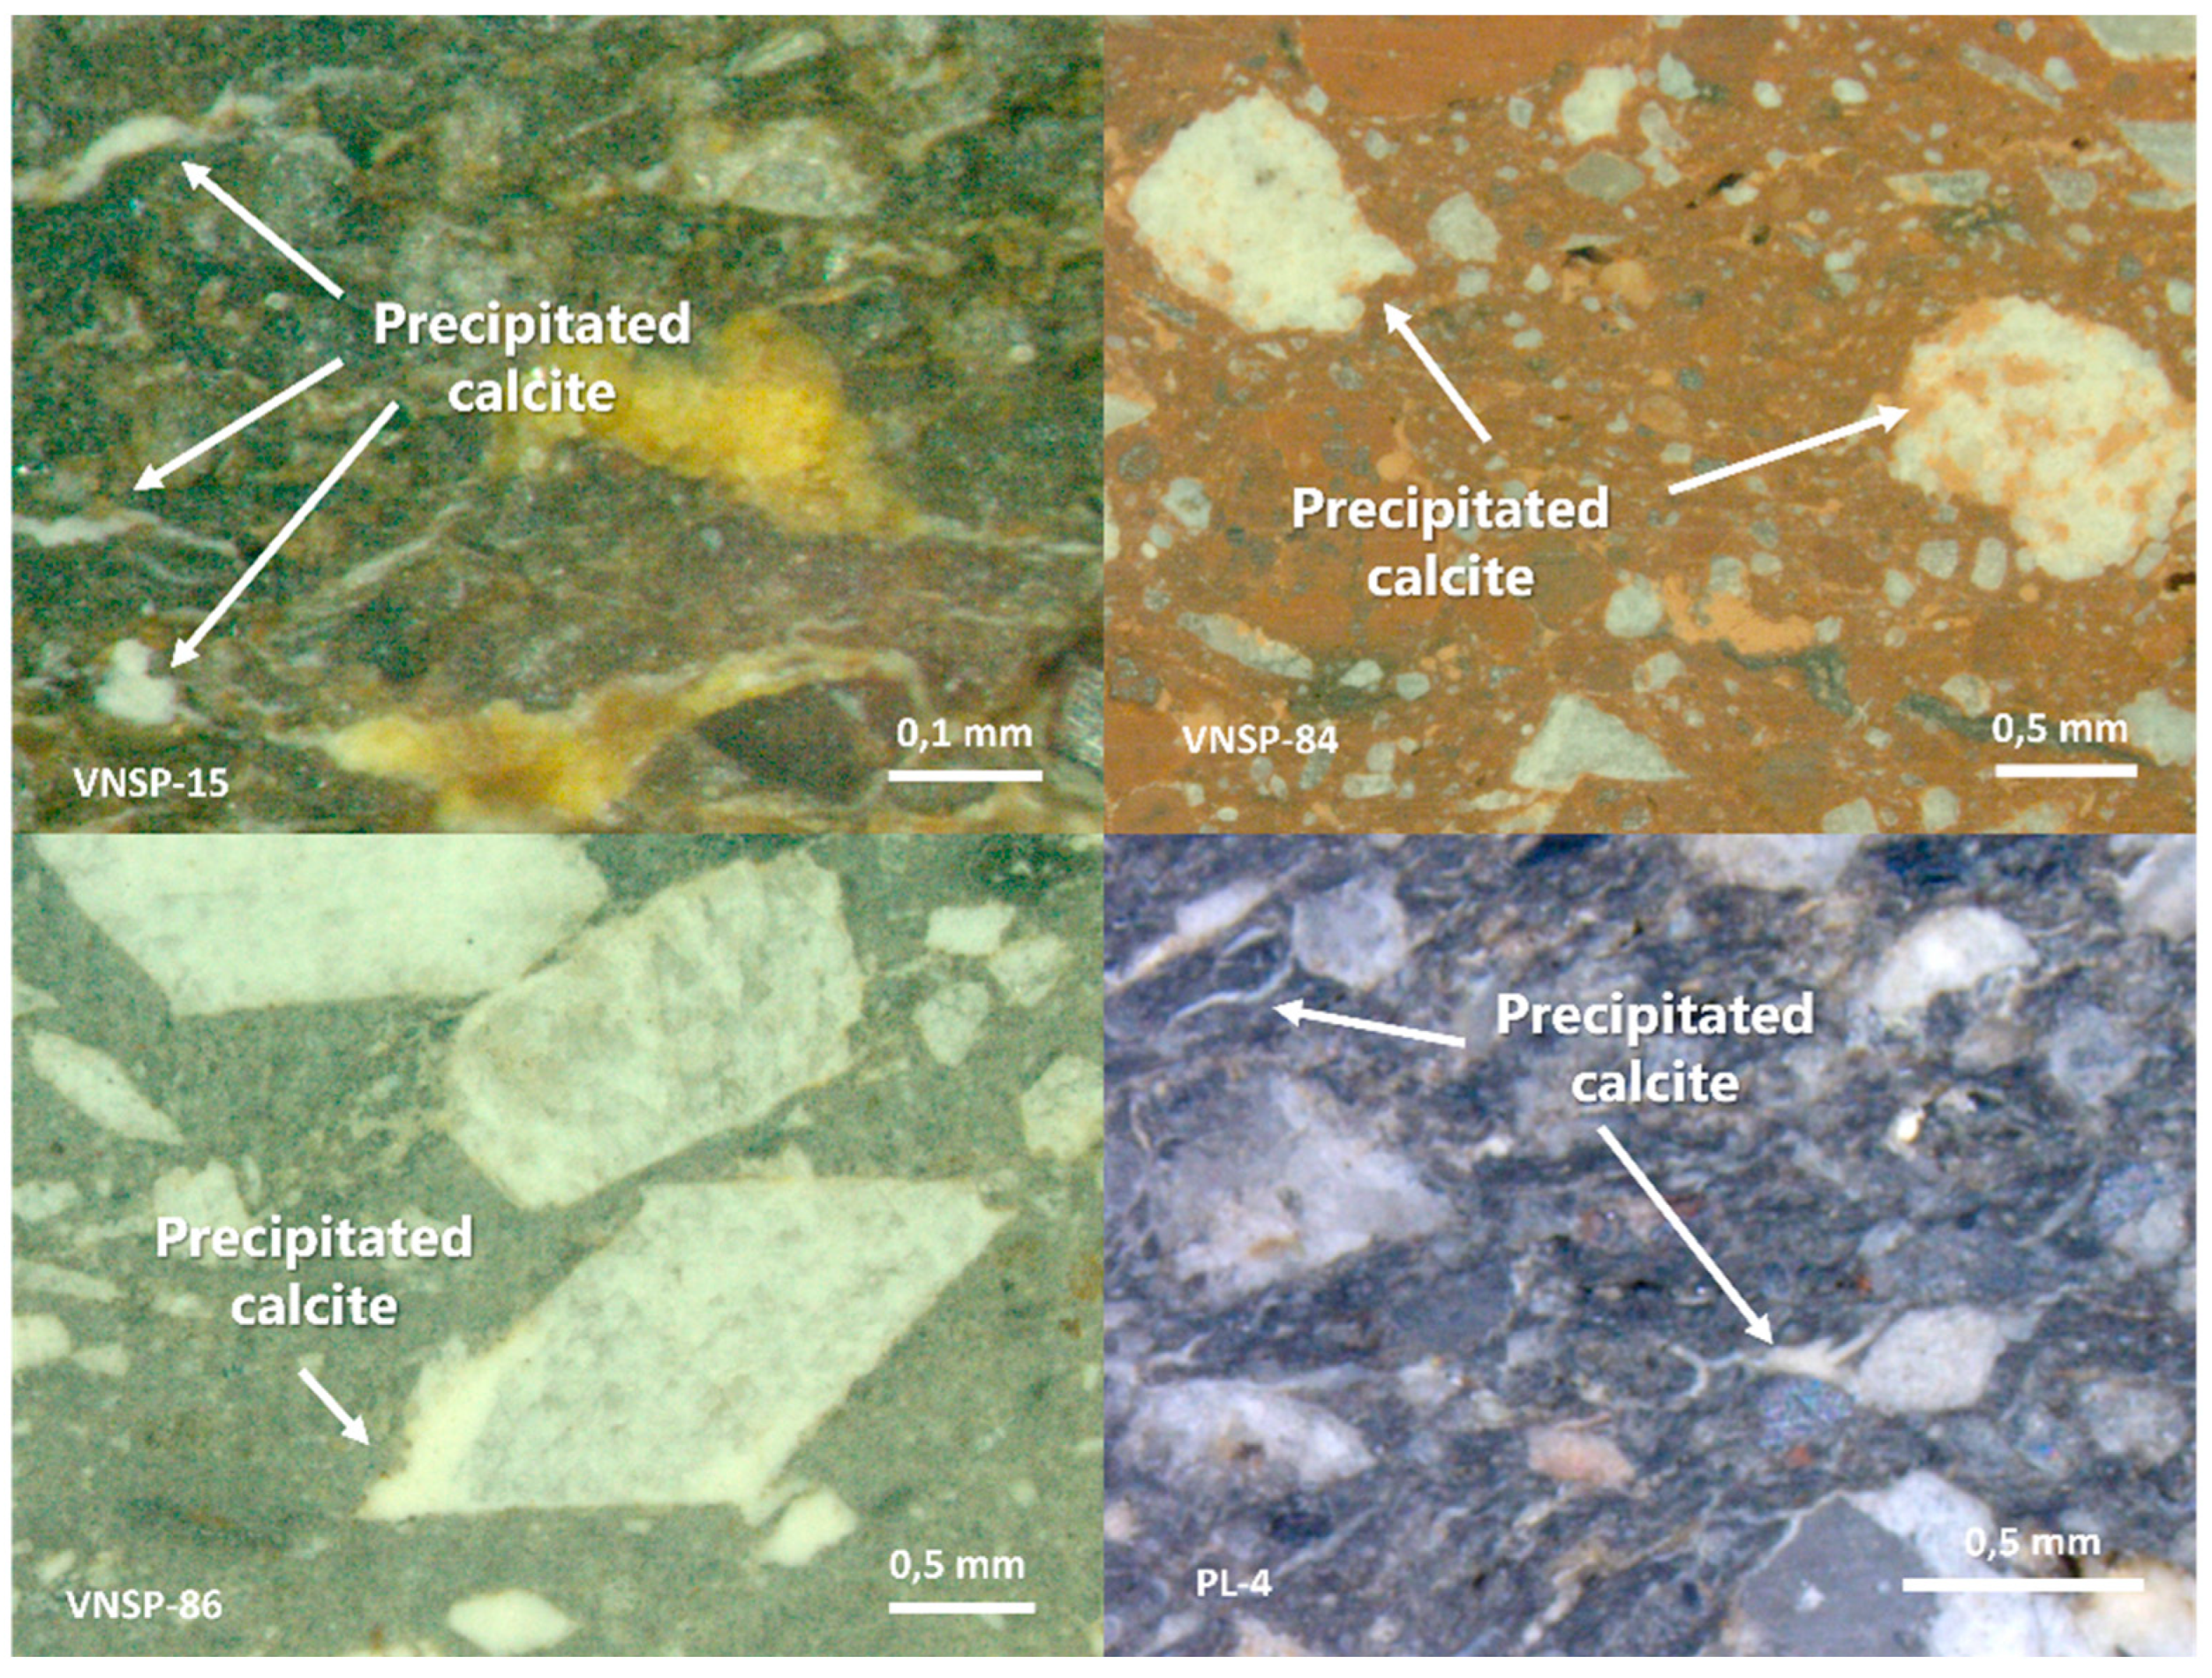
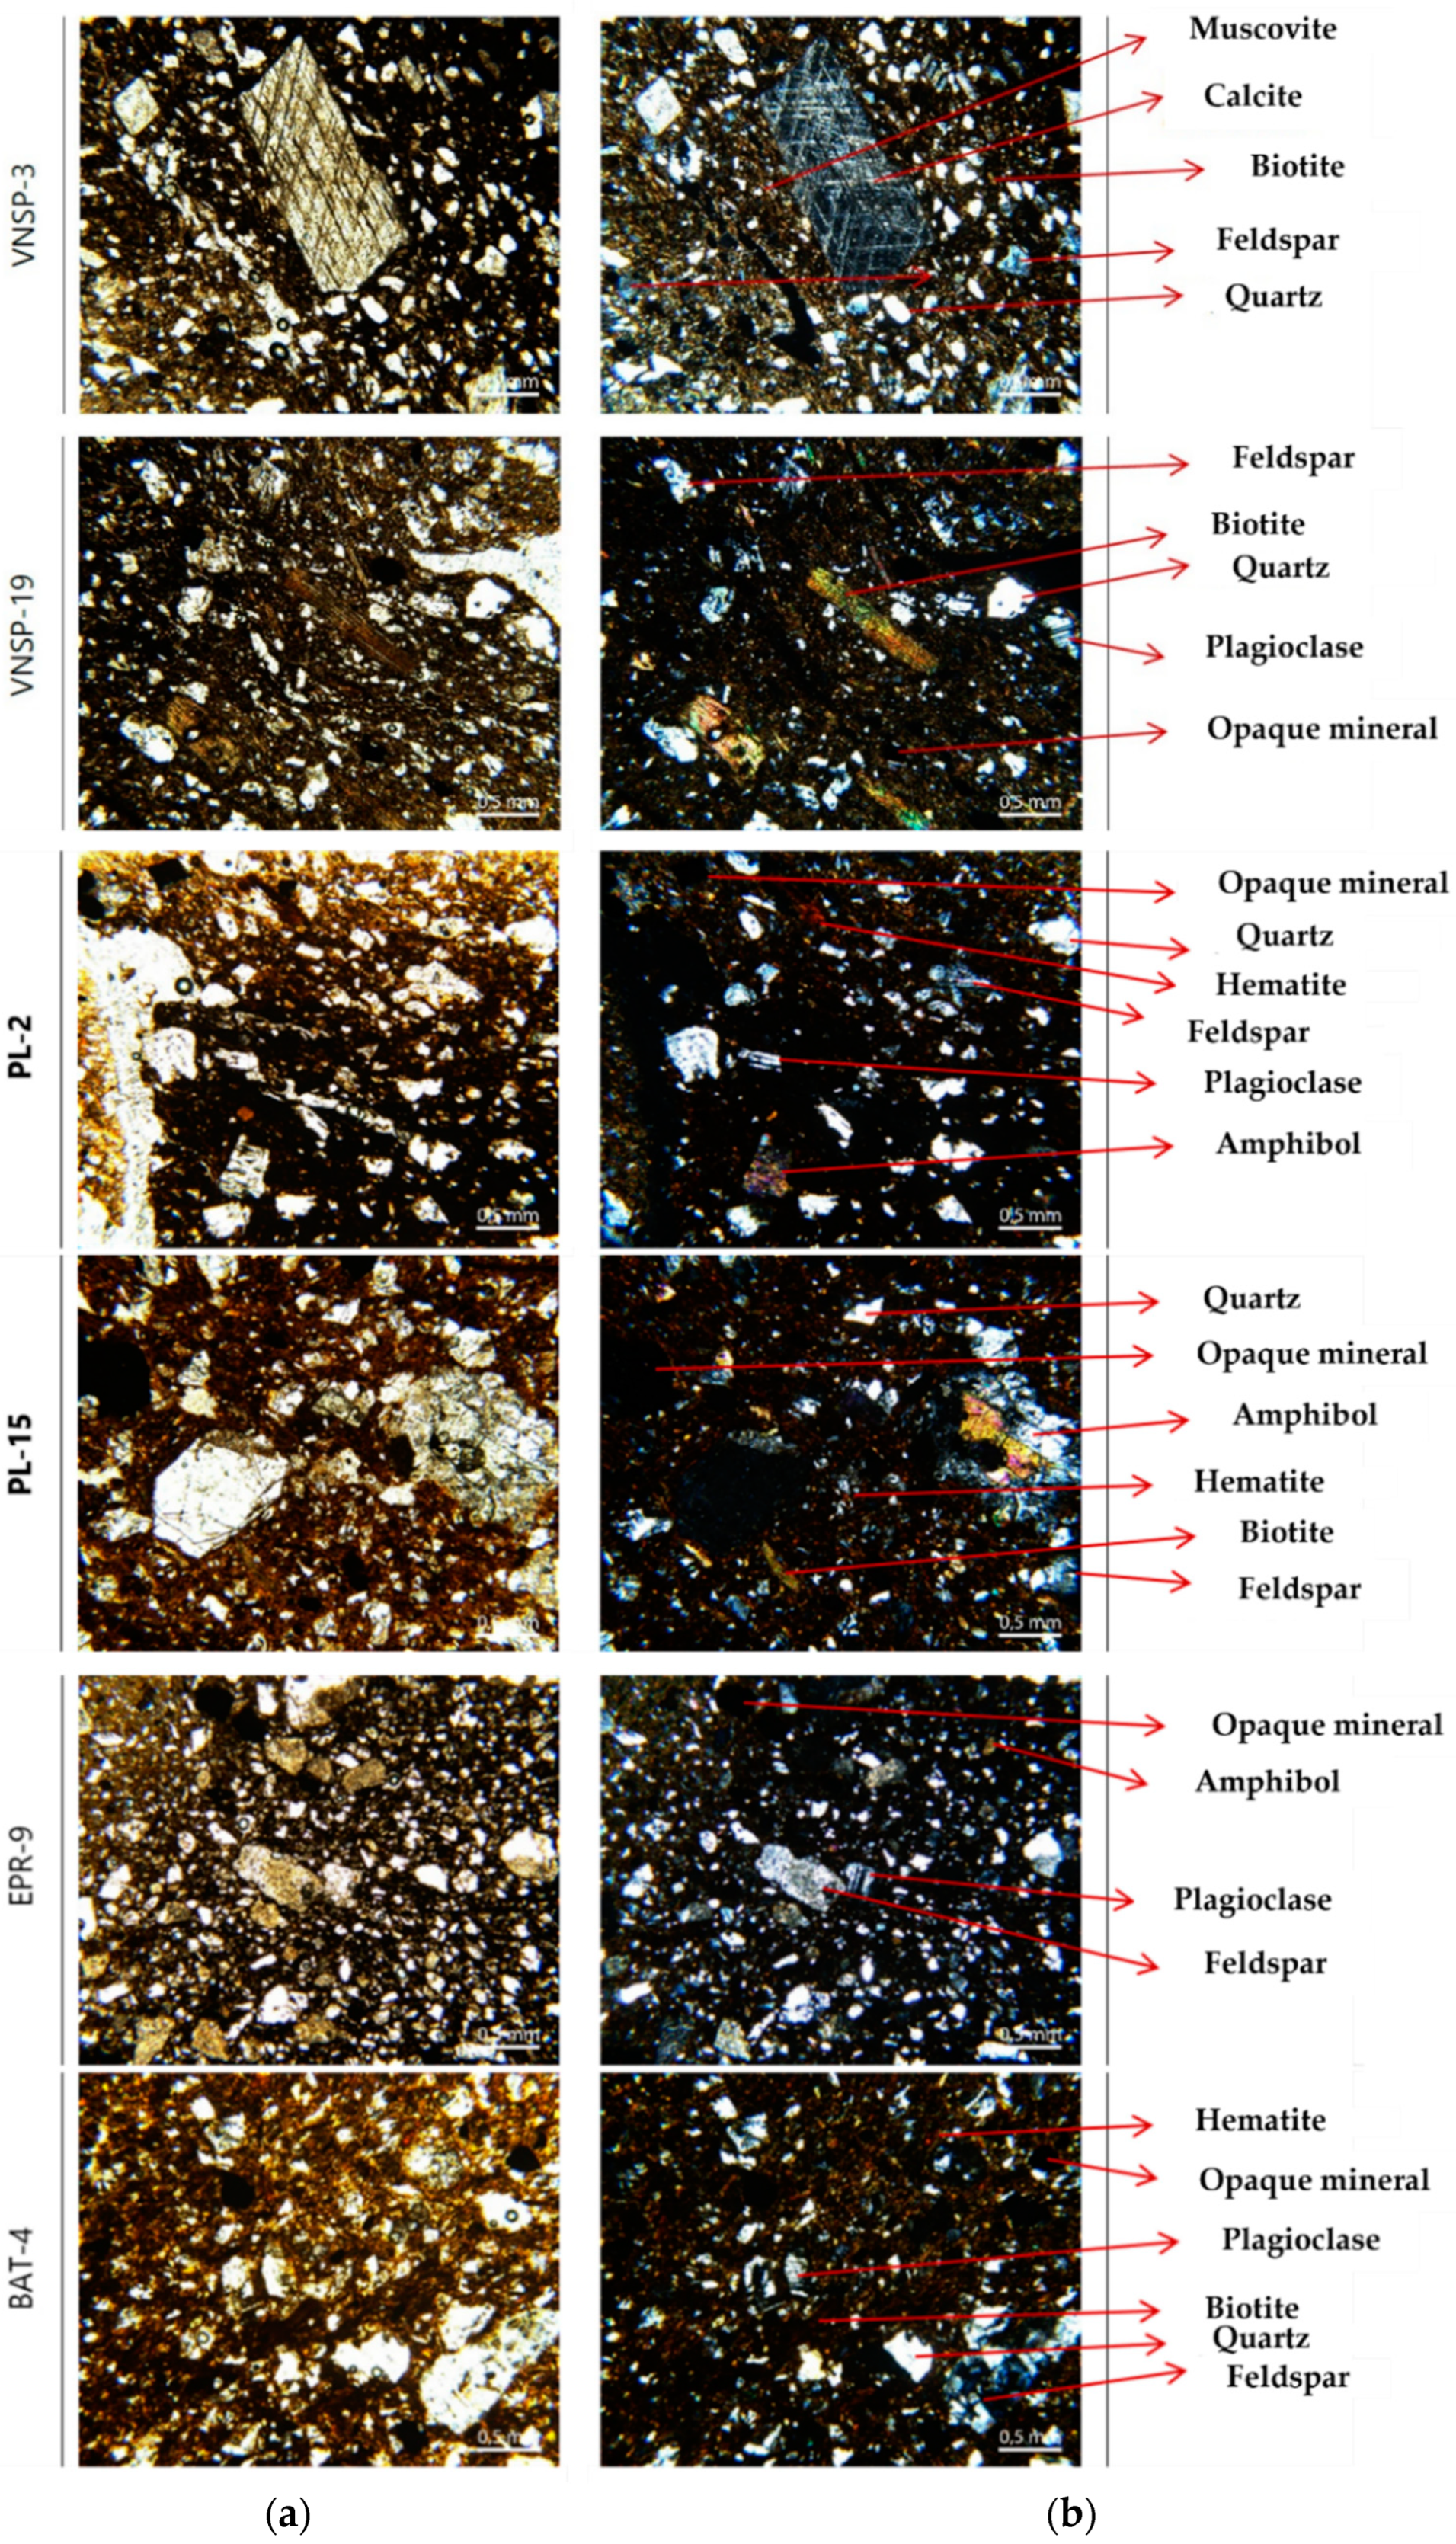
3.3. Mineralogical Analysis

Table 3 presents the mineralogical composition of a set of 41 selected samples analyzed by XRD, petrographic microscopy and Raman microspectroscopy. The selection criteria followed the need to have a representation of different archaeological sites and different decorative typologies, and regarding different chemical composition within each of the above groups and major textural marks, such as different coloring of the pastes and/or the shape or size of the inclusions. Representative thin sections of the samples included in Table 3 can be found in Figure 4. Supporting information can be found in supplementary materials Figures S1–S4.

4. Discussion

The fragments and respective pastes are, in general, in good condition and cohesion, despite the thousands of years they have been buried. A great variety of colors of pastes and surfaces appears in all archaeological sites and in all typologies (Figure 3 and Table 1). This color variation has, of course, to do with the components of the pastes themselves, but as well with the firing process used for these ceramics [2,24], which seems to be the same at all archaeological sites studied. The firing process would be carried out in open fires, where the ceramics were covered with branches or other wood fragments and even with ceramic discards. As expected, in conditions such as these, ceramics would be subject to large fluctuations, both in atmosphere and in firing temperature, from the beginning to the end of the firing cycle, resulting, consequently, in a large variation of the color of the vessels. In many cases, several colors are usually found in the same vessel, which may present darker and lighter stains as a result of the great heterogeneity of the firing atmosphere (Figure 5) or variations in the core color, as seen in Figure 3.
The color of pastes and surfaces mainly vary between brown (which reflect a less reductive atmosphere) and a dark gray (resulting from a more reductive firing) [25]. A few cases (7 fragments) of orange pastes are also detected in all sites except for BAT, resulting from oxidizing firing atmospheres [25]. In this way, there are no specific colors corresponding to different settlements or typologies, showing that the firing processes were very similar over time. No evidence was found that the ceramics under study had been painted. However, in sample VNSP-61, Raman microspetroscopy allowed the identification of calcium phosphate (Ca3(PO4)2) as a bone-based white paste filling the decorative imprints of a Bell Beaker vessel.
Looking at the inclusion textural properties, regarding microscopic aspects such as distribution, size, geometry and percentage of grains, there are also similarities between all archaeological sites. The slight differences found are mainly between typologies and mainly related to the different shapes and functions of the sampled ceramic vessels. It can be seen that in all archaeological sites and ceramic typologies, the grain distribution is non-uniform, which is indicative of a deficient treatment in the preparation of the paste, whether these grains are natural from the clay used or added while tempering. This fact may indicate that the people who did this preparation were not “specialized”, but common people, who perhaps produced the ceramic vessels according to the needs of the family or clan to which they belonged. However, in all typologies of all archaeological sites, it is possible to observe, in certain fragments (34.9% of them), what we can call an “orientation trend” followed by inclusions and pores (Figure 6), being aligned parallel to the base, a fact that may indicate the manufacture of the parts through the so-called roller technique [26]. For smaller pieces, this orientation is not observed, so it is believed that the ball technique may have been used, a more adequate technique for these smaller ceramics [26].
When the focus is on the grain geometry, it is interesting to notice that, in all archaeological sites, there is a tendency for them to be more angular (subangular) in the Full Chalcolithic period. This fact seems to follow the logic of having used more tempera especially prepared to sustain the robustness of the large containers with acacia-leaf decoration (Figure 1). Regarding the percentage of grains in the matrix, we found wide variation in all typologies, and even from fragment to fragment, but all composing between 20 and 30% of the matrix. However, there seems to be a slight reduction in this percentage over time, which may be indicative of a better purification of the raw materials.
In the characterization of ceramics, in addition to classifying traditional attributes, it is also important to classify attributes related to their chemical nature. Table 2 presents the average, minimum and maximum values for each settlement, as well as the averages for each typology. As a first look, we can see that the pastes are non-calcareous. Higher levels of CaO are found in the “no decoration” and “other decoration” ceramic groups of VNSP, and the samples that have more influence in this are VNSP-77, 84, 86, 93, 95 and 98, with, respectively, 20.8%, 23.2%, 21.2%, 37.5%, 49.1% and 37.9% of CaO, with calcareous pastes (with values between 15% < CaO < 60%). There are two more samples with high concentrations of Ca, outside these two typologies, VNSP-3 and VNSP-5, from Early Chalcolithic, with angular inclusions.
The concentrations presented for SiO2 also suggest that, in terms of acidity, the rocks that were in the origin of the clays used may be mainly intermediate rocks (65–52% SiO2) tending towards basic rocks (52–45% SiO2), considering that higher SiO2 values can sometimes be influenced by the addition of quartz (SiO2) as temper. However, as can be seen, there is a great variation in the chemical composition of ceramic pastes, especially regarding the contents of CaO of VNSP, but also of SiO2 and Al2O3, in general. This dispersion can give some important information. On one hand, it suggests that the raw materials, in each of the archaeological sites, come from different deposits and not from just one. On the other hand, the wide dispersion of SiO2 and CaO values may indicate that, in each group, in addition to the contents naturally present in the paste, the quartz and calcite (CaCO3) inclusions were most likely added during tempering in some of the ceramics. When the contents are similar, this may indicate that the raw materials come from the same clay deposit [27], concerning each of the archaeological sites.
To make an even deeper comparison of the whole set and to make it possible to cross-reference the various factors under study, one can also resort to a multivariate statistical analysis of the set of 149 Chalcolithic ceramic samples (Figure 7). The “cloud” resulting from the principal components analysis (PCA) shows a not very severe separation between groups.
We notice only one segregation—a group on the left (group 1) with higher concentrations of SiO2, K2O and Rb2O3, and another, on the right (group 2), with higher concentrations of Al2O3, Fe2O3 an TiO2, in addition to other minor and trace elements. The concentrations of the oxides in these two groups are inversely proportional. We were also able to distinguish four samples that behave as outliers, more specifically VNSP-84, 93, 95 and 98 (in red), due to their different compositions, which are demonstrated by the high concentration of CaO. Looking at these four fragments (Figure 8), it is interesting to notice some issues: the “non-decorated” fragment, VNSP-84 is, among all, the one with the thinnest thickness and the reddest paste. VNSP-93 e 95 from the “other decoration” group has in common a band of striations. In addition, the last fragment concerns the only “horn idol”, a possible ideotechnic artefact, unique among the analyzed fragments. All these questions in relation to these four samples raise the possibility that we are dealing with non-local ceramics.
Through the dendrogram (Figure 9) resulting from the HAC (Figure 8), we can see the relationship between the statistical groups and the Euclidean distances between them.
Thus, a comparison is possible, taking into account the Euclidian distance that exists between the groups assembled within each archaeological settlement. It is possible to observe a first group, Group 1 (the same from the PCA), composed just with samples of VNSP, with about half of the ceramics from the Early Chalcolithic, large majority of the ceramic from the Late Chalcolithic and also the majority of the “non-decoration” and “other decoration” ceramics, with major concentrations of SiO2, K2O and Rb2O3. The other group, Group 2, is the rest of the samples, from all the four settlements, with major concentrations of Al2O3, Fe2O3 an TiO2. Inside Group 2, there are another two subgroups: Group 2.1, mainly with all the ceramics from PL, and Group 2.2, a very heterogeneous group, with ceramics mainly from EPR and BAT, as well as VNSP. Table 4 helps to see which samples relate to each statistical group. Despite the separation of ceramics in these large groups, we can see that this is divided into multiple others, some with larger and others with smaller Euclidean distances within each archaeological site, with, of course, the most obvious in VNSP. This once again gives us the indication that several sources of raw materials may be at the origin of the ceramic pastes.
Finally, we have another very important element of the archaeometric analysis of ceramics: the classification of attributes related to their mineralogical nature. In this context, it is important to mention that archaeological ceramics are among the most complex ceramic systems to study. Here are several related factors, starting with the complex mineralogical composition itself, based on a mixture of materials that, as already mentioned, can be a combination of materials from clay (plastic part) and inclusions (non-plastic part), which can be original from the raw materials or added later, while tempering. The minerals present in the ceramic body undergo a complex set of chemical and structural changes that can happen not only during the time the ceramics were buried, but mainly during firing, which ultimately determine the final properties of these products. It is, therefore, a great challenge to predict the phase changes with this type of material, not only because there are complex relationships between these chemical and structural properties, but also because the changes are influenced by variable factors such as the maximum temperature reached, the firing duration and the atmosphere (oxidizing or reducing) [28,29,30].
Regarding this analysis (Table 2), in general, carried out through XRD, it was possible to identify, in all archaeological settlements, quartz, feldspars ((K,Na,Ca)(Si,Al)4O8) (both potassium and chalco-sodic), phyllosilicates ((Si2O5)2) and iron oxy-hydroxides (FeHO2). Pyroxenes (XY(Si,Al)2O6), and amphiboles (W0–1X2Y5Z8O22(OH,F)2) emerge as secondary phases, mainly in the settlements located in the Lisbon Vulcanic Complex. Calcite was only identified in VNSP. This is mostly primary calcite, which occurs in ceramic fired at low temperatures (<800 °C), a temperature above which the presence of some minerals such as gehlenite (Al2Ca2H2O7Si) and diopside (CaMgSi2O6) are identified, which is not the case in the present analysis. However, another type of calcite may be present not only in some of these samples where calcite was identified through XRD, but also in others, by observation with optical microscopy. That is precipitated calcite, a type of secondary calcite, which is revealed through the occurrence of formless aggregates (Figure 10) that occur when, in a burial context, there is the infiltration of carbonate solutions from the soil that cause the precipitation of calcium carbonate in pores and cracks existing in the ceramic pastes [27,29].
It is also important to see that with XRD we have a bulk vision of the minerals present in the sample, since the analysis is made after grinding the ceramic sample, with the plastic and non-plastic components mixed together. To understand which minerals are part of the clay and which could have been added as temper, it is essential to use petrographic microscopy performed through thin sections. Quartz, feldspars, biotite (K(Mg,Fe)3(AlSi3O10)(F,OH)2), calcite and opaque minerals were identified as the main non-plastic elements (Figure 4). Results show that calcite and quartz might be included as temper taking into account the large variations between chemical elements contents, combined with the size and geometry of the grains. Another type of temper, more precisely an anthropogenic temper, might have been included—in about eight samples it was possible to identify some aggregates with an appearance of grog (identified in the form of an aggregate with minerals dispersed in a matrix, where the walls of the minerals do not touch each other).
Having also performed the HAC of the mineralogical analysis data (Figure 11), it was possible to note that there is a division of groups similar to that of Figure 9. Here, we find again a large main group (now on the right), composed by ceramics from Group 1 of VNSP, characterized as having, as main phase, quartz in abundance, potassium feldspars, in some of the samples the presence of calcite and muscovite, and a complete absence of pyroxenes and amphiboles, besides smaller amounts of biotite and plagioclases.
Another group is formed (Group 2), on the left. This one very heterogeneous, a characteristic that is immediately noticeable by the number of multiple subgroups formed, with almost all archaeological sites and typologies being represented. This group is marked by the presence of mafic minerals (pyroxene, amphibole and biotite), plagioclases, epidote and chlorite and smaller amounts of quartz, potassium feldspars, in addition to the absence of calcite.
Considering the chemical compositions, the minerals present in samples and the geological characteristics of the archaeological implementation areas, it seems to have mainly been used for clays with mafic minerals, which is likely to have origin in the degradation of volcanic rocks such as those found in the Lisbon Volcanic Complex, such as basalt and diorite. These are mainly associated with the ceramics that make up Group 2, not only PL, EPR and BAT, which are implanted in the Lisbon Volcanic Complex, but also suggesting that some VNSP ceramics (about half of those from the Early Chalcolithic and the vast majority of ceramics with acacia-leaf decoration) could eventually become part of a ceramic marketing route. This is because clay is an easily accessible natural resource, so it would not be common to travel much more than 5 km to acquire this raw material [26,30]. Thus, a theory could predict that the most likely was that these ceramics could be produced in a village closer to a volcanic massif, being the closest to Serra de Todo Mundo, about 15 km northwest in a straight line, or still others such as EPR and BAT, about 60 km away, having already been considered distances greater than these for this type of trade [31]. On the other hand, it is important to keep this inference in mind and be careful, taking into account that the vast majority of clays found in Portugal are secondary clays (so with the possible presence of minerals that may not be from the area where the deposit is located), so the grouping of VNSP ceramics with ceramics from the Lisbon Volcanic Complex can be seen merely as statistical and not as a sign that the samples are not local.
Another type of clay with a larger presence of quartz was also used, mainly in Group 1 of VNSP, which may have its origin in the degradation of more acidic rocks such as granite and syenite. Finally, as seen, some samples show clays with calcium carbonate contaminations.
Taking into account the mineralogical phases present such as calcite and micas, in addition to the absence of others, such as gehlenite and diopside, the ceramics under study seem to have been fired at temperatures between 700 and 800 °C, in a cycle that, using data from experimental archaeology, indicates that it was relatively short and lasted between one and two hours (depending on the number of pieces to be baked), followed by a slower cooling to room temperature, which could last between two and six hours, depending on the size of the bonfire [26]. Although, in general, it is thought that these open ovens, so-called “soengas”, could not produce temperatures above 700 °C, it is known that the wind itself can lead to thermal peaks, so it could exceed this temperature even in the Neolithic and Chalcolithic [2].

5. Conclusions

To conclude, we can answer the first stated question: have raw materials and production techniques remained the same over time? The results obtained and the comparisons made point to the fact that the production techniques used have, in general, remained the same throughout the Chalcolithic in each of the archaeological sites, with textural differences mainly related to different forms and functions. It is also possible to suggest that these pieces are more likely a local production (with the exception of VNSP-84, 93, 95 and 98, which have their origin in a trade route perhaps with a local or, at most, regional network) where the raw materials used are from the region, which may have their origin in different types of rocks. On the other hand, the verification of some crudeness in the preparation of the pastes, the very diversity of sources of raw material that seem to have been used in all archaeological sites, appears to indicate that this may be a so-called “homemade” industry, and not exactly an “institutionalized” pottery industry, in the knowledge that would be passed from generation to generation and shared within communities but not only, since we find parallels between archaeological sites, revealing a greater network of interaction.
Results shows that calcite and quartz might be included as temper taking into account the large variations between chemical elemental contents, combined with the size and geometry of the grains. In addition, considering the mineralogical phases present, the pottery must have been fired at temperatures between 700 °C and 800 °C.
Finally, it should be noted that archaeometric studies such as this are rare and very important since they allow and certify the construction of theories about the past, because pottery has been a crucial and dynamic element in the sphere of interpersonal relationships in communities for thousands of years [32,33].

Supplementary Materials

The following supporting information can be downloaded at: https://www.mdpi.com/article/10.3390/heritage5030126/s1, Figure S1: XRD acquired diffractograms for selected VNSP samples. Qz—Quartz; Cal—Calcite; Fld—Feldspars; Ph—Philosilicates; IOH—Iron Oxy-Hydroxides; Anf—Amphibole; Px—Pyroxene; Figure S2: XRD acquired diffractograms for selected PL samples; Figure S3: XRD acquired diffractograms for selected EPR and BAT samples; Figure S4: Representative examples of Raman microspectroscopy spectra acquired for the main minerals identified by this analytical method.

Author Contributions

Conceptualization, R.C.C.; methodology, R.C.C., J.P.V. and A.M.S.; software, R.C.C., J.P.V. and A.M.S.; validation, R.C.C., J.P.V. and A.M.S.; formal analysis, R.C.C., J.P.V. and A.M.S.; investigation, R.C.C., J.P.V. and A.M.S.; resources, R.C.C., J.P.V. and A.M.S.; data curation, R.C.C., J.P.V. and A.M.S.; writing—original draft preparation, R.C.C.; writing—review and editing, R.C.C., J.P.V. and A.M.S.; visualization, R.C.C., J.P.V. and A.M.S.; supervision, J.P.V. and A.M.S.; project administration, R.C.C., J.P.V. and A.M.S.; funding acquisition, R.C.C., J.P.V. and A.M.S. All authors have read and agreed to the published version of the manuscript.

Funding

R.C. Chaves acknowledges FCT-Portuguese Foundation for Science and Technology for the scholarship ref. PD/BD/114409. J.P. Veiga acknowledges FEDER funds through the COMPETE 2020 Programme and National Funds through FCT-Portuguese Foundation for Science and Technology under the project ref. UIDB/50025/2020-2023.

Conflicts of Interest

The authors declare no conflict of interest.

References

  1. Dias, M.I.; Prudêncio, M.I. Neutron Activation Analysis of Archaeological materials: An overview of the ITN NAA Laborartory, Portugal. Archaeometry 2007, 49, 383–393. [Google Scholar] [CrossRef]
  2. Amaro, G. La cerâmica com Decoración Acanalada y Bruñida en el Contexto Pre-Campaniforme del Calcolítico de la Extremadura Portuguesa—Nuevos Aportes a la Comparensión del Processo de Procucción de Cerâmicas em la Prehistoria Reciente de Portugal. Ph.D. Thesis, Universidad Autonoma de Madrid, Madrid, Spain, 2010. [Google Scholar]
  3. Kunst, M. As Cerâmicas decoradas do Zambujal e o faseamento do Calcolítico da Estremadura Portuguesa. Estud. Arqueol. Oeiras 1996, 6, 257–287. [Google Scholar]
  4. Ferreira, S. Os Copos no Povoado Calcolítico de Vila Nova de S. Pedro. Rev. Port. Arqueol. Arqueol. 2003, 6, 181–228. [Google Scholar]
  5. Neto, N. A cerâmica decorada Neolítica e Calcolítica do Povoado das Baútas (Amadora). ARQA Patrim. Res. 2004, 1, 36–51. [Google Scholar]
  6. Sousa, A.C. O Penedo do Lexim e a Sequência do Neolítico Final e Calcolítico da Península de Lisboa. Ph.D. Thesis, Universidade de Lisboa, Lisboa, Portugal, 2010. [Google Scholar]
  7. Cardoso, J.L. Pré-História de Portugal; Editorial Verbo: Lisboa, Portugal, 2002; pp. 247–324. [Google Scholar]
  8. Dias, M.I.; Varela, A.; Lago, M.; Prudêncio, M.I. Proveniência e tecnologia de produção de cerâmicas nos Perdigões. Vipasca Arqueol. Hist. 2007, 2, 117–121. [Google Scholar]
  9. Kunst, M. Zambujal—Glockenbecher und kerbblattverzierte Keramik aus den Grabungen 1964 bis, 1973. In Mainzam Rhein; Ger.: P. von Zabern, Deutschland, 1987. [Google Scholar]
  10. Cardoso, J.L.; Soares, A.M. Contribution d’une série de datations C14, provenant, du site de Leceia, (Oeiras, Portugal), à la chronologie absolute du néolithique et du calcolithique de l’Estremadura portugaise. In Actes du Colloque de Périgueux (Supplément de la Révue d’Archeométie); Colloque de Périgueux: Périgueux, France, 1996; pp. 45–50. [Google Scholar]
  11. Serrão, E. Sobre a periodização do Neolítico e Calcolítico do território português. In Actas da 1 Mesa Redonda Sobre o Neolítico e o Calcolítico em Portugal; Abril: Porto, Portugal, 1979; pp. 125–140. [Google Scholar]
  12. Zbyszewski, G. Carta Geológica de Portugal—Notícia Explicativa da Folha 31-A; Serviços Geológicos de Portugal: Santarém, Lisboa, Portugal, 1953. [Google Scholar]
  13. Brilha, J.; Braga, M.; Proust, D.; Dudoignon, P. A disjunção colunar na chaminé vulcânica de Penedo de Lexim (Complexo Vulcânico de Lisboa)—Morfologia e Génese. Comun. Inst. Geol. Min. 1998, 84, 164–167. [Google Scholar]
  14. Ramalho, M.; Pais, J.; Ray, J.; Berthou, P.; Alves, C.; Palácios, T.; Leal, N.; Kullberg, M. Carta Geológica de Portugal—Notícia Explicativa da folha 34-A; Serviços Geológicos de Portugal: Santarém, Lisboa, Portugal, 1993. [Google Scholar]
  15. Bronk, H.; Röhrs, S.; Bjeoumikhov, A.; Langhoff, N.; Schmalz, J.; Wedell, R.; Gorny, H.; Herold, A.; Waldschläger, U. ArtTAX—a new mobile spectrometer for energy-dispersive micro X-ray fluorescence spectrometry on art and archaeological objects. Fresenius J. Anal. Chem. 2001, 371, 307–316. [Google Scholar] [CrossRef] [PubMed]
  16. Vyverberg, K.L.; Jaeger, J.M.; Dutton, A. Quantifying Detection Limits and Uncertainty in X-ray Diffraction Mineralogical Assessments of Biogenic Carbonates. J. Sediment. Res. 2018, 88, 1261–1275. [Google Scholar] [CrossRef]
  17. Riederer, J. Thin Section Microscopy Applied to the Study of Archaeological Ceramics. Hyperfine Interact. 2004, 154, 143–158. [Google Scholar] [CrossRef]
  18. Sandu, I.; Joosten, I.; Leal, N. Optical imaging applications for the study of cultural heritage artifacts. In Advances in Laser and Optics Research; Arkin, T., Ed.; Nova Science Publishers: New York, NY, USA, 2015; Volume 2, pp. 65–108. [Google Scholar]
  19. Lafuente, B.; Downs, R.; Yang, H.; Stone, N. The power of databases: The RRUFF project. In Highlights in Mineralogical Crystallography; Armbruster, T., Danisi, R.M., Eds.; De Gruyter: Berlin, Germany, 2015; pp. 1–30. [Google Scholar]
  20. R Core Team. R: A Language and Environment for Statistical Computing; R Foundation for Statistical Computing: Vienna, Austria, 2022. Available online: https://www.R-project.org/ (accessed on 4 August 2022).
  21. Johnson, R.; Wichern, D. Applied Multivariate Statistical Analysis; Prentice Hall: Hoboken, NJ, USA, 1982. [Google Scholar]
  22. Ward, J. Hierarchical Grouping to Optimize a Objective Function. J. Am. Stat. Assoc. 1963, 58, 236–244. [Google Scholar] [CrossRef]
  23. Little, G. The Technology of Pottery Production in Northwestern Portugal during the Iron Age; Cadernos de Arqueologia: Braga, Portugal, 1990. [Google Scholar]
  24. Rice, P. Pottery Analysis—A Sourcebook; The University of Chicago Press: Chicago, IL, USA; London, UK, 1987. [Google Scholar]
  25. Shepard, A. Ceramics for the Archaeologist, Carnegie Institution of Washington; Braun Brumfield: Washington, DC, USA, 1976. [Google Scholar]
  26. Amaro, G.; Anunciação, C. Tentativa de Compreensão da Cadeia Operatória de Produção de Cerâmicas Campaniformes Através de Métodos Experimentais: Exemplo baseado no estudo das peças do povoado calcolítico do Zambujal e da necrópole da Cova da Moura (Torres Vedras, Portugal). Al-Madan 2013, 17, 59–68. [Google Scholar]
  27. Fabbri, B.; Gualtieri, S.; Shoval, S. The presence of calcite in archaeological ceramics. J. Eur. Ceram. Soc. 2014, 34, 1899–1911. [Google Scholar] [CrossRef]
  28. Ouahabi, M.; Daoudi, L.; Hatert, F.; Fagel, N. Modified Mineral Phases During Clay Firing. Clays Clay Miner. 2015, 63, 404–413. [Google Scholar] [CrossRef]
  29. Chaves, R.C.; Lima, A.; Coroado, J.; Teixeira, A.; Vilarigues, M.; Leal, N.; Azzeddine, K.; Soares, A.M. Medieval and early modern ceramics from Azemmour (Morocco)—Textural, mineralogical and chemical analysis. J. Archaeol. Rep. 2018, 21, 1152–1162. [Google Scholar] [CrossRef]
  30. Arnold, D. Ceramics, Theory and Cultural Process, New Studies in Archaeology; Cambridge University Press: Cambridge, UK, 1985. [Google Scholar]
  31. Convertini, F.; Cardoso, J.L. Les poteries campaniformes de la fortification chalcolihique de Leceia (Oeiras, Portugal): Étude pétrographique, analyse des provenances et degraissants. Estud. Arqueol. Oeiras 2022, 30, 11–34. [Google Scholar]
  32. Buys, S.; Oakley, V. Conservation and Restoration of Ceramics; Butterworth-Heinmann: Oxford, UK, 1993. [Google Scholar]
  33. Salanova, L.; Sheridan, A. When the Potter Make the Story: What can pottery tell us about the people who made and used it? Eur. Archaeol. 2013, 40, 80–82. [Google Scholar]
Figure 1. Types of ceramic decoration characteristic of the Chalcolithic region of Lisbon. (a) Cylindrical cups with a polished corrugated outer surface (Early Chalcolithic); (b) Large containers with acacia-leaf decoration (Full Chalcolithic); (c) Bell Beaker pottery (Late Chalcolithic).
Heritage 05 00126 g001
Figure 2. The four Chalcolithic settlements under study in the Lisbon region (image adapted from Google Maps, Maps data © 2021 Google).
Heritage 05 00126 g002
Figure 3. Representative cross-sections of the set of samples under study. Analysis performed using photomicrographs with a 20× magnification using the stereomicroscope Zeiss SteREO Discovery, V20.
Heritage 05 00126 g003
Figure 4. Some representative thin sections of the set under study. (a) parallel nicols and (b) crossed nicols. Analysis performed using a petrographic microscope OLYMPUS BX51, fitted with a 4× objective and coupled with a digital camera OLYMPUS DP20.
Heritage 05 00126 g004
Figure 5. Some fragments from all archaeological settlements with stains in the surface, resulting of the firing conditions.
Heritage 05 00126 g005
Figure 6. Observation of an “orientation trend” followed by inclusions and pores. Analysis performed using photomicrographs with a 20× magnification using the Stereomicroscope Zeiss SteREO Discovery, V20.
Heritage 05 00126 g006
Figure 7. Diagram obtained from the principal components analysis of the set of results determined for the elemental chemical composition of all 149 Chalcolithic ceramic fragments from the Lisbon region under study. Samples VNSP-84, 93, 95 and 98 are highlighted in red, as non-local samples.
Heritage 05 00126 g007
Figure 8. The four “outlier” ceramic fragments. From left to right—VNSP-84, 93, 95 and 98 (horn idol).
Heritage 05 00126 g008
Figure 9. Dendrogram resulting from the ascending hierarchical classification of the chemical analysis performed on the 149 Chalcolithic ceramics under study.
Heritage 05 00126 g009
Figure 10. Precipitated calcite identified through the formation of shapeless aggregates in some of the samples studied. Analysis performed using photomicrographs with a 20× magnification using the stereomicroscope Zeiss SteREO Discovery, V20.
Heritage 05 00126 g010
Figure 11. Dendrogram resulting from the ascending hierarchical classification on the mineralogical analysis performed on the 41 Chalcolithic ceramics under study.
Heritage 05 00126 g011
Table 1. Summary of the textural characterization. Grain size: dense < 0.1 mm; fine-grained 0.1 mm–0.33 mm; small-grained 0.33 mm–1 mm; medium-grained 1 mm–3.3 mm; coarse-grained 3.3 mm–10 mm, according to definitions of J. Riederer [17]. Geometry: angular—all angled facets; subangular—mostly angular facets, but with two or three rolled facets; subrounded—mostly rounded facets, but with two or three angled facets; rolled—facets all rolled according to definitions of G. Little [23].
PasteInclusions
ColorDistributionSizeGeometry%
Vila Nova de São Pedro—98 Samples
Early Chalcolithic
(Corrugated)
Mostly a range of brownsNon
uniform
Mostly fine
(89%)
Mostly subrounded
(69%)
29%
Full Chalcolithic
(Acacia leaf)
Mostly a range of graysNon
uniform
Fine to small
(50% fine and 50% small)
Mostly subangular
(77%)
26%
Late Chalcolithic (Beaker pottery)Mostly with black core and orange surfacesNon
uniform
Mostly fine
(58%)
Mostly subangular
(54%)
20%
Other decorationRandomNon
uniform
Dense to small (46% fine)Mostly subangular
(55%)
23%
No decorationRandomNon-
uniform
Fine to small (46% fine and 39% small)Mostly subangular (69%)24%
Penedo do Lexim—29 samples
Early Chalcolithic
(Corrugated)
Mostly a range of graysNon
uniform
Mostly fine
(83%)
Mostly subrounded
(67%)
27%
Early Chalcolithic
(No decoration)
Mostly a range of brownsNon
uniform
Mostly fine
(67%)
Subrounded (100%)23%
Full Chalcolithic
(Acacia leaf)
Mostly a range of brownsNon
uniform
Mostly small
(71%)
Mostly subangular (71%)24%
Full Chalcolithic
(Other decoration)
Mostly with black core and brown surfacesNon
uniform
Mostly small (100%)Subangular to subrounded (50%)25%
Full Chalcolithic
(No decoration)
Mostly a range of brownsNon
uniform
Mostly fine
(67%)
Mostly subrounded
(83%)
23%
Espargueira—12 samples
Late Neolithic/
Early Chalcolithic
Mostly a range of brownsNon
uniform
Mostly small (50%)Subangular to subrounded (50%)24%
Baútas—10 samples
Full Chalcolithic
(Acacia leaf)
Mostly a range of browns, sometimes with a black coreNon
uniform
Mostly fine
(70%)
Subangular to subrounded (50%)28%
Table 2. Summary of the chemical characterization.
Vila Nova de São Pedro—98 Samples
% (m/m)ppm
Al2O3SiO2K2OCaOTiO2Fe2O3Cr2O3MnOCoOZnORb2OSrOCe2O3ThO2
Early Chalc. (Corrugated)16.557.72.314.541.156.651027912319012420847510
σ2.911.40.713.810.722.96245601066481571553
Full Chalc.
(Acacia leaf)
19.848.81.694.661.719.7492985281828732738813
σ2.48.40.381.170.492.002131773631931843
Late Chalc.
(Beaker pottery)
18.460.62.532.550.976.86143682251921461035219
σ2.15.00.551.070.521.6822768640401101712
No decoration
15.359.92.537.660.786.0913258622151157944649
σ1.914.80.848.650.402.393851982950711143
Other decoration
15.244.31.7815.891.337.68128900271599918952213
σ5,213.60.8817.290.814.32306281452561612235
Mean
(n = 98)
17.555.32.205.731.207.441177912518012319047111
σ3.311.70.737.740.662.8633589949501491743
Maximum24.176.03.6949.132.9014.53243398749437219533110020
Minimum7.724.80.271.070.333.00585787314432205
Penedo do Lexim—29 samples
% (m/m)ppm
Al2O3SiO2K2OCaOTiO2Fe2O3Cr2O3MnOCoOZnORb2OSrOCe2O3ThO2
Early Chalc. (Corrugated)24.952.81.954.601.718.708878224150492313464
σ3.25.80.281.310.271.0192533759501151
Early Chalc.
(No decoration)
21.558.71.993.671.938.12113115123153512172714
σ3.610.40.581.561.023.7465513104016110571
Full Chalc.
(Acacia leaf)
29.350.31.734.191.9410.18100100328142442183314
σ2.65.20.230.740.531.131228931610551380
Full Chalc.
(Other decoration)
26.553.81.853.931.608.388180923121462042334
σ2.36.10.570.490.462.44251097291486790
Full Chalc.
(No decoration)
25.652.32.314.271.7510.22147135229150612533294
σ1.02.70.490.740.291.7766474625734750
Mean
(n = 29)
25.653.41.974.151.809.21107103326145512263084
σ3.76.70.451.040.562.244740464112671021
Maximum32.871.93.016.942.9813.07240229036303803275635
Minimum16.140.81.471.590.803.4947313119125761293
Espargueira and Baútas—22 samples
% (m/m)ppm
Al2O3SiO2K2OCaOTiO2Fe2O3Cr2O3MnOCoOZnORb2OSrOCe2O3ThO2
Late Neo./Early Chalc. (EPR—No decorated)18.951.81.993.911.668.751131142222045216829411
σ2.15.70.331.170.651.7778737545960942
Full Chalc.
(BAT—acacia leaf)
21.844.81.275.312.2010.2783974251645127932713
σ0.64.40.301.140.891.92172935281077842
Mean4
(n = 22)
20.248.61.664.551.909.44991065231865221830912
σ2.26.20.481.330.801.9560573542988892
Maximum22.966.72.786.894.0914.303502800352877140053018
Minimum16.640.20.772.020.476.23532331512337581738
Table 3. Mineralogical analysis of the samples from the four settlements under study. Ab—Albite; Act—Actinolite; An—Anorthite; Anf—Amphibole; Anl—Analcite; Ant—Anatase; Aug—Augite; Bt—Biotite; Cal—Calcite; Chl—Chlorite; Epd—Epidote; Ph—Philosilicates; Fld—Feldspars; Hem—Hematite; Ilm—Ilmenite; K—Potassium Feldspars; Mag—Magnetite; Mc—Microcline; Ms—Muscovite; Op—Opaque minerals; Or—Orthoclase; IOH—Iron oxy-Hydroxides; Plg—Plagioclases; Px—Pyroxenes; Qz—Quartz; San—Sanidine; Tr—Tremolite. The semi-quantification took into account the intensity of the peaks in the diffractograms (in arbitrary units presented below in parentheses): xxxx—extremely abundant (>3000); xxx—very abundant (1000 to 3000); xx—abundant (500 to 1000); x—present (100 to 500); v—traces (<100); nd—not detected.
Semi-Quantification Using XRDMinerals Identified by XRD, Raman and Petrographic Microscopy
QuartzFeldsparsPhyllosilicatesCalciteIron Oxi-HydroxidesPyroxeneAmphibole
Vila Nova de São Pedro—26 Samples
Early Chalc. (corrugated)VNSP-3xxxxxxxxxx--Cal, Ph(Ms, Bt, Chl), Fld(Or), IOH(Hem), Qz
VNSP-5xxxxxxxxx--Cal, Ph, Fld(San, Plg), IOH(Hem), Qz
VNSP-19xxxx---xAnf(Tr), Ph(Bt, Chl), Fld(Plg, San), Op, Qz
VNSP-22xxxxxxx-x--Fld(Plg, San), Ph, IOH(Hem), Qz
VNSP-23xxxxx-x--Epd, Ph(Ms, Bt, Chl), Fld(Ab, An, K), Op, IOH(Hem, Mag), Qz
VNSP-26xxxxxxx----Ph, Fld(Mc), Qz
Full Chalc. (acacia leaf)VNSP-27xxxxxxx-v--Ph(Bt, Chl, Ms), Fld(Mc, Plg) IOH(Hem), Qz
VNSP-31xxxxxx-x-xAnf(Act), Ph(Bt), Fld(Ab, K), Op, IOH(Hem, Ilm), Qz
VNSP-37xxxx-x-xAnf, Epd, Ph(Bt, Chl), Fld(Ab, An, K), Op, IOH, Qz
VNSP-42xxxxxxx----Epd, Ph, Fld(Mc), Qz
VNSP-44xxxxx-xv-Ph(Bt), Fld(Ab, Or, San), Op, IOH(Hem), Px(Aug), Qz
BeakerVNSP-53xxxxxx----Ph(Ms), Fld(Ab, Or), Qz
VNSP-56xxxxxx-x--Ph(Ms), Fld(Ab, An, Or), Op, IOH, Qz
VNSP-61xxxxxx-x--Ph(Bt, Chl), Fld(Mc, Plg), IOH(Hem), Qz
VNSP-62xxxv--xxAnf(Act), Ph(Bt), Fld(Ab, K), Op, Px(Aug), Qz
VNSP-63xxxxxxx-x--Ph, Fld(San), Op, IOH(Hem), Qz
VNSP-65xxxxxx----Ph(Ms), Fld(Ab, An, Or), Qz
No decorationVNSP-79xxxxxx-x--Ph, FldK (Or), IOH, Qz
VNSP-86xxxvxxx---Cal, Ph, Fld(K, Ab), Qz
VNSP-87xxxxxxv-vx-Ph, Fld(Ab, Anl, Or), Op, IOH(Hem), Px(Aug), Qz
Other DecorationsVNSP-88xxxxxxxxxv--Cal, Ph, Fld(Mc, Plg), IOH, Qz
VNSP-89xxxxx-xx-Epd, Ph(Bt), Fld(Ab, And),Op, IOH(Hem, Ilm), Px(Aug), Qz
VNSP-92xxxxv-v--Epd, Ph(Bt), Fld(Ab, And, Anl, K), Op, IOH(Ilm), Qz
VNSP-95xxxxvxxxx---Cal, Ph, Fld(Plg), Qz
VNSP-96xxxxxxx-x--Ph(Ms), Fld(Mc), IOH, Qz
VNSP-98xxxxxxxx--Cal, Ph, Fld(Ab), Op, IOH(Hem), Qz
QuartzFeldsparsPhyllosilicatesCalciteIron oxi-hydroxidesPyroxeneAmphiboleMinerals identified by XRD, Raman and petrographic microscopy
Penedo do Lexim—10 samples
Early Chalc. (corrugated)PL-2xxxxv-xxxxAnf(Act), Epd, Ph(Chl, Ms), Fld(Anl, K, Ort), Op, IOH(Mag), Px(Aug), Qz
PL-5xxxxxx-xx-xAnf(Trem), Ph(Bt), Fld(And), IOH, Qz
PL-7xxxxxxx-v--Fld(Ab, Anl, Or), Op, IOH, Qz
PL-8xxxxxx-xxxAnf(Tr), Ph(Bt), Fld(Ab), Op, IOH(Hem), Px(Aug), Qz
Early Chalc (No)PL-13xxx--xxx--Anf, Ph(Bt), Fld(Ab, Anl), Op, Px, Qz
PL-15xxxxx--xx-Anf, Chl, Epd, Ph(Bt), Fld(Anl), Op, IOH(Hem, Mag), Px(Aug), Qz
PL-18xxxxxx-vxxAnf(Tr), Ph(Bt, Ms), Fld(Anl, Or), IOH(Mag), Px(Aug), Qz
No dec.PL-20xxxxxxx-xxxxAnf(Tr), Ph(Bt), Fld(Or, Plg), Op, IOH(Hem), Px(Aug), Qz
PL-26xxxxxv-xx--Ph, Fld(Ab, Anl, Or), Op, IOH(Hem, Mag), Qz
PL-29xxxxx--v--Ph, Fld(Ab), IOH(Hem), Qz
QuartzFeldsparsPhyllosilicatesCalciteIron oxi-hydroxidesPyroxeneAmphiboleMinerals identified by XRD, Raman and petrographic microscopy
Espargueira and Baútas—5 samples
EPR-6xxxx-xx-Epd, Ph(Bt), Fld(Ab, An), IOH(Mag), Px(Aug), Qz
EPR-7xxxx-xxxAnf, Ph(Bt), Fld(Ab, An, K), Op, IOH(Hem, Mag), Px, Qz
EPR-9xxxxxx-xxxAnf, Ph, Fld(Ab, Or),Op, IOH(Hem), Px(Aug), Qz
BAT-3xxxxxxx-vv-Ph, Fld(Ab, And), Op, IOH(Hem), Px, Qz
BAT-4xxxxxx-vxxAnf, Ph(Chl), Fld(Ab, An, K), IOH(Mag), Px, Qz
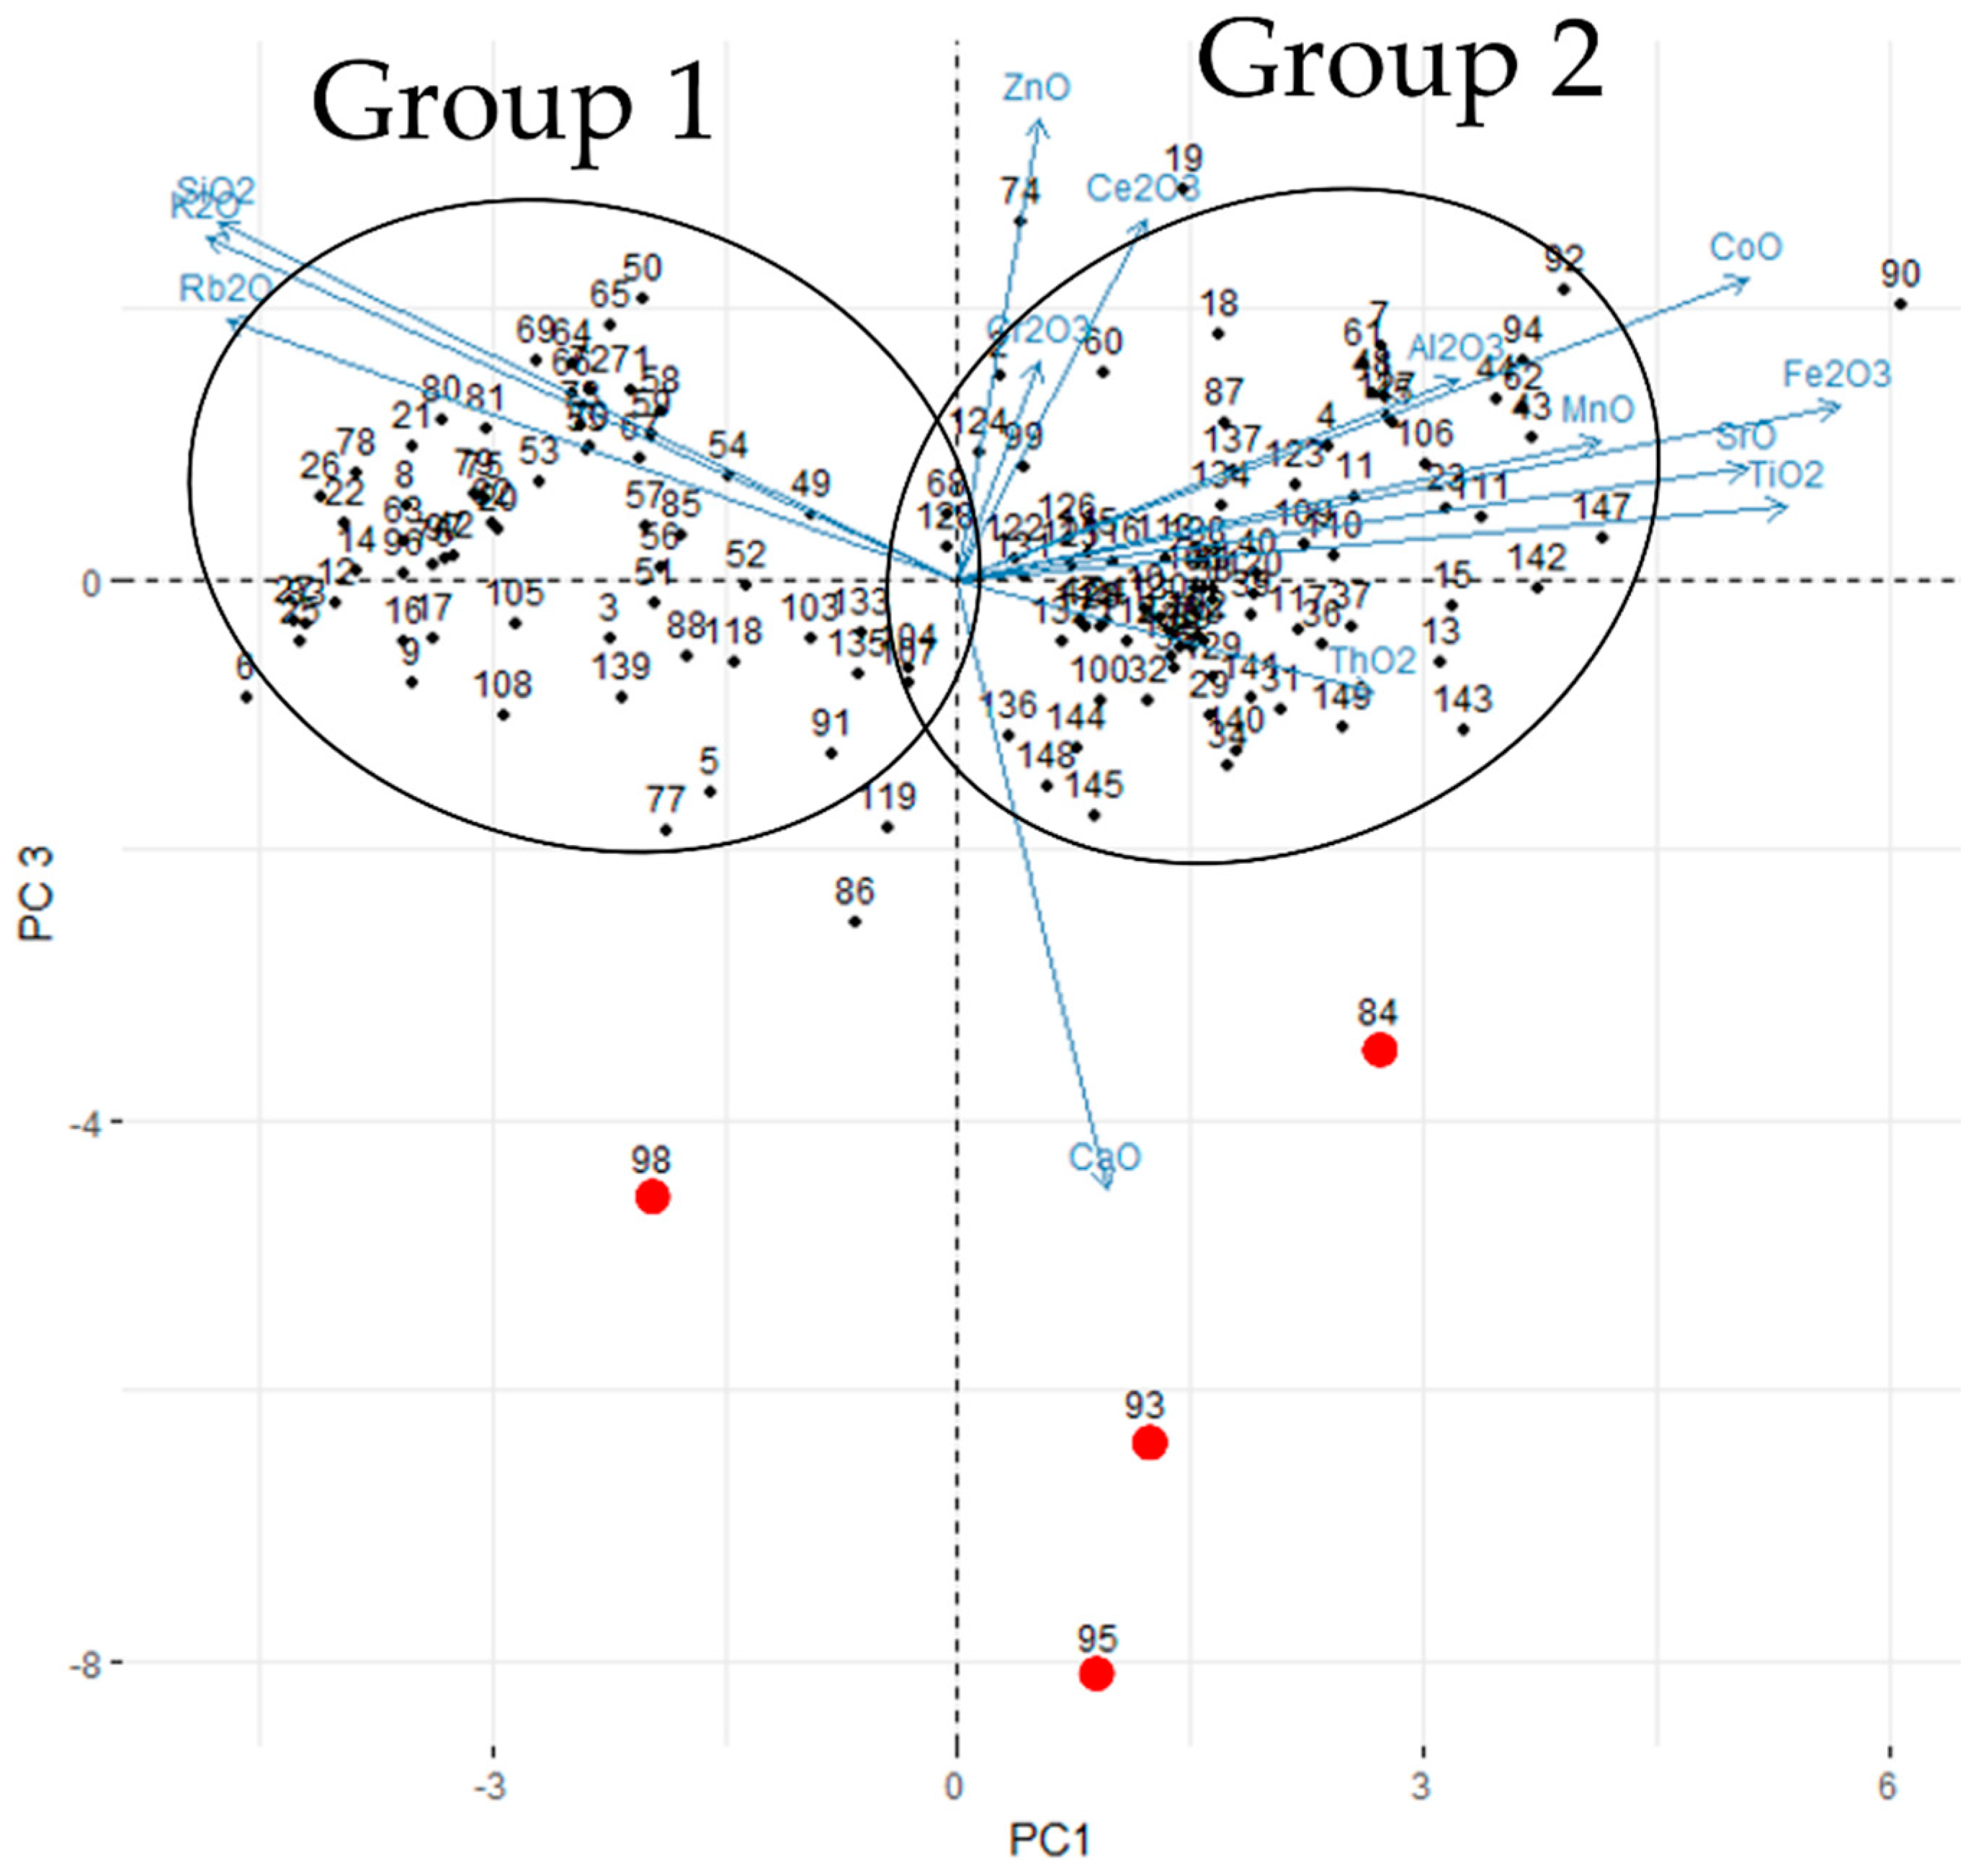
Table 4. Division of the 140 samples by statistical group, based on the chemical composition.
Group 1Group 2
Group 2.1Group 2.2
VNSPEarly Chalc.
(corrugated)
VNSP-3, 5, 6, 8, 9, 12, 14, 16, 17, 20, 21, 22, 25, 26 VNSP-1, 2, 4, 7, 10, 11, 13, 15, 18, 19, 23, 24
Full Chalc.
(acacia leaf)
VNSP-27, 42 VNSP-28, 29, 30, 31, 32, 33, 34, 35, 36, 37, 38, 39, 40, 41, 43, 44, 45, 46, 47, 48
Late Chalc.
(beaker)
VNSP-49, 50, 51, 52, 53, 54, 55, 56, 57, 58, 59, 63, 64, 65, 66, 67, 68, 69, 70, 71, 72, 73 VNSP-60, 61, 62, 74,
No decorationVNSP-75, 76, 77, 78, 79, 80, 81, 82, 83, 84, 85, 86 VNSP-87
Other decorationVNSP-88, 91, 93, 95, 96, 97, 98 VNSP-89, 90, 92, 94
PLEarly Chalc.
(corrugated)
PL-2, 3, 4, 5, 6PL-1
Early Chalc.
(no decoration)
PL-7, 8, 9, 10, 11, 12
Full Chalc.
(acacia leaf)
PL-13, 14, 15, 16, 17, 18, 19
Full Chalc.
(no decoration)
PL-20, 21, 22, 23
Full Chalc.
(other decoration)
PL-24, 25, 26, 27, 28, 29
EPRLate Neo./Early Chalc.
(carinated bowls)
EPR-7, 12EPR-1, 2, 3, 4, 5, 6, 8, 9, 10, 11
BATFull Chalc.
(acacia leaf)
BAT-1, 2, 3, 4, 5, 6, 7, 8, 9, 10
Total57 samples30 samples62 samples
Publisher’s Note: MDPI stays neutral with regard to jurisdictional claims in published maps and institutional affiliations.

