Abstract
The fringe projection (FP) method is an outstanding tool for reconstructing painted surfaces. This technique, which has been used for conservation and digitization, does not damage the artwork and can reach sub-millimeter accuracy. To carry out this type of analysis, it is necessary to achieve the most accurate measurements possible. Measuring the precision that a projector-camera-object arrangement can achieve is a complex task. In this paper, we show an experimental method used to measure the accuracy of this technique with instrumentation within the reach of most conservation laboratories. The method consists of capturing, as a reference model, a stepped cylindrical Nylamid® pyramid, as a construction whose shape, size, and manufacturing accuracy are known with high precision. The pyramid has eight well-defined steps, which are fashioned with an accuracy more exact than that of the fringe projection method. The height of each step was measured, obtaining the mean and variance of the height measurements fitted to a Gaussian distribution. In this work, we show the measured heights of the steps, obtained by varying the period of the fringes. The smallest detectable step height was less than 44.1 µm; however, this was obtained with a variance in the order of the step height. The smallest detectable step height with a small variance was 0.1008 mm. In addition to this accuracy measurement, a qualitative evaluation of a painting was carried out, finding the presence of possible superimposed thin layers, fabric, and microcracks, which commonly occur in the drying and aging processes. Further research would provide an experimental measurement of the method’s accuracy and its variance as essential for obtaining a confidence criterion that could then be applied to the model of the painting’s surface.
1. Introduction
The best possible reconstruction of the shape of an art piece has been a subject of great importance since ancient times, when such reproductions could be done only by mechanical pantograph. Initially, the focus was on obtaining the most precise copy of the artwork. Today, the possibility of replicating the external aspects and the surface of a cultural heritage object with high precision allows for various 3D applications [1]. One of the most common applications is to create digital models of the object for museography and cataloging purposes. For this type of use, very high precision is not necessarily required, since a resolution of one millimeter provides acceptable quality [2,3].
Digital models allow a precise memory of the artifact to be preserved in the event of deterioration or loss (due to natural or accidental causes). In addition, they enable databases to be generated that can be used to recognize replicas of original artworks and to create digital museums. These make art accessible to people all over the world by allowing virtual tours and observation of objects from different points of view and with a certain degree of closeness. Lastly, with the advent of 3D printers, the possibility of transforming three-dimensional models into faithful copies of scanned works is now viable, both for the public [4,5] and for reconstructing and reintegrating missing pieces [6].
One of the first institutions to use 3D scanner techniques applied to conservation was the National Research Council of Canada (NRCC). They first utilized this technology in the 1980s to measure artifacts in order to make replicas of them [7]. Italy began to explore this field with some interesting and iconic projects, such as the Michelangelo Project (1998) and the Pietà Rondanini Project (1998), both focused on documenting Michelangelo Buonarroti’s artworks in Italy. Additionally, other pieces of cultural heritage have been digitally reconstructed for study, such as relics from the Qin Shi Huang Mausoleum and the Terracotta Warriors and Horses Museum (1999), “La Minerva di Arezzo” (2001), parts of the San Giovanni Baptistery in Florence (2001), and some sculptures by Donatello and San Giovanni Pisano (2004) [7].
The possibility of obtaining 3D models that are faithful to the respective artworks enables virtual restoration of specific works and their reintegration through image processing, the return of damaged polychrome sculptures to their original appearance, or the relocation of them virtually to their original architectural context [8,9].
More recent advanced applications of this type of technology in the field of cultural assets include quantitative morphometric analysis for research purposes in support of various scientific fields (e.g., archeology, art history, conservation, and restoration). However, digital models with different resolutions are required for cultural asset applications, depending on the scale and type of the study to be carried out [10,11,12,13]. For example, an archaeologist or an art historian can carry out studies with models that have precisions ranging from millimeters to as many as five hundred microns. In contrast, the restorer who wants to study the deformation of the pictorial surface related to a specific type of lining or the state of a wall painting before and after chemical treatment requires details of some tens of microns to at most two hundred microns, an accuracy that not all methods can achieve.
Today, digital scanners based on structured light projection and user-friendly photogrammetric methods are available to many professional laboratories. Structured light projection involves projecting a known pattern of pixels (horizontal lines, grids, or bars) onto a scene [14]. The way the pixel pattern deforms when it is projected onto the surface enables computer vision systems to calculate the surface depth of the objects in the scene [15].
Most people think of paintings as two-dimensional because this is what the eye perceives at first glance, but they are in fact three-dimensional objects. As a base support, they may have metal, canvas, or wood panels, or other less common materials such as bone or stone, on which a preparation base and several layers of paint are applied, creating a substrate that has its own topography. Artists, either deliberately or unintentionally, create 3D textural effects on the surface by applying the brushstrokes in certain ways [16,17,18].
Paintings are made up of different layers and materials that significantly influence not only their appearance, but also their chemical and physical behavior during the drying process and, later, the aging process, which involves eventual degradation that is reflected in the surface appearance [18,19]. In order to be able to characterize and quantify these phenomena, the professional field of restoration has ventured into applying image analysis systems to photographic documentation, obtaining semi-quantitative results for this purpose [20].
To be able to study these painting surfaces, a three-dimensional model with a very high resolution must be created, in such a way that we can observe and monitor the topographic characteristics of each painting, as well as the potential aging or damage caused by agents such as chemical cleaners, mechanical abrasion, or relining processes [21,22].
The main goal of the present study was to apply and generate a fringe projection (FP) system to create a three-dimensional model with an axial and plane resolution of 100 µm in which the original details and physical characteristics of the objects can be observed. This is very important in order to be able to monitor the state of conservation of an artwork, as well as the success of potential treatments applied to solve specific problems, which can sometimes modify the impasto of the pictorial layer or cause other types of damage. This paper presents the general method, describes the methodology as applied to an oil painting on canvas, and shows how the results obtained can be useful in meeting the objectives.
2. Materials and Methods
In this paper, we use fringe projection as a 3D reconstruction methodology to be applied in the preservation of cultural heritage. This technique has been employed in various disciplines [23,24,25,26,27,28,29,30,31,32,33] due to its simplicity and measurement accuracy. The general experimental setup and basic principles are described in the following section.
2.1. Fringe Projection
Fringe projection is a three-dimensional reconstruction method used to generate a 3D digital model of an object with excellent accuracy and simplicity [29,34,35,36,37,38,39,40,41,42]. A typical setup for a fringe projection system consists of a projection unit (projector) and an image acquisition unit (CCD camera), as shown in Figure 1, as well as an analysis system (computer). The camera is placed perpendicular to the plane where the object under study is located at a distance H. The projector must be situated on the camera axis at a distance D and angle α.
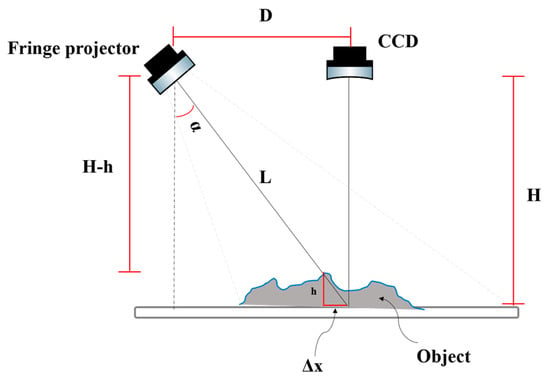
Figure 1.
Typical fringe projection setup for three-dimensional reconstruction of objects.
The 3D reconstruction model begins by projecting a sinusoidal pattern (Figure 2) with a well-defined frequency onto the reference plane, and then onto the object surface placed on the reference plane. Images of fringe patterns are acquired with and without the object. Here, the distribution of the heights of the object modulates the pattern phase (distorted pattern). The distorted fringe patterns can be modeled as:
where is the background light (ambient light), is the modulation of the fringes (fringe contrast), is the phase term, and is the phase shift produced by the object’s surface being a certain height above the reference plane. The background and modulation are adjusted to a gray scale to generate black-and-white theoretical sinusoidal fringes (Figure 2). In practice it is difficult to achieve this range of fringes; however, the optical setup must be adjusted to obtain the result closest to the ideal case. The critical task is to recover the phase of the fringe image captured, because the phase contains the information giving the height of the object. There are several techniques for phase recovery, such as stepping, triangular phase stepping, or π-shift FTP, among others [35,36,37]. The phase stepping technique [35] is notable for the small number of images required and for its excellent precision. Phase stepping involves the capture of N-images (three as a minimum) with a known N-step of fringe shifting. The N-step images are modeled by the following equation in which the spatial component is omitted:
where represents the phase-shift index . Based on the fringe steps, a system of equations can be solved to obtain the phase. The solution to the system of equations is expressed as:
where is the wrapped phase. Figure 2 shows an example of fringe images with 3-step phase shifting, produced using Equation (1).
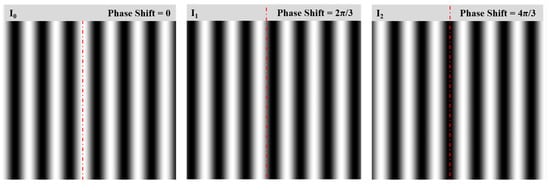
Figure 2.
Example of fringe images with 3-step phase shifting.
The drawback of this technique is that the phase is wrapped. The main problem is that an error in unwrapping affects not only a single pixel, but propagates. When the captured object has edges or abrupt changes, the phase unwrapping process is more complicated. Fortunately, in most cultural heritage and art objects, there are few cases where the objects have abrupt changes; therefore, the phase stepping method can be applied in most cases without difficulty. In this work, we used the unwrapping method proposed by Barrientos et al. [38].
2.2. Experimental Arrangement
In the previous section, we described the geometrical arrangement of the method; here, we describe the specific configuration used in our experiments. Following the geometry shown in Figure 1, the distance between the reference plane and the camera lens was 24 cm, the illumination angle of the projector was 30° (α), and the distance between the projector lens and the object was 39 cm. Figure 3 shows the equipment used. In this arrangement, we used a Lumenera® LW11057M high-resolution camera (4008 × 2672 pixels) with a Nikon 60 mm focal length lens and a multimedia Epson EH-TW6100 high-resolution video projector (1920 × 1080 pixels). The fringe periods varied from 0.5 to 8 mm. For all images, we employed four equally spaced phase shifts: 0, π/2, π, and 3π/2.
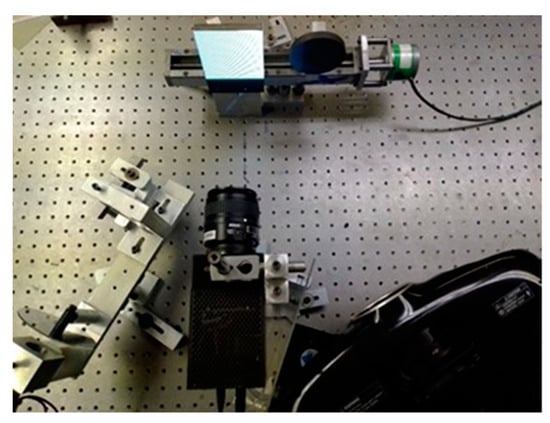
Figure 3.
Experimental arrangement.
2.3. Processing of Captured Images
Once the fringe stepping images are captured without and with the object, the phase needs to be recovered and unwrapped, and the phase units converted to height (calibrated). The expression for recovering the phase from captured images, which in this work was four, can be obtained from Equation (3), as follows:
where , and correspond to displacements of and , respectively. The phase-recovered is involved. Fortunately, the pictorial surfaces do not present discontinuities, and drift is low. The algorithm we employed in this work was that proposed by Barrientos et al. [38]). They developed a robust method for 2D phase unwrapping using the fast cosine transform. Once the phase is unwrapped, , it is necessary to convert from phase to metric units. The conversion expression is as follows:
where is the phase difference and the equivalent period, calculated using
In the case of paint on canvas, it is necessary to separate the deformation of the canvas from the paint strokes. For this, regional minima of the whole model are detected and interpolated with a fourth-order polynomial. The interpolation contributed by the polynomial represents the overall shape of the canvas. Subtracting the shape of the canvas from the model yields the texture map corresponding to the painting. For more details on the deduction of formulas 1–3 and a description of the phase-stepping technique, we suggest the work published by Zuo et al. [43].
2.4. Resolution Tests on Reference Figures with Known Geometry
Accuracy is a crucial issue in the metrology of paintings on canvas. A high-accuracy 3D map is helpful for the conservation and restoration of works of art. To understand the precision of our digital models, it is necessary to compare them with objects whose dimensions and surface irregularities are perfectly known. For this reason, to calibrate the fringe projection method and make a reliable estimate of the accuracy obtained in the reconstruction of the models, a physical model was constructed as a reference, with the shape, size, and manufacturing accuracy known with high precision.
The model in question was a stepped cylindrical pyramid which was used to test the resolution of the out-of-plane FP method. At the pyramid’s top surface, three slots were made, each with a specific width and depth, to test the in-plane resolution. To minimize alterations produced by scattering, the material used to fabricate this model was dark gray Nylamid®.
The circular pyramid was fabricated with highly accurate step heights. The pyramid is shown in Figure 4C. It had eight steps, with heights of 2.0993 mm, 1.0895 mm, 0.5855 mm, 0.3151 mm, 0.1836 mm, 0.1008 mm, 0.0441 mm, and 0.0141 mm. At the top step, there were three concentric channels with widths of 0.9267 mm, 0.4327 mm, and 0.2325 mm. These channels were used for the “x” and “y” calibration. A detailed diagram is shown in Figure 4A. The heights of the steps and the roughness were accurately confirmed using a high precision digital 3D-touch BFWA 10–45–2/90° roughness meter probe. The accuracy of the height of the pyramid was 25 µm. A profile of the roughness is shown in Figure 4B.
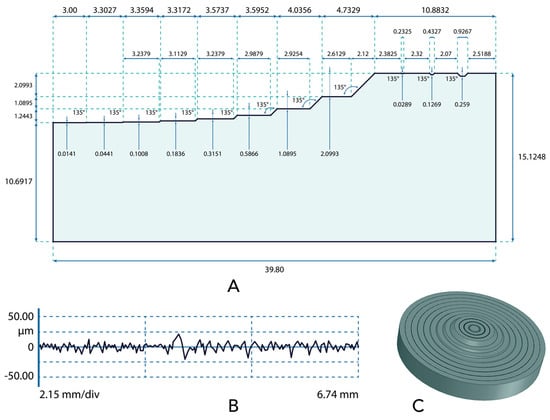
Figure 4.
Circular pyramid (8 steps) used to test fringe projection. This pyramid was manufactured from Nylamid® using a lathe. The top step has three concentric channels which were useful for plane calibration. (A) Detailed diagram of the size of the steps and concentric channels. (B) Roughness profile. (C) Rendering of pyramid.
2.5. Case Study: The Rooster
The painting used in the experimental procedure, The Rooster, is an oil painting on linen canvas painted in part using a spatula technique. It was painted by Pablo Gonzales in 2001 and is 30 cm wide by 40 cm tall. Figure 5 shows a color image of The Rooster.
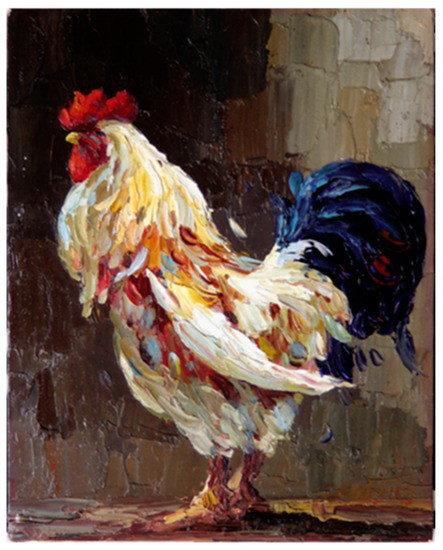
Figure 5.
Color image of the The Rooster (2001) by Pablo Gonzales. Technique: oil with brush and spatula on linen.
This painting presents a number of complex issues in terms of color, with both very dark and very bright areas. The surface of the painting has areas where the paint was applied with a soft-bristled brush, generating a very thin layer, as well as areas with random apices and thickly plastered oil paint, which are typical of the application of oils with a spatula. Thus, the painting covers a variety of possible scenarios.
3. Results and Discussions
This section presents and discusses the results obtained from testing, in different ways, the fringe projection method. The quantitative results obtained by analyzing the reference object whose dimensions and roughness were known with high precision are presented. In addition, a qualitative description of how the method performed on an oil painting with different fringe periods is provided, noting its limits and potential. Typologies of real details of pictorial surfaces that can be observed and measured at the resolution achieved by the method are also described.
3.1. FPS Resolution Limit Test Using a Stepped Cylindrical Pyramid as Reference
In order to test the FP resolution limit and the influence of resolution on the accuracy of the DEM, the pyramid (Figure 4C) was captured, varying the optical sensitivity. Five fringe periods were used: 0.5 mm, 1 mm, 2 mm, 4 mm, and 8 mm. The maximum resolution achieved with the experimental setup was obtained using the 0.5 mm fringe period. Figure 6 shows a capture of the pyramid. Figure 7 shows the reconstructions and profiles of the reference piece using different fringe periods. It can easily be observed that using small periods decreases the residual noise.
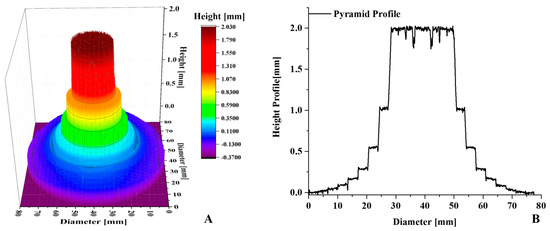
Figure 6.
Example of pyramid reconstruction. (A) Three-dimensional surface plot. (B) Two-dimensional plot using color value. The color is related to the value of the height.
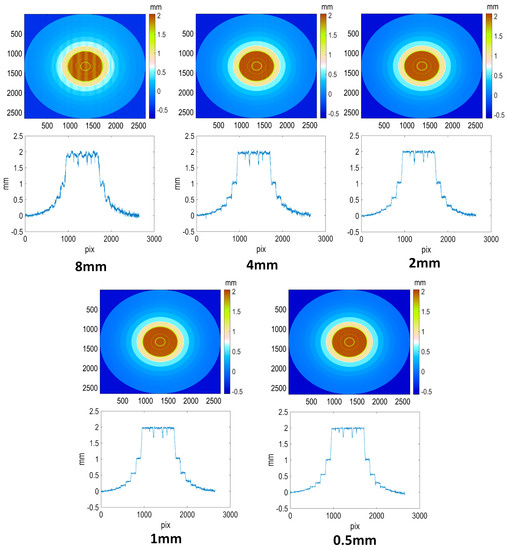
Figure 7.
Reconstruction of the pyramid with different fringe periods.
The image of the three-dimensional model was processed by level sets that corresponded to the steps. At each level set the distribution of heights was obtained. Figure 8A shows an example. This distribution, as expected, has a Gaussian behavior, which enables the degree of uncertainty of the measurements to be determined. Figure 8B shows the mean and standard deviation of the Gaussian distributions of each step.
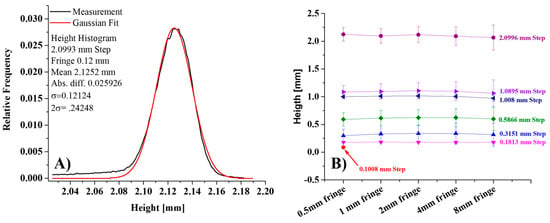
Figure 8.
(A) Distribution of heights for the 2.0993 mm step using the fringe with 0.5 mm period. Measured heights are shown in black and the best fit of a normal distribution in red. (B) Means and standard deviations of all steps and periods.
As seen in Figure 8B, for the five highest steps (≥0.1836 mm), the mean value of the measurement is consistent with the real value, and the standard deviation is smaller when the period is smallest. The 0.0141 mm and 0.0441 mm steps are detectable, but unfortunately the variance is in the order of the step height. This fringe projection setup was able to detect up to 0.1008 mm with high precision and with a degree of uncertainty up to 0.0125 mm.
In addition, to provide the actual resolution of the method, this analysis included an evaluation of how the variation in the period of the fringes influences the resolution of the method. It can be observed that, while a fringe width of 0.5 mm allows all the steps to be perceived and accurately measures the 0.1008 mm step with a fringe period of 1 mm, it is only possible to measure the 0.1813 mm step. Moreover, upon observing the errors associated with the measurements, it can be clearly seen how the uncertainty increases as the period of the fringes become progressively larger.
3.2. Result of the Experimental Arrangement Applied to the Rooster
In the previous section, the results of the quantitative measurement of the reference objects were presented from a methodological point of view. Now, we will show the results from the application of the same techniques to the painting we chose for our case study, giving a qualitative description of how the method performs, its scope, and its potential applications. As we mentioned, The Rooster is an oil painting on linen canvas, painted using in part a spatula technique. This technique generates thick applications of paint with a strong relief that provides a greater dynamic to the painting. Figure 9A is a real color image of the work.
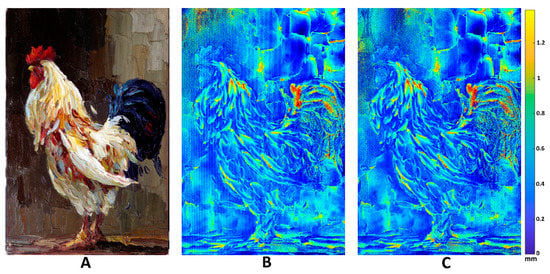
Figure 9.
The Rooster. Oil painting on linen with spatula technique. In (A) RGB color image of the work, in (B) 3D model with false color captured with 2 mm period fringes, and in (C) the model captured with 1 mm fringes.
To show the application of the method, we captured the complete work with two fringe periods: 2 mm, as shown in Figure 9B, and 1 mm, as shown in Figure 9C. We discuss the process at two scales: analyzing the complete model (global) and analyzing a region (local). In the global analysis, we can see that both photographs clearly show where there is thicker paint, applied with a relief effect that results from the angles of the spatula. The texture is relatively thick, for example, in the tail of the rooster. With respect to these characteristics, at the scale considered, there are no distinguishable differences. However, if we perform an analysis focused on certain regions of the painting, we can observe a notable difference between the models. An example can be seen in the upper left corner of the painting.
Figure 10A again shows the original painting. The green frames indicate regions of interest in the chart that have been digitized with fringes of different periods: 1 mm (left-hand column) and 2 mm (right-hand column). These are described below.
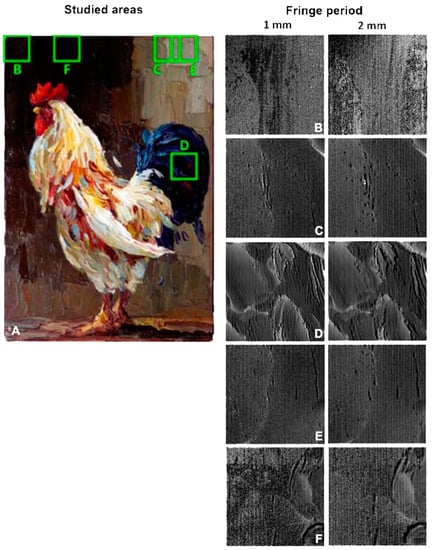
Figure 10.
(A) Within the original color painting, the green boxes indicate the location of the selected areas. For these areas, by the fringe projection method, digital models were obtained using two different fringe steps. (B–F) The two different fringe steps: 1 mm fringe period (left-hand column) and 2 mm (right-hand column). The macroscopic differences in the models, using different fringe steps, can be observed.
Figure 10B shows how changing the fringe period, which corresponds to a change in resolution, produces a significant difference in the image. The changes in the elevation pattern are evident. In Figure 10B with 1 mm stripes (higher resolution), coarse details are not recognized, and a slightly lowered vertical zone (dark stripe) can be noted in the center. It can be seen that this corresponds to a smooth area with little relief. In contrast, in the lower resolution image (2 mm stripes), the deeper central area is completely lost and artifacts appear on the right and left margins of the image where raised areas are indicated that do not actually exist. The reason for these apparent differences is the presence of details below the resolution limit being merged together, creating fictitious detail. In Figure 10C, significant differences can be observed between the images using the 1 mm and those using the 2 mm fringe period. As the period of the fringe increases, a general decrease in resolution is noted, with the disappearance of minute linear details and the appearance of broader, blurred features. Fictitious black crater-like structures, which do not exist in reality, appear in the center of the image along a narrow vertical band. A change in the overall dynamics of the image is also noticeable. It is interesting to note that in the 2 mm fringe image, periodic vertical bands related to the fringes appear. In the image with 1 mm stripes, the vertical bands can be discerned, but they are much less evident. In Figure 10D (1 mm period), very fine details are observed as aligned ridges, with a tendency to verticality, and tiny peaks on the edges of the impasto, which are probably due to irregularities on the edge of the ridges, generated by the spatula and/or the brushstrokes of the base paint which is applied as a base prior to the addition of the figure. Very slight ripples appear against an almost perfectly flat background, as seen in the large smooth gray area at the top left of the image. In the 2 mm fringe image, these very fine details lose their definition and become blurry fringes, hidden by black shadows that are not present in the higher-resolution image. The change in the sharpness of the image is striking. Figure 10E is a typical example whereby, upon decreasing the resolution (2 mm fringes), the pinpoint details become wider and more blurred, and black spots (craters) appear that do not exist in reality. The effect of the longer period is also noticeable in the appearance of a vertical stripe pattern due to the fringes. In Figure 10F, captured in a very darkly pigmented area of the painting, the limit of the fringe projection method is clearly seen. The pattern of vertical lines due to the fringes is visible in both images (1 mm and 2 mm fringe). However, the higher-resolution image (1 mm period) has finer details and the stripes are slightly less visible.
4. Conclusions
In this work, we presented a high-precision experimental method to estimate the accuracy of a capture system based on the fringe projection technique. A reference object with well-defined height levels was fabricated, and an instrument verified the levels with a resolution greater than 10 µm. To estimate the error, a Gaussian distribution was fitted to the heights of the points at each level. Using the best experimental setup (fringe period of 0.5 mm), the lowest detectable level was 0.0441 mm; however, the standard deviation was in the order of step height. The second measurable step was 0.1008 mm with a standard deviation of 0.0125 mm. In this way, it was confirmed that the precision of the method is of the order of one-tenth of a millimeter, a resolution capable of characterizing and measuring most of the details of the technical characteristics of a pictorial surface and conservation state. Some examples of these include the thickness of the paint layers, direction of the brushstrokes, and the variations in relief of the impasto throughout the pictorial surface. In terms of the conservation state, various alterations of the pictorial layer can be observed in close detail, such as microfractures, craquelure pattern, or effects of metal soaps, among others. A resolution of this order of magnitude also makes it possible to perform quantitative measurements of deformations in the painting’s support or to evaluate the effects of conservative interventions (such as consolidating or lining the pictorial surface) in terms of loss of the relief dynamics of the artwork.
Statistical analysis also provided quantitative data concerning the effect of the fringe period on the resolution. Our study showed that increasing the fringe period from 0.5 to 1 mm worsens the resolution from 0.1008 to 0.1813 mm, respectively. Increasing the period of the fringes also considerably increases the uncertainty of the measurements.
A qualitative analysis of the 3D reconstruction of the oil painting The Rooster was carried out as a case study to explore the potential of the method for art restoration. Although it was a challenge to capture this painting with a fringe projection system since it displays a large color dynamic range and areas with high contrast tones, the resulting digital model was of good quality. Visual inspection of the 3D model confirmed that with the resolution used, it is possible to measure, and eventually quantify, thin layers of paint, brushstrokes, fillings, paint detachment, craquelure, metal soaps, state of the fabric, or microfractures in the paint layers generated by the drying or aging processes. In addition, it was possible to learn through visual inspection how the increase in the period of the fringes not only produces a loss of resolution, but also introduces fictitious details, which do not exist in reality and produce appreciable changes in the apparent topography of the paint.
This method has some limitations, such as the appearance of fictitious features due to subsampling, and the presence of bands that appear in the direction of the grid of the fringe. This is a problem that is always present in models obtained by the fringe projection method, although it is significantly reduced by using small fringes or by post-processing with de-striping algorithms. This method may also suffer significant loss of resolution in strong lighting conditions, such as outdoors or in paintings that have very dark, absorbent areas or strong color contrasts.
The experimental estimation, with measurement of the precision error, enabled us to establish a degree of objective certainty in capturing the characteristics and the deterioration of the surfaces of the paintings. This may prove to be of great utility and importance for conserving cultural heritage.
The fringe projection method is very effective for producing digital models of paintings with high precision and in a reasonably short time (minutes to hours, depending on the size and complexity of the artwork). This method is within the reach of any conservation laboratory.
5. Future Developments
This work represents the basis of a series of studies that are being carried out using this methodology. At present, our group is working on a comparative study of the invasiveness of different relining methods. The detailed study of the DEM of the surfaces of four quasi-identical paintings (copies of the same subject and size, produced by the same artist), captured by the fringe projection method before and after the conservative intervention, will be very useful for evaluating the changes introduced by different lining materials to the surfaces of paintings. Another future study will concern the state of conservation of easel paintings. We plan to create a DEM database of the common alteration state of oil painting surfaces. The final goal of this research will be to explore the possibility of automatically recognizing alteration typologies through the use of deep learning methods. Many other studies, in addition to these, could be carried out, taking advantage of the potential of fringe projection methodology.
Author Contributions
Conceptualization, M.d.C.C.P., G.M.C., F.C.R. and D.S.; methodology, M.d.C.C.P., G.M.C., F.C.R., C.M. and B.B.; software, G.M.C., B.B. and C.M.; validation, M.d.C.C.P., G.M.C., F.C.R. and D.S.; formal analysis, M.d.C.C.P., G.M.C., F.C.R. and D.S.; investigation, M.d.C.C.P., G.M.C., F.C.R., D.S. and C.M.; resources, G.M.C., D.S. and B.B.; data curation, G.M.C. and F.C.R.; writing—original draft preparation, M.d.C.C.P., G.M.C., F.C.R. and D.S.; writing—review and editing, M.d.C.C.P., G.M.C., F.C.R., D.S., C.M. and B.B.; figures, M.d.C.C.P., F.C.R., G.M.C., D.S. and C.M.; supervision, G.M.C. and F.C.R.; project administration, G.M.C., D.S. and F.C.R.; funding acquisition, D.S. and G.M.C. All authors have read and agreed to the published version of the manuscript.
Funding
This research was funded by the SEP-PRODEP program which provided the grant for the doctoral studies of M.C. Maria del Carmen Casas Pérez, CONACYT Ciencia Básica N° 286764, directed by L. Borselli, who provided additional research funding.
Acknowledgments
We acknowledge the Centro de Investigación en Optica in León, Guanajuato, the Laboratorio de Analisis de Imagenes y Modelado Analogico of the UASLP, as well as the Maestría en Ciencias del Procesamiento de la Información of the UAZ, for allowing the use of their facilities. We would also like to acknowledge Mildred Quintana Ruiz for her invaluable guidance and Lorenzo Borselli for his support during the laboratory research.
Conflicts of Interest
The authors declare no conflict of interest, and the funders had no role in the design of the study, in the collection, analyses, or interpretation of data, in the writing of the manuscript, nor in the decision to publish the results.
References
- Remondino, F. Heritage recording and 3D modeling with photogrammetry and 3D scanning. Remote Sens. 2011, 3, 1104–1138. [Google Scholar] [CrossRef]
- Mara, H.; Kampel, M.; Niccolucci, F.; Sablatnig, R. Ancient coins & ceramics–3D and 2D documentation for preservation and retrieval of lost heritage. In Proceedings of the 2nd ISPRS International Workshop 3D-ARCH: 3D Virtual Reconstruction and Visualization of Complex Architectures, Zurich, Switzerland, 12–13 July 2007; pp. 12–13. [Google Scholar]
- Lerma, J.L.; Muir, C. Evaluating the 3D documentation of an early Christian upright stone with carvings from Scotland with multiples images. J. Archaeol. Sci. 2014, 46, 311–318. [Google Scholar] [CrossRef]
- Sansoni, G.; Trebeschi, M.; Docchio, F. State-of-the-art and applications of 3D imaging sensors in industry, cultural heritage, medicine, and criminal investigation. Sensors 2009, 9, 568–601. [Google Scholar] [CrossRef]
- West, J.; Kuk, G. The complementarity of openness: How MakerBot leveraged Thingiverse in 3D printing. Technol. Forecast. Soc. Change 2016, 102, 169–181. [Google Scholar] [CrossRef]
- Inzerillo, L.; Di Paola, F. From SFM to 3D PRINT: Automated workflow addressed to practitioner aimed at the conservation and restauration. Int. Arch. Photogramm. Remote Sens. Spat. Inf. Sci. 2017, 42, 375–382. [Google Scholar] [CrossRef]
- Múnera, E.M.; Salazar, J.F.R.; Bedoya, J.W.B. Construcción de un modelo digital 3D de piezas precolombinas utilizando escaneo láser. Rev. Av. Sist. Inf. 2010, 7, 197–206. [Google Scholar]
- Pieraccini, M.; Guidi, G.; Atzeni, C. 3D digitizing of cultural heritage. J. Cult. Herit. 2001, 2, 63–70. [Google Scholar] [CrossRef]
- Fabris, M.; Achilli, V.; Bragagnolo, D.; Manin, A.; Salemi, G. Laser scanning methodology for the structural modelling. In Proceedings of the XXI International CIPA Symposium, Athens, Greece, 1–6 October 2007. [Google Scholar]
- Pierrot-Deseilligny, M.; De Luca, L.; Remondino, F. Automated image-based procedures for accurate artifacts 3D modeling and orthoimage generation. Geoinformatics FCE CTU 2011, 6, 291–299. [Google Scholar] [CrossRef]
- Kuzminsky, S.C.; Gardiner, M.S. Three-dimensional laser scanning: Potential uses for museum conservation and scientific research. J. Archaeol. Sci. 2012, 39, 2744–2751. [Google Scholar] [CrossRef]
- Tucci, G.; Bonora, V.; Conti, A.; Fiorini, L. High-quality 3D models and their use in a cultural heritage conservation project. Int. Arch. Photogramm. Remote Sens. Spat. Inf. Sci. 2017, 42, 687–693. [Google Scholar] [CrossRef]
- Gabellone, F.; Ferrari, I.; Giuri, F. Digital restoration using Image-Based 3D models. In Proceedings of the 1st International Conference on Metrology for Archaeology, Benevento, Italy, 22–25 October 2015; pp. 478–482. [Google Scholar]
- Remondino, F.; El-Hakim, S. Image-based 3D modelling: A review. Photogramm. Rec. 2006, 21, 269–291. [Google Scholar] [CrossRef]
- Elkhuizen, W.S.; Callewaert, T.W.J.; Leonhardt, E.; Vandivere, A.; Song, Y.; Pont, S.C.; Geraedts, J.M.P.; Dik, J. Comparison of three 3D scanning techniques for paintings, as applied to Vermeer’s ‘Girl with a Pearl Earring’. Herit. Sci. 2019, 7, 89. [Google Scholar] [CrossRef]
- Jevenois, A.V. La pintura Sobre Tela: Historiografía, Técnicas y Materiales; Editorial Nerea: Bilbao, Spain, 2004; Volume 1, p. 426. [Google Scholar]
- Mayer, R. Materiales y Técnicas del Arte; Ediciones Akal: Mexico City, Mexico, 2005; Volume 28, p. 704. [Google Scholar]
- Calvo, A. Conservación y Restauración: Materiales, Técnicas y Procedimientos: De la A a la Z; Editorial SERBAL: Barcelona, Spain, 1997; p. 256. [Google Scholar]
- Giannini, C.; Roani, R. Diccionario de Restauración y Diagnóstico; Editorial Nerea: Bilbao, Spain, 2008; Volume 14, p. 224. [Google Scholar]
- Casas-Pérez, M.D.C.; Sarocchi, D. El análisis de imágenes como instrumento diagnóstico del estado de conservación: Su aplicación a la pintura con soporte lapídeo de la Virgen de Analco, Puebla. Intervención 2012, 3, 18–25. [Google Scholar]
- Bellucci, R.; Ciatti, M.; Frosinini, C.; Parri, M.; Sostegni, L. La fondazione ‘Primo Conti’: Da un cantiere della scuola alle misure di conservazione preventiva. Il restauro dell’arte contemporanea. OPD Restauro 2002, 14, 56–72. [Google Scholar]
- Scicolone, G.C. Restauración de la Pintura Contemporánea; Editorial Nerea: Bilbao, Spain, 2002; Volume 8, p. 256. [Google Scholar]
- Chen, L.C.; Huang, C.C. Miniaturized 3D surface profilometer using digital fringe projection. Meas. Sci. Technol. 2005, 16, 1061. [Google Scholar] [CrossRef]
- Wang, S.; Tay, C.J.; Quan, C.; Shang, H.M. Investigation of membrane deformation by a fringe projection method. Appl. Opt. 2002, 41, 101–107. [Google Scholar] [CrossRef]
- He, X.Y.; Sun, W.; Zheng, X.; Nie, M. Static and dynamic deformation measurements of micro beams by the technique of digital image correlation. In Key Engineering Materials; Trans Tech Publications Ltd.: Wollerau, Switzerland, 2006; Volume 326, pp. 211–214. [Google Scholar]
- De Angelis, M.; De Nicola, S.; Ferraro, P.; Finizio, A.; Pierattini, G. Liquid refractometer based on interferometric fringe projection. Opt. Commun. 2000, 175, 315–321. [Google Scholar] [CrossRef]
- Zhang, Q.C.; Su, X.Y. An optical measurement of vortex shape at a free surface. Opt. Laser Technol. 2002, 34, 107–113. [Google Scholar] [CrossRef]
- Cobelli, P.J.; Maurel, A.; Pagneux, V.; Petitjeans, P. Global measurement of water waves by Fourier transform profilometry. Exp. Fluids 2009, 46, 1037–1047. [Google Scholar] [CrossRef]
- Huang, P.S.; Jin, F.; Chiang, F.P. Quantitative evaluation of corrosion by a digital fringe projection technique. Opt. Lasers Eng. 1999, 31, 371–380. [Google Scholar] [CrossRef]
- Jang, P.R.; Arunkumar, R.; Leone, T.; Long, Z.; Mott, M.A.; Norton, O.P.; Ettien, J. Quantitative imaging characterization of aluminum pit corrosion in Oak Ridge research reactor pool. In Advanced Environmental, Chemical, and Biological Sensing Technologies; SPIE: Bellingham, WA, USA, 2006; Volume 6377, pp. 162–173. [Google Scholar]
- López Domínguez, Y.Y.; Martínez, A.; Rayas, J.A. Topometry and color association by RGB Fringe Projection Technique. Rev. Mex. Fís. 2014, 60, 109–113. [Google Scholar]
- Martínez, A.; Rayas, J.A.; Flores, M.J.M.; Rodríguez Vera, R.; Donato Aguayo, D. Técnicas ópticas para el contorno de superficies tridimensionales. Rev. Mex. Fís. 2005, 51, 431–436. [Google Scholar]
- Nava-Vega, A.; Salinas-Luna, J.; Luna, E.; Nuñez, J.M. Phase map by fringe projection with dammann gratings: An application to measure small objects. Rev. Mex. Fís. 2015, 61, 330–337. [Google Scholar]
- Gorthi, S.S.; Rastogi, P. Fringe projection techniques: Whither we are? Opt. Lasers Eng. 2010, 48, 133–140. [Google Scholar] [CrossRef]
- Srinivasan, V.; Liu, H.C.; Halioua, M. Automated phase-measuring profilometry of 3-D diffuse objects. Appl. Opt. 1984, 23, 3105–3108. [Google Scholar] [CrossRef] [PubMed]
- Li, J.; Su, X.; Guo, L. Improved Fourier transform profilometry for the automatic measurement of 3D object shapes. Opt. Eng. 1990, 29, 1439–1444. [Google Scholar]
- Jia, P.; Kofman, J.; English, C. Two-step triangular-pattern phase-shifting method for three-dimensional object-shape measurement. Opt. Eng. 2007, 46, 083201. [Google Scholar]
- Barrientos, B.; Mares, C.; Sarocchi, D.; Cerca, M.; Valdivia, R. Dynamic three-dimensional displacement analysis of small-scale granular flows by fringe projection and digital image correlation. Landslides 2020, 17, 825–837. [Google Scholar] [CrossRef]
- Borg, B.; Dunn, M.; Ang, A.; Villis, C. The application of state-of-the-art technologies to support artwork conservation: Literature review. J. Cult. Herit. 2020, 44, 239–259. [Google Scholar] [CrossRef]
- Chen, C.; Wang, H.; Zhang, Z.; Gao, F. Three-dimensional reconstruction from a fringe projection method system through a planar transparent medium. Opt. Express 2022, 30, 34824–34834. [Google Scholar] [CrossRef]
- Abzala, A.; Saadatsereshta, M.; Varshosazb, M.; Remondino, F. Development of an automatic map drawing system for ancient bas-reliefs. J. Cult. Herit. 2020, 45, 204–214. [Google Scholar] [CrossRef]
- Li, Y.; Qian, J.; Feng, S.; Chen, Q.; Zuo, C. Composite fringe projection deep learning profilometry for single-shot absolute 3D shape measurement. Opt. Express 2020, 30, 3424–3442. [Google Scholar] [CrossRef] [PubMed]
- Zuo, C.; Feng, S.; Huang, L.; Tao, T.; Yin, W.; Chen, Q. Phase shifting algorithms for fringe projection profilometry: A review. Opt. Lasers Eng. 2018, 109, 23–59. [Google Scholar] [CrossRef]
Disclaimer/Publisher’s Note: The statements, opinions and data contained in all publications are solely those of the individual author(s) and contributor(s) and not of MDPI and/or the editor(s). MDPI and/or the editor(s) disclaim responsibility for any injury to people or property resulting from any ideas, methods, instructions or products referred to in the content. |
© 2023 by the authors. Licensee MDPI, Basel, Switzerland. This article is an open access article distributed under the terms and conditions of the Creative Commons Attribution (CC BY) license (https://creativecommons.org/licenses/by/4.0/).