1. Introduction
Paper materials and works of art on paper represent a large portion of museum, archive, and library collections, including drawings, watercolors, prints, books, and manuscripts. Despite their prevalence, paper materials are infrequently the subject of technical studies due to inherent limitations in their analysis, such as the fragility of the paper substrate, a lack of suitable sampling opportunities, and the presence of mixed, but chemically similar cellulosic materials.
There are many potential questions a technical study of paper and works on paper can answer. It can be useful to understand the composition (furnish) of a paper substrate in terms of the raw fiber material (cotton, wood, linen, etc.), chemical treatments (gelatin, starch, or alum sizing), fillers (such as clay), and lignin content (an organic compound present in certain fibers). This information may inform conservation treatments, stability predictions, and provenance research. To date, most of these questions have been answered through invasive or micro-destructive analysis [
1], including micro sampling for fiber identification with polarized light microscopy or chemical spot testing, such as the Biuret test, which uses aqueous copper (II) sulfate in a basic aqueous solution to detect proteins, indicating the presence of gelatin. The nature of these tests limits which objects can be studied.
A non-destructive analysis is always preferential for conservation research of collection materials [
2,
3,
4]. Fourier-transform infrared (FTIR) spectroscopy is a particularly suitable analytical chemistry technique to detect and identify the organic materials present in paper and works of art on paper [
5,
6,
7,
8,
9,
10,
11]. Since the resulting vibrational spectra are cumulative representations of all materials present, it can be difficult to discern minor peaks among the bulk cellulose signal, as well as subtle variations within the cellulose signal. These small differences, however, are significant for material identification and classification; however, the human eye alone cannot make reliable distinctions in the patterns of the spectra.
With FTIR, identifications are usually made by interpreting individual peaks or comparing the spectrum to reference spectral libraries of known compounds. Computers are used to carry out this pattern matching task; however, the correlation algorithms used in pattern matching heavily weight the identification matches to the largest peaks in the spectra. For paper materials, the FTIR spectra are usually dominated by large cellulosic peaks. Minor chemical components with small peak contributions to the overall spectra, such as the sizing material used in the paper, end up being ignored by the spectral library matching algorithms. This means that with straight spectral library matching, all papers often end up being identified as the same.
This manuscript explores the application of principal component analysis (PCA), a method of data processing and analysis to determine correlations between measurements. The data can be processed in a way that ignores the commonalities between the spectra and highlights the systematic differences. Specifically, here, for instance, the cellulosic spectral contribution can be ignored and the signal from the materials used for paper sizing can be highlighted and explored.
The sample set for this research was mainly the Paper and Mediums Study Collection from Legacy Press compiled by Cathleen Baker (
http://www.thelegacypress.com/study-collection.html, accessed on 1 September 2021). It consists of American and European book and writing papers from the 18th to the 21st centuries. It has previously been subjected to fiber analysis and chemical tests for gelatin, starch, and lignin following standard methods in the field of paper conservation. The known sample set was supplemented with alum sized papers from Debora Mayer’s personal collection and pure fiber pulp stock samples from Walter Rantanen.
The analysis reported in this manuscript will demonstrate that the PCA model of the specular reflection FTIR spectra can provide the same information as the chemical tests- if not even better, providing a plausible alternative method for identification that does not require destructive testing and can be applied to a wider range of objects.
1.1. Spectroscopy Data Collection Methods
The FTIR spectra for this manuscript were collected using a non-contact specular reflectance method which avoids any risk of damage to the sample, making the technique suitable for fragile objects, and yet it provides rich molecular information about the object, as previously demonstrated by McClelland et al. in the analysis of coatings on historic salted paper prints [
12].
Raman spectroscopy is the other optical vibrational spectroscopy analytical chemistry technique often used in the analysis of museum and library collections. It is also completely non-contact and provides similar molecular information to FTIR. However, Raman spectroscopy can suffer spectral interference from fluorescence in the object under investigation and it is, in general, not suitable in the analysis of papers as cellulosic materials tend to exhibit high amounts of fluorescence. Additionally, Raman spectroscopy uses highly focused laser light and is therefore not ideal for possibly photosensitive materials.
Attenuated total reflection instruments (ATR-FTIR) have been used extensively in cultural heritage analytical research; however, the ATR-FTIR requires intimate contact between the ATR crystal and the material, causing small dents in paper supports. In the end, different ATR-FTIR approaches all involve either sampling the object or the potential risk of permanently distorting soft materials such as paper. ATR-FTIR does have the distinct advantage over specular reflection FTIR of decades of reference spectra already existing in spectral reference libraries. For instance, a comprehensive library of reference spectra of ATR-FTIR and Raman spectra for cultural heritage materials has been built through the Infrared and Raman User Group (IRUG) [
13,
14]. The PCA techniques presented here could certainly be applied to ATR-FTIR or Raman spectral data sets. For this manuscript, the question was about how much information could be extracted specifically from the specular reflection FTIR spectra.
Although infrared peak positions are based on the energy of the molecular bonds and do not change significantly between data collection modes, the peak shape and intensity will be strongly affected based on the method used. As such, an ATR-FTIR reference spectrum will not be directly comparable to an external reflectance spectrum. Ideally, a separate spectral reference library would be available where the reference and sample materials were scanned using the same type of instrument. A more thorough discussion of FTIR analysis and applications in cultural heritage can be found in McClelland et al. [
12].
1.2. Principal Component Analysis (PCA)
PCA can be applied to many kinds of data, including spectra, and enables the visualization of relationships that may not be obvious to the eye alone, eliminating bias imposed by human interpretation. In recent years, PCA has been applied in cultural heritage research to FTIR spectra of degrading plastics [
15], Raman spectra of drawing media in drawings by the artist Odilon Redon [
16], various properties of 19th and 20th century Chinese papers including pH and tensile strength [
17], NMR spectra of 13th-15th century Italian paper [
18], microspectrofluorimetry of lake pigments [
19], and FTIR spectra of archaeological Aztec resins [
20]. This list, while not exhaustive, demonstrates the value of PCA applied to different types of data sets in cultural heritage as non-invasive analysis and material characterization techniques continue to improve.
A PCA model is generated by organizing the data in a matrix, effectively a table, where each sample becomes a row and each column a measurement. For FTIR spectra, each row is an individual spectrum, and each column is the spectral response at a particular wavenumber. Linear algebra algorithms are then applied to the data matrix to find the eigenvalues and eigenvectors. The eigenvectors are referred to as the principal components (PCs). The eigenvalues are referred to as the loadings. In practice, a computer takes care of all the calculations with relatively little user input needed other than correctly organizing the data into a table of samples versus measurements.
The PCA model will depend on the samples that were included in the matrix. In general, the more data available when building the model, the more robust the model will be. It is usually best to start with a collection of known and well-characterized samples and then try to apply the model built with the known samples to unknown objects.
The PCs can be thought of as a new basis set that is a better description for the original data set. A familiar example of using a different basis set to better describe the real-world is the use of longitude and latitude to describe positions on the surface of the earth, rather than Cartesian (x, y, z) coordinates from the center of the earth. The PCs are a new coordinate system that is made up of a linear combination of the different weightings of each of the measurements in the original data matrix that best describe the variance in the data. The different weightings are called the loadings. The PCs are numbered based on the amount of variance they represent, so PC 1 will represent more variance than PC 2 and so on. Variance is the statistical measure of how much spread the data set has along a specific PC. The total number of PCs will vary based on the complexity of the data set, and all PCs may not be significant. It is certainly possible to overfit the data and model the noise in the data set.
The PCA models also generate a Q residual value, which represents how well that sample fits to the model, and a Hotelling T-squared value that shows how far from the center of the model a particular sample lies. Looking for samples with high Q residuals and T-squared values is usually an easy way to spot outliers in the data set.
Prior to building a model, it is usually necessary to preprocess the sample data. Preprocessing treatment of raw data can have a significant effect on the strength of the model, since PCA models work best with linear relationships. Preprocessing the data describes any process applied to the data prior to modeling, including normalization, variable centering, mathematical operations, and scaling. This treatment removes extraneous variation, for example, signal artifacts from the instrument, and linearizes relationships between variables. Spectral data can usually be improved with baseline corrections and mean centering the data. In FTIR, there is often a baseline offset from light that is scattered out of the optical collection path. This scattering usually has a weak wavelength dependence leading to a sloping baseline on the data. On paper media, the roughness of the paper contributes to the baseline offset as light is scattered out of the optical collection path of the microscope. Since the baseline shape does not contain chemical information about the object, it can be fitted to a polynomial and subtracted from the spectra. Mean centering is a data processing technique where the average (mean) of the entire data set is subtracted from each individual spectrum in the data set. This has the effect of suppressing what is the same between all the spectra and highlighting what is different.
2. Materials and Methods
2.1. Specular Reflectance FTIR Spectroscopy
This research employed a Bruker LUMOS FTIR microscope with a liquid nitrogen cooled mercury cadmium telluride (MCT) detector from 4000 to 600 cm−1 in specular reflectance mode at the Harvard Center for Nanoscale Systems (CNS). The technique is fully non-contact, and the system allows for multiple points in the analysis area to be selected and scanned. The microscope and camera allowed the close examination of the analysis area and documentation of the visual appearance. Thirty points were collected from each sample (fifteen each from two areas of the paper) to ensure statistical representation within the data model. Each point of data was collected from the default area size of 125 × 126 microns and was the average of 16 scans at 4 cm−1 spectral resolution. The background was taken against the built-in gold reference mirror on the instrument sample stage. Data collection was carried out using the accompanying Bruker OPUS software. Spectra were baseline corrected in Opus using the rubber band method.
2.2. Sample Material and Classification
Areas for spectral analysis were selected based on an absence of stains, foxing, print, ruling, or other visual irregularities. Spectra were collected from known papers from a range of sources. The Legacy Press Paper and Mediums Study Collection was the primary source of reference material. The collection, released in 2016 and compiled by Cathleen Baker, contains 42 examples of book paper and 21 examples of writing paper made from the 18th–21st centuries in Europe and North America. The papers were subject to chemical tests by Baker for protein (Biuret test), starch (iodine-potassium iodide), and lignin (phloroglucinol). The fiber content was assessed by Integrated Paper Services, Inc. The results of these investigations were included with the collection which enabled data correlation with the FTIR spectra. The decision to use the Legacy Press Collection of papers was made because it is a curated collection of papers that many art conservation labs have and can be referenced and studied by other researchers. Using known collections allows a comparison of test results and adds to the shared understanding of these papers, which are studied in art conservation training programs. This project took advantage of the testing already conducted for sizing, lignin, and fiber composition which is recorded with the collection. No additional testing was performed on these papers, such as filler content.
The alum sized papers were artists papers from the 1970s with 100% rag fiber content (cotton) from Debora Mayer’s collection, and included Lenox 100 (Rising Co., Housatonic, MA, USA), Fabriano 5 watercolor paper (Fabriano, Italy) and BFK Rives printmaking paper (Rives, France).
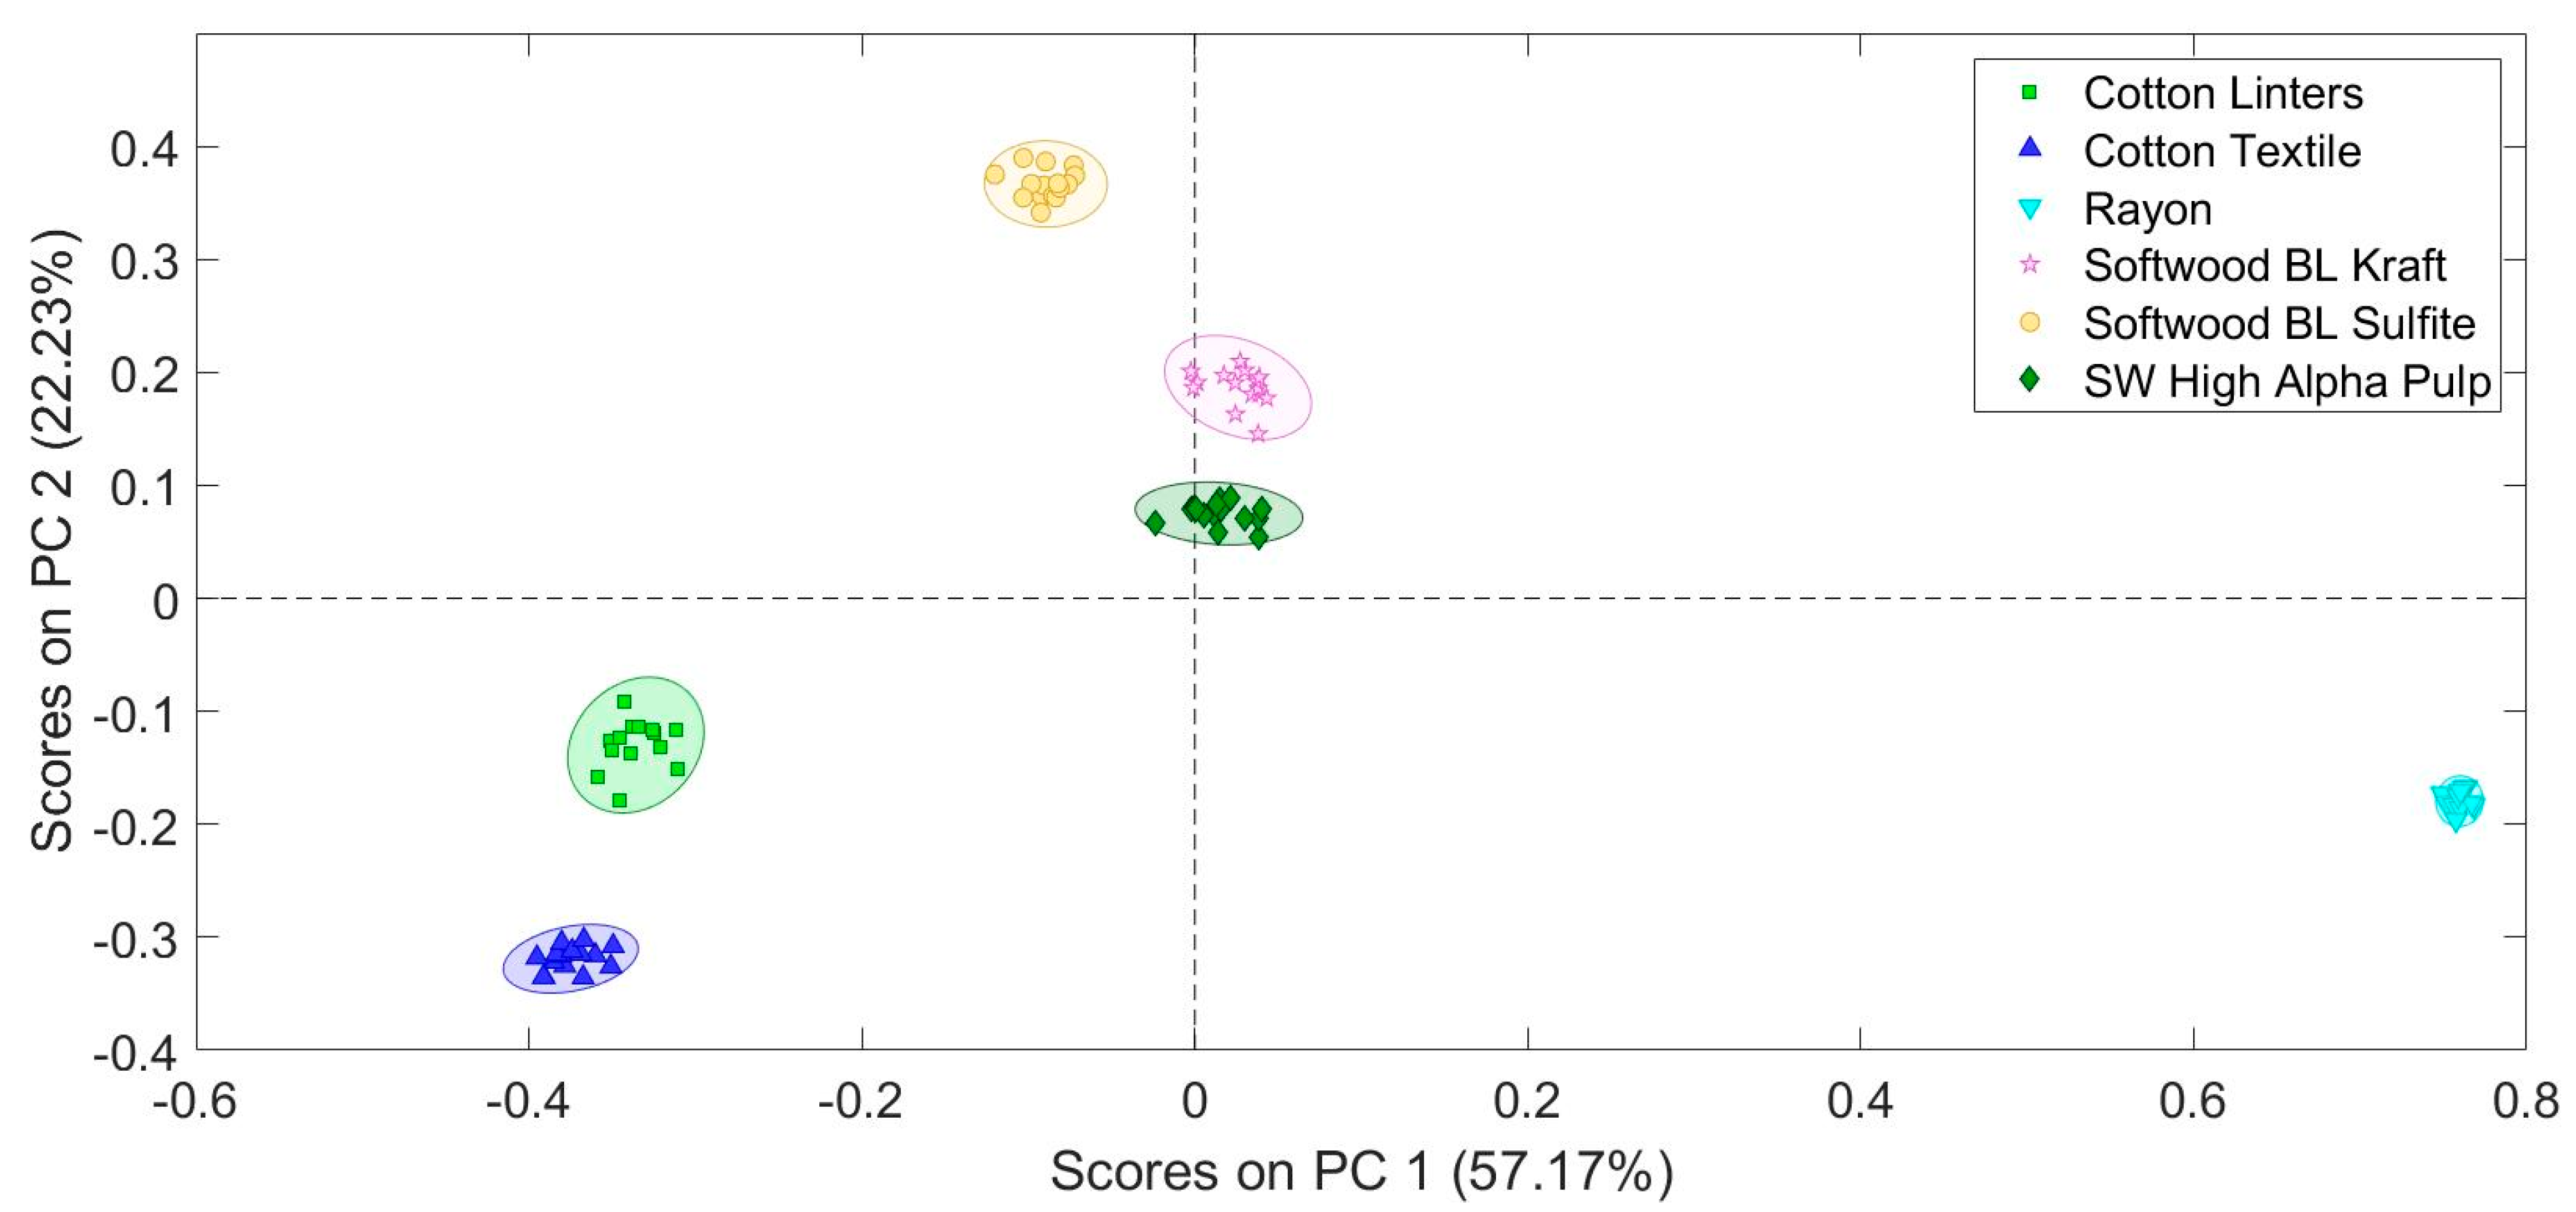
The first step in the project was to take fiber samples of high cellulose content (fibers with no or extremely low lignin content) and determine if they could be readily separated using this model. The fiber groups first tested were pure pulp stock reference materials including cotton linter fibers, cotton textile fibers, rayon fibers, softwood bleached (BL) kraft fibers, softwood bleached (BL) sulfite fibers, and softwood high alpha pulp fibers. The samples were provided by Walter Rantanen, SGS-IPS Testing.
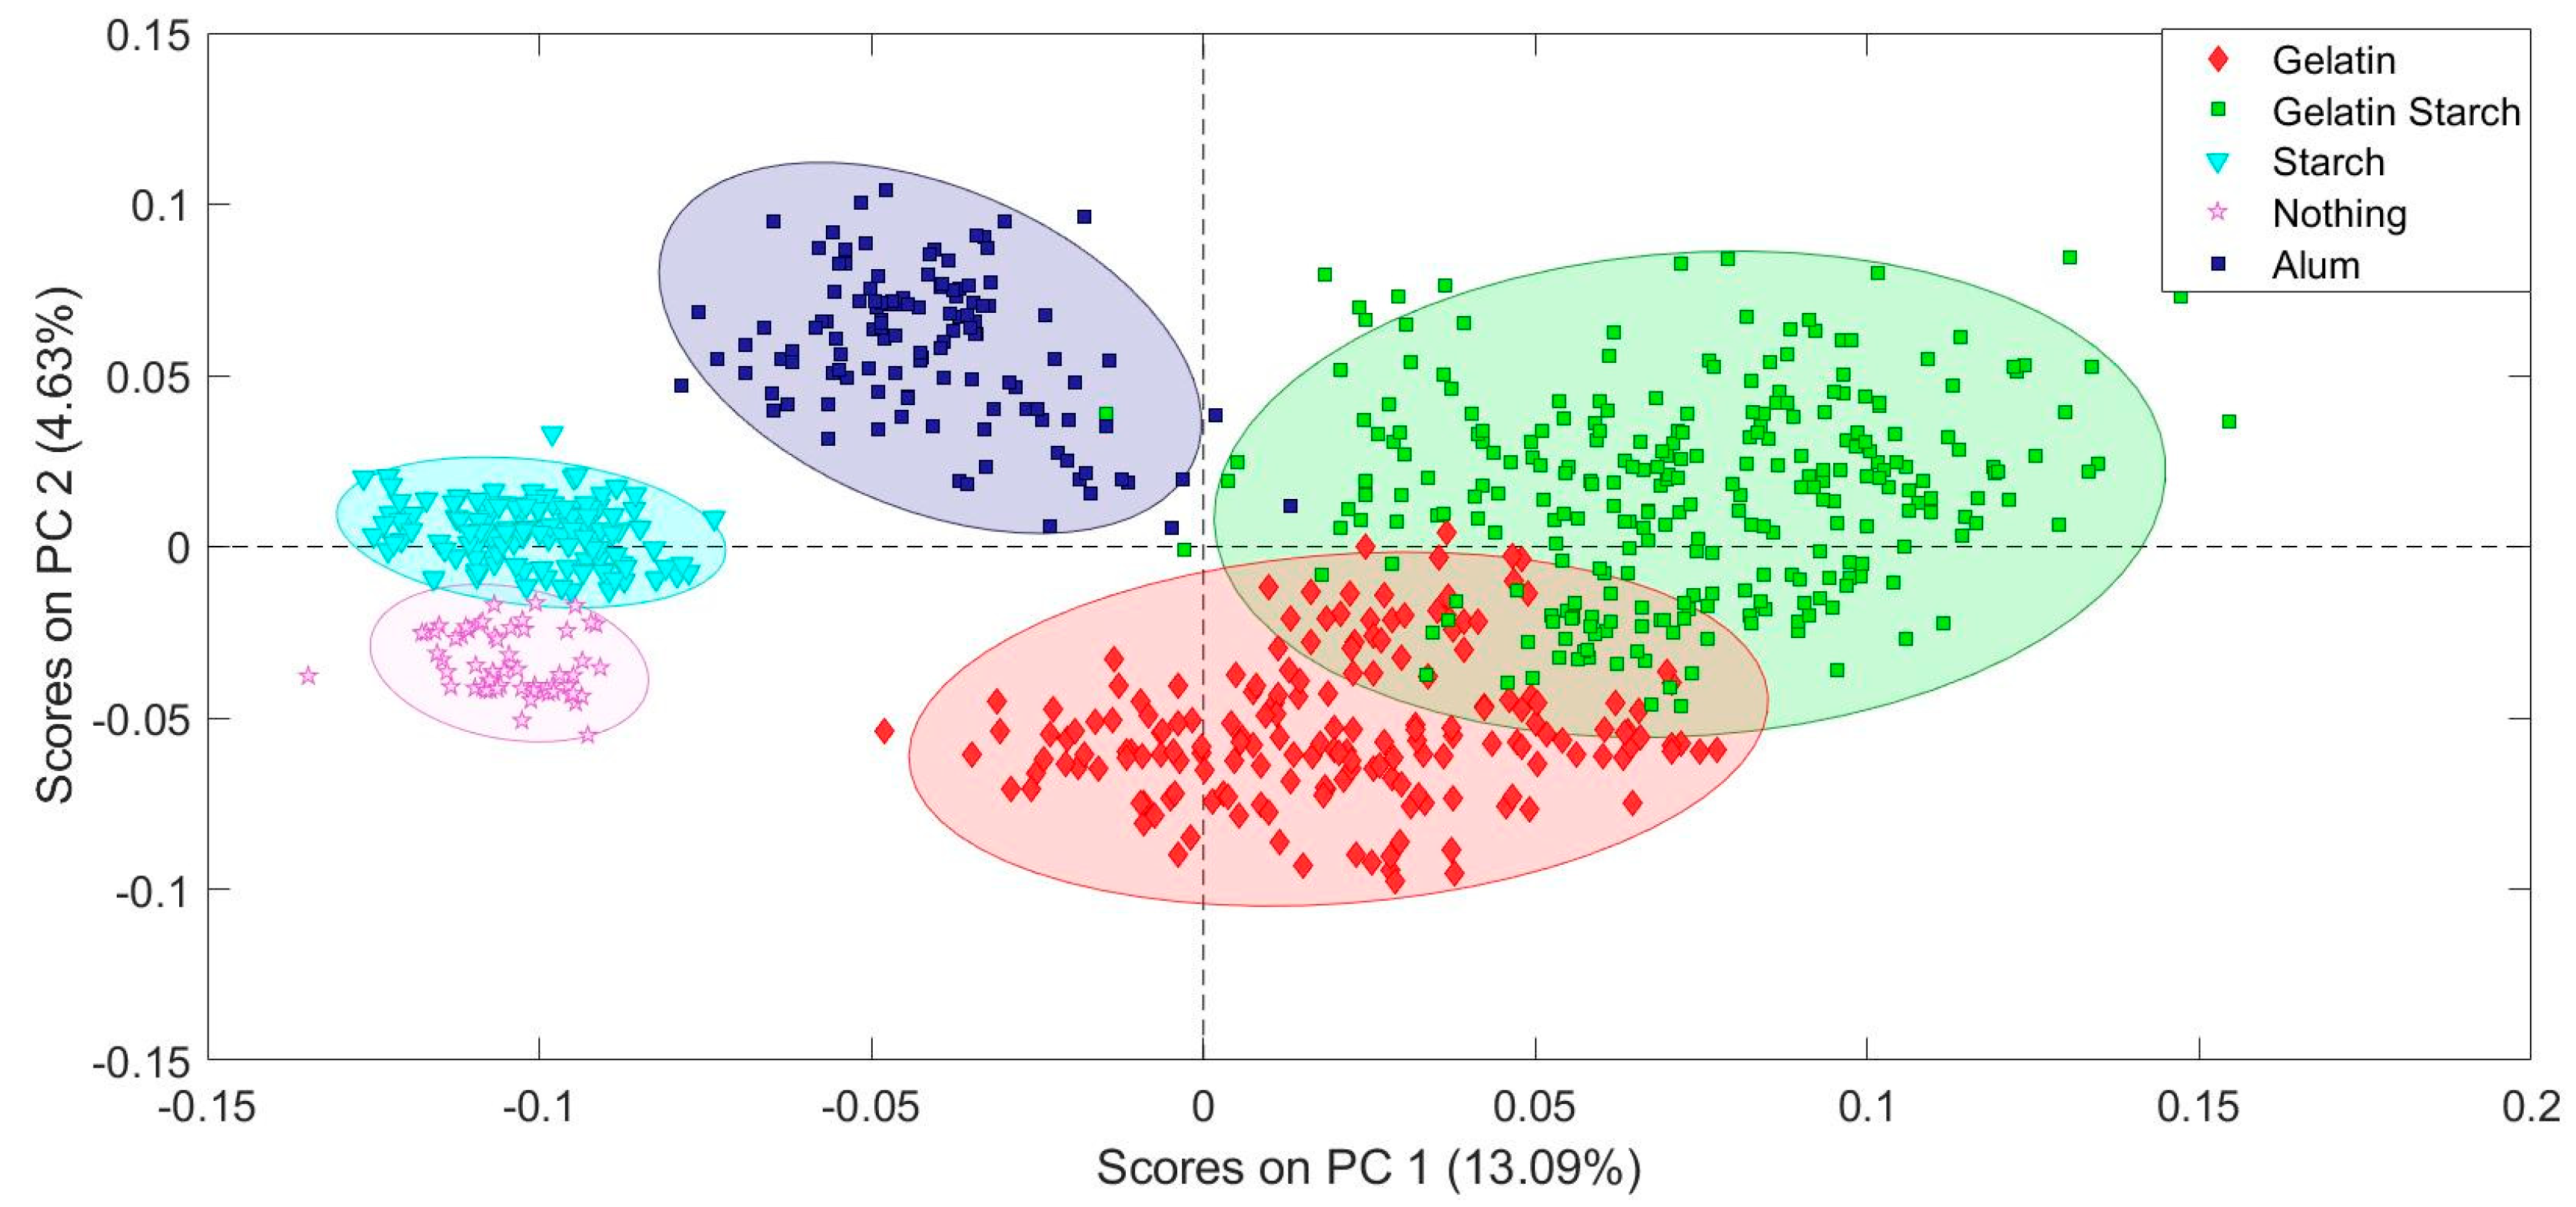
The samples were assigned classes, the term used for a group of known samples that are the same chemically. Initial modeling was carried out with the data from the 21 writing paper samples because there was more variability in the test results than in the results for the book paper samples. A positive result for gelatin (G), starch (S), or lignin (L) was used for the model’s classes. For example, the SL class all tested positive for starch and lignin but not gelatin. The N class had a negative result for all three chemical tests.
The writing paper samples, results, and classes are given in
Table 1. Manufacture dates and sample letters are from the notes accompanying the collection. The number of samples in each class is: N (1), L (1), S (3), SL (1), GS (7), GL (6), GSL (2). There were unfortunately no samples that tested positive for gelatin only.
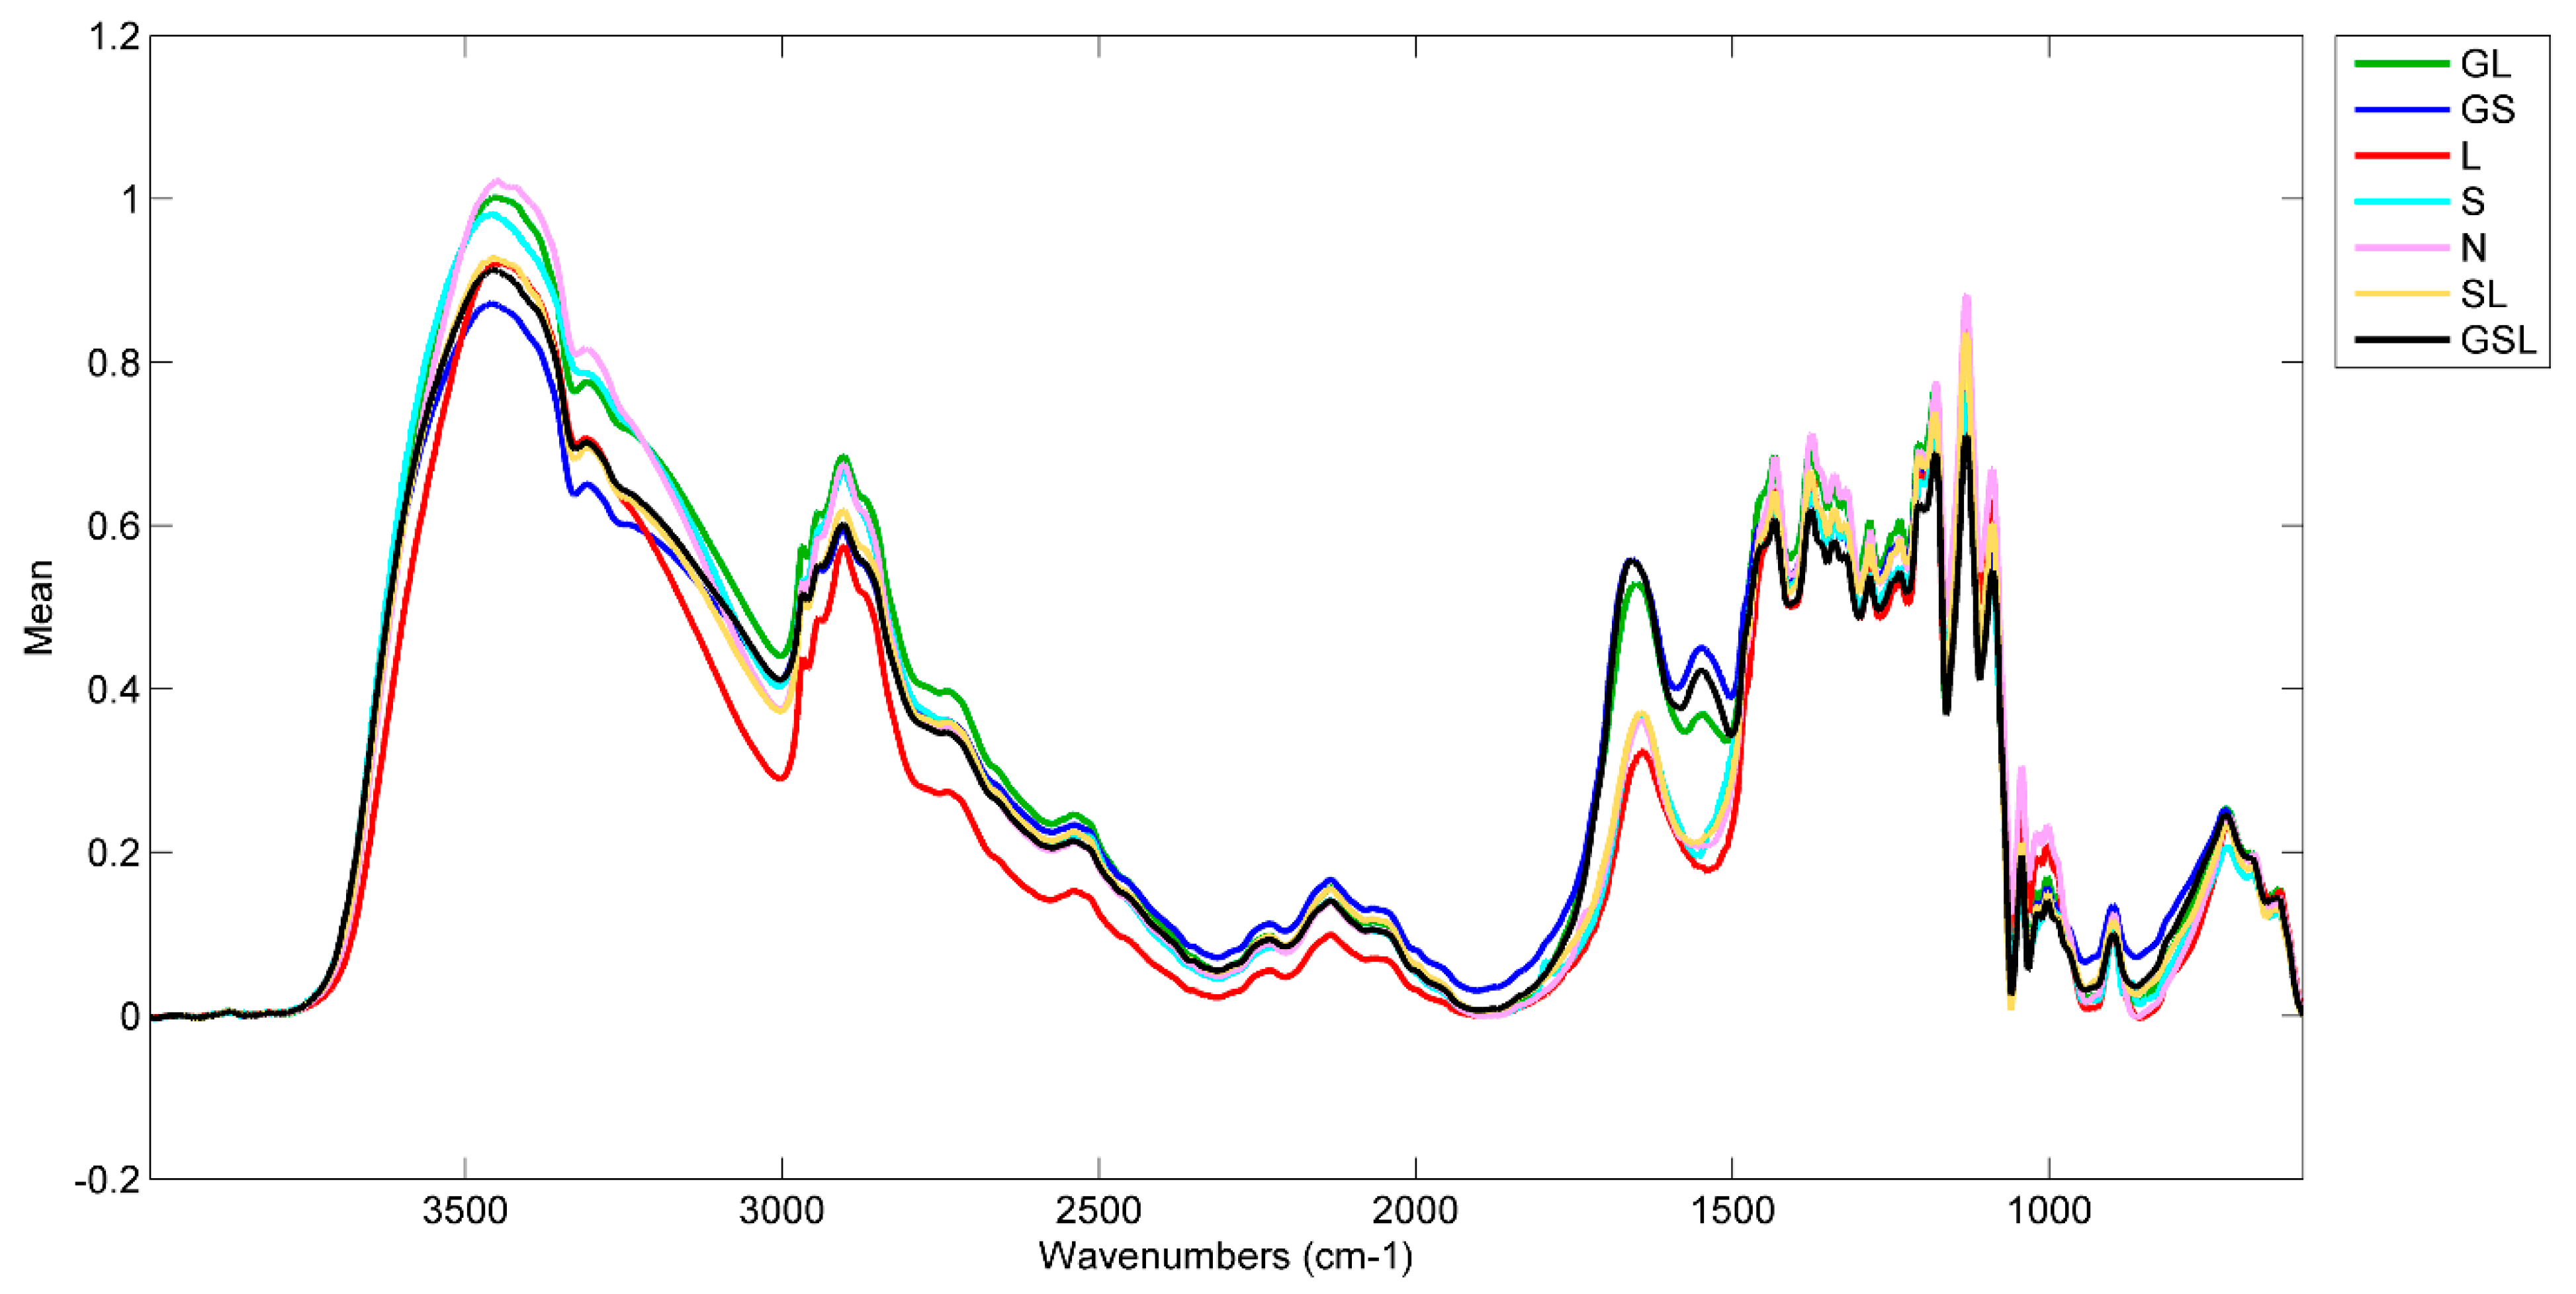
Figure 1 shows an average spectrum for each class prior to preprocessing. The most obvious difference in spectra is the proteinaceous amide I and II peaks from 1550 to 1650 cm
−1 for the GL, GS, and GSL classes. In the -OH stretching region from 3000–3400 cm
−1, the slope of the GS spectrum is shallower than that of the other classes. The remaining variance across the spectra is less distinct and difficult to characterize by peak position and shape alone, hence the application of PCA. With data science classification techniques, such as PCA, it is not necessary to try to parse and assign each peak in a spectrum. The shape of the spectra can be viewed as a wholistic signature of a paper’s specific chemical composition. Spectral processing techniques such as the Kubelka-Munk or Kramers-Kronig transforms are not necessary if the PCA model is built with data that is collected in the same method as the data from the unknown objects.
Of the 10 positive listings for lignin, only one was a moderate test result (Paper C). The other 9 were noted as slight or very slight test results.
2.3. Modeling
Modeling was carried out using the Solo software from Eigenvector Research Incorporated. The spectra were imported into the software and class assignments entered, first based solely on the results of the sizing in the paper. A second model was made including the known information about the sizing and the fiber types. A range of preprocessing conditions were tested to optimize the predictive capability of the model. The order of preprocessing steps does affect the outcome of the resultant model.
For spectral data, sources of variation that can obscure information of interest include measurement noise, baseline variation, and environmental CO2 to name a few. These signals are often referred to as clutter and they make the modeling less robust. A strong model will show clustering within an assigned class, while individual classes are reasonably separated within the model space. Proper preprocessing can help minimize the clutter and tighten the clustering of the classes by just keeping the variance of interest in the data set and ignoring the variance that is not of interest.
For these spectra, the baselines were first corrected in OPUS using the rubber band method. Next, in Solo, a multiplicative signal correction (MSC) was applied as a weighted normalization treatment to remove magnitude variability. The MSC algorithm also performs a baseline removal, but better results were obtained using the OPUS baseline removal tool prior to importing the data into Solo. The weighted normalization treatment determines the weighting scale factor by regressing a measured spectrum against a reference spectrum calculated from the mean of the data, then correcting the spectrum using the slope and intercept of the fit. MSC can be applied to the mean or the median of the data. For this project the MSC (mean) algorithm was used.
Next, generalized least squares weighting (GLSW) was applied to the data. GLSW is a decluttering treatment where the data are weighted by the inverse square root of the clutter covariance. The weighting factor can be adjusted, with lower thresholds going further into the features from minor components. A GLSW threshold of 0.05 was found to give the tightest clustering of the classes with this data set. The GLSW algorithm shrinks the clutter dimensions without fully removing them, so any actual variance caught in the clutter calculation will still have some representation in the model. It does not account for magnitude difference, so it should be applied after a normalization process such as MSC.
“Clutter” is variance in the data that is not relevant to the question at hand. For example, in this case, the fiber type information would be “clutter”, since the question was about whether there was gelatin, lignin, or starch in the object. The same FTIR data could be arranged into classes based on the fiber type and then the gelatin, lignin, and starch signals would be the “clutter”.
Finally, the data were mean centered. Mean centering is a treatment where the mean of the data set is subtracted from each column of the matrix. This allows the model to capture variance around the mean of the data, emphasizing differences while eliminating repetitive information from the model. A similar treatment, class centering, where the mean of each class is subtracted from that particular class, can also be applied. The suitability of class centering depends on whether there is additional variance within a class, effectively a “sub-class”. This is the case with the paper samples since there are spectral contributions from the fiber content that are not accounted for by the classifications for the chemical tests. As such, mean centering is the best choice for this data set and generates a better model than class centering [
21].
In summary, the full preprocessing treatment for the data was rubber band baseline correction in OPUS and in Solo MSC (mean), GLSW (clutter source x-block classes, threshold 0.05), and mean centering preprocessing.
4. Conclusions
The application of PCA modeling to specular reflection FTIR spectral data has the potential to provide a non-invasive means of analysis for major and minor components in paper materials. Relative to the bulk cellulose signal, the presence of components such as gelatin, starch, and lignin are fairly minimal and may be difficult to detect from examining individual peaks alone. Traditional methods for detecting these materials involve wet chemical tests (Biuret, iodine, phloroglucinol) that are ultimately destructive and not applicable to museum and collection objects. Taking these two primary concerns into consideration, a PCA model of non-contact specular reflectance FTIR spectra was tested as an alternative method for the wet chemical tests.
The models demonstrated here, generated from the Legacy Press Paper and Mediums Study Collection, demonstrate the effectiveness of the method. Preprocessing is a significant part of making a robust PCA model, and the conditions are dependent on the type of data being modeled. In this instance, MSC, GLSW, and mean centering were found to be the most useful for minimizing similarity (bulk cellulose) and emphasizing variance within the specular reflectance FTIR spectra. Classifications for the calibration data were made based on the notes accompanying the collection, which came from chemical tests carried out by collection compiler Cathleen Baker and the fiber type analysis from Integrated Paper Services, Inc.
Pure fiber pulp stock samples were tested. The ability to distinguish different sources and processing of cellulosic material was demonstrated.
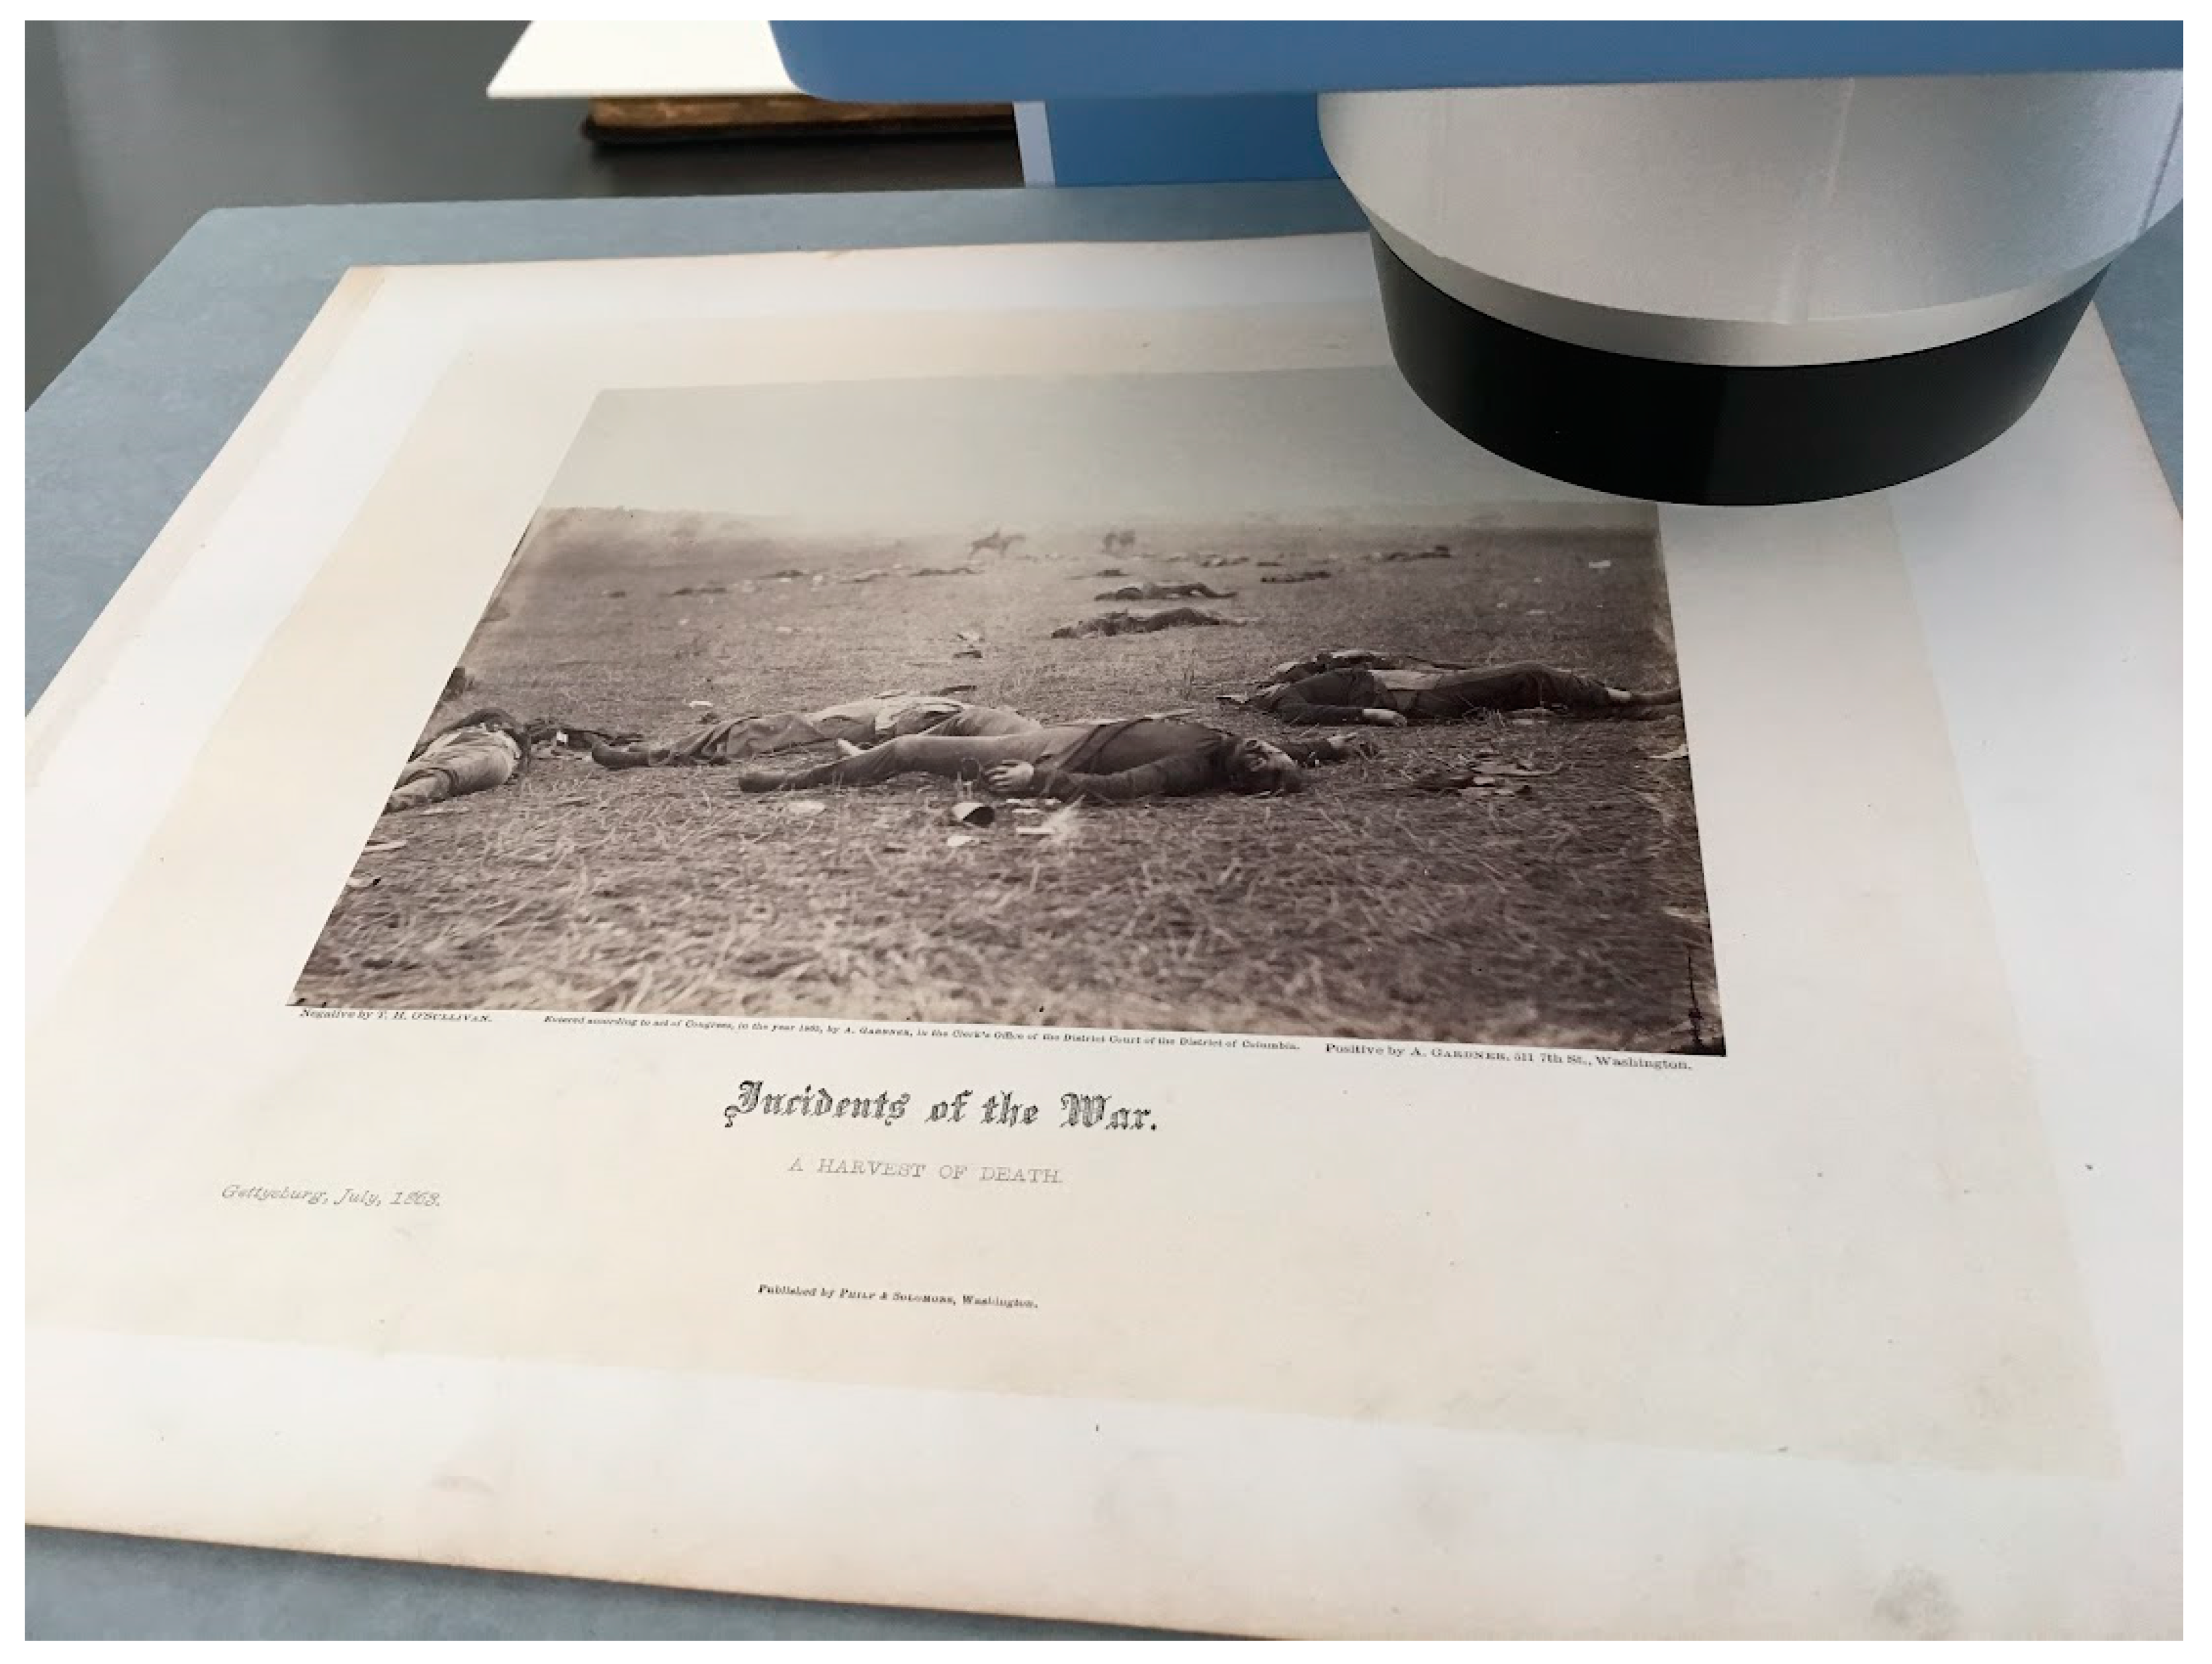
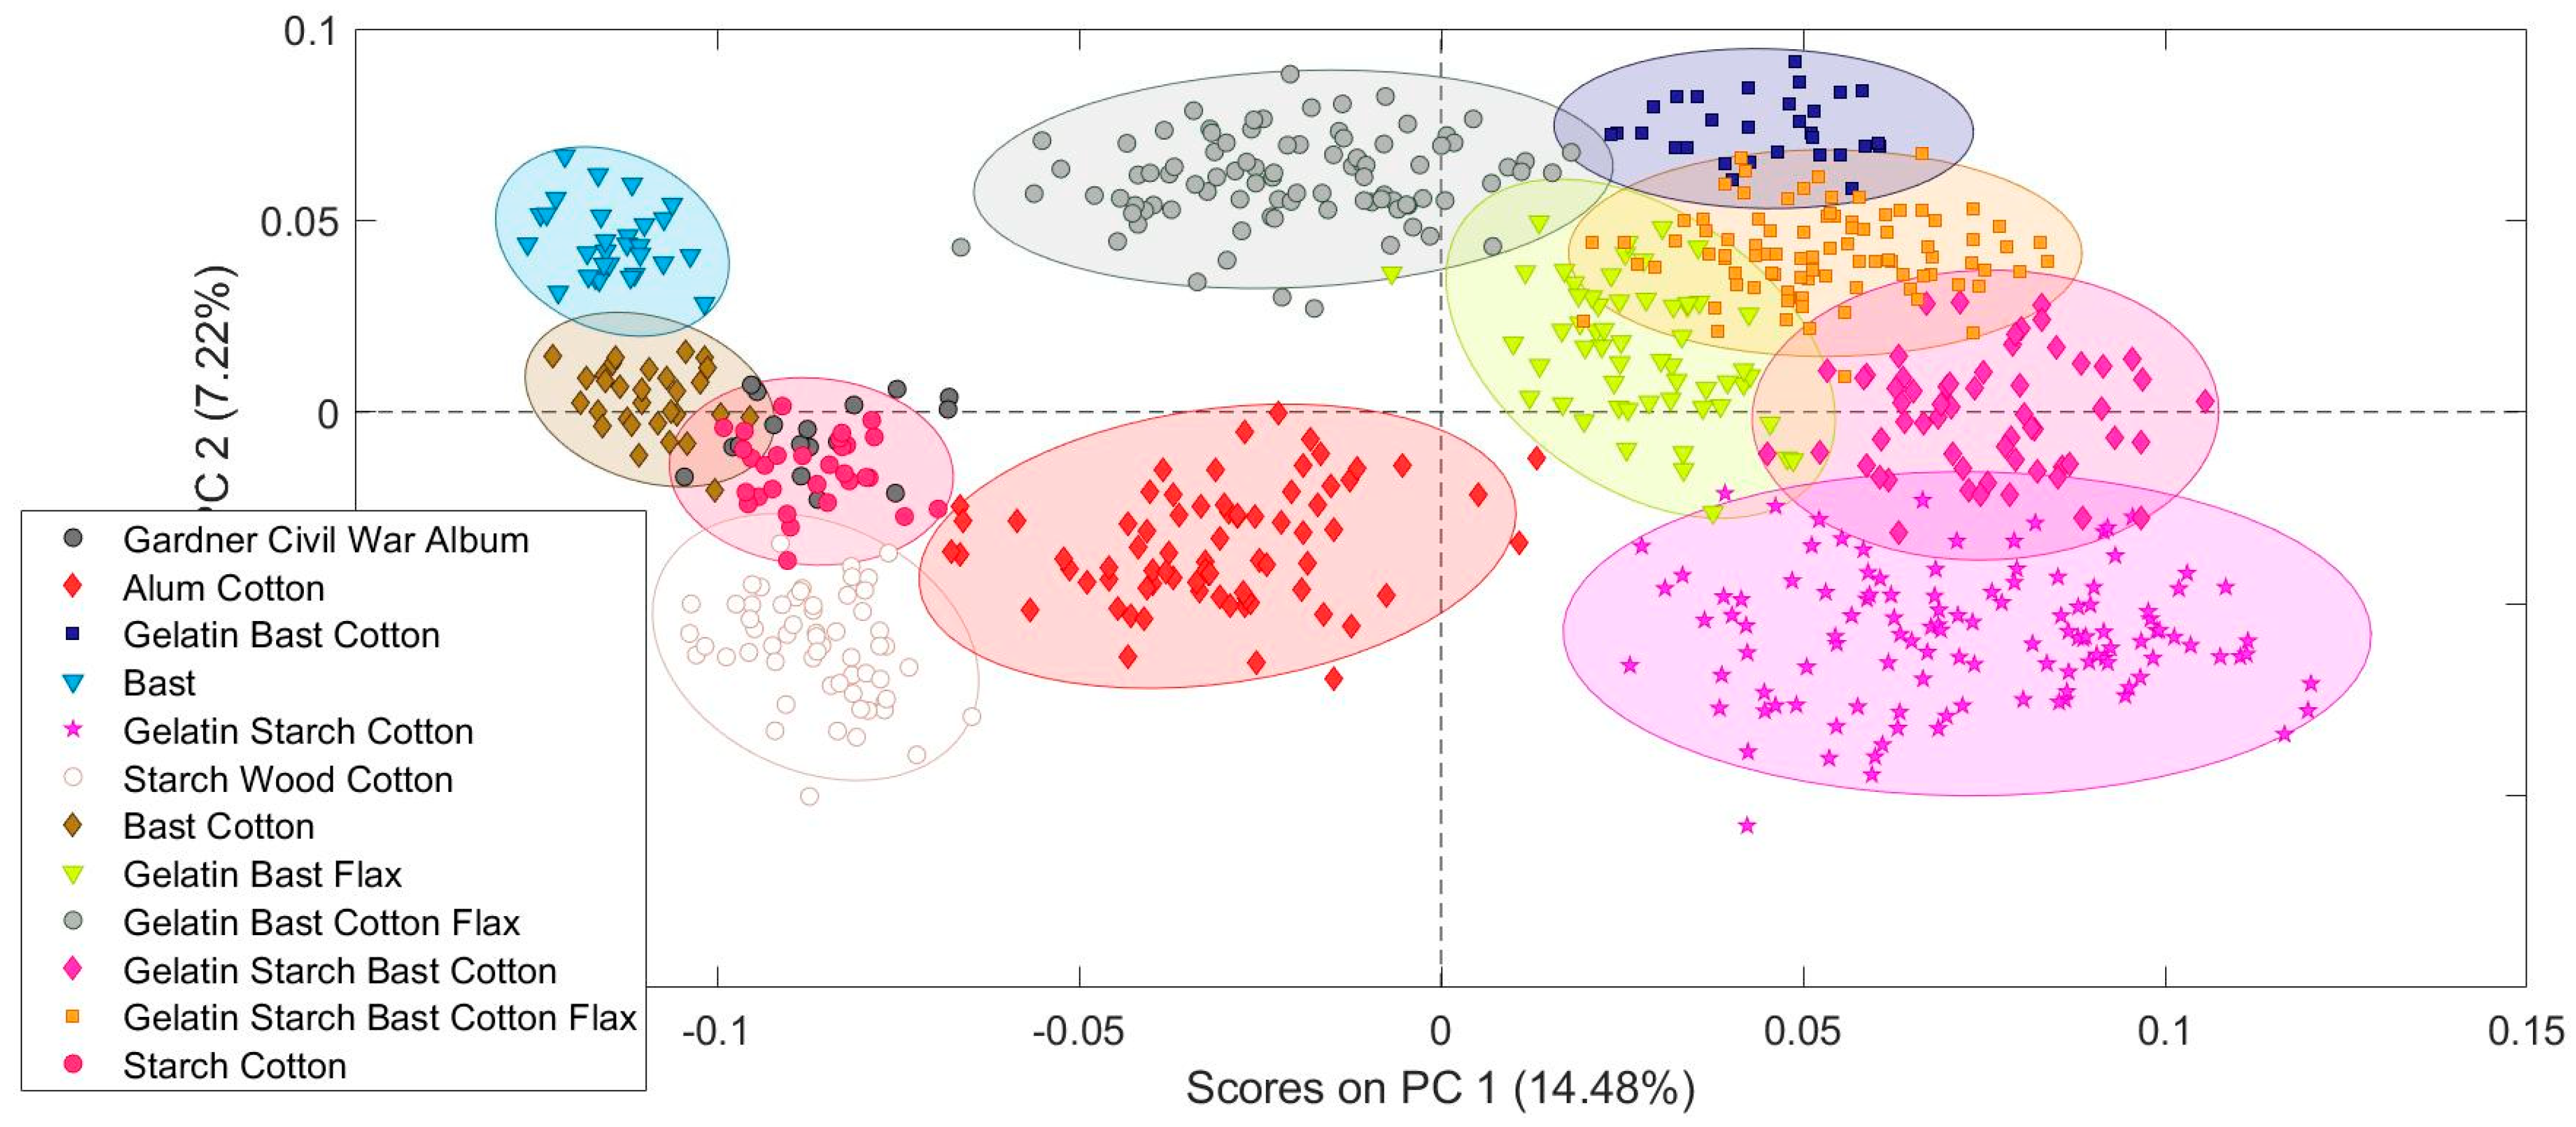
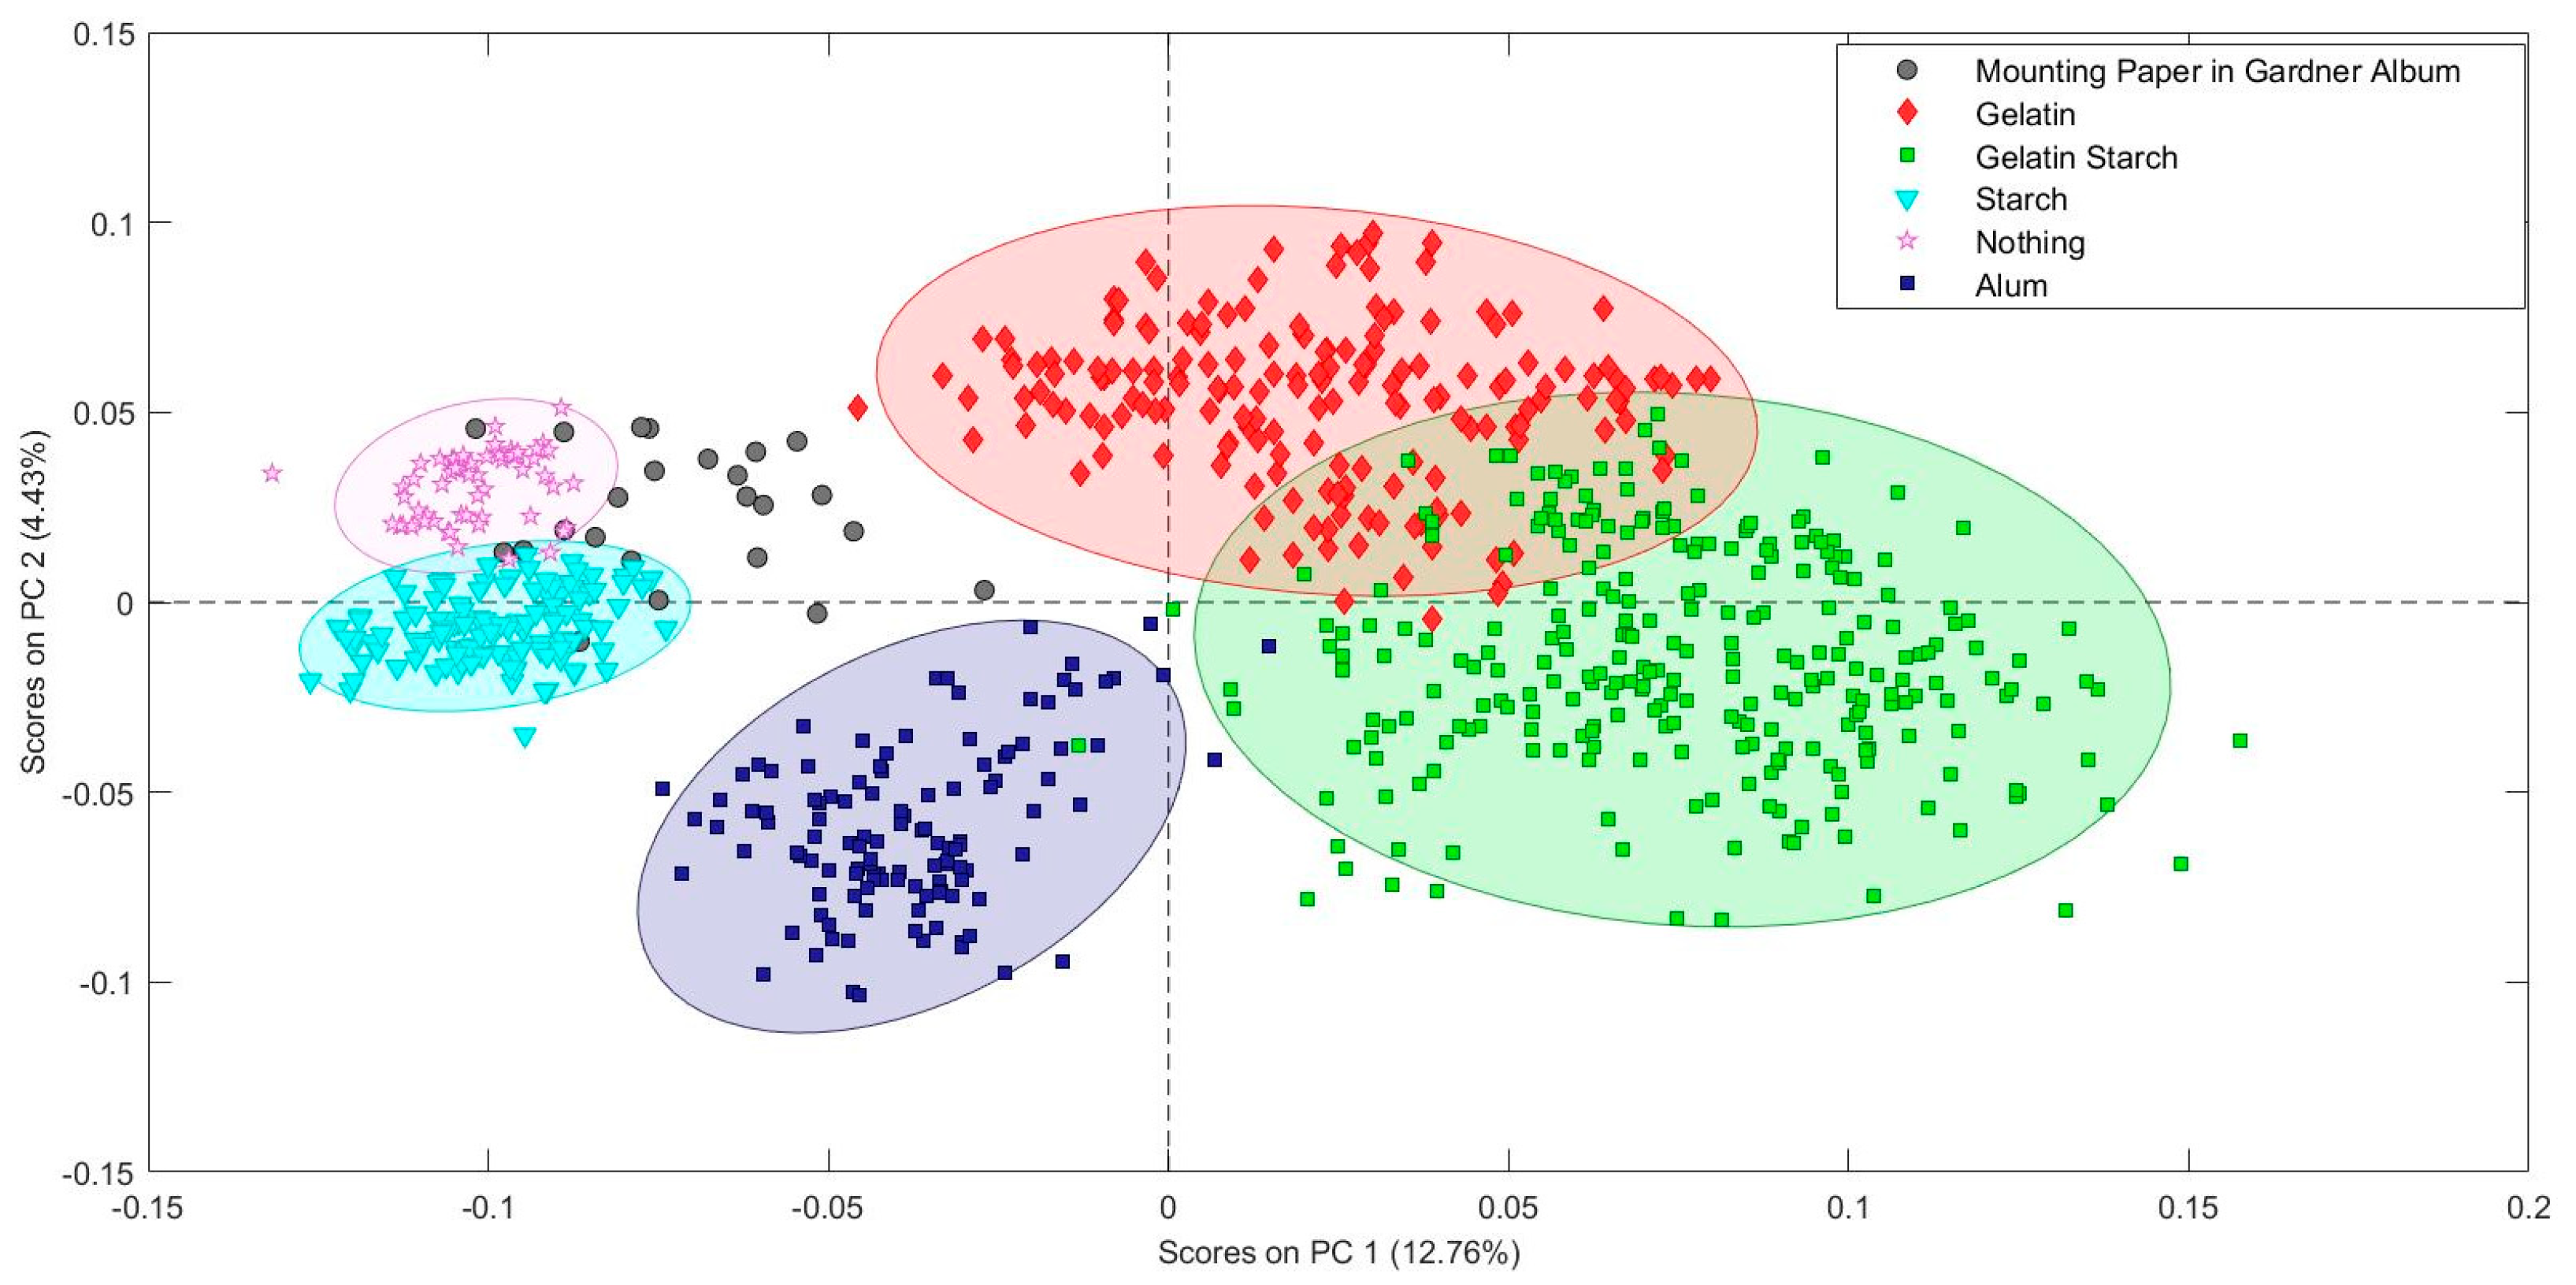
Including the fiber types and chemical test data produced a more precise classifications model for the paper study collection. The photograph mounting paper used by Alexander Gardner in Gardner’s Photographic Sketch Book of War was compared to two different PCA models. The first model only included information about the paper sizing. The second model included sizing and fiber type information. The second model provides a much clearer identification of the paper Gardner used. The data from multiple pages lands neatly in the cotton/bast paper sized with starch area of the second PCA model, allowing a positive identification with reasonable confidence. The fiber composition result with the PCA model matches the results obtained by traditional fiber analysis performed by Debora Mayer using broken fragments from the edge of a page. The cotton fibers were identified based on the presence of extinction bands visible in cross-polarized light microscopy. Since the specular reflection FTIR measurement is completely non-sampling and non-contact, several points on multiple pages could be investigated.
Based on this demonstration, PCA modeling of non-invasive specular reflectance FTIR is a viable method for detecting the presence of minor chemical components within the bulk cellulose matrix of the paper without risking harm to the object. Differences in fiber types can also be distinguished. Since fiber identification also traditionally requires sampling and examination by optical microscopy, this is another place where PCA modeling of FTIR spectra has the potential to provide information for objects that would otherwise not be suitable for analysis involving sample removal. In the analysis of fiber composition of papers, use of PCA modeling with specular reflectance may better approximate industry standards on sampling paper to achieve representative results, all nondestructively, in contrast to traditional methods of removing samples for examination using optical microscopy. This is a practice changer for art conservators and other museum and library professionals in the analysis of collections.
As data science techniques become more widely accessible to the non-specialist, more information about objects can be determined. While the commercial Solo software by Eigenvector Research, Inc. was used here, similar data analysis could be carried out using free software packages such as python or R.
More complex models should be developed for general paper analysis. Since wood fibers land so far from cotton, bast, and flax fibers in PCA space, a hierarchal model should be used to first distinguish general fiber type, and then a more refined model to distinguish specific fiber mixture and sizing materials. The ability to build robust models depends on having relevant well-characterized reference materials to collect data from.
Future directions for this research include expanding the papers analyzed to papers of known fiber mixtures, including percentages along with processing chemistry and modern sizing agents, and broadening the scope of papers to study to include non-western papers such as Indian, Islamic World and East Asian papers to understand how the techniques outlined might be applied to papers from around the world. It is also hoped that once paper supports are better understood, the techniques might be used to study media that has been difficult to analyze because there is so little material present. This might include, for example, drawing inks on old master drawings. The use of principal component analysis and specular reflection FTIR may open new avenues for the study of artists’ materials, allowing a deeper understanding of materials that were traditionally very difficult to analyze.


