1. Introduction
Digital archiving, image analysis, and virtual restoration of ancient documents, photographs, art pieces, and cultural heritages are of growing interest [
1,
2,
3,
4]. Since digital photography, scanning, and imaging techniques have become widely available, the usage of digital images, including photographs, have virtually exploded since 1990, the beginning of a “digital era” in photography. As digital photography and imaging technology continues to improve, the potential for the manipulation and use of digital images increases as well. Artificial manipulation of digital images requires basic knowledge of the digital image file format and skillful insight to transform original images into desired (perhaps highlighted) images in art form. Digital photographic images can be very useful for non-contact, non-destructive quantitative characterization and measurement of physical dimensions, and distribution of color and brightness at the image plane, provided that digital photographic images have negligible distortion, color shift, white balance, and contrast related problems [
5,
6]. Appropriate digital photographic images are a great source of information for non-contact and non-destructive quantitative characterization and recording of conditions of cultural heritages, including old paper documents, at the time of photographing. By comparing photographs taken at different points in time, the change in conditions of cultural properties can be characterized and quantified for record keeping and making rational decisions towards optimization of conservation conditions and restoration [
5,
6].
Foxing stains develop on paper with time. Foxing stains typically appear as either spotty or diffused areas on aged paper documents with yellowish, brownish, reddish, or blackish colors [
7,
8]. One can easily discern foxing stains from photographic images by their visual appearance (typically localized change of color). For record keeping and characterizing the degree of deterioration and degradation of printed paper documents with aging, photography is done either on a regular basis or on an as needed basis. However, the characterization of the affected areas is not easy. Depending on the level of experience and the skills of the personnel handling document characterization, the outcome can vary significantly due to the subjective nature of visual inspection.
There are many image processing software programs which manipulate color, brightness, and enable editing or cropping. However, they are not designed for measurement or quantitative analysis of length, area, perimeter, circularity, geometric characteristics, coloration, and so on. Most of all, images are used primarily for viewing or reporting. Very valuable and insightful information in the photographic images are rarely preserved due to the lack of convenient and easy-to-use image processing and image analysis software. It would be beneficial to develop image-based analysis techniques which are both quantitative and objective for characterizing foxing stains on old printed paper documents from the development of personnel independent characterization and conservation points of view.
In this paper, we studied the feasibility of image-based quantitative analysis of foxing stains on collections of old (16th–20th century) European books stored in the Rare Book Library of the Seoul National University in Korea. Quantification of the degree of foxing, determining foxing affected areas and their distribution in books and documents, using image-based analysis is the main scope of this study. We were able to objectively determine the foxing affected areas on books using image processing software (PicMan) developed for quantitative analysis and information extraction. Foxing stains were quantitively measured based on colors in the images of foxed material. Root cause analysis of foxing stains is not a scope of this study. Root cause of foxing has to be studied separately from material science, biological, and chimerical points of view.
2. Materials and Methods
2.1. Materials
In 2016, Dr. Se-Kyung (Sue) Oh Shklar, an alumni of Seoul National University, Korea and a former professor of Pharmacy at Massachusetts Institute of Technology donated her late husband’s (Gerald Shklar (1924–2015), DDS, Professor of Department of Oral Medicine, Infection, and Immunity at the Harvard School of Dental Medicine) 329 volume, personal collection of rare books (published in 16th–20th century) related to the history of medicine to Seoul National University. Since then, Dr. Oh has donated an additional 1464 books for humanities, arts, and architecture in August and November 2016. Upon the donation of the rare books, the Central library of Seoul National University allocated a personal library section and named his collections as SHKLAR books in the rare book archives library. SHKLAR books consists of 1793 books (329 books on natural science and medicine, 417 books on the humanities and art, and 1047 books on paintings, architecture, and music). Books were written in six languages (599 in English, 74 in French, 33 in Latin, 38 in Germen, one in Dutch, and one in an unidentified language). There were four 16th century books, nine 17th century books, 73 18th century books, 354 19th century books, 297 20th century books, and nine books with no publication date [
9,
10].
In an effort to collect and record the current condition of the books, photographs were taken from 760 of 1793 SHKLAR books from October to November 2017. During our initial inspection, we found many foxing stains inside the cover pages of 19th and 20th century books. For foxing stain characterization and affected area measurements, mainly 19th and 20th century books were selected. The older books tend to have more physical damage and are not as suited for proper foxing characterization and affected area measurement using photographed images. Approximately 10% of the 760 imaged books which showed were analyzed in the course of this study.
2.2. Methods
2.2.1. Photographing
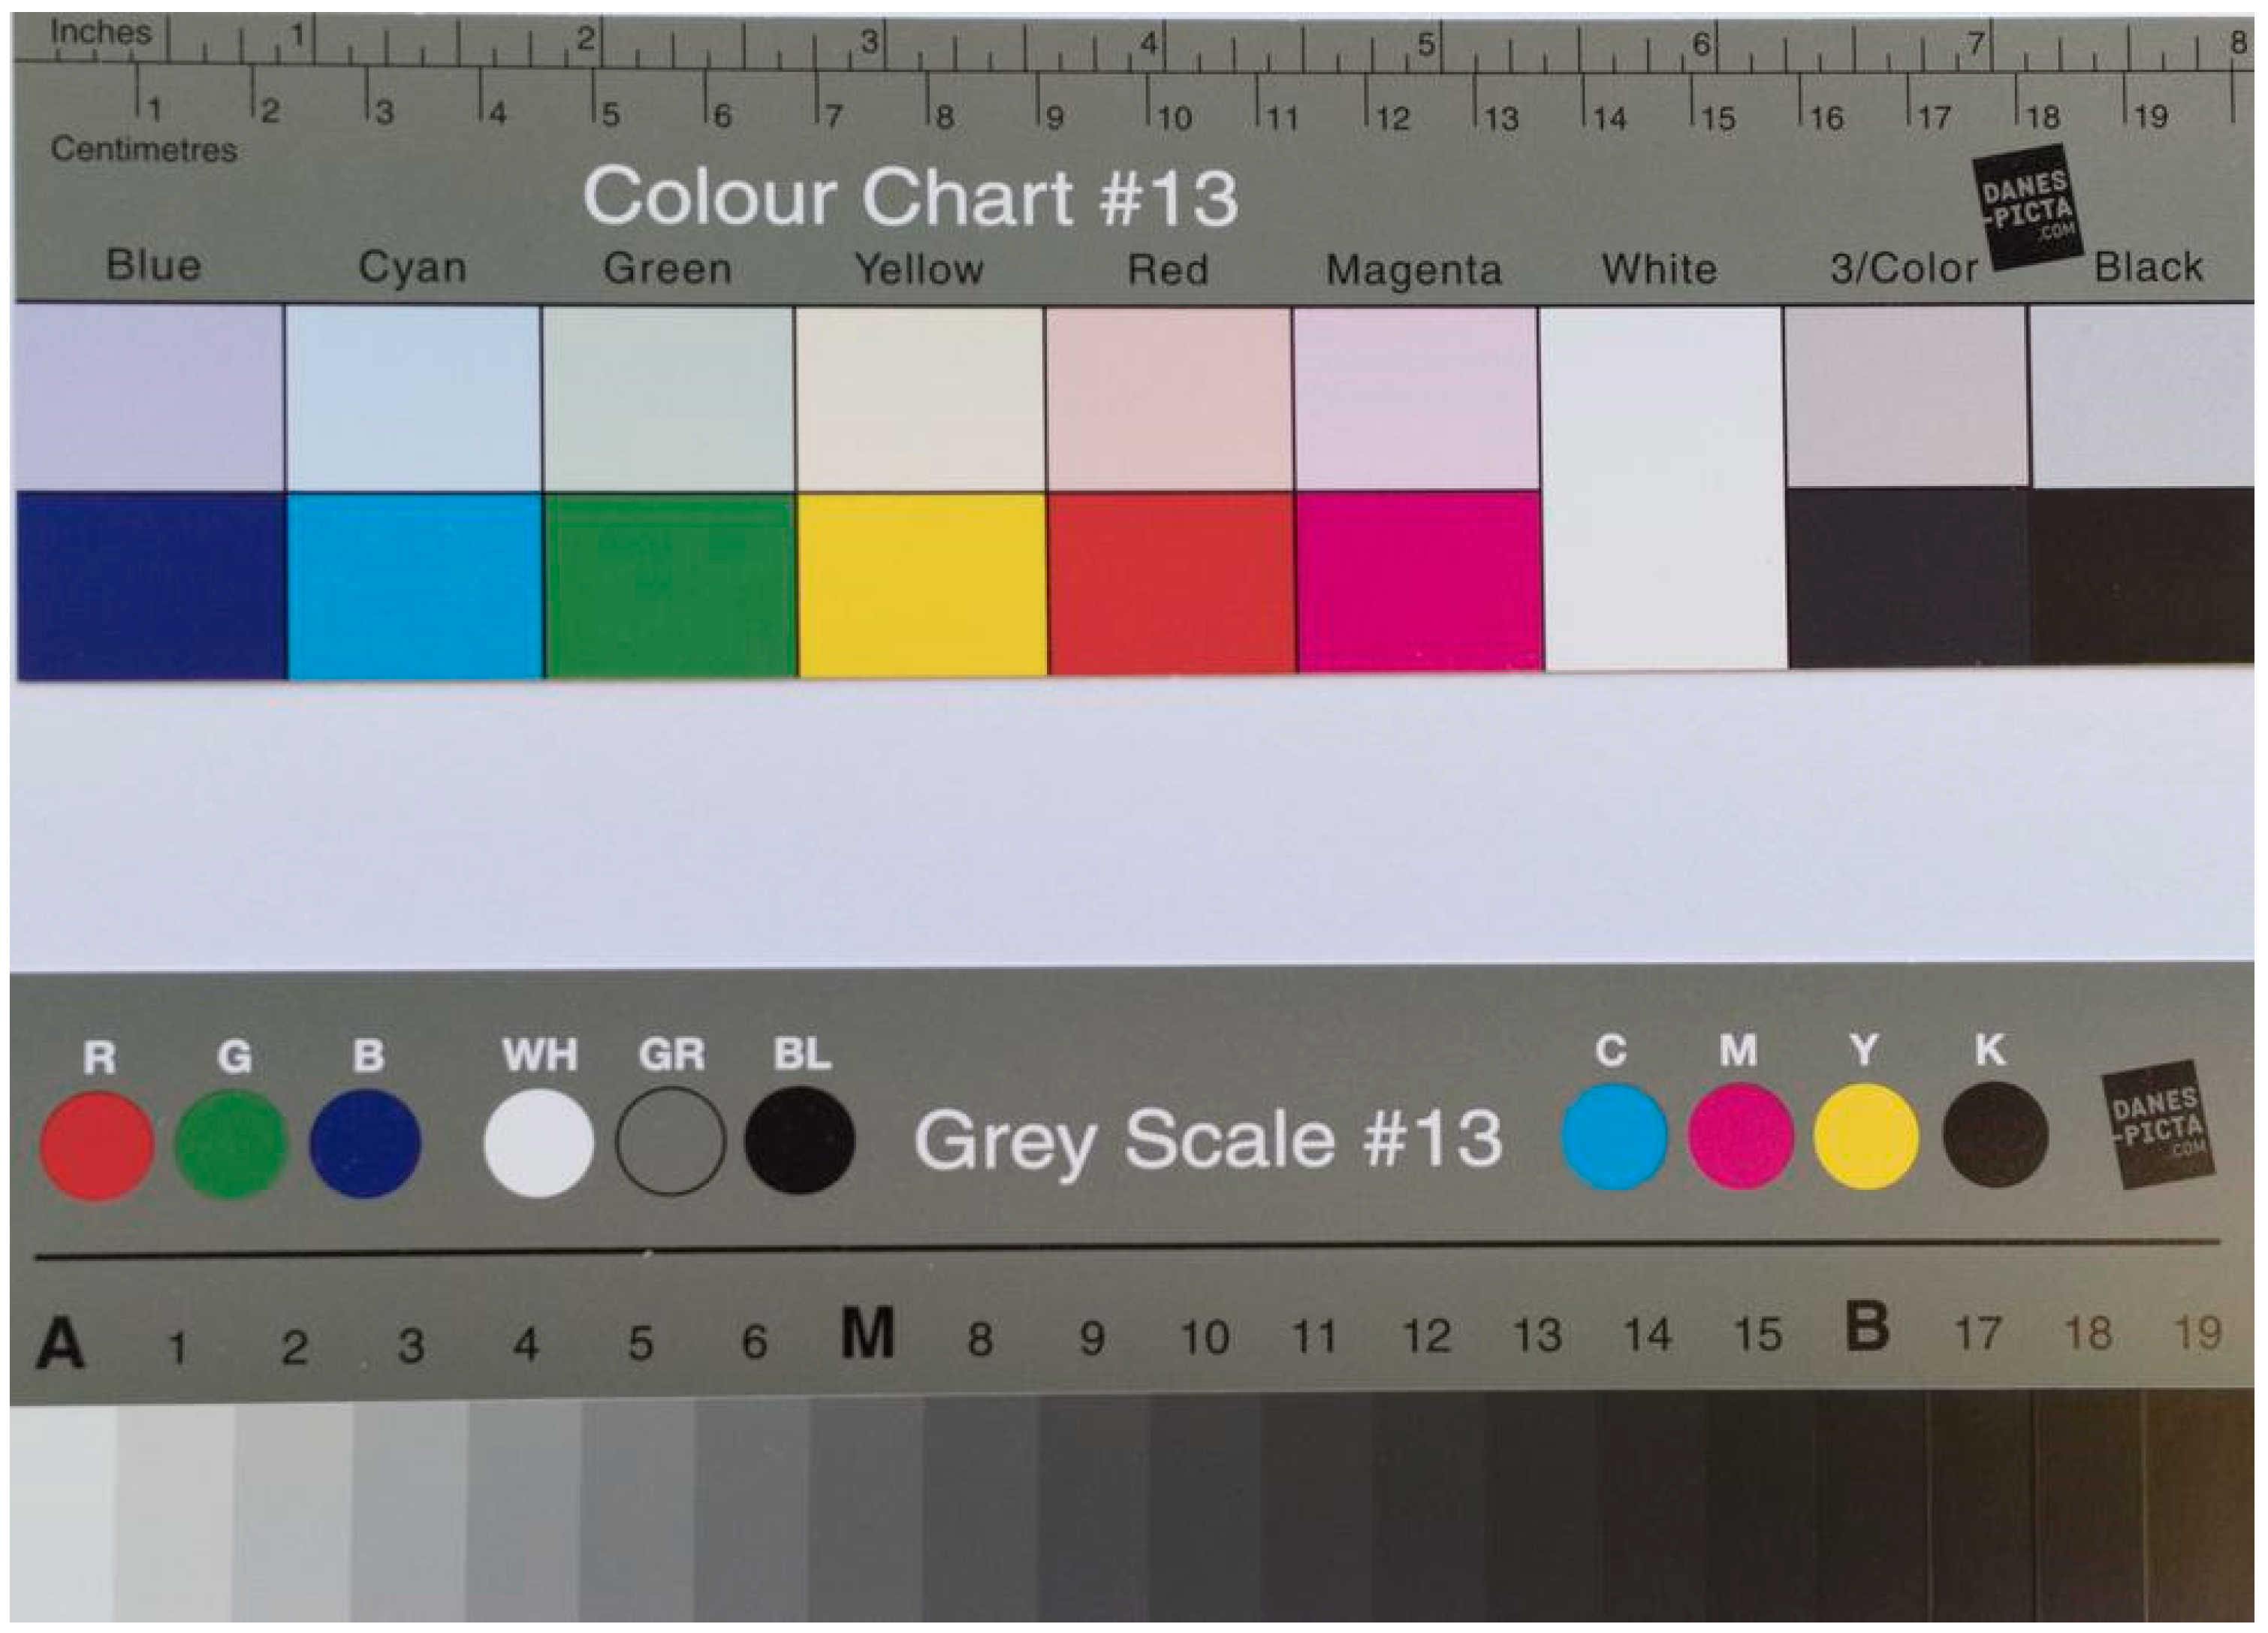
The scope of this project is to make a fast, digital record of a large collection of SHKLAR books as a reference and a preservation measure for future activities. Front and back covers were visually inspected for damage and the damaged portions of the cover pages were measured using image analysis techniques to obtain measurements of the foxed areas. The first pages facing the front and back covers were mainly photographed. A digital camera with a document stand was used with lighting equipment for the photography. A Canon EOS 5D Mark III camera with 2640 × 3960 pixels (>10 M Pixels) was used. The distance between the camera and book, lighting condition, shutter speed (exposure time), f number, and focal length were adjusted, using design of experiment protocols for best photography results with no saturation and no color shift. For foxing stain characterization, color information on the digital photographs is essential. All books were photographed with a small (20 cm long) grayscale and color separation guide by Danes-Picta (
Figure 1) [
11].
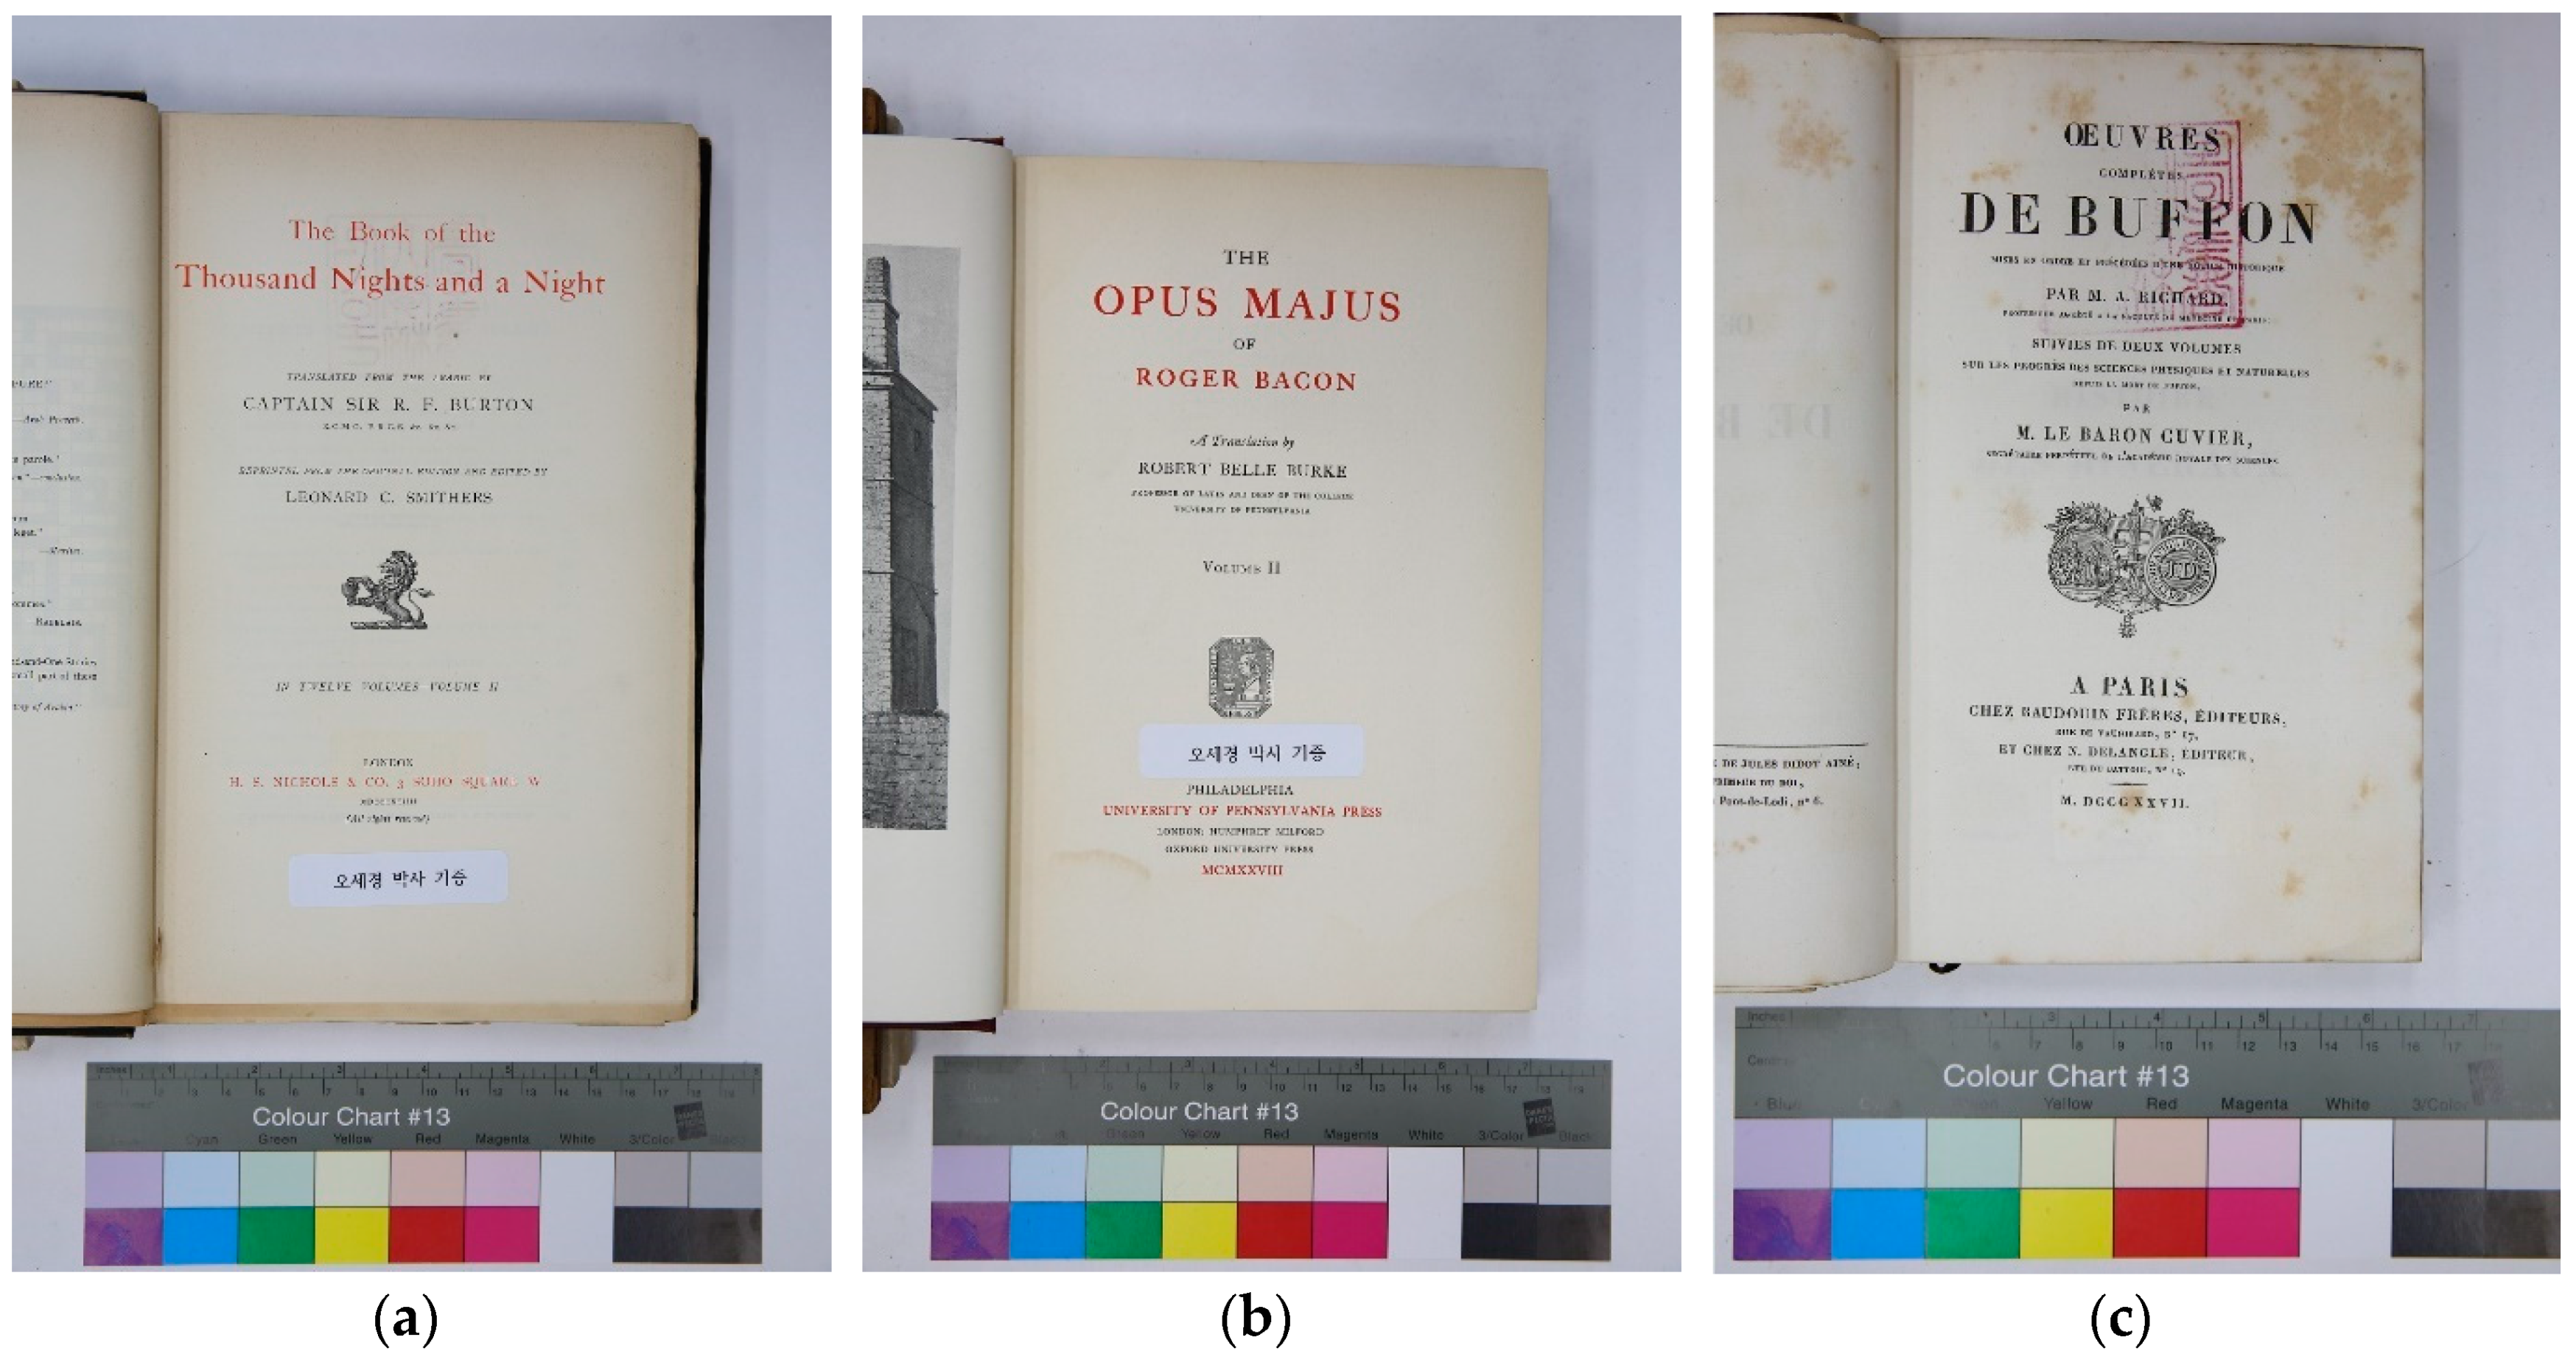
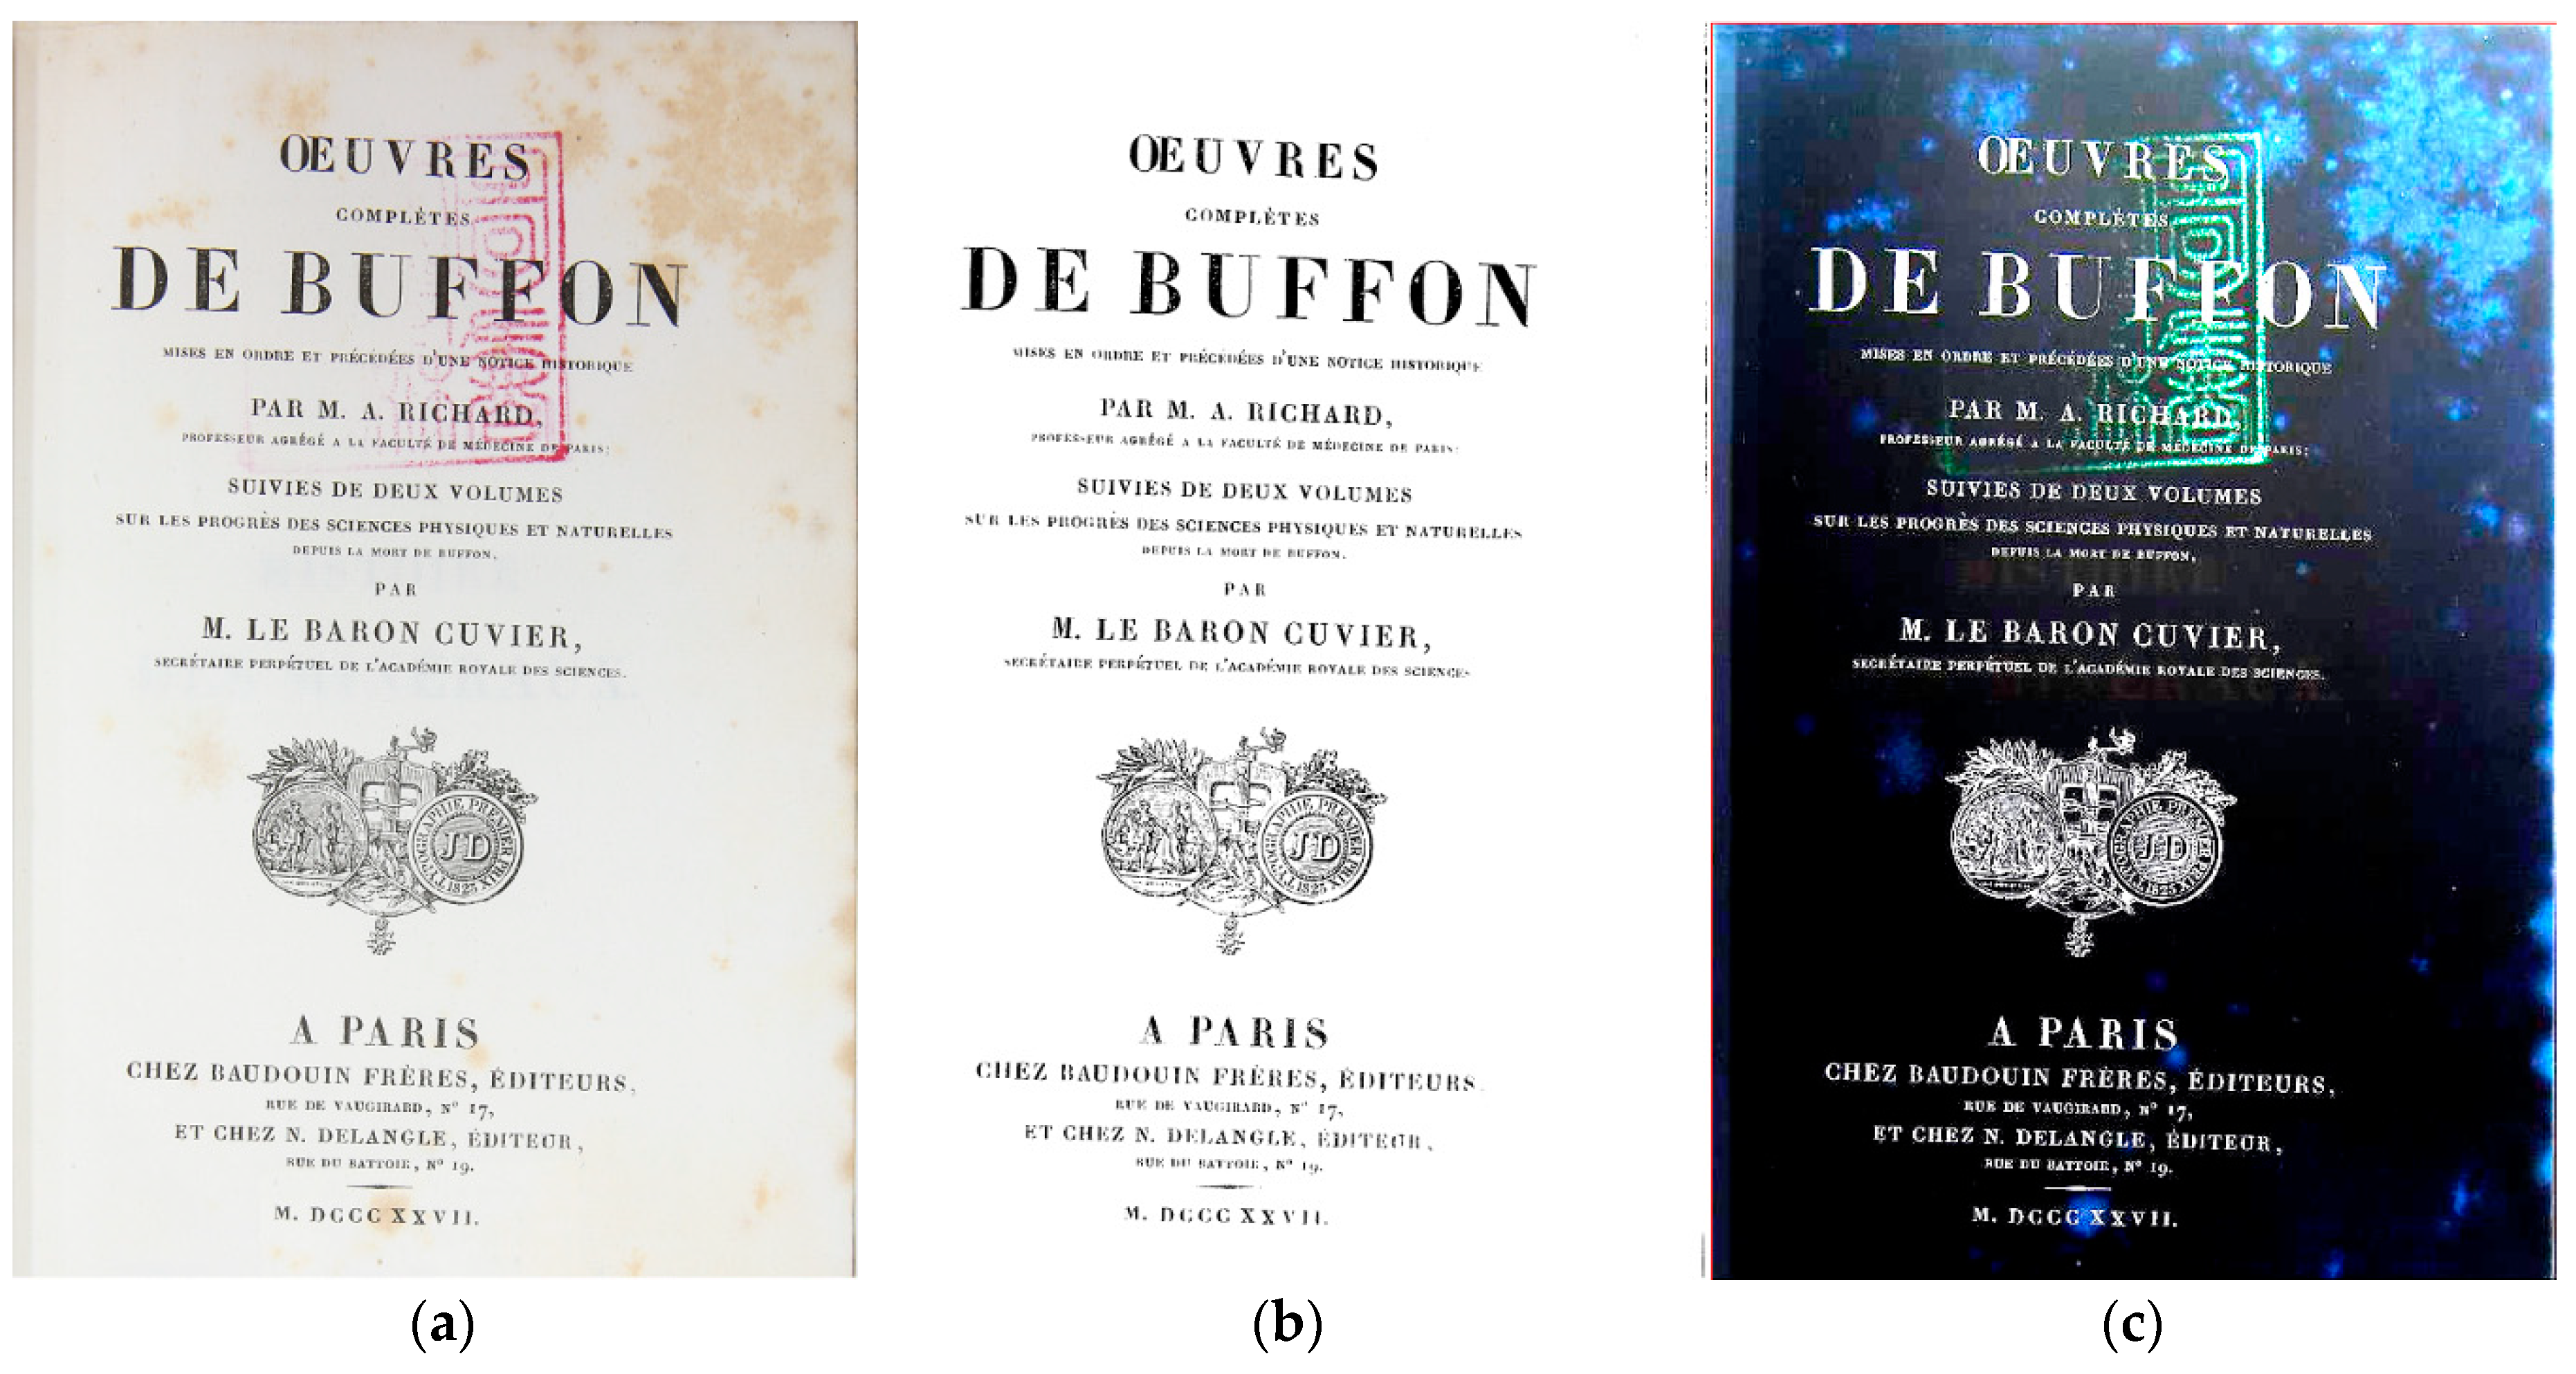
Figure 2 shows three photographs of the inside cover of 19th and 20th century SHKLAR collection books with the grayscale and color separation guide. Photographs only show the color separation guide portion.
Figure 2a,b was taken at a focal length of 53 mm, while
Figure 2c was taken at a focal length of 47 mm. Thus, the magnification of
Figure 2c was slightly higher than for the other photographs. Details of photographing conditions of sample books are summarized in
Table 1.
2.2.2. Image Data File Format and Characteristics
The raw image data files were saved in CR2 format. A CR2 file is a raw camera image created by Canon’s EOS 5D Mark III digital camera. Other Canon digital cameras also store image files in the CR2 format. It stores uncompressed image data exactly as it was captured by the image sensor. The camera provides an option to save image files in JPG (or JPEG) format. CR2 files are based on the TIFF file specification and typically used by professional photographers because they store higher quality, uncompressed images. The drawback is the large file size. It is cumbersome to store and handle significantly large quantities of large size image files.
Depending on the usage of image data, super-high quality images such as CR2 file format images may be required to make a perfect print replica or high quality digital archives. Some applications such as paper foxing characterization and affected area measurement may not need high resolution images because area measurement accuracy higher than 1 mm2 is neither required nor practical. Sometimes, productivity comes before perfection. For onsite characterization and image processing, one often faces limitations in high performance work stations, analytical equipment, accessibility to the materials of interest, and the project period itself. We have to find adequate, yet practical solutions applicable to the field operations.
The JPG image file format provides smaller image file size by compression techniques. Image compression may result in data loss and image quality deterioration. However, it will greatly reduce the computational load for PC-based image analysis due to the smaller size of image files. This may provide practical solutions for foxing stain characterization and affected area measurement with measurement accuracies of around 1 mm2. Optimizing image file format and number of pixels for 1 mm2 area measurement accuracy must be evaluated for finding practical solutions for the significantly labor-intensive project in under 4 months. We reduced image sizes in JPG format to find practical solutions resulting in acceptable area measurement accuracy of 1 mm2 for the field work without using super high performance personal notebook computers.
As summarized in
Table 2, the average file size of three CR2 files with 2640 × 3960 pixels was 16.7 MB while the average size of three JPG files with 3850 × 5760 pixels was 5.1 MB (approximately 30% of the size of CR2 files). If we further reduce the image size to 25% in both X and Y directions (960 × 1440 pixels from 3850 × 5760 pixels), the file size becomes significantly smaller. The average file size became 259 KB, which is 1.55% of the average CR2 file size of 16.7 MB. The total of 960 × 1440 pixels (reduced to 25% in X,Y directions, area (number of pixels) is reduced to 6.25% of original JPG image files) is sufficient for the project goals of 1 mm
2 area measurement accuracy. This is a good image file format and size. As long as the size of images is kept at 72 dpi or higher in minimum compression or lossless JPG file formats, we can achieve sufficient color and spatial resolution with manageable image file size.
2.2.3. Resolution Requirement for Image Data File
To estimate the dpi (dots per inch) requirement for 1 mm
2 area measurement accuracy, the resolution (dots/mm), equivalent length per dot (mm/dot), and minimum measurable area (mm
2/dot) were calculated and summarized in
Table 3. The resolution of both JPG format image files has 72 dpi. It is equivalent to 2.8 dots/mm. One dot is equal to 0.36 mm in length. Thus, for one dot (one pixel: one dot in both X, Y directions), the minimum measurable area, is calculated to be 0.130 mm
2. JPG image files with 72 dpi have 7.7 times higher area measurement resolution of 1 mm
2. For 1 mm
2 area measurement resolution, JPG image files with 26 dpi will be sufficient for the purpose. Since the JPG images with 960 × 1440 pixels already have manageable image file size using ordinary notebook PCs, we decided to use this size image for foxing characterization and affected area measurements in this study.
We are not suggesting that 26 dpi is good enough. We were only using that as an example of a minimum requirement for the minimum measurable area of 1 mm2/pixel. We believe that 72 dpi resolution would be the practical resolution from both image quality and image size points of view. We used 72 dpi images for image analysis in the course of this study.
2.2.4. Image Processing Software (PicMan)
Newly developed image processing and analysis software, PicMan (WaferMasters, Inc., California, U.S.A.) for quantitative analysis and information extraction was used in this study. The software can handle digital image files and video files of various formats. Color and brightness of every pixel, on images and video files, can be collected, analyzed, and highlighted using various functions. Custom functions can also be added if necessary. Unlike other image handling software, it can extract necessary numerical data in images and movies for quantitative and statistical analysis. It also helps users to easily highlight the regions of interest by selected color and brightness levels of pixels in the image. It is very convenient and easy-to-use image processing and analysis software for many applications including cultural property characterization, conservation, preservation, and restoration applications.
We have used other well-known image processing software previously. However, image processing software often requires high-end computers or workstations with very high computing power and significantly large size memories. This complicates onsite image-based quantitative analysis using personal computers or notebook computers on site. If image size is larger, for example high resolution TIFF images, it took a very long time to process a single image.
This was the reason why we developed a new image processing software (PicMan) which does not require installation (only an execution file) and only takes small memory space (<10 MB). This is very important features of PicMan making onsite photographing and analysis possible without high end computer equipment. PicMan’s batch processing capability makes analysis of a large number of images faster and accurate. Analyzed numerical data and highlighted image export capability are also added benefits.
PicMan is capable of opening and processing various formats of still images and video files such as JPG, GIF, BMP, PNG, TIF, DM3, ND2, MP4, AVI, and so on. Examples of still and video image files can be found in [
12,
13,
14,
15]. PicMan is now commercially available from WaferMasters, Inc. Customization of software functions is also available.
3. Results
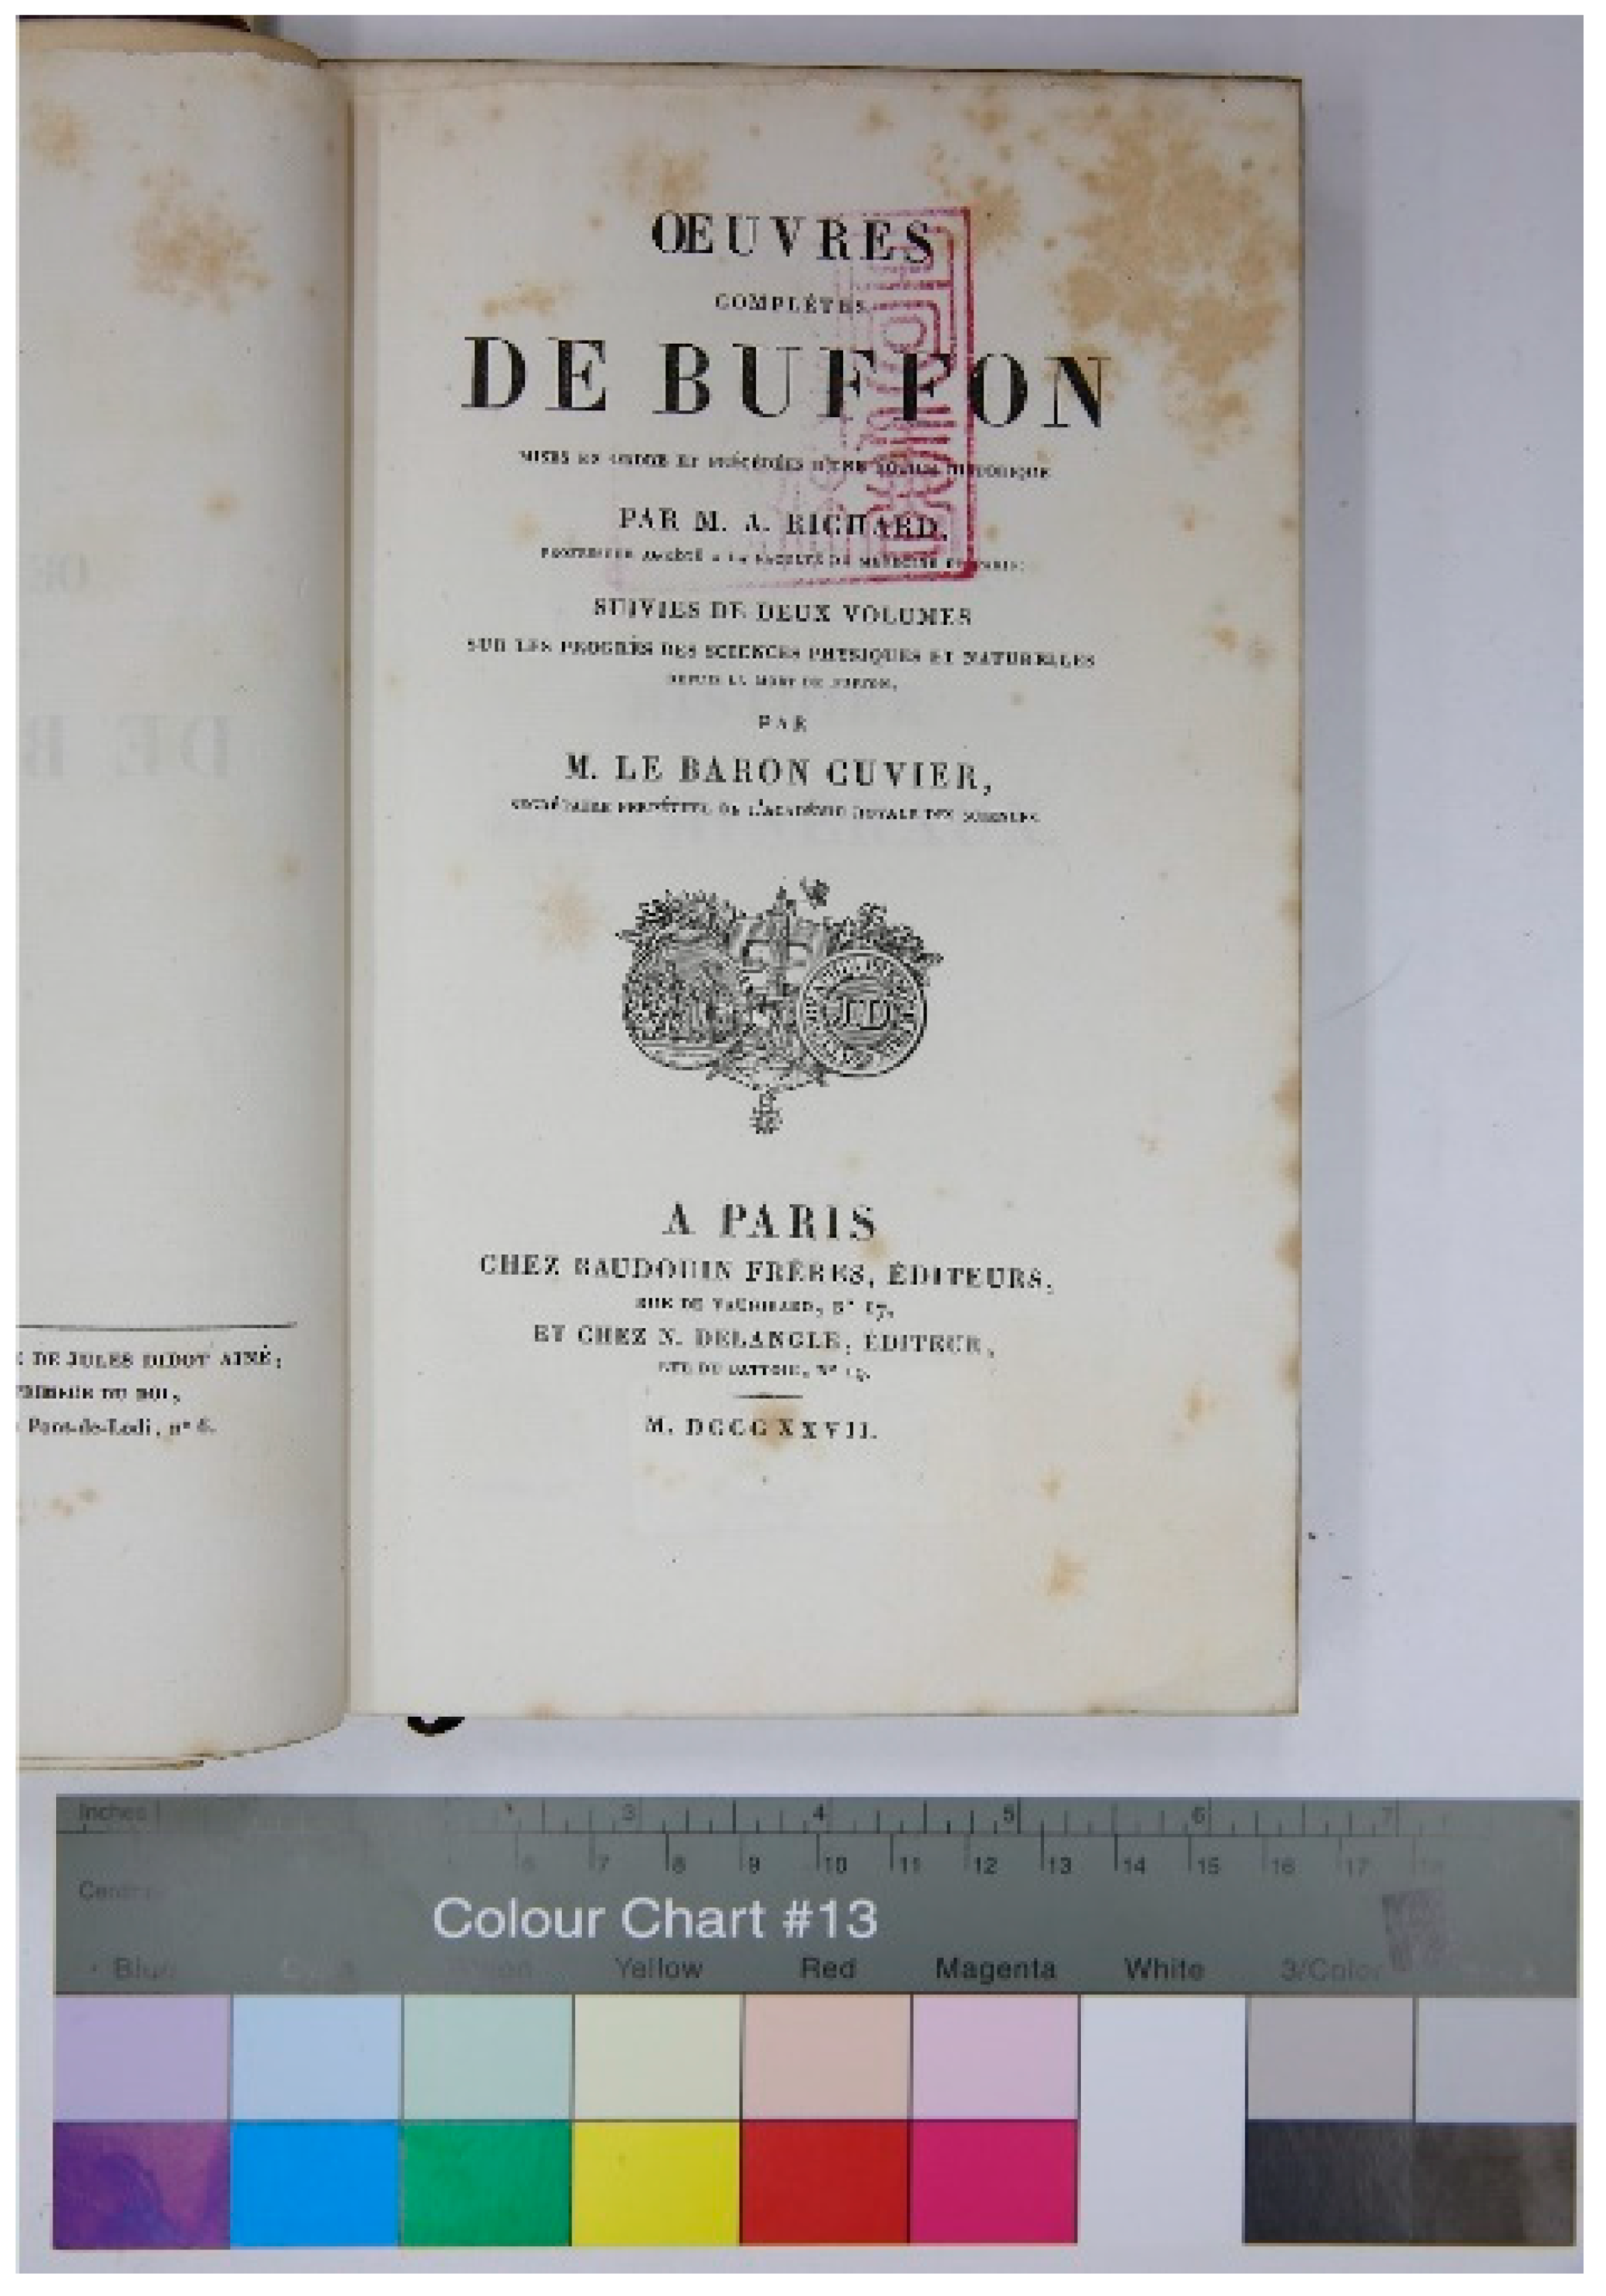
For this foxing stain characterization and affected area measurement example, a small JPG file with 960 × 1440 pixels in area and 291 KB in size of ‘DE BUFFON’ book image was used (
Figure 3). Similar foxing stain characterization and affected area measurement were done for other images. To avoid redundancy, only one foxing stain characterization and affected area measurement example is given.
3.1. Color and Brightness Analysis Using PicMan
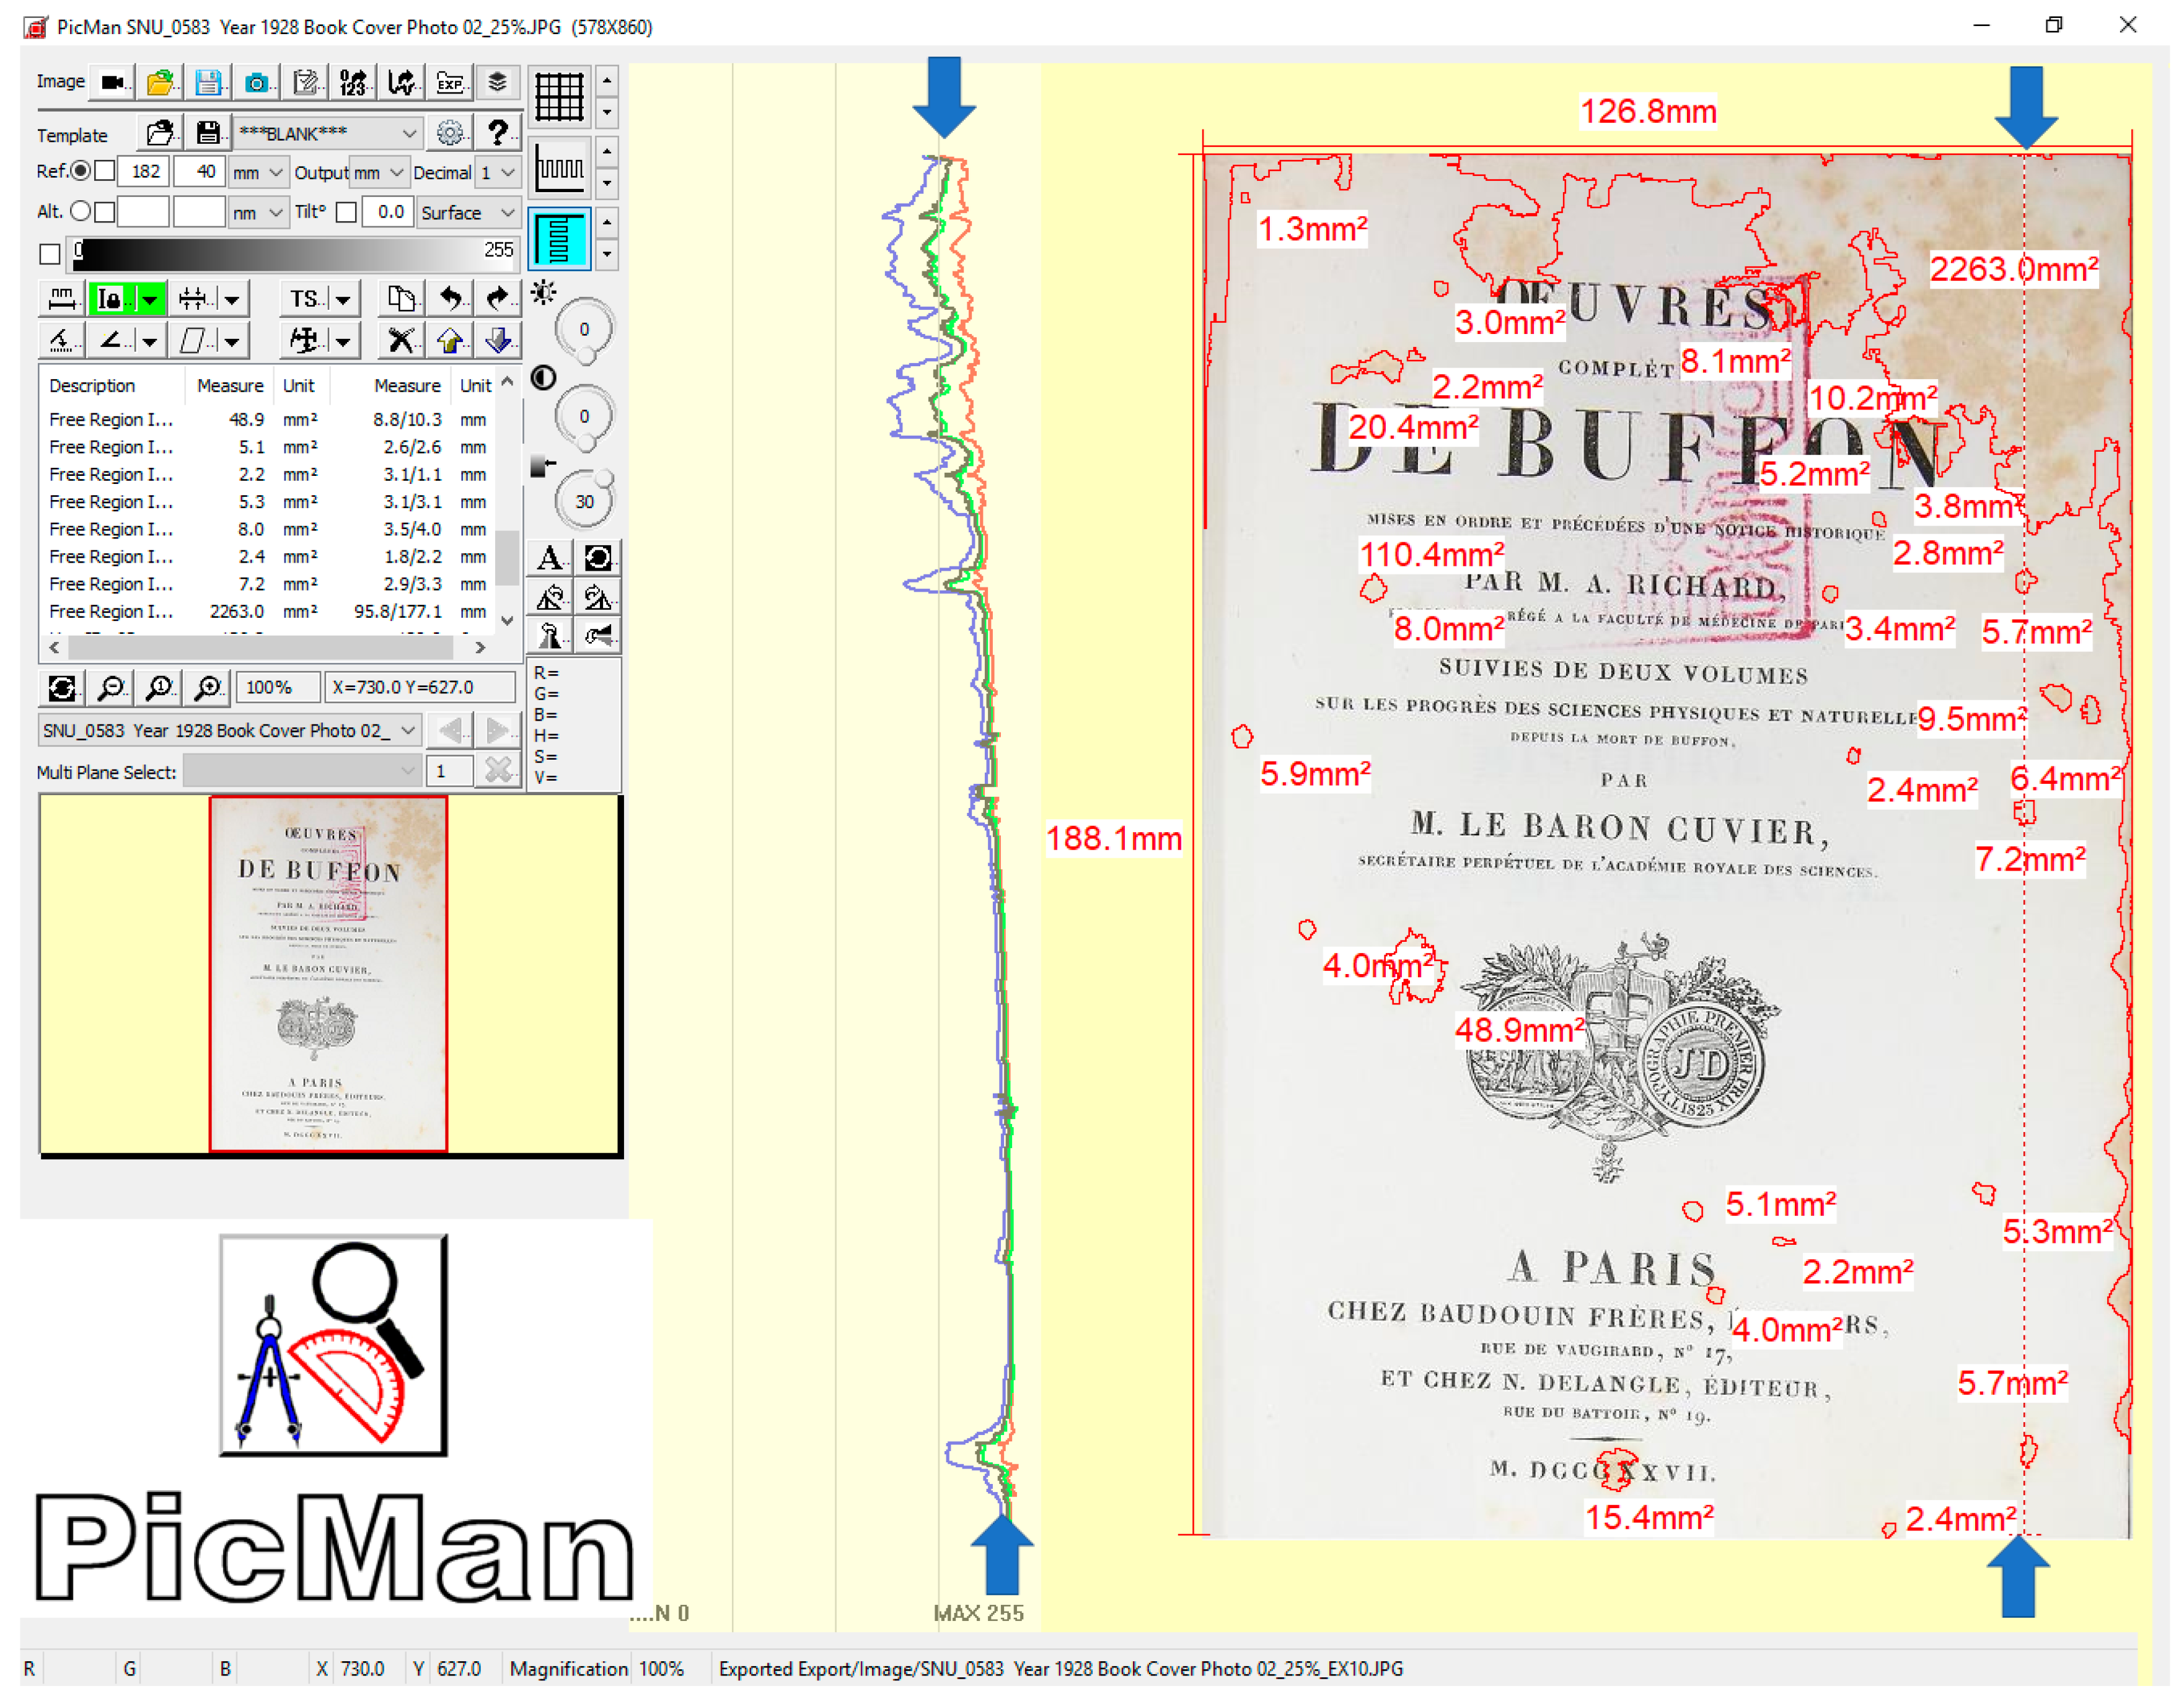
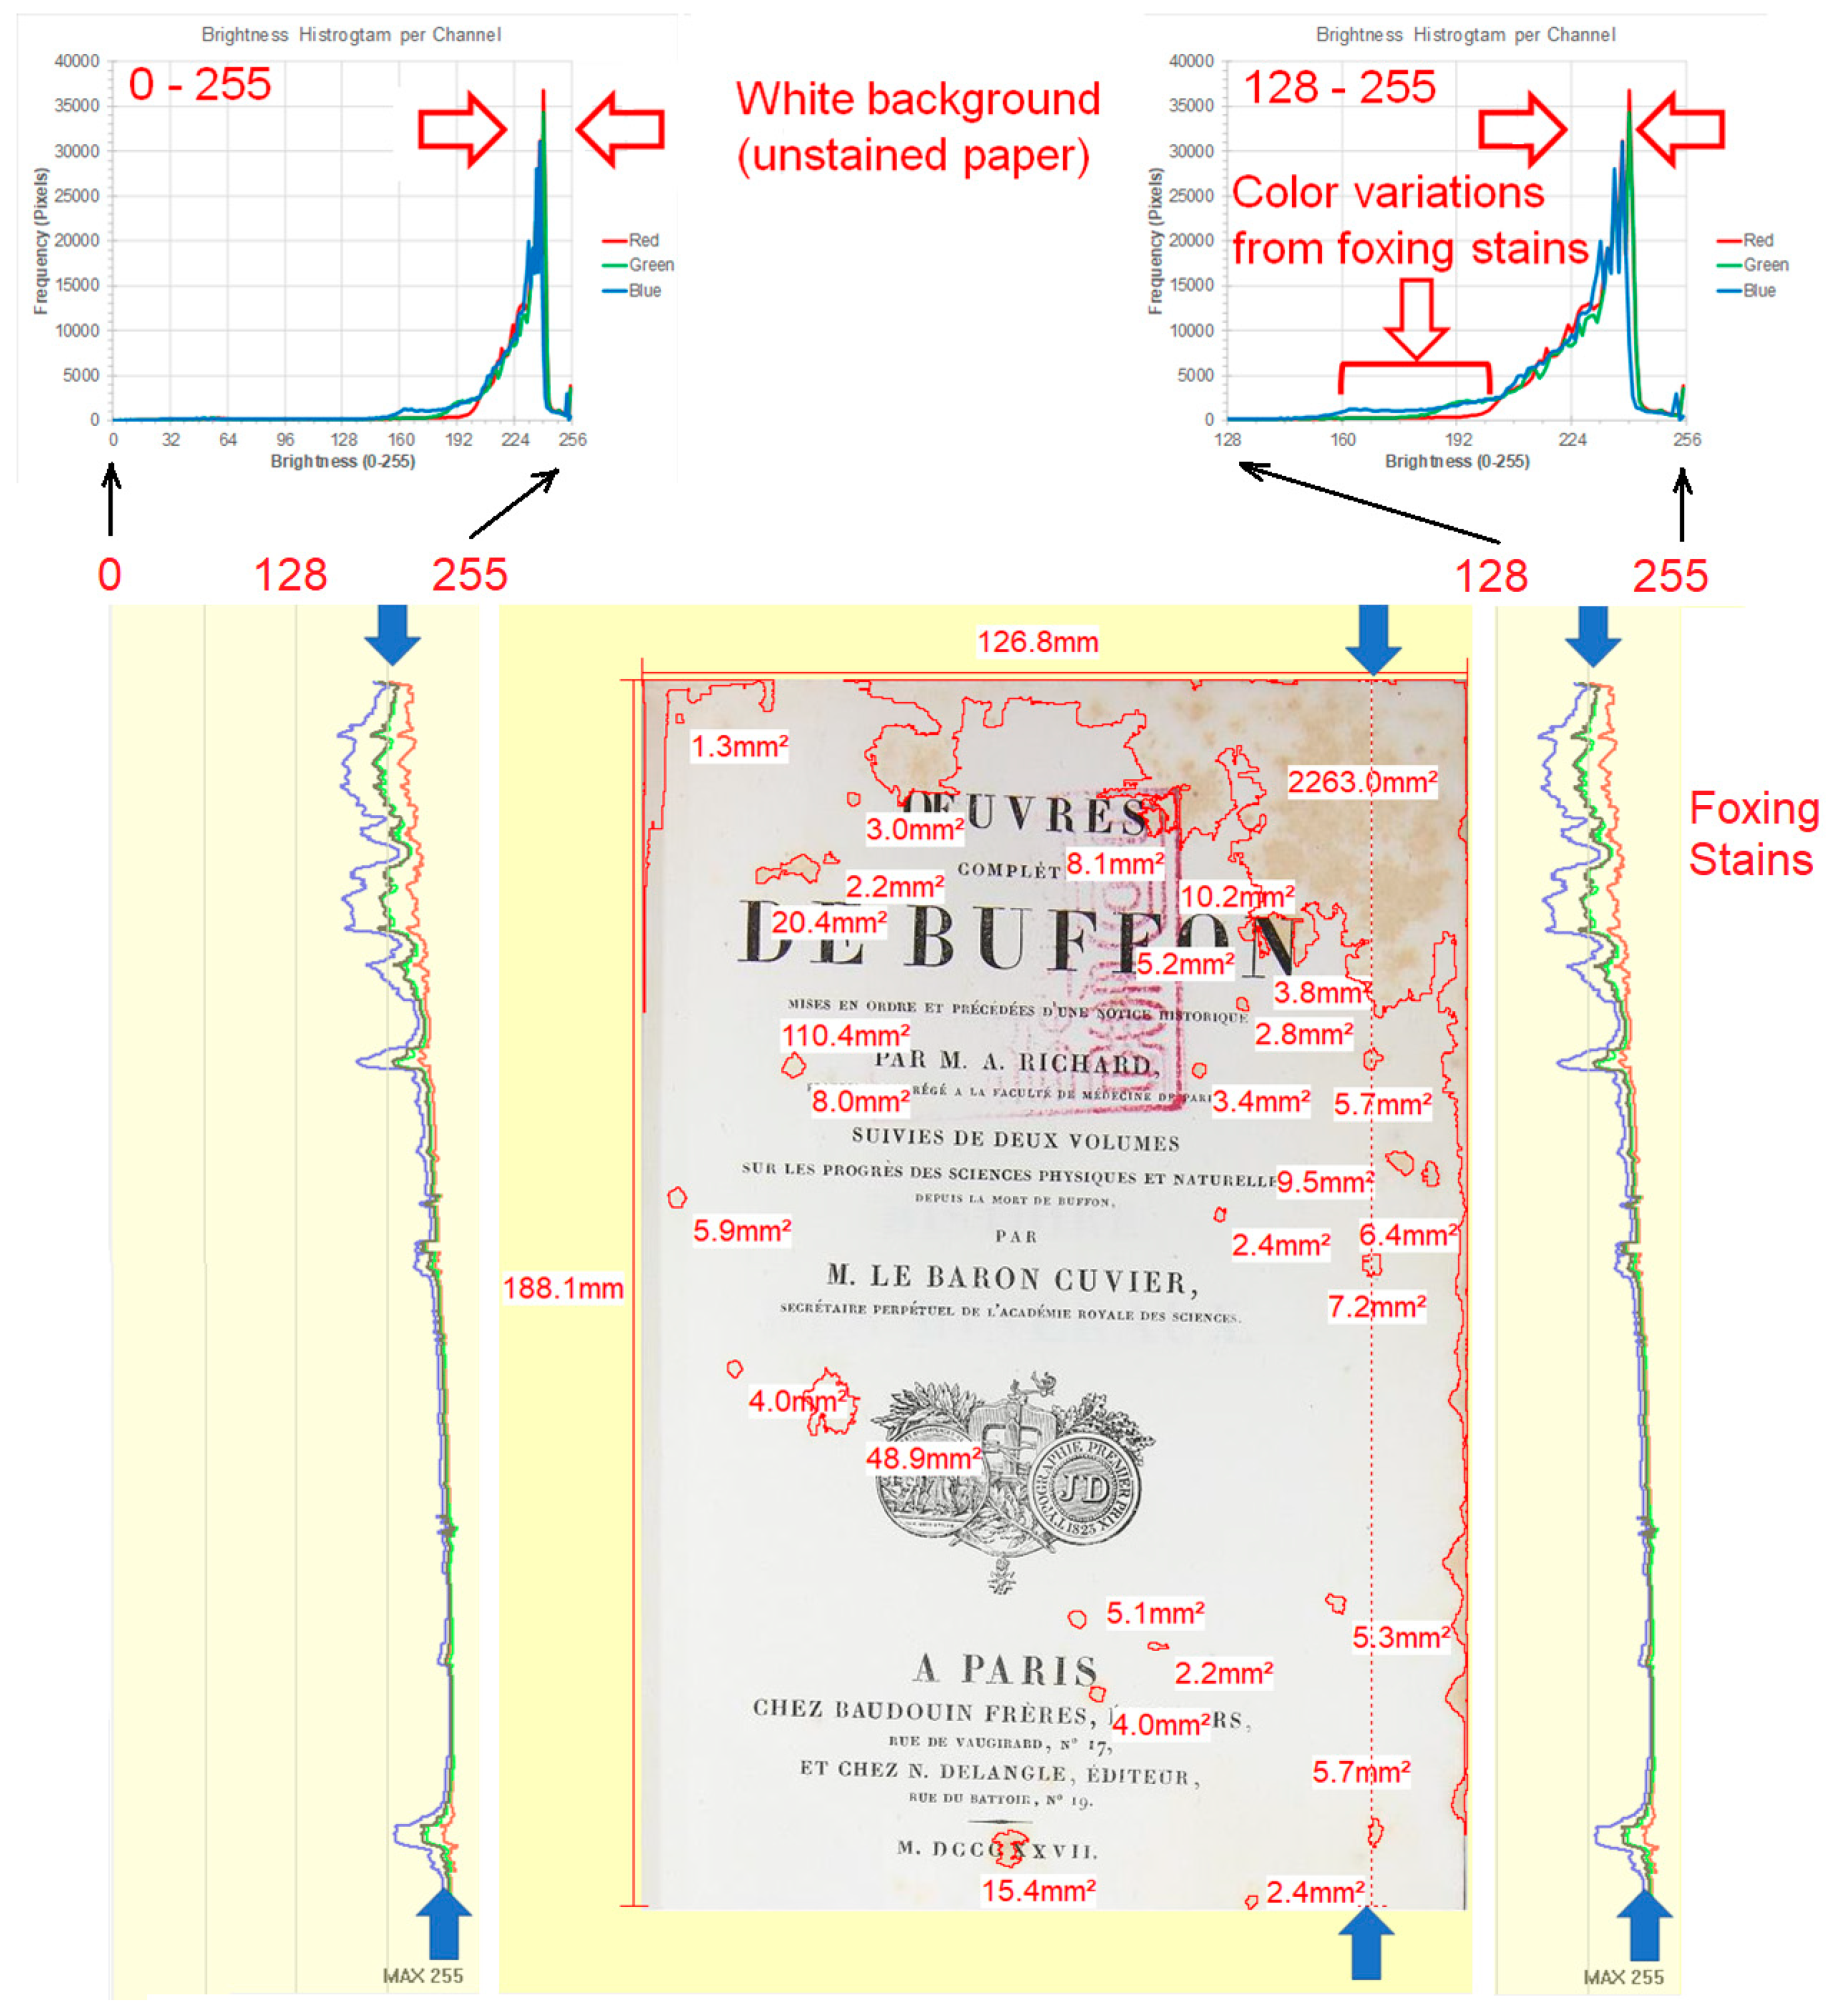
In a screen captured image of PicMan, foxing affected regions with area measurement values and color and brightness of RGB (red, green, blue) pixels on the vertical line on the book image were highlighted, indicated by blue arrows (
Figure 4). The area measurement values were calculated based on the small (20 cm long) grayscale and color separation guide photographed with the book. Forty millimeters (40 mm) on the scale was 180 pixels in the photograph, taken at a focal length of 47 mm. One pixel is equal to 0.22 mm in length. Thus, the resolution of length measurement in this image is calculated to be 0.22 mm/pixel. The area of one pixel in the image is equal to 0.048 mm
2. Consequently, the area measurement resolution is 0.048 mm
2. It has more than two times the minimum area measurement resolution target value of 1 mm
2. This was the minimum area measurement using the small JPG image file (1/4 × 1/4 = 1/16 of the area of original JPG file).
The brightness of all pixels in RGB colors, on the vertical line indicated by the blue arrows, are shown as line graphs in the left side of the book image. Red, green, blue, and gray lines correspond to the change in brightness levels in RGB components and their average in 0–255 (2
8 = 256 level scale). As seen in the
Figure 4, line segments affected by foxing stains showed significant brightness variations in blue color and green color components while brightness levels of the red color component were reasonably flat across the vertical line.
Based on this correlation between blue and green color brightness (intensity) reduction and the degree of foxing stain, we can easily define the foxing stain affected regions and calculate the areas of individual regions using the scaling reference of 0.22 mm/pixel (or 0.048 mm
2/pixel) (
Figure 4). Since we can measure the total area of the book, the number of foxing stain affected regions, areas of individual and total foxing stain affected regions, statistical analysis of foxing stain on the book can be done at the time of photographing. The statistical analysis results can be used as a quantitative measure of determining the degree of foxing stain damage.
3.2. Histograms of RGB Colors
The image of book with foxing stains has 497,080 pixels (= 578 × 860 pixels) in total. Brightness levels of all 497,080 pixels of RGB colors on the book image were extracted and plotted as histograms (
Figure 5). Since all colors have 8 bit information, the brightness range falls into 256 levels (2
8 = 256, 0–255 in value). Most of the book has bright (white) background and brightness levels of all RGB colors distributed above 200 in brightness level. Color variations from foxing stains cause the extension of tails for the blue and green colors as seen from the line intensity graph in
Figure 4 and
Figure 5. Color variations from foxing stains are easily recognizable in the histogram having brightness levels in the range of 128–255 (
Figure 5).
3.3. Statistical Analysis
Statistical analysis results on the image of the book with foxing stains are summarized in
Table 4 and
Table 5. The total number of isolated regions of foxing stains was counted to be 28. Minimum, average, and maximum areas of isolated regions affected by foxing stains were calculated and summarized in the table. The range and standard deviation of 28 isolated regions were also calculated for reference. Perimeter, base, height, equivalent diameter assuming a perfect circle, area-to-perimeter ratio, circularity, and centroids of x, y coordinates on the image were also calculated and provided in the tables. Note that the origin (x = 0, y = 0) of the image coordinate is the top left corner. This is different from conventional Cartesian (rectangular) coordinates used in mathematics. Y values become larger as they go down to the bottom. There are no negative values in x and y coordinates in image files.
The area-to-perimeter ratio is related to the degree of circularity in isolated regions. However, it is not normalized, and the values are proportional to the equivalent radius (one half of equivalent diameter assuming the isolated region as a perfect circle). The circularity is a normalized value independent of equivalent radius. The circularity value ranges from 0 to 1. The circularity 0 means that there is a length but no area (i.e., a line). The circularity 1 means that the area (r2) is r/2 of perimeter (2r), where r is an equivalent diameter (i.e, a perfect circle). The circularity indicates the shape and foxing stain generation mechanism.
The total area of the book image is measured to be 23,857.6 mm2 and the area sum of 28 foxing stain affected regions was measured to be 2571.7 mm2. A total of 10.8% of the paper was affected by some foxing stain. Quantitative measurement and statistical analysis of foxing stain affected regions were successfully demonstrated using the image processing and analysis software (PicMan).
3.4. Highlighted and Decorated Images
In addition to the quantitative and statistical summary of image-based characterization results, it is very important to visualize the characterization results as images for easy recognition and easy comparison. One can grasp the point instinctively by looking at highlighted images of characterization results with their numerical summary.
Figure 6 shows (a) the original photograph, (b) bleaching by using threshold switching functions of PicMan for exctracting printed images, and (c) an image after color inversion. The red library seal and foxing stains were removed after virtual restoration by image processing.
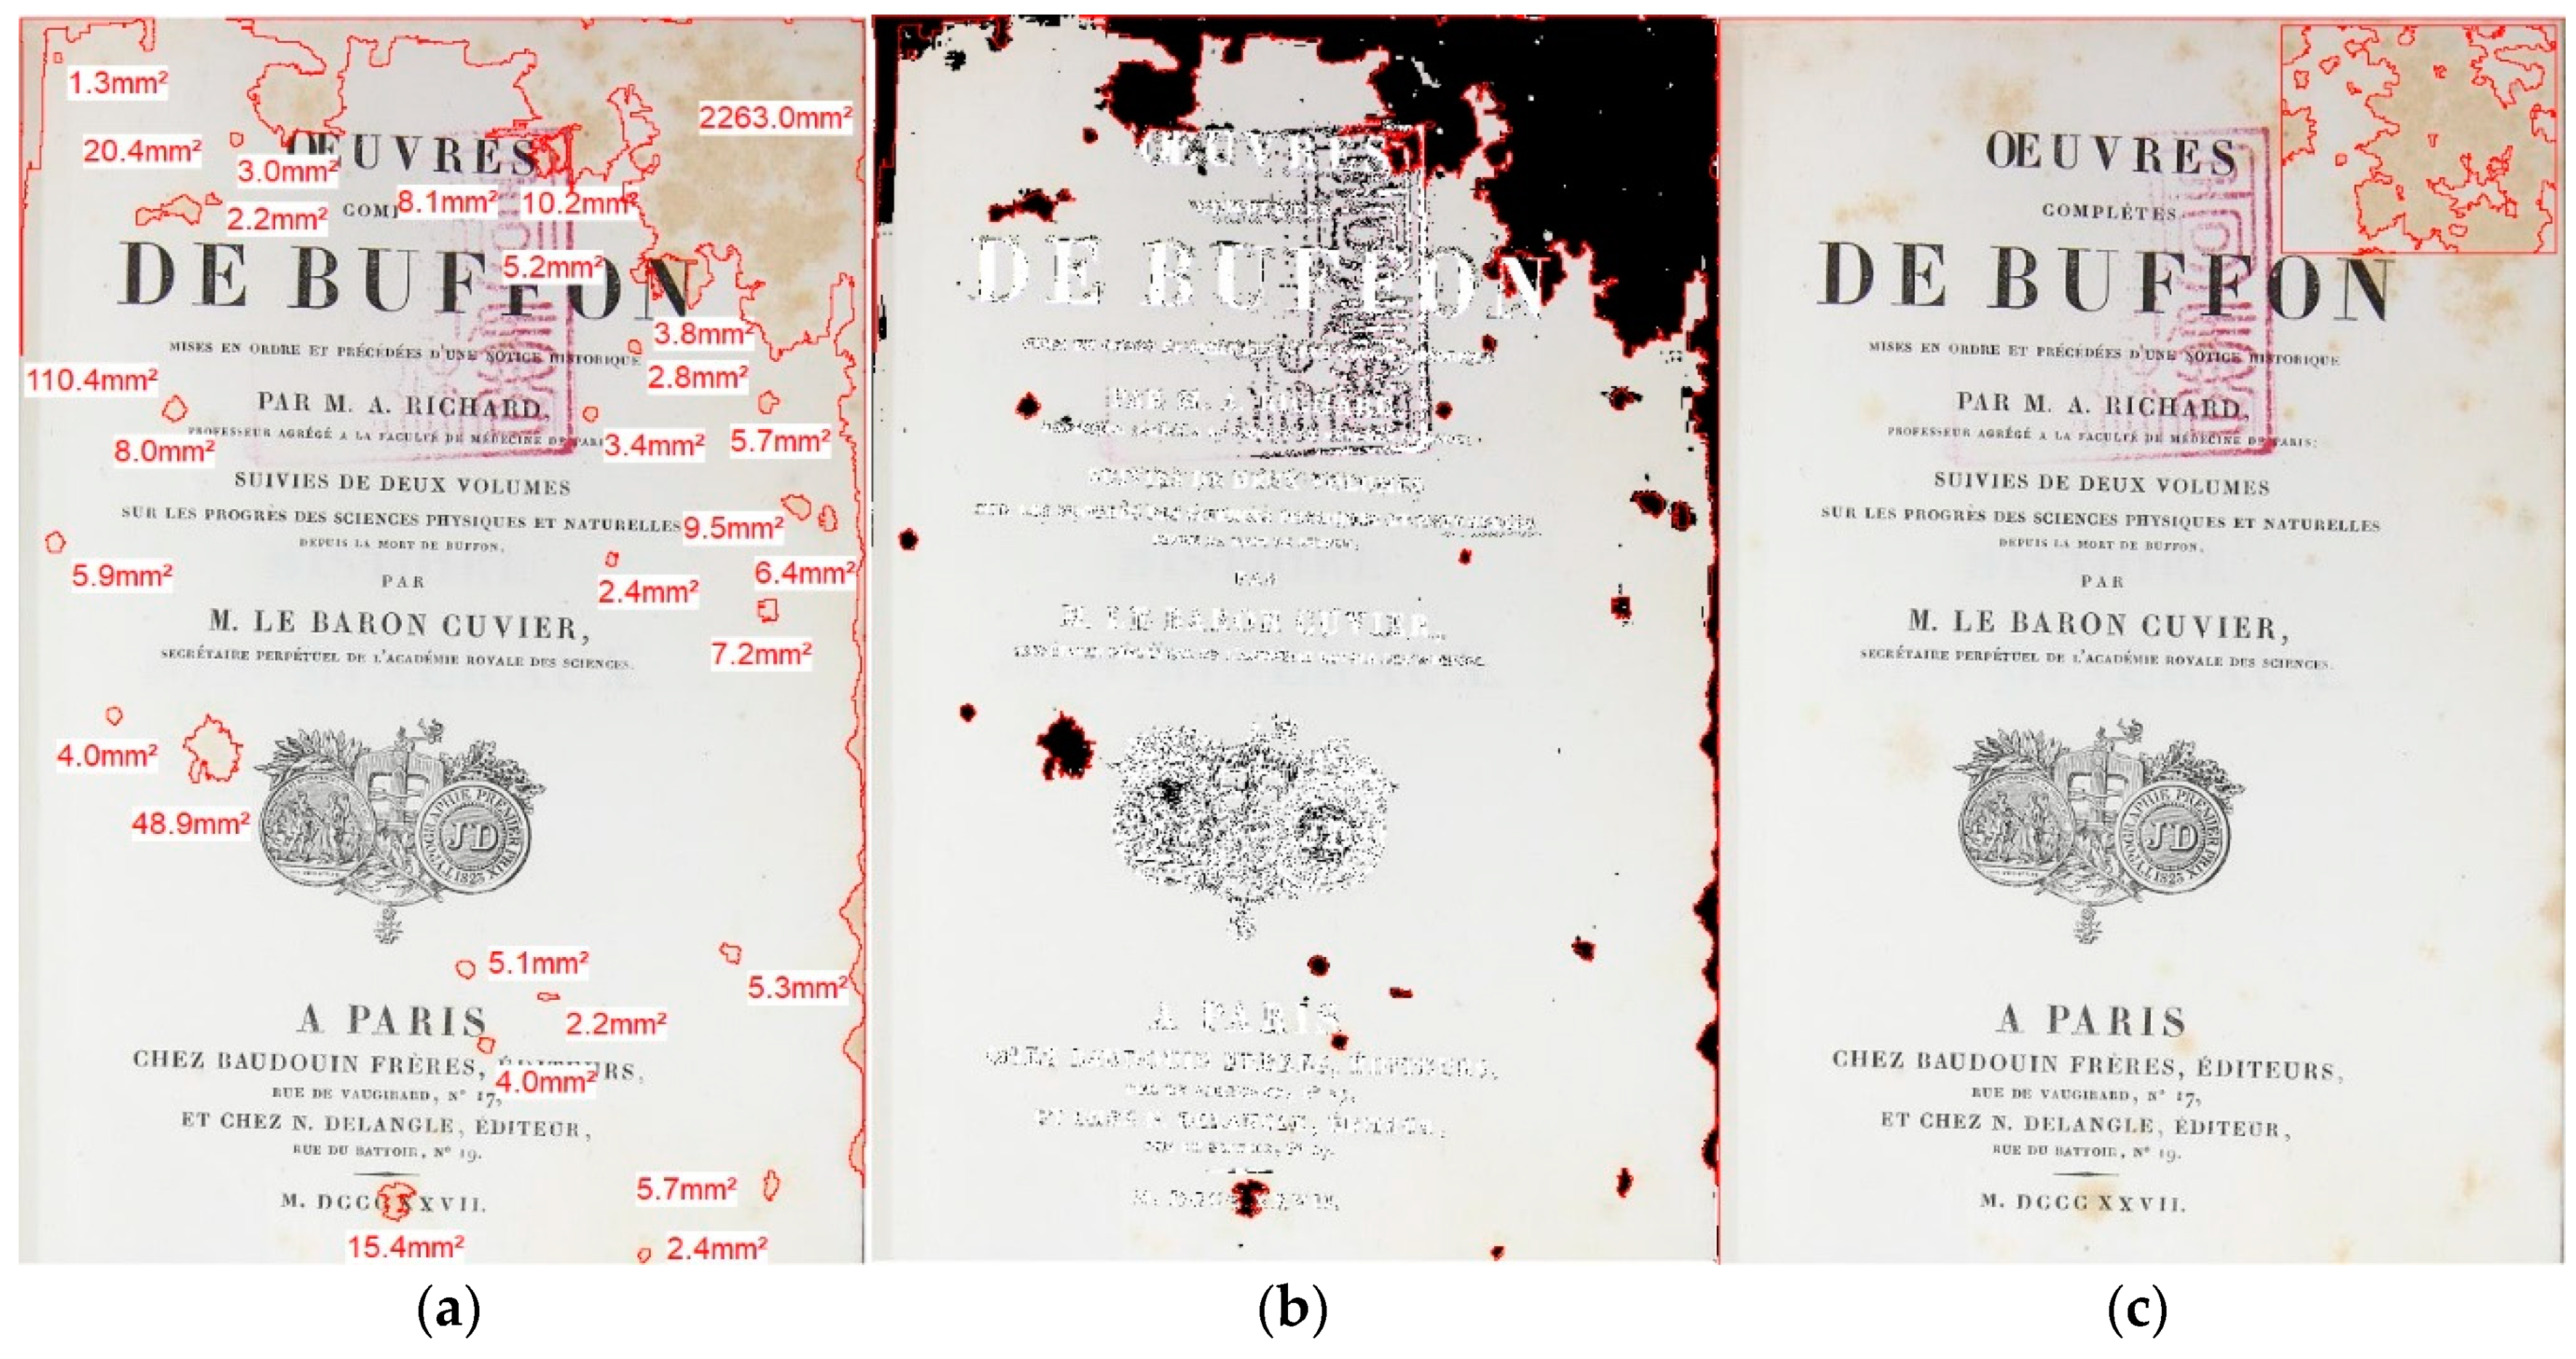
Foxing stain characterization results are expressed in
Figure 7 in three different ways. Isolated regions affected by foxing stains were highlighted with red lines. Area measurement values were displayed next to the highlighted regions (
Figure 7a). Printed letters were eliminated and regions affected by foxing stains were filled with black color for easy recognition of the affected region (
Figure 7b). Contour lines were added to the original photographic image for local characterization of the degree of foxing stains in the top right corner region (
Figure 7c).
4. Discussion
It is important to establish objective guidelines for effective record keeping, preservation, conservation, and restoration of old printed paper documents in the foxing process. Periodic photography and photographic image analyses will provide an important database for assessing and optimizing preservation, storage, and conservation environments for old paper documents.
As the performance of photographing equipment such as digital cameras and scanners improve, resolution and file size of images tend to increase dramatically. In the case of TIFF format images, one image file size can easily exceed a few hundred MB and are sometimes larger than 1 GB. It is very difficult to store, handle, and process such large size image files. Even though it is not an ideal situation, lossless PNG files, with medium size and lossy JPG files, with small size, may be used for projects, depending on the objectives of the tasks. Physical size of images and magnification of images (related to resolution) also need to be optimized for practical purposes.
Many people in this field, including image processing experts, try to store large size image files. Preservation of super-fine digital images and from the fixity point of view, file format and size may be very important, so as not to lose details and not to modify color information [
4]. However, it is important to find practical solutions which can be accepted by front line researchers in the field with limited access to high performance equipment. As discussed before, determining manageable size (physical size and file size) images, with sufficient resolutions for the task, must be investigated and defined so that all tasks can be completed with reasonable accuracy within the intended period of the project using available resources (people, equipment, technology, time, and budget).
Quantitative characterization and statistical analysis of foxing stains from photographic images using image processing and analysis software (PicMan) has demonstrated very promising feasibility for objective systematic characterization. Various image processing, image analysis, and image highlighting techniques were successfully demonstrated for foxing stain characterization. This image-based quantification and statistical analysis technique can be applied for many applications in cultural heritage recording, characterization, preservation, conservation, and restoration applications.
5. Conclusions
The feasibility of image-based quantitative analysis of foxing stains was studied for collections of old (16th–20th century) European books stored in the Rare Book Library of the Seoul National University in Korea. Quantitative characterization of the foxing affected areas on books from their photographic images was successfully demonstrated using a newly developed image processing software (PicMan). This image-based quantitative characterization method and technique can be applied for other cultural property characterization applications. Dimensional and color analysis of photographic images can be done easily and quantitatively. Histograms of RGB pixels of photographic images also provide additional reference for judgement. Importance of image quality, resolution, and digital file format requirement considerations were reviewed. Image-based quantitative analysis of foxing stains on paper documents including books are found to be very promising towards automation for objective characterization of photographic images of cultural properties. This technique can be used for a cultural property digital archive. Quantitative and statistical analysis techniques can be very useful for monitoring the effect of storage and conservation environment on the cultural properties. It can be applied for many applications in cultural heritage recording, characterization, preservation, conservation, and restoration applications.
Author Contributions
Conceptualization, G.K. and W.S.Y.; methodology, K.K. and W.S.Y; software, K.K. and W.S.Y.; data validation, G.K, J.G.K., K.K. and W.S.Y.; writing—original draft preparation, W.S.Y.; writing—review and editing, W.S.Y and G.K.; supervision, G.K.
Funding
This research was partially funded by the Library of Seoul National University, Korea.
Acknowledgments
The authors would like to express special thanks to Euna Kim (Doctoral course student and Research Associate) and Daseul Kim (Master course student) of Archeological Chemistry Laboratory of the Department of Cultural Heritage Conservation Science, Kongju National University, Korea, for their dedicated support during this project.
Conflicts of Interest
The authors declare no conflict of interest.
References
- Krstić, D.; Schauperl, Z. Characterization of Foxing Stains on Eighteenth Century Books. HDKBR INFO Mag. 2013, 3, 32–39. Available online: https://hrcak.srce.hr/148794 (accessed on 12 July 2019).
- Ramponi, G.; Bruni, V. Virtual restoration of faded photographic prints. In Proceedings of the 14th European Signal Processing Conference, Florence, Italy, 4–8 September 2016; Available online: https://ieeexplore.ieee.org/iel7/7065145/7065146/07071389.pdf (accessed on 30 March 2015).
- Stanco, F.; Tenze, L.; Ramponi, G. Virtual restoration of vintage photographic prints affected by foxing and water blotches. J. Electron. Imaging 2005, 14, 043008. [Google Scholar] [CrossRef]
- Tikhonov, A. Preservation of Digital Images; Question of Fixity. Heritage 2019, 2, 1160–1165. [Google Scholar] [CrossRef]
- Yoo, W.S.; Kim, G. An Application of Image Analysis in Conservation Science (I). In Proceedings of the 6th East Asian Cultural Heritage Conservation Symposium, Shanghai, China, 24–26 August 2017. [Google Scholar]
- Yoo, W.S.; Kim, J.G.; Kim, G. An Application of Image Analysis in Conservation Science (II). In Proceedings of the 7th East Asian Cultural Heritage Conservation Symposium, Daejeon, Korea, 29–31 August 2019; pp. 20–24. [Google Scholar]
- Arai, H. Foxing caused by Fungi: twenty-five years of study. Int. Biodeterior. Biodegrad. 2000, 46, 181–188. [Google Scholar] [CrossRef]
- Ardelean, E.; Melniciuc-Pauică, N. Conservation of Paper Documents Damaged by Foxing. Eur. J. Sci. Theol. 2013, 9, 117–124. Available online: http://www.ejst.tuiasi.ro/Files/37/11_ArdeleanMelniciuc.pdf (accessed on 12 July 2019).
- SHKLAR Books Installation Background and Operations. Available online: http://s-space.snu.ac.kr/bitstream/10371/117669/1/05.%5BSHKLAR%20문고%5D%20설치%20배경과%20운영.pdf (accessed on 9 July 2019). (In Korean).
- Cyber Memorial Collection. Available online: http://donate.snu.ac.kr/content/shklar-gerald (accessed on 9 July 2019).
- Small Greyscale and Colour Separation Guide by Danes-Picta. Available online: https://colorconfidence.com/products/small-greyscale-and-colour-separation-guide (accessed on 9 July 2019).
- Yoo, W.S.; Ishigaki, T.; Kang, K. Image Processing Software Assisted Quantitative Analysis of Various Digital Images in Process Monitoring, Process Control and Material Characterization. In Proceedings of the 2017 International Conference on Frontiers of Characterization and Metrology for Nanoelectronics (FCMN), Monterey, CA, USA, 21–23 March 2017; Available online: https://www.nist.gov/document/049pdf (accessed on 07 September 2019).
- Yoo, W.S.; Kang, K.; Kim, J.G.; Ishigaki, T. Image-based Dimensional Analysis for Semiconductor and MEMS Structures. In Proceedings of the 2019 International Conference on Frontiers of Characterization and Metrology for Nanoelectronics (FCMN), Monterey, CA, USA, 2–4 April 2019; Available online: https://www.nist.gov/pml/div683/conference/2019-fcmn-presentations (accessed on 07 September 2019).
- Zhu, C.; Espulgar, W.V.; Yoo, W.; Koyama, S.; Dou, X.; Kumanogoh, A.; Tamiya, E.; Takamatsu, H.; Saito, M. Single Cell Receptor Analysis Aided by a Centrifugal Microfluidic Device for Immune Cells Profiling. Bull. Chem. Soc. Jpn. 2019. [Google Scholar] [CrossRef]
- Ryu, S.; Yoo, W.S. A Basic Study on Conversion of Wooden Tablet Images into Digital Content using Quantitative Analysis. In Proceedings of the 7th East Asian Cultural Heritage Conservation Symposium, Daejeon, Korea, 29–31 August 2019; pp. 248–253. [Google Scholar]
© 2019 by the authors. Licensee MDPI, Basel, Switzerland. This article is an open access article distributed under the terms and conditions of the Creative Commons Attribution (CC BY) license (http://creativecommons.org/licenses/by/4.0/).


