1. Introduction
Damage to heritage monuments, both deliberate and inadvertent, has been a frequent aspect of armed conflict throughout history [
1]. However, recent examples of cultural destruction, such as the demolition of archaeological sites by the Islamic State armed group using explosives [
2] and the breaching of the old city walls of Raqqa by coalition airstrikes [
3], have brought the issue to prominence in public discourse. Constant improvement in firearms technology means that infantry small arms now also present a significant threat to built heritage. Despite the growing potential for the destruction of these small arms, the damage that ballistic impact and subsequent weathering can cause to buildings is often overlooked in conversations around cultural destruction [
4].
The increased capacity for damage that has resulted from the evolution of firearms technology has been explored in a number of studies. Krenn, Kalaus and Hall demonstrated through test-firing early small arms that modern assault rifles have significantly increased accuracy, range and kinetic energy at impact when compared with muskets available in the 16th century [
5].
These conclusions are supported by the findings of Mol and Gomez-Heras [
6], who investigated the surface hardness of sandstone building blocks impacted by musket balls during the English Civil war, and limestone blocks impacted by modern spitzer shape (pointed) projectiles fired by the Mauser M1893 [
7]. The stone impacted by the lower velocity, rounded musket ball was found to have been compacted at the impact site, raising the surface hardness of the stone in these areas. Conversely, the stone impacted by the Mauser projectiles was found to have reduced surface hardness in the immediate impact sites and the areas surrounding them [
6]. Thus, it has been shown that analysis with surface hardness probes can distinguish between impact craters in stone and surrounding non-impacted areas. Therefore, it is likely that surface hardness surveys of impacted stone could compliment other techniques such as permeability analysis in identifying areas of weakness in impacted stone which are most at risk of further degradation.
Miao et al. have shown that an increasing fracture density increases the permeability of a fracture network in stone [
8]. Therefore, a permeability survey of the surface of stone impacted by a small arms projectile would likely aid in the identification of surface fracture networks. In addition to contributing to the degradation of the surface of the stone, the presence of surface fractures caused by projectile impact has been shown to be indicative of a wider fracture network in the interior of the impacted material [
9]. Thus, a permeability survey could also identify areas of interest on the surface of impacted stone which could then be assessed for interior fracture networks using other techniques.
Some work has been done to explore the damage mechanisms by which high velocity (500–1300 ms
−1) impacts weaken stone. Dynamic fracture propagation has been demonstrated to be a principle damage mechanism for impacts into brittle materials [
10,
11,
12]. Fractures exhibit three principle morphologies: radial fractures which propagate outwards from the point of impact, both in a spoke like fashion, and conically into the rock; concentric fractures in a hemispherical orientation around the impact site; and spallation fractures parallel to free surfaces [
13,
14,
15]. Radial fractures form first, directly behind the initial, quasi-spherical compressive phase of the shock wave. This results in a peak tension parallel to the wave, and thus a radial fracture orientation at 90° to this [
14,
16]. Concentric fractures form quasi-spherically around the impact as they are the result of the tensional phase of the shockwave, thus peak tension is at 90° to the compressional phase [
14]. Finally, spallation fractures form as the compressional phase of the shock wave reflects off a free surface as a tensile wave of equal magnitude, generating a peak tension perpendicular to the free surface [
13,
16].
Additional research into the propagation of fractures in rock and other brittle materials has allowed the development of numerical modelling of fracture induced damage to rock, stated in the Johnson–Holmquist damage model (J–H) [
10]. The model has been refined in successive iterations, and J–H2 numerical modelling has been applied to understand the damage to brittle materials caused by ballistic impact induced fracture networks [
17]. However, the J–H2 model does not describe the spatial distribution of fractures within rock, and an understanding of this spatial distribution will be crucial in assessing damage to heritage buildings for the purposes of conservation work [
18]. In addition to this, understanding fracture networks will aid in identifying likely points of ingress for weathering agents such as moisture and salt which may further degrade the structure [
19,
20].
As well as macroscopic fracture damage, the fracturing of constituent grains is a common feature observed through microscale analysis with both electron and optical microscopy techniques. Polanskey and Ahrens described a hemispherical region directly below the impact site with a high density of small fractures and significant grain and pore size reduction through crushing and shear fractures [
13]. This zone of compaction and shear fracture is observed in impact experiments into water ice [
16], and by using micro-computed tomography (µCT) on stone impacts [
6]. Further microstructural observations made by Mol highlight the association of quartz fracturing with proximity to the impact [
21]. They present optical microscopy evidence of networks of parallel and high angle micro-fractures transecting grains directly adjacent to the impact site. This is supported by back scatter electron (BSE) imaging of quartz grains from the impact site, depicting a high density of micro fracturing and material loss [
6,
21].
Previous studies have focused on the effects of low velocity, deformable projectiles such as musket balls and 0.22 lead bullets [
4,
6]. Having highlighted the use of permeametry and surface hardness in identifying damaged areas of stone, this work will seek to investigate fracture networks arising in sandstone from modern 7.62 × 39 mm ammunition (fired by AK-47 type weapons) using these methods. This research is necessary to understand the damage that modern military projectiles with higher kinetic energies can cause to stone used in built heritage and will inform future conservation strategies. Furthermore, given the difficulty in accessing heritage sites damaged during armed conflict, and the irreplaceable nature of heritage assets, the development of methods which are portable, rapid, and non-destructive for detecting and assessing ballistic damage to stone will be invaluable in ongoing attempts to develop conservation strategies in conflict areas. This work also has the potential to increase the number of techniques available to conservation professionals when assessing ballistic damage to stone, as none of the previous works discussed here have explored the potential of permeametry analysis for this purpose.
3. Results
3.1. Surface Hardness Survey Results
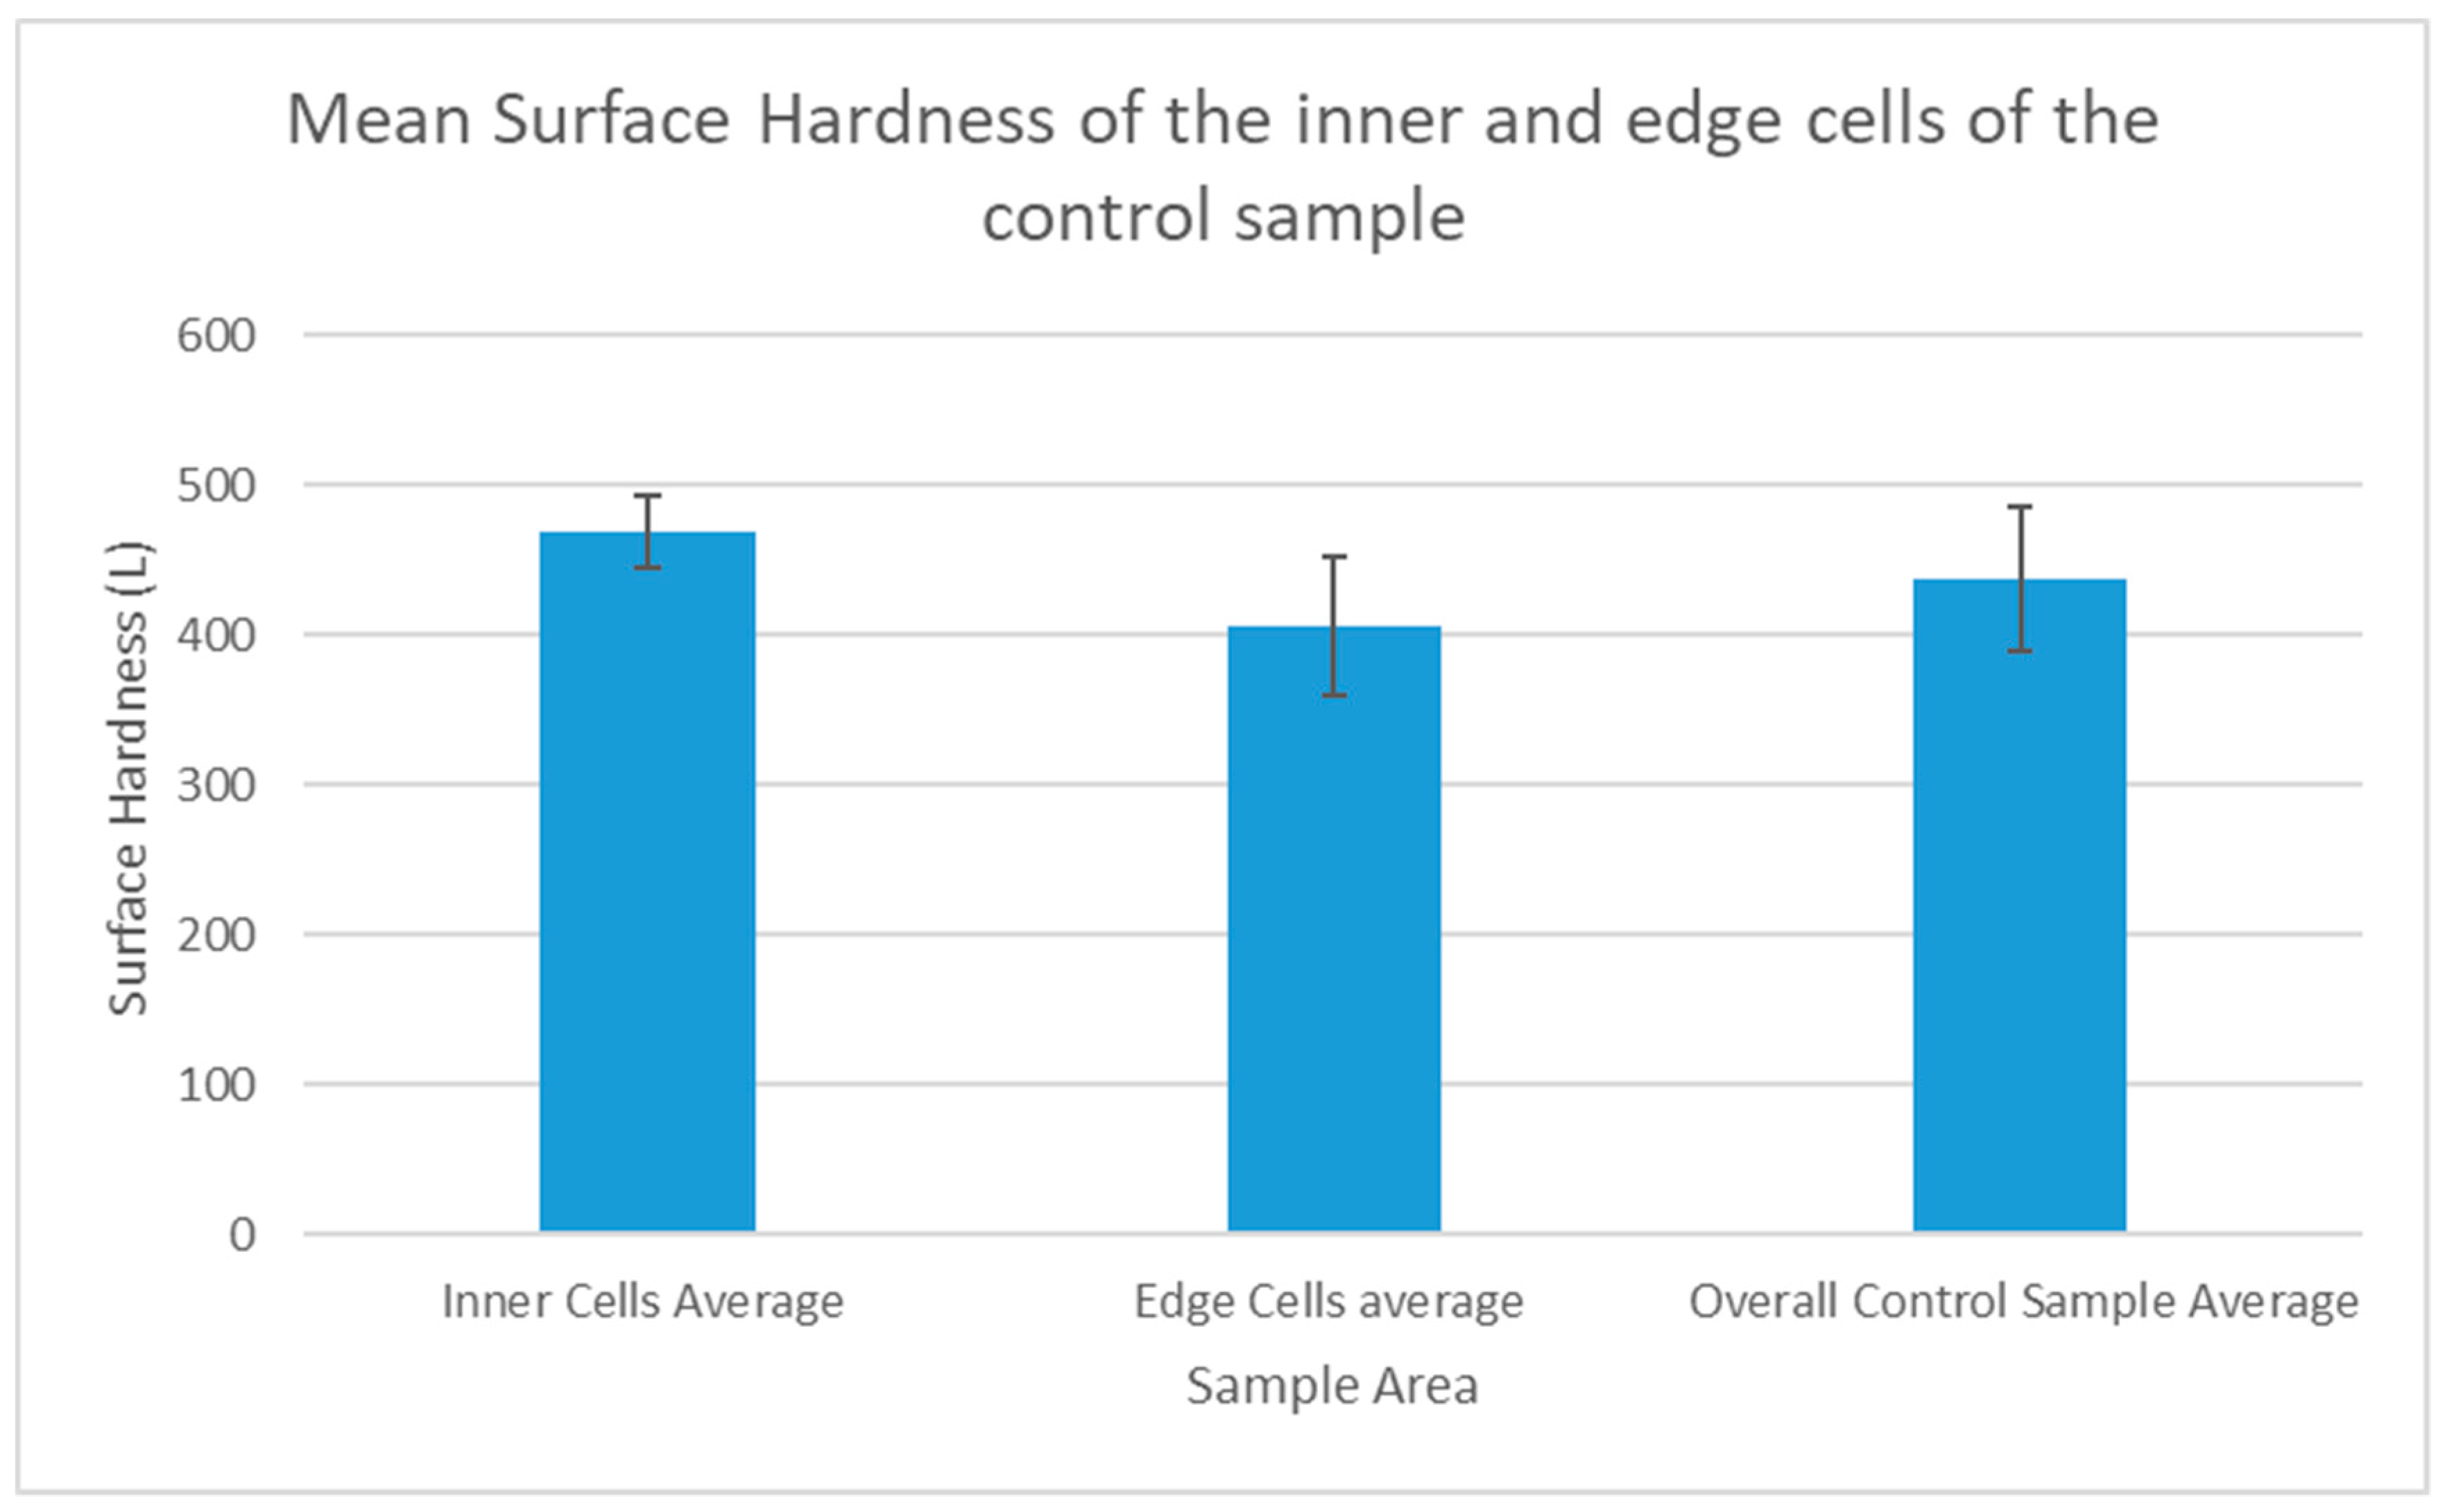
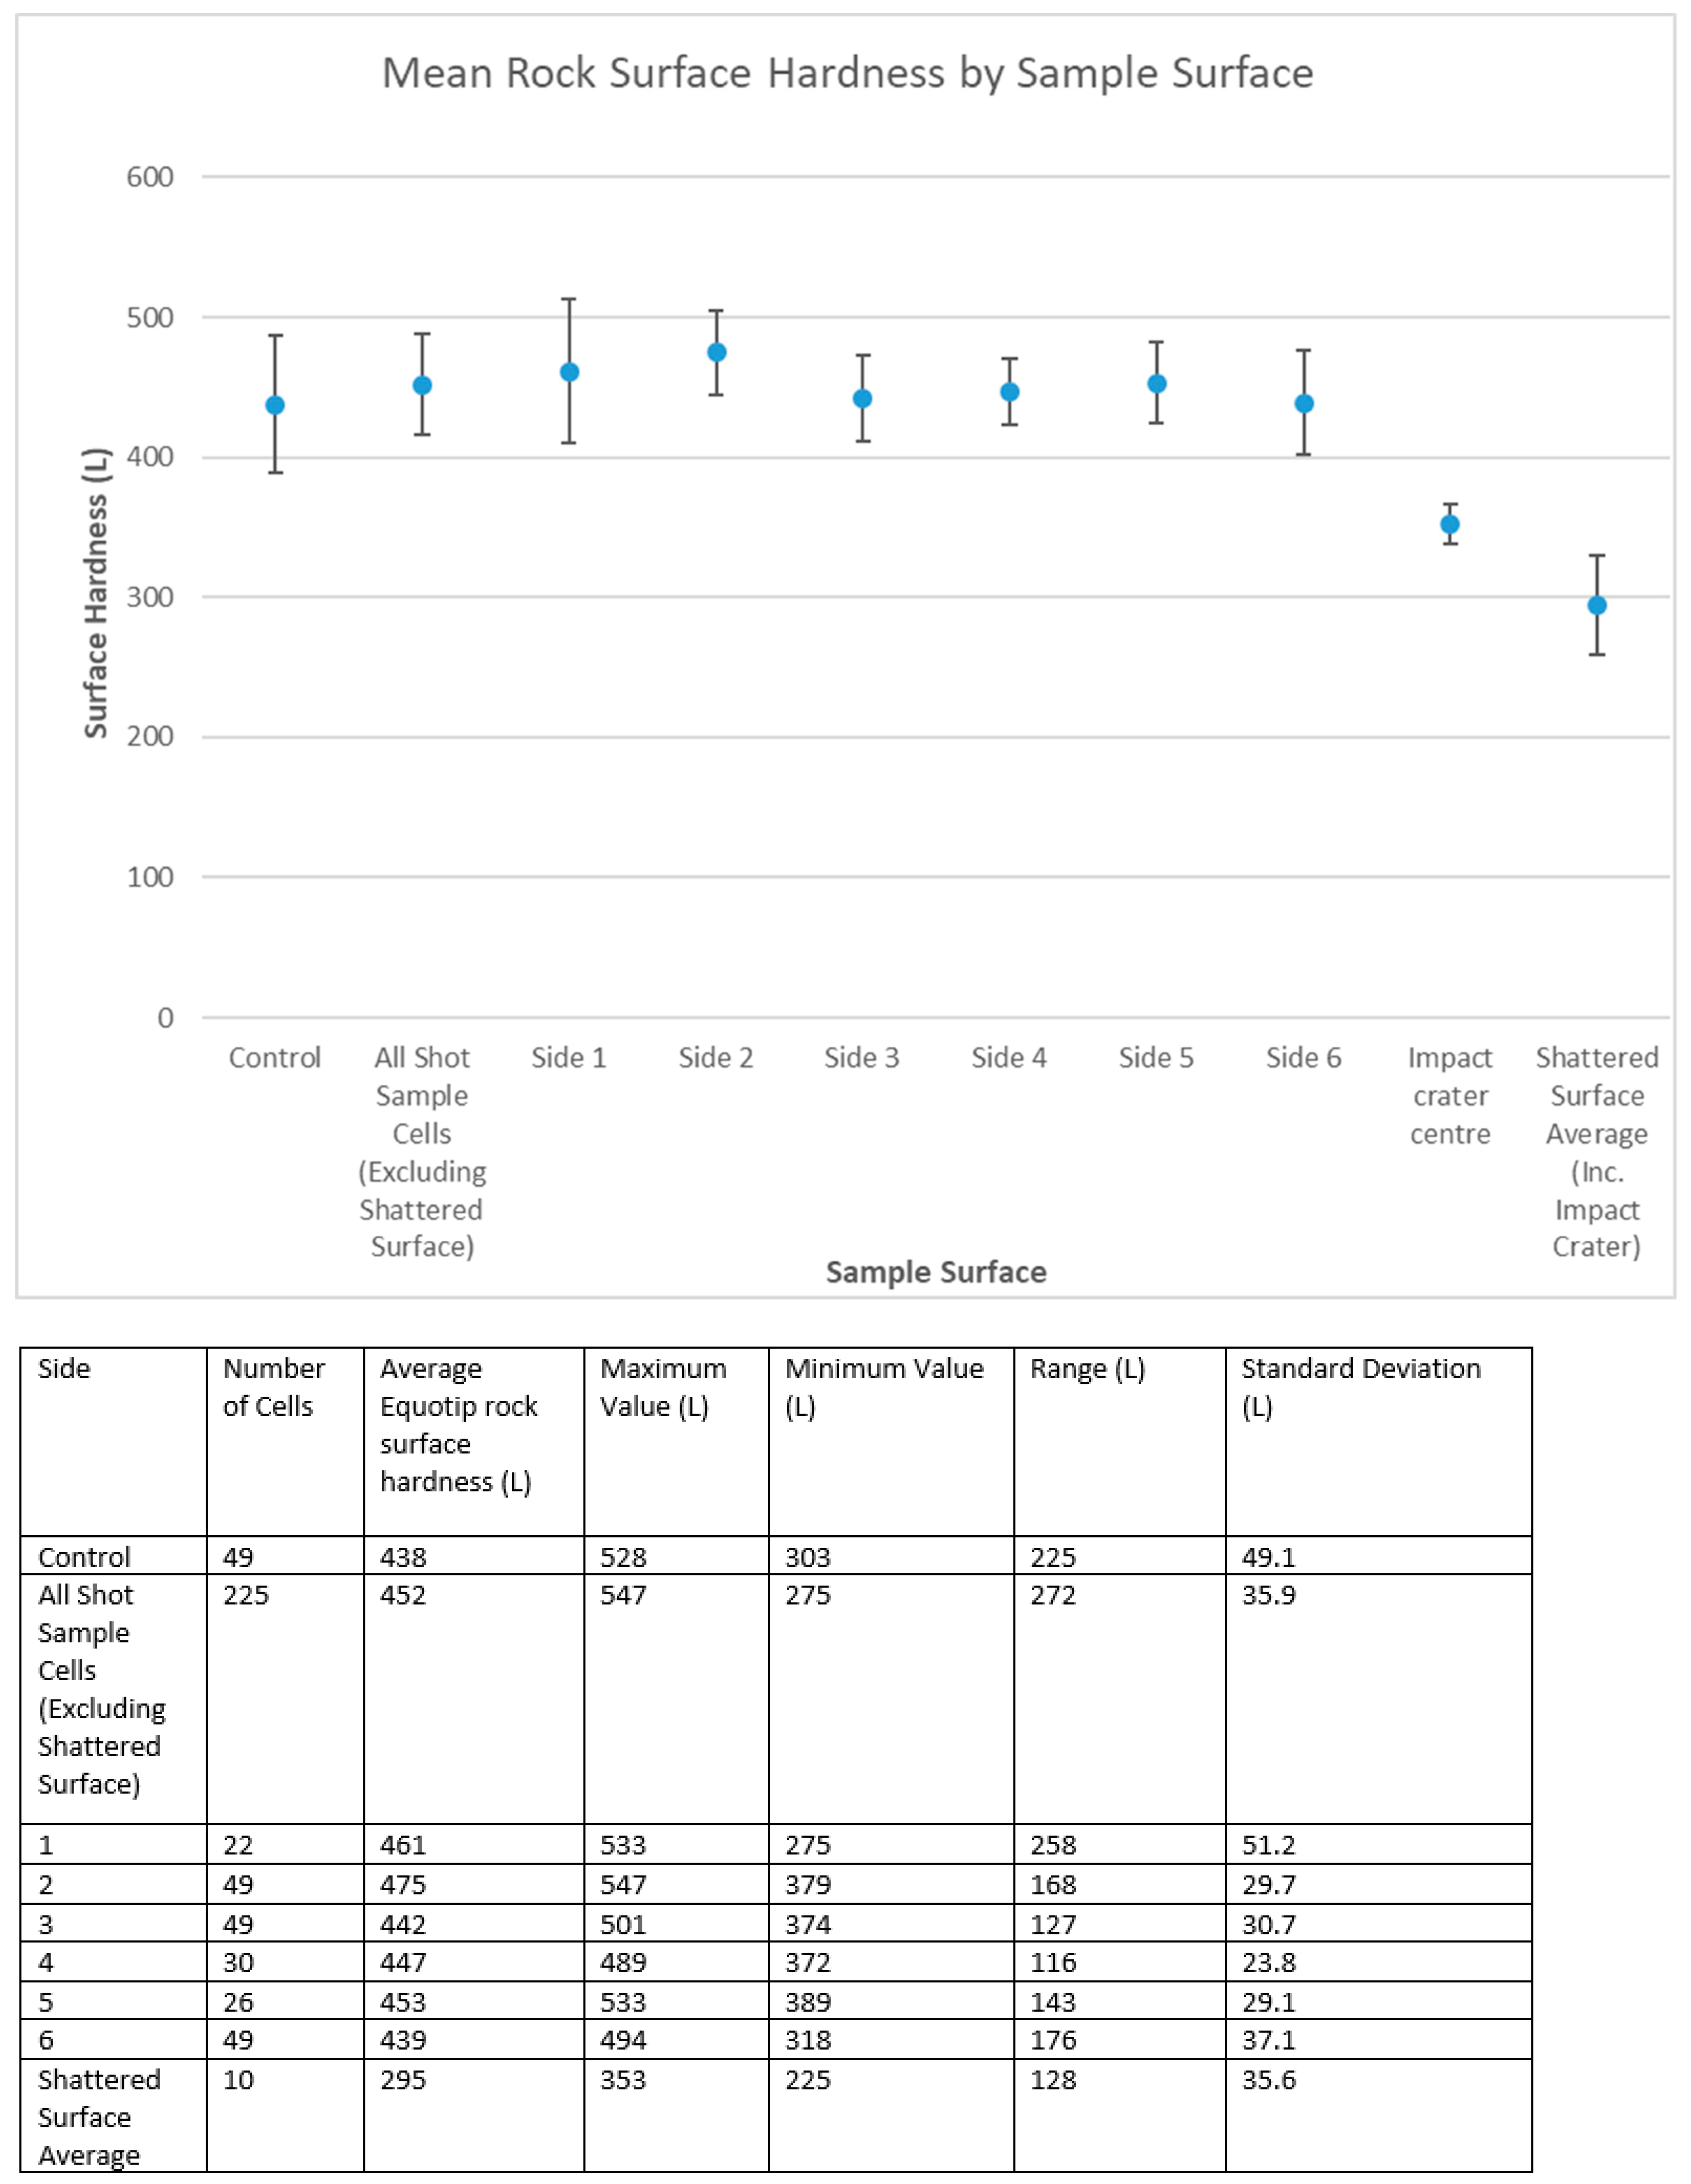
As shown in the table associated with
Figure 8, the average surface hardness of the six numbered faces (1–6) range from 435 to 475 L. The control sample fits inside this range and, in terms of surface hardness, is consistent with the six numbered sides of the impacted sample. The fact that these sides have an average hardness comparable to the control sample suggests that surface hardness is not a useful metric when seeking to assess which of the numbered sides of the sample are most damaged by the impact.
To demonstrate this, the overall hardness data of all 225 cells of the shot sample (excluding the shattered surface) was compared to the control sample data using a Mann–Whitney U test, and found to have no statistically significant difference from the control sample (p = 0.116).
However, the mean hardness for the shattered surface (295 L) was found to be significantly lower than both the mean hardness of the control, and the non-shattered sides of the sample (both tests: Mann–Whitney U test, p = 0.000). Therefore, the Equotip surface survey demonstrates a statistically significant reduction in hardness across the shattered surface.
Furthermore, in
Figure 8, side 1 exhibits a larger standard deviation (error bar) than the surfaces which were not directly impacted by the bullet: 51 L for side 1 vs. an average of 30 L for the other numbered sides of the impacted sample. A higher standard deviation of Equotip readings can be indicative of advanced weathering of a rock surface [
26,
28]. Therefore, the fact that side 1 has the highest standard deviation could suggest that the degradation effects of projectile impact are comparable to those of weathering systems but act instantaneously. However, given that this data set only includes one surface which experienced direct impact (side 1), more investigation is required to ascertain whether the heightened standard deviation of the impacted side of a sample is statistically significant.
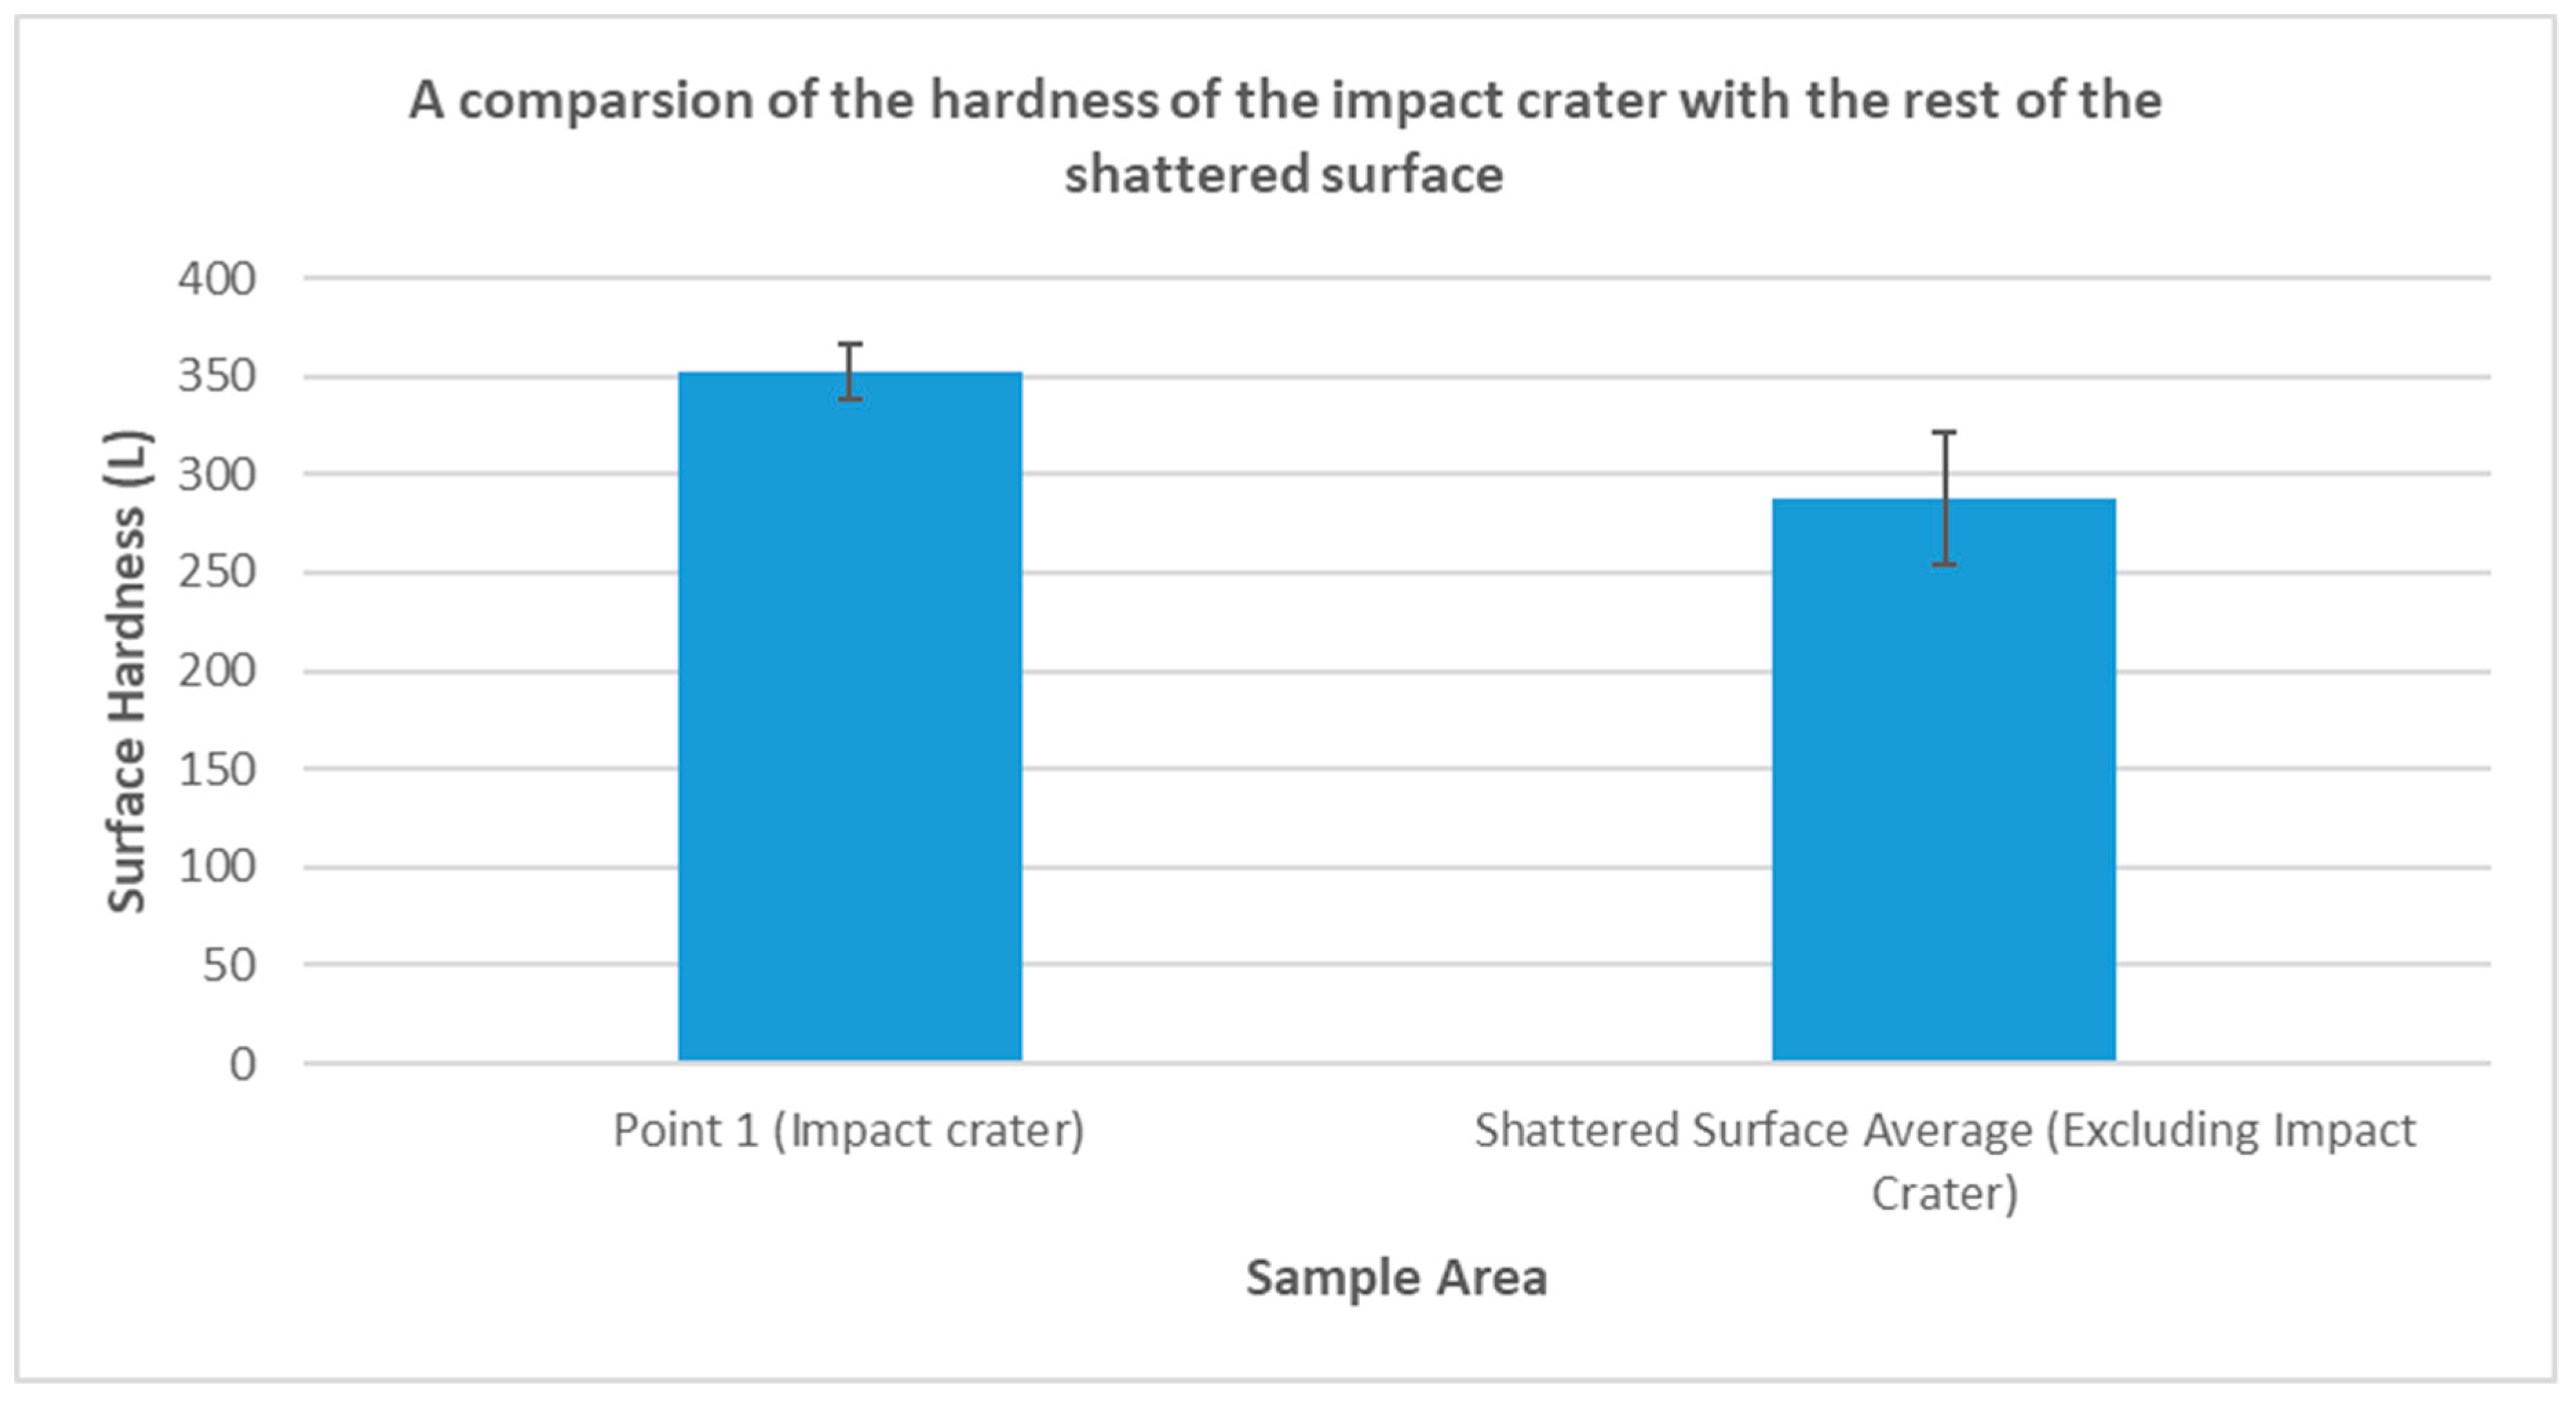
Figure 8 and
Figure 9 demonstrate that the impact crater has a higher average hardness than the rest of the shattered surface (353 L mean for the impact point vs. 288 L mean for the rest of the shattered surface). This is likely indicative of compaction and realignment of clay minerals within the matrix, as observed using optical microscopy by Mol et al. [
4] on samples of the same Huesca sandstone. X-ray diffraction analysis (XRD) conducted by Mol et al. on the Huesca sandstone identifies the relatively high proportion of clay minerals (13% muscovite, 6% kaolinite), which facilitate compaction as a response to impact shock at the impact site [
4]. The comparatively lower reduction in surface hardness at the impact site, compared to the wider shattered surface, can be viewed as comparable to the apparent surface hardness increases seen on heritage stone damaged by ballistic impacts observed in the field [
6].
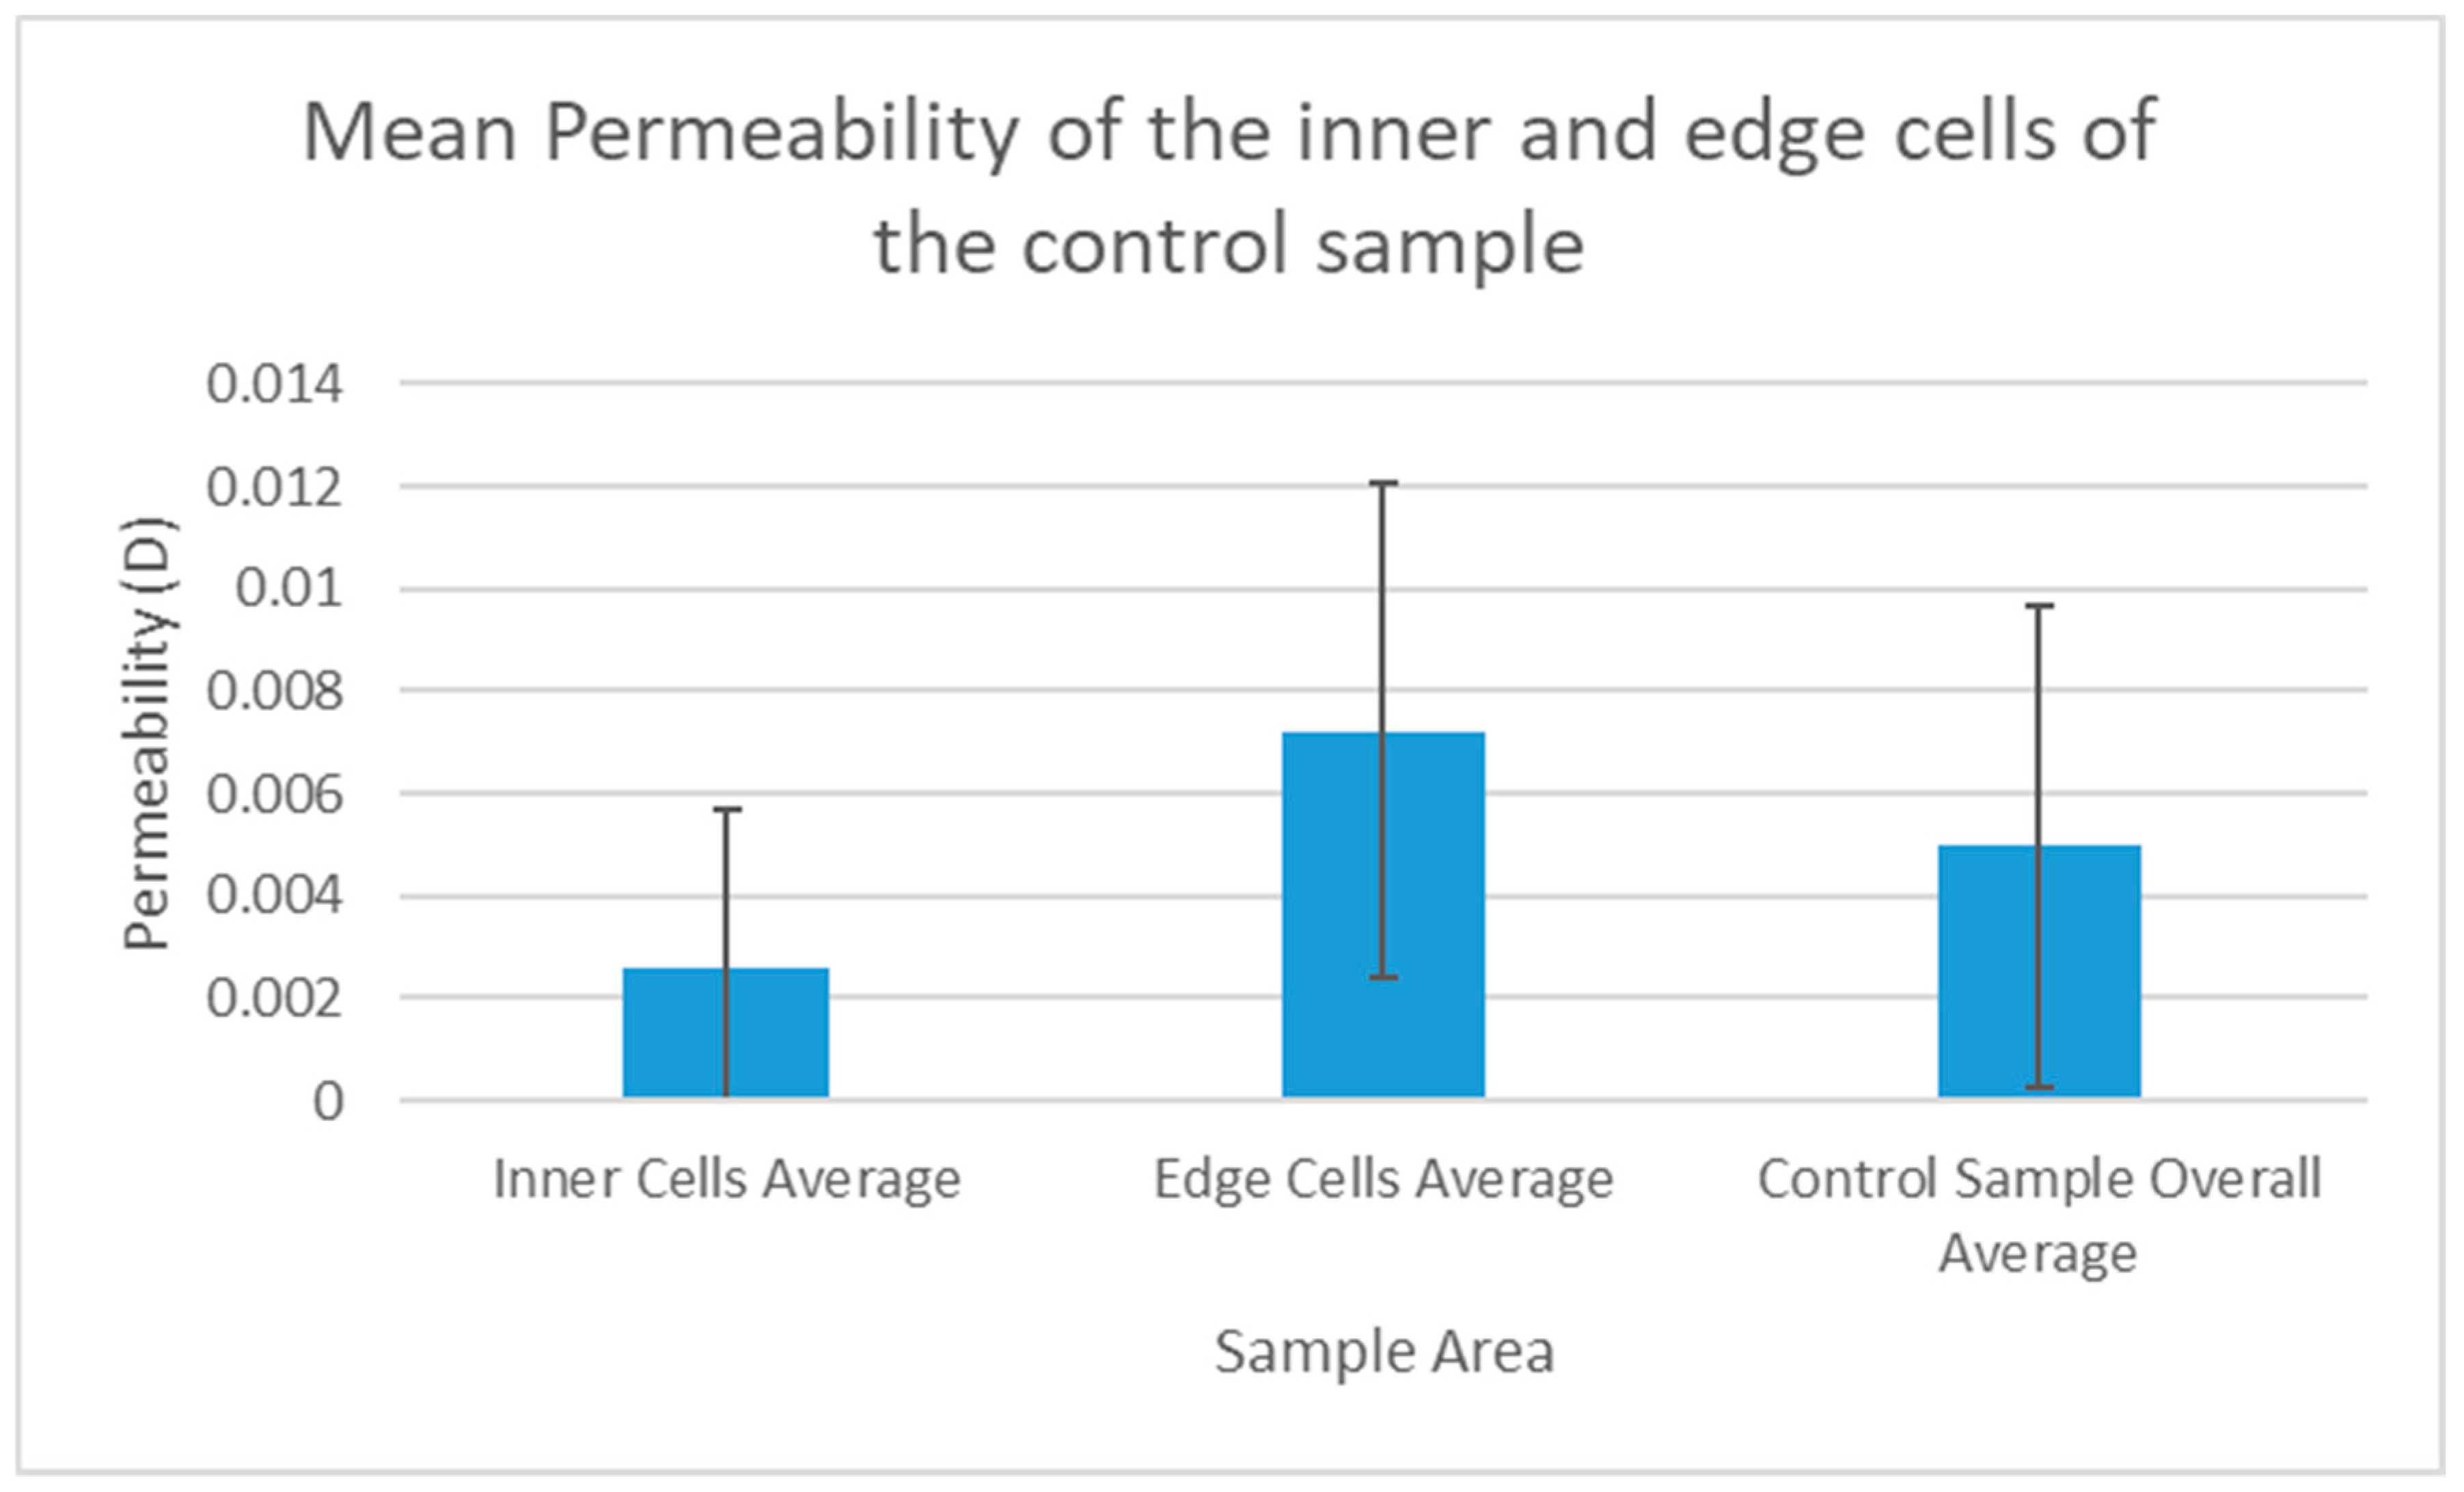
3.2. Permeametry Survey Results
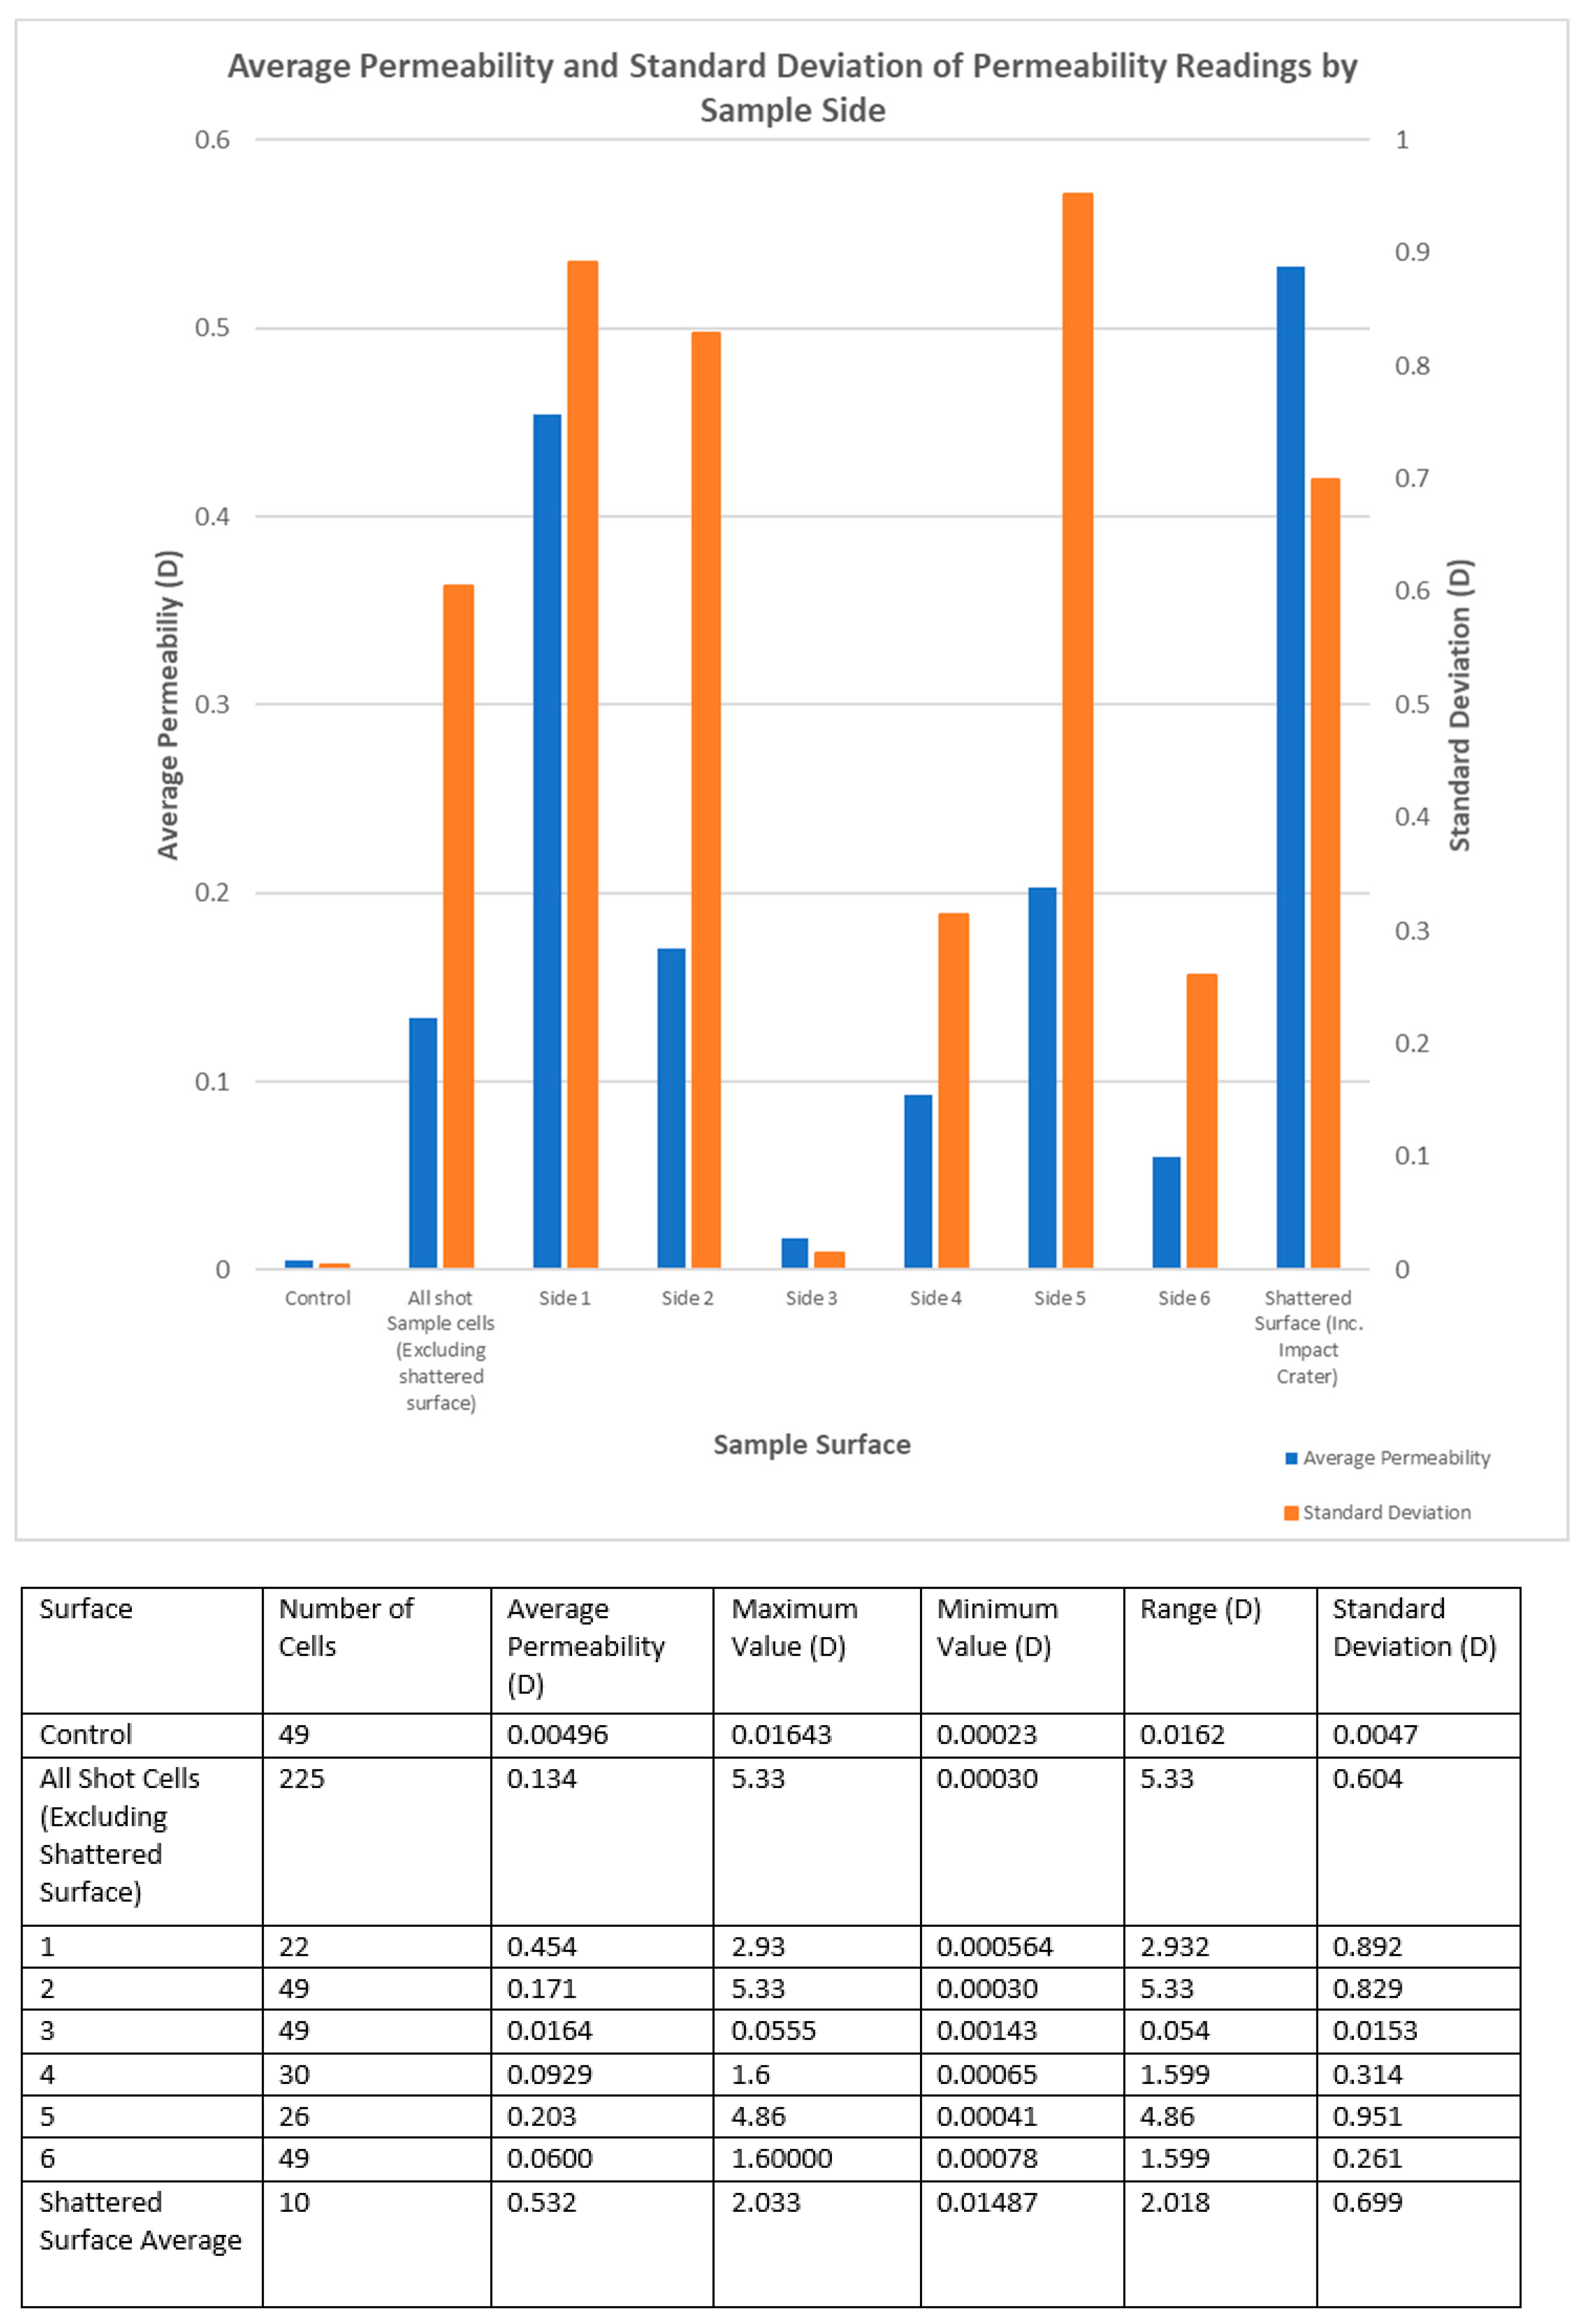
In contrast to the data obtained from the Equotip survey, the permeametry data for all 225 non-shattered cells was found to be significantly different from the control sample (Mann–Whitney U test, p = 0.000). This is reflected in the fact that all surfaces of the impacted sample show a great deal of variation, both in relation to the control and in relation to each other (
Figure 10).
Side 1 and the shattered surface show the highest permeability, reflecting the large number of visible fractures across these areas of the sample. The increased permeability seen across side 1 and the shattered surface are due to the fact that the projectile impacted side 1 directly, leading to greater damage in this area and across the adjacent shattered surface.
The sides with the lowest permeability readings were sides 3 and 6. This is likely because side 3 is the antipode of side 1, and thus furthest away from the impact. Therefore, the reduced damage exhibited by side 3 corresponds well with known models of impact damage in rock, in which shock wave energy reduces with distance from the point of impact [
29]. Side 6 probably experienced less damage because, at the time of shooting, this side was facing downwards on the target area. This meant that it was the only side with compression/containment, i.e., the mass of the block above it pushing it downward onto the target structure on the firing range.
Permeability readings across a given side of the sample were often found to have ranges spanning orders of magnitude, which would give standard deviation error bars that were so large as to obscure the data itself. For this reason, the standard deviation of the permeability data has been plotted separately in
Figure 10 rather than as an error bar, and other statistical information on the data set is listed in the associated table.
It is worth noting in
Figure 10 that the sides previously hypothesised to be least damaged by the projectile impact, sides 3 and 6, have the lowest standard deviations. This suggests that, as with the Equotip measurements, the standard deviation of a permeability data set for a given surface of an impacted sample may be related to the damage sustained by it during impact. This is supported by statistical reasoning, as a lower standard deviation would imply a largely homogenous surface without surface fractures which increase the range and standard deviation of the data set for that side. This is indeed the case with side 3. This notion is also supported by the fact that the non-impacted control sample had both the lowest average permeability and the lowest standard deviation.
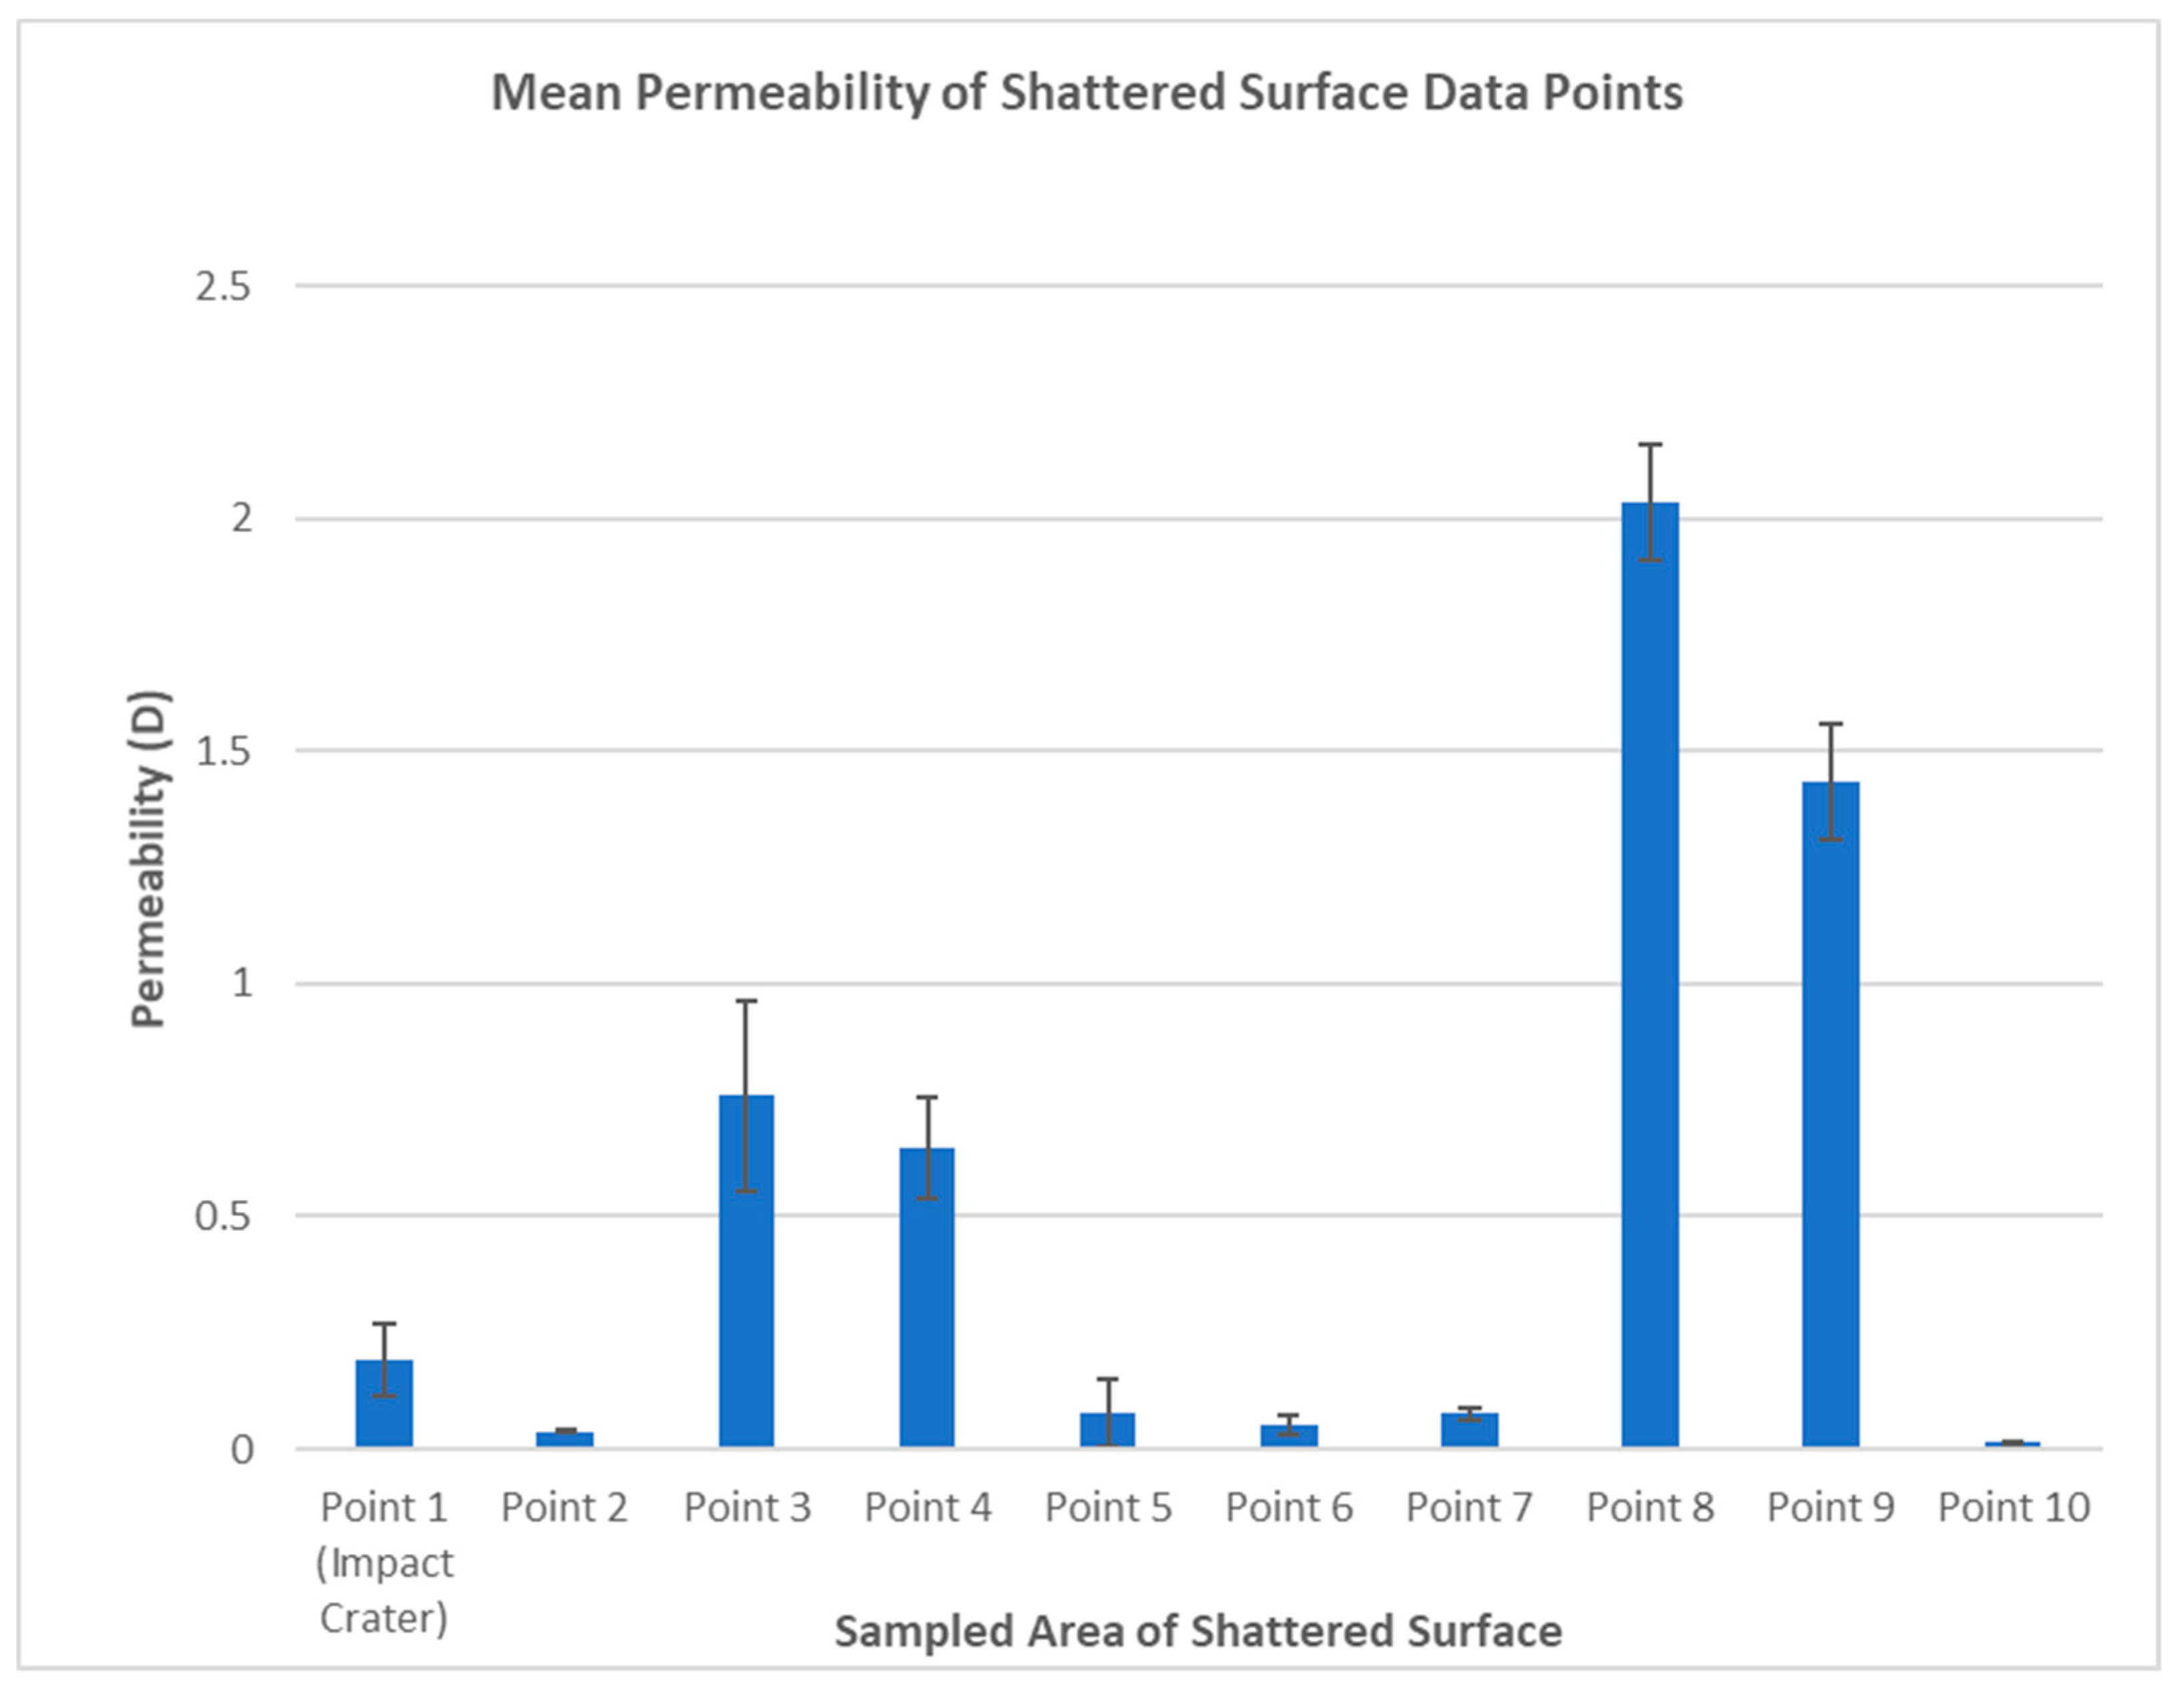
The hypothesised compaction at the impact site (point 1 of the shattered surface), which is thought to result in a lower reduction of surface hardness, may also be responsible for a reduction in permeability. The shock generated upon impact can realign clay minerals and reduce moisture flow, as discussed by Mol et al. [
4]. This phenomenon might be expected to influence our permeability measurements at the impact site. As seen in
Figure 11, point 1 does have a lower average permeability than those areas of the shattered surface which show visible fractures or have become friable after shearing (points 3,4,8,9). However, the permeability of the impact point is higher than that for other distal points of the shattered surface (2,5,6,7,10). This is possibly due to the generation of micro-fracture networks through quartz grains, which has previously been observed using optical microscopy [
4] and scanning electron microscopy (SEM) [
21], creating connected networks that may act as potential pathways for moisture.
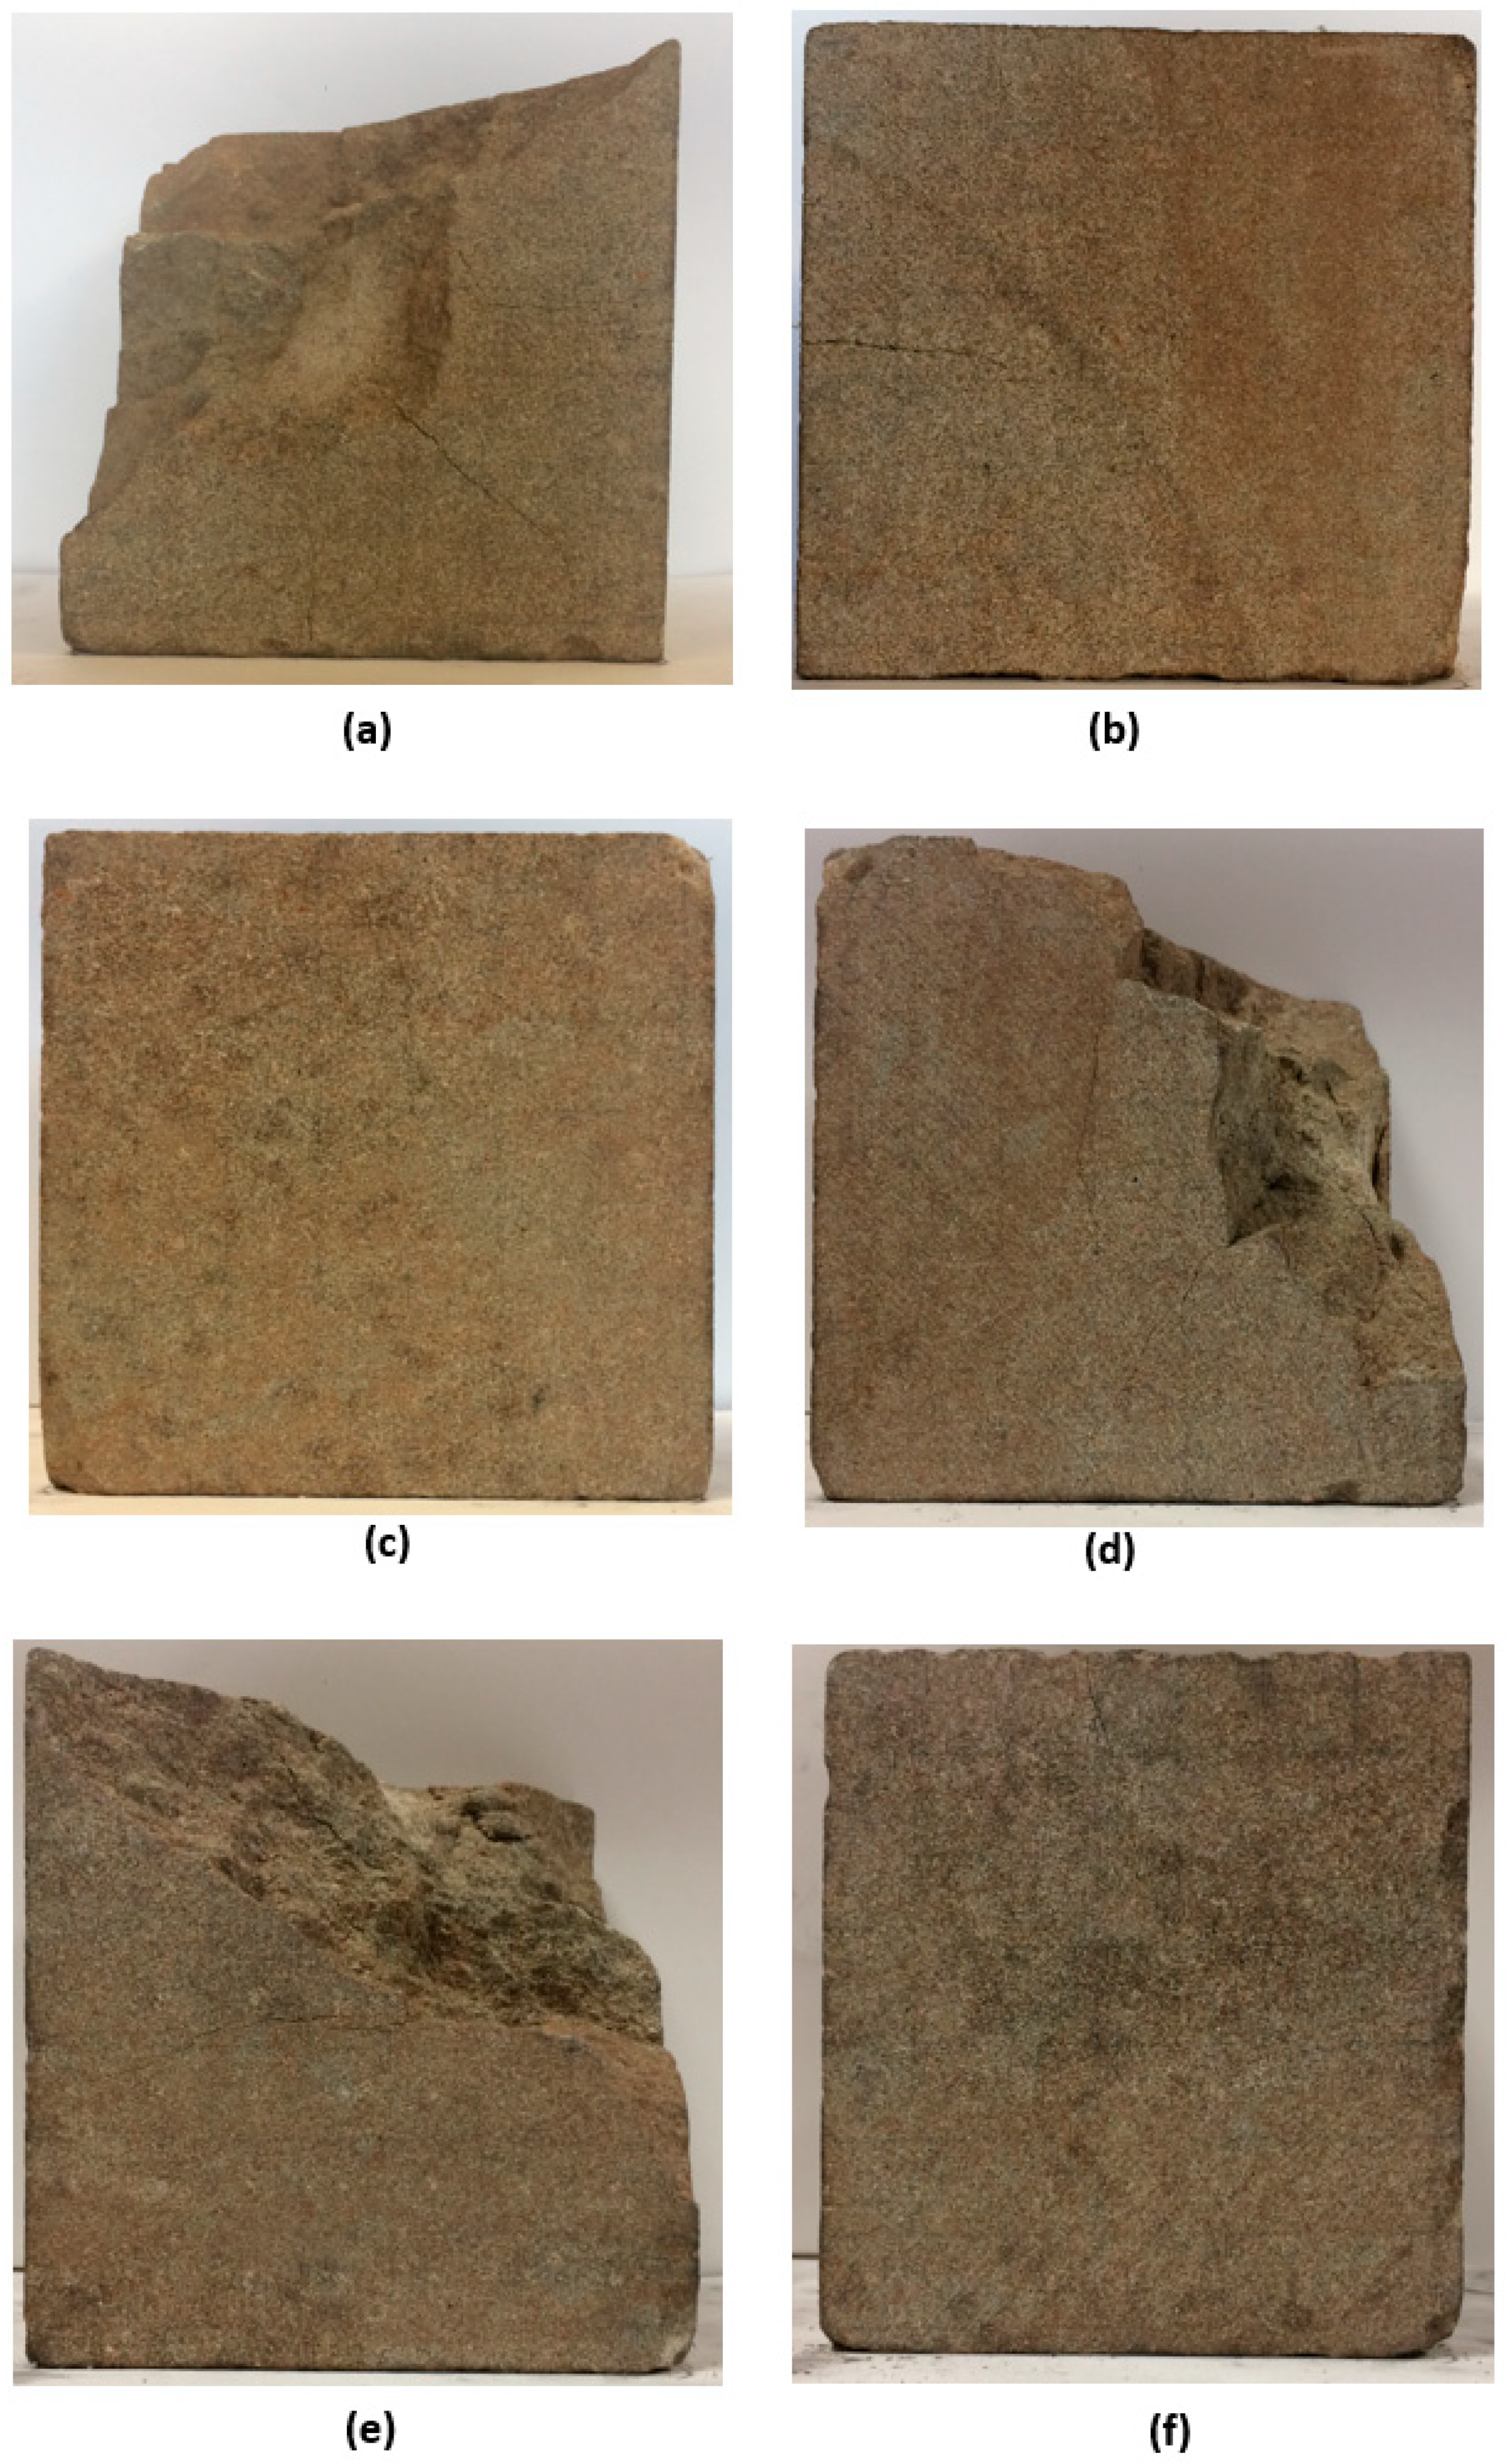
The greatly increased permeability of points 8 and 9 are due to sizeable surface fractures close to these points, whilst the intermediate permeability of points 3 and 4 are attributable to flaking of the stone matrix in these areas. Some of these features are observable in
Figure 4.
3.3. Spatial Distribution Analysis (“Heat Mapping”) of Sample Permeability Data
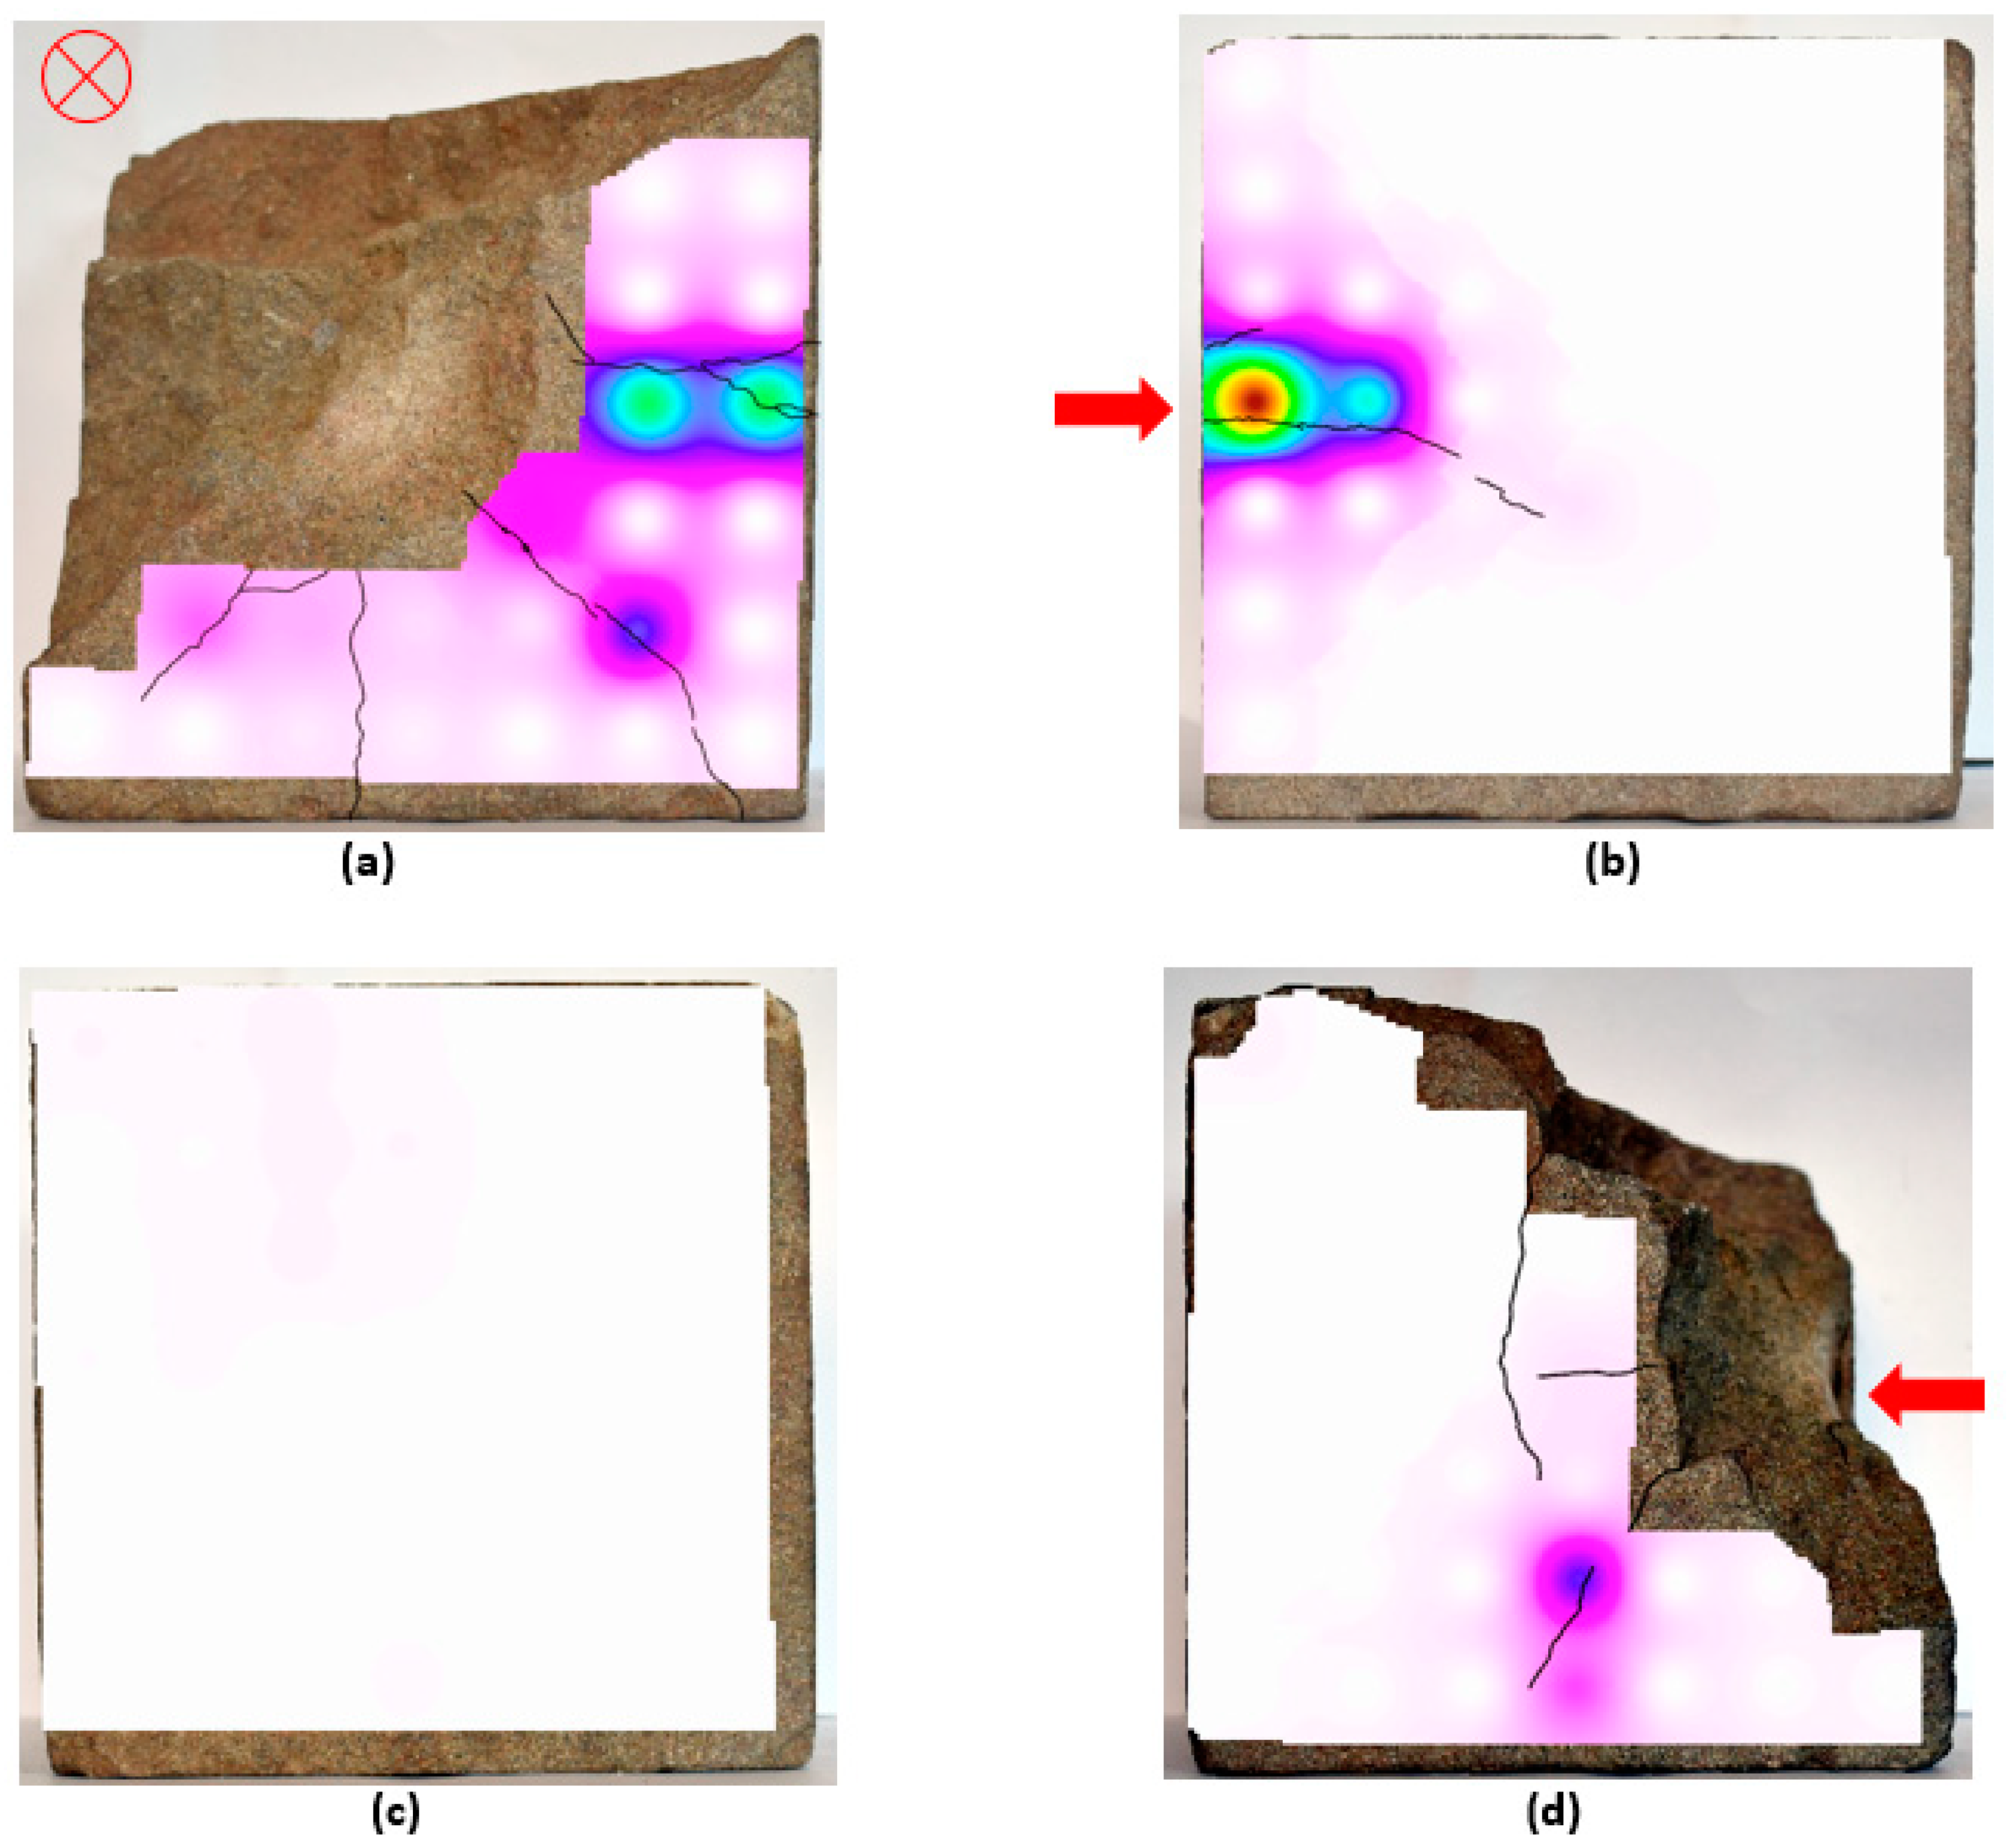
In addition to distinguishing between the levels of damage across the sample surfaces, permeametry is effective at identifying the areas of a given surface that have been significantly fractured as a result of projectile impact. This is best demonstrated by presenting the permeametry data in relation to its spatial distribution across the sample surface, as seen in
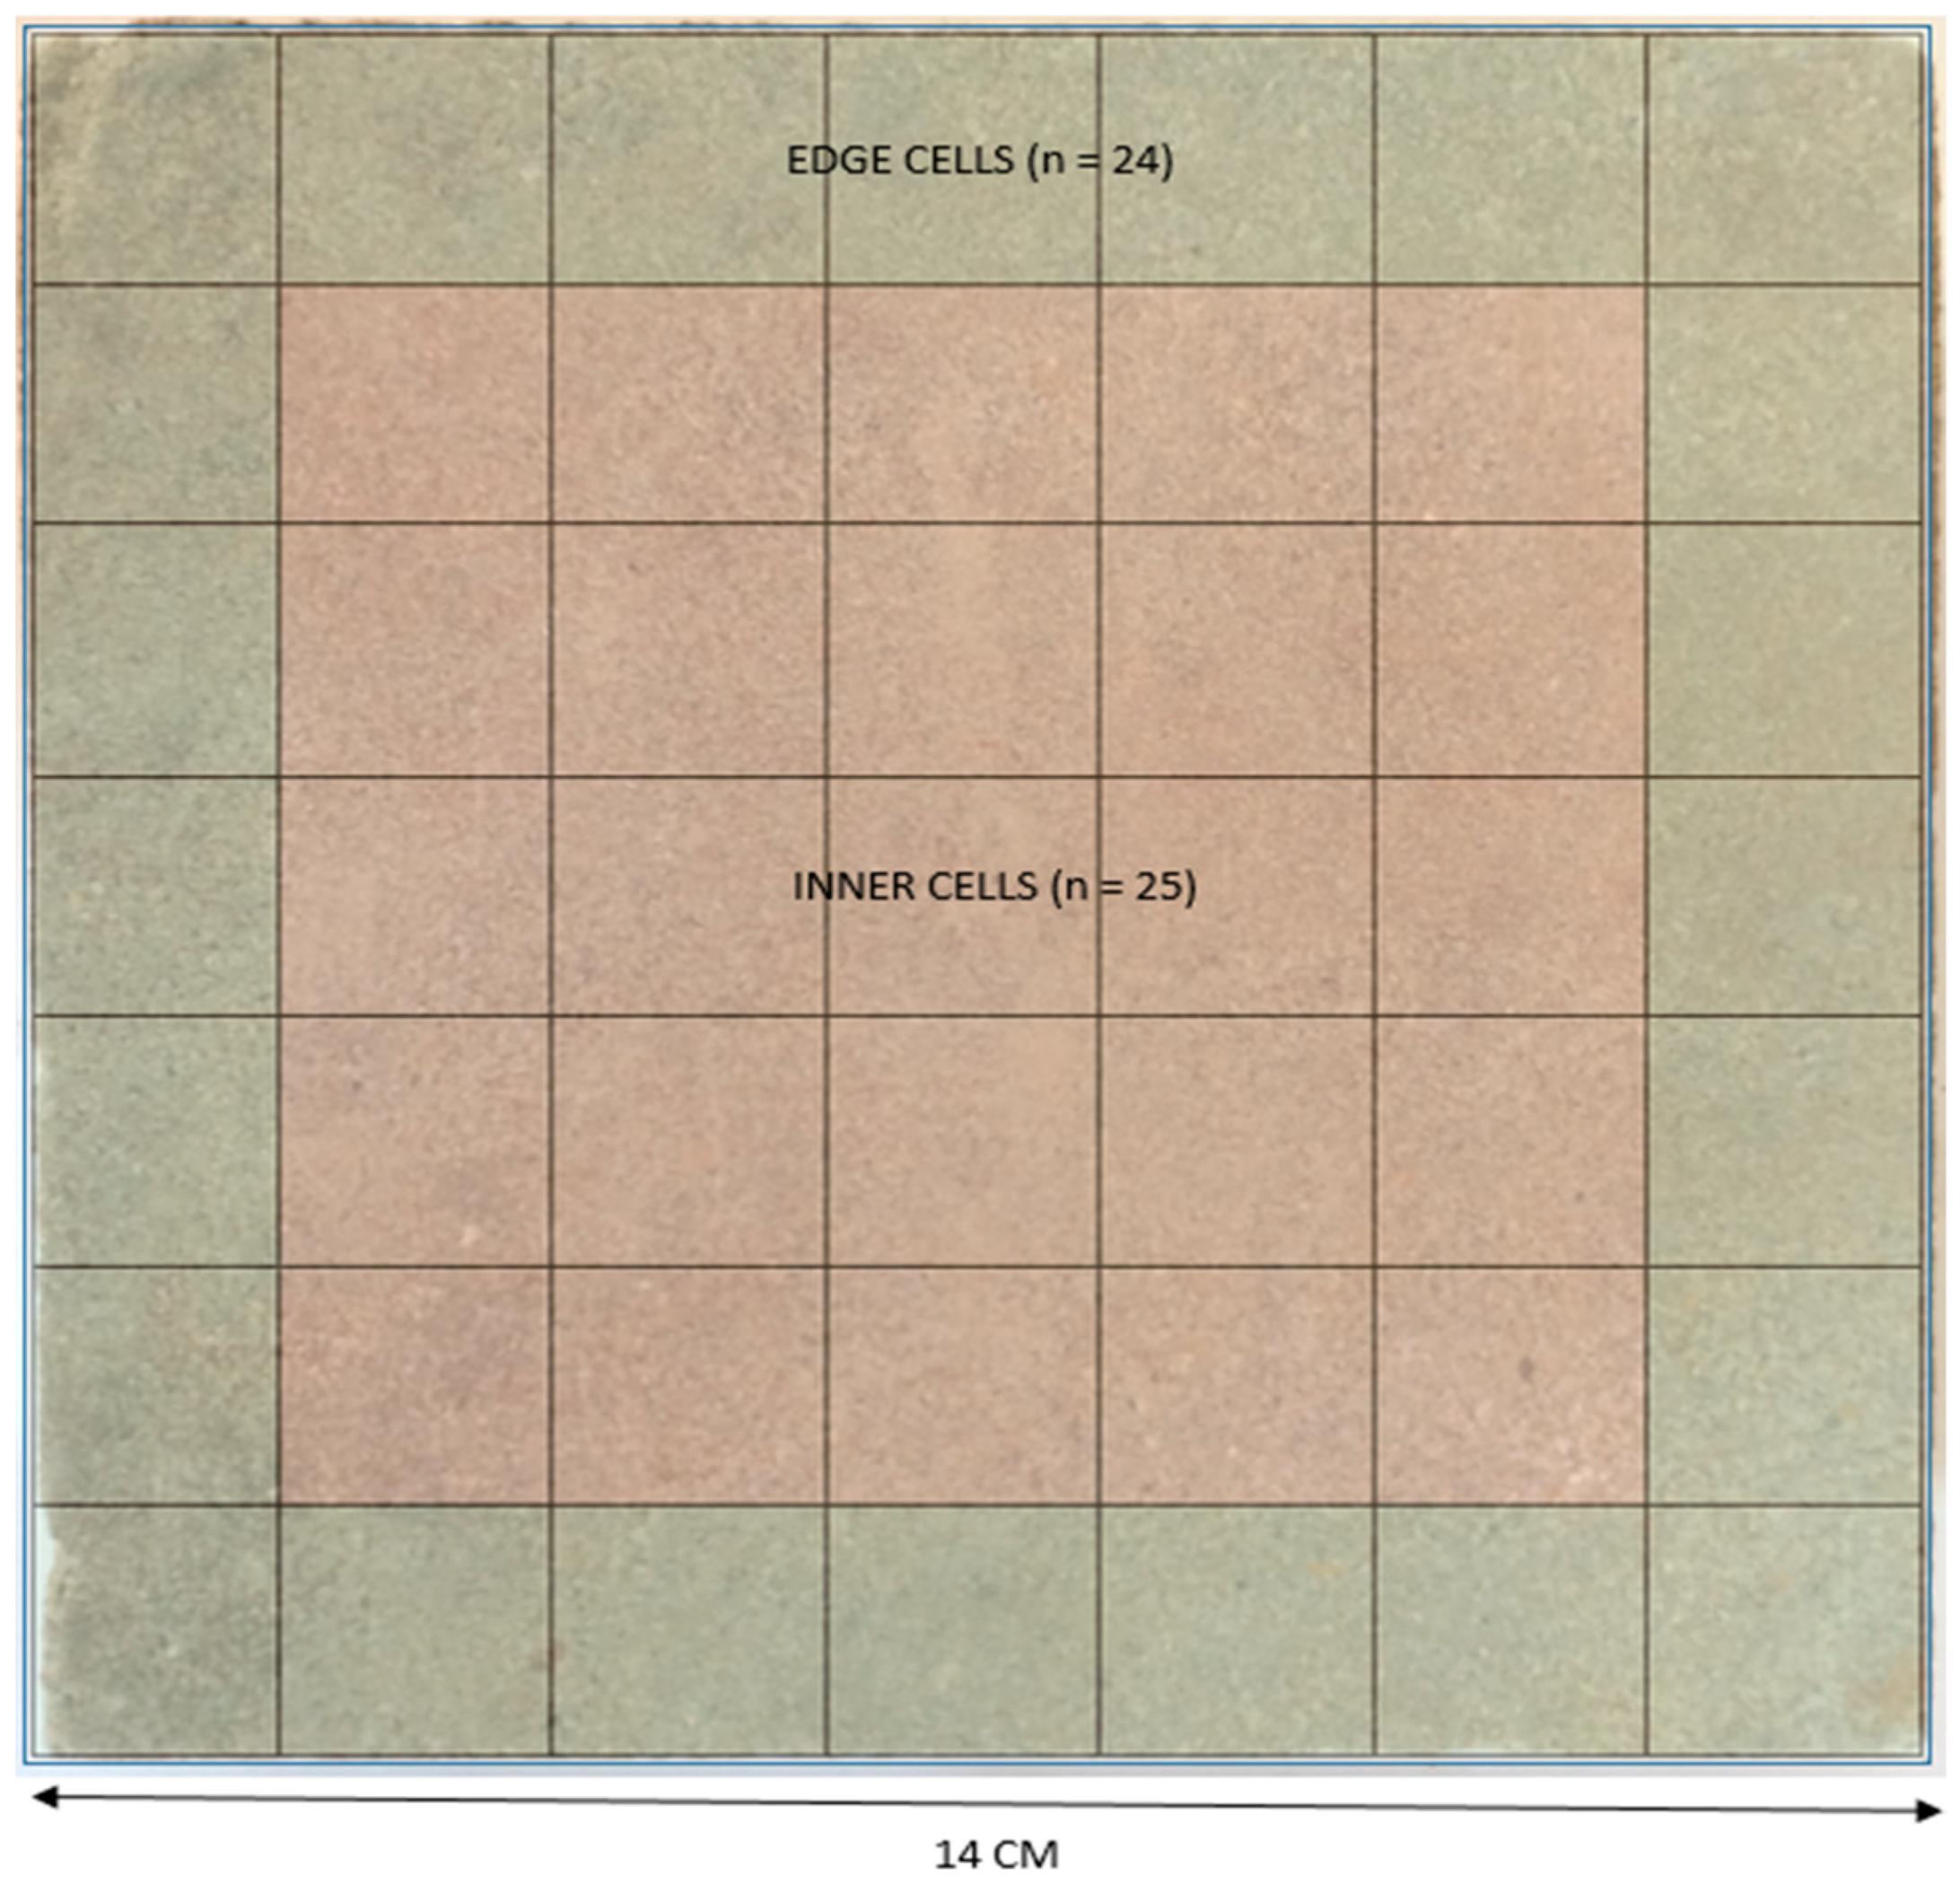
Figure 12. Fractures have been highlighted in black. With the exception of side 1, which was impacted face on (Indicated by a red ‘⮾’), the direction of projectile impact is indicated with a red arrow. As discussed previously, a calibration constant of −0.0046 D was applied to the cells contacting the sample edge, so as to remove any edge effect when visualising ballistic damage at the sample’s edge.
A number of important trends become evident from the visualisation of the spatial distribution of the permeability data. Most obvious of these is that for every surface displaying a fracture network, the areas of highest permeability correspond directly to the position of the fractures. This is perhaps an obvious observation, as a fracture will drastically increase the permeability of the local surface it runs through. However, this clearly demonstrates the efficacy of permeametry analysis in identifying the position of surface fractures in an impacted sample. Some areas with surface fractures appear to have higher permeability that other areas exhibiting surface fracture. This is possibly due to differences in the sub-surface extent of the fractures, i.e., that those fractures which extend further into the sample or connect with a fracture network of greater density will give higher permeability readings, but further work will be necessary to confirm this [
8].
The area of increased permeability to the upper left corner of side 3 of the sample is notable and although it is markedly lower than the permeability averages for surface fractures on other sides (the highest reading for a side 3 cell is 0.056 D) it could be indicative of sub-surface micro-fractures or defects. This could be the result of natural variation in the stone or could be related to residual shock wave damage towards the rear of the sample. Further work would be necessary to determine the cause of this area of increased permeability.
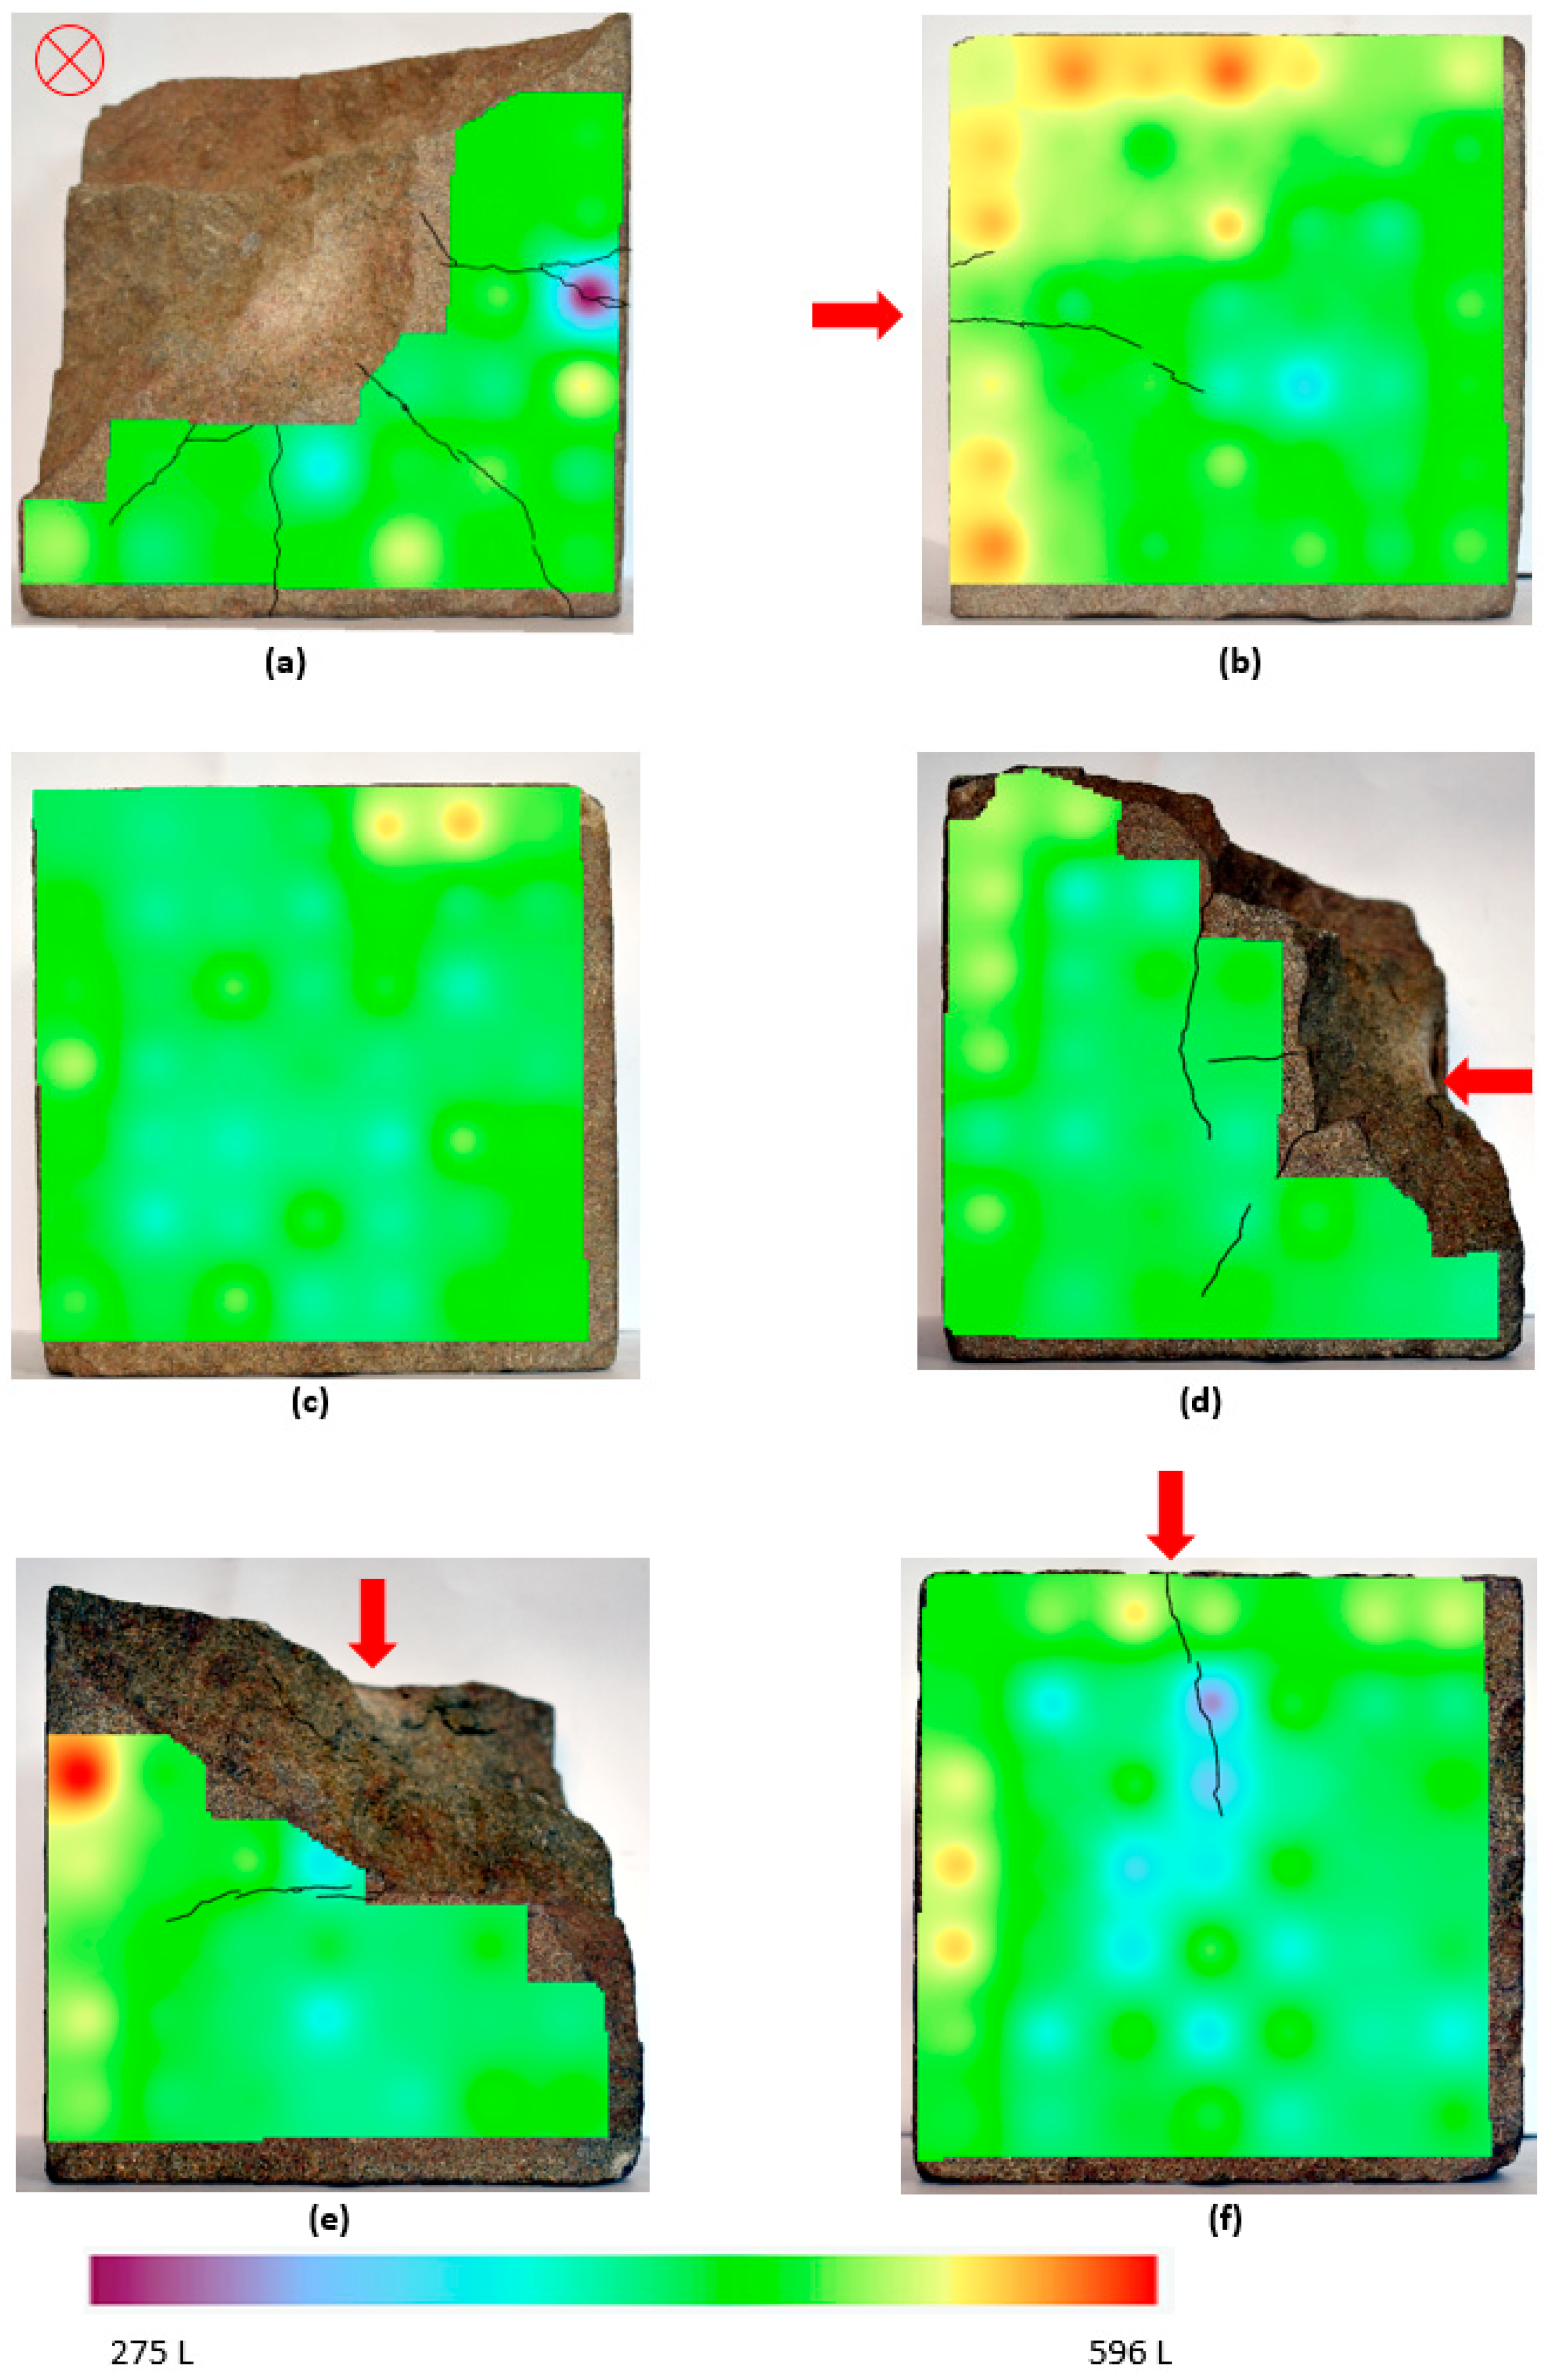
3.4. Spatial Distribution Analysis (“Heat Mapping”) of Sample Equotip Surface Hardness Data
As can be seen in
Figure 13, spatial analysis of the distribution of Equotip surface hardness readings corresponded less directly with identifiable surface fractures than similar analysis for permeability data. This can be seen in
Figure 13 and although there is some agreement between those areas exhibiting surface fractures and areas of lower hardness, such as those seen in the heat map for side 6 in
Figure 13, other areas of lower hardness appear to be unrelated to the presence of surface fractures, such as sides 2 and 4.
Furthermore, some large fractures visible on the sample surface do not affect the hardness of the surrounding cell, as is the case for the heat map of side 1, and are in direct contrast to the permeability heat map for that side. The addition of the 63 L calibration constant appears to have been successful in creating a broadly homogenous surface hardness independent of the edge effect for many of the sample sides, as seen on sides 3,4 and 6. However, the left and upper edges for side 2 do appear to be significantly harder than the rest of that surface, indicating that further work may be required to thoroughly investigate the edge effect and to calibrate for its effects when investigating ballistic damage in stone.
4. Discussion
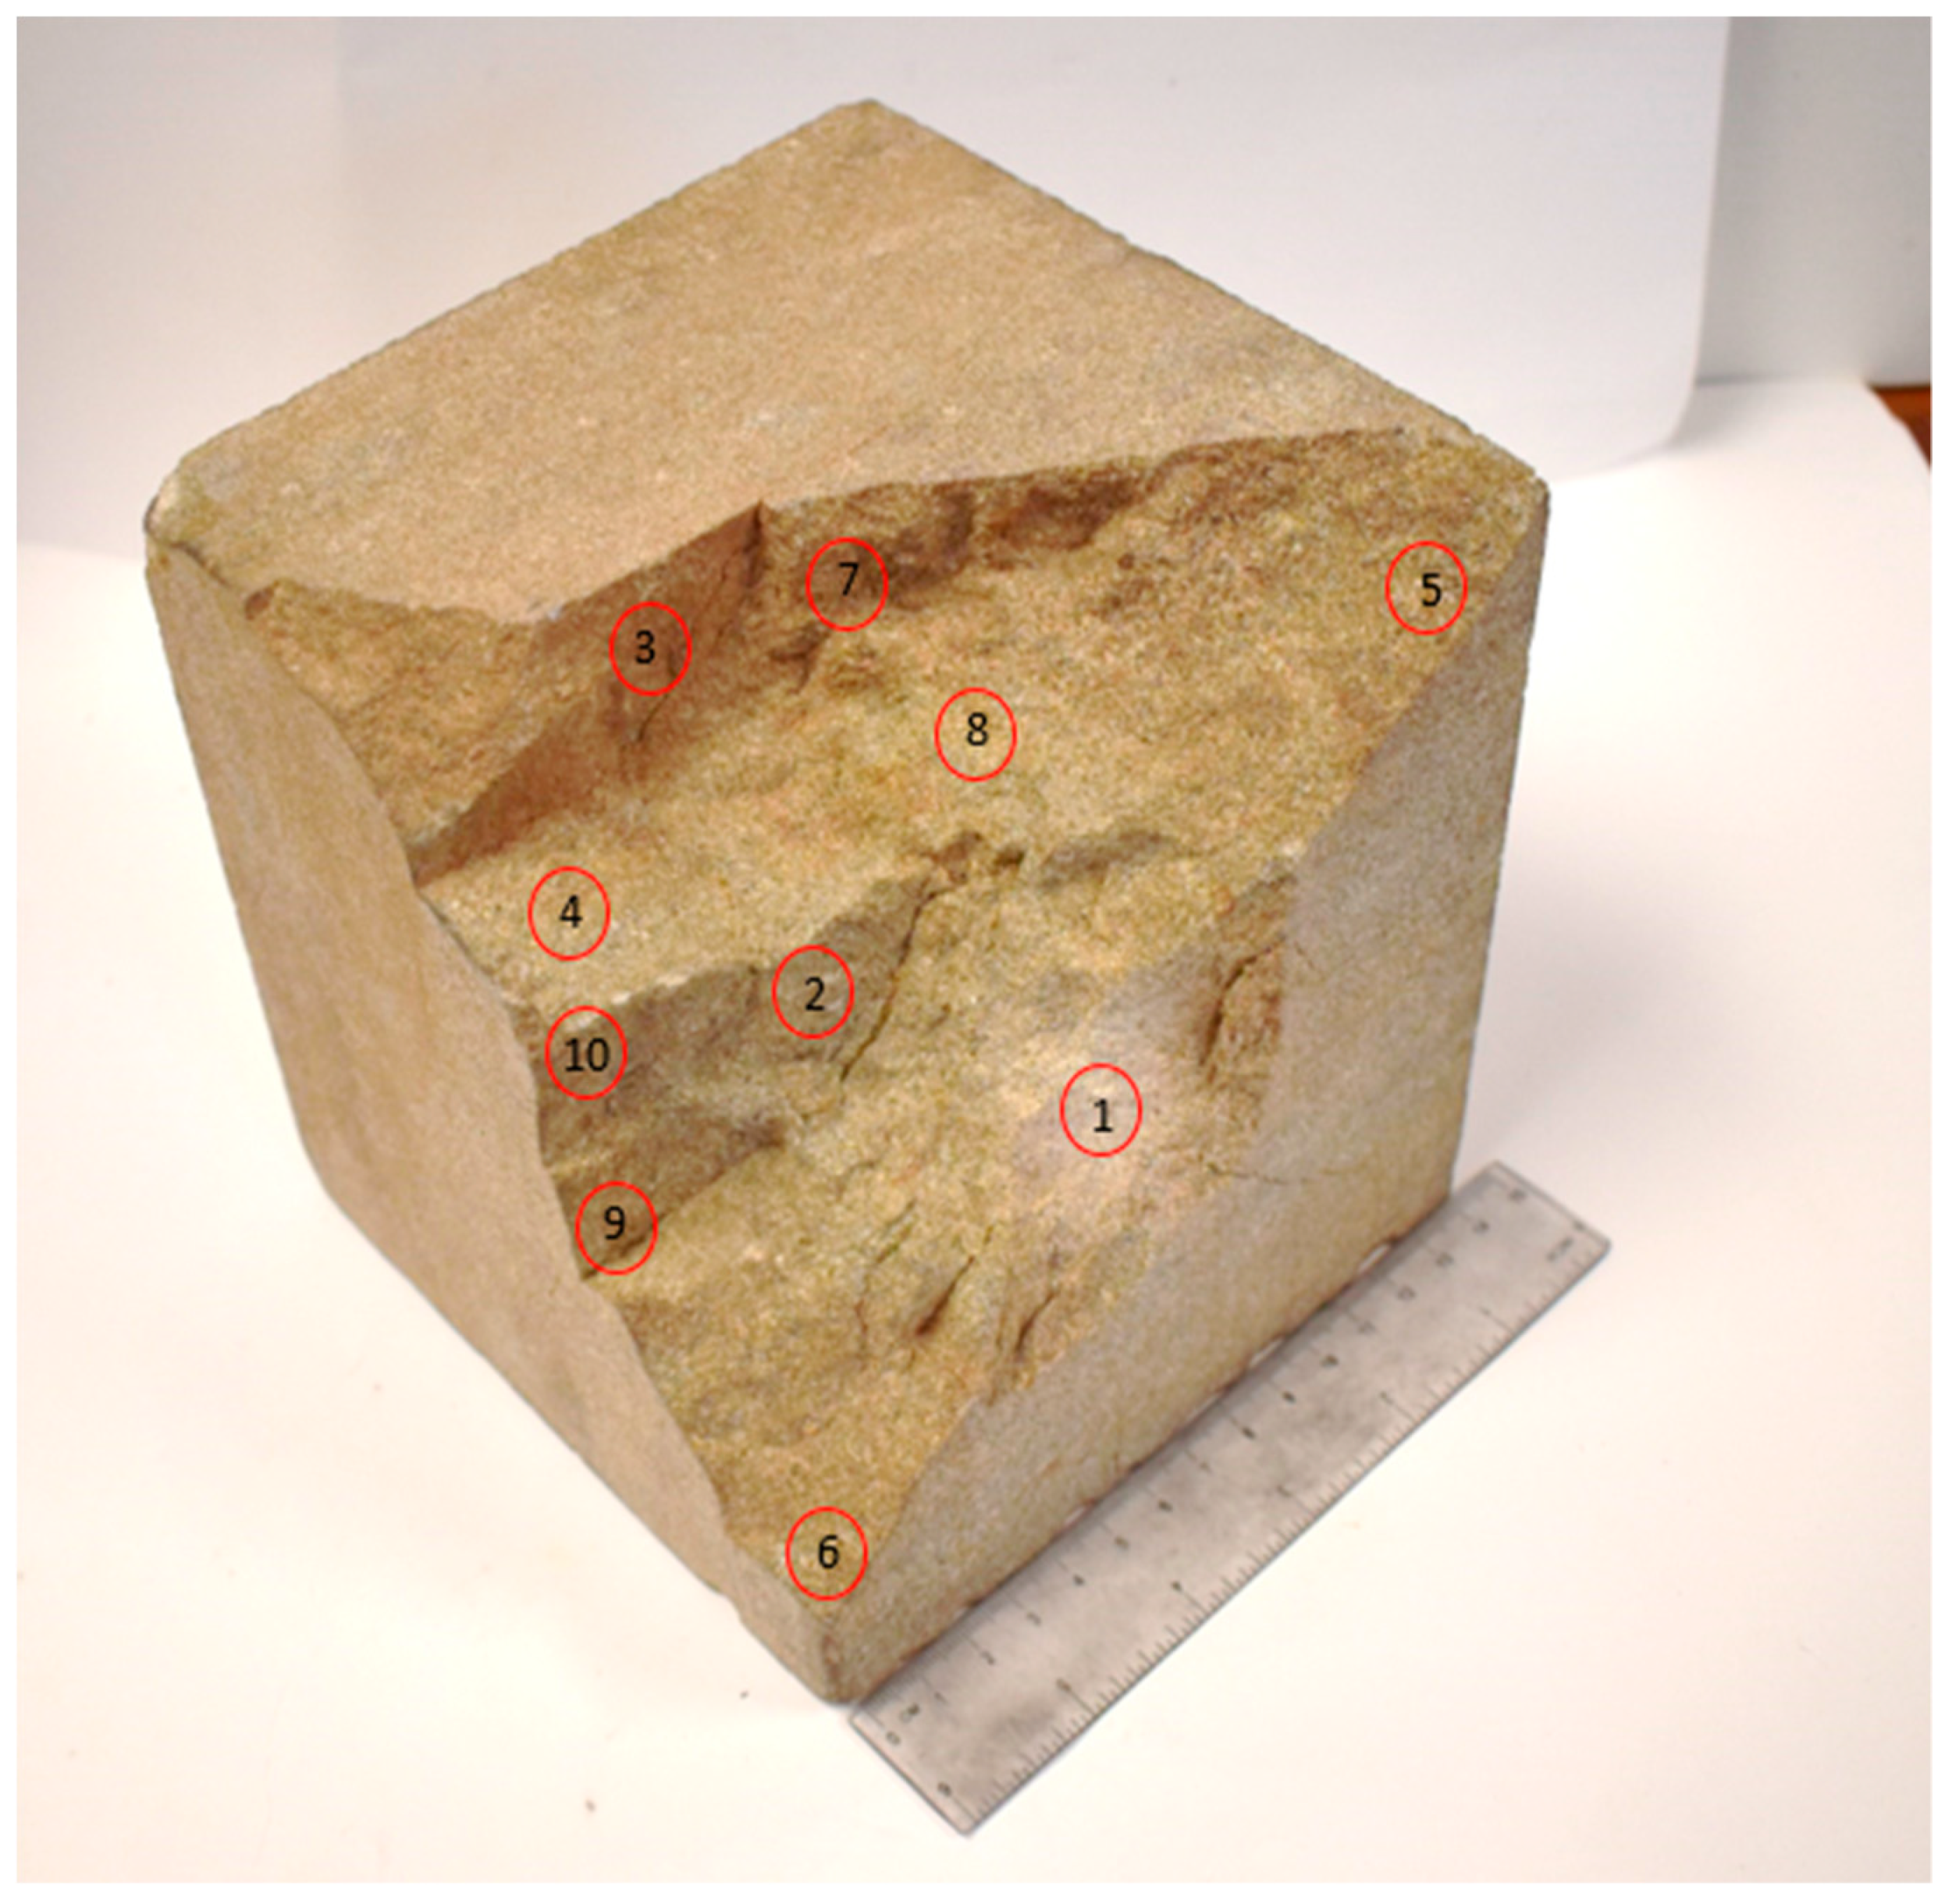
As shown in
Figure 4, there is a discoloured area of lighter stone in the centre of the shattered surface. This is the impact point of the projectile (point 1 on the damaged surface) and as shown in
Figure 9, it has a noticeably higher average hardness than the rest of the shattered surface (353 L for the impact point vs. 288 L average for the rest of the shattered surface). The fact that the impact crater has experienced less weakening than the rest of the shattered surface could indicate compaction of the stone matrix at the impact point, as found in previous studies [
4,
6]. Although the impact crater has a reduced hardness when compared with the cells sampled on non-shattered sides (353 L compared with an average of 452 L for non-shattered cells), the fact that it is harder than the surrounding shattered stone is an important finding when seeking to model impact damage to stone. It is notable because it suggests that the most damaged areas may not be the point of direct impact, but rather the wider shattered surface which has sheared away during the ballistic event.
The variability in hardness readings from side 1 is higher than those from other sides of the block, with a range of 258 L compared to an average range of 146 L for the other sides, whilst side 1 also has an increased standard deviation (
Figure 8). This is demonstrated by the charts presented here, which show that Equotip surface hardness is a highly indicative method for quantifying the difference between the point of impact of a ballistic projectile and non-impacted areas. Equotip is also effective at identifying areas of wider damage across any shattered/shear faces arising from such an impact. This trend is indicated both by the Equotip absolute values and the standard deviation of the data sets for a given side, which may indicate that ballistic impact has the capacity to degrade stone to a comparable extent to known weathering processes, but much more rapidly [
26,
30]. More studies will be necessary to confirm that the link between point of impact and high standard deviation is statistically significant.
However, the Equotip surface hardness survey is likely not useful in detecting surface fractures on an otherwise undamaged surface. This can be seen in the heat maps presented in
Figure 13 and although there is some agreement between surface fractures and areas of reduced surface hardness (side 1), for many surface fractures, there is no corresponding reduction in surface hardness (sides 2 and 4). It is possible that fractures resulting in a discernible reduction of hardness in the stone have wider micro-fracture networks associated with them. Investigations using Schmidt hammer by Young and Frowell [
31] evidenced a decrease in surface hardness with smaller discontinuity spacing. Decreased surface hardness proximal to a visible fracture may therefore indicate a network of micro-fractures associated with it that are unobservable on the surface.
An alternative explanation may not stem from the spacing and number of fractures, but from the orientation of those fractures relative to the measured face. Rebound values are strongly reduced when discontinuities, such as internal layering, fracturing or mineral alignments are oriented perpendicular to the direction of Equotip impact [
23]. It could therefore be that the noticeable decrease in hardness may result from a fracture intersecting the measured surface at a low angle. Fractures that display no noticeable change in hardness may be the result of fractures intersecting the surface at a high angle, or a discrete fracture with no associated micro-fractures. Further investigation through destructive methods such as thin sections may be necessary to quantify this.
Mirroring the Equotip findings, permeability at the impact crater was found to be lower than the average for the wider shattered surface, which further supports the notion that there is compaction at this point which causes a smaller reduction in hardness and a smaller increase in permeability. However, whilst the impact crater has the highest hardness across the shattered surface when measured with the Equotip (
Figure 9), it does not have the lowest permeability. This can be seen in
Figure 11 and shows that many of the sampling points further from the impact crater have a lower permeability than the centre (points 2,5,6,7,10).
The fact that the impact crater has a slightly increased permeability relative to these points is possibly due to the fracturing of quartz grains at the impact site. The fracturing of quartz grains at the site of ballistic damage has been observed under scanning electron microscope (SEM) by Mol [
21]. The increase in permeability at the point of impact is evidence of the same phenomenon being present with larger calibre projectile impacts and highlights that ballistic damage to stone causes both macroscopic (observable surface fractures) and microscopic changes (the fracturing of quartz grains). It is also possible that the discoloration in this area (
Figure 4) is related to the change in refractive index observed in microscopic analyses of shocked quartz grains arising from shock waves associated with high-energy impacts [
32]. Identifying areas of such discoloration may prove a useful diagnostic tool in identifying areas of impact in the field.
Another clearly identifiable spatial trend is that permeability, which can be taken to infer damage to the sample, correlates strongly with the direction of impact. In the heat map for side 1, the fractures and areas of increased permeability can be seen to radiate outwards from the point of impact. Radial fracturing is a classic sign of ballistic impact in brittle materials [
33] and shows that permeametry analysis is accurately reflecting known projectile damage patterns. In sides 2, 4, 5 and 6, it is clear that the side of the surface closest the impact (indicated by the red arrow) experiences a far greater increase in permeability than the side furthest from the impact. This trend is especially clear in the heat map for side 2, where the direction of impact and the surface fractures are strongly reflected in the areas of highest permeability across the surface.
In the sides that did not experience direct impact (2,4,5,6), the fractures often run parallel to the direction of impact, and this is especially true on sides 2 and 6. However, some surface fractures clearly run perpendicular to the direction of projectile impact, as can be seen on sides 4 and 5. This is perhaps evidence that the shockwaves generated by the projectile impact are exploiting pre-existing defects in the stone which result in these fracture patterns. This would support previous findings which illustrated through computed tomography analysis that internal damage to the stone arising from bullet impact follows bedding planes within the sample [
4]. However, fractures perpendicular to the direction of impact could also be the expression of the hemispherical concentric fractures described earlier [
13,
14]. Further work utilising thin section analysis or computed tomography imaging may clarify this.
In areas distant from the surface fractures, the permeability heat maps are broadly homogenous, indicating that there has been no notable artificial reduction in permeability due to the calibration constant. Therefore, we can consider this a viable method for removing the edge effect when seeking to visualise increases in permeability due to ballistic damage.
IDW heat maps show that permeability surveys of impacted stone can help in identifying and visualising the spatial distribution of surface fractures, which in turn could inform conservation strategies by identifying likely points of ingress for weathering agents. Furthermore, permeability readings and their standard deviations indicate that the technique is effective at highlighting the sides of a sample block which are most and least damaged.
Given that both the instruments used in this work (TinyPerm 3 and Equotip) are portable, these findings demonstrate a potential new method for conservation professionals to assess ballistic damage to heritage stone in the field. They could therefore provide a new capability to conduct survey work rapidly on site, which is a key requirement given the time constraints often inherent to accessing ballistic damage to heritage sites during unpredictable conflicts.
5. Conclusions
The data presented here supports previous work on ballistic damage to stone, confirming previous observations that ballistic impact can lead to higher Equotip surface hardness for the impact crater relative to some areas of the surrounding stone [
4], whilst also demonstrating that these conclusions hold true for higher calibre, more damaging ammunition than previously studied. Furthermore, the significantly lower hardness values of the shattered surface compared with the non-shattered cells illustrate the efficacy of using Equotip surface hardness to identify those surfaces which have been sheared or shattered as a result of ballistic impact. Therefore, the Equotip surface hardness survey has been shown here to be a useful method in distinguishing between less-damaged sides and the impact crater and wider shattered surfaces arising from ballistic impact.
On sides distant from the impacted side of the sample, permeametry surveys have been shown in this work to be an effective method for identifying surface fracture networks and identifying which specific surfaces/areas of an impacted stone sample are most damaged. This will aid in conservation work by allowing the triaging of most damaged building materials and identifying points of ingress for weathering agents.
Statistical analysis undertaken here supports the likely presence of an edge effect for both Equotip surface hardness and permeability for these samples of cut stone. Whilst Viles et al. did not record this edge effect on natural stone blocks [
26], this does appear to be an issue for blocks subjected to the strain of cutting equipment. This is worth considering when informing conservation strategies for ballistic damage to stone, as impacts which cause damage and fracturing to the edge of a block may be exacerbated by the edge effect. However, further work is necessary to properly understand the edge effect, both to confirm its presence for cut stone, and to understand how to effectively calibrate for it during ballistic investigations.
The principle findings of this paper are that an integrated dual survey using surface hardness and permeability greatly increases the potential for informative data. Critically, these methods can be utilised rapidly in the field and are non-destructive, pointing to a viable method for assessing damage to built heritage in conflict zones.
This work has highlighted many areas for further investigation, particularly using those methods which will allow insight into the interior of the impacted sample. Thin section microscopic analysis and X-ray computed tomography analysis might allow for the relationship between fracture length and density and corresponding permeability and hardness values to be explored. Scanning electron microscopy could also be used to explore the theorised effects of matrix compaction and grain fracturing at the impact site.


