Article

Recovering Past Reflections: X-ray Fluorescence Imaging of Electrocleaned 19th Century Daguerreotypes

1
The Department of Chemistry, The University of Western Ontario, 1151 Richmond Street, London, ON N6A5B7, Canada
2
The Department of Anthropology, The University of Western Ontario, 1151 Richmond Street, London, ON N6A5C2, Canada
3
Canadian Light Source Inc., 44 Innovation Boulevard, Saskatoon, SK S792V3, Canada
4
Cornell University, Cornell High Energy Synchrotron Source, 200L Wilson Laboratory, Route 366 & Judd Falls Road, Ithaca, NY 14853, USA
*
Author to whom correspondence should be addressed.
Heritage 2019, 2(1), 568-586; https://doi.org/10.3390/heritage2010037
Submission received: 14 December 2018 / Revised: 7 February 2019 / Accepted: 9 February 2019 / Published: 12 February 2019

Abstract

:
The first commercially viable photographic image, the daguerreotype, captured images for a span of approximately 20 years (1839–1860). DeDterioration now disfigures many of these valuable images. One proposed restoration method is an electrochemical process. However, its safety and effectiveness are still under debate within the conservation community as the effects of this treatment, and its physical and chemical impact on the daguerreotype image, have not yet been analyzed in depth. This study used synchrotron-based micro-X-ray fluorescence to map the elemental distribution pre- and post-electrocleaning on 19th century daguerreotypes using both soft and hard incident X-rays. X-ray absorption spectroscopy was used to probe local chemistry before and after cleaning. Two different electro-treatment methods were compared: the original method proposed by Barger and a second put forward by Wei. When used correctly, both processes significantly reduced the S and Cl surface contamination without dulling the surface. However, both electrochemical methods used in this study resulted in a loss of Hg and Au from the surface. In all cases, the Hg distribution tracks with image particle density allowing the retrieval of full portraits from entirely corroded daguerreotypes, suggesting that Hg concentration may be a useful proxy for the original image.

1. Introduction

A full understanding of the chemical and physical properties of cultural heritage objects is essential for their preservation and, if damaged, their restoration. Best practices in cultural heritage conservation dictate that treatment methods should be selected that do not adversely affect the object in both its present and its future state [1]. It is important that restoration techniques have as little potential as possible to damage or deteriorate the sample if used correctly, incorrectly, or excessively. In support of this directive, this work studies the effects of electrocleaning on daguerreotype surfaces.
Louis-Jaques-Mandé Daguerre’s method of fixing a permanent image on a silver-coated copper plate with mercury vapour to produce a daguerreotype completely changed the landscape of image documentation [2,3,4,5]. Despite being placed within a frame and behind cover glass for protection, these metallic plates are prone to corrosion [6,7,8], often in the form of white (silver chloride (AgCl)), brown/red (copper oxide (Cu2O)), and/or black films (copper oxide (CuO), copper sulfide (CuS), silver sulfide (Ag2S), silver sulfate (Ag2SO4), and silver oxide (Ag2O)), which distort and can sometimes completely obscure the photographic image [9,10]. The conservation of daguerreotypes has been a long-standing topic of discussion and, at times, has been a point of contention [11]. The goal of a conservation-based cleaning treatment for a daguerreotype is to preserve the optical integrity of the image while removing the tarnish from the surface (i.e., regions of high particle density remain intact and particles retain their original shape and areas of low image particle density maintain their smooth, mirror finish). A treatment process that is controllable and somewhat forgiving is highly desirable [11]. Given the inherent individuality of each daguerreotype and their variable chemistry, which depends on but is not limited to their production, how they have been stored and handled, and any past conservation efforts, treating daguerreotypes is a challenge and some treatment methods have caused the fading and/or complete loss of historic images.
Historically, if abrasive procedures could not be used to remove Ag2S and/or Ag2O, immersing an object in a silver dip cleaner, such as potassium or sodium cyanide and/or acidic thiourea solutions, was deemed appropriate. It was observed that when this technique was applied to daguerreotypes, the lack of control and selectivity, resulted in surface etching that degraded a plate’s optical properties, the formation of measles on the surface (for thiourea cleaning specifically), and the development of silver cyanide and silver-thiourea complexes, which are extremely detrimental to the daguerreotype surface. Other methods for daguerreotype treatments that have been explored have included sputter cleaning [11], the application of excimer lasers [12], and atmospheric pressure non-equilibrium plasma [13]. Generally, in the museum setting, rinsing with an ammonium solution [14] and the replacement of the 19th century cover glass [11] are the only performed procedures.
Another proposed restoration treatment is electrocleaning, which was put forward by Barger et al. [15]. The original procedure applied an external current with a movable aluminum electrode over the daguerreotype, which was placed in an ammonium hydroxide electrolyte solution (NH4OH; pH = 12). A platinum (Pt) wand was later introduced, as it was observed that the more noble the counter electrode, the better the cleaning results. Altering the potential of the daguerreotype between anode and cathode in repeated cycles resulted in a substantial removal of surface tarnish. The plate was then rinsed and dried. While no negative alterations to the surface have been identified, alternate methodologies have been proposed [4,16,17]. One such study, proposed by Wei et al. [18], applied only a cathodic potential to avoid the oxidation of silver on the surface. This was conducted in an electrolyte solution of 0.1 M sodium nitrate (NaNO3; ~ pH = 6). Throughout the literature, including the Barger and Wei studies, only localized regions of treated plates have been examined pre- and post-electrocleaning, offering a limited view of any variations in chemical or physical morphology.
In this work, synchrotron radiation analysis (SRA), micro-X-ray fluorescence (µ-XRF) and X-ray absorption near edge spectroscopy (XANES), were used to examine how the elemental distribution and chemistry of the surface of the entire daguerreotype might be altered as a result of electrocleaning. Two electrocleaning methods were compared: Barger [15] and Wei [18]. These two cleaning methods vary in multiple ways including: (1) electrolyte: Barger uses NH4OH at pH = 12 while Wei uses 0.1 M NaNO3, (2) polarity: Barger alternates between cathodic and anodic treatment whereas Wei uses only cathodic cleaning, and (3) applied current: the Barger method works in a range of 15–25 mA with the Wei procedure using a range of 40–60 mA; (4) number of cleaning rounds: which is assessed by the conservator during the cleaning treatment and the end point chosen based on museum/conservation standards. The impact of these factors will be discussed.

2. Materials and Methods

2.1. Sample Materials

The daguerreotypes used in this study (Figure 1), which displayed substantial surface tarnish, were supplied by the Canadian Photography Institute at the National Gallery of Canada (NGC). No sample preparation was required for SRA. While five plates were treated in this study, only three of them will be discussed.

2.2. Electrocleaning

Full plate electrocleaning was conducted at the NGC using the two different electrochemical methods examined: the Barger technique [15] and the Wei process [18]. Daguerreotype PSC 70:112 (Figure 1a) was treated with the Barger method. Cathodic and anodic cleaning was conducted over 5-min cleaning intervals. The voltage ranged between 5–7 dc volts and the current varied between 15–25 mA depending how much tarnish was on the surface. Plates RCLSC1 (Figure 1b) and SC1 (Figure 1c) were cleaned using the Wei method where the current was between 40–60 mA with the voltage ranging between 5–7 dc volts. After each cleaning cycle for both methods, the plate was rinsed with deionized water followed by ethanol to facilitate rapid drying. The number of cleaning cycles depended on the quality of the daguerreotype and the cleaning method chosen. Plates were cleaned until deemed appropriate by visual inspection to see if (1) the majority of the problematic tarnish had been removed and (2) if, overall, the optical quality of the daguerreotype had been improved, through deliberating if the state of the image was representative of its original state, and (3) considering the impact of further treatment to the artifact. Typical total cleaning times ranged between 20–40 min. For cleaning, the daguerreotype was secured in the bottom of a Pyrex dish between two adjustable rails. A Pt electrode was fastened at a fixed height (1 cm) above the daguerreotype. This ensured the Pt electrode remained a constant distance from the daguerreotype throughout the entire treatment while still being able to cover the whole surface of the plate. A schematic and details of the cleaning has been previously published [19]. The Pt electrode was directed in a circular motion over the daguerreotype during each cleaning cycle. Localized electrocleaning efforts (seen as cleaned circles in Figure 1) were conducted at The University of Western Ontario prior to full plate cleaning; this research will be published in a forthcoming manuscript.

2.3. Synchrotron Radiation Analysis

2.3.1. Plan of Analysis

Synchrotron-based XRF examination was chosen, as it would allow for both a micro and macroscopic view of 19th century daguerreotypes before and after electrochemical treatment. The soft X-ray micro-characterization beamline at the Canadian Light Source (CLS) was chosen for its ability to locally image with XRF sulfur (S) and chlorine (Cl), which are the primary tarnish elements. The distribution and chemistry of S and Cl were tracked with X-ray absorption spectroscopy, in order to examine how each was impacted by the two electrocleaning methods. Entire daguerreotypes were imaged with rapid scanning XRF at two different beamlines at the Cornell High Energy Synchrotron Source (CHESS). The combination of the rapid scanning detection paired with higher incident energy beam allowed for the mapping of silver (Ag), mercury (Hg), and gold (Au) across the whole surface. Comparison of elemental ratios from highlight, midtone, and shadow regions before and after cleaning provided insight into the impact of the two conservation methods. The application of scanning μ-XRF to image localized regions and entire plates provides, for the first time, a complete picture of how the electrocleaning process impacts daguerreotypes. Moreover, by collecting μ-XRF images at two different incident energies, the effect of the Barger and Wei method on the elemental composition of the tarnished surface (S, Cl, and Ag) and the image particles and bulk (Hg, Au, and Ag) can be compared.

2.3.2. Canadian Light Source

Daguerreotypes PSC 70:112 (Figure 1a), RCLSC1 (Figure 1b), and SC1 (Figure 1c) were analyzed before and after treatment at the soft X-ray micro-characterization beamline (SXRMB) at the CLS. Here, localized μ-XRF maps were collected with an incident energy just above the Ag L3-edge [20]. For analysis, the daguerreotype was secured to the sample holder using alligator clips under which strips of weighing paper were placed to prevent scratching the surface. An incident energy of 3.950 keV was selected and µ-XRF maps were created using the partial fluorescence yield of the element of interest (e.g., Ag Lα (2.984 keV), S Kα (2.307 keV), and Cl Kα (2.622 keV) X-ray emission). The spot size at the specimen was ~10 µm × 10 µm. Each map was normalized to I0 (the intensity of the incident X-ray) and analyzed using the SMAK software program [21].
Micro-XANES analysis was conducted at selected locations within each µ-XRF map. X-ray absorption spectra were collected for Ag, S and Cl in fluorescence (FLY) mode. The parameters for each scan are summarized in Table 1. A series of standards (supplied by Sigma-Aldrich) were used for comparison and are included in Table 2. The Ag-Au alloys were produced for a previous study [22]. All absorption spectra were processed using the Athena software package [23]. Processing included energy calibration, background subtraction, normalization, and averaging of all spectra [24]. It is important to note that due to the small spot size, the position of the motors, the placement of the daguerreotype on the sample holder, and the viewing screen at the endstation, it was not possible to analyze the exact locations pre- and post-cleaning. Therefore, the XANES spectra were not collected from the exact same spot. They are, however, in the vicinity of each other and can still be used as a representation of the alteration of local chemistry from the conservation treatment.

2.3.3. Cornell High Energy Synchrotron Source

The conservation staff at the National Gallery of Canada produced individual frames for each daguerreotype prior to travel to CHESS. These frames were used to secure the plates for transport and for mounting at the beamline, thereby reducing the handling of each object.
Two beamlines (G3 and A1) were used at CHESS, Cornell University, Ithaca, NY, U.S.A. All daguerreotypes were analyzed at the CHESS facility using hard X-rays. Analysis of pre-electrocleaning samples was conducted using µ-XRF rapid scanning with a Maia-384 element detector [25] at the G3 line with an incident energy of 13.025 keV. The details of these experimental conditions have been previously discussed [26] and the data was processed using GeoPIXE [27]. The A1 line was used to examine the daguerreotypes post-electrocleaning. Here, an incident energy of 20 keV was used, with a dwell time of 15 ms per 50 × 50 μm pixel over a scan area of 70 × 80 mm for daguerreotypes PSC 70:112 (Figure 1a) and SC1 (Figure 1c) and an area of 50 × 60 mm for RCLSC1 (Figure 1b). An energy discriminating detector (Vortex ME-4 (R)), placed at about 90 degrees to the incident beam, and a XIA XMAP digital X-ray processor were used for XRF data collection. The X-ray beam incident on the sample was attenuated with Al to optimize performance of the detector. The elements of interest were Ag, Au, Hg and copper (Cu). The μ-XRF data was processed with PyMCA [28]. An Au foil reference (density = 19.32 g/cm3) was employed for energy and flux calibration before scanning the sample.
To compare the amounts of Au and Hg detected before and after electrocleaning, the total Au, Hg and Cu counts were extracted from regions of interest using GeoPIXE (before electrocleaning) and PyMCA (after electrocleaning). In order to compare both sets of XRF data, which were collected at different incident energies, the total expected fluorescence yield per mass for CuK, AuL and HgL were calculated at 13 keV and 20 keV using the xraylib library [29]. The relative expected fluorescence ratios were then calculated at each energy and the 20 keV ratios were adjusted for comparison with the 13 keV data: AuL/CuK ratios were scaled by 0.4381 and HgL/CuK ratios by 0.4388. The amounts of Au and Hg were evaluated relative to Cu by calculating the AuL/CuK and HgL/CuK count ratios. A direct comparison of raw counts was not possible because the total counts arising from the before and after scanning conditions were very different. The Cu counts were chosen as a reference because the signal is expected to be effectively constant across the entire plate and, importantly, unaffected by the electrocleaning process. Although the Cu signal in the fluorescence data was substantial (Cu is the substrate on which the Ag is cold welded), its local intensity can vary depending on the thickness of Ag above. However, this local variation is not affected by electrocleaning, meaning that the local ratios of Cu to Au and Hg are expected to remain constant if none of the materials are affected by the treatment. Although it is not an ideal internal standard, for these reasons, Cu was deemed the most appropriate option for a representation of the bulk material from which the examination of any variations in the surface microstructure (represented by Au and Hg that reside in the Ag–Au–Hg amalgam) could be examined. Three regions of interest for each image tone (highlight, midtone, and shadow) were averaged for each electrocleaning treatment, with care to select the same regions in the before and after electrocleaning datasets. Because the before and after measurements were made with different incident energies, it was important to correct the AuL/CuK and HgL/CuK ratios in the 20 keV (after) scan, taking into account the relative decrease in expected CuK fluorescence versus AuL and HgL fluorescence at the higher energy.

3. Results and Discussion

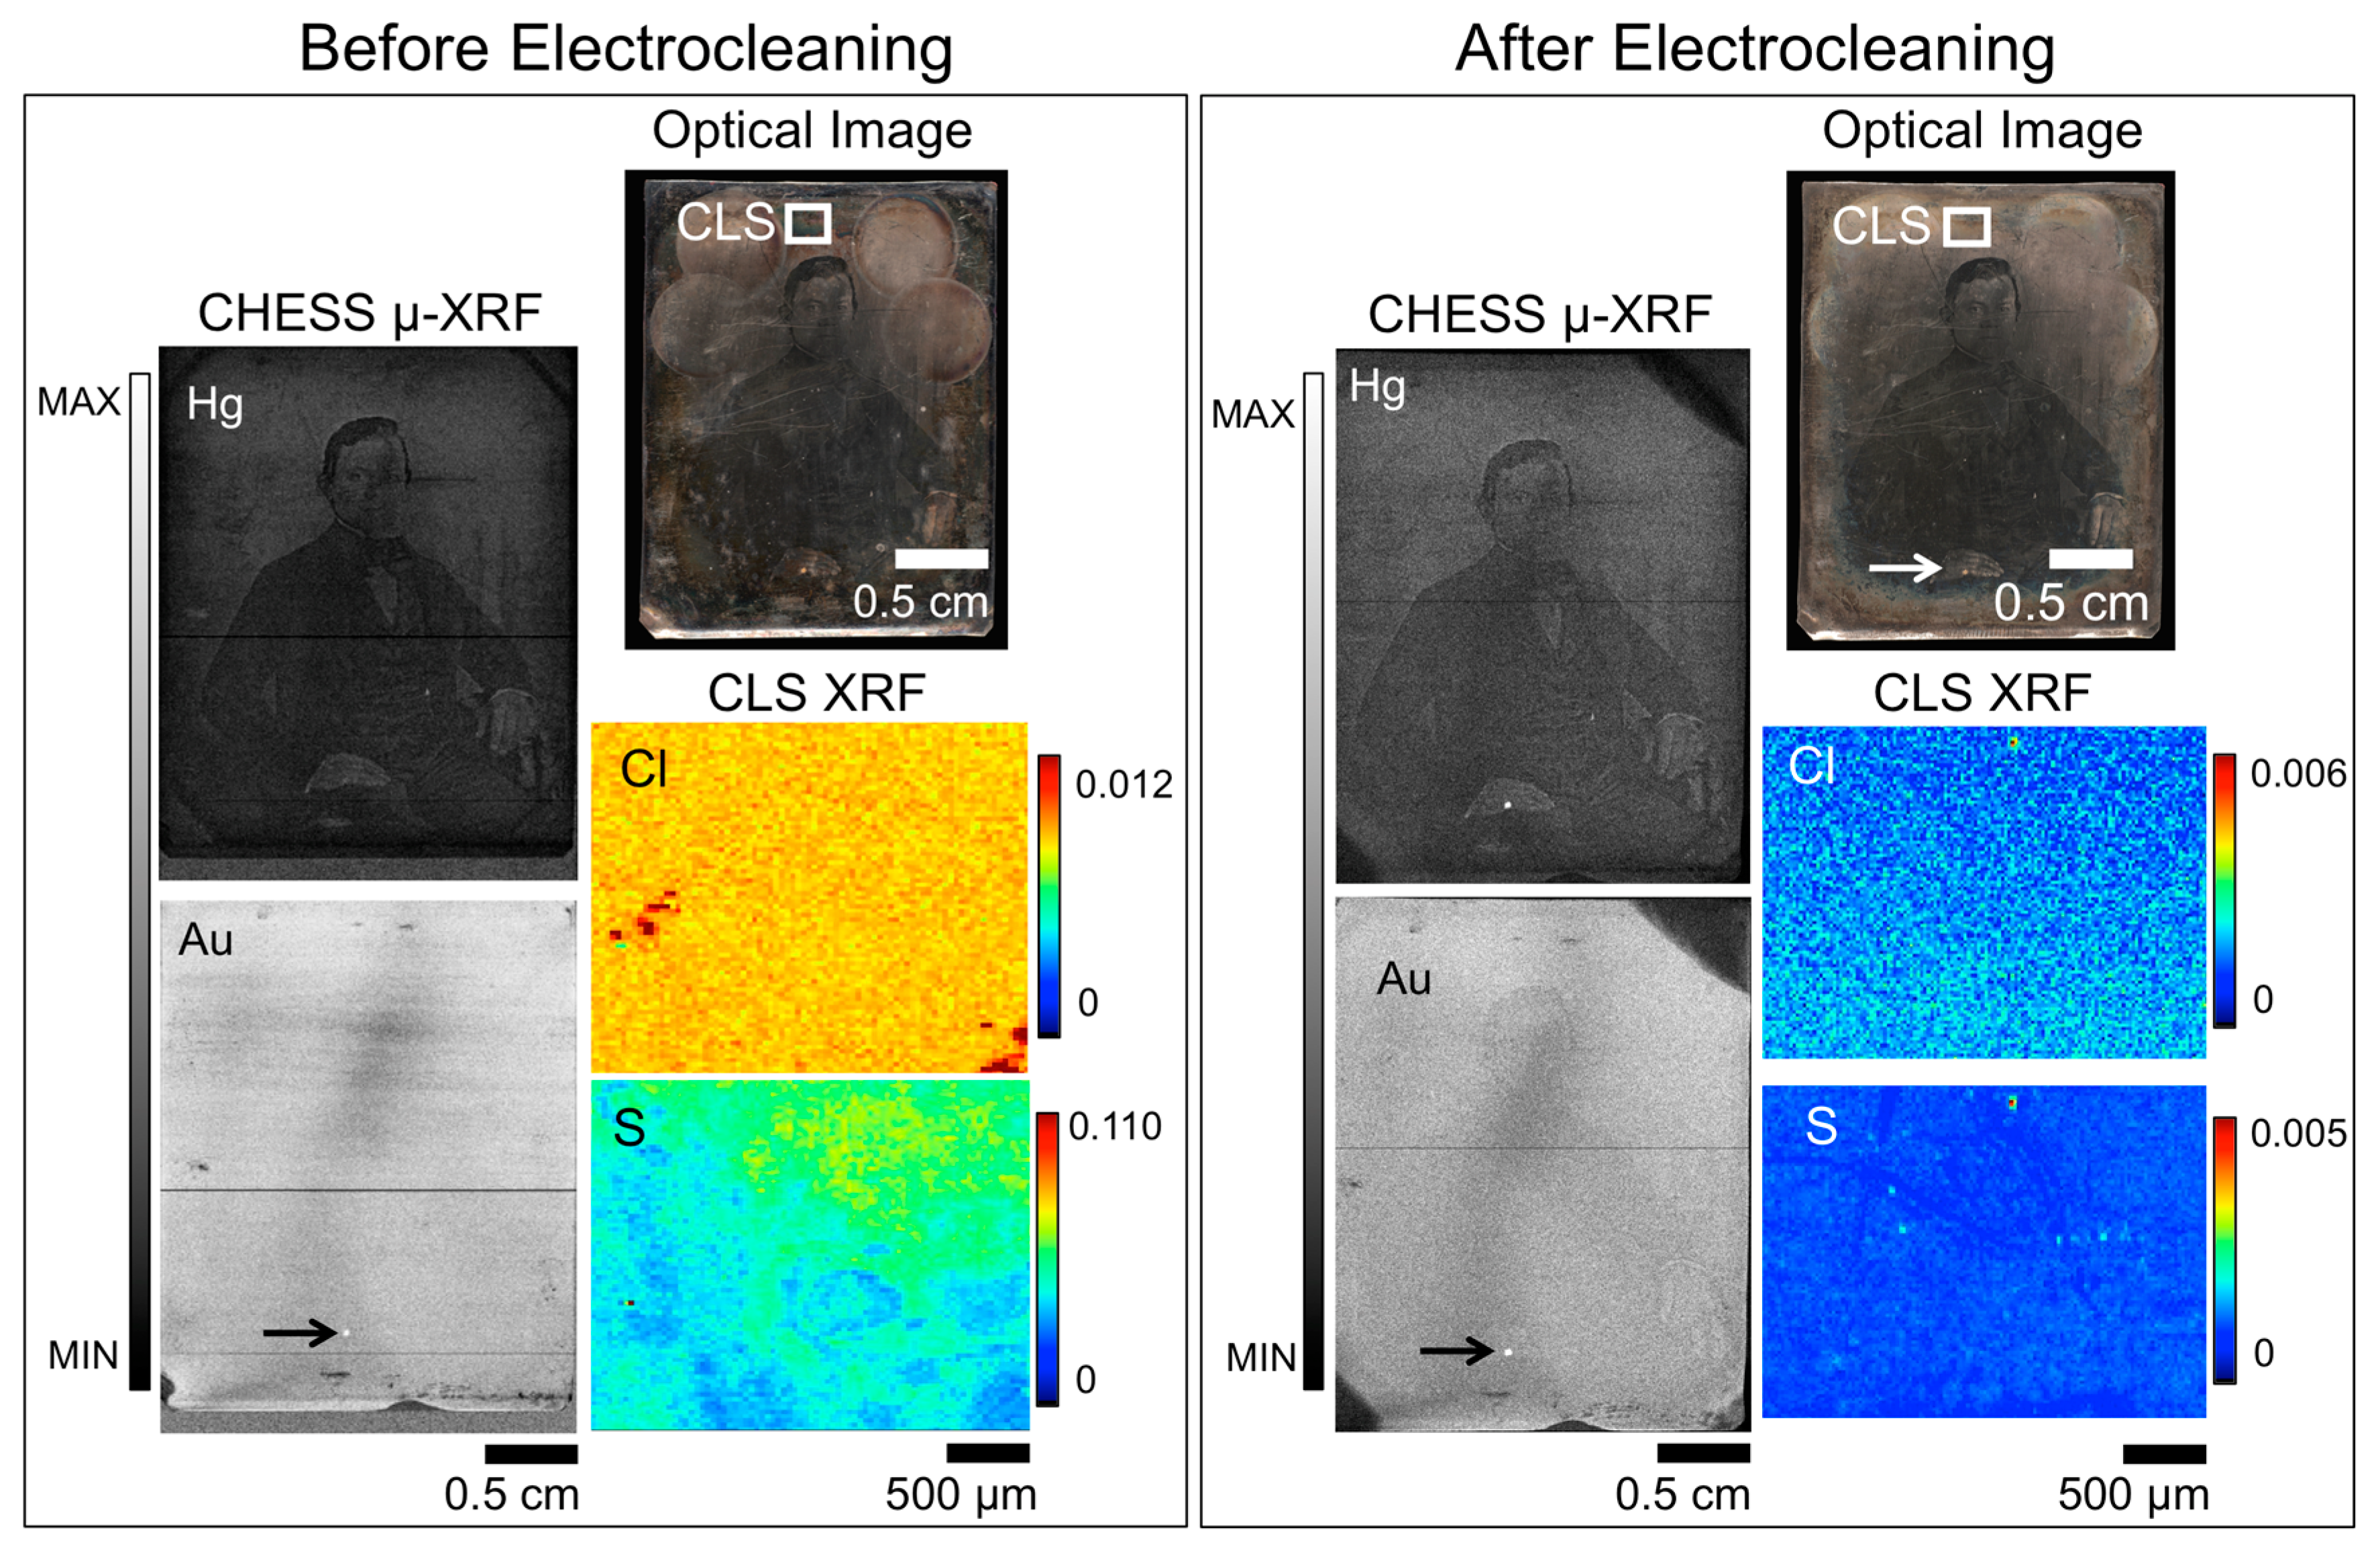
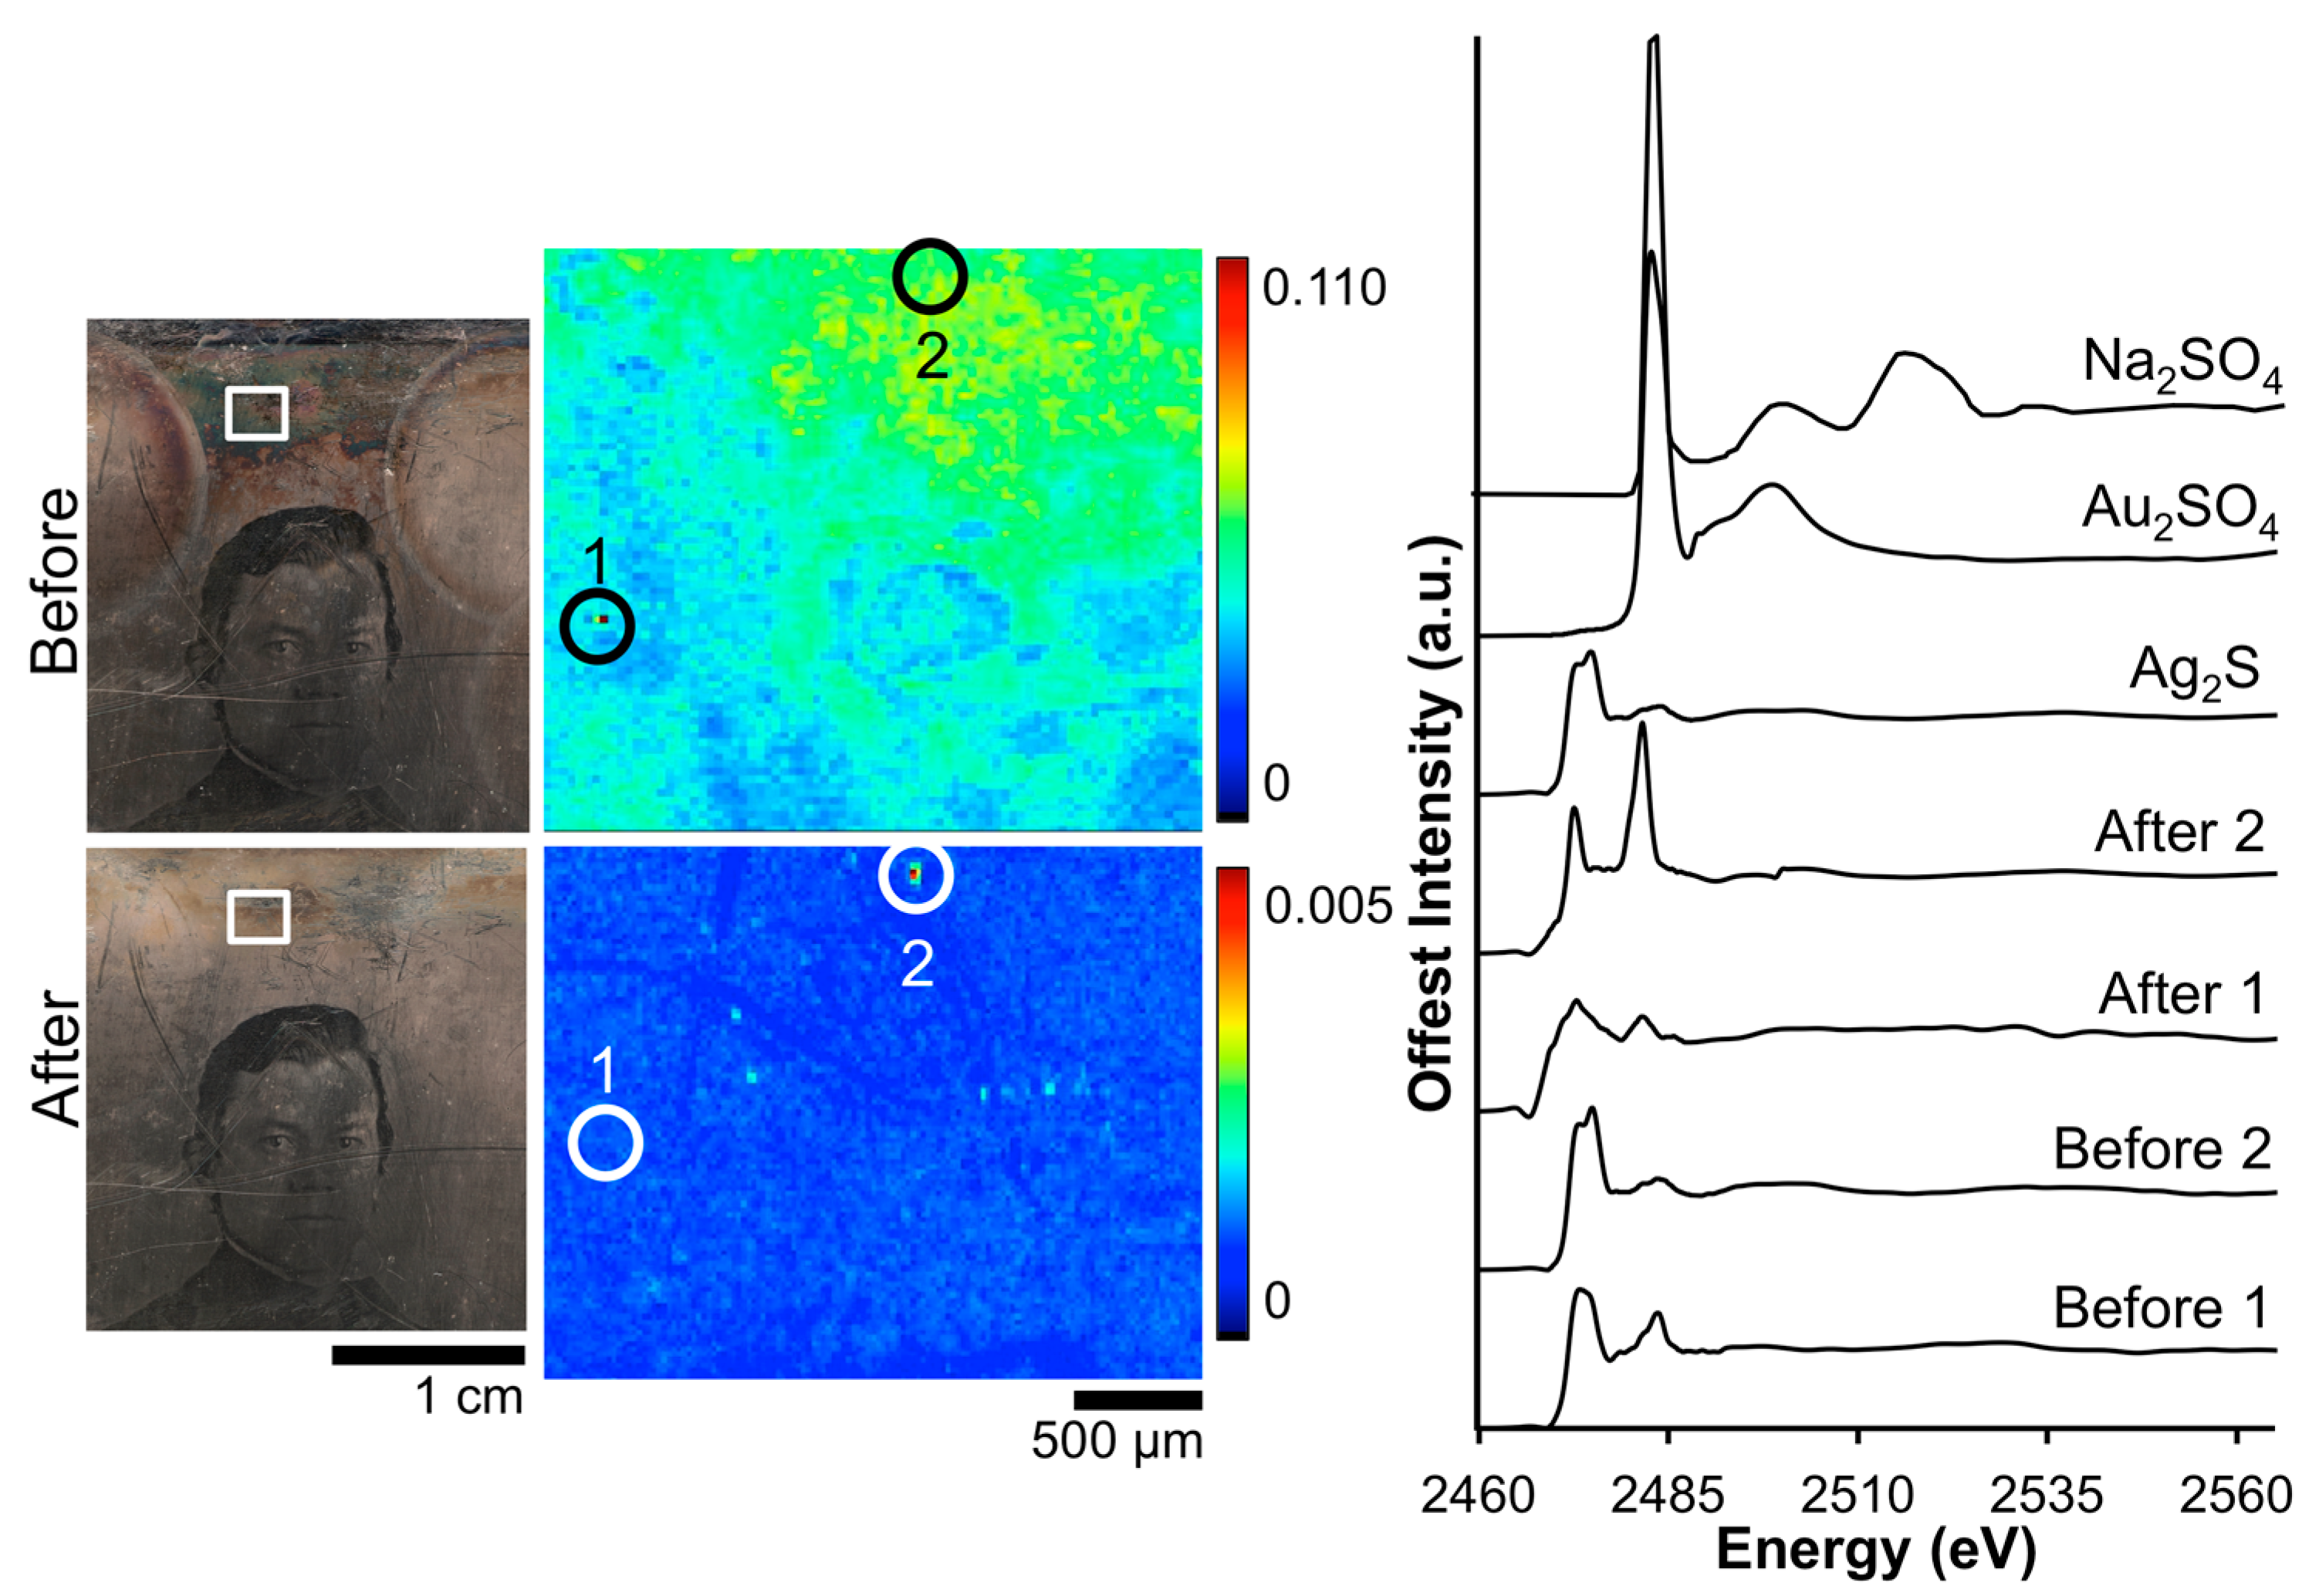
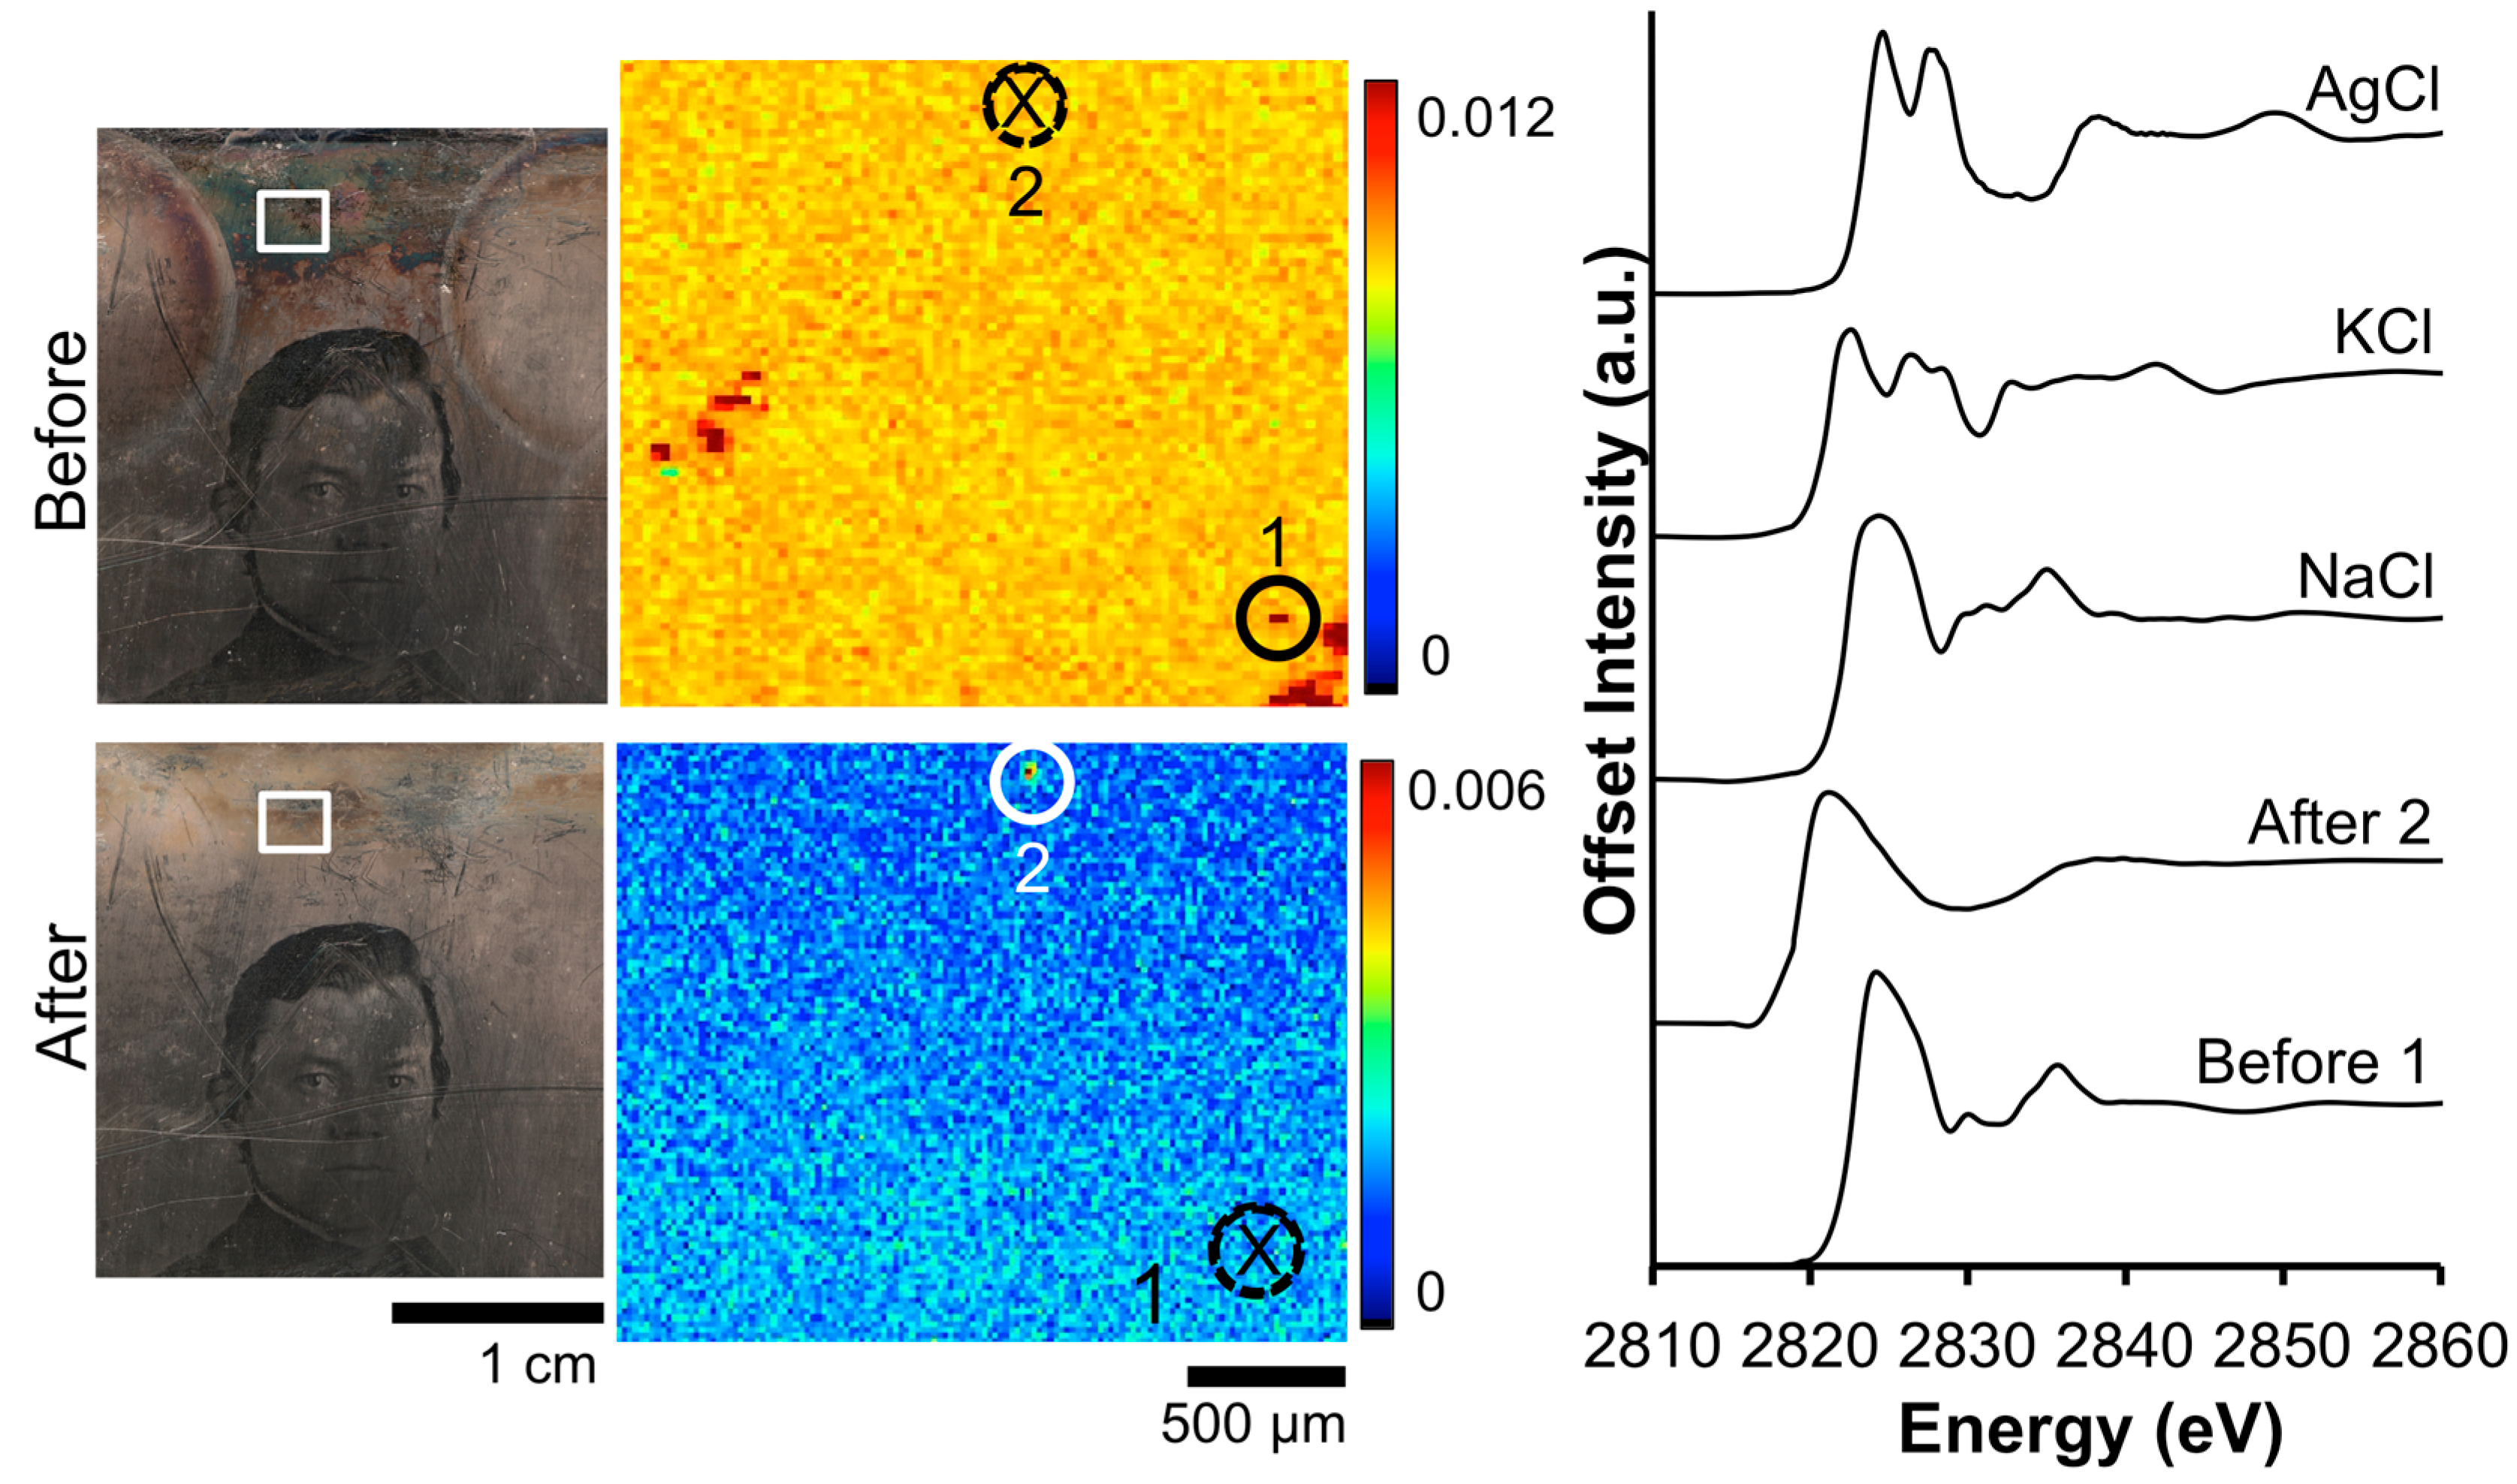
3.1. The Barger Process

Recently, rapid scanning μ-XRF imaging of daguerreotypes enabled the imaging of severely degraded daguerreotypes, providing an alternative method of uncovering the obscured image [26]. While this method provides an alternative for plates that cannot be, or are not, improved by conservation efforts, the goal of museums is still to conserve and preserve daguerreotypes. Figure 2 shows the results of a cleaning treatment conducted on daguerreotype PSC 70:112 where a dramatic improvement in visual appearance is observed. The impact of the Barger electrocleaning can be seen in the variation of the concentrations for Ag, S, and Cl (CLS SXRMB data). Here, the relative amount of S and Cl has notably decreased post-treatment while the counts for Ag have increased. This comparative increase in Ag is most likely due to the removal of corrosion species on the surface. When comparing either the pre- or post-treatment Ag maps from CLS SXRMB to those collected at CHESS (either the A1 or G3 beamlines), the difference in the amount of detail observed is due to the use of different incident energies. As the details of the daguerreotype reside within the image particles, which exist in in the first few hundred nanometers of the surface [15], a detailed Ag image can be obtained with the soft X-ray used at the CLS since one absorption length of Ag at the excitation energy of 3.95 keV is ~0.8 μm. The hard incident X-ray used at CHESS provides a bulk analysis of Ag signal as one absorption length at this energy of 20 keV (for the post-cleaning data) is ~60 μm. At the excitation energy of 20 keV, the cross-section for Ag L3 excitation is weak and the signal is dominated by the bulk, which is why the daguerreotype image cannot be observed in the CHESS Ag maps.
Figure 3 shows the before and after S μ-XRF images along with accompanying XANES data for daguerreotype PSC 70:112. The before image shows a random dispersion of S across the eye region, while after cleaning, the details of the man’s right eye are apparent. The relative concentration of S correlates with regions of increased image particle (Ag–Au–Hg) density. This accumulation of tarnish in the highlight area may be due to the relative increase in reactivity in these areas. Three locations were selected within the μ-XRF image from which absorption spectra were gathered. While an effort was made to collect these spectra at the same location, it was not possible to examine the exact same sites pre- and post-cleaning. Therefore, the XANES spectra are representative of an overall change in chemistry as a result of the cleaning. The S K-edge, which is the result of a 1s electron being promoted to a previously unoccupied 3p orbital, occurs at 2473 eV. The location of the edge jump (peak A), along with the double feature of the first peak, suggests an Ag-S interaction [31]. While all the absorption spectra indicate Ag2S to be the dominant species, the second, distinct peak at 2483 eV (peak B), indicates sulfate is also present due to surface oxidation [32].
The quality of the spectra varies between the pre- and post-electrocleaning data (Figure 3). The signal to noise ratio has worsened post-cleaning due to the reduction of S on the daguerreotype surface. In addition, while the normalization process has produced the same area under the curve for all spectra, their non-normalized spectra look quite different (not shown). In the non-normalized spectra, the area under the curve is significantly reduced in the post-cleaning spectra, which is due to the removal of tarnish from the daguerreotype surface. The ratio between the two peaks (B/A) can be used to distinguish between the pre- and post-cleaning: before cleaning the average ratio is 0.87 while the average ratio after cleaning is 0.99. This confirms the removal of sulfide and sulfate as a result of the electrocleaning process.
The impact of the Barger electrocleaning process on the Cl contamination on daguerreotype PSC 70:112 is shown in Figure 4. From the XRF image, the tarnished surface shows a random distribution of Cl across the eye region. Post-electrocleaning, this spotted pattern has been removed and a uniform distribution, with a faint outline of the eye, is apparent. This, along with the optical image of the plate, is evidence that the conservation method was successful at returning the image to as close as possible to its original state, removing unwanted degradation products (based on both S and Cl) on the surface. Both of the before-cleaning absorption spectra clearly indicate the presence of AgCl as the primary tarnish product, which is clear from the location of the K-edge at 2822 eV along with the position and shape of the oscillations after the edge jump [33]. Only one of the two examined locations provided sufficient signal to collect an adequate post-electrocleaning Cl K-edge spectrum (Figure 4). Here, the Cl K-edge, which was collected within the vicinity of the pre-treated XAS spectra, shows a very different signature, which is similar to that of potassium chloride (KCl) [34]. This could arise from an environmentally sourced product that was deposited on the plate post-treatment.
During Barger electrocleaning in NH4OH (pH = 12), the alternation between anodic and cathodic polarization removes the tarnish products through the oxidation and reduction of silver on the surface of the daguerreotype. When the daguerreotype acts as the cathode, the Ag in the tarnish undergoes reduction (Equations (1) and (2)) while oxidation occurs at the anode, the Pt electrode.
Ag2S (s) + 2 e → 2 Ag (s) + S2− (aq)
AgCl (s) + e → Ag (s) + Cl (aq)
Barger [6] suggested that when the polarity is reversed, tarnish is removed by a mechanical action. This would be the result of the volume expansion of the underlying Ag surface caused by the Ag to Ag2O reaction (Equation (3)) while at the Pt electrode reduction occurs (Equation (4)). The subsequent reversal of polarization causes the reduction of Ag2O to Ag (s). It is challenging to confirm this process, however, without the analysis of potentiodynamic data.
2 Ag (s) + 2 OH → Ag2O (s) + H2O (aq) + e
H +   ( g ) + e 1 2   H 2   ( g )
The increase in contrast, image clarity, and brightness that is observed in daguerreotype PSC 70:112 (Figure 1a) may be the result of surface scrubbing or lifting of adherent particles via the production of H2 bubbles during the cathodic polarization portion of the Barger treatment. While the electrocleaning procedure is a non-contact method, the evolution of H2 gas can generate a mechanical cleaning effect, which, if limited, can improve the appearance of the surface. However, prolonged exposure may induce undesired abrasion. Finally, the benefit of NH4OH is that it is also a chelating agent and can chelate and remove any residual halides while the Ag2S is being removed electrochemically
Overall, a similar amount of detail is observed in both the Hg and Au CHESS images pre- and post-electrocleaning. For example, in the Hg maps in Figure 2, details of the foliage of the plant in the vase and the folds of the tablecloth on which it rests, and the man’s tie and tiepin are still visible after treatment. While it appears that upon further consideration that there is some minor degradation of boundaries in the Hg map, which may corroborate the reduction in Hg upon treatment, due to the inherent differences in the experimental set up, these variations between the pre- and post-treatment analyses may be more a function of the scanning conditions than the electrocleaning. The quality of the Au map will depend on the initial gilding process, how the tarnish interacts with the surface and the impact of the electrocleaning process. An apparent loss of detail is seen in the Au post-treatment μ-XRF image, suggesting that this cleaning method does impact the integral elements on the daguerreotype surface.
Taking into account the difference in the predicted total fluorescence for the elements of interest (Cu, Au, Hg) between 13.025 keV and 20 keV incident energies, Au(L)/Cu(K) and Hg(L)/Cu(K) ratios were collected at three different regions (highlight, midtone, and shadow) pre- and post-cleaning. From examination of the Au(L)/Cu(K) ratios, the greatest difference between the pre- and post-cleaned (Table 3) plates is observed in the highlighted regions. This may be due to the relatively greater reactivity of the high image particle density regions compared to the shadow regions. While a decrease in Au is noted in the midtone and shadow regions of plate PSC 70:112, the loss is not as substantial as was observed in the highlighted areas. The post-electrocleaning Hg(L)/Cu(K) ratio (Table 4) for PSC 70:112 shows a similar (~40%) loss of Hg in the highlight regions. The midtone and shadow regions are more difficult to assess. The total Hg signal in these areas of the plate was low both before and after the electrocleaning process, and therefore subject to greater uncertainty than the highlighted regions.

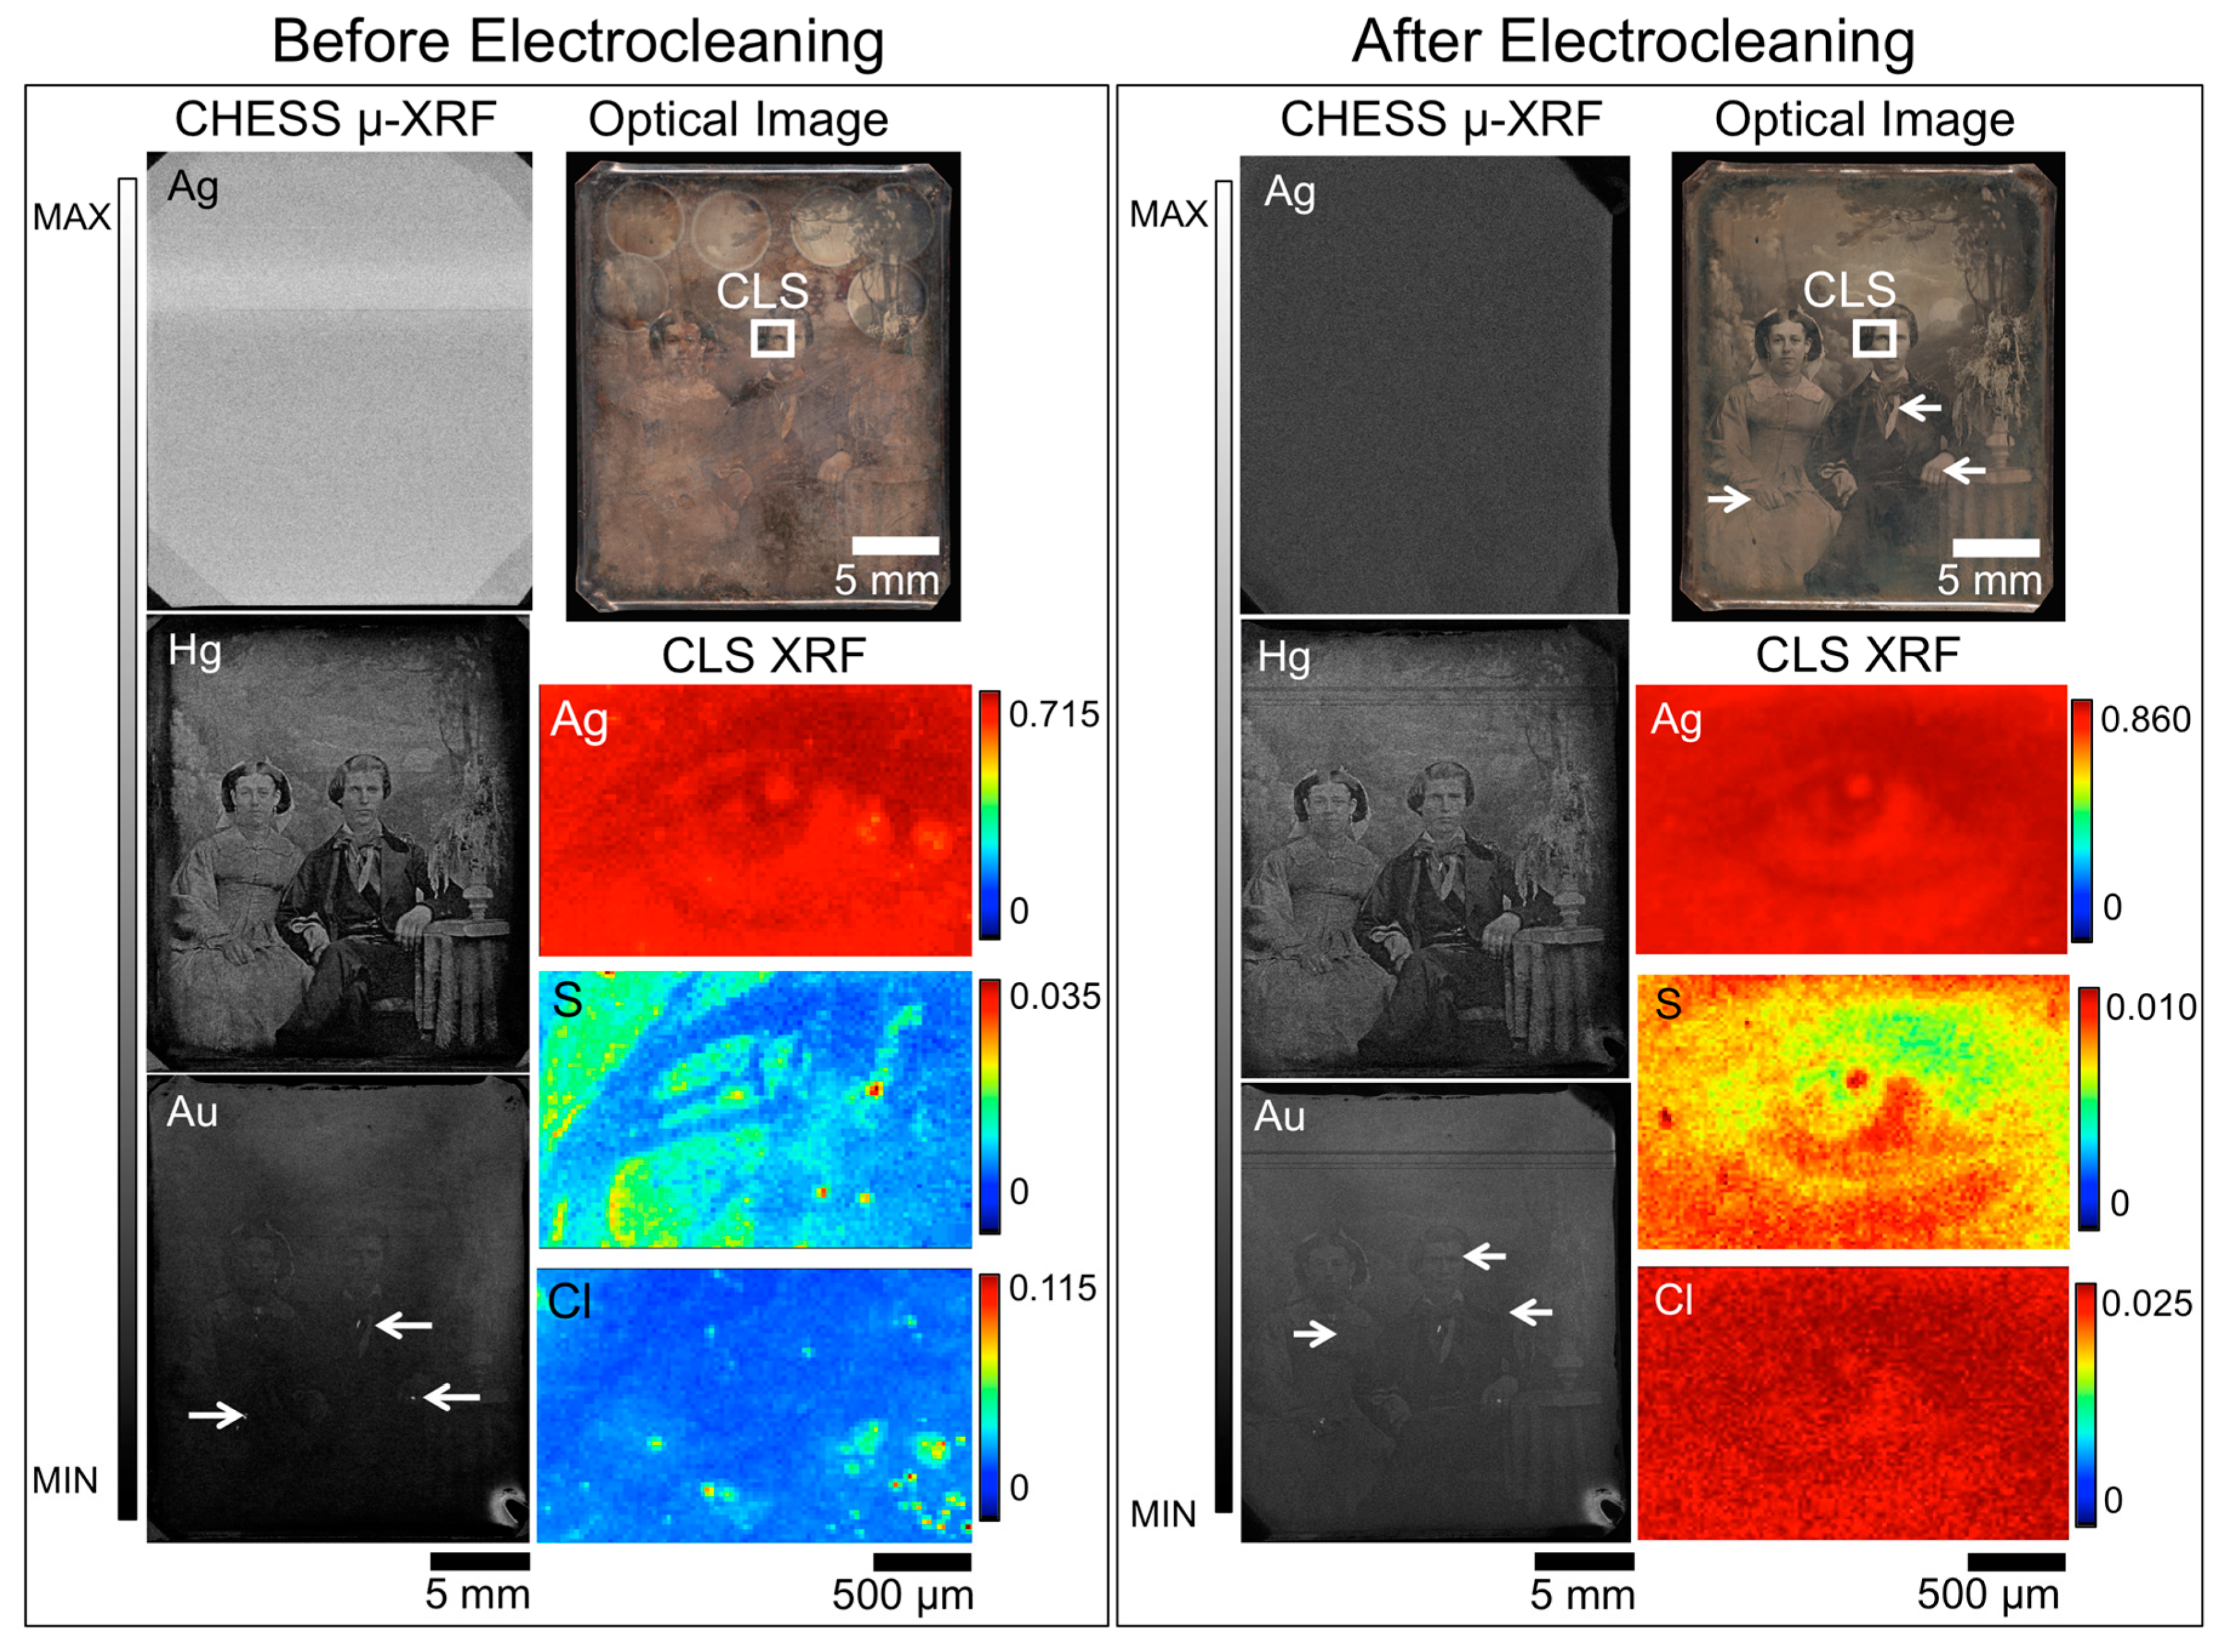
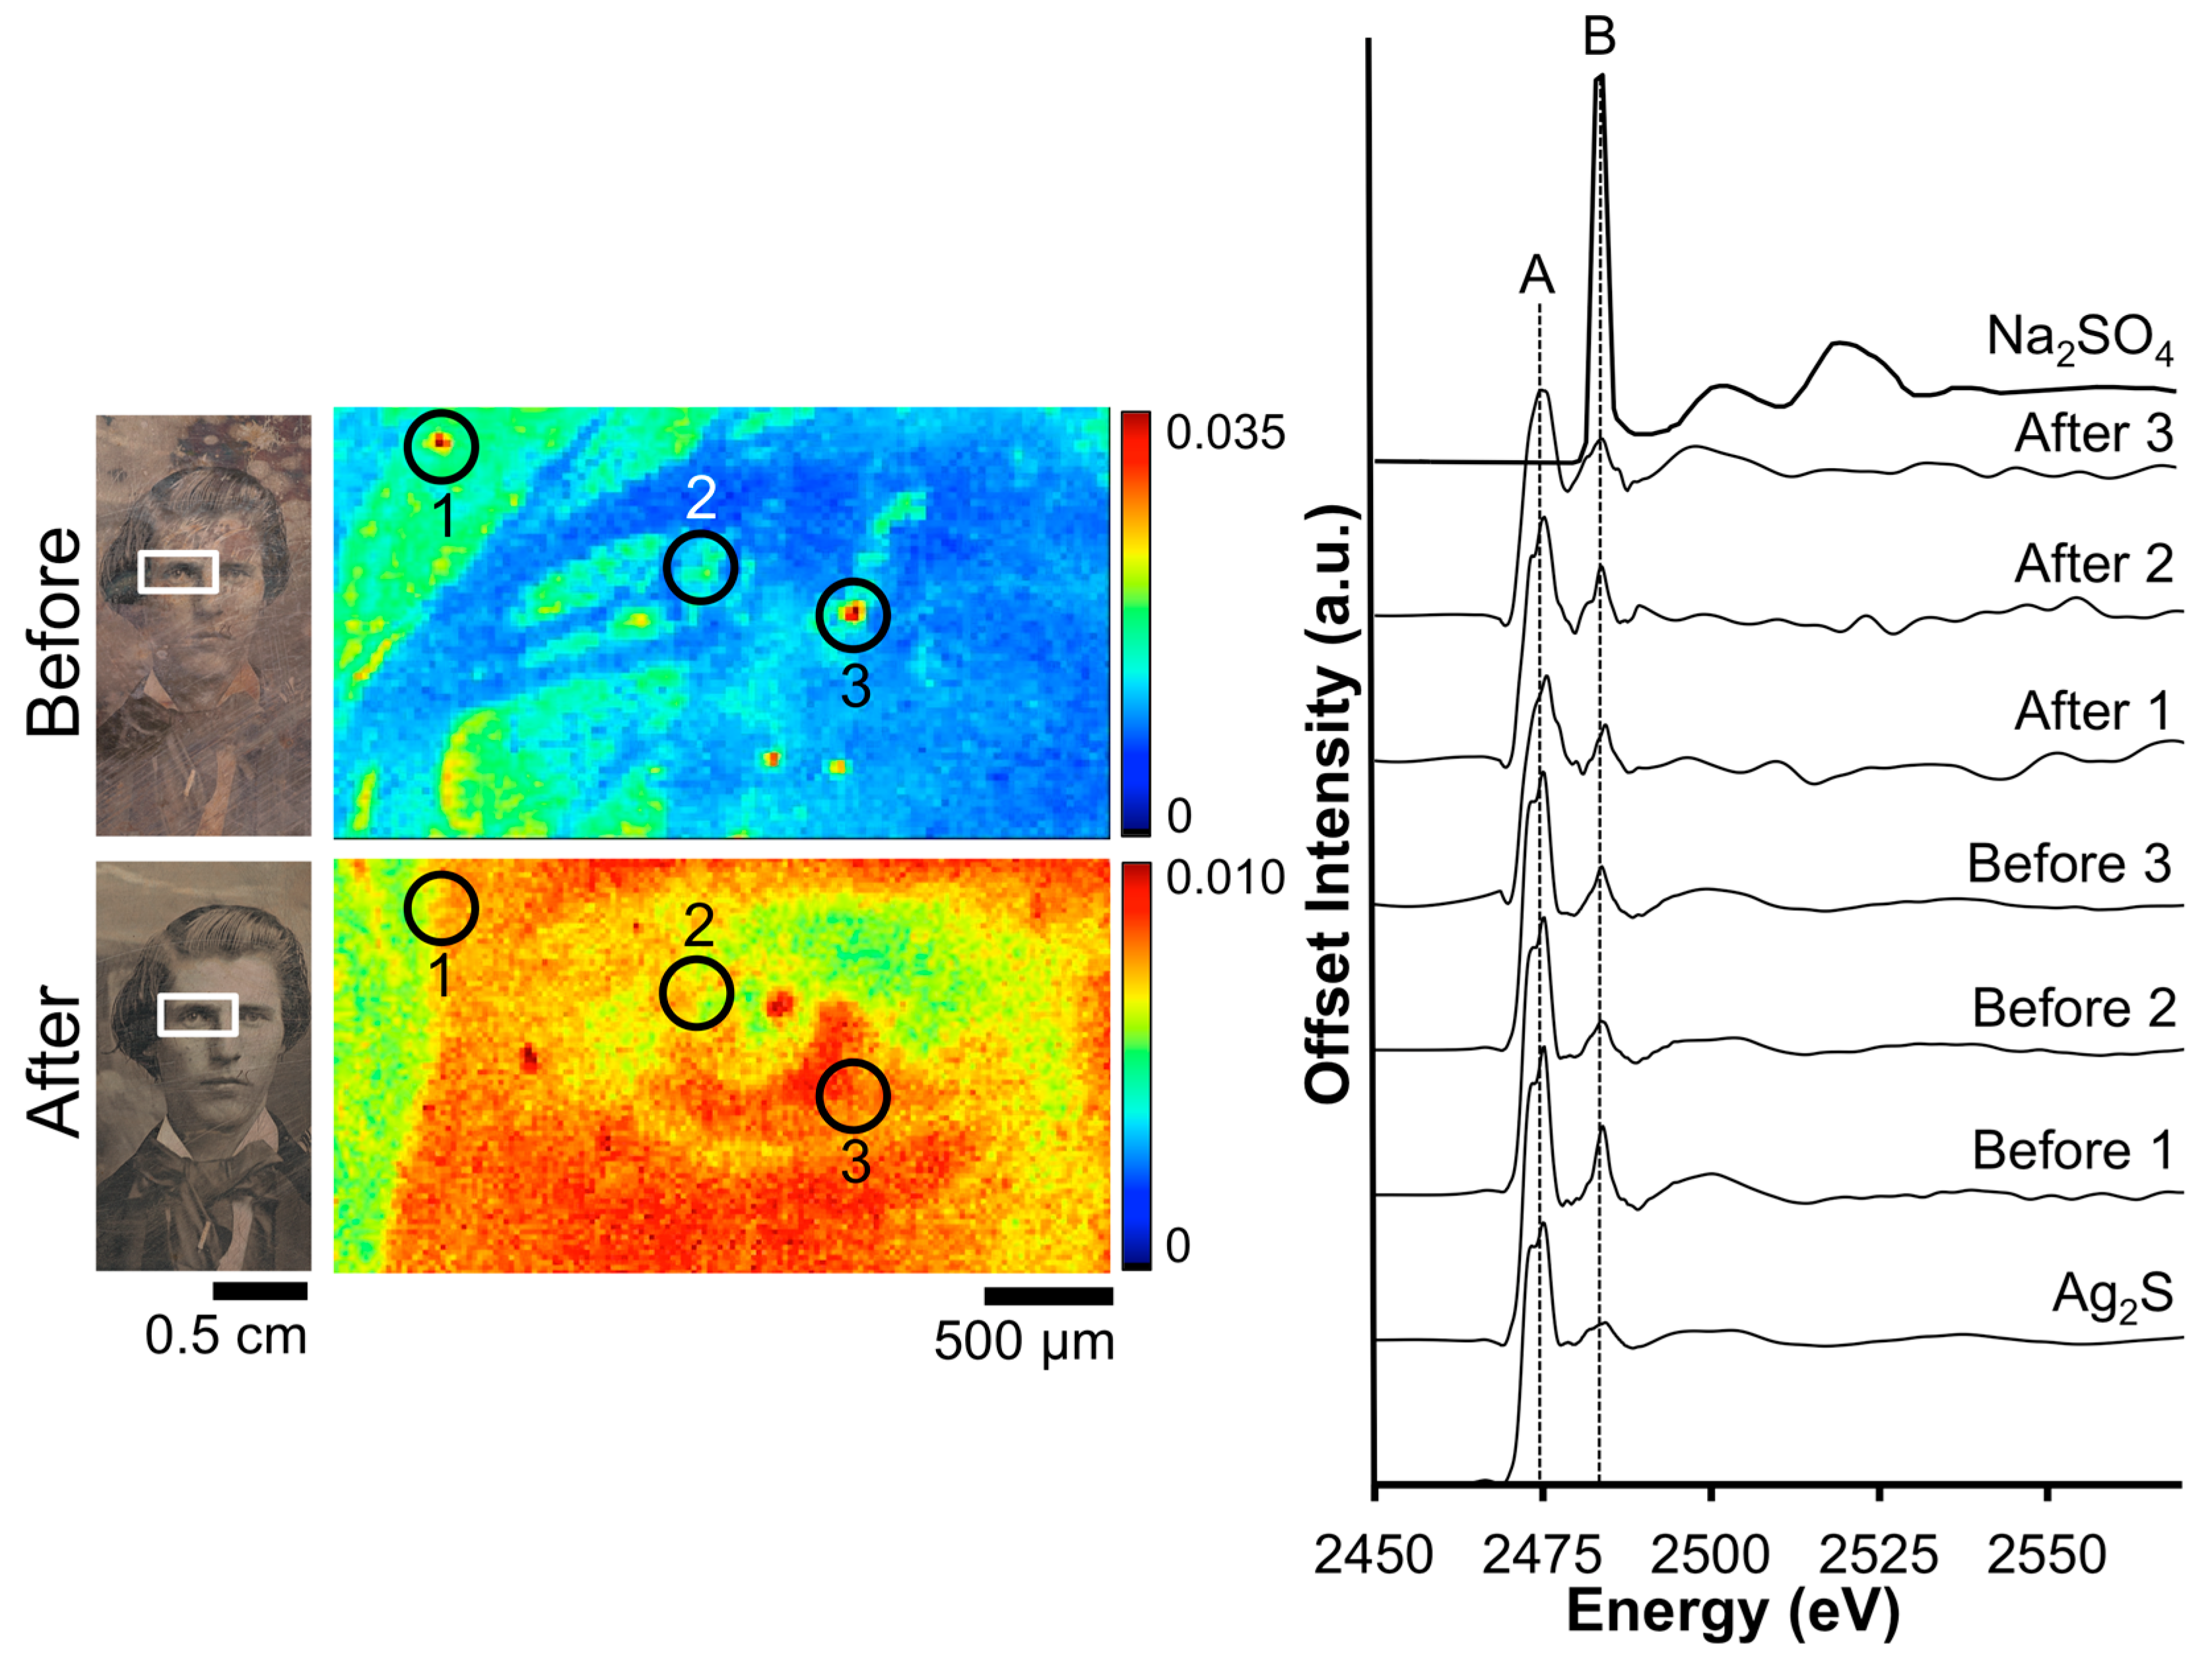
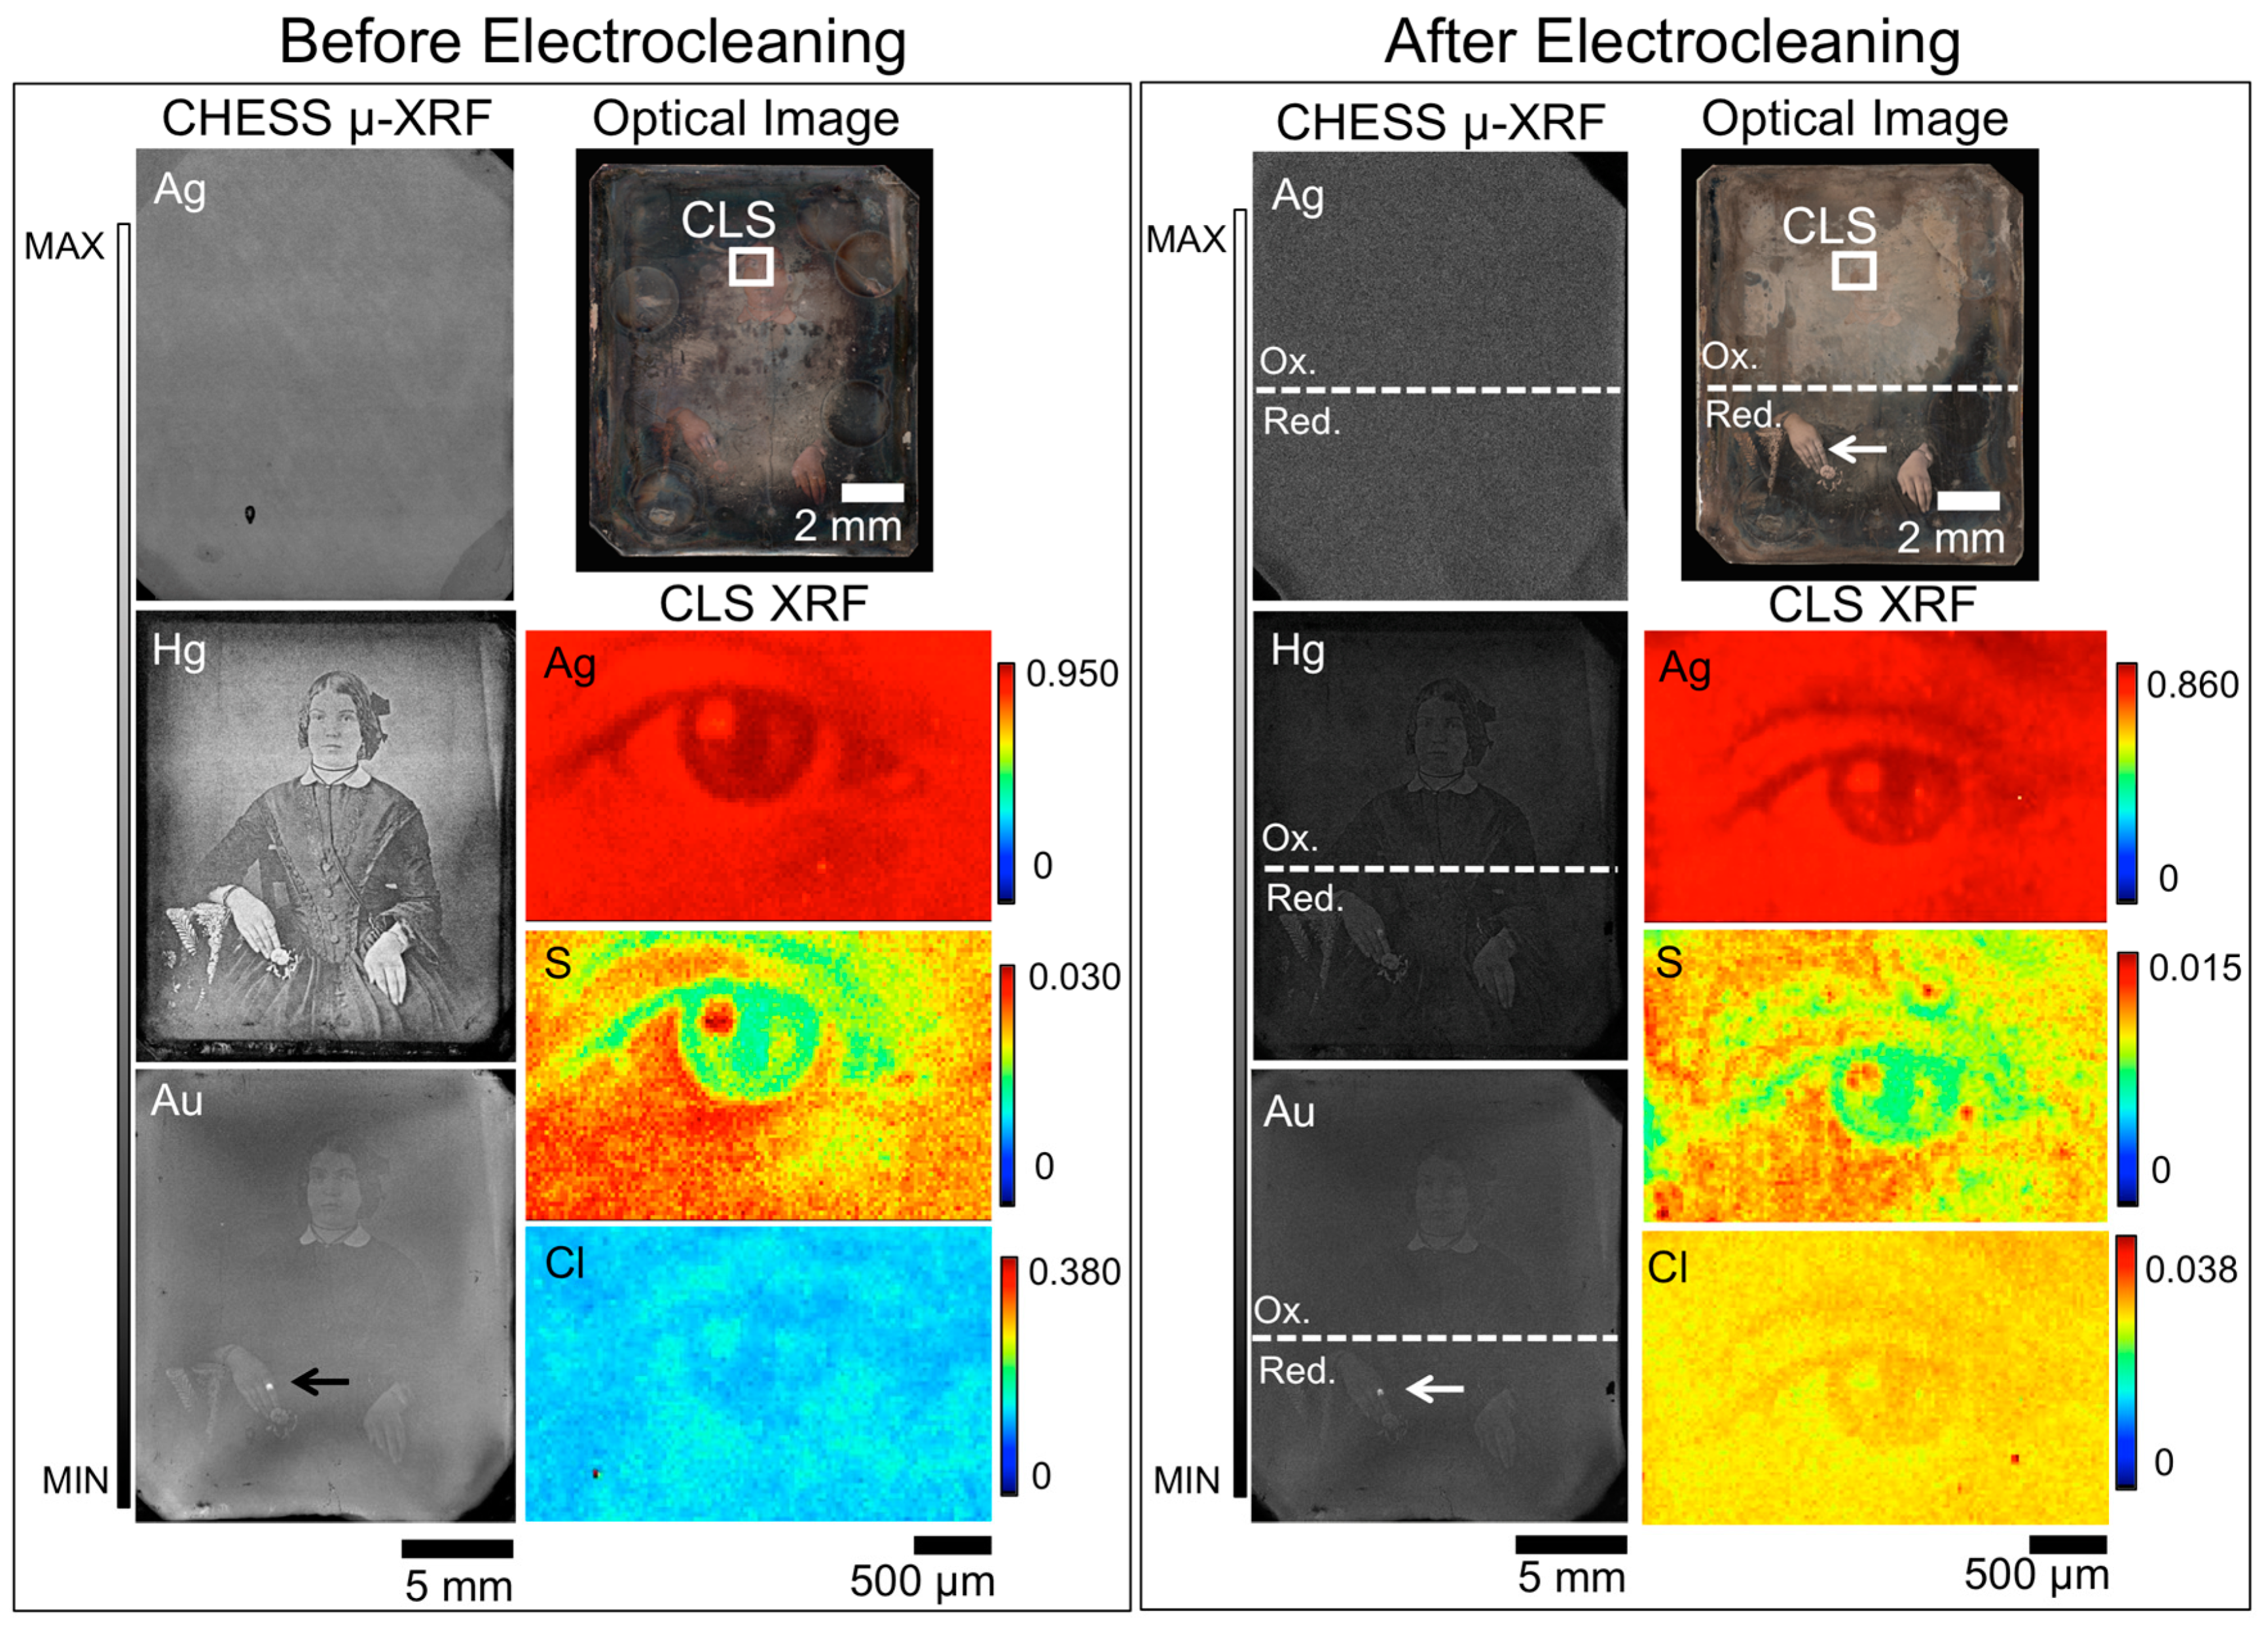
3.2. The Wei Process

Wei’s motivation was to establish a process that utilized only the cathodic portion of the electrocleaning treatment to avoid the removal of Ag from the surface. The results presented by Wei et al. showed that the cathodic cleaning removed blue tarnish and produced a visibly improved product [18]. The visual examples provided in the Wei publication show a greater enhancement as a result of cleaning than the daguerreotypes cleaned in this study. One explanation for this discrepancy may be the relative poorer quality of the plates treated in this study, thereby resulting in a less vibrant final result. This reliance on daguerreotype quality to judge the effectiveness of a conservation treatment can make developing new treatment methods challenging. However, when paired with μ-XRF, qualitative and quantitative observations can be made, thereby assisting in determining effective and safe cleaning methods.
Cleaning daguerreotype RCLSC1 with the Wei method somewhat improved the quality of the visual image (Figure 5). Here, the distinct border of the localized cleaning locations has been softened and the intensity of the corrosion that is present along the perimeter has been muted (Figure 1b.2), like that observed by Wei [18]. While the clarity of the man’s attire has improved, there appears to be a lack of depth (i.e., the attenuation of the grey scale range) in this image, which is also observed on the tarnished plate prior to treatment. This reduction in grey scale contrast produces the appearance of a flattened image, a qualitative feature that is present in both the treated and un-treated images and may indicate poorly preserved image particles. This finding suggests that the outcome of a treatment is strongly dependent on the integrity of the original surface under the corrosion layer. Therefore, despite the effectiveness of the electrocleaning technique, if a plate is of poor quality to begin with, removing the tarnish will only reveal a poor quality photograph.
Given the colour and location of this tarnish, it is expected to be S dominant. The CLS pre-treatment S μ-XRF image (Figure 5) shows a variation in concentration across the examined region, which has been removed after the electrocleaning treatment. This removal of S by the cleaning process allows for surface abrasions, such as scratches, to be visible in the μ-XRF image. The distribution of Cl on the tarnished surface shows localized hot spots of Cl buildup. While a large amount of Cl was not observed on the pre-cleaned surface, the Wei method was successful at removing what was present from the surface.
A closer examination of the local chemistry on daguerreotype RCLSC1 was conducted with XANES spectroscopy (Figure 6). Sulfur absorption spectra were collected from within the vicinity of two regions pre- and post-electrocleaning. Silver sulfide was again observed as the dominant corrosion product with the peak at 2483 eV suggestive of sulfates, which is expected and appears to be minimal. The peak ratios for the two spectra collected from the tarnish surface correlate to the dominance of Ag2S signal. Post-treatment, the edge jump of spectrum “After 1” has a B/A peak ratio of 0.99. This result is similar to that of the Barger post-treatment S K-edge spectra and is indicative of the removal of sulfide groups from the surface. Similarly, in spectrum “After 2”, the reduction process has removed a significant portion of the sulfide and sulfate groups, producing a sulfide/sulfate ratio over 1.0.
Analysis of Cl within the tarnish band (Figure 7) shows a different distribution compared to that of S. In the tarnished Cl μ-XRF image, the only discernable features are two regions with randomly elevated Cl signal. Post-treatment, these aggregated areas of increased Cl signal have been removed. While two areas were probed for Cl K-edge examination, only one provided sufficient signal to produce a readable spectrum. The peak positions, widths, and relative areas vary according to the bonding state of Cl and can be used to identify the local Cl environment [35]. Analysis of the Cl K-edge data pre-cleaning (Before 1) shows a broad absorption band with a maximum located at 2824 eV. Here, the location of the edge jump, along with the post edge oscillations, corresponds to the sodium chloride (NaCl) standard [36]. In the “After 2” spectrum collected post-electrocleaning, the shift to a lower energy of the Cl edge jump is indicative of an organochlorine compound.
Curiously, in the post-treatment Au μ-XRF map, the outline of the seated man is more distinct than in the pre-treatment and the hot spot visible at the man’s ring is still apparent (Figure 5). A shadow-like feature that stretches across the man’s body can be seen in the Au map and to a lesser extent in the Hg image. While the source of this feature is not clear, it may be the result of how the gilding solution was applied, or simply an abrasive feature from a cloth or hand. The examination of Au(L)/Cu(K) (Table 3) and Hg(L)/Cu(K) (Table 4) ratios at highlight, midtone, and shadow regions revealed that a substantial amount of both Au and Hg have been removed as a result of the cleaning process, which is highlighted by the percent difference values in both Table 3 and Table 4. In all regions, a percent loss of approximately 72% was observed in the Au(L)/Cu(K) ratios. For the Hg(L)/Cu(K) ratios, a percent loss of 82% was noted in the highlighted and midtone regions and a 78% loss in the shadow regions. This significant removal of elements integral to the plate suggests that if a daguerreotype appears to not be in a well-preserved state, that electrocleaning may further weaken the image particles through the removal of Au and Hg.
If the daguerreotype functions as the anode in the Wei method instead of as the cathode, the procedure does not yield a positive outcome. Figure 8 shows the μ-XRF images before and after anodic treatment on the top half of the plate and cathodic cleaning on the bottom half. In the optical image, the negative impact of the oxidation (anodic treatment) is evident, as the top portion of the plate has lost its reflectivity, gained an increased roughness thereby masking the image, and demonstrates a negative effect on its aesthetic quality. Any silver nitrate (AgNO3) formed during the oxidation process would be removed during the rinsing process.
Micro-XRF of the woman’s eye (CLS SXRMB) shows that the primary features are retained despite the anodic cleaning (Figure 8). The Ag and S maps, however, do show an increase in irregularity post-treatment and the contrast range in the post-electrocleaned daguerreotypes appears to have decreased. In the pre-treatment S XRF image, the details of the eye are obvious while the finer details appear blurred in the post-treatment map. For example, the distinct line that delineates the eyelid in the before treatment map has become fragmented post-cleaning. The S K-edge spectra (Figure 9) that were collected pre- and post-cleaning at similar locations on the surface vary considerably. In the two spectra taken from the tarnished plate, Ag2S is the dominant tarnish species and was confirmed comparing the “Before 1” peak ratio (0.61) to that of the Ag2S standard spectrum (0.67). Examining spectrum “Before 2”, a peak ratio value (B/A) of 0.87 is determined, which corresponds to the peak ratios calculated for the S K-edge in Figure 3. The quality of the signal post-treatment has noticeably deteriorated with the average peak ratio for signals A and B for the three post-treatment being 0.99 (B/A). This is evidence that while the cleaning process has a negative effect on the quality of the image, it has also successfully removed the majority of the sulfide on the surface.
The impact on the distribution of Cl from anodic cleaning with the Wei process can be seen in Figure 10. Despite the increased surface roughness caused by the treatment, the clarity of the eye is improved in the post-cleaning Cl μ-XRF map. The Cl K-edge, which occurs at 2822 eV, indicates that AgCl is the prominent deterioration compound. While these same locations were examined again post-treatment, the signal was insufficient to collect a statistically significant spectrum. A fourth location, a Cl hotspot, was subsequently examined and, when compared to the standard spectra, was determined to be KCl. The presence of KCl is most likely due to environmental contamination post-treatment as it was not stored in an inert environment between cleaning and analysis.
Comparison of the Au(L)/Cu(K) (Table 3) and Hg(L)/Cu(K) (Table 4) ratios at highlight, midtone, and shadow regions pre- and post-cleaning was done on both the oxidized (top) and reduced (bottom) portions of the plate. The oxidized region (top half) of the plate showed a 62% depreciation of Au while the reduction area (bottom half) showed similar results (62%, 58%, and 60% reduction for the highlight, midtone, and shadow regions, respectively). This similarity in loss of Au may be due to the challenge of localized cleaning while the entire plate is immersed in solution (i.e., while cleaning efforts were done on two different portions of the plate, some of the impact of oxidation may be observed on the bottom half of the plate and vice versa). The variations in the Hg(L)/Cu(K) ratios also showed similar percent differences between the reduced and oxidized portions of the plate: the highlighted regions showed an approximate 41% loss and the midtone areas show an estimated 21% loss. The greatest difference was observed in the shadowed portions of the plate for both oxidized and reduced regions as the reduction process reported a 50% increase of signal while the oxidation side of the daguerreotype showed a 9% increase. Given that all instances of a positive shift were observed from shadow areas where the Hg counts are low both before and after cleaning, this discrepancy is likely related to the poorer signal to noise ratio and overall lower counts for Hg in general, which are especially apparent in the after-cleaning scan conditions.
While a loss of quality in the optical image in the top half of SC1 is observed post-treatment, the CHESS Hg images (Figure 8) retain a significant amount of detail compared to the un-treated elemental maps. Due to the exposure to an oxidation environment on the top half of the plate, Hg may undergo reduction along with Ag. Once in solution, aqueous Hg may form a variety of compounds such as, but not limited to: mercury chlorides (Hg2Cl2 and HgCl2) [37], mercury sulfides (HgS and Hg2S) [38], and/or mercury oxides (HgO and Hg2O) [39] some of which will redeposit uniformly on the surface. A similar observation can be made about the Au map. This suggests that a loss, or possible redistribution, of Hg and Au is potentially expected as a result of the oxidation process. Even with this loss of contrast, the rapid scanning μ-XRF images of Hg and Au from CHESS A1 show the main details remain in place, which suggests that this technique can be used to digitally recover the subject matter of daguerreotypes that have received unsuccessful treatments. Additional effort, such as scanning the plate twice using an incident photon energy above and below the edge of interest (HgL) would help improve the quality of the μ-XRF image, if desired.
It is challenging to decipher how much difference is expected due to the initial state of the plate compared to the impact of the cleaning treatment, in this case, the Wei method. However, when comparing the percent differences between plates RCLSC1 and SC1 (when reduction is used, i.e., the bottom half of the plate), plate integrity appears to make a 10% difference with respect to the Au/Cu ratio (i.e., 10% less Au is removed) while it makes a 40–90% difference in the Hg/Cu ratios for highlight to shadow regions, respectively. From these preliminary conclusions, it appears that plate integrity has a greater impact on the relative amount of Hg retained after cleaning than of Au.

4. Conclusions

When used correctly and appropriately, full plate electrocleaning with both the Barger and Wei methods was observed to improve the optical quality of all the plates in this study. The importance of this study is in the use of synchrotron-based μ-XRF to image entire daguerreotype surfaces before and after cleaning where previously, only a localized view of any variations in chemical or physical morphology was documented. Given that this treatment method involves full immersion of the daguerreotype into the electrolyte, μ-XRF mapping of complete plates is essential to understand the full effect of these cleaning methods as the impact of the treatment cannot be completely isolated. Future work should include the development of a localized, non-immersive cleaner for daguerreotypes which would ensure localized cleaning efforts, remove the need for submersion in an electrolyte, and could possibly be used to conserve coloured daguerreotypes, which are currently untreatable with electrocleaning as their colour is soluble in solution.
While there were reservations in the use of Cu as an appropriate internal standard, it was used to provide some insights into the impact of the electrocleaning treatments. From the Au(L)/Cu(K) and Hg(L)/Cu(K) ratios collected from highlight, midtone, and shadow regions before and after cleaning, it appears that despite the method used, both Au and Hg are removed from and/or redistributed across the surface. The greatest difference before and after cleaning for both Au and Hg was noted at the highlight regions on all plates. The Barger method had the greatest impact on the relative concentrations of Au, while Hg appears to be removed in similar quantities by both the Wei and Barger process. This is the first time that μ-XRF ratios generated from maps have been reported, which contain significantly more data points than a single point measurement. This ability to average a collection of points enables an improved picture of the larger trends resulting from treatment.
Along with the observation that both electrocleaning processes have the greatest impact (i.e., most significant loss of Au and Hg) on the highlight regions of the plate, it was noted that S, and sometimes Cl, accumulates within high image particle density regions. This suggests the reactivity of the plate is correlated with image particle density. This may be due to the increased surface area, or by virtue of the image particles having limited contact with the plate, and may imply that the particles and the plate do not have the same potential. X-ray absorption analysis showed that before cleaning, AgCl and Ag2S were the dominant Ag tarnish species and that both of these compounds were removed as a result of cleaning.
These findings can assist in influencing conservator and conservation scientists’ decisions when pursuing chemical analysis and/or conservation treatments, but each daguerreotype must be assessed individually before proceeding. It is important to note that if a plate is of poor quality, removing the tarnish will only reveal a poor quality photograph. It may also be the case that if a daguerreotype is not well preserved, electrocleaning will contribute to the degradation of the image. It is evident that careful consideration needs to be taken prior to undergoing electrocleaning and that more work needs to be done before this cleaning method is deemed safe to be used on daguerreotypes.

Author Contributions

Conceptualization, M.S.K. and T.K.S.; methodology, I.C., L.S., A.W., M.S.K., and T.K.S.; software, L.S. and A.W.; validation, L.S. and A.W.; formal analysis, M.S.K., L.S., and A.W.; investigation, M.S.K., L.S., and A.W.; resources, L.S., A.W., T.K.S., and M.S.K.; data curation, A.W., L.S., M.S.K.; writing—original draft preparation, M.S.K.; writing—review and editing, R.M., T.K.S., A.N., A.W., L.S. I.C., J.M., and M.S.K.; visualization, M.S.K. and L.S.; supervision, T.K.S., R.M., A.N. and I.C.; project administration, T.K.S. and I.C.; funding acquisition, T.K.S.

Funding

This work is based upon research conducted at the Cornell High Energy Synchrotron Source at the A1 and G3 beamlines, which are supported by the National Science Foundation and the National Institutes of Health/National Institute of General Medical Sciences under NSF award DMR-1332208. This research was supported by the National Science and Engineering Research Council of Canada (grant number T.K.S: DG, RGPIN-2014-04113), the Canadian Foundation for Innovation, Canada Research Chairs and the Ontario Ministry of Innovation. Further support for interdisciplinary research was provided by The Dean’s Office at The University of Western Ontario, Faculty of Science.

Acknowledgments

The authors wish to thank the support and collaboration of John P. McElhone, the Canadian Photography Institute, the National Gallery of Canada.

Conflicts of Interest

The authors declare no conflict of interest. The funders had no role in the design of the study; in the collection, analyses, or interpretation of data; in the writing of the manuscript, or in the decision to publish the results.

References

  1. American Institute for Conservation of Historic and Artistic Works, Code of Ethics and Guidelines for Practices. 2018. Available online: http://www.conservation-us.org/our-organizations/association-(aic)/governance/code-of-ethics-and-guidelines-for-practice/code-of-ethics-and-guidelines-for-practice-(html)#.XBAfsxQqZUR (accessed on 11 December 2018).
  2. Argago, F. Le daguerreotype. Comptes Rendus des Séances de l’Académie des Sciences 1839, 9, 250–267. [Google Scholar]
  3. Holland, P. Personal photographs and popular photography. In Photography: A Critical Introduction, 5th ed.; Wells, L., Ed.; Routledge: London, UK, 2015; p. 147. ISBN 978-0-415-85428-3. [Google Scholar]
  4. Ravines, P.; Li, L.; McElroy, R. An electron microscopy study of the image making process of the daguerreotype, the 19th century’s first commercially viable photographic process. J. Imag. Sci. Technol. 2016, 10, 30504-1–30504-10. [Google Scholar] [CrossRef]
  5. Ravines, P.; Li, L.; Chan, L.; McElroy, R. Some science behind the daguerreotype: Nanometer and sub-micrometer realities on and beneath the surface. In Nanoscience and Cultural Heritage; Dillman, P., Bellot-Gurlet, L., Nenner, I., Eds.; Atlantis Press: Paris, France, 2016; pp. 123–158. ISBN 978-94-6239-197-0. [Google Scholar]
  6. Barger, S.M.; Krishnaswamy, S.V.; Messier, R. The cleaning of daguerreotypes: Comparison of cleaning methods. J. Am. Conserv. 1982, 22, 13–24. [Google Scholar] [CrossRef]
  7. Centeno, S.; Schulte, F.; Kennedy, N.; Schrott, A. The formation of chlorine-induced alterations in daguerreotype image particles: A high resolution SEM-EDS study. Appl. Phys. A 2011, 105, 55–63. [Google Scholar] [CrossRef]
  8. Franey, J.P.; Kammlott, G.W.; Graedel, T.E. The corrosion of silver by atmospheric sulfurous gases. Corr. Sci. 1985, 25, 133–143. [Google Scholar] [CrossRef]
  9. Graedel, T.E.; Franey, J.P.; Gualtieri, G.J.; Kammlott, G.W.; Malm, D.L. On the mechanism of silver and copper sulfidation by atmospheric H2S and COS. Corr. Sci. 1985, 25, 1163–1180. [Google Scholar] [CrossRef]
  10. Graedel, T.E. Corrosion mechanism for silver exposed to the atmosphere. J. Electrochem. Soc. 1992, 139, 1963–1970. [Google Scholar] [CrossRef]
  11. Barger, S.M.; Giri, A.P.; White, W.B.; Edmondson, T.M. Cleaning Daguerreotypes. Stud. Conserv. 1986, 31, 15–28. [Google Scholar] [CrossRef]
  12. Turovets, I.; Maggen, M.; Lewis, A. Cleaning of daguerreotypes with an excimer laser. Stud. Conser. 1998, 43, 89–90. [Google Scholar] [CrossRef]
  13. Boselli, M.; Chiavari, C.; Colombo, V.; Gherardi, M.; Martini, C.; Rotundo, F. Atmospheric pressure non-equilibrium plasma cleaning of 19th century daguerreotypes. Plasma Process. Polym. 2017, 14, 1–8. [Google Scholar] [CrossRef]
  14. Robinson, M.; Vicenzi, E.P. A twin paradox: A study of preservation and disfigurement of Southworth and Hawes daguerreotypes. Topics Photogr. Preserv. 2015, 16, 1–19. [Google Scholar]
  15. Barger, S.M.; White, W.B. The Daguerreotype: Nineteenth Century Technology and Modern Science; Smithsonian Institution Press: Washington, DC, USA, 1991; pp. 46–122. ISBN 978-0801864582. [Google Scholar]
  16. Canosa, E. Investigation and Optimization of Electrochemical Treatments for Daguerreotypes. Ph.D. Thesis, University of Arizona, Tucson, AZ, USA, 2016. [Google Scholar]
  17. Da Silva, E.; Robinson, M.; Evans, C.; Pejovic-Milic, A.; Heyd, D.F. Monitoring the photographic process, degradation and restoration of 21st century Daguerreotypes by wavelength-dispersive X-ray fluorescence spectrometry. J. Anal. Atom. Spectrosc. 2010, 25, 654–661. [Google Scholar] [CrossRef]
  18. Wei, W.; Gerritsen, I.; Von Waldthausen, C. Re-examining the (electro-)chemical cleaning of daguerreotypes: Microscopic change vs. macroscopic perception. In Topics in Photographic Preservation, Proceedings of the American Institute for Conservation Photographic Materials Group, Milwaukee, WI, USA, 11–14 May 2010; American Institute for Conservation: Washington, DC, USA, 2011; pp. 24–40. [Google Scholar]
  19. Kozachuk, M.S.; McElhone, J.P. Applying nanoscience to daguerreotypes: Understanding and preserving the first form of the photograph. Natl. Gallery Can. Rev. 2018, 9, 36–42. [Google Scholar] [CrossRef]
  20. Xiao, Q.; Maclennan, A.; Hu, Y.; Hackett, M.; Leinweber, P.; Sham, T.K. Medium-energy microprobe station at the SXRMB of the CLS. J. Synchrotron Rad. 2017, 24, 333–337. [Google Scholar] [CrossRef] [PubMed]
  21. Webb, S.M. The microanalysis toolkit: X-ray fluorescence image processing software. In Proceedings of the 10th International Conference on X-ray Microscopy, Chicago, IL, USA, 15–20 August 2010; Volume 1365, pp. 196–199. [Google Scholar] [CrossRef]
  22. Bzowski, A.; Sham, T.K.; Yiu, Y.M. Charge redistribution in Au-metalloid intermetallics: A Au L2,3 X-ray absorption study. Anal. Rev. B 1994, 49, 9515–9520. [Google Scholar] [CrossRef]
  23. Ravel, B.; Newville, M. ATHENA, ARTEMIS, HEPHAESTUS: Data analysis for X-ray absorption spectroscopy using IFEFFIT. J. Synchrotron Radiat. 2005, 12, 537–541. [Google Scholar] [CrossRef] [PubMed]
  24. Ravel, B. Athena User’s Guide. The University of Chicago, 2009. Available online: http://cars9.uchicago.edu/~ravel/software/exafs/ (accessed on 10 September 2014).
  25. Kirkham, R.; Dunn, P.A.; Kuczewski, A.J.; Siddons, D.P.; Dodanwela, R.; Moorhead, G.F.; Ryan, C.G.; De Geronimo, G.; Beuttenmuller, R.; Pinelli, D.; et al. The Maia spectroscopy detector system: Engineering for integrated pulse capture, low-latency scanning and real-time processing. AIP. Conf. Proc. 2010, 1234, 240–243. [Google Scholar] [CrossRef]
  26. Kozachuk, M.S.; Sham, T.K.; Martin, R.; Nelson, A.J.; Coulthard, I.; McElhone, J.P. Recovery of degraded-beyond-recognition 19th century daguerreotypes with rapid high dynamic range elemental X-ray fluorescence imaging of mercury L emission. Nat. Sci. Rep. 2018, 8, 1–10. [Google Scholar] [CrossRef]
  27. Ryan, C.; Jamieson, D. Dynamic analysis: On-line quantitative PIXE microanalysis and its use in overlap-resolved elemental mapping. Nucl. Instrum. Methods Phys. Res. Sect. B Beam Interact. Mater. Atoms. 1993, 77, 203–214. [Google Scholar] [CrossRef]
  28. Solé, V.A.; Papillon, E.; Cotte, M.; Walter, P.; Susini, J. A multiplatform code for the analysis of energy-dispersive X-ray fluorescence spectra. Spectrochim Acta B. 2007, 62, 63–68. [Google Scholar] [CrossRef]
  29. Schoonjans, T.; Brunetti, A.; Golosio, B.; Sanchez del Rio, M.; Solé, V.A.; Ferrero, C.; Vincze, L. The xraylib library for X-ray–matter interactions: Recent developments. Spectrochim. Acta Part B 2011, 66, 776–784. [Google Scholar] [CrossRef]
  30. Jacob, M.G. Colour and the daguerreotype. Daguerreotype J. 2014, 0, 13–19. Available online: https://www.fotomuseum.be/content/dam/fomu/pdf%27s/Daguerreotype%20Journal_Issue_0_%202014_07.pdf (accessed on 11 December 2018).
  31. Solomon, D.; Lehmann, J.; Martinez, C.E. Sulfur K-edge XANES spectroscopy as a tool for understanding sulfur dynamics in soil organic matter. Soil Sci. Soc. Am. J. 2003, 67, 1721–1731. [Google Scholar] [CrossRef]
  32. Manceau, A.; Nagy, K.L. Quantitative analysis of sulfur functional groups in natural organic matter by XANES spectroscopy. Geochimica et Cosmochimica Acta 2012, 99, 206–223. [Google Scholar] [CrossRef]
  33. Kozachuk, M.S.; Sham, T.K.; Martin, R.R.; Nelson, A.J.; Coulthard, I. Exploring tarnished daguerreotypes with synchrotron light: XRF and μ-XANES analysis. Hert. Sci. 2018, 6. [Google Scholar] [CrossRef]
  34. Cotte, M.; Susini, J.; Metrich, N.; Moscato, A.; Gratziu, C.; Bertagnini, A.; Pagano, M. Blackening of Pompeian cinnabar paintings: X-ray microspectroscopy analsyis. Anal. Chem. 2006, 78, 7484–7492. [Google Scholar] [CrossRef] [PubMed]
  35. Leri, A.C.; Hay, M.B.; Lanzirotti, A.; Rao, W.; Myneni, S.C.B. Quantitative determination of absolute organohalogen concentrations in environmental samples by X-ray absorption spectroscopy. Anal. Chem. 2006, 78, 5711–5718. [Google Scholar] [CrossRef] [PubMed]
  36. Konishi, H.; Yamashita, M.; Uchida, H.; Mizuki, J. Cl k-edge XANES spectra of atmospheric rust on Fe, Fe-Cr and Fe-Ni alloys exposed to saline environment. Mater. Trans. 2004, 45, 3356–3359. [Google Scholar] [CrossRef]
  37. Afonso de Magalhães, M.E.; Tubino, M. A possible path for mercury in biological systems: The oxidation of metallic mercury by molecular oxygen in aqueous solutions. Sci. Total Environ. 1995, 170, 229–239. [Google Scholar] [CrossRef]
  38. Dahmen, E.A.M.F. Faradaic methods of electrochemical analysis. In Electroanalysis: Theory and Applications in Aqueous and Non-Aqueous Media and in Automated Chemical Control; Elsevier: Amsterdam, The Netherlands, 1986; p. 132. ISBN 0-444-42534-9. [Google Scholar]
  39. Milazzo, G.; Caroli, S.; Sharma, V.K. Tables of Standard Electrode Potentials; John Wiley & Sons: Chichester, UK, 1978. [Google Scholar]
Figure 1. Images of 19th century daguerreotypes before (1) and after (2) electrocleaning, which was done with either the Barger (B) method or Wei (W) method. (a) Daguerreotype (accession number PSC 70:112) from the National Gallery of Canada (NGC) collection; (b) daguerreotype (accession number RCLSC1) from the NGC research study collection; (c) daguerreotype (identified as SC1) from the NGC research study collection.
Heritage 02 00037 g001
Figure 2. Before (left box) and after (right box) Barger electrocleaning data for daguerreotype PSC 70:112, which includes an optical image (top right), μ-XRF images for Ag, Hg, and Au from CHESS (left), and μ-XRF images for Ag, S, and Cl from the CLS (right). The region analyzed at the CLS is indicated in the optical image. Arrow indicates the possible use of Au leaf post-production [30].
Heritage 02 00037 g002
Figure 3. Before and after Barger electrocleaning data from daguerreotype PSC 70:112: (left) optical images of man’s face post-electrocleaning; (center) S μ-XRF images; (right) S K-edge XANES data collected at select points indicated in XRF images.
Heritage 02 00037 g003
Figure 4. Before and after Barger electrocleaning data from daguerreotype PSC 70:112: (left) optical images of man’s face post-electrocleaning; (center) Cl μ-XRF images; (right) Cl K-edge XANES data collected at select points indicated in XRF images (solid line indicates location where Cl concentration was sufficient for absorption data while dotted line with an X indicates signal was insufficient for absorption spectra collection).
Heritage 02 00037 g004
Figure 5. Micro-XRF images from before (left box) and after (right box) Wei cleaning for daguerreotype RCLSC1, which includes an optical image (top right), μ-XRF images for Hg and Au from CHESS (left), and μ-XRF images collected in the tarnish band above the man’s head for S and Cl from the CLS (bottom right). The region analyzed at CLS SXRMB is indicated in the optical image. Arrow indicates the possible use of Au leaf post-production [30].
Heritage 02 00037 g005
Figure 6. Before and after Wei electrocleaning data from daguerreotype RCLSC1: (left) optical images of man’s face; (center) S μ-XRF images collected in the tarnish above the man’s head; (right) S K-edge XANES data collected at select points indicated in μ-XRF images.
Heritage 02 00037 g006
Figure 7. Before and after Wei electrocleaning data from daguerreotype RCLSC1: (left) optical images of woman’s face; (center) Cl μ-XRF images; (right) Cl K-edge XANES data collected at select points indicated in μ-XRF images (solid line indicates location where Cl concentration was sufficient for absorption data while dotted line with an X indicates signal was insufficient for absorption spectra collection).
Heritage 02 00037 g007
Figure 8. Before (left box) and after (right box) Wei electrocleaning μ-XRF images for daguerreotype SC1, which includes an optical image (top right), μ-XRF images for Ag, Hg, and Au from CHESS (left), and μ-XRF images for Ag, S, and Cl from the CLS (bottom right). The region analyzed at the CLS SXRMB is indicated in the optical image. Arrow indicates the possible use of Au leaf post-production [30].
Heritage 02 00037 g008
Figure 9. Before and after Wei electrocleaning data from daguerreotype SC1: (left) optical images of woman’s face; (center) S μ-XRF images; (right) S K-edge XANES data collected at select points indicated in μ-XRF images (solid line indicates location where S concentration was sufficient for absorption data while dotted line indicates signal was insufficient for absorption spectra collection).
Heritage 02 00037 g009
Figure 10. Before and after Wei electrocleaning data from daguerreotype SC1: (left) optical images of woman’s face; (center) Cl micro-XRF images; (right) Cl k-edge XANES data collected at select points indicated in μ-XRF images (solid line indicates location where Cl concentration was sufficient for absorption data while dotted line and an X indicates signal was insufficient for absorption spectra collection).
Heritage 02 00037 g010
Table 1. X-ray absorption collection parameters for Ag, S and Cl.
Element of InterestEnergy Range (eV)Energetic Step Size (Pre-Edge)Energetic Step Size (at the Edge)Energetic Step Size (Post-Edge)Edge Jump Analyzed
Ag3344–3450 2.00 eV0.15 eV0.75 eVL3-edge (2984 eV)
S2448–2554 2.00 eV0.20 eV0.75 eVK-edge (2307 eV)
Cl2800–2950 2.00 eV0.15 eV0.75 eVK-edge (2622 eV)
Table 2. List of standards used for X-ray absorption near edge (XANES) analysis.
Element of InterestStandardsEdge Jump Analyzed
AgAg, Ag95Au5, Ag75Au25, AgI, AgCl, AgBr, Ag2O, Ag2S, AgNO3L3-edge (2984 eV)
ClAgCl, NaCl, KCl, HgCl2, Au(SMe2)Cl, Au2Cl6K-edge (2307 eV)
SAg2S, Na2SO4, Na2SO3, CuS, Cu2S, HgSO4, Na2S2O3·5H2OK-edge (2622 eV)
Table 3. Average and standard deviation values for Au(L)/Cu(K) ratios collected before and after electrocleaning treatment for all three daguerreotypes. Three different areas (highlight, midtone, and shadow) were probed. The after values have been scaled to account for the difference in total fluorescence due to the different incident energies used pre- and post-treatment. (± = standard deviation).
DaguerreotypeCleaning ProcessRegionBefore Au/CuAfter Au/Cu% Difference before/after
PSC 70:112BargerHighlight0.012 ± 0.00100.0071 ± 0.0034−41%
Midtone0.0080 ± 0.00370.0050 ± 0.0017−37%
Shadow0.0076 ± 0.00210.0049 ± 0.0016−36%
RCLSC1WeiHighlight0.044 ± 0.00580.012 ± 0.0029−73%
Midtone0.050 ± 0.00300.014 ± 0.0029−73%
Shadow0.031 ± 0.00290.0089 ± 0.0035−72%
SC1Wei (top half; oxidation)Highlight0.027 ± 0.00580.010 ± 0.0046−62%
Midtone0.024 ± 0.00930.0090 ± 0.00069−62%
Shadow0.023 ± 0.00430.0087 ± 0.0012−62%
Wei (bottom half; reduction)Highlight0.028 ± 0.00280.011 ± 0.0019−62%
Midtone0.024 ± 0.00330.010 ± 0.0015−58%
Shadow0.021 ± 0.00180.0086 ± 0.0010−60%
Table 4. Average and standard deviation values for Hg(L)/Cu(K) ratios collected before and after electrocleaning treatment for all three daguerreotypes. Three different areas (highlight, midtone, and shadow) were probed. The after values have been scaled to account for the difference in total fluorescence due to the different incident energies used pre- and post-treatment. Positive shifts are likely related to relatively poorer signal to noise ratio and overall lower counts for Hg. (± = standard deviation).
DaguerreotypeCleaning ProcessRegionBefore Hg/CuAfter Hg/Cu% Difference before/after
PSC 70:112BargerHighlight0.0059 ± 0.00100.0034 ± 0.0010−43%
Midtone0.0014 ± 0.000790.0017 ± 0.00062+24%
Shadown/a0.0009 ± 0.0003n/a
RCLSC1WeiHighlight0.018 ± 0.00390.0033 ± 0.0010−82%
Midtone0.015 ± 0.00180.0027 ± 0.00090−82%
Shadow0.0076 ± 0.00130.0017 ± 0.00054−78%
SC1Wei (top half; oxidation)Highlight0.0052 ± 0.000940.0031 ± 0.00083−41%
Midtone0.0030 ± 0.000210.0024 ± 0.00036−21%
Shadow0.0019 ± 0.0000710.0020 ± 0.00013+9%
Wei (bottom half; reduction)Highlight0.0060 ± 0.00100.0035 ± 0.00074−41%
Midtone0.0027 ± 0.000510.0022 ± 0.00035−20%
Shadow0.0012 ± 0.000360.0017 ± 0.00029+50%

