Abstract
The production and manufacturing techniques of metals involve expertise, and the study of ancient artifacts relies on interdisciplinary skills. Metalworking processes used in the production of jewelry masterpieces can, for example, give indications on the provenance of an ancient object of an unknown origin and the techniques used. In this regard, metallic samples from the Chiaravalle Cross (a beautiful processional cross with a complex structure, dating to the 13th century) have been studied, combining bulk and point measurements. Neutron-based experiments (like Prompt Gamma Activation Analysis and neutron diffraction) provide the bulk of the elemental and mineralogical composition, while particle induced X-ray emission analyses evidenced important details on its manufacturing techniques.
1. Introduction
The Chiaravalle Cross is an ancient Italian processional cross [1] from Chiaravalle Abbey (close to Milan, Italy). According to tradition, it was donated to the abbey by Louis the Pious, the youngest son of Charlemagne, in the year 822 AD, however art historians in the 19th century [2] indicate it was a gift from Ottone Visconti, the bishop of Milan. However, there is a lack of any official documents about the provenance of this artifact. Over the centuries, it has been restored several times, for example in 1539, it was found again after being stolen in 1521. The St. Celso Sanctuary in Milan purchased it in 1799 to keep in the treasury of the sanctuary. Eventually, in 1985 it was entrusted in a perpetual deposit to the treasury of the Milan Cathedral.
The Cross is a jewelry masterpiece, with rich decoration. On the front part, in red jasper, there are more than 500 gems, with beautiful golden statues and a fine filigree decorating the contour. On the rear, it has embossed laminas covered by crystal rocks and more than 400 gems. Precious metals have been used in this artifact, applying several different manufacturing techniques like chiseling, engraving, gilding by laminas and amalgams. In particular, a golden filigree is present as fine decoration all over the cross. This technique has very ancient origins (from Asian regions and Egypt) and was diffused in Italy in the Etruscan period (see for example [3], and related references). Many historical and artistic issues could be derived by the artifact. The complexity of this artefact needs a multidisciplinary context, starting from restorers and archaeologists, and passing through many specialists in gold, gems as well as a team of experts in physical and chemical characterizations [4]. In the following, we focus on the scientific study of some of the metallic parts and their manufacturing techniques.
The starting point of the research was the project SOFIA (Search of Fingerprints in Archaeometallurgy: Elemental composition study of three gold filigree fragments from an ancient Italian processional cross) under the framework of the IPERION CH Horizon 2020 programme. This project addresses the essential question of deriving origin and dating metals when a straightforward criterion is not applicable, as well as taking other factors into consideration, like the constituents used in metal production during certain historical periods, as well as the knowledge of different metal making technologies. We thus studied the compositions of metal archaeological samples by major, minor and trace elements, searching for unusual fingerprints in order to obtain valuable information on provenance and dating issues. One of the main goals of the project is the characterization of the golden filigree and the secondary goal was to derive the composition of other metallic parts, namely some metallic nails used to join parts of the Cross. An essential point of this study was the categorical use of solely non-destructive analyses.
Concerning the issue of gold provenance, Hartmann [5] was able to distinguish different types of gold compositions with geographically-coherent distribution, based on several thousands of analyses of ancient gold objects. However, other authors suggested that composition of the inclusions does not normally provide a basis for characterizing the geographical provenance of gold [6]. Yet, Au, Ag and Cu distribution in gold samples can reveal the same place of origin but very different dating. Other trace elements that are likely to be present in the gold artifact could be Sb, Zr, Ir, Ni, Os, Co and Fe. The elements Fe, Co and Ni can be added or removed during the manufacturing or refining process.
Several scientific analyses can be used to detect an elemental composition at the surface of the sample, but only neutron-based techniques are able to investigate the bulk of the sample in a non-invasive way, like neutron diffraction (ND) and neutron resonance capture analysis (NRCA). Both techniques have been used in this study, along with X-ray fluorescence (XRF), particle induced X-ray emission (PIXE) and prompt gamma activation analysis (PGAA), in order to get information from both the surface and the bulk of the samples.
Several analyses of ancient gold samples based on the PIXE technique have already been published (see [5,7,8,9]). The highly complementary nature of the information provided by XRF, PIXE and PGAA spectroscopies makes their combination especially intriguing.
2. Materials and Methods
The Chiaravalle Cross is an artifact of a rather complex design, as can be seen from Figure 1a. The dimensions are 69 cm (length) × 88 cm (height). Our first analyses were performed during the Cross’ restoration [10] at Franco Blumer’s laboratory (Bergamo, Italy), within the ‘Restituzioni Project’ [11].
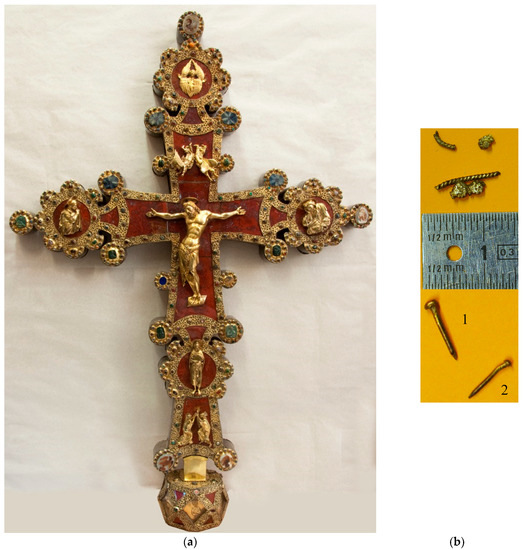
Figure 1.
A picture of the artifact and of the investigated specimens: (a) Front of the Chiaravalle cross and (b) filigrees and nails specimens (photograph credit: Franco Blumer).
The restoration process provided for the substitution of minor damaged parts and some pieces of golden filigree were made available for scientific analyses (see Figure 1b—upper section). Though very small (no more than 1 cm in length and 1 mm in thickness), they recall the full design of the filigree, with gracefully twisted threads and rosettes. Moreover, they do not show evident traces of alterations. Additionally, two nail specimens were also made available for analysis (see Figure 1b—bottom section). In the consolidation and cleaning operations, the Cross was unmounted in some parts. The nails also did not show any evident alteration (nor patinas or corrosion layers).
The Time-Of-Flight neutron diffraction (TOF-ND) experiments were run at the Italian Neutron Experimental Station (INES) of the ISIS spallation neutron source (UK); INES is equipped with a system of beam limiters in order to reduce the beam size and to select the gauge volume of interest in the sample, even in the millimetric range. The measurements were conducted in air, and the alignment was made through a laser pointer. INES is frequently addressing cultural heritage investigations [12,13,14,15]. The ND data were processed using Mantid software [16] for data normalization and correction, and then were analyzed with the Rietveld refinement technique using the GSAS (General Structure Analysis System) code [17] with the EXPGUI interface [18].
ND and NRCA measurements were simultaneously performed at INES [19]. The NRCA spectra detects resonance peaks occurring in cross sections of neutron-induced capture reactions as a function of neutron energy, and these peaks can be used to identify elements in materials [20]. In our case, NRCA gave only semiquantitative results.
Prompt Gamma Activation Analysis was made using the PGAA instrument at the Budapest Neutron Centre [21]. The samples were packed into a thin fluorinated ethylene propylene (FEP) film, mounted on an aluminum frame (Figure 2a) and placed in a fixed position of the PGAA sample holder. The small objects were irradiated for different times, ranging from 1400 s to 61,000 s. The characteristic prompt-gamma photons were detected with a High Purity Germanium (HPGe) detector surrounded by an 8-segment bismuth-germanate (BGO) scintillator to perform Compton-suppressed mode. The prompt-gamma spectra were evaluated with the application of a Hypermet PC [22]. The chemical elements were identified using our PGAA library, and the concentrations were calculated using prompt k0-method and applying the ProSpeRo software [23].
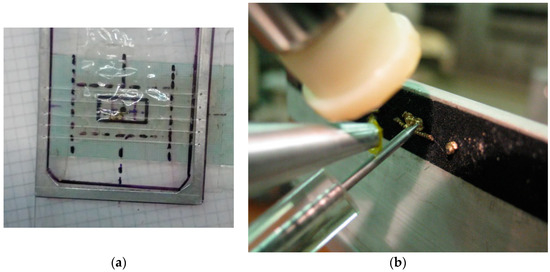
Figure 2.
Set ups of the experiments: (a) Sample holder for (prompt gamma activation analysis) PGAA analysis; (b) set up for the particle induced X-ray emission (PIXE) experiment.
In the case of a PGAA, the sensitivities and the equivalent detection limits basically depend on the neutron-absorption cross sections of a given atomic nucleus and therefore vary over a wide range for different elements. Detection limits for PGAA, can be estimated from the measured spectra using to the following equation [24]:
where 0.6022 = 10−24 × Avogadro number, σγ0 is the partial gamma ray production cross section, M is the mass number, Φ0 is the neutron beam intensity, ε is the detector efficiency and t is the acquisition time. The detection limit will give the amount a given element will produce significant identifiable peaks in the measured spectrum. Since the detectability of a given element is very often influenced by other elements that might produce overlapping peaks, they must be determined individually for every kind of sample, and for every single acquisition. The detection limits are inversely proportional to the measurement time. With increasing an acquisition time and sample amount, the detection limits can be improved.
External milli-beam PIXE spectroscopy is a widely applied method for non-destructive elemental analysis of archaeological objects [25]. On the object, selected surface spots are bombarded by energetic protons and the characteristic X-rays produced are used for quantitative elemental analysis. Due to the energy loss of the penetrating protons in the sample and absorption of the generated out-coming X-rays, the PIXE method is sensitive for the surface layer of thickness up to some-tens of micro-meter. The external milli-PIXE measurements were performed at the 5 MV Van de Graaff Accelerator of the Institute of Particle and Nuclear Physics, Wigner Research Centre of the Hungarian Academy of Sciences. The collimated proton beam of 2.5 MeV energy was extracted from the evacuated beam line to air through a 7.5 μm thick Kapton foil window. The target was positioned at a distance of 10 mm from the window where the proton beam diameter was about 1 mm. In the analyses, the external beam intensity was varied from 1 to 5 nA, depending on the actual total X-ray count rate. The analyzed samples were fixed to a computer-controlled 3D positioning stage, allowing for accurate three-dimensional positioning. The final target positioning was achieved using a mechanical ‘aiming pin pointer’. The X-ray spectra were collected by an Amptek X-123 spectrometer having an SDD type detector of a 25 mm2 × 500 μm active volume, an 8 μm thick Be window and an energy resolution of 130 eV for the Mn Kα line. The detector was positioned at 135° with respect to the beam direction, the target-detector distance was 25 mm. The net X-ray peak intensities and concentrations were calculated in off-line mode with the GUPIXv.2.1 data acquisition program package [26].
3. Results
ND and NRCA data were collected on the bigger filigree sample (due to the very small size of the other two specimens). From NRCA, the presence of gold and silver was inferred, while from the ND data just one phase was visible (see Figure 3).
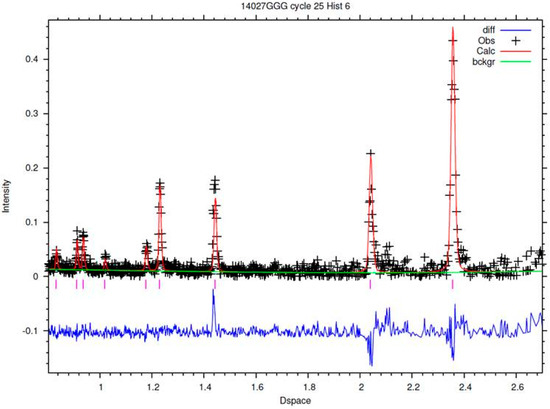
Figure 3.
Neutron diffraction (ND) spectrum and the result of fitting by a single phase (Au).
This is easily explained because gold and silver belong to the same space group, thus the diffractograms are very similar. This means that Au or Ag phases could both fit the recorded diffractogram. We could not find further relevant features, thus evidencing the presence of single phases. No other speculations could be done due to the quality of the data (related to the very small quantity of sample).
Using PGAA, we tried to determine the composition for major and minor components. Results are listed in a weight percent with absolute uncertainties (Table 1). We could indeed detect the presence of silver and gold, as well as copper and mercury. The composition obtained are similar between the twisted threads and rosette parts and confirm the composite nature of the specimen.

Table 1.
PGAA results (weight percent, with absolute uncertainties in brackets).
Furthermore, we checked the composition by PIXE measurements. A typical spectrum is displayed in Figure 4. The results obtained in all the measurements are listed in Table 2 (weight percent and absolute uncertainties).
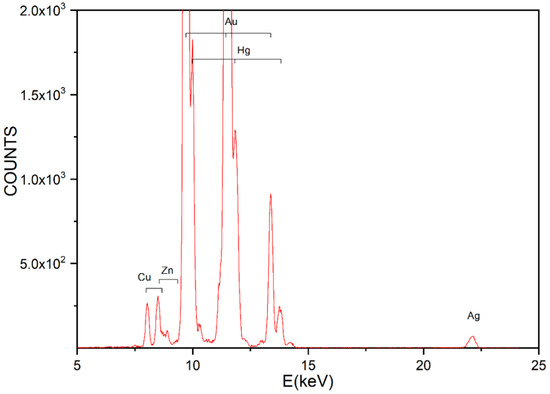
Figure 4.
The PIXE spectrum for the bigger filigree sample, focused on the rosette (data file 14,205).

Table 2.
PIXE results (weight percent, with absolute uncertainties in brackets).
The presence of silver, gold, copper and mercury was evidenced, as well as traces of iron and lead, though the content of these trace components sometimes has a large uncertainty. Measurements were carried out in different points. The presence of iron is quite certain in the twisted thread, while we looked for lead presence in order to compare our results with SEM analysis [4].
The PIXE millimetric spot enabled us to focus on different parts of the specimens. Indeed, different compositions in different points (see Table 2) were found.
Concerning the nails, the NRCA measurements revealed the presence of copper (main peak at 68.4 microseconds) and zinc (see Figure 5). The presence as minor components of Mn, Fe and Ni could be suggested for peaks at 90, 48.7 and 34.7, respectively. We could also suggest the presence of Co traces (peaks at 30.8 and 143 microseconds). Lead is not evident, nor is there relevant peaks of other elements. The quality of the spectrum is low due to the small quantity of the specimens and for this reason the samples were investigated all together, so we cannot go further into details.
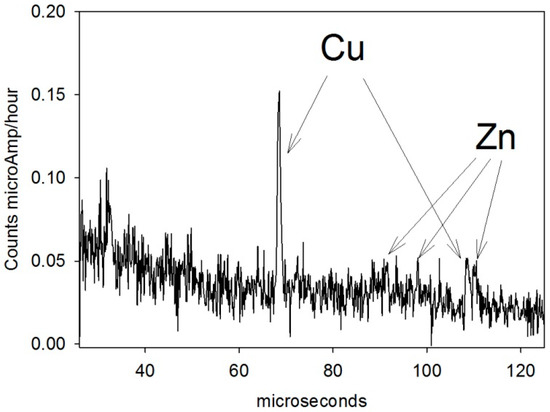
Figure 5.
Neutron resonance capture analysis (NRCA) on nails samples: Main peaks related to Cu and Zn are clearly visible.
Both PGAA and PIXE were used to analyze the two nails individually (referred to as nail 1—straight nail and nail 2—curved one, as displayed in Figure 2b). The results of the measurements are reported in Table 3, Table 4 and Table 5. As for NRCA, the main components are copper and zinc, and we could obtain the relative concentration and the Cu/Zn ratio. Moreover, by spot PIXE experiments we could focus our attention on the head of the straight nail. As can be seen, many minor components were found in the head and not in the body of the nail (see Table 4, the first three columns are for the head).

Table 3.
PGAA results on two nail samples (weight percent, with absolute uncertainties in brackets).

Table 4.
PIXE results on nail 1 (the straight one), in weight percent, with absolute uncertainties in brackets.

Table 5.
PIXE results on nail 2 (the curved one) in weight percent, with absolute uncertainties in brackets.
4. Discussion
The complementary non-destructive analytical measurements might help to understand the ‘past life’ of the historical objects.
In the case of the golden filigree, we wanted to verify the hypothesis of using the amalgam technique (mix of Au and Hg) over a silver object without metallographic or invasive methods. Moreover, we wanted to infer, from the possible presence of unusual minor/trace elements, indications on both the provenance of the metals used and the soldering technique. When interpreting the results, one has to remember that PIXE is a near-surface method, while the neutron-based ND, NRCA and PGAA are typically bulk methods. With the help of PGAA and PIXE, we proved the presence of Hg, which is an indicator of the usage of the amalgam technique. By PIXE we found a relevant difference between the surface and the inner part of the filigree twisted thread (Table 2, 4th column). A large concentration of silver and a higher concentration of copper was detected when we tried to focus in on the ‘twisted thread cut’ region. This means that the inner part of the twisted thread is silver, and the presence of 4.5% of copper should be a deliberate addition (for example for the soldering). Yet the presence of more than 2% of copper is difficult to find in natural silver [27].
We did not find any platinum group elements, nor tin, that could be related to the use of alluvial gold within our detection limits. In our case, the detection limits for the platinum group elements by PGAA were calculated from the spectrum of the twisted ‘thread’ (AY22), that was collected for 7000 s (see Table 6).

Table 6.
Estimated detection limits of the platinum group elements in the gold matrix, at the Budapest PGAA system, supposing 7000 s acquisition time. The poor detectability of Pt is due to the interfering prompt-gamma lines in the spectrum.
In PIXE spectrometry, similar to the case of PGAA, sensitivities are given by the detection limits. The GUPIX software package always gives the actual estimated detection limits for each spectrum. In Table 7 such values are listed for some elements around Pt, obtained from the PIXE spectra of a Pt coin and a filigree. The values clearly indicate that the detection limit for Pt is about twice as big in the case of the filigree compared to that of pure Pt. The main reason for this difference is the important overlap of the complex Pt and Au Lα X-ray spectra with special emphasis on the very large peak-size differences.

Table 7.
Estimated detection limits of certain relevant elements in the external milli-beam PIXE measurements given by the GUPIXv.2.1 data acquisition program package. The calculations are based on the corresponding Lα lines.
Therefore, within our sensitivity and errors, we could suggest that the gold used was not alluvial. However, the search for fingerprints related to the mine or alluvial provenance is subtle and there is still a debate about this in the literature [6,28].
Concerning the nails, we found two different compositions.
The straight nail (nail 1) was a simple brass alloy. The presence on the head of different and other minor components could be related to the manufacturing or the use of the nail itself, for example for the hammering of the nail through the silver laminas and wooden core of the Cross.
In the literature, brass-based metallic nails were studied in relationship with corrosion issues (mainly in shipwreck findings [29]). The history of brass refers to the deliberate addition of zinc to copper since the first millennium BC. However, many different compositions were used in different ages. There was also 30% of zinc added in Roman times (1st and 2nd centuries AD), then lowered in the following century [30]. Therefore, we cannot derive a strict chronological criterion to date the nail, though the low content presence of iron (up to 0.5%) and lead (less than 2%) suggests that nail 1 could have been produced in the 18th century [29]. Additionally, this nail, having a Cu/Zn ratio of 70/30, should have been produced before the use of the Muntz patent (concerning a brass metal having a Cu/Zn ratio equal to 60/40, patented in 1832 [29]).
The curved nail (nail 2) has major components of copper and zinc, but by PGAA a significant concentration of aluminum was found. We have to stress that PIXE could not detect aluminum, since a filter (Al suppressing) was used, and NRCA cannot detect Al since the TOF resonance is below the detected energy (TOF) range. Therefore, only PGAA results should be trusted for the composition of the second nail. The presence of aluminum could suggest a modern use of this nail. The restorer, Franco Blumer, did find the signature of a recent restoration, with a white paper below a golden lamina, citing “Goldsmith Agostino Figini, Milano, did restore in 1950” [4].
The different compositions of the two nails possibly indicate that the nails were manufactured in two different workshops, and probably in two different time periods. Moreover, the presence of a high zinc content suggests that raw materials were not from recycling.
5. Conclusions
The key aspect of our research was combining powerful non-destructive techniques in a deliberately interdisciplinary way.
Many data were collected, with the main goal of deriving new insights into the provenance and manufacturing technique. We could confirm the use of the amalgam technique for the gilding of the filigree over a silver twisted thread and the use of copper in the soldering.
Other metallic parts were used for the connection of the different laminas, like nails, and the different compositions give a possible indication of different manufacturing techniques and periods used.
We stress that the combination of bulk and point measurements can be very powerful. By using point measurements on the filigree, we were able to better analyze the composite structure and discriminate between inner and surface regions, while by bulk PGAA analysis we could determine the exact composition of the nail specimens.
Other processional crosses were investigated by XRF, mainly in the gilding and enamel decorations [31], though some possible discrepancies in the measurements of layer thickness by XRF were evidenced [32].
The study of a complex masterpiece like the Chiaravalle Cross has really benefited from the mutually beneficial exchange among experts in archaeometry, materials science, geology, physics, chemistry, cultural heritage and art history.
Author Contributions
D.D.M. and E.P.C. conceived the paper. A.S., D.D.M. and E.P.C. performed the ND and NRCA analysis. Z.K. and I.H. (with the participation of D.D.M. and E.P.C.) performed the PGAA experiment. I.K. and Z.S.-N. (with the presence of D.D.M. and E.P.C.) carried out the PIXE measurements. R.C. took care of the project administration, while G.G. supervised it. D.D.M. prepared a draft, improved with the help of all coauthors.
Funding
Partial financial support was received by the CNR-STFC agreement 2014–2020 (No. 3420 2014–2020) concerning collaboration in scientific research at the ISIS Spallation Neutron Source and by the Access to Research Infrastructures activity in the Horizon 2020 Programme of the EU (IPERION CH Grant Agreement n. 654028).
Acknowledgments
We thank Giulia Benati, Franco Blumer and Emanuela Daffra for the loan of the samples and for their very valuable discussions.
Conflicts of Interest
The authors declare no conflict of interest. The funders had no role in the design of the study, in the collection, analyses or interpretation of data, in the writing of the manuscript, or in the decision to publish the results.
References
- Caselli, L. La Croce di Chiaravalle Milanese e le Croci Veneziane in Cristallo di Rocca; Il Prato Edizioni: Padova, Italy, 2002; ISBN 978-8887243505. [Google Scholar]
- Fumagalli, A. Delle Antichità Longobardico-Milanesi Illustrate con Dissertazioni dei Monaci Cisterciensi di Lombardia; Nell’imperial Monistero di S. Ambrogio Maggiore: Milano, Italy, 1793; Volume IV. [Google Scholar]
- Parrini, P.; Formigli, E.; Mello, E. Etruscan granulation analysis of orientalizing jewelry from Marsiliana D’Albegna. Am. J. Archaeol. 1982, 86, 118–121. [Google Scholar] [CrossRef]
- Benati, G.; Di Martino, D. (Eds.) La Croce di Chiaravalle. Approfondimenti Storico-Scientifici in Occasione del Restauro. Atti del Convegno, Milano 2016; Booktime: Milano, Italy, 2017; ISBN 9788862182935. [Google Scholar]
- Hartmann, A. Preistoriche Goldfunde aus Europa; Mann: Berlin, Germany, 1982; Volume 2. [Google Scholar]
- Meeks, N.D.; Tite, M.S. The analysis of platinum-group element inclusions in gold antiquities. J. Archaeol. Sci. 1980, 7, 267–275. [Google Scholar] [CrossRef]
- Butalag, K.; Demortier, G.; Quarta, G.; Muscogiuri, D.; Maruccio, L.; Calcagnile, L.; Pagliara, C.; Maggiulli, G.; Mazzotta, C. Checking the homogeneity of gold artefacts of the final bronze age found in Roca Vecchia, Italy by proton induced X-ray emission. Nucl. Instrum. Methods Phys. Res. B 2005, 240, 565–569. [Google Scholar] [CrossRef]
- Mathot, S.; Demortier, G. Diffusion bonding from antiquity to present times. Nucl. Instrum. Methods Phys. Res. B 2004, 226, 222–230. [Google Scholar] [CrossRef]
- Scrivano, S.; Gómez-Tubío, B.; Ortega-Feliu, I.; Ager, F.J.; Moreno-Suárez, A.I.; Respaldiza, M.A.; De la Bandera, M.L.; Marmolejo, A. Identification of soldering and welding processes in ancient gold jewelry by micro-XRF spectroscopy. X-Ray Spectrom. 2013, 42, 251–255. [Google Scholar] [CrossRef]
- Franco Blumer “restauro metalli”: La Croce di Chiaravalle. Available online: http://www.francoblumer.it/senza-categoria/croce-di-chiaravalle-inizia-il-restauro/ (accessed on 19 January 2019).
- Restituzioni “Tesori D’arte Restaurati”. Available online: www.restituzioni.com (accessed on 19 January 2019).
- Grazzi, F.; Civita, F.; Williams, A.; Scherillo, A.; Barzagli, E.; Bartoli, L.; Edge, D.; Zoppi, M. Ancient and historic steel in Japan, India and Europe, a non-invasive comparative study using thermal neutron diffraction. Anal. Bioanal. Chem. 2011, 400, 1493–1500. [Google Scholar] [CrossRef] [PubMed]
- Cattaneo, R. Integrated X-ray and neutron-based analysis of bronze artefacts from the Ligurian settlement of Guardamonte-Monte Vallassa. J. Anal. At. Spectrom. 2011, 26, 1024–1029. [Google Scholar] [CrossRef]
- Festa, G.; Cippo, E.P.; Di Martino, D.; Cattaneo, R.; Senesi, R.; Andreani, C.; Schooneveld, E.; Kockelmann, W.; Rhodes, N.; Scherillo, A.; et al. Neutron resonance transmission imaging for 3D elemental mapping at the ISIS spallation neutron source. J. Anal. At. Spectrom. 2015, 30, 745–750. [Google Scholar] [CrossRef]
- Di Martino, D.; Bellanova, M.; Cippo, E.P.; Felicetti, R.; Scherillo, A.; Kelleher, J.; Kis, Z.; Gorini, G. A neutron diffraction and imaging study of ancient iron tie rods. J. Instrum. 2018, 13, C05009. [Google Scholar] [CrossRef]
- Arnold, O.; Bilheux, J.C.; Borreguero, J.M.; Buts, A.; Campbell, S.I.; Chapon, L.; Doucet, M.; Draper, N.; Leal, R.F.; Gigg, M.A.; et al. Mantid—data analysis and visualization package for neutron scattering and μSR experiments. Nucl. Instrum. Methods Phys. Res. Sect. A 2014, 764, 156–166. [Google Scholar] [CrossRef]
- Larson, A.C.; Von Dreele, R.B. General Structure Analysis System (GSAS); Los Alamos National Laboratory Report; LAUR: Los Alamos, NM, USA, 2004; pp. 86–748. [Google Scholar]
- Toby, B.H. EXPGUI, a graphical user interface for GSAS. J. Appl. Crystallogr. 2001, 34, 210–213. [Google Scholar] [CrossRef]
- Imberti, S.; Kockelmann, W.; Celli, M.; Grazzi, F.; Zoppi, M.; Botti, A.; Sodo, A.; Imperiale, M.L.; de Vries-Melein, M.; Visser, D.; et al. Neutron diffractometer INES for quantitative phase analysis of archaeological objects. Meas. Sci. Technol. 2008, 19, 034003. [Google Scholar] [CrossRef]
- Postma, H.; Butler, J.J.; Schillebeeckx, P.; van Eijk, C.W.E. Neutron resonance capture applied to some prehistoric bronze axes. Il Nuovo Cimento C 2007, 30, 105–112. [Google Scholar]
- Szentmiklosi, L.; Belgya, T.; Revay, Z.; Kis, Z. Upgrade of the prompt gamma activation analysis and the neutron-induced prompt gamma spectroscopy facilities at the Budapest Research Reactor. J. Radioanal. Nucl. Chem. 2010, 286, 501–505. [Google Scholar] [CrossRef]
- Révay, Z.; Belgya, T.; Molnár, G.L. Application of Hypermet-PC in PGAA. J. Radioanal. Nucl. Chem. 2005, 265, 261–265. [Google Scholar] [CrossRef]
- Révay, Z. Determining elemental composition using prompt gamma activation analysis. Anal. Chem. 2009, 81, 6851–6859. [Google Scholar] [CrossRef]
- Révay, Z.; Belgya, T. Principles of PGAA method. In Handbook of Prompt Gamma Activation Analysis with Neutron Beams; Molnár, G.L., Ed.; Kluwer Academic Publishers: Dordrecht, The Netherlands; Boston, MA, USA; New York, NY, USA, 2004; pp. 1–30. [Google Scholar]
- Rogante, M.; Kovács, I.; Rosta, L.; Stortoni, E.; Szőkefalvi-Nagy, Z. PIXE investigation of Roman metal archaeological objects from the Municipium Tifernum Mataurense area (S. Angelo in Vado, Italy). Nucl. Instrum. Methods B 2015, 363, 156–160. [Google Scholar] [CrossRef]
- Campbell, J.L.; Hopman, T.; Maxwell, J.A.; Nejedly, Z. The Guelph PIXE software package III: Alternative proton database. Nucl. Instrum. Methods B 2000, 170, 193–204. [Google Scholar] [CrossRef]
- Ogden, J. Jewellery of the Ancient World; Trefoil Books: London, UK, 1982; ISBN 0862940087. [Google Scholar]
- Guerra, M.F.; Calligaro, T. Gold traces to trace gold. J. Archaeol. Sci. 2004, 31, 1199–1208. [Google Scholar] [CrossRef]
- Cohen, M.; Ashkenazi, D.; Kahanov, Y.; Stern, A.; Klein, S.; Cvikel, D. The Brass Nails of the Akko Tower Wreck (Israel): Archaeometallurgical Analyses. Metallogr. Microstruct. Anal. 2015, 4, 188–206. [Google Scholar] [CrossRef]
- Craddock, P.T. The composition of the copper alloys used by the Greek, Etruscan and Roman civilizations. 3. The Origins and Early Use of Brass. J. Archaeol. Sci. 1978, 5, 1–16. [Google Scholar] [CrossRef]
- Ferretti, M.; Polese, C.; García, C.R. X-ray fluorescence investigation of gilded and enamelled silver: The case study of four medieval processional crosses from central Italy. Spectrochim. Acta B 2013, 83–84, 21–27. [Google Scholar] [CrossRef]
- Ager, F.J.; Ferretti, M.; Grilli, M.L.; Juanes, D.; Ortega-Feliu, I.; Respaldiza, M.A.; Roldán, C.; Scrivano, S. Reconsidering the accuracy of X-ray fluorescence and ion beam based methods when used to measure the thickness of ancient gildings. Spectrochim. Acta B 2017, 135, 42–47. [Google Scholar] [CrossRef]
© 2019 by the authors. Licensee MDPI, Basel, Switzerland. This article is an open access article distributed under the terms and conditions of the Creative Commons Attribution (CC BY) license (http://creativecommons.org/licenses/by/4.0/).