Article

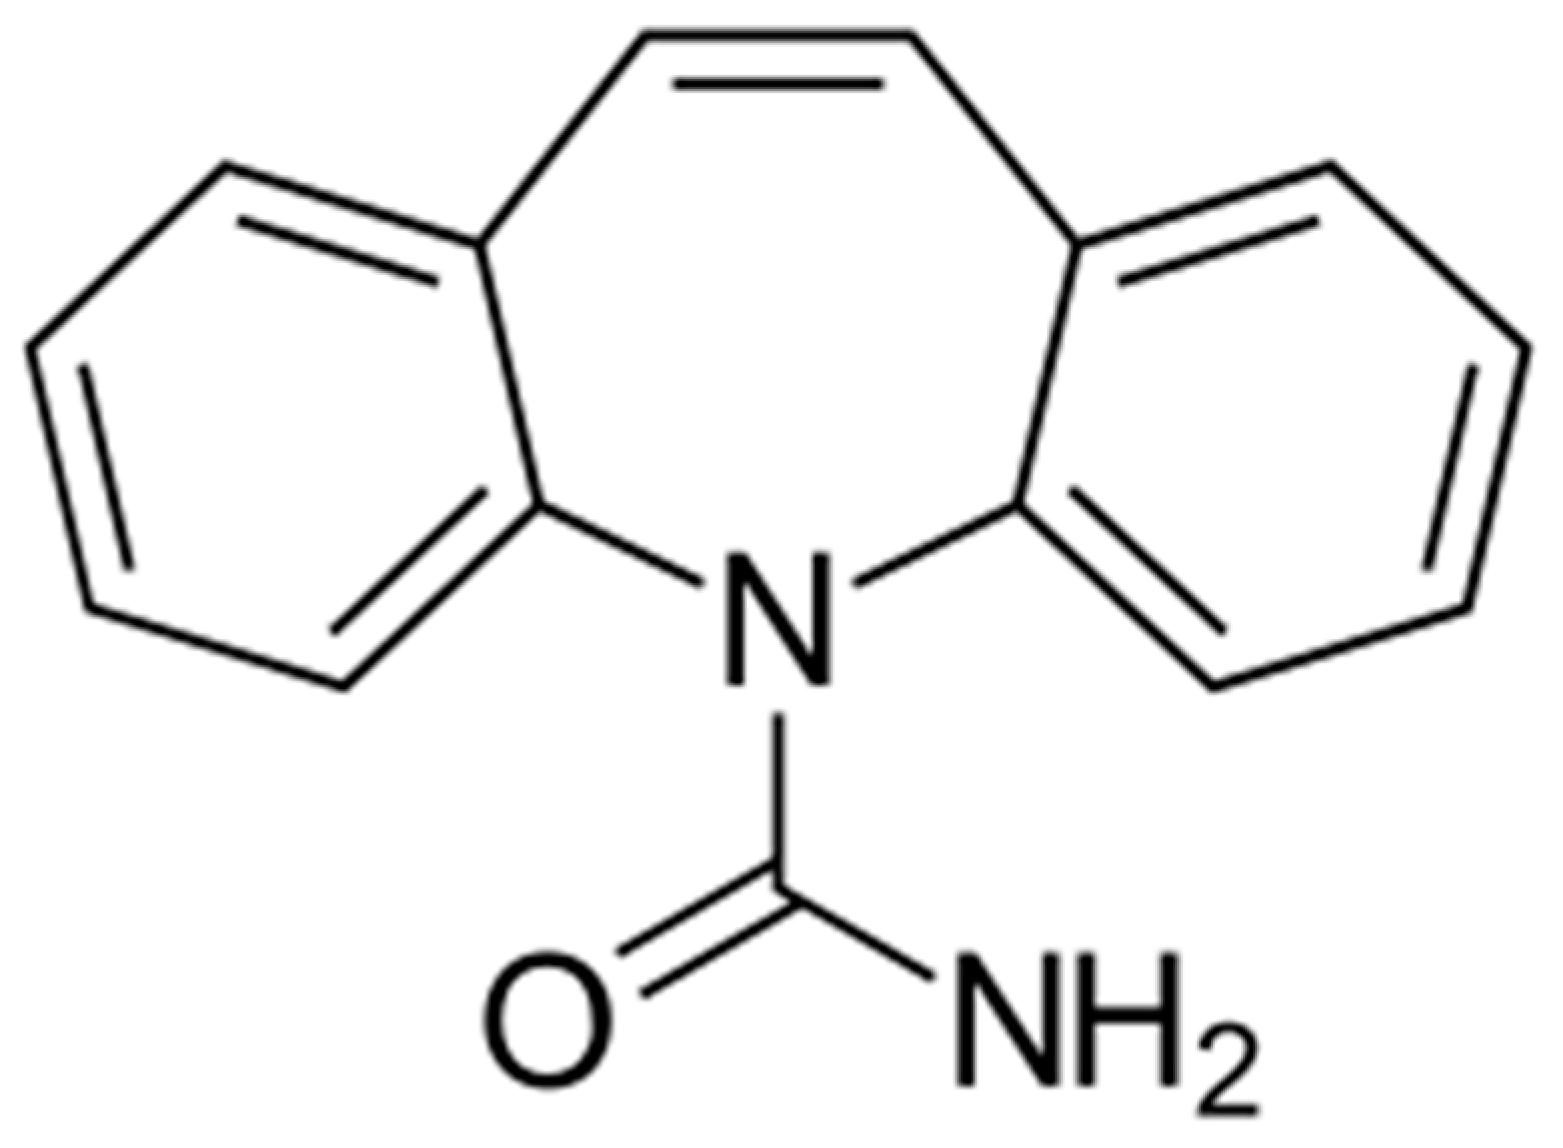
Elementary Steps in Steady State Kinetic Model Approximation for the Homo-Heterogeneous Photocatalysis of Carbamazepine

1
Environmental Sciences & Water Sciences Departments, Tel Hai College, Tel Hai 1220800, Israel
2
Environmental Physical Chemistry Laboratory, MIGAL-Galilee Research Institute, Kiryat Shmona 1101602, Israel
*
Author to whom correspondence should be addressed.
Clean Technol. 2023, 5(3), 866-880; https://doi.org/10.3390/cleantechnol5030043
Submission received: 10 April 2023 / Revised: 20 June 2023 / Accepted: 30 June 2023 / Published: 6 July 2023
(This article belongs to the Special Issue Advanced Oxidation Processes for Environmental Remediation)

Abstract

:
Elucidating physicochemical processes in the degradation of pollutants may optimize their removal from water sources. Although the photodegradation of carbamazepine (CBZ) in Advanced Oxidation Processes (AOPs) has been widely studied, there is no detailed report on the elementary steps of the kinetics. This study proposes a set of elementary steps for the AOP of CBZ, combining short-wave ultraviolet radiation (UVC), a homogeneous reagent (H2O2), and a heterogeneous catalyst (TiO2), which includes the excitation of both reagents/catalysts by UVC photons, the adsorption of CBZ by the excited TiO2, or its oxidation by hydroxyl radicals. Assuming the steady-state approximation on the intermediate products (excited TiO2, CBZ-excited TiO2 complex, and hydroxyl radicals) leads to rate laws for the degradation of CBZ, in which UVC radiation, TiO2, and H2O2 are pseudo-first-order at all concentrations or intensities and have no direct influence on CBZ pseudo-order, whereas CBZ shifts from pseudo-first-order at low concentrations to pseudo-zero-order at high concentrations. Several experiments to test the mechanism were conducted by varying CBZ, H2O2, and TiO2 concentrations and UVC radiation intensities. The measured results indeed fit the suggested mechanism for the first three, but the irradiation intensity appears to shift the CBZ influence from pseudo-second- to pseudo-first-order with increased intensities. Part of the elementary steps were changed to fit the results.

1. Introduction

Pharmaceuticals and personal care products (PPCPs) constitute a large and diverse group of organic compounds, including drugs, chemicals for medical diagnosis, sunscreens, cosmetics, soaps, and more [1], which reach the environment and water sources from hospital or factory effluents, aquaculture facilities, and animal and human excreta from sanitation systems and sewers. Additional PPCP sources include the disposal of expired drugs in landfills, poor storage of drugs in manufacturing plants, and fertilizers based on animal excreta [2].
One of the most common pollutants belonging to this group is carbamazepine (CBZ, see Figure 1), a medicine approved by the US Food and Drug Administration (FDA) as a treatment for manic depression (bipolar disorder), trigeminal neuralgia, and epilepsy [3]. Since it is only partially removed by conventional wastewater treatment processes, it was suggested as a marker of anthropogenic activity in water sources [4]. Its global consumption increased from 742 to 1214 tons per year between the years 1995 and 2015 [5] and it was reported at concentrations of up to 647 ng/L in surface water, 30 ng/L in drinking water, and up to 610 ng/L in groundwater [6]. Although no significant health hazards were found upon exposure to carbamazepine residues in drinking water, research performed on animals reports possible health damage: For example, a study on its influence on sperm production in young and adult rats reported that CBZ given before sexual development causes side effects on rat testes, resulting in more severe damage in the adult stage [7]. Another study found increased damage to the DNA of rare Chinese minnows (Gobiocypris rarus) with the increase in concentrations of CBZ, together with a significant increase in the concentration of 8-OHdG free radicals and an accelerated process of apoptosis in the liver [8].
Over the years, various methods for removing CBZ from water sources have been tested: Reverse osmosis (RO) and nano filtration (NF) membranes were found effective but result in the accumulation of CBZ in the filtered brine, requiring complementary treatment [9]. Membrane bio-reactors (MBRs) in combination with activated carbon as an adsorbent substrate [10] or the adsorption on the surface of clay minerals/organoclays [11] have also been shown to be effective; however, the polluted matrix requires additional treatment to achieve complete CBZ removal.
Several Advanced Oxidation Processes (AOPs) have been proven to be effective in the degradation and mineralization of CBZ. Such processes are based on a variety of techniques aimed at the production of oxidating agents such as hydroxyl radicals, superoxide, and other forms with a high oxidation potential that can mineralize resilient pollutants. For example, the use of ozone (O3) yielded efficient CBZ degradation, but large amounts of degradation byproducts were found [12]. The photo-Fenton reaction, which combines H2O2 and Fe2+, has been shown to be effective but only in acidic conditions (pH = 2.8–5.3), requiring additional treatment and pH adaptation [13]. Additional AOP treatments effective in CBZ degradation, including various combinations of UV radiation, H2O2, and/or heterogeneous catalysts such as TiO2 and ZnO [12], Ba-embedded g-C3N4 [14], or specifically engineered catalysts based on MnO2/Fe3O4/SiO2/ TiO2 [15,16], were described, but in most cases, exposure times were 1 h or more. In experiments conducted by our research group (Azerrad & Shahar, 2023, unpublished results), a catalyst based on Fe3O4/SiO2/TiO2/Ag exhibited efficient CBZ photo-degradation in a few minutes.
The most widespread heterogeneous photocatalyst applied in AOP processes is catalytic-grade TiO2 since it is commercially available, cheap, non-toxic, and chemically stable. Although, in some cases, results depended on the specific manufacturer [17], its catalytic efficiency has been proven in the degradation of CBZ [6,18]. A homogeneous photo-reaction using H2O2 also has been proven efficient in CBZ degradation [19]. Hetero-homogeneous photocatalysis combining TiO2 and H2O2 has been shown to be effective in the degradation of a variety of organic pollutants in water sources [20,21], including CBZ [11].
Several mechanisms were proposed for the various stages of AOP processes. The absorption of UV radiation by H2O2 breaks bonds between the oxygen atoms and hydroxyl radicals (HO•) are formed, which are known to be strong oxidizing agents [22]. Hydrogen peroxide molecules absorb radiation in the range of 185–300 nm, and the highest hydroxyl radical formation yield is achieved at wavelengths of 200–280 nm [23]. In the UV/TiO2 process, the photons absorbed by the catalyst cause excitation and an electron jump to a higher energy level, which creates a “hole” that acts as an oxidizer agent by attracting electrons. Such a combination of excited electron–hole pairs can be applied to degrade specific chemicals [24]. Several scenarios may arise: 1. The excited electron may return and fill the hole; 2. the electron–hole pair may oxidize a water molecule, resulting in the formation of a hydroxyl radical and a proton, which lowers the pH in the suspension; 3. the TiO2-excited molecule may collide with a hydroxyl ion turning it into a hydroxyl radical; and 4. the excited electron may attack an oxygen molecule and turn it into superoxide [25]. Due to the relatively broad energy gap of TiO2 (3.2–4.0 eV), such processes are limited to ultraviolet radiation [26], which is not common in solar radiation [27].
The CBZ degradation pathway was widely described and reviewed, focusing mostly on the analysis of the intermediate byproducts [28]. To further elucidate the CBZ photodegradation process, this study presents a series of elementary steps, combined with the steady-state approximation “based on the assumption that intermediates in the reaction mechanism are consumed as quickly as generated”, thus their concentration remains constant during the process [29]. Such an approach was adopted in several studies on the degradation of caffeine [30], the atmospheric degradation of N2O5 [31], or the Lindemann–Hinshelwood process [32,33], and a similar method was used recently to study the degradation of metronidazole by UV and UV/H2O2 [34]. Although “steady state approximation” is criticized in some cases for over-simplification [35,36], it still “remains a powerful tool for the simplification of reaction structures” in the elucidation of kinetic processes.
The proposed mechanism may elucidate the physicochemical processes that occur throughout the CBZ degradation process and allow the planning and implementation of specific and effective treatments for its degradation, depending on its concentration in the treated water source. A wide set of experiments was conducted, aiming to obtain circumstantial evidence of the proposed elementary steps.

2. Materials and Methods

2.1. Materials

CBZ (C15H12N2O), catalyst-grade industrial high-quality TiO2 (Hombikat®), and a 30% (9.79 M) concentrated H2O2 solution were obtained from Merck/Sigma–Aldrich (Merck KGaA, Darmstadt, Germany). All materials were used without further treatment.

2.2. Kinetic Analysis

As mentioned above, this study suggests a simplified series of elementary steps in the process of the degradation of CBZ when irradiated with UVC light in the presence of a combination of a homogeneous reactant (H2O2) and a heterogeneous catalyst (TiO2). The complete process can be described as
CBZ + UVC + TiO2 + H2O2TiO2 + Various degradation products
and can be separated into the following elementary steps:
Step 1 (rate constant k1)—TiO2 (denoted as T for the sake of brevity) may undergo excitation after absorbing photons (denoted as UVC) at the appropriate wavelength yielding an excited titanium dioxide particle (denoted as T*)
T + U V C T
which may release its energy and relax by undergoing internal conversion, yielding unexcited TiO2 (rate constant k−1)
T T
Step 2 (rate constant k2)—there are several oxidating species that may form from H2O2 irradiation by UVC (superoxide, singlet oxygen, etc.). In most studies, the focus on the hydroxyl radical (HO) is usually adopted since it is considered the most effective oxidative species [37]. The formation of the hydroxyl radicals can be described as:
H 2 O 2 + U V C 2 H O
which may also occur in the opposite direction to obtain H2O2 (rate constant K−2).
H O 1 2 H 2 O 2
Although it is obvious that for the formation of a hydrogen peroxide molecule, two hydroxyl radicals are required, the notation in Equation (5) was adopted to keep the hydroxyl radicals as first order based on a “collisions mechanism”.
Step 3 (rate constant k3)—the pollutant (CBZ, denoted as Z for the sake of brevity) may be adsorbed on the surface of the excited heterogeneous catalysts, yielding an excited complex (denoted as ZT*)
T + Z Z T
Step 4 (rate constant k4)—the excited complex may relax via internal conversion to obtain a non-excited complex, which “separates” the catalyst and the pollutant.
Z T Z T Z + T
Step 5 (rate constant k5)—the excited TiO2-CBZ complex may degrade the pollutant to a product (denoted as P1), releasing the catalyst particle:
Z T P 1 + T
On the other hand, there is another set of elementary steps performed by the homogeneous catalyst:
Step 6 (rate constant k6)—Step 2 forms hydroxyl radicals, which may oxidize the pollutant to obtain another degradation product (denoted P2)
H O + Z P 2
The whole set of elementary steps includes three intermediate products: Excited TiO2 (T*), the excited TiO2-CBZ complex (ZT*), and hydroxyl radicals (HO). Assuming all the elementary steps occur according to a collision mechanism that states that the rate of a reaction is directly proportional to the concentration of the reactants (and accordingly, the order of each component is equal to its stoichiometric coefficient), and assuming that the intermediate products are in a steady state (thus, their concentrations do not change), we can denote the rate of change of the intermediate products with time:
d [ T ] d t = k 1 T U V C k 1 T k 3 T Z = 0
d [ Z T ] d t = k 3 T Z k 4 Z T k 5 Z T = 0
d [ H O ] d t = 2 k 2 H 2 O 2 U V C k 2 H O k 6 H O Z = 0
and isolating the concentration of the excited TiO2 (T*), the excited complex (ZT*), and the hydroxyl radicals (HO) yields:
[ T ] = k 1 T [ U V C ] k 1 + k 3 [ Z ]
Z T = k 3 T [ Z ] k 4 + k 5
[ H O ] = 2 k 2 H 2 O 2 [ U V C ] k 2 + k 6 [ Z ]
By introducing 11a into 11b, the concentration of the excited complex in a steady state becomes
Z T = k 3 [ Z ] k 4 + k 5 k 1 T [ U V C ] k 1 + k 3 [ Z ]
At this stage, the rate of formation of the CBZ degradation products may be evaluated. The rate of formation of products degraded by the heterogeneous catalyst (TiO2) is:
d [ P 1 ] d t = k 5 Z T = k 5 k 3 [ Z ] k 4 + k 5 k 1 T [ U V C ] k 1 + k 3 [ Z ] = K k 1 T [ U V C ] k 1 + k 3 [ Z ] [ Z ]
where we defined, for the sake of simplicity, K = k 5 k 3 k 4 + k 5 .
The rate of formation of the products degraded by the hydroxyl radicals can be described by
d [ P 2 ] d t = k 6 H O Z = k 6 2 k 2 H 2 O 2 [ U V C ] k 2 + k 6 [ Z ] Z
From Equation (12), it can be deduced that CBZ (Z) degradation by heterogeneous photocatalysis is pseudo-first-order on TiO2 (T) and UVC radiation, whereas Equation (13) indicates that CBZ degradation by the homogeneous process is from pseudo-first-order on H2O2 and UVC radiation. However, the influence of CBZ is more complex: For example, in Equation (12) if k3[Z] << k−1, the process will be pseudo-first order on CBZ. On the other hand, with large CBZ amounts, if k3[Z] >> k−1, the concentration of CBZ in the nominator and denominator will be canceled, and the process will become pseudo-zero-order, meaning CBZ degradation at those conditions does not depend on its concentration. A similar effect can be observed in Equation (13): Low concentrations of CBZ leading to k6[Z] << k−2 will lead to a pseudo-first-order process on CBZ, while large concentrations (k6[Z] >> k−2) will yield a pseudo-zero-order on CBZ. Between those two extreme values, the CBZ pseudo-order will depend on its concentration in the specific process but range between zero and one. In both Equations (12) and (13), no direct influence of either TiO2, H2O2, or UVC radiation on the CBZ pseudo-order is noticed.

2.3. Description of the Experiments

Experiments were performed as follows: 100 mL CBZ solutions were introduced to a suitable quartz beaker (refractive Index n = 1.5048), which does not absorb radiation at wavelengths in the UV-visible range (100–800 nm). The beaker was inserted into a Rayonet RMR-600 mini photochemical chamber reactor (Southern New England Ultraviolet Company, Branford, CT, USA) with an optical path length of 5.3 cm. The chamber was equipped with eight RMR 2537A lamps (254 nm wavelength), with each lamp emitting approximately 8 W of energy according to the manufacturer, with an irradiance flux of 1.9 mW cm−2 at 254 nm, as measured in previous studies [30] at the center of the chamber. The solution was constantly mixed with an external impeller driven by an overhead stirrer motor (VELP Scientifica, Usmate Velate, Italy) rotating at 100 rpm. Measurements started immediately after preparing the sample and turning the lamps on, using a Black Comet SR spectrometer (StellarNet Inc., Tampa, FL, USA) with a dip 20 mm probe (DP400-UVVis-SR) with Deuterium and Halogen bulbs. which together emit light in the entire UV-Vis spectrum. CBZ amounts were determined by the absorbance (OD = optical density) at 286 nm, with a diagonal reference baseline at the borders of the absorption band. Fluctuations at low CBZ concentrations (<0.1 mg L−1) are due to limitations of the measurement setup. Preliminary studies [11] indicate that the UV-Vis CBZ spectrum does not change in a broad range of pHs (1.5–12.0), and CBZ does not degrade without UV light [11,14].
To find circumstantial evidence for the proposed elementary steps, 16 experiments were conducted, divided into four different sets, where each set included changes in the concentration of one of the participants, while the other participants in the process remained at a fixed concentration. In the first set, the CBZ concentration ranges from 1–20 mg L−1 (4.23–84.6 µM), in the second set, the TiO2 concentration ranges from 0.02–0.5 mg L−1, in the third set, the H2O2 concentration ranges from 0.5–5 mg L−1 (14.7–147 µM), and in the fourth set, the radiation intensity ranges from 901–3605 W m−2 (2–8 UVC lamps). In all cases, the results were analyzed for the influence of CBZ concentration on the kinetics—thus, the pseudo-order of CBZ.
Analysis of the data was performed following the procedure extensively reported in previous studies [38] (the main equations are presented in Appendix A). Measurements were recorded for approximately 30 min at 0.5 min intervals. From the large amount of data (approximately 60 data points) in each experiment, a “bootstrap” [39,40] procedure was performed by choosing 5 sets of 10 values for each experiment. Calculations of the best-fit pseudo-order (n), the half-life, and the rate constant (k) were performed by minimizing the overall root mean square error (RMSE), defined as the “square root of the mean of the squared differences between corresponding elements of the forecasts and observations” [41]. Kinetic parameters were also calculated by fixing the pseudo-order to zero, one, and two. Comparing the measured results to the calculated values for the fixed pseudo-orders delivers an indication of the fit to the proposed mechanism.

3. Results and Discussion

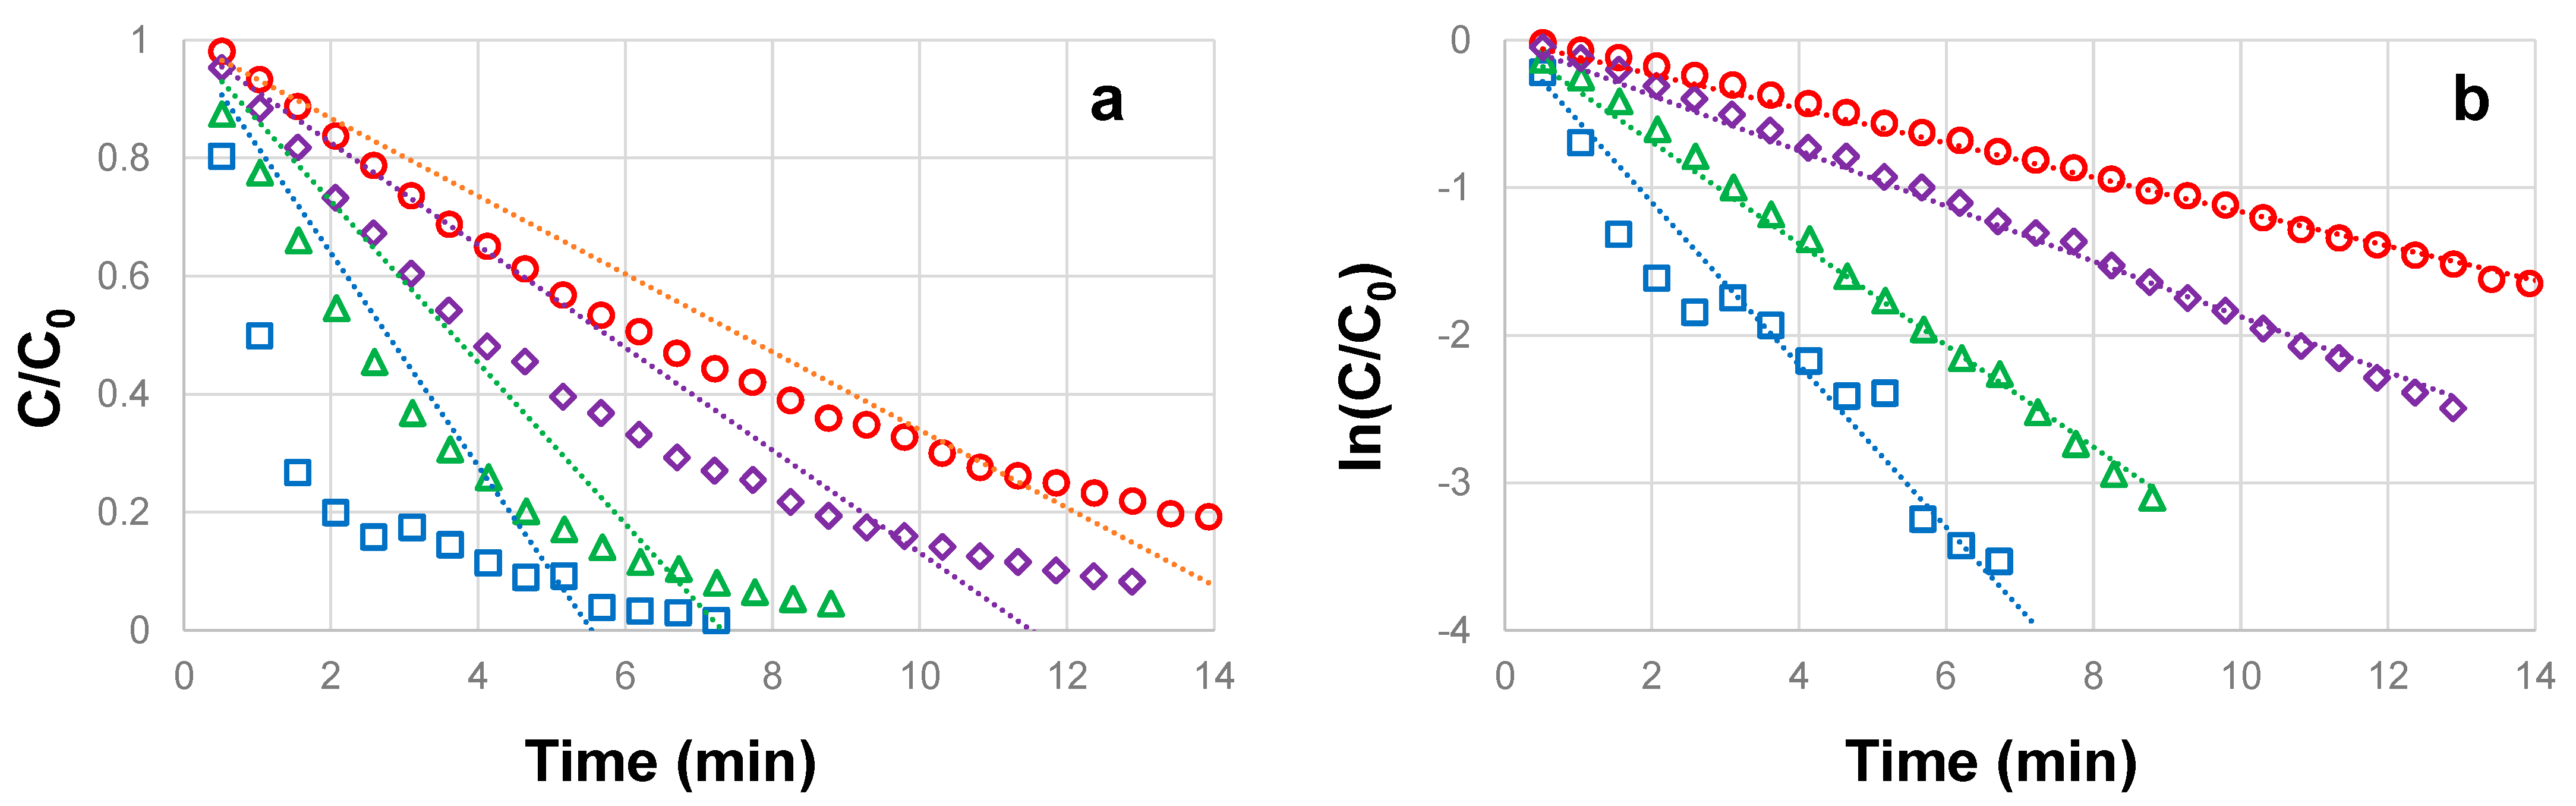
3.1. Influence of CBZ Concentration on the Photocatalytic Degradation

CBZ degradation at concentrations ranging between 1 and 20 mg L−1 (4.23–84.64 µM), with 5 mg L−1 (147 µM) H2O2, 0.5 mg L−1 TiO2, and UVC at a radiation intensity of 3605 W m−2 are shown in Figure 2. The purpose of the experiments is to determine if the behavior is similar to that described in the mechanism in Section 2, in which it appears that a low pollutant concentration may behave according to pseudo-first-order, whereas high CBZ concentrations will exhibit behavior approaching pseudo-zero-order on CBZ. Figure 2a shows the CBZ concentration related to its initial value (C/C0).
A good fit to a linear representation of (C/C0) as a function of time
C / C 0 = 1 k t
will indicate the fit to a zero-order process, whereas a good fit to a linear presentation of the natural logarithm of (C/C0) as a function of time (as shown in Figure 2b)
ln [ C / C 0 ] = k t
will indicate the fit to a first-order process. In both cases, the slope (k) will represent the kinetic coefficient [42,43]. Table 1 summarizes the half-life times, root mean square errors, (RMSE), and coefficient of determination (R2) assuming a zero- or first-pseudo-order process and also includes the optimal pseudo-order value as evaluated empirically by minimizing the RMSE [38]. It is interesting to notice that R2 for the first-order process at high CBZ concentrations is higher than for the optimized process; however, lower RMSE should be preferred to determine the fit to a model, considering R2 “does not measure how one variable explains another” [44].
As can be expected, an increase in the pollutant concentration for the same catalytic conditions yields higher half-life times, indicating slower degradation. For all CBZ concentrations, there is a very good fit between measurements and the pseudo-first-order model, whereas pseudo-zero does not fit at all at low concentrations but exhibits a reasonable fit at higher initial CBZ amounts (15 and 20 mg L−1). It should be emphasized that even at the highest CBZ concentration, the process fits the pseudo-first-order better than the pseudo-zero-order, but the optimal pseudo-order (see Table 1) decreases from 1.11 to 0.61 with the increase in the CBZ concentration. Thus, results show a trend that corresponds to the scenario described in the mechanism, in which low CBZ concentrations will influence kinetics directly (first pseudo-order), whereas larger CBZ concentrations will not (zero pseudo-order). To further confirm the effect, additional experiments at even larger CBZ concentrations might be required.

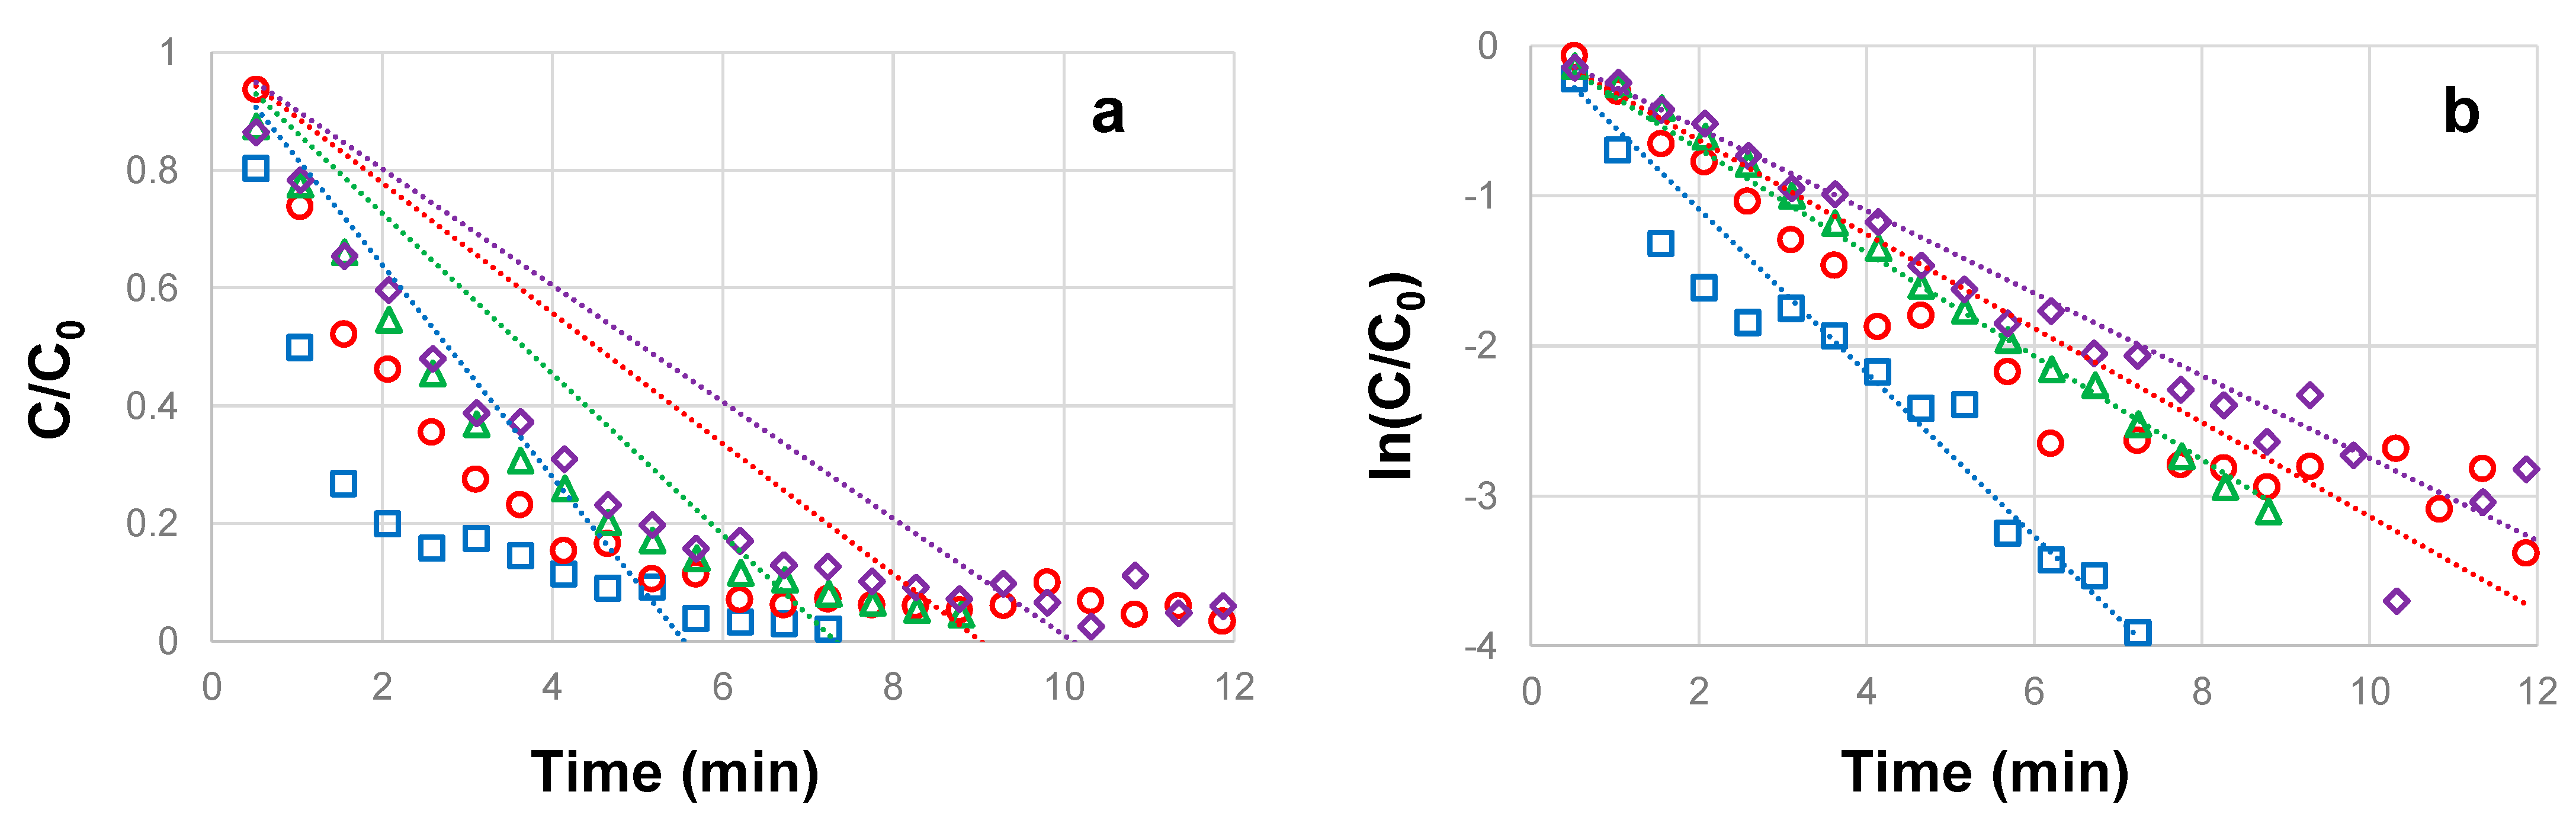
3.2. Influence of H2O2 Concentration on the Photocatalytic Degradation of CBZ

CBZ degradation at 1 mg L−1 (4.23 µM) was tested with hydrogen peroxide concentrations ranging from 0.5–5 mg L−1 (14.7–147 µM), combined with 0.5 mg L−1 TiO2 and UVC at a radiation intensity of 3605 W m−2. This set of experiments intended to determine whether the concentration of H2O2 as a homogeneous catalyst has an influence on the pseudo-order of a 1mg L−1 degradation of CBZ.
According to the relationships between the linearity of graphs and the integrated rate laws [43], Figure 3a shows that in all H2O2 concentrations, CBZ degradation does not fit zero-pseudo-order kinetics. The conclusion is confirmed by the relatively large RMSE (>0.19) and low R2 (<0.83) values shown in Table 2. On the other hand, a considerably better fit is observed for the first-pseudo-order model (Figure 3b, Table 2) with relatively low RMSE (<0.090) and larger R2 (>0.9). Confirmation of this can be observed in the optimized CBZ pseudo-orders in Table 2: For all four cases, values range between 0.93 and 1.11, thus close to first-pseudo-order kinetics, which approximately fits the results obtained in Table 1 and Figure 2 for a 1mg L−1 CBZ concentration. Considering the kinetic model presented hereby predicts that H2O2 at all levels will not have an influence on the pseudo-order of CBZ, the results show a trend that corresponds to the scenario described in the mechanism.
Another conclusion from the experiment is that although increasing H2O2 concentrations by one order of magnitude reduces the half-life duration (from approximately 2.5 to 1 min), the influence is not very significant in the measurements, as seen in Figure 3a. Experiments at larger CBZ concentrations might be required to strengthen the model hypothesis.

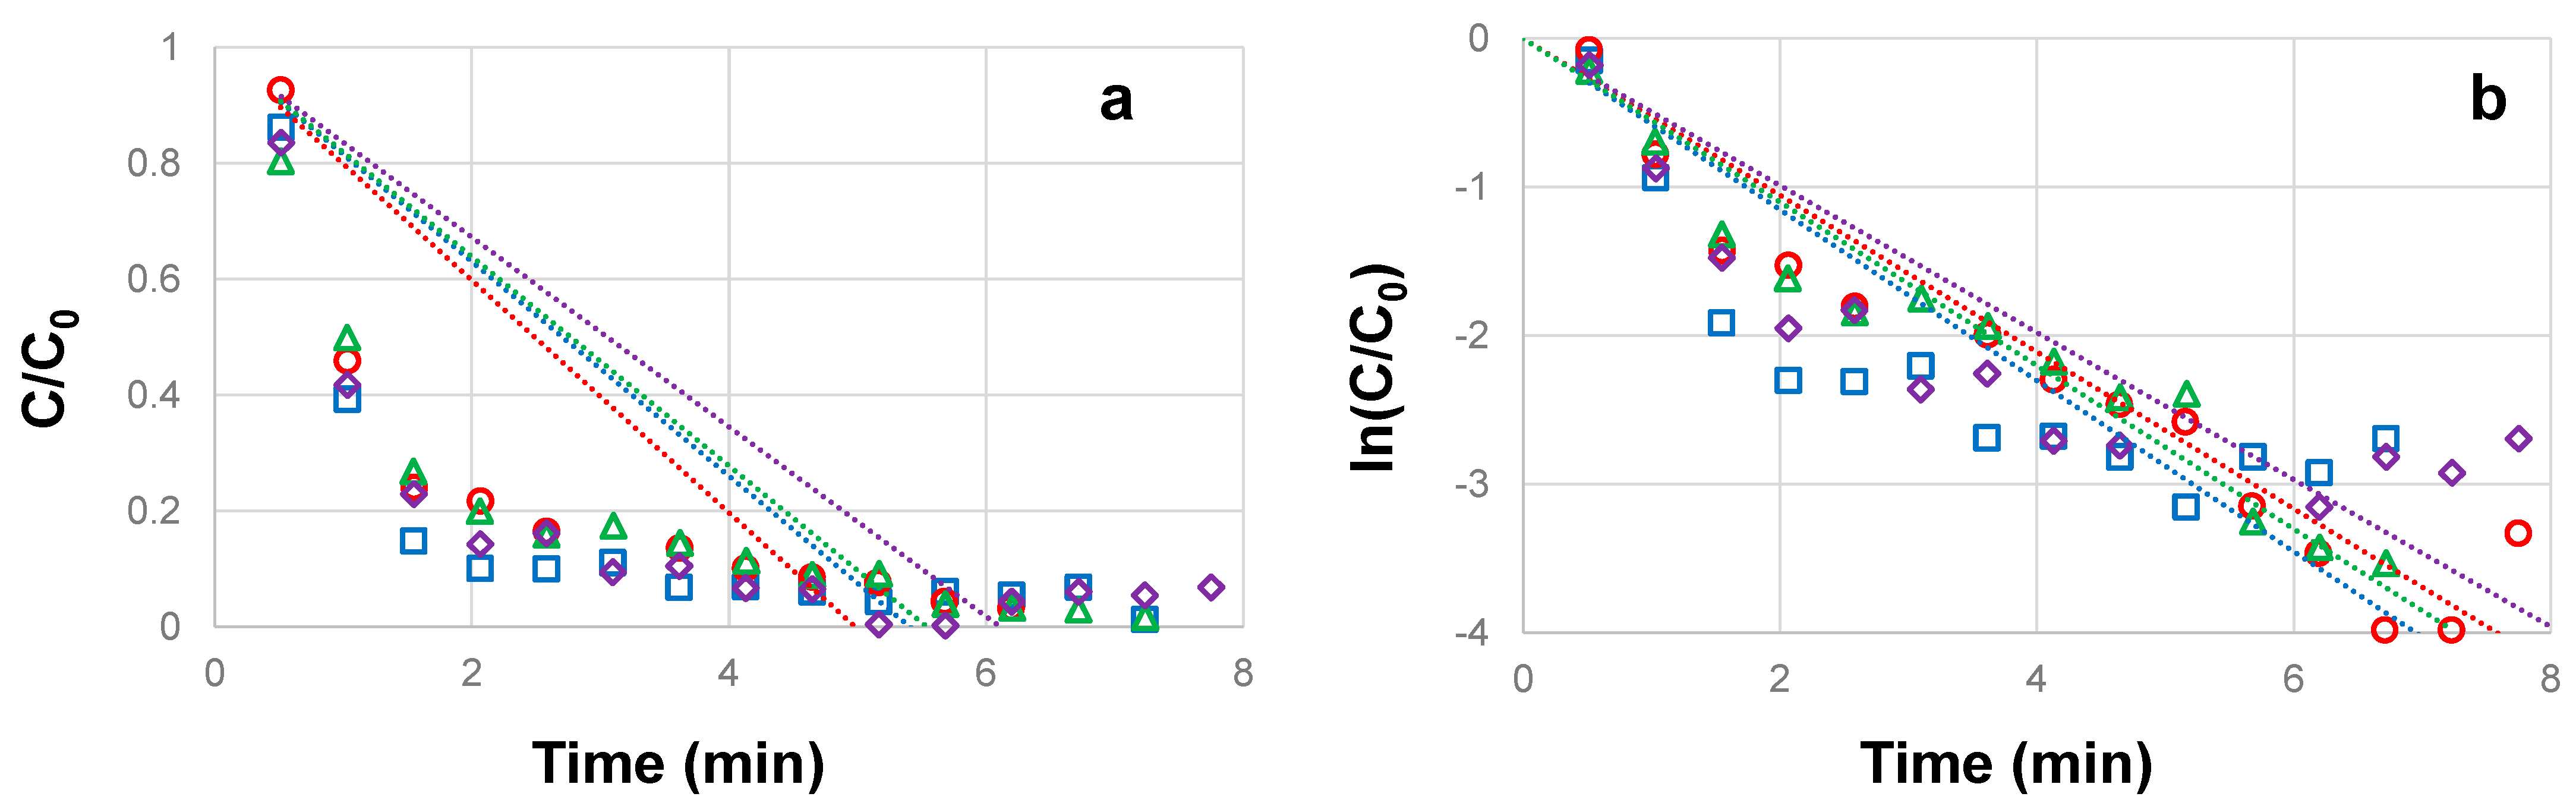
3.3. Influence of TiO2 Concentration on the Photocatalytic Degradation of CBZ

CBZ degradation at a concentration of 1 mg L−1 (4.23 µM) was tested with TiO2 concentrations ranging from 0.02–0.5 mg L−1, combined with H2O2 concentration of 5 mg L−1 (147 µM) and UVC at a radiation intensity of 3605 W m−2. This set of experiments intended to determine whether the concentration of TiO2 as a heterogeneous catalyst has an influence on the pseudo-order of a 1 mg L−1 degradation of CBZ.
Figure 4a shows that all the TiO2 tested in the experiments do not fit zero-pseudo-order kinetics on CBZ, whereas Figure 4b indicates a better fit to a first-pseudo-order process, although far from being as good as in the CBZ experiment. Such a statement is reinforced by the results in Table 3, which present relatively large RMSE (>0.26) and low R2 (<0.7) values for zero-pseudo-order, with a considerably better (although far from being optimal) fit for first-pseudo-order kinetics (RMSE < 0.096, R2 > 0.889) and optimized pseudo-orders between 0.81 and 1.11. Considering the kinetic model and the results of the first experiment predict that CBZ degradation at 1mg L−1 will be of first-pseudo-order kinetics regardless of the TiO2 concentration, the results tend to present a trend that corresponds to the scenario described in the mechanism. However, it should be noted from Figure 4a that all heterogeneous catalyst concentrations yield very similar results; thus, there is no significant influence on the process, and all concentrations yield a half-life time of approximately 1 min. We assume that this can be ascribed to the relatively large influence that the homogeneous reactant has at the concentration tested (5 mg L−1 of H2O2). Thus, even though no direct influence of the H2O2 concentration on the CBZ pseudo-order is observed, experiments at lower H2O2 concentrations might be required to strengthen the model hypothesis on the influence of TiO2.

3.4. Influence of UVC Irradiation Intensity on the Photocatalytic Degradation of CBZ

CBZ degradation at a concentration of 1mg L−1 (4.23 µM) was tested with a hydrogen peroxide concentration of 5 mg L−1 (147 µM), combined with 0.5 mg L−1 TiO2 and UVC at radiation intensities ranging from 901–3605 W m−2 (2–8 lamps). This set of experiments was intended to determine whether the UVC intensity has an influence on the pseudo-order of a 1mg L−1 degradation of CBZ.
According to the relationships between the linearity of graphs and the integrated rate laws [43], Figure 5a shows that irradiation intensities do not fit zero CBZ pseudo-order kinetics, as confirmed by values in Table 4 (RMSE > 0.200 and R2 < 0.75). A considerably better fit is observed for the first-pseudo-order model (Figure 5b, Table 4, RMSE < 0.100 and R2 > 0.938). However, the evaluation of optimized pseudo-orders (Table 4) indicates that at large irradiation intensities (six and eight lamps), the process is indeed close to first-pseudo-order, but at lower intensities (four lamps), the CBZ pseudo-order increases to 1.4, and at two lamps, it further increases to close to second-pseudo-order. Such behavior is confirmed by Figure 5c, which shows the reciprocal of C/C0. Such representation yields linear behavior for second-order processes according to
1 [ C / C 0 ] = C 0 / C = k t + 1
Such behavior does not fit the model presented in Section 2, which predicts that the irradiation intensity will not have an influence on the CBZ pseudo-order at any intensity. Thus, we consider in the following subsection an improved mechanism that fits the results at low intensities to a second-pseudo-order process on CBZ, shifting to a first-pseudo-order at high irradiation intensities [42,43].

3.5. Corrected Kinetic Analysis

To adapt to the results in the previous section, which indicate that CBZ degradation at low irradiation intensities is a second-pseudo-order process, we suggest the following changes to the mechanism presented in Section 2.2.
We assume that step 2 (related to the formation of the hydroxyl radical) also requires collision with a CBZ molecule (denoted as Z), with a rate constant k2:
H 2 O 2 + U V C + Z 2 H O
whereas step 6, related to the formation of a product from the hydroxyl radical, requires interaction with an additional photon (rate constant k6)
H O + Z + U V C P 2
Accordingly, Equation (10c), which focuses on the rate of change of the intermediate hydroxyl radical (HO) at a steady state, will change to:
d [ H O ] d t = 2 k 2 H 2 O 2 U V C [ Z ] k 2 H O k 6 H O Z [ U V C ] = 0
Leading to changes in the isolated term for ( H O ) (Equation (11c)):
[ H O ] = 2 k 2 H 2 O 2 U V C [ Z ] k 2 + k 6 Z [ U V C ]
changing the rate of the formation of the product P2 (Equation (13) based on the elementary step established in Equation (9*):
d [ P 2 ] d t = k 6 H O Z [ U V C ] = k 6 2 k 2 H 2 O 2 [ U V C ] 2 k 2 + k 6 Z [ U V C ] [ Z ] 2
At relatively low irradiation rates and CBZ concentrations (k6 [Z][UVC] << k−2), the process presented in Equation (13*) will indeed behave according to the measured results
d P 2 d t k 6 2 k 2 H 2 O 2 [ U V C ] 2 k 2 [ Z ] 2
Thus, it is pseudo-second-order on CBZ concentration (and pseudo-second-order on UVC intensity). On the other hand, at relatively high irradiation intensities, when k6 [Z][UVC] >> k−2, Equation (13*) becomes:
d P 2 d t k 6 2 k 2 H 2 O 2 [ U V C ] 2 k 6 Z U V C Z 2 = k 6 2 k 2 H 2 O 2 [ U V C ] k 6 Z = 2 k 2 H 2 O 2 [ U V C ] Z
which is obviously pseudo-first-order on CBZ and irradiation intensity. Thus, the corrected mechanism based on the requirement of pollutant collision for the formation of the radical and an additional photon to interact with the radical and the pollutant fits the results presented in Section 3.4.

4. Conclusions

This study presents a set of elementary steps aiming to elucidate the heterogeneous-homogeneous photocatalysis of carbamazepine based on the formation of three intermediate products. According to the proposed mechanism, in a steady state, the different components should be influenced as follows:
  • Carbamazepine should be pseudo-first-order or pseudo-zero-order at low or at high concentrations, respectively.
  • The homogeneous catalysts (H2O2) should be pseudo-first-order at all concentrations, without influencing CBZ pseudo-order.
  • The heterogeneous catalysts (TiO2) should be pseudo-first-order at all concentrations, without influencing CBZ pseudo-order.
  • The UVC irradiation intensity should be pseudo-first-order at all concentrations, without influencing CBZ pseudo-order.
A set of experiments performed to test these outcomes show that points [1,2,3] appear to behave according to the proposed model. As for point 4, slight changes in the model were introduced to meet the measured results that indicated that UVC irradiation induces a pseudo-second or pseudo-first CBZ order at low or high intensities, respectively.
Although it is obvious that the presented mechanism is an oversimplification of the process, the model delivers a first approximation approach, which might be useful to design more efficient AOP devices. For example, since high pollutants’ pseudo-order processes are less effective in achieving complete removal at low pollutant concentrations [38], in the case of CBZ degradation, this study indicates that low irradiation intensities should not be used to avoid pseudo-second-order processes.

Author Contributions

Conceptualization, G.R. and Y.S.; methodology, G.R. and Y.S.; software, Y.S.; validation, G.R. and Y.S.; formal analysis, Y.S. and G.R.; investigation, G.R. and Y.S.; resources, G.R. and Y.S.; data curation, G.R. and Y.S.; writing—original draft preparation, Y.S.; writing—review and editing, G.R. and Y.S.; visualization, G.R.; supervision, G.R.; project administration, G.R.; funding acquisition, G.R. All authors have read and agreed to the published version of the manuscript.

Funding

This research was partially funded by CSO-MOH (Israel) in the frame of the collaborative international consortium (REWA) financed under the 2020 AquaticPollutants Joint call of the AquaticPollutants ERA-NET Cofund (GA Nº 869178). Additional funds were received from Israel Innovation Authority Grant #75367, in cooperation with Mekorot (Israeli Water Company).

Informed Consent Statement

Not applicable.

Data Availability Statement

All raw data are available from the authors.

Acknowledgments

The authors would like to thank the European Commission and AKA (Finland), CSO-MOH (Israel), IFD (Denmark), and WRC (South Africa) for funding in the frame of the collaborative international consortium (REWA) financed under the 2020 AquaticPollutants Joint call of the AquaticPollutants ERA-NET Cofund (GA Nº 869178). This ERA-NET is an integral part of the activities developed by the Water, Oceans and AMR JPIs. The authors are also thankful to Barak Chen for his help in performing part of the experiments. We are thankful to Yotam Gonen for finding our errors and mistakes by meticulously reviewing the mechanism proposed, allowing us to improve the manuscript.

Conflicts of Interest

The authors declare no conflict of interest.

Appendix A. Pseudo-Order of a Process

This appendix presents the core equations on which the procedure to find the kinetic parameters of the process is based [38].
The change in the concentration of reactant A when all other reactants are in non-limited amounts, and/or kept constant, can be described by a simplified rate law [45]:
υ = d A d t = k a A n a
where υ is the reaction rate, ka is the apparent rate coefficient, and na is the apparent or “pseudo” reaction order [33,46], where the term “apparent” or “pseudo” is used to emphasize that all other parameters were kept constant [47]. The integration of Equation (A1) (as long as na ≠ 1) yields:
A t = 1 1 A 0 n a 1 + n a 1 k a t 1 n a 1
whereas for pseudo-first-order (na = 1):
d A A = k a d t A t = A 0 e k a t
To compare between different processes, the reaction “half-life time” (t1/2) can be calculated by solving Equations (A2) and (A2*) for the case where [A](t) = 0.5, yielding:
for   n a 1 :   t 1 2 = 2 n a 1 1 n a 1 k a A 0 n a 1
for   n a = 1 :   t 1 2 , n = 1 = l n ( 2 ) k a
As can be seen from Equation (A3), the half-life time (except for na = 1) strongly depends on the initial concentration. Thus, when comparing processes, this should be taken into consideration.

References

  1. Liu, J.L.; Wong, M.H. Pharmaceuticals and personal care products (PPCPs): A review on environmental contamination in China. Environ. Int. 2013, 59, 208–224. [Google Scholar] [CrossRef] [PubMed]
  2. Yang, Y.; Ok, Y.S.; Kim, K.H.; Kwon, E.E.; Tsang, Y.F. Occurrences and removal of pharmaceuticals and personal care products (PPCPs) in drinking water and water/sewage treatment plants: A review. Sci. Total Environ. 2017, 596–597, 303–320. [Google Scholar] [CrossRef] [PubMed]
  3. Alrashood, S.T. Carbamazepine. Profiles Drug Subst. Excipients Relat. Methodol. 2016, 41, 133–321. [Google Scholar]
  4. Clara, M.; Strenn, B.; Kreuzinger, N. Carbamazepine as a possible anthropogenic marker in the aquatic environment: Investigations on the behaviour of Carbamazepine in wastewater treatment and during groundwater infiltration. Water Res. 2004, 38, 947–954. [Google Scholar] [CrossRef]
  5. Oldenkamp, R.; Beusen, A.H.W.; Huijbregts, M.A.J. Aquatic risks from human pharmaceuticals—Modelling temporal trends of carbamazepine and ciprofloxacin at the global scale. Environ. Res. Lett. 2019, 14, 034003. [Google Scholar] [CrossRef]
  6. Im, J.-K.; Son, H.-S.; Kang, Y.-M.; Zoh, K.-D. Carbamazepine Degradation by Photolysis and Titanium Dioxide Photocatalysis. Water Environ. Res. 2012, 84, 554–561. [Google Scholar] [CrossRef] [PubMed]
  7. De Oliva, S.U.; Miraglia, S.M. Carbamazepine damage to rat spermatogenesis in different sexual developmental phases. Int. J. Androl. 2009, 32, 563–574. [Google Scholar] [CrossRef] [PubMed]
  8. Yan, S.; Chen, R.; Wang, M.; Zha, J. Carbamazepine at environmentally relevant concentrations caused DNA damage and apoptosis in the liver of Chinese rare minnows (Gobiocypris rarus) by the Ras/Raf/ERK/p53 signaling pathway. Environ. Pollut. 2021, 270, 116245. [Google Scholar] [CrossRef]
  9. Radjenović, J.; Petrović, M.; Ventura, F.; Barceló, D. Rejection of pharmaceuticals in nanofiltration and reverse osmosis membrane drinking water treatment. Water Res. 2008, 42, 3601–3610. [Google Scholar] [CrossRef]
  10. Serrano, D.; Suárez, S.; Lema, J.M.; Omil, F. Removal of persistent pharmaceutical micropollutants from sewage by addition of PAC in a sequential membrane bioreactor. Water Res. 2011, 45, 5323–5333. [Google Scholar] [CrossRef]
  11. Levakov, I.; Shahar, Y.; Rytwo, G. Carbamazepine Removal by Clay-Based Materials Using Adsorption and Photodegradation. Water 2022, 14, 2047. [Google Scholar] [CrossRef]
  12. Alharbi, S.K.; Price, W.E. Degradation and Fate of Pharmaceutically Active Contaminants by Advanced Oxidation Processes. Curr. Pollut. Rep. 2017, 3, 268–280. [Google Scholar] [CrossRef]
  13. Clarizia, L.; Russo, D.; Di Somma, I.; Marotta, R.; Andreozzi, R. Homogeneous photo-Fenton processes at near neutral pH: A review. Appl. Catal. B Environ. 2017, 209, 358–371. [Google Scholar] [CrossRef]
  14. Liang, J.; Zhang, W.; Zhao, Z.; Liu, W.; Ye, J.; Tong, M.; Li, Y. Different degradation mechanisms of carbamazepine and diclofenac by single-atom Barium embedded g-C3N4: The role of photosensitation-like mechanism. J. Hazard. Mater. 2021, 416, 125936. [Google Scholar] [CrossRef] [PubMed]
  15. Zielińska-Jurek, A.; Bielan, Z.; Dudziak, S.; Wolak, I.; Sobczak, Z.; Klimczuk, T.; Nowaczyk, G.; Hupka, J. Design and application of magnetic photocatalysts for water treatment. The effect of particle charge on surface functionality. Catalysts 2017, 7, 360. [Google Scholar] [CrossRef] [Green Version]
  16. Pan, F.; Ji, H.; Du, P.; Huang, T.; Wang, C.; Liu, W. Insights into catalytic activation of peroxymonosulfate for carbamazepine degradation by MnO2 nanoparticles in-situ anchored titanate nanotubes: Mechanism, ecotoxicity and DFT study. J. Hazard. Mater. 2021, 402, 123779. [Google Scholar] [CrossRef] [PubMed]
  17. Alonso-Tellez, A.; Masson, R.; Robert, D.; Keller, N.; Keller, V. Comparison of Hombikat UV100 and P25 TiO2 performance in gas-phase photocatalytic oxidation reactions. J. Photochem. Photobiol. A Chem. 2012, 250, 58–65. [Google Scholar] [CrossRef]
  18. Carabin, A.; Drogui, P.; Robert, D. Photo-degradation of carbamazepine using TiO2 suspended photocatalysts. J. Taiwan Inst. Chem. Eng. 2015, 54, 109–117. [Google Scholar] [CrossRef]
  19. Vogna, D.; Marotta, R.; Andreozzi, R.; Napolitano, A.; d’Ischia, M. Kinetic and chemical assessment of the UV/H2O2 treatment of antiepileptic drug carbamazepine. Chemosphere 2004, 54, 497–505. [Google Scholar] [CrossRef]
  20. Lee, H.J.; Kang, D.W.; Chi, J.; Lee, D.H. Degradation kinetics of recalcitrant organic compounds in a decontamination process with UV/H2O2 and UV/H2O2/TiO2 processes. Korean J. Chem. Eng. 2003, 20, 503–508. [Google Scholar] [CrossRef]
  21. Yegane Badi, M.; Vosoughi, M.; Sadeghi, H.; Mokhtari, S.A.; Mehralipour, J. Ultrasonic-assisted H2O2/TiO2 process in catechol degradation: Kinetic, synergistic and optimisation via response surface methodology. Int. J. Environ. Anal. Chem. 2022, 102, 757–770. [Google Scholar] [CrossRef]
  22. Wols, B.A.; Hofman-Caris, C.H.M. Review of photochemical reaction constants of organic micropollutants required for UV advanced oxidation processes in water. Water Res. 2012, 46, 2815–2827. [Google Scholar] [CrossRef]
  23. Lopez, A.; Bozzi, A.; Mascolo, G.; Kiwi, J. Kinetic investigation on UV and UV/H2O2 degradations of pharmaceutical intermediates in aqueous solution. J. Photochem. Photobiol. A Chem. 2003, 156, 121–126. [Google Scholar] [CrossRef]
  24. Carp, O.; Huisman, C.L.; Reller, A. Photoinduced reactivity of titanium dioxide. Prog. Solid State Chem. 2004, 32, 33–177. [Google Scholar] [CrossRef]
  25. Deng, Y.; Zhao, R. Advanced Oxidation Processes (AOPs) in Wastewater Treatment. Curr. Pollut. Reports 2015, 1, 167–176. [Google Scholar] [CrossRef] [Green Version]
  26. Ge, L. Novel visible-light-driven Pt/BiVO4 photocatalyst for efficient degradation of methyl orange. J. Mol. Catal. A Chem. 2008, 282, 62–66. [Google Scholar] [CrossRef]
  27. Zhou, X.-T.; Ji, H.-B.; Huang, X.-J. Photocatalytic Degradation of Methyl Orange over Metalloporphyrins Supported on TiO2 Degussa P25. Molecules 2012, 17, 1149–1158. [Google Scholar]
  28. Li, Y.; Yang, Y.; Lei, J.; Liu, W.; Tong, M.; Liang, J. The degradation pathways of carbamazepine in advanced oxidation process: A mini review coupled with DFT calculation. Sci. Total Environ. 2021, 779, 146498. [Google Scholar] [CrossRef]
  29. Chieh, C. Steady-State Approximation—Chemistry LibreTexts. Available online: https://chem.libretexts.org/Textbook_Maps/Physical_and_Theoretical_Chemistry_Textbook_Maps/Supplemental_Modules_(Physical_and_Theoretical_Chemistry)/Kinetics/Reaction_Mechanisms/Steady-State_Approximation (accessed on 16 March 2023).
  30. Rendel, P.M.; Rytwo, G. Degradation kinetics of caffeine in water by UV/H2O2 and UV/TiO2. Desalin. Water Treat. 2020, 173, 231–242. [Google Scholar] [CrossRef]
  31. Brown, S.S. Applicability of the steady state approximation to the interpretation of atmospheric observations of NO3 and N2O5. J. Geophys. Res. 2003, 108, D17. [Google Scholar] [CrossRef]
  32. Cole, S.L.; Wilder, J.W. Gas Phase Decomposition by the Lindemann Mechanism. SIAM J. Appl. Math. 1998, 51, 1489–1497. [Google Scholar] [CrossRef]
  33. Atkins, P.; de Paula, J. Physical Chemistry; W.H. Freemand and Co.: New York, NY, USA, 2006; Volume 8, ISBN 0-7167-8759-8. [Google Scholar]
  34. Su, R.; Dai, X.; Wang, H.; Wang, Z.; Li, Z.; Chen, Y.; Luo, Y.; Ouyang, D. Metronidazole Degradation by UV and UV/H2O2 Advanced Oxidation Processes: Kinetics, Mechanisms, and Effects of Natural Water Matrices. Int. J. Environ. Res. Public Health 2022, 19, 12354. [Google Scholar] [CrossRef] [PubMed]
  35. Flach, E.H.; Schnell, S. Use and abuse of the quasi-steady-state approximation. Syst. Biol. (Stevenage) 2006, 153, 187–191. [Google Scholar] [CrossRef] [PubMed] [Green Version]
  36. Turányi, T.; Tomlin, A.S.; Pilling, M.J. On the error of the quasi-steady-state approximation. J. Phys. Chem. 1993, 97, 163–172. [Google Scholar] [CrossRef]
  37. Wang, L.; Li, B.; Dionysiou, D.D.; Chen, B.; Yang, J.; Li, J. Overlooked Formation of H2O2 during the Hydroxyl Radical-Scavenging Process When Using Alcohols as Scavengers. Environ. Sci. Technol. 2022, 56, 3386–3396. [Google Scholar] [CrossRef]
  38. Rytwo, G.; Zelkind, A.L. Evaluation of Kinetic Pseudo-Order in the Photocatalytic Degradation of Ofloxacin. Catalysts 2022, 12, 24. [Google Scholar] [CrossRef]
  39. Efron, B. Bootstrap Methods: Another Look at the Jackknife. Ann. Stat. 1979, 7, 1–26. [Google Scholar] [CrossRef]
  40. Mishra, D.K.; Dolan, K.D.; Yang, L. Bootstrap confidence intervals for the kinetic parameters of degradation of anthocyanins in grape pomace. J. Food Process Eng. 2011, 34, 1220–1233. [Google Scholar] [CrossRef]
  41. Barnston, A.G. Correspondence among the Correlation, RMSE, and Heidke Forecast Verification Measures; Refinement of the Heidke Score. Weather Forecast. 1992, 7, 699–709. [Google Scholar] [CrossRef]
  42. Rytwo, G.; Klein, T.; Margalit, S.; Mor, O.; Naftali, A.; Daskal, G. A continuous-flow device for photocatalytic degradation and full mineralization of priority pollutants in water. Desalin. Water Treat. 2016, 57, 16424–16434. [Google Scholar] [CrossRef]
  43. Larsen, D. 5.7: Using Graphs to Determine Integrated Rate Laws—Chemistry LibreTexts. Available online: https://chem.libretexts.org/Bookshelves/Physical_and_Theoretical_Chemistry_Textbook_Maps/Supplemental_Modules_(Physical_and_Theoretical_Chemistry)/Kinetics/05:_Experimental_Methods/5.07:_Using_Graphs_to_Determine_Integrated_Rate_Laws (accessed on 6 April 2023).
  44. Ford, C. Is R-squared Useless?|University of Virginia Library Research Data Services + Sciences. Available online: https://data.library.virginia.edu/is-r-squared-useless/ (accessed on 6 April 2023).
  45. Rendel, P.M.; Rytwo, G. The Effect of Electrolytes on the Photodegradation Kinetics of Caffeine. Catalysts 2020, 10, 644. [Google Scholar] [CrossRef]
  46. White, D.P. Chapter 14- Chemical Kinetics. Available online: My.ilstu.edu/~ccmclau/che141/materials/outlines/chapter14.ppt (accessed on 6 April 2023).
  47. UPAC. Compendium of Chemical Terminology, 2nd ed.; McNaught, A.D., Wilkinson, A., Eds.; (the “Gold Book”); Blackwell Scientific Publications: Oxford, UK, 1997; ISBN 0-9678550-9-8. Available online: https://goldbook.iupac.org/ (accessed on 20 February 2023).
Figure 1. Schematic structure of carbamazepine.
Cleantechnol 05 00043 g001
Figure 2. Degradation of 1 (squares), 5 (triangles), 15 (rhombus), and 20 (circles) mg L−1 CBZ with 0.5 mg L−1 TiO2, 5 mg L−1 of H2O2, and 8 UVC lamps. Panel (a) and panel (b) show the concentration related to its initial value (C/C0) and its natural logarithm, respectively. Lines indicate linear regression for each set.
Cleantechnol 05 00043 g002
Figure 3. Degradation of 1 mg L−1 CBZ with 0.5 mg L−1 TiO2, 8 UVC lamps and 0.5 (rhombus), 1 (circles), 2 (triangles), or 5 mg L−1 (squares) of H2O2. Panel (a) and panel (b) show the concentration related to its initial value (C/C0) and its natural logarithm, respectively. Lines indicate linear regression for each set.
Cleantechnol 05 00043 g003
Figure 4. Degradation of 1 mg L−1 CBZ with 5 mg L−1 H2O2, 8 UVC lamps, and 0.02 (squares), 0.05 (rhombus), 0.2 (circles), or 0.5 mg L−1 (triangles) of TiO2. Panel (a) and panel (b) show the concentration related to its initial value (C/C0) and its natural logarithm, respectively. Lines indicate linear regression for each set.
Cleantechnol 05 00043 g004
Figure 5. Degradation of 1 mg L−1 CBZ with 5 mg L−1 H2O2, 0.5 mg L−1 TiO2, and 2 (squares), 4 (circles), 6 (triangles), or 8 (rhombus) UVC lamps. Panels (ac) show the concentration related to its initial value (C/C0), its natural logarithm (ln(C/C0)), and its reciprocity (C0/C), respectively. Lines indicate linear regression for each set.
Cleantechnol 05 00043 g005
Table 1. CBZ Pseudo-orders, half-life times, root mean square errors (RMSE), and coefficient of determination (R2) for experiments with several CBZ concentrations, 0.5 mg L−1 TiO2, 5 mg L−1 (147 µM) of H2O2, and a UVC radiation intensity of 3605 W m−2 (corresponding to 8 UVC bulbs).
CBZ Concentration
(mg L−1)
CBZ
Pseudo-Order
na
Half Life
t1/2
(min)
RMSER2
102.77 ± 17.8%0.3460.683
505.09 ± 4.26%0.3280.765
1506.05 ± 7.41%0.1420.925
2007.37 ± 4.68%0.0460.977
111.08 ± 12.02%0.0770.921
512.22 ± 3.64%0.0370.995
1513.96 ± 1.31%0.0350.999
2016.27 ± 1.31%0.0280.999
11.11 ± 4.90%0.95 ± 6.05%0.0720.955
50.83 ± 2.04%2.33 ± 1.10%0.0300.996
150.76 ± 3.25%4.18 ± 1.28%0.0210.998
200.61 ± 8.71%6.55 ± 1.15%0.0180.998
Table 2. CBZ pseudo-orders, half-life times, root mean square errors (RMSE), and coefficient of determination (R2) for degradation of 1 mg L−1 CBZ with 0.5 mg L−1 TiO2, UVC radiation intensity of 3605 W m−2 (corresponding to 8 UVC bulbs), and H2O2 ranging between 0.5 and 5 mg L−1 (14.7–147 µM).
H2O2 Concentration
(mg L−1)
CBZ
Pseudo-Order
na
Half Life
t1/2
(min)
RMSER2
0.504.99 ± 6.44%0.1940.823
104.29 ± 10.4%0.2480.707
202.98 ± 5.32%0.2490.618
502.77 ± 17.8%0.3460.683
0.512.44 ± 1.33%0.0280.991
111.82 ± 3.33%0.0480.980
211.31 ± 7.37%0.0870.905
511.08 ± 12.02%0.0770.921
0.50.95 ± 2.57%2.48 ± 2.48%0.0270.992
10.93 ± 4.49%1.86 ± 1.37%0.0470.979
21.05 ± 6.78%1.25 ± 6.28%0.0860.902
51.11 ± 4.90%0.95 ± 6.05%0.0720.955
Table 3. CBZ pseudo-orders, half-life times, root mean square errors (RMSE), and coefficient of determination (R2) for degradation of 1 mg L−1 CBZ with 5 mg L−1 (147 µM) H2O2, UVC radiation intensity of 3605 W m−2 (corresponding to 8 UVC bulbs), and TiO2 ranging between 0.02 and 0.5 mg L−1.
TiO2 Concentration
(mg L−1)
CBZ
Pseudo-Order
na
Half Life
t1/2
(min)
RMSER2
0.0202.19 ± 16.3%0.3020.518
0.0502.47 ± 7.39%0.2930.578
0.202.84 ± 13.84%0.2620.663
0.502.77 ± 17.8%0.3460.683
0.0210.83 ± 5.29%0.0960.889
0.0510.90 ± 4.48%0.0730.933
0.211.06 ± 4.55%0.0860.902
0.511.08 ± 12.02%0.0770.921
0.020.81 ± 15.6%0.88 ± 4.22%0.0930.890
0.050.88 ± 11.8%0.91 ± 5.70%0.0700.936
0.21.07 ± 8.56%1.02 ± 7.34%0.0850.907
0.51.11 ± 4.90%0.95 ± 6.05%0.0720.955
Table 4. CBZ pseudo-orders, half-life times, root mean square errors (RMSE), and coefficient of determination (R2) for degradation of 1 mg L−1 CBZ with 5 mg L−1 (147 µM) H2O2, 0.5 mg L−1 TiO2, and UVC irradiation intensity ranging between 901 and 3605 W m−2 (corresponding to 2–8 UVC lamps).
UVC Irradiation
Intensity
(W m−2)
CBZ
Pseudo-Order
na
Half Life
t1/2
(min)
RMSER2
901 (2 lamps)09.68 ± 2.52%0.2020.747
1803 (4 lamps)05.12 ± 3.36%0.2540.689
2704 (6 lamps)03.42 ± 3.95%0.2860.684
3605 (8 lamps)02.77 ± 17.8%0.3460.671
901 (2 lamps)15.02 ± 5.63%0.0960.938
1803 (4 lamps)11.78 ± 6.06%0.0680.947
2704 (6 lamps)11.18 ± 4.03%0.0510.966
3605 (8 lamps)10.98 ± 17.8%0.0830.968
901 (2 lamps)23.43 ± 1.22%0.0440.985
1803 (4 lamps)21.25 ± 5.26%0.0750.979
2704 (6 lamps)20.89 ± 5.83%0.0980.982
3605 (8 lamps)20.71 ± 1.82%0.1030.980
901 (2 lamps)1.92 ± 3.41%3.46 ± 4.97%0.0410.955
1803 (4 lamps)1.41 ± 2.65%1.50 ± 3.53%0.0570.950
2704 (6 lamps)1.03 ± 2.86%1.16 ± 2.93%0.0500.967
3605 (8 lamps)1.11 ± 4.90%0.95 ± 6.05%0.0720.955
Disclaimer/Publisher’s Note: The statements, opinions and data contained in all publications are solely those of the individual author(s) and contributor(s) and not of MDPI and/or the editor(s). MDPI and/or the editor(s) disclaim responsibility for any injury to people or property resulting from any ideas, methods, instructions or products referred to in the content.

