Article

Free-Range Chickens Reared Within an Olive Grove Influenced the Soil Microbial Community and Carbon Sequestration

1
National Research Council of Italy, Institute for Agriculture and Forestry Systems in the Mediterranean (ISAFOM-CNR), 06128 Perugia, Italy
2
Department for Innovation in Biological, Agro-Food and Forest Systems, University of Tuscia, 01100 Viterbo, Italy
3
Department of Agricultural, Food and Environmental Sciences, University of Perugia, 06121 Perugia, Italy
4
Research Institute on Terrestrial Ecosystem (IRET-CNR), 50019 Sesto Fiorentino, Italy
*
Author to whom correspondence should be addressed.
Soil Syst. 2025, 9(3), 69; https://doi.org/10.3390/soilsystems9030069
Submission received: 16 May 2025 / Revised: 25 June 2025 / Accepted: 1 July 2025 / Published: 3 July 2025

Abstract

Although the benefits of rational grazing by polygastric animals are well known, little is understood about how chicken grazing affects soil biological health and its capacity to store organic matter. This study aimed to assess the impact of long-term free-range chicken grazing in an olive grove on the soil chemical and biochemical properties, including the total organic carbon (TOC), total nitrogen (TN), microbial biomass (Cmic), basal respiration, and microbial community structure, as well as the soil’s capability to stock organic carbon and total nitrogen. A field experiment was conducted in an olive grove grazed by chickens for over 20 years, with the animal load decreasing with distance from the poultry houses. At 20 m, where the chicken density was highest, the soils showed reduced OC and TN contents and a decline in fungal biomass. This was mainly due to the loss of both aboveground vegetation and root biomass from intensive grazing. At 50 m, where grazing pressure was lower, the soil OC, TN, and microbial community size and activity were similar to those in a control, ungrazed area. These findings suggest that high chicken density can negatively affect soil health, while moderate grazing allows for the recovery of vegetation and soil organic matter. Rational management of free-range chicken grazing, particularly through the control of chicken density or managing grazing time and frequency, is therefore recommended to preserve soil functions and fertility.

1. Introduction

It is commonly known that rearing chickens (Gallus gallus domesticus) in free-range (FR) and organic systems improves the health and welfare of the animals and the nutritional characteristics of the products. In particular, kinetic activity enhances bone strength and reduces body lesions (footpad dermatitis and sternal lesions) [1]. Simultaneously, foraging behaviour increases the intake of bioactive compounds, which improves the welfare status of birds and the quality of meat by providing tocols, carotenoids, and n-3 PUFA [2,3].
In view of the “one health” perspective, in addition to animal welfare and meat quality, the environmental impact should also be evaluated. The body of literature agrees that because the environmental impact of poultry is mainly due to the production of feed ingredients (e.g., corn, soy), FR chickens have a high global warming potential (GWP) per kg of meat [4]. This is due to the increased need to support the higher energy demands of their immune system, kinetic activity, and thermoregulation, as well as due to the land used for pasture. Part of this GWP can be mitigated through agroforestry practices, which integrate multiple types of production within a single land area (e.g., olive oil, chicken meat) [5,6,7], or by modifying the diet using low-input ingredients [8].
However, this complex environmental evaluation also involves the effects of grazing on the soil’s ability to act as a sink or source of atmospheric carbon. Indeed, grazing duration and intensity can modify the structure and the organic carbon (OC) storage potential of the soil [9,10,11]. A meta-analysis of 83 studies on extensive grazing showed that, across all climatic zones and grazing intensities, grazing below the system’s carrying capacity results in a decrease in soil organic carbon (SOC) storage. However, the impact of grazing on SOC is climate-dependent [10]. In turn, soil OC has a great influence on ecosystem services, such as nutrient retention, water storage, and pollutant mitigation, and its reduction could lead to the loss of soil fertility and environmental degradation.
Alongside the physical and chemical properties of soil, through animal trampling and manure deposition, grazing can affect the soil microbial community [12]. In particular, it has been reported that animal trampling may compact soil, changing the aeration, redox conditions, water-holding capacity, and water potential [13], which in turn affect the size and activity of the soil microbial community. In addition, manure deposition from small animals may affect the soil pH [6] and C and N cycling [14,15], influencing the soil microbial community and plant-symbiotic microbes, such as arbuscular mycorrhizal fungi [16]. Grazing herbivores can also indirectly affect the soil microbial community by altering plant productivity and community composition [17,18]. Indeed, the removal of aboveground vegetation due to grazing can increase root exudates, such as enzymes, organic substances, and polysaccharides [19,20]. Although the impacts of livestock grazing on soil organic carbon (SOC) dynamics attracted much attention [10,21], there is still no consensus on how SOC varies after livestock grazing due to the different climatic conditions, grassland types, animals, and grazing strategies [22,23].
The present research aims to evaluate the impact of different loads of free-range chickens reared in an olive grove for more than 20 years (about 70 rearing cycles) on the chemical and microbiological properties of the soil and its ability to accumulate organic carbon and total nitrogen. To achieve this objective, within a single olive grove with grass-covered soil and where the soil, climatic conditions, and agronomic practices were homogeneous, we modulated different loads of free-range chickens according to the fact that as the distance from the animal house increased, the number of grazing animals decreased. Specifically, the main objectives of the work were as follows: (i) to assess the impact of chicken load on the soil chemical (TOC, TN, pH) and microbiological properties (Cmic, basal respiration, ester-linked fatty acid methyl ester—El-FAME) in the upper horizons (Ap1 and Ap2); (ii) to quantify the C and N stocks of soil and grass root biomass; (iii) to clarify the relationship between SOC stock and plant biomass under grazing conditions. We hypothesized that (1) the density of grazing chickens would affect the soil properties, and (2) high chicken loads, despite the input of animal faeces, would reduce the aboveground and belowground grass biomass and, thereby, SOC storage.

2. Materials and Methods

2.1. Site Description

The study site was an olive (Olea europaea L., 1753) grove of about 110 ha, located in the municipality of Viterbo (Central Italy), at about 320 m a.s.l. The climate of the area is continental; the mean annual air temperature is 14.5 °C, with January as the coldest month (6.3 °C) and August as the warmest one (24.4 °C). The mean annual precipitation is 750 mm, concentrated during the cold seasons, with summer drought. The soil was developed from pyroclastic materials and is classified according to WRB classification as Cambic Phaeozems [23].
The olive grove, made of plants of the cv Frantoio, was planted in 1960, with a density of 278 plants ha−1 and a distance between and along the rows of 6 m. The soil under the olive grove was left to the spontaneous colonization of herbaceous species (Phleum sp., Avena fatua, Hordeum spp., Dactylis glomerata, Sanguisorba minor, Santolina sp., Linaria sp., Agropyron sp., Picris hieracioides, Calamintha nepeta, Reichardia picroides, Rubus sp., Daucus carota, Chondrilla juncea, Cichorium intybus, Centaurea sp., Campanula rapunculus, Convolvulus sp., Portulaca oleracea, Plantago lanceolata, Petrorhagia prolifera, Trifolium spp.). The olive trees are pruned yearly, and all the pruning is chopped and spread on the soil. Because of the organic nature of the farm, no chemical treatments are carried out, and only Cu spraying [copper oxychloride, Cu2(OH)3Cl] is allowed for the control of fungal diseases.

2.2. Management of Chickens

Free-range chicken farming in the olive grove under study began in 2003. Within the olive grove, nineteen chicken houses (with dimensions of 50 × 12 m) were installed with a distance of approx. 200 m between them. Each chicken house hosted about 3500 animals per cycle, and the chickens chosen for rearing under the olive trees were of the meat-type (Naked Neck) breed. The rearing cycle is schematically shown in Figure 1. Initially, during the first 4 weeks of age, the chicks remain enclosed in the houses under a controlled temperature. After this period, the popholes are left open, and the chickens have free access to the outdoors until 12 weeks of age (slaughter age). Successively, before a new cycle begins, there is a sanitary break of about 3 weeks (all-in-all-out procedure). At the time of sampling (March 2023), the poultry/olive tree system had been managed similarly for the last 20 years, corresponding to about 70 rearing cycles.

2.3. Evaluation of Animal Density and Feed Consumption

During the outdoor period, the chickens generally stayed close to the house, and almost none of them moved further than 70–80 m from the poultry house. At 60 days of age, we evaluated the number of chickens outside three poultry houses by installing 4 cameras at 20 m and 4 cameras at 50 m from each house and recording four hours of activity (from 8 to 10 a.m. and from 3 to 5 p.m.) for five consecutive days. From the videos, the number of animals was counted, and the average density (chicken/m2) was calculated for each distance.
Feed consumption was recorded as an average value, calculated by dividing the daily total consumption by the number of chickens. Using this data, along with chicken density, the amount of organic matter and nitrogen released in faeces and urine over a 12-week production cycle was then estimated. In particular, the organic matter was estimated starting from the chemical composition of the feed (95% organic matter and 2.88% N) and feed consumption (150 g day−1), corrected for organic matter and nitrogen digestibility (0.85% and 0.75%, respectively; ref. [24]).

2.4. Soil Sampling

As we used the distance from the poultry houses as a proxy for the chicken load, within the grazed olive grove, we selected two plots of about 400 m2 at 20 and 50 m away from the three chicken houses (2 plots × 3 chicken houses = 6 plots), corresponding to high chicken density (0.63 animals m−2) and low chicken density (0.08 animals m−2), respectively. An adjacent olive grove naturally covered with grasses and not subjected to grazing by chickens was considered as a control (CTR). After assessing the low pedological variability of grazed and ungrazed olive groves, three sampling sites were randomly selected within each plot. At each site, a soil profile was manually dug up using a shovel, and the Ap1 (0–10 cm depth) and Ap2 horizons (10–20 cm depth) were sampled from the entire exposed width by collecting about 1 kg of soil. The soil samples were immediately put in a portable refrigerator and carried to the laboratory, where they were air-dried and sieved through a 2 mm mesh.
At the time of sampling, additional samples from the Ap1 and Ap2 horizons were collected by steel cylinders (height: 51 mm; diameter: 50 mm) for the estimation of the soil bulk density (BD). Once in the laboratory, the samples were dried at 105 °C until they reached a constant weight. The bulk density was calculated from the ratio of the dried mass and volume of the soil core and corrected for the rock fragment content.

2.5. Estimation of the Aboveground and Belowground Herbaceous Biomass and Soil Analyses

Since plant cover is a key factor affecting both soil physical properties and SOC inputs in grassland ecosystems [25,26,27], the changes in the amount of aboveground and belowground plant biomass after grazing were investigated. To assess the amount of aboveground herbaceous biomass, the grass was collected (April 2023) in twelve random 1 m2 areas at 20 m and 50 m away from the chicken houses by cutting it to a height of 1 cm with scissors. The collected aboveground grass biomass was expressed as g dry matter m−2.
The belowground plant biomass was estimated by collecting the herbaceous roots in 12 undisturbed soil cores (15 × 15 × 20 cm) (4 for each studied area). From each core, which had been previously broken by hand, the largest roots were recovered by washing off the soil over a 2 mm sieve. The mixture of soil and water that passed through the sieve was gathered in a plastic container, stirred, and allowed to stand for about 1 h to collect the finer roots floating on the water’s surface. The roots were then rinsed with distilled water, dried in an oven at 60 °C, and weighed. The root biomass was expressed on a volume basis as g dm−3. Soil pH was measured potentiometrically in a 1:2.5 (w/v) soil/deionized water suspension [28]. The total organic C (TOC) and total nitrogen (TN) concentrations of the soil samples and plant roots were determined using an elemental analyser vario-MACRO cube (Elementar GmbH, Langenselbold, Germany).
The stored TOC and TN stocks and those related to root biomass in the entire investigated depth (0–20 cm) were calculated by the Equations (1) and (2), respectively:
Soil C or N stock [Mg ha−1] = C or N concentration [g kg−1] × BD [kg dm−3] × (1–Vrf) × thickness [m] × 10
where BD is the soil bulk density (mean value of 0.79 kg dm−3), and Vrf is the volume proportion occupied by rock fragments in the considered horizon,
Root C or N stock [Mg ha−1] = C or N concentration [g kg−1] × root amount [kg dm−3] × thickness [m] × 10.
Microbial basal respiration was measured by incubating 30 g of soil in airtight jars at a controlled temperature (25 °C) and humidity (50% of the soil water holding capacity) for 28 days. During the incubation, basal respiration was measured weekly by alkaline reaction (1 M NaOH solution) of the CO2 emitted from the samples and titration of the residual OH with a 0.1 M HCl solution [29]. The data were expressed as the whole CO2–C released during the incubation period (ƩCO2–C). The mineralization quotient (qM), represented by the ratio of (ƩCO2–C) to TOC content, was also calculated.
The structure of the soil microbial community was assessed by the ester-linked fatty acid methyl ester (El-FAME) profiling, which employed a mild alkaline methanolysis method. Stazi et al. (2017) [30] reported the details of the extraction procedure. The mass spectra were recorded by a QP-5050 (Shimadzu, Kyoto, Japan) spectrometer equipped with an AT 20 capillary column (0.25 mm i.d., 25 m) (Alltech, Deerfield, IL, USA) [30]. Twenty-five methylated fatty acids were identified according to their mass spectra and using BAME 24 and 37 FAME Mix (47080-U and 47885-U, respectively, Sigma-Aldrich, Darmstadt, Germany) as chemical standards. The fatty acids were finally quantified and converted into nmol lipid g–1 dry soil using peak areas from the internal standard [methylnonadecanoate (19:0)]. EL-FAME biomarkers were identified as follows: actinobacteria (10Me16:0, 10Me17:0, 10Me18:0), Gram-positive bacteria (G+) (i14:0, i15:0, a15:0, i16:0, i17:0, a17:0), Gram-negative bacteria (G−) (16:1ω7c, cy17:0, cy19:0, 18:1ω9t, 18:1ω7c), general bacteria (14:0, 15:0, 16:0, 17:0, 18:0, 25:00, 22:00), general fungi (18:3ω6c, 18:1ω9c), saprophytic fungi (18:2ω6,9) (SF), and arbuscular mycorrhizal fungi (AMF) (16:1ω5c), according to previous studies [31,32]. The sum of actinobacteria, G+, G−, and general bacteria was considered total bacteria (TB), whereas the sum of general fungi, SF, and AMF was named total fungi (TF). The G+/G− and TF/TB ratios were calculated as an index of soil microbial community change, while SFA/MUFA (saturated to monounsaturated fatty acid), and Cy/pre (cyclopropyl fatty acid to the monoenoic precursor) (cy17:0:16:1ω7) ratios were used as indicators of physiological or nutritional stress in the bacterial community [33,34].

2.6. Statistical Analysis

One-way analysis of variance (ANOVA) was performed to compare the animal density and herbal and root masses at different distances from the chicken houses (20 and 50 m).
Two-way ANOVA was performed to compare the biochemical soil variables as a function of distance from the chicken houses and soil depth. The normality and homogeneity of variances were tested by graphical analysis of residuals. When the normality and homoscedasticity were not satisfied, the logarithmic transformation was selected by the maximum likelihood procedure devised by Box and Cox, as implemented in the Box–Cox function of the package Modern Applied Statistics with S (MASS) [35] in the R statistical environment (R Core Team, 2020) [36]. The multiple comparison tests were performed with Tukey’s HSD with a significance level of 0.05.

3. Results and Discussion

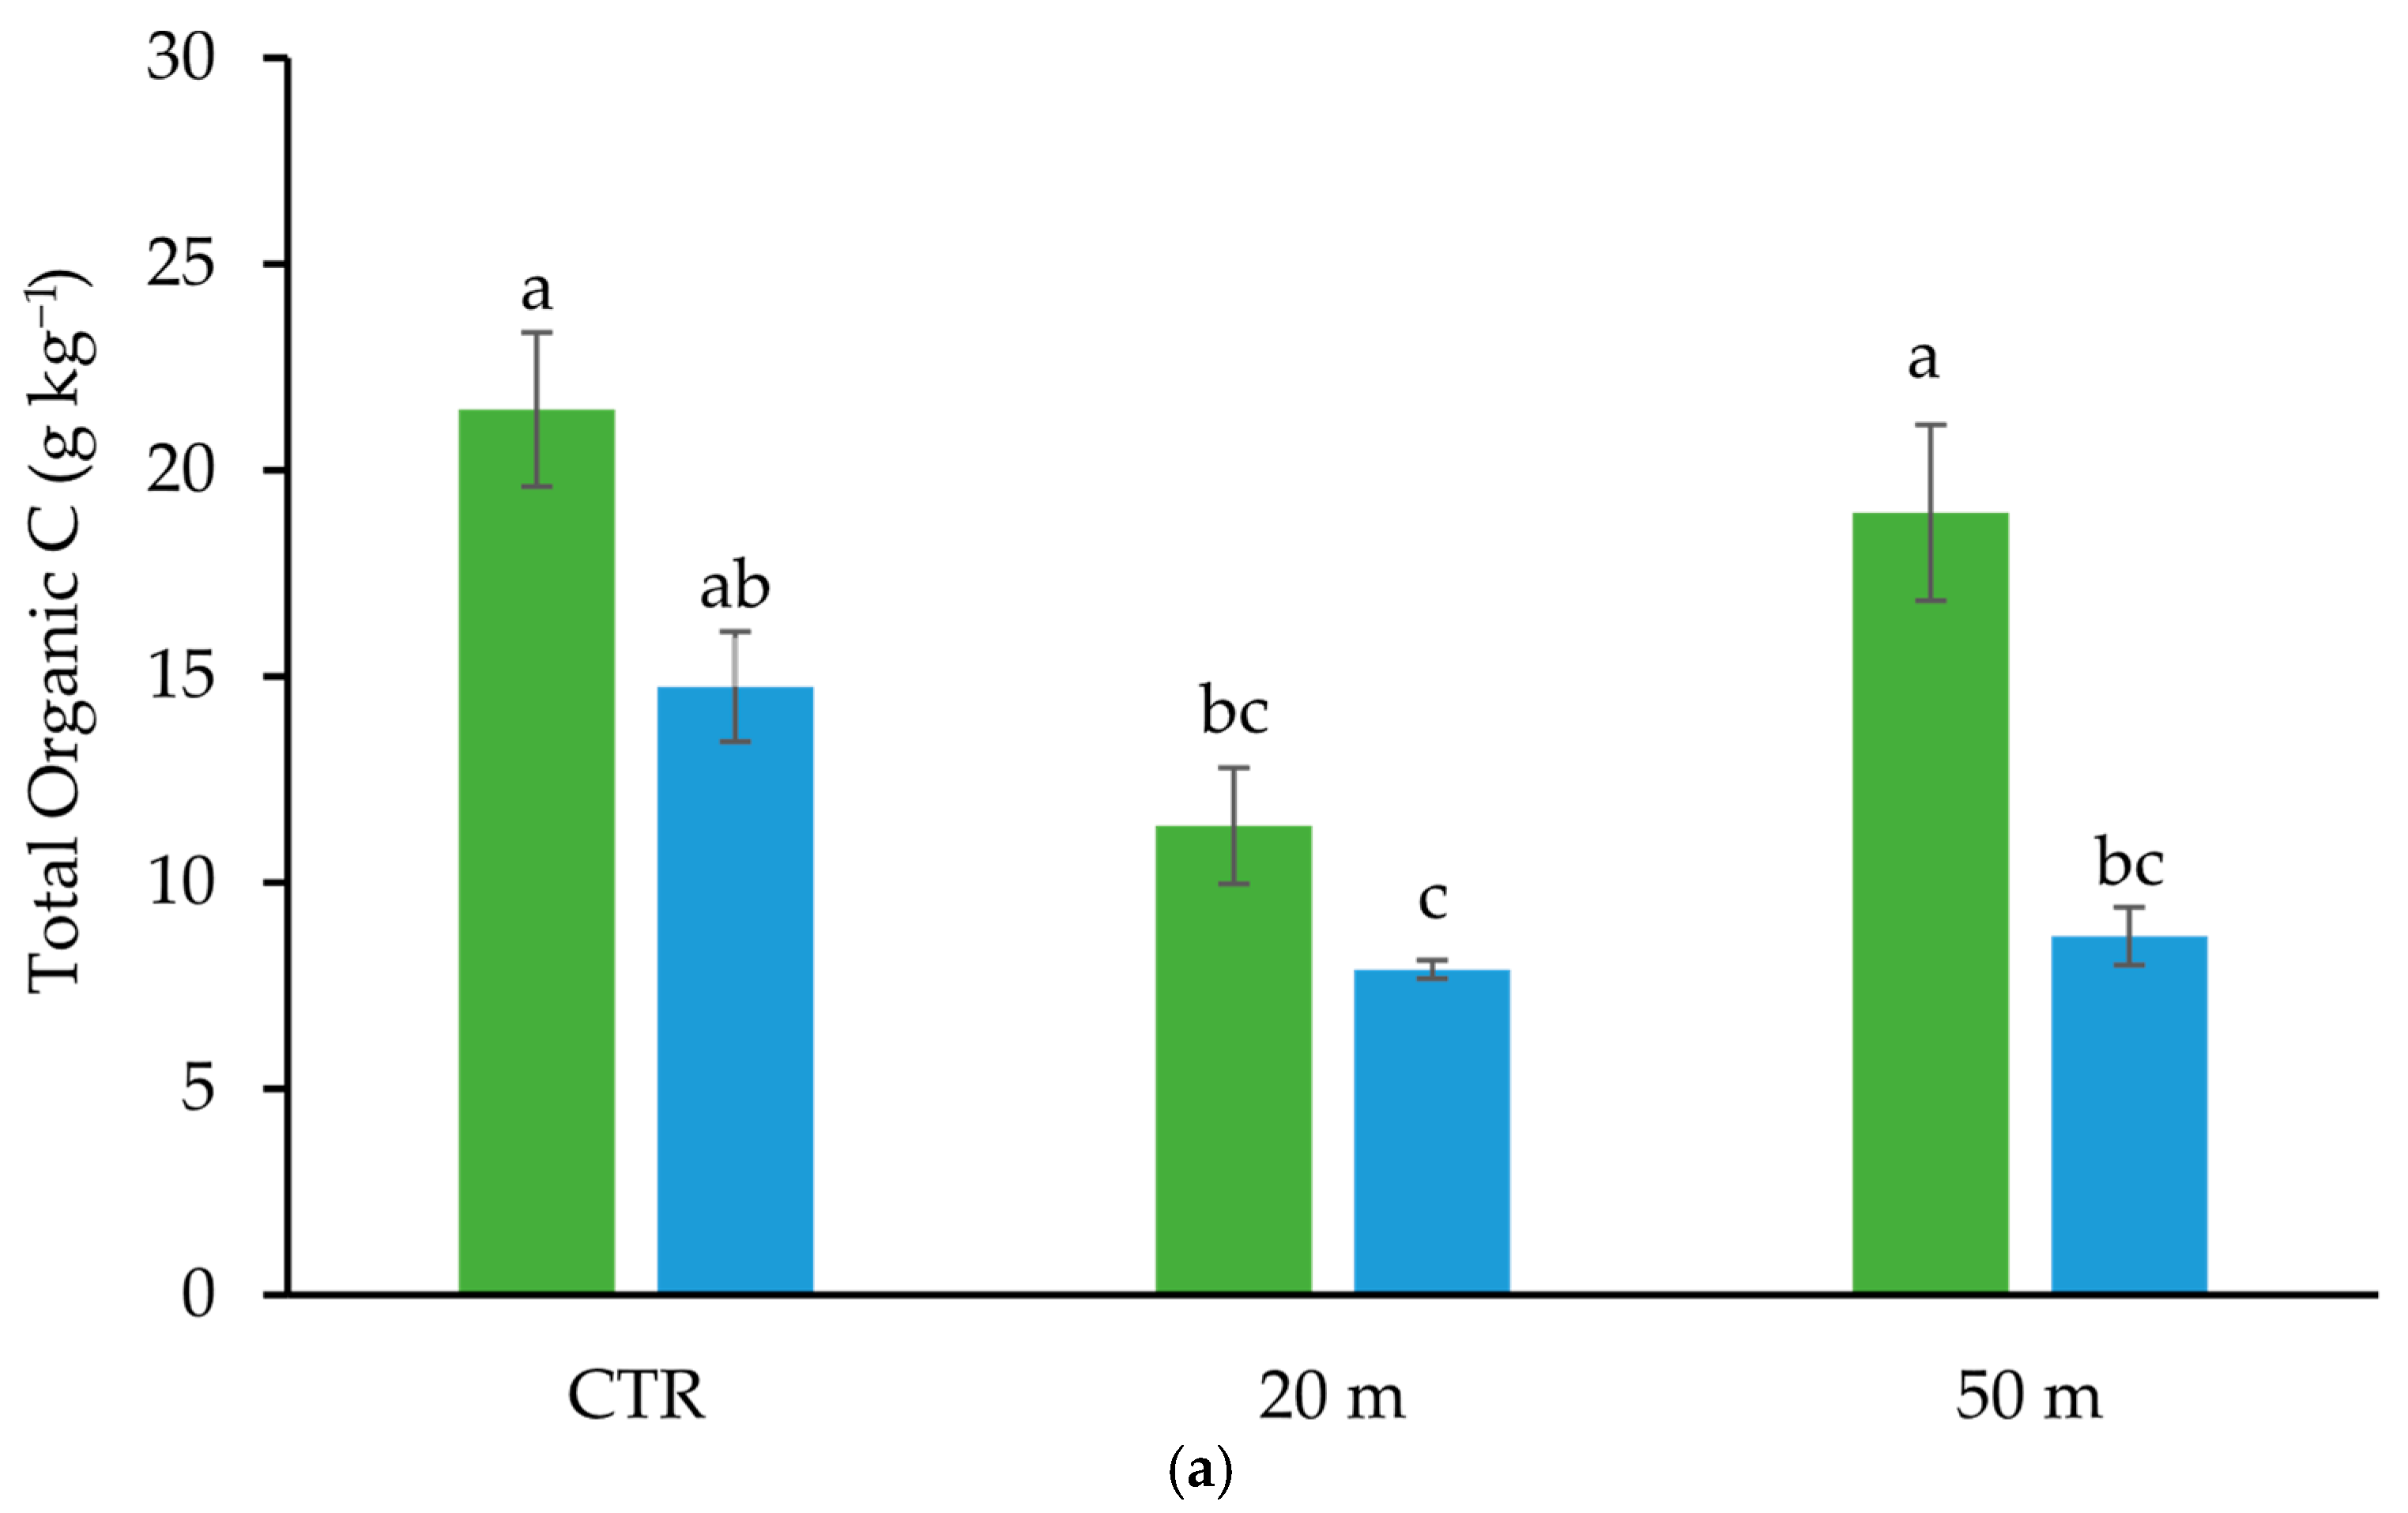
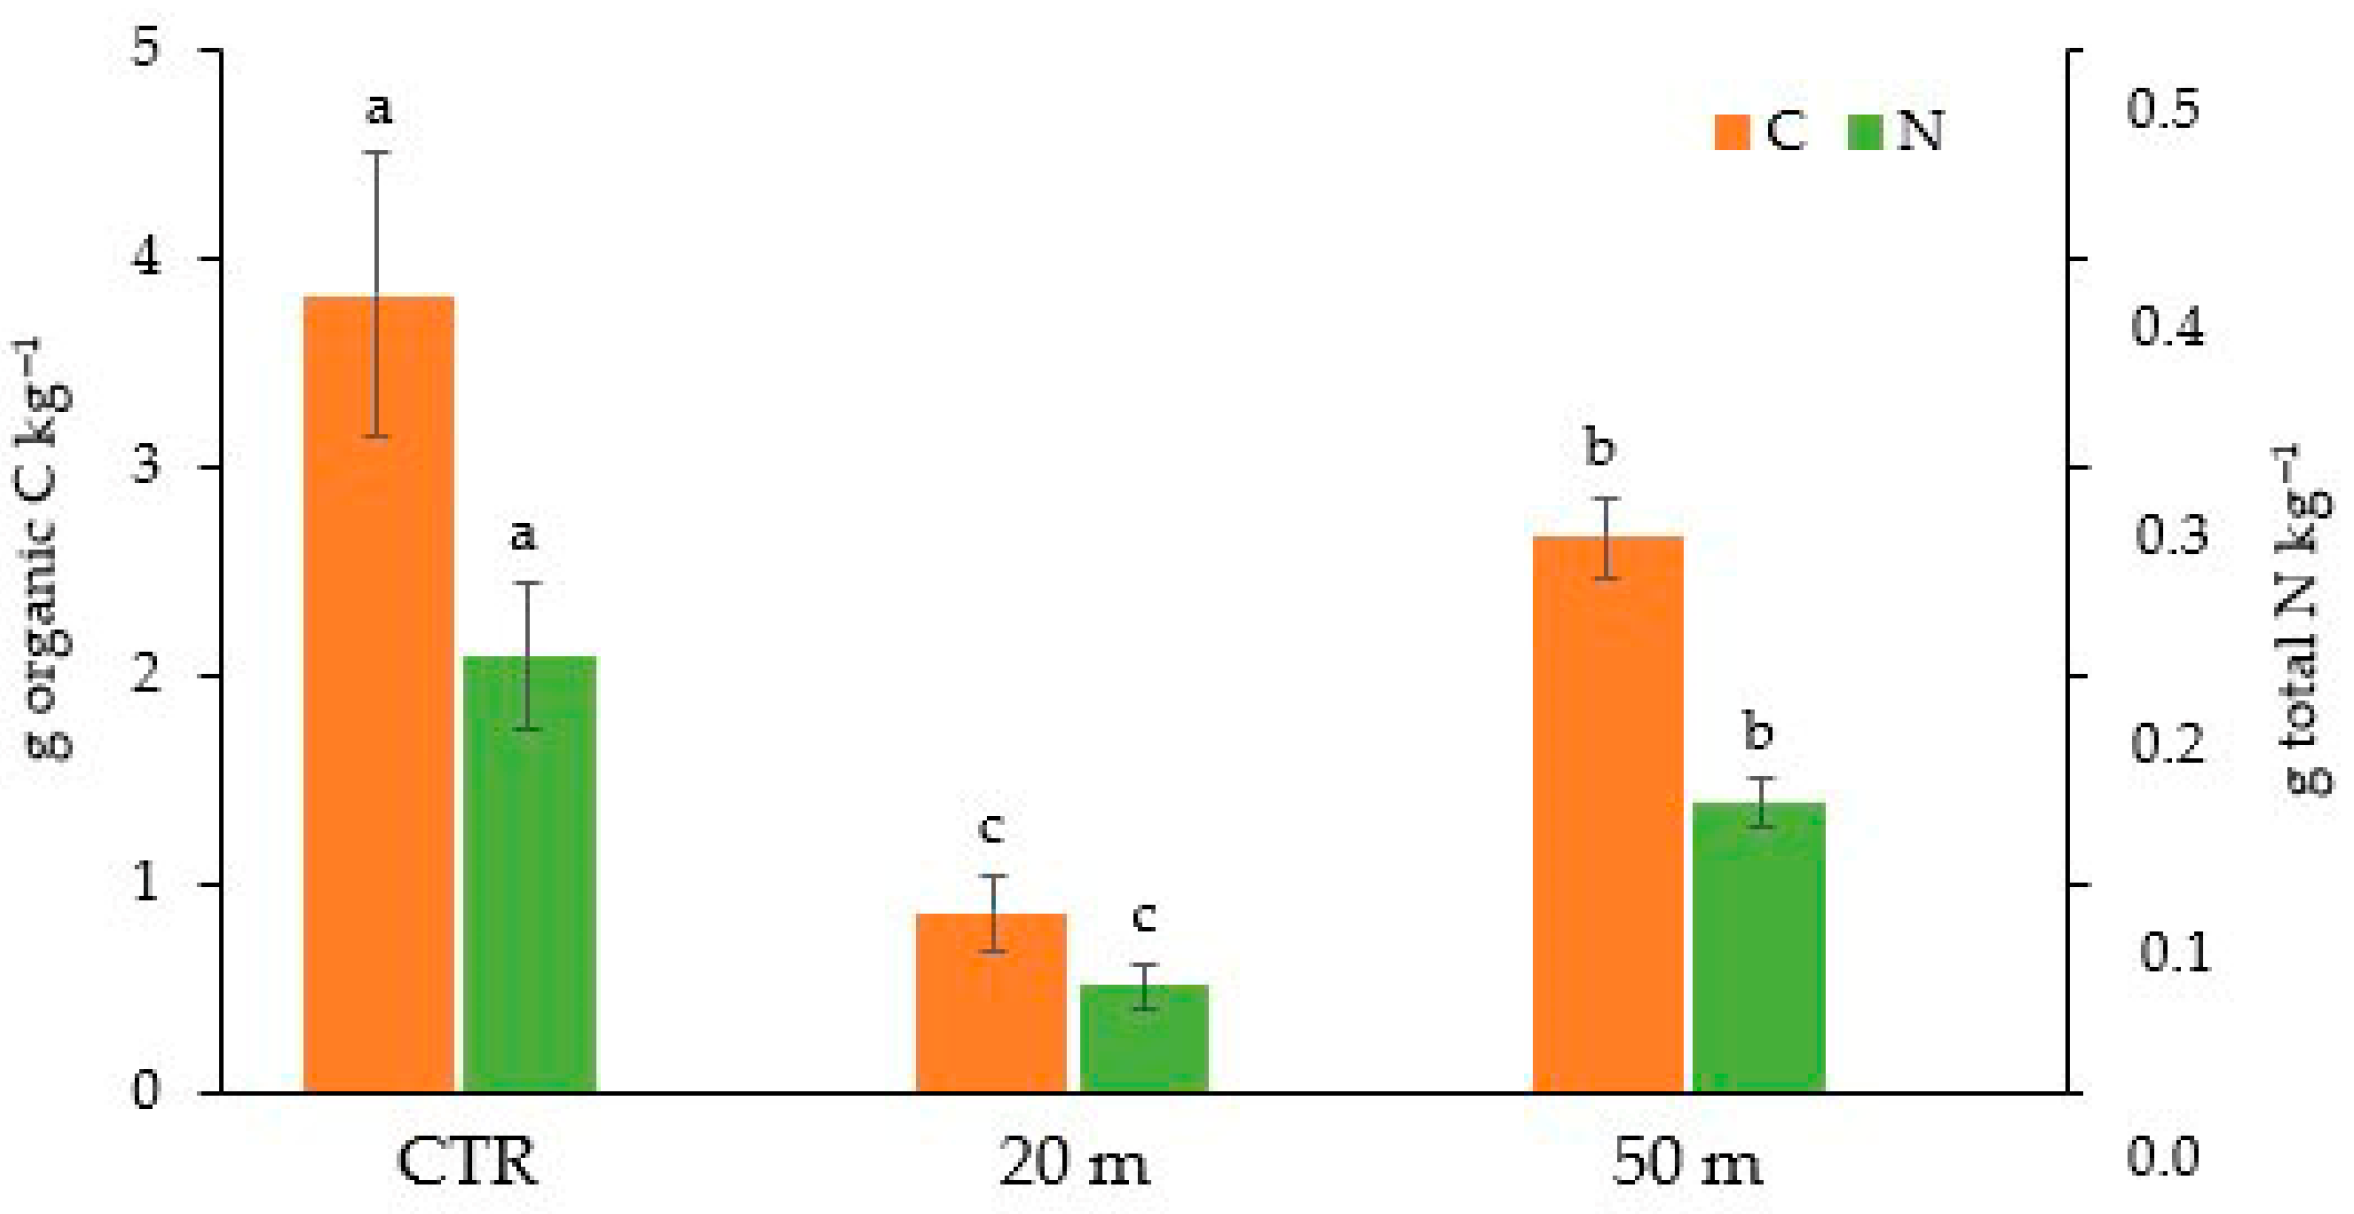
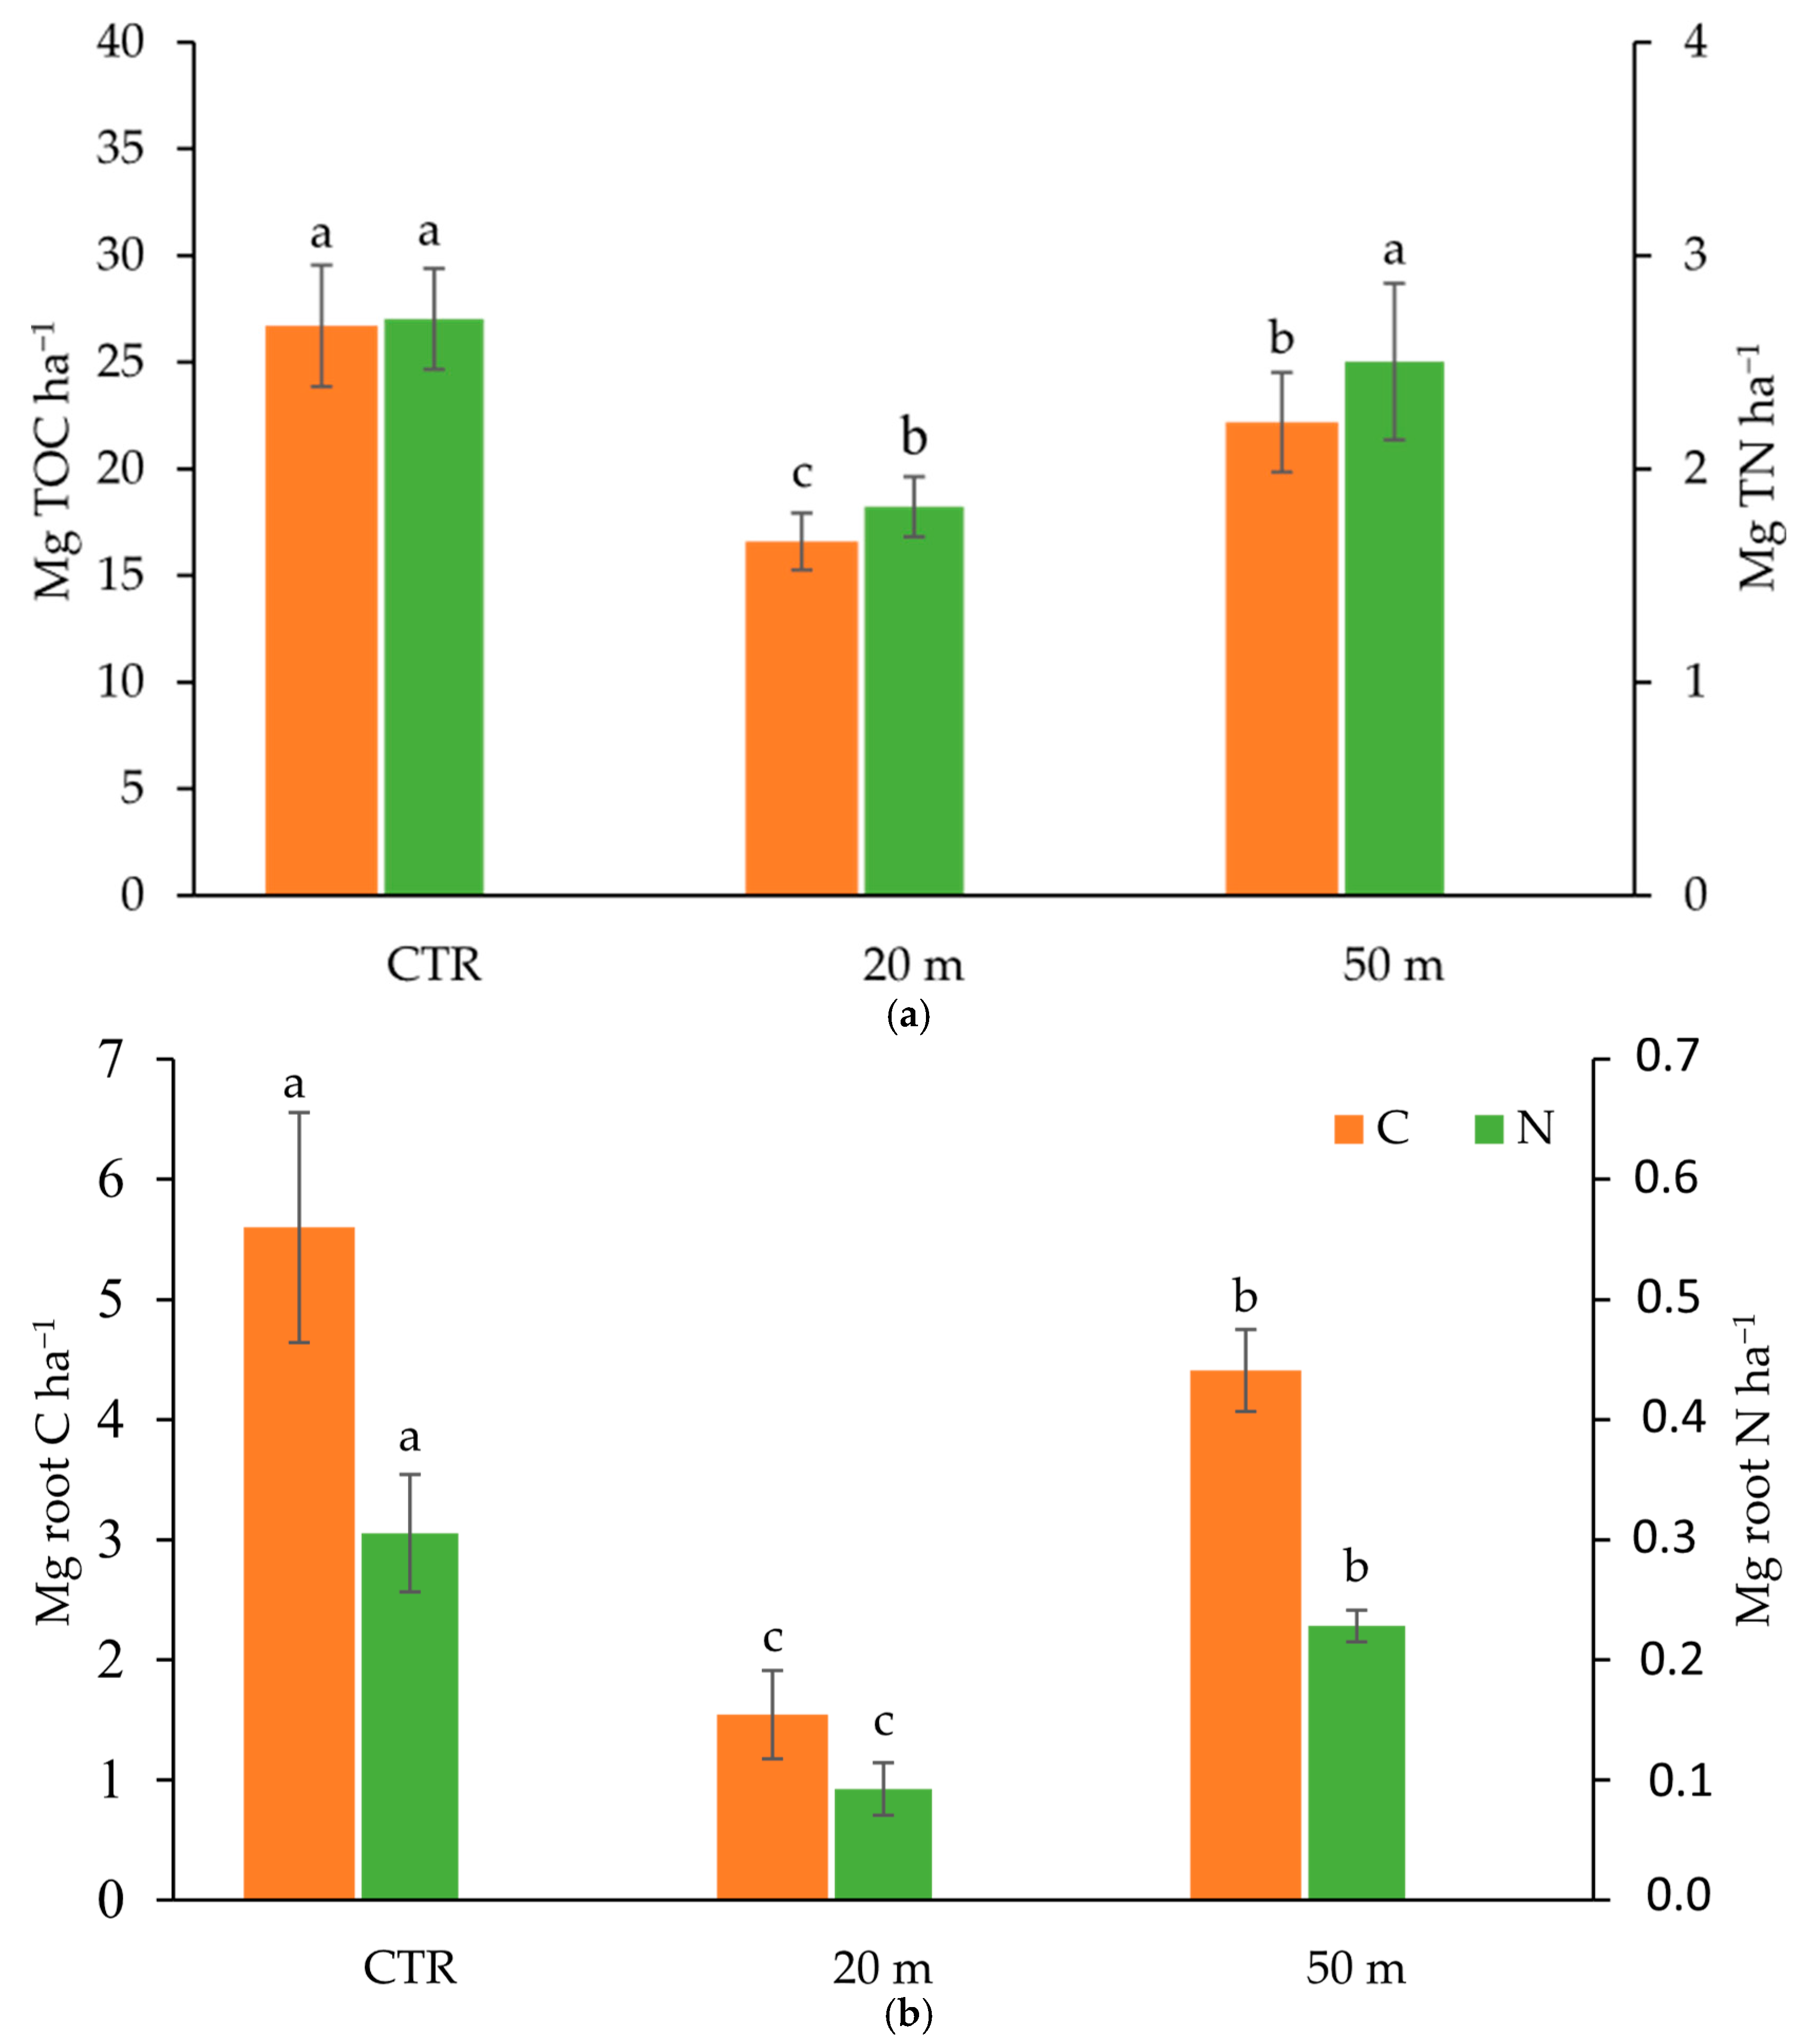
3.1. Grazing Effect on C and N Soil Concentrations and Stocks

Although the presence of olive trees generally improved the chickens’ exploratory behaviour, exerted climate mitigation and a protective role against birds of prey, and increased the use of pasture [37], the chicken density in the olive grove decreased progressively with the increasing distance from the houses. In particular, the density of chickens at 20 m away from the houses was 0.63 animals m−2, whereas at 50 m away from the houses, the density lowered to 0.08 animals m−2, about 87% less than that at 20 m (Table 1).
The decreasing amount of chickens with the increasing distance from the houses had a marked effect on the herbaceous soil cover. Indeed, the aboveground plant biomass, with respect to the CTR area, was reduced by about 90% and 77% at 20 and 50 m away from the chicken houses, respectively (Table 1). As reported by many studies, as grazing distance decreases, the accumulation of manure increases [38]. Similarly, in our case, according to the animal density, during each cycle the chicken droppings supplied 889.61 and 154.75 g m−2 of organic matter and 24.83 and 8.12 g m−2 of N to the soil, at 20 m and 50 m away from the houses, respectively (Table 1). However, despite the high supply of C and N by chicken droppings, at 20 m away from the chicken houses, the soil TOC and TN contents were lower than that of the CTR, both in the Ap1 (0–10 cm) and Ap2 (10–20 cm) horizons (Figure 2).
This apparently ineffective impact of chicken manure on the TOC content can be at least partly attributed to the fact that it is degraded on the soil surface, with a consequent loss of C in the form of CO2 emissions into the atmosphere [6]. At a distance of 50 m from the poultry houses, where the animal load and, consequently, the chicken droppings were lower than at 20 m, the TOC and TN contents of the soil were similar to those of the CTR in the Ap1 horizon and to those measured at 20 m in the Ap2 horizon (Figure 2). Although the present study did not identify overgrazing levels, which, as reported by Bilotta et al. (2007) [39], would result in soil degradation and fertility loss, a reduction in organic carbon and nitrogen was nevertheless observed at a distance of 20 m. Similarly to our results, Gai et al. (2021) [40], who tested the impact of chicken grazing on the soil organic C and fungal biomass in Chinese bamboo–chicken farming at 5, 15, 25, and 35 m from the chicken houses, found that a significant amount of C was lost in the soil near the houses due to enhanced C mineralization caused by excessive excretion of chicken manure [13]. The increased soil C mineralization close to the hen houses could also be due to the abundance of carbohydrates and other simple organic molecules derived from the degradation [41] of a large amount of chicken manure, which in turn would trigger the activity of the soil microbial community [42]. In addition to the reduction of the aboveground biomass, the decrease in the soil C contents also appeared to be related to the root biomass in the entire investigated depth (0–20 cm). Indeed, we observed reductions in the root C with respect to the CTR soil of about 77% and 30%, at 20 and 50 m away from the chicken houses, respectively (Figure 3).
Similar reductions occurred also in the root N concentration at the two distances from the chicken houses (75% and 35%). Despite the stronger reduction in root biomass in the soil close to the houses (Table 1), the similar amount of TOC and TN lost (about 40%) from the Ap2 horizon (10–20 cm depth) with respect to the CTR at both 50 and 20 m away from the houses (Figure 2) suggests that the chicken grazing, regardless of the load, strongly affected the organic matter content in the sub-superficial soil layer. Conversely, the greater C and N losses recorded in the Ap1 horizon within proximity of the chicken houses indicates that the animal load affected mostly the C and N contents in the upper soil horizon. The rather similar contents of C and N in the Ap2 horizon, regardless of the distance from the houses, and the marked reduction in root biomass at 20 m might seem contradictory. However, the reduction in the concentration of C and N in the deep soil horizon compared to the CTR could be attributed to a smaller amount of rhizodeposition, due to the decrease in aboveground and belowground biomass [43] and to the lower epigeic soil macrofauna [44], which is responsible for the degradation of litter, the formation of stable organomineral complexes [45], and their transport from the surface to deeper horizons [46]. However, it is important to note that a recent review of the literature revealed gaps in our knowledge regarding the impact of chicken grazing on soil organic matter.
The lower organic C content may also be the reason for the lower pH, compared to the CTR, of the Ap1 horizon at 20 m from the chicken houses (Figure 4).
Indeed, although chicken droppings are known to be neutral or slightly alkaline [47], the lower organic matter content reduces the cationic adsorption capacity of soil [48], thus promoting a greater presence of H+ in solution.
The TOC and TN stocks in the 0–20 cm soil depth at 20 m and 50 m away from the chicken houses, according to the TOC and TN concentrations, were significantly lower than those in the CTR (Figure 5a).
It can be noted that, while in the ungrazed soil (CTR) the root C and N (Figure 5b) greatly contributed to the TOC and N stocks (about 21% and 12%, respectively), in the grazed olive grove soil the contribution of root C and N to the TOC and TN stocks decreased, especially at 20 m from the poultry houses, where the chicken load was higher and root C and N contributed only about 10% and 5% to the TOC and TN stocks. The TOC stock data obtained in our case are in accordance with the meta-analysis of Ma et al. (2022) [27]. Considering 55 studies conducted in the grasslands of the Tibetan Plateau (China), they reported that SOC content and stock decreased by 14.4% and 11.9%, respectively, after livestock grazing (yak and Tibetan sheep), and that the SOC stocks decreased by 10.1%, 6.2%, and 20.1% under light, moderate, and heavy grazing.

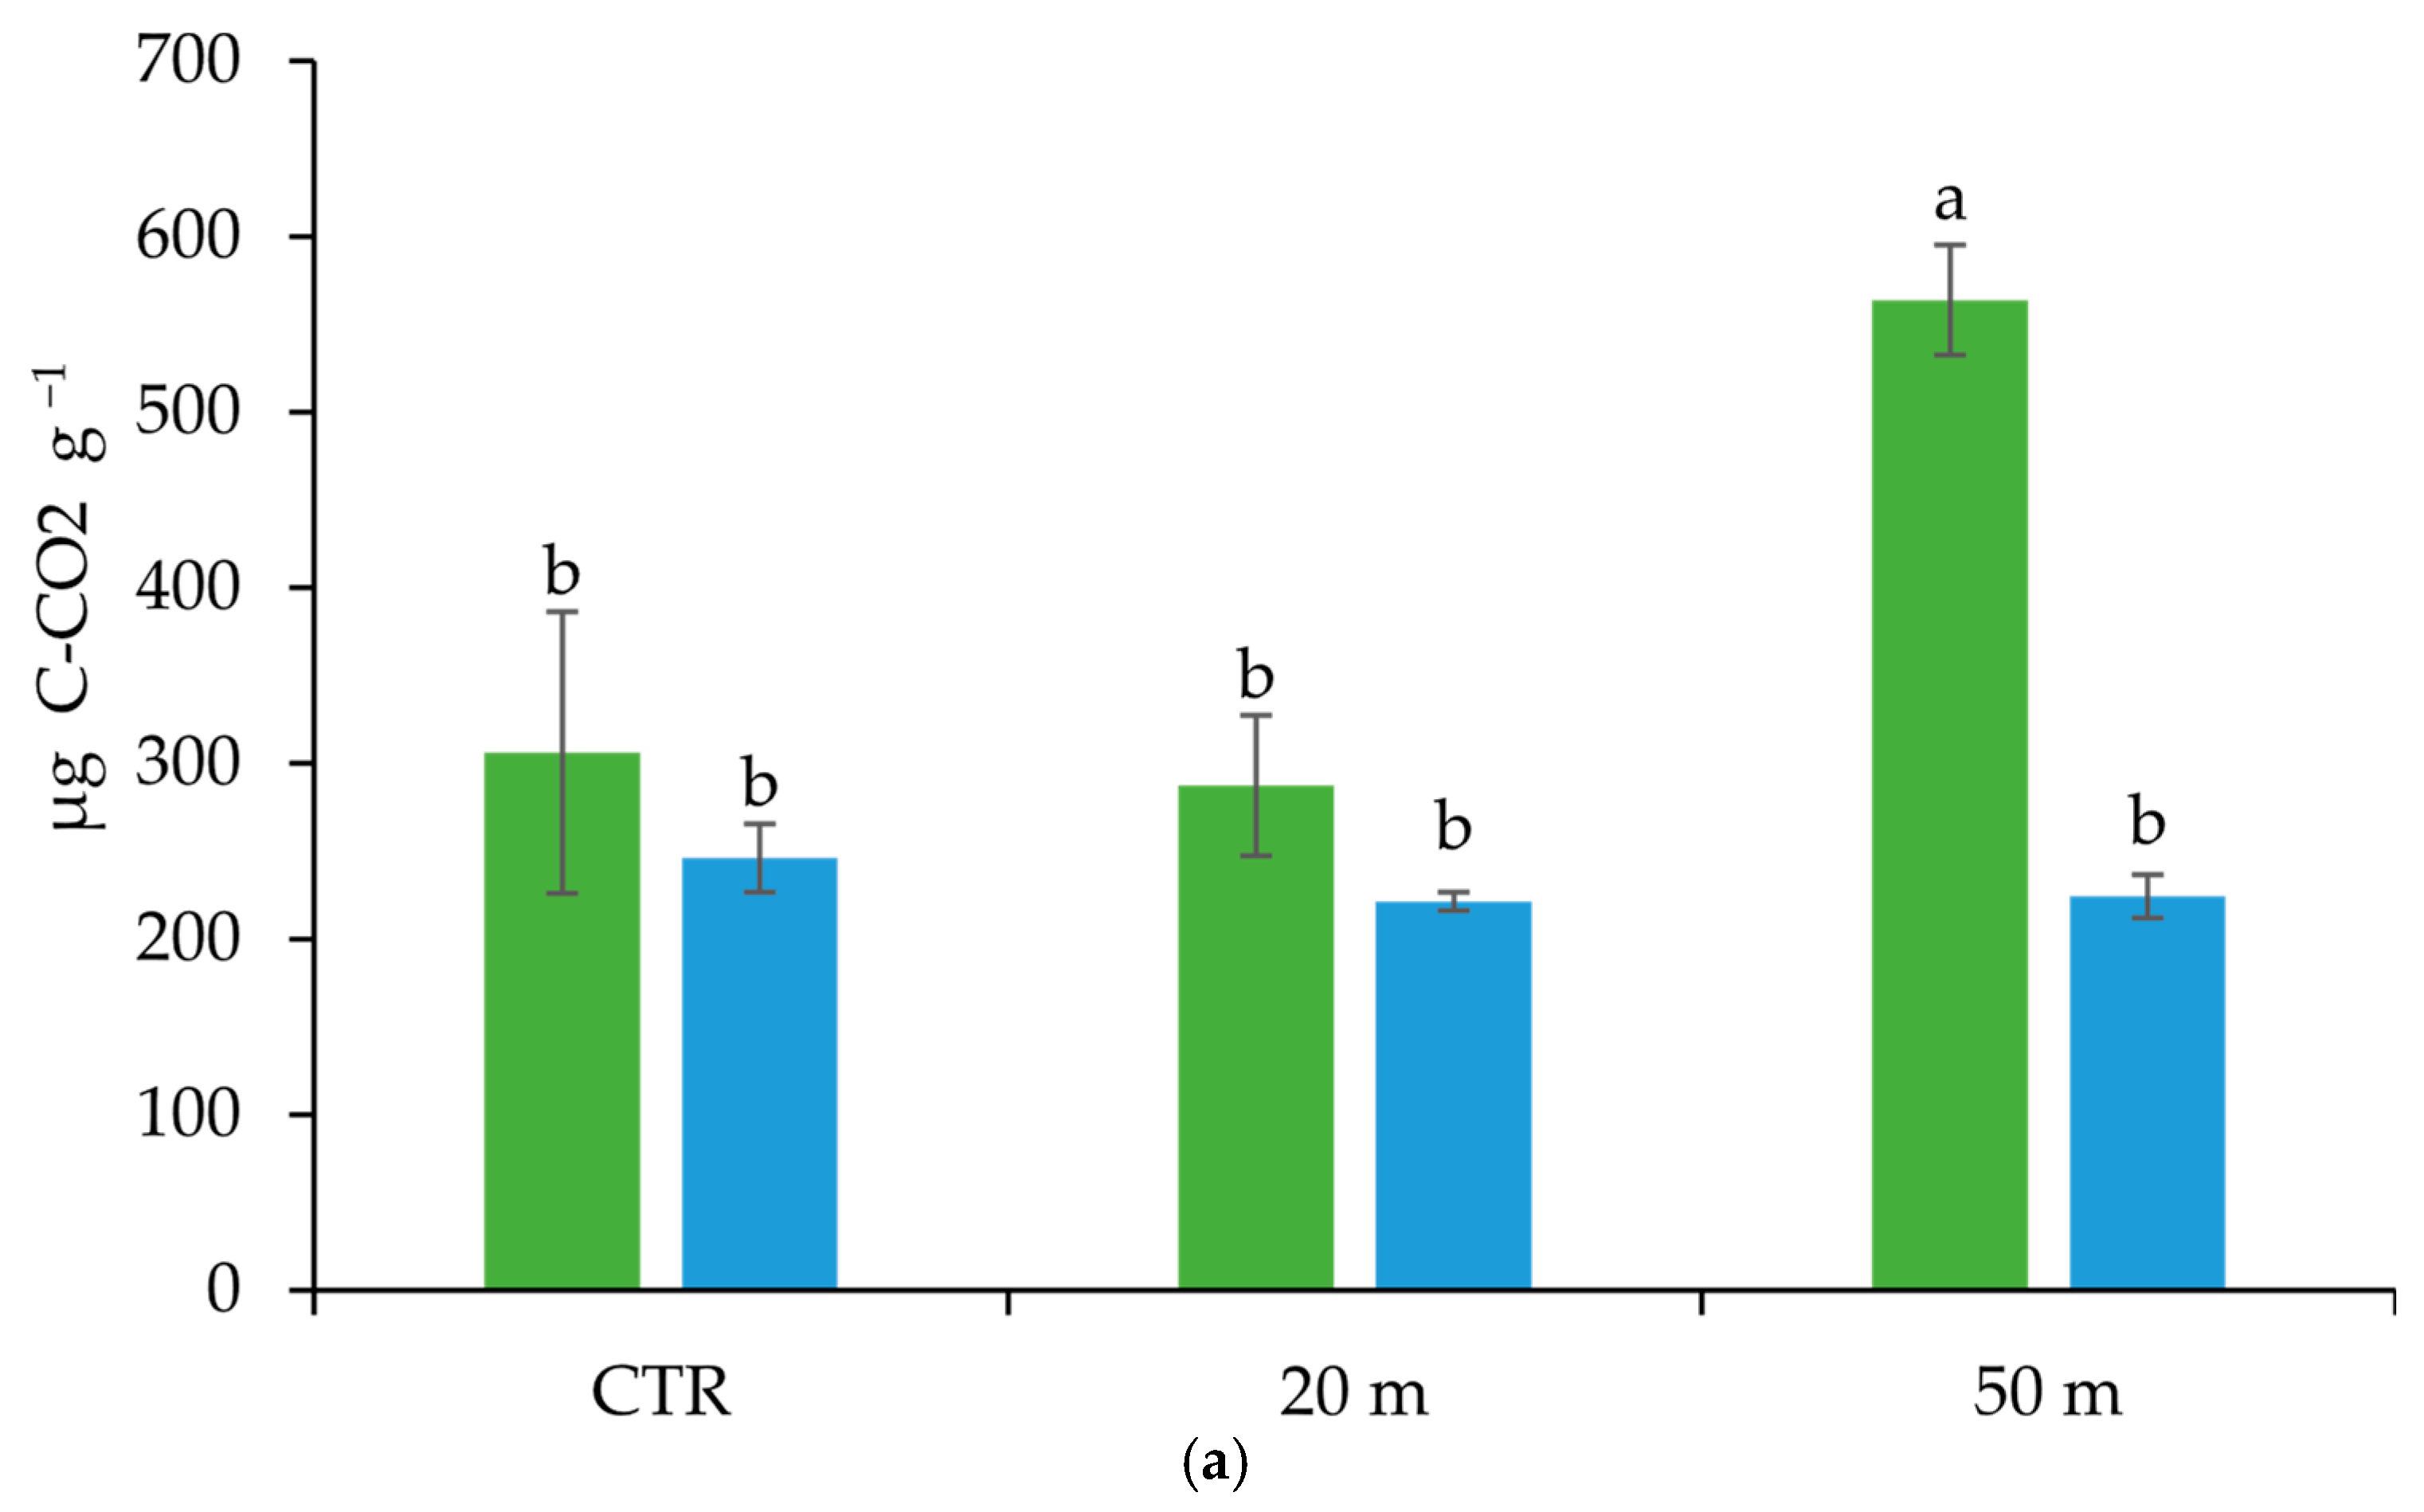
3.2. Grazing Effect on Microbial Community Amount, Activity, and Structure

The high chicken load in the soil close to the houses (20 m), differently affected the soil microbial community in the upper and deeper soil horizons (Table 2). As indicated by the El-FAME analysis, with respect to the CTR, increases in the SFA/MUFA and G+/G− ratios, and a reduction in the fungal community (as indicated by the TF and TF/TB ratio), which was probably due to the low amount of plant roots [49,50], occurred in the Ap1 horizon. In particular, the occurrence of a high SFA/MUFA ratio is recognized as an index of soil disturbance and/or compaction [35] and indicates a low availability of soil nutrients [51]. Indeed, SFA/MUFA has been shown to increase under acidic conditions, low oxygen supply, high temperature, and low nutrient availability [52] and has been associated with nutrient stress, and physical and chemical disturbances [34,53]. At a greater distance from the chicken houses, where a lower animal density occurred, the Ap1 horizon showed higher TF, SF, AMF, MUFA, and Pre contents than those of the plots close to the house and higher G+/G− and TF/TB ratios than those of the CTR (Table 2). Hence, where the chicken load was not excessive, the conditions of the soil microbial community were comparable to those of the ungrazed soil. Furthermore, the highest microbial basal respiration and mineralization quotient in the upper soil horizon at 50 m from the chicken houses (Figure 6), given the same TOC concentration (Figure 2) and microbial biomass content (estimated by the total EL-FAME, Table 2), suggests the presence of an even more active microbial community than that in the unpastured CTR soil.
The occurrence of a high TF/TB ratio also indicates relatively good availability and diversity of carbon sources for the microbial community [54], derived from both root exudates and chicken droppings.
In the Ap2 horizon, at both 20 and 50 m away from the chicken houses, the greater SFA/MUFA ratios and the lower concentration of MUFA and Pre indicated pronounced general environmental stress [34]. In the soils located 50 m away from the chicken houses, the significant decrease in the living microbial biomass assessed by total EL-FAME (Table 2) was not expected, and we hypothesized that it might be related to the pronounced reductions in the TOC and TN contents recorded for the Ap2 horizon (54% and 52%, respectively). In this regard, it cannot be ruled out that the lower amount of pedofauna, which is heavily preyed on by chickens [55], may have played a role in the cycling of organic matter and soil microbial activity. Finally, the larger G+/G− ratio occurring in both horizons of the soils pastured by the chickens, with respect to the CTR, may indicate a progressive change from copiotrophic to more oligotrophic conditions [56].

4. Conclusions

The results of the present research suggest that in addition to polygastric animals, such as cattle and sheep, nearly continuous grazing by FR chickens at a high animal density has a negative impact on soil health. Moreover, our results show that, despite the input of C and N supplied by chicken droppings, soil health and its CO2 sink capacity mainly depend on the amount of belowground and aboveground biomass present in the grazed area. The highest animal density in the area close to the chicken houses, which resulted in a rather significant absence of herbaceous cover and belowground root biomass, negatively affected the soil organic C and total N contents and the size and activity of the microbial community. At 50 m away from the poultry houses, moderate grazing due to a lower animal load was found to have a relatively sustainable soil impact, showing organic C and N contents and microbial community size and activity similar to those in the ungrazed area. In order to achieve a more comprehensive evaluation of the short- and long-term implications of free-range chicken farming on soil, future studies should also include analyses of soil samples collected during the indoor phase.
The management of free-range poultry farming should therefore consider, in addition to animal welfare, a rational pasture management strategy to ensure the maintenance of herbaceous cover and the chemical and biological components that contribute to soil health over time.

Author Contributions

L.M.: Writing—original draft, writing—review and editing, investigation, formal analysis, data curation. R.M.: Formal analysis, data curation. C.P.: Investigation. S.M.: Writing—review and editing. C.C.: Writing—review and editing, writing—original draft, investigation, conceptualization. A.A.: Writing—review and editing, writing—original draft, conceptualization. All authors have read and agreed to the published version of the manuscript.

Funding

This research received no funding.

Institutional Review Board Statement

Not applicable.

Informed Consent Statement

Not applicable.

Data Availability Statement

The original contributions presented in this study are included in the article. Further inquiries can be directed to the corresponding author.

Conflicts of Interest

The authors declare that they have no known competing financial interests or personal relationships that could have appeared to influence the work reported in this paper.

References

  1. Gouveia, K.G.; Vaz-Pires, P.; da Costa, P.M. Welfare assessment of broilers through examination of haematomas, foot-pad dermatitis, scratches and breast blisters at processing. Anim. Welf. 2009, 18, 43–48. [Google Scholar] [CrossRef]
  2. Dal Bosco, A.; Mugnai, C.; Mattioli, S.; Rosati, A.; Ruggeri, S.; Ranucci, D.; Castellini, C. Transfer of bioactive compounds from pasture to meat in organic free-range chickens. Poult. Sci. 2016, 95, 2464–2471. [Google Scholar] [CrossRef] [PubMed]
  3. Mattioli, S.; Cartoni Mancinelli, A.; Dal Bosco, A.; Ciarelli, C.; Guarino Amato, M.; Angelucci, E.; Chiattelli, D.; Castellini, C. Intake of nutrients (polyunsaturated fatty acids, tocols, and carotenes) and storage efficiency in different slow-growing chicken genotypes reared in extensive systems. PLoS ONE 2022, 17, e0275527. [Google Scholar] [CrossRef] [PubMed]
  4. Skunca, D.; Tomasevic, I.; Nastasijevic, I.; Tomovic, V.; Djekic, I. Life cycle assessment of the chicken meat chain. J. Clean. Prod. 2018, 184, 440–450. [Google Scholar] [CrossRef]
  5. Paolotti, L.; Boggia, A.; Castellini, C.; Rocchi, L.; Rosati, A. Combining livestock and tree crops to improve sustainability in agriculture: A case study using the Life Cycle Assessment (LCA) approach. J. Clean. Prod. 2016, 131, 351–363. [Google Scholar] [CrossRef]
  6. Massaccesi, L.; Cartoni Mancinelli, A.; Mattioli, S.; De Feudis, M.; Castellini, C.; Dal Bosco, A.; Marongiu, L.; Agnelli, A. Geese reared in vineyard: Soil, grass and animals interaction. Animals 2019, 9, 179. [Google Scholar] [CrossRef]
  7. Chavan, S.B.; Newaj, R.; Rizvi, R.H.; Ajit; Prasad, R.; Alam, B.; Handa, A.K.; Dhyani, S.K.; Amit, J.; Tripathi, D. Reduction of global warming potential vis-à-vis greenhouse gases through traditional agroforestry systems in Rajasthan, India. Environ. Dev. Sustain. 2021, 23, 4573–4593. [Google Scholar] [CrossRef]
  8. Berton, M.; Huerta, A.; Trocino, A.; Bordignon, F.; Sturaro, E.; Xiccato, G.; Birolo, M. Life Cycle Assessment of broiler chicken production using different genotypes and low-input diets. In Proceedings of the 73rd Annual Meeting of the EEAP, 5–8 September 2022; Porto, Portugal; Wageningen Academic Publishers: Noordwijk, The Netherlands, 2022; p. 502. [Google Scholar]
  9. Cui, X.; Wang, Y.; Niu, H.; Wu, J.; Wang, S.; Schnug, E.; Rogasik, J.; Fleckenstein, J.; Tang, Y. Effect of long-term grazing on soil organic carbon content in semiarid steppes in Inner Mongolia. Ecol. Res. 2005, 20, 519–527. [Google Scholar] [CrossRef]
  10. Abdalla, M.; Hastings, A.; Chadwick, D.R.; Jones, D.L.; Evans, C.D.; Jones, M.B.; Rees, R.M.; Smith, P. Critical review of the impacts of grazing intensity on soil organic carbon storage and other soil quality indicators in extensively managed grasslands. Agr. Ecosyst. Environ. 2018, 253, 62–81. [Google Scholar] [CrossRef]
  11. Poeplau, C. Grassland soil organic carbon stocks along management intensity and warming gradients. Grass Forage Sci. 2021, 76, 186–195. [Google Scholar] [CrossRef]
  12. Yang, F.; Niu, K.; Collins, C.G.; Yan, X.; Ji, Y.; Ling, N.; Zhou, X.; Du, G.; Guo, H.; Hu, S. Grazing practices affect the soil microbial community composition in a Tibetan alpine meadow. Land Degrad. Dev. 2019, 30, 49–59. [Google Scholar] [CrossRef]
  13. Kauffman, J.B.; Thorpe, A.S.; Brookshire, E.N.J. Livestock exclusion and belowground ecosystem responses in riparian meadows of eastern Oregon. Ecol. Appl. 2004, 14, 1671–1679. [Google Scholar] [CrossRef]
  14. Bardgett, R.D.; Leemans, D.K.; Cook, R.; Hobbs, P.J. Seasonality of the soil biota of grazed and ungrazed hill grasslands. Soil Biol. Biochem. 1997, 29, 1285–1294. [Google Scholar] [CrossRef]
  15. Kohler, F.; Hamelin, J.; Gillet, F.; Gobat, J.M.; Buttler, A. Soil microbial community changes in wooded mountain pastures due to simulated effects of cattle grazing. Plant Soil 2005, 278, 327–340. [Google Scholar] [CrossRef]
  16. Kardol, P.; Dickie, I.A.; John, M.G.S.; Husheer, S.W.; Bonner, K.I.; Bellingham, P.J.; Wardle, D.A. Soil-mediated effects of invasive ungulates on native tree seedlings. J. Ecol. 2014, 102, 622–631. [Google Scholar] [CrossRef]
  17. Bardgett, R.D.; Wardle, D.A. Herbivore-mediated linkages between aboveground and belowground communities. Ecology 2003, 84, 2258–2268. [Google Scholar] [CrossRef]
  18. Eldridge, D.J.; Delgado-Baquerizo, M.; Travers, S.K.; Val, J.; Oliver, I. Do grazing intensity and herbivore type affect soil health? Insights from a semi-arid productivity gradient. J. Appl. Ecol. 2017, 54, 976–985. [Google Scholar] [CrossRef]
  19. Bardgett, R.D.; Wardle, D.A.; Yeates, G.W. Linking above-ground and below-ground interactions: How plant responses to foliar herbivory influence soil organisms. Soil Biol. Biochem. 1998, 30, 1867–1878. [Google Scholar] [CrossRef]
  20. Hu, H.; Chen, X.; Hou, F.; Wu, Y.; Cheng, Y. Bacterial and fungal community structures in loess plateau grasslands with different grazing intensities. Front. Microbiol. 2017, 8, 606. [Google Scholar] [CrossRef]
  21. Xu, H.; You, C.; Tan, B.; Xu, L.; Liu, Y.; Wang, M.; Xu, Z.; Sardans, J.; Peñuelas, J. Effects of livestock grazing on the relationships between soil microbial community and soil carbon in grassland ecosystems. Sci. Total Environ. 2023, 881, 163416. [Google Scholar] [CrossRef]
  22. Liu, Y.; Zhang, M.; Wang, X.; Wang, C. The impact of different grazing intensity and management measures on soil organic carbon density in Zhangye grassland. Sci. Rep. 2024, 14, 17556. [Google Scholar] [CrossRef] [PubMed]
  23. Napoli, R.; Paolanti, M.; Di Ferdinando, S. Atlante dei Suoli del Lazio; ARSIAL Regione Lazio: Rome, Italy, 2019; ISBN 978-88-904841-2-4. [Google Scholar]
  24. Akinola, O.S.; Onakomaiya, A.O.; Agunbiade, J.A.; Oso, A.O. Growth performance, apparent nutrient digestibility, intestinal morphology and carcass traits of broiler chickens fed dry, wet and fermented-wet feed. Livest. Sci. 2015, 177, 103–109. [Google Scholar] [CrossRef]
  25. Gould, I.J.; Quinton, J.N.; Weigelt, A.; De Deyn, G.B.; Bardgett, R.D. Plant diversity and root traits benefit physical properties key to soil function in grasslands. Ecol. Lett. 2016, 19, 1140–1149. [Google Scholar] [CrossRef] [PubMed]
  26. O’brien, S.L.; Jastrow, J.D.; Grimley, D.A.; Gonzalez-Meler, M.A. Moisture and vegetation controls on decadal-scale accrual of soil organic carbon and total nitrogen in restored grasslands. Glob. Change Biol. 2010, 16, 2573–2588. [Google Scholar] [CrossRef]
  27. Ma, Z.; Qin, W.; Wang, Z.; Han, C.; Liu, X.; Huang, X. A Meta-Analysis of Soil Organic Carbon Response to Livestock Grazing in Grassland of the Tibetan Plateau. Sustainability 2022, 14, 14065. [Google Scholar] [CrossRef]
  28. van Reeuwijk, L. Procedures for Soil Analysis, 6th ed.; ISRIC: Wageningen, The Netherlands; FAO: Rome, Italy, 2002. [Google Scholar]
  29. Anderson, T.H.; Domsch, K.H. The metabolic quotient for CO2 (qCO2) as a specific activity parameter to assess the effects of environmental conditions, such as pH, on the microbial biomass of forest soils. Soil Biol. Biochem. 1993, 25, 393–395. [Google Scholar] [CrossRef]
  30. Stazi, S.R.; Moscatelli, M.C.; Papp, R.; Crognale, S.; Grego, S.; Martin, M.; Marabottini, R. A multi-biological assay approach to assess microbial diversity in arsenic (as) contaminated soils. Geomicrobiol. J. 2017, 34, 183–192. [Google Scholar] [CrossRef]
  31. Massaccesi, L.; Benucci, G.M.N.; Gigliotti, G.; Cocco, S.; Corti, G.; Agnelli, A. Rhizosphere effect of three plant species of environment under periglacial conditions (Majella massif, Central Italy). Soil Biol. Biochem. 2015, 89, 184–195. [Google Scholar] [CrossRef]
  32. Marinari, S.; Marabottini, R.; Falsone, G.; Vianello, G.; Antisari, L.V.; Agnelli, A.; Massaccesi, L.; Cocco, S.; Cardelli, V.; Serrani, D.; et al. Mineral weathering and lessivage affect microbial community and enzyme activity in mountain soils. Appl. Soil Ecol. 2021, 167, 104024. [Google Scholar] [CrossRef]
  33. McKinley, V.; Peacock, A.D.; White, D.C. Microbial community PLFA and PHB responses to ecosystem restoration in tallgrass prairie soils. Soil Biol. Biochem. 2005, 37, 1946–1958. [Google Scholar] [CrossRef]
  34. Romaniuk, R.; Costantini, A.; Giuffré, L.; Nannipieri, P. Catabolic response and phospholipid fatty acid profiles as microbial tools to assess soil functioning. Soil Use Manag. 2016, 32, 603–612. [Google Scholar] [CrossRef]
  35. Venables, W.N.; Ripley, B.D. Modern Applied Statistics with S, 4th ed.; Springer: New York, NY, USA, 2002. [Google Scholar]
  36. R Core Team. R: A Language and Environment for Statistical Computing; R Foundation for Statistical Computing: Vienna, Austria, 2020; Available online: https://www.R-project.org/ (accessed on 30 November 2024).
  37. Dal Bosco, A.; Mugnai, C.; Sirri, F.; Zamparini, C.; Castellini, C. Assessment of a GPS to evaluate activity of organic chickens at pasture. J. Appl. Poult. Res. 2010, 19, 213–218. [Google Scholar] [CrossRef]
  38. Mohr, D.; Cohnstaedt, L.W.; Topp, W. Wild boar and red deer affect soil nutrients and soil biota in steep oak stands of the Eifel. Soil Biol. Biochem. 2005, 37, 693–700. [Google Scholar] [CrossRef]
  39. Bilotta, G.S.; Brazier, R.E.; Haygarth, P.M. The impacts of grazing animals on the quality of soils, vegetation, and surface waters in intensively managed grasslands. Adv. Agron. 2007, 94, 237–280. [Google Scholar] [CrossRef]
  40. Gai, X.; Zhong, Z.; Zhang, X.; Bian, F.; Yang, C. Effects of chicken farming on soil organic carbon fractions and fungal communities in a Lei bamboo (Phyllostachys praecox) forest in subtropical China. For. Ecol. Manag. 2021, 479, 118603. [Google Scholar] [CrossRef]
  41. Zhong, Y.Q.W.; Yan, W.M.; Shangguan, Z.P. Soil carbon and nitrogen fractions in the soil profile and their response to long-term nitrogen fertilization in a wheat field. Catena 2015, 135, 38–46. [Google Scholar] [CrossRef]
  42. Urra, J.; Alkorta, I.; Lanzén, A.; Mijangos, I.; Garbisu, C. The application of fresh and composted horse and chicken manure affects soil quality, microbial composition and antibiotic resistance. Appl. Soil Ecol. 2019, 135, 73–84. [Google Scholar] [CrossRef]
  43. Dawson, L.A.; Grayston, S.J.; Paterson, E. Effects of Grazing on the Roots and Rhizosphere of Grasses. In Grassland Ecophysiology and Grazing Ecology; Lemaire, G., Hodgson, J., de Moraes, A., Nabinger, C., de Faccio Carvalho, P.C., Eds.; CAB International: Wallingford, UK, 2000; pp. 61–84. [Google Scholar]
  44. Soares, P.R.; Guilherme, R.; Conceição, A.; Galhano, C. Soil macrofauna under laying hens’ grazed fields in two different agroecosystems in Portugal. Open Agric. 2023, 8, 20220172. [Google Scholar] [CrossRef]
  45. Hayes, M.H.B. Darwin’s “vegetable mould” and some modern concepts of humus structure and soil aggregation. In Earthworm Ecology; Satchell, J.E., Ed.; Chapman and Hall: London, UK; New York, NY, USA, 1983; pp. 19–33. [Google Scholar]
  46. Jones, C.G.; Lawton, J.H.; Shachak, M. Organisms as ecosystem engineers. Oikos 1994, 69, 373–386. [Google Scholar] [CrossRef]
  47. Dikinya, O.; Mufwanzala, N. Chicken manure-enhanced soil fertility and productivity: Effects of application rates. J. Soil Sci. Environ. Manag. 2010, 1, 46–54. Available online: http://www.academicjournals.org/JSSEM (accessed on 20 November 2024).
  48. Murphy, B.W. Impact of soil organic matter on soil properties—A review with emphasis on Australian soils. Soil. Res. 2015, 53, 605–635. [Google Scholar] [CrossRef]
  49. Delgado-Baquerizo, M.; Fry, E.L.; Eldridge, D.J.; Vries, F.T.; Manning, P.; Hamonts, K.; Kattge, J.; Boenisch, G.; Singh, B.K.; Bardgett, R.D. Plant attributes explain the distribution of soil microbial communities in two contrasting regions of the globe. New Phytol. 2018, 219, 574–587. [Google Scholar] [CrossRef] [PubMed]
  50. Leff, J.W.; Bardgett, R.D.; Wilkinson, A.; Jackson, B.G.; Pritchard, W.J.; De Long, J.R.; Oakley, S.; Mason, K.E.; Ostle, N.J.; Johnson, D.; et al. Predicting the structure of soil communities from plant community taxonomy, phylogeny, and traits. ISME J. 2018, 12, 1794–1805. [Google Scholar] [CrossRef] [PubMed]
  51. Bossio, D.A.; Scow, K.M.; Gunapala, N.; Graham, K.J. Determinants of soil microbial communities: Effects of agricultural management, season, and soil type on phospholipid fatty acid profiles. Microbial. Ecol. 1998, 36, 1–12. [Google Scholar] [CrossRef] [PubMed]
  52. Kieft, T.L.; Ringelberg, D.B.; White, D.C. Changes in ester-linked phospholipid fatty acid profiles of subsurface bacteria during starvation and desiccation in a porous medium. Appl. Environ. Microbiol. 1994, 60, 3292–3299. [Google Scholar] [CrossRef]
  53. Pinkart, H.C.; Ringelberg, D.B.; Piceno, Y.M.; Macnaughton, S.J.; White, D.C. Biochemical approaches to biomass measurements and community structure analysis. Manual Environ. Microbiol. 2002, 2, 101–113. [Google Scholar]
  54. De Vries, F.T.; Hoffland, E.; Van Eekeren, N.; Brussaard, L.; Bloem, J. Fungal/bacterial ratios in grasslands with contrasting nitrogen management. Soil Biol. Biochem. 2006, 38, 2092–2103. [Google Scholar] [CrossRef]
  55. Schon, N.L.; Fraser, P.M.; Mackay, A.D.; Dickinson, N. Relationship between earthworm abundance, ecological diversity and soil function in pastures. Soil Res. 2021, 59, 767–777. [Google Scholar] [CrossRef]
  56. Yao, H.Y.; Jiao, X.D.; Wu, F.Z. Effects of continuous cucumber cropping and alternative rotations under protected cultivation on soil microbial community diversity. Plant Soil 2006, 284, 195–203. [Google Scholar] [CrossRef]
Figure 1. Rearing cycle of chickens, use, and rest of pasture.
Soilsystems 09 00069 g001
Figure 2. Amount of total organic C (TOC) (a), and total N (TN) (b) in the Ap1 and Ap2 horizons at 20 and 50 m away from the chicken houses and in the control soil (CTR). Error bars are the standard errors (n = 3). Different letters indicate significant differences between the distances from the chicken houses and soil depth (HSD test, p < 0.05).
Soilsystems 09 00069 g002aSoilsystems 09 00069 g002b
Figure 3. Amounts of organic C and total N in roots in the Ap1 and Ap2 horizons at 20 and 50 m away from the chicken houses and in the control soil (CTR). Error bars are the standard errors (n = 3). Different letters indicate significant differences between the distances from the chicken houses and soil depth (HSD test, p < 0.05).
Soilsystems 09 00069 g003
Figure 4. Soil pH values in the Ap1 and Ap2 horizons at 20 and 50 m away from the chicken houses and in the control soil (CTR). Error bars are the standard errors (n = 3). Different letters indicate significant differences between the distances from the chicken houses and soil depth (HSD test, p < 0.05).
Soilsystems 09 00069 g004
Figure 5. Organic carbon and total nitrogen stocks in soil (a) and in roots (b) in the 0–20 cm soil layer at 20 and 50 m away from the chicken houses and in the control soil (CTR). Error bars are the standard errors (n = 3). Different letters indicate significant differences between the distances from the chicken houses and soil depth (HSD test, p < 0.05).
Soilsystems 09 00069 g005
Figure 6. Cumulative microbial respiration (a) and mineralization quotient (b) in the Ap1 and Ap2 horizons at 20 and 50 m away from the chicken houses and in the control soil (CTR). Error bars are the standard errors (n = 3). Different letters indicate significant differences between the distances from the chicken houses and soil depth (HSD test, p < 0.05).
Soilsystems 09 00069 g006aSoilsystems 09 00069 g006b
Table 1. Estimated chicken density, aboveground and belowground herbaceous biomass and its nitrogen content, amount of chicken excreta and nitrogen excreted with faeces and urine (per cycle) in the control (CTR) and pastured olive grove soils at different distances from the chicken houses. Values within brackets represent the standard errors (n = 3). Mean values with different letters significantly differ for p < 0.05.
CTR20 m50 m
Chicken density (animals m−2)-0.63 (0.33) a0.08 (0.05) b
Aboveground herbaceous biomass (g d.m. m−2)231.0 (33.1) c20.0 (1.2) a53.0 (4.6) b
Belowground plant biomass (g d.m. dm−3) 2.2 (0.5) a0.6 (0.3) b1.9 (0.1) ab
N content of herbaceous biomass (g d.m. m−2)4.7 (0.4) c0.4 (0.0) a 1.1 (0.9) b
Chicken excreta (g d.m. m−2 per cycle)-889.6 (4.6) a154.8 (2.1) b
N excreted with faeces and urine (g d.m. m−2 per cycle)-24.8 (3.0) a8.1 (1.0) b
Table 2. El-FAME analysis of the control soil (CTR) and soil samples at different distances (20 m and 50 m) from the chicken houses and at 0–10 cm (Ap1) and 10–20 cm (Ap2) depths. Values within brackets represent standard error (n = 3). For each line, mean values with different letters significantly differ for p < 0.05.
CTR20 m50 m
Ap1Ap2Ap1Ap2Ap1Ap2
nmol g−1
Total EL-FAME525.99 (38.6) a434.7 ± 56.3 a495.2 (26.7) a451.0 (32.2) a588.45 (75.0) a258.1 (40.6) b
TB404.7 (36.1) a400.9 (63.1) a403.47 (21.9) a362.4 (25.1) a441.07 (57.6) a282.9 (66.4) a
G+99.96 (8.2) a90.4 (13.2) a94.85 (4.8) a85.3 (5.2) a100.65 (17.2) a60.7 (13.6) a
G113.84 (12.6) a110.4 (19.6) a84.41 (3.1) a73.8 (5.1) ab111.4 (13.3) a63.2 (10.2) b
ACT15.18 (1.9) a12.3 (2.4) a16.16 (1.4) a15.4 (2.2) a22.9 (5.0) a13.2 (3.2) a
TF121.28 (10.0) a139.9 (20.2) a91.73 (4.8) b88.6 (7.3) b147.38 (18.0) a68.35 (12.8) b
SF30.14 (9.0) ab21.3 (3.1) a15.5 (2.1) b14.4 (0.8) b36.28 (4.8) a10.6 (2.2) b
AMF32.38 (2.4) a30.0 (5.1) a16.6 (0.7) b19.6 (1.6) a27.25 (3.7) a21.5 (3.5) a
SFA190.35 (20.4) a188.3 (28.1) a208.05 (21.2) a187.9 (13.7) a189.74 (11.7) a144.4 (38.0) a
MUFA173.13 (20.5) ab203.3 (28.2) a134.38 (2.4) b120.2 (9.9) b197.25 (27.7) a101.9 (17.9) b
Iso49.79 (4.5) a42.1 (7.4) a43.59 (2.6) a44.8 (3.3) a51.99 (9.4) a30.1 (6.2) a
Anteiso50.18 (4.1) a48.3 (5.9) a51.26 (2.6) a40.5 (4.4) a48.81 (7.8) a30.8 (7.4) a
Cy32.5 (2.5) a25.8 (5.6) ab26.27 (2.1) a27.8 (2.1) a28.97 (3.7) a17.5 (3.5) b
Pre49.2 (3.8) a51.9 (7.6) a34.3 (1.6) b27.1 (1.8) b52.81 (6.8) a25.9 (4.4) b
ratios
G+/G0.79 (0.0) b0.8 (0.0) b1.13 (0.1) a1.2 (0.1) a0.96 (0.0) a1.0 (0.1) a
TF/TB0.28 (0.0) b0.31 (0.0) a0.23 (0.0) c0.24 (0.0) b0.33 (0.0) a0.25 (0.0) ab
SFA/MUFA1.14 (0.0) b1.01 (0.05) b1.54 (0.1) a1.57 (0.04) a1.12 (0.0) b1.41 (0.10) a
Iso/Anteiso0.98 (0.0) a0.86 (0.03) a0.85 (0.0) b1.16 (0.19) a1.08 (0.0) a0.99 (0.04) a
Cy/Pre0.62 (0.0) ab0.53 (0.05) c0.77 (0.1) a1.02 (0.01) a0.49 (0.0) b0.82 (0.03) b
TB: total bacteria; G+: Gram-positive bacteria; G−: Gram-negative bacteria; ACT: Actinomycetes; TF: total fungi; SF: saprophytic fungi; AMF: arbuscular mycorrhizal fungi; SFA: saturated fatty acid; MUFA = monounsaturated fatty acid; Iso: iso-branched fatty acid; Anteiso: anteiso-branched fatty acid; Cy: cyclopropyl fatty acids; Pre: monoenoic precursor.
Disclaimer/Publisher’s Note: The statements, opinions and data contained in all publications are solely those of the individual author(s) and contributor(s) and not of MDPI and/or the editor(s). MDPI and/or the editor(s) disclaim responsibility for any injury to people or property resulting from any ideas, methods, instructions or products referred to in the content.

