Article

Urban Market Gardening Improves Soil Health: A Case Study in Burkina Faso

by
Rayangnéwendé Adèle Ouédraogo
1,2,*,
Fabèkourè Cédric Kambiré
2,
Laurent Cournac
3,4 and
Charles L. Bielders
1
1
Earth and Life Institute, Université Catholique de Louvain, 1348 Louvain-la-Neuve, Belgium
2
Institut de Recherche en Sciences Appliquées et Technologies/Centre National de la Recherche Scientifique et Technologique (IRSAT/CNRST), Direction Régionale de l’Ouest, Bobo-Dioulasso 01 BP 2393, Burkina Faso
3
Eco&Sols, Institut de Recherche pour le Developpement (IRD), CIRAD, INRAE, Institut Agro, Université de Montpellier, 34060 Montpellier, France
4
Laboratoitre Mixte International Intensification Ecologique des Sols cultivés en Afrique de l’Ouest (LMI IESOL), Centre ISRA IRD Bel-Air, Dakar BP 1386, Senegal
*
Author to whom correspondence should be addressed.
Soil Syst. 2025, 9(2), 59; https://doi.org/10.3390/soilsystems9020059
Submission received: 12 March 2025 / Revised: 27 May 2025 / Accepted: 28 May 2025 / Published: 4 June 2025

Abstract

:
In sub-Saharan Africa, urban market gardening is characterized by the intensive use of chemical inputs, which could have adverse effects on soil health. This study therefore aimed to assess the impact of urban market gardening on soil health. Topsoil samples were collected from 69 plots at a market gardening site in Bobo-Dioulasso, Burkina Faso, with cultivation histories ranging from 0 to over 50 years. Twenty-six chemical, biological, and physical soil properties were analyzed. Principal component analysis was used to identify minimum data sets for the assessment of soil health. The selected variables were standardized and aggregated into two soil health indices on a scale from 0 to 100: an overall index based on all properties combined and an average index based on the mean of the biological, physical, and chemical components of soil health. Both indices revealed a clear improvement in soil health over time, with the overall index rising from an initial value of 0.35 to 0.64 after 60 years and the average index rising from 0.30 to 0.62. The average index, which enables the separate assessment of its three components, accounted for a greater share of the temporal variability (R2 = 0.59) than the overall index (R2 = 0.47). These findings highlight the positive impact of urban market gardening practices on soil health at the study site, which was attributed to the large additions of organic amendments.

1. Introduction

Soil health is defined as “the continued ability of soil to function as a vital living ecosystem that supports plants, animals, and humans” [1]. Given that human interventions such as land use changes or soil management practices alter soil properties, monitoring soil health is essential for sustainable land management [2,3]. The use of soil health indices (SHIs) has been proposed for this purpose. In addition to helping farmers to assess the impacts of new agricultural practices, these integrated SHIs allow researchers and policymakers to evaluate policy decisions and measure progress towards sustainable soil management [4].
Although changes in land management may already translate into changes in soil health after a few years, such short-term monitoring is often insufficient to assess the full extent of changes in soil health, which may require several decades. Several studies around the world have assessed the impact of cropping practices on soil health in the long term. For example, Ref. [5] demonstrated that a crop rotation system involving soya and maize alongside perennials and cover crops, combined with no-till farming, improved soil health by between 32% and 49% after 21 and 36 years of cultivation, respectively, in two regions of Canada. After 30 years of farming, the use of organic amendments promoted improvements in the number of earthworms, soil organic matter content, and aggregate stability in China and Europe [6]. In Switzerland, the use of farmyard manure over 37 years led to the annual accumulation of 4.4 mg/kg of soil carbon, improving microbial activity compared to mineral fertilization [7]. In Burkina Faso, 30 years of continuous cotton and cereal production negatively affected the main chemical characteristics of the soil (carbon, nitrogen, and phosphorus content; exchangeable bases; and cation exchange capacity), but recycling crop residues into compost or farmyard manure slowed this chemical degradation [8]. A meta-analysis focusing on vegetable cropping systems in Europe and America revealed that alternative management practices, such as soil amendments and the incorporation of cover crops, generally enhance the physical, chemical, and biological components of soil health without adversely impacting vegetable yields compared to conventional management practices [9].
In contrast to most cereal and tuber production systems in sub-Saharan Africa, which are implemented under low-input rainfed conditions, vegetable production is largely carried out under high-input irrigated conditions, especially in urban areas [10,11,12,13]. This places high demands on maintaining and improving soil [14]. However, the assessment of the sustainability of these production systems has often been limited to measuring plant biomass and yields and assessing a limited number of soil properties. In particular, to the best of our knowledge, the long-term effects of horticultural practices on soil health in sub-Saharan Africa have not been documented, although these production systems are of great concern because of their heavy reliance on pesticides and fertilizers and their frequent use of urban waste and polluted irrigation [12,13,15,16,17]. Therefore, there is a need to assess the impact of vegetable production practices on the health of urban garden soils in sub-Saharan Africa in order to guide appropriate actions and policies to ensure the sustainability of these production systems.
According to research [18], soil quality should ideally be assessed by monitoring indices of soil functioning. While such indices would best reflect the health of a soil, they are time-consuming to determine and require knowledge of reference values, which are difficult to obtain as they may vary according to the geographical area and objectives. Consequently, simpler methods have been developed for more routine use. In the study in [19], a robust statistical approach was proposed that involves selecting a minimum set of soil health data, normalizing the scores, and calculating a global soil health index. This framework has been widely adopted [20,21,22,23,24]. Given that sustainable soil management is more critical than ever in sub-Saharan Africa, and given the lack of long-term monitoring studies of urban garden soils, the objective of this research was therefore to assess the short- and long-term impacts of market gardening on soil health in sub-Saharan Africa.

2. Materials and Methods

2.1. Description of the Study Area

The 60 ha Kuinima market garden area (11°09′21.46″ N; 4°14′46.72″ W), located in Bobo-Dioulasso, was chosen for the study. Bobo-Dioulasso is the second-largest city in Burkina Faso, and the Kuinima site is the second-largest market garden site in Bobo-Dioulasso (Figure 1). Rainfall varies between 800 and 1200 mm (May–October), which is typical of the Southern Sudanese climatic zone.
This site was selected because it is one of the most important vegetable gardening sites in Bobo-Dioulasso. In addition, the site includes plots that have been managed for a wide range of durations, from 0 to over 50 years. Finally, the topography is quite flat (altitude between 441 and 478 m). An auger survey followed by the characterization of soil pits revealed a fairly homogeneous soil of the lixisol type [25].
Figure 1. Location and duration of cultivation of the sampled vegetable plots within the Kuinima site of Bobo-Dioulasso [26].
Soilsystems 09 00059 g001

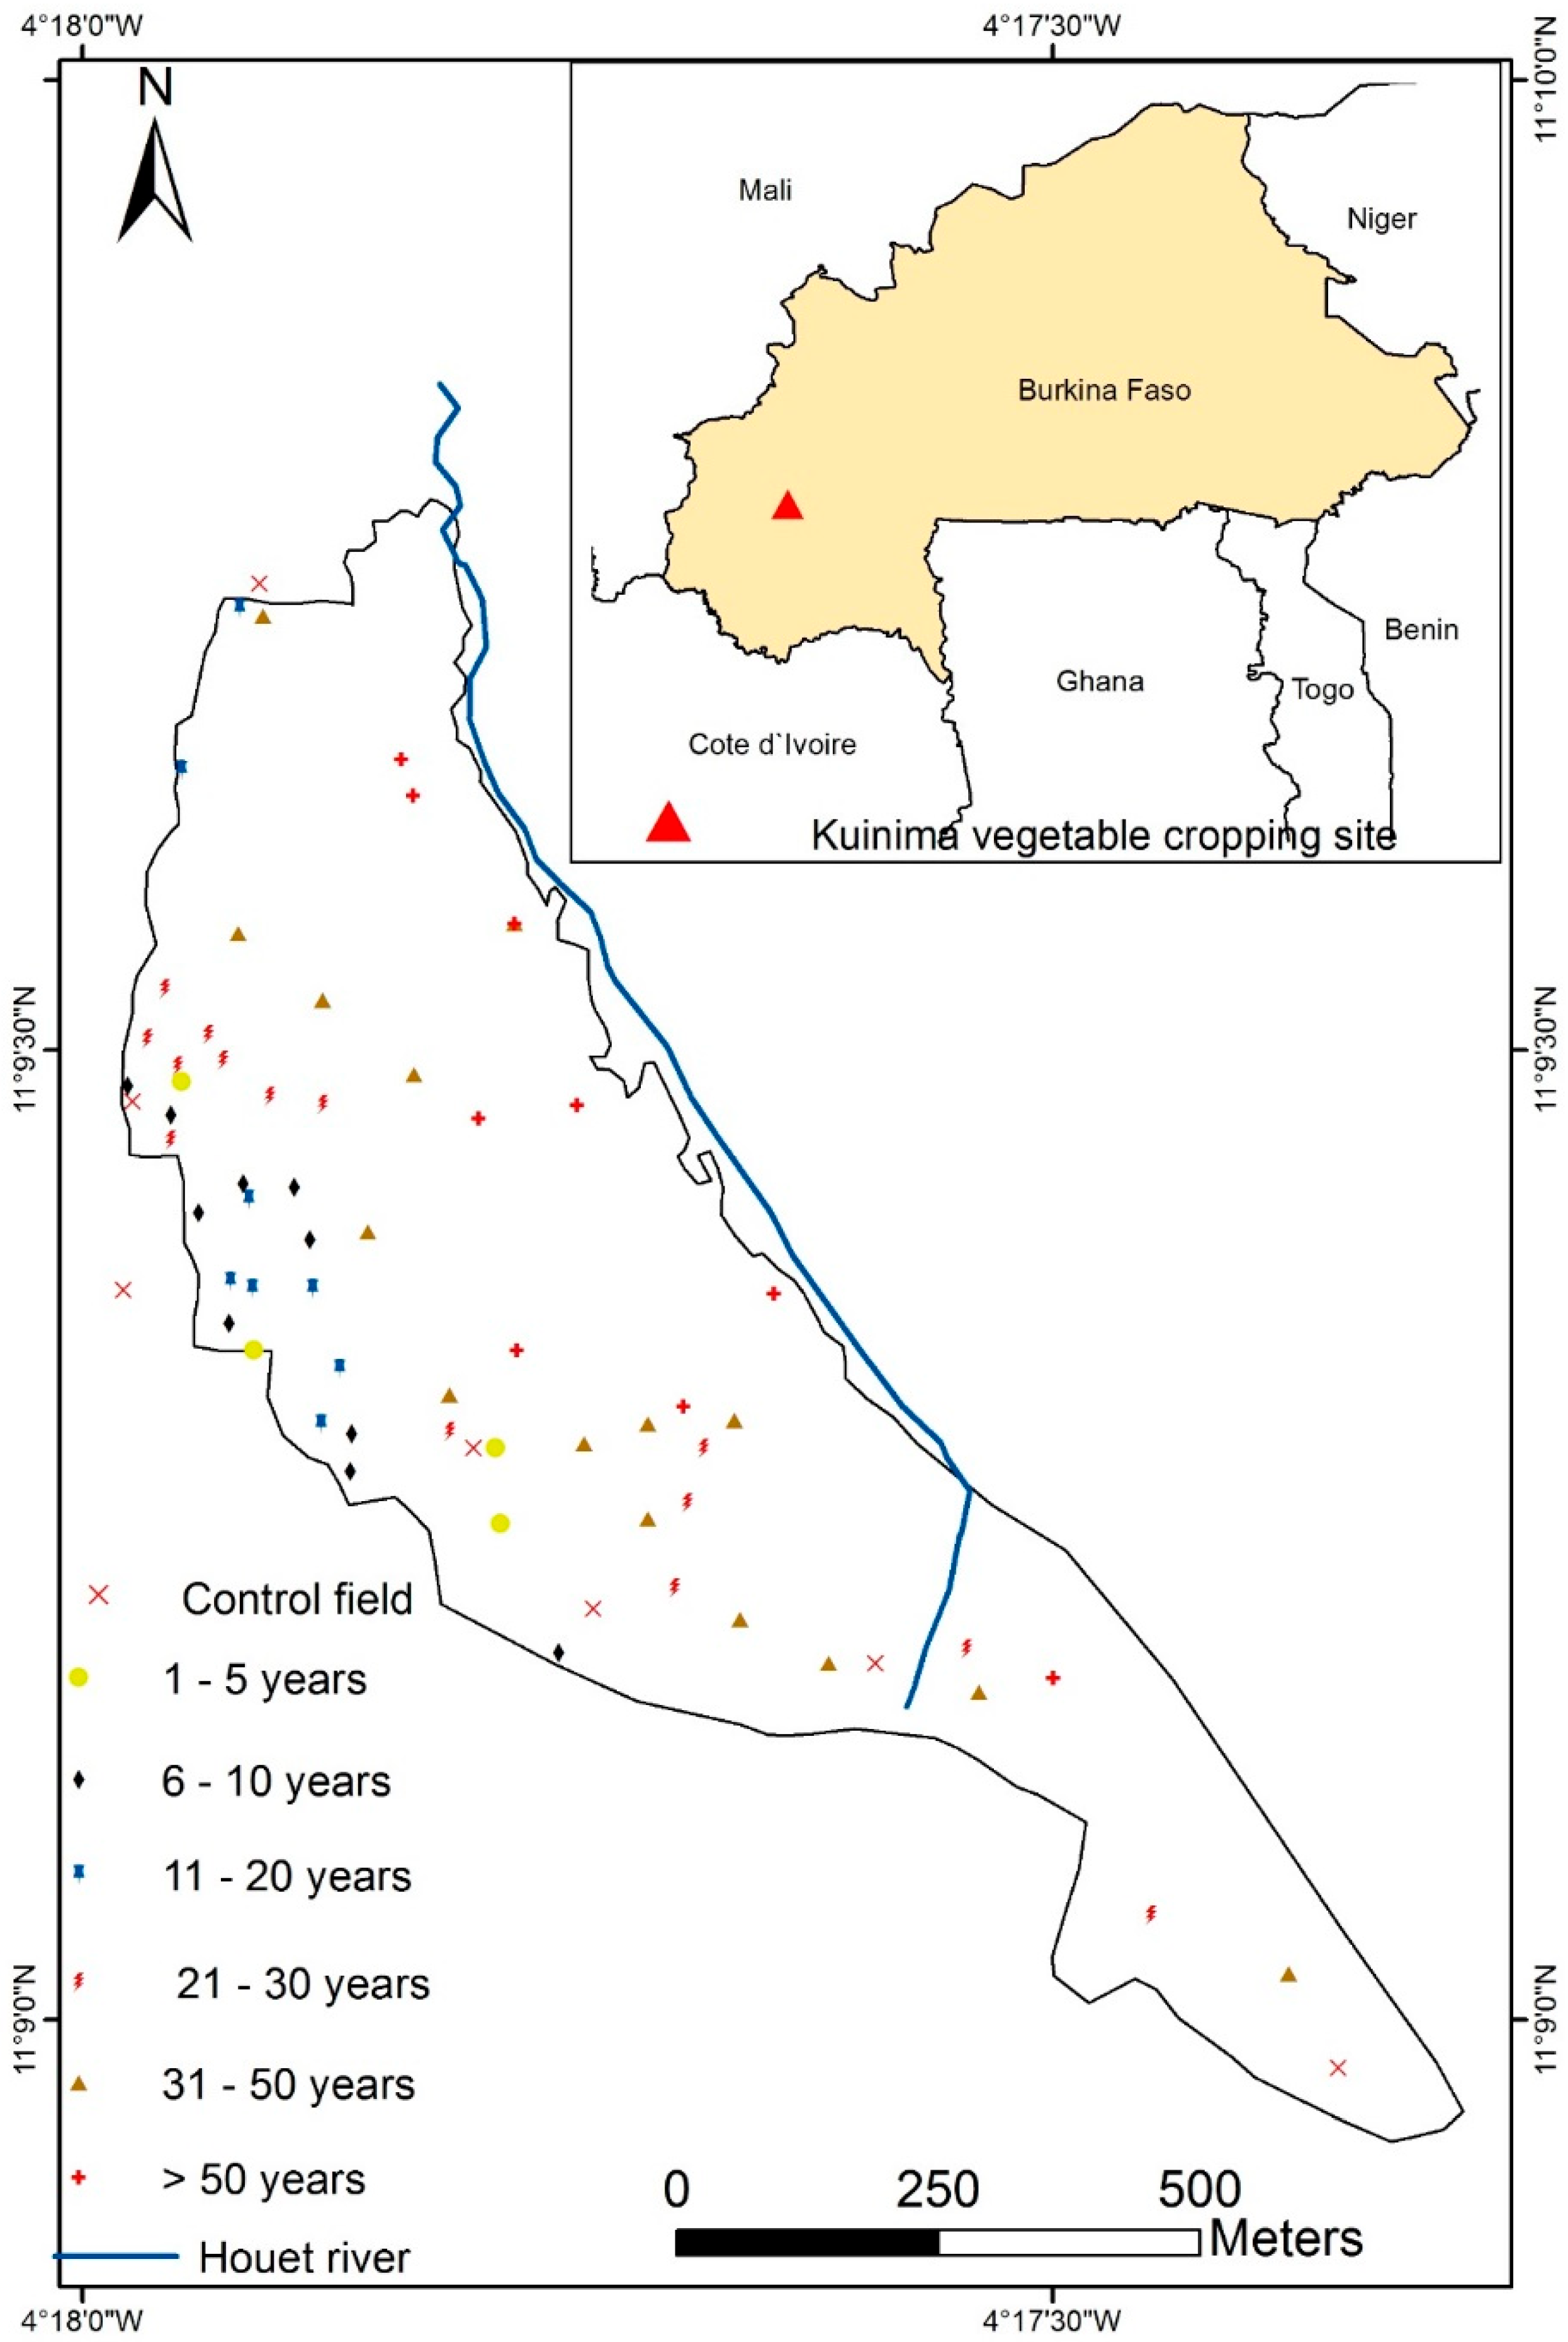
2.2. Field and Soil Sampling

Sixty-nine plots were sampled to cover a range of cultivation histories from 0 to >50 years (Figure 1). This was made possible by a prior investigation of the age and history of the fields based on farmer surveys. The plots were selected so as to be widely dispersed throughout the study area (Figure 1). Plots used as controls were those that had never been used for market gardening. Some of them had been used for rainfed annual production (Figure 1). Plots cultivated for more than 50 years were arbitrarily considered as 60 years old.
In each of the 69 plots, a subplot with homogeneous land cover and management was selected for soil sampling [26]. Then, in each subplot, five soil samples were taken from the 0–15 cm topsoil layer following the two diagonals. These samples were mixed to form a single composite sample and taken to the laboratory for chemical and biological analyses. For physical analyses, undisturbed soil samples were collected with 100 cm3 Kopecki rings at 4 random points per subplot between 5 and 10 cm depths. These samples were collected at least 2 weeks after the last tillage or weeding operation. As physical characterization is very time-consuming, this was performed in 18 out of 69 fields spanning across the full range of cultivation durations. Additional details regarding the site and sampling methodology can be found in [26].

2.3. Analysis of Soil Samples

2.3.1. Soil Texture and Chemical Parameters

The soil samples were shade-dried and then sieved using a 2 mm sieve. After the destruction of the soil organic matter and dispersion with Na-hexametaphosphate, a particle size analysis was performed using the wet sieving technique (particles > 50 µm) combined with sedimentation (particles < 50 µm). Electrical conductivity and the soil pH were measured in a soil/water suspension with a ratio of 1:2.5. Nitrogen (Ntot) and total carbon (Ctot) were measured using a Variomax dry-burning CN analyzer (Elementar Analysensystem GmbH, Frankfurt, Germany). Available phosphorus was measured by the Bray-1 method [27]. Exchangeable cations and the cation exchange capacity (CEC) were determined after the saturation of the exchange complex with a 1 M ammonium acetate solution (pH 7). Further details of the chemical analyses can be found in [28].

2.3.2. Enzymatic Activity

Enzymatic activity was measured through the colorimetric analysis (Genesys 20 spectrophotometer, Thermo Fisher Scientific, Waltham, MA, USA) of the products released by a given enzyme after incubation in an appropriate substrate under standard conditions. For the determination of betaglucosidase activity, the method described in [29] was used. It consists of using a para-nitro-phenyl-ß-D-glucopyranoside substrate with an incubation time of 2 h at 37 °C. Urease activity was determined under standard conditions (2 h at 37 °C) [30], using 2 M urea as a substrate. Acid phosphatase activity was measured using 15 mM p-nitrophenyl phosphate as a substrate in a modified universal buffer (MUB) under conditions of pH 6.5, incubated for 1 h at 37 °C [31]. The activity of fluorescein diacetate (FDA) was quantified with an FDA substrate, incubated for 1 h at 30 °C, according to the method described in [32].
Enzymatic activity values were expressed in micrograms of product per gram of dry soil per hour. Specific enzymatic activity values per unit of SOC or per unit of microbial biomass carbon were also calculated. For each field, the geometric mean of enzymatic activity (GME) was evaluated [33].

2.3.3. Biochemical Activity

Soil microbial biomass carbon (MBC) was measured on dry soil samples using the chloroform fumigation method, followed by the KCl extraction of alpha amino acids [34]. The amino N-alpha content was determined by the colorimetry of the amino-ninhydrin-alpha nitrogen complex using a Technicon (Seal-Analytical, Mequon, WI, USA) Auto-Analyzer 3 QuAAtro AQ 2. The amino N-alpha content of microbial biomass was obtained by subtracting the amino N-alpha content of fumigated samples from that of non-fumigated samples. The MBC content (µg g−1 dry soil) was obtained after multiplication by a factor of 21 [35]. The microbial quotient (Qmic) was evaluated as the ratio between the MBC content and Ctot [36].
Mineral NH4+ and NO3 content was measured simultaneously by continuous-flow colorimetry after extraction with KCl on non-fumigated dry samples using a Technicon (Seal-Analytical) Auto-Analyzer 3 QuAAtro AQ 2. Mineral N (Nmin) was obtained by summing the N-NH4+ and N-NO3 content.
Basal soil respiration (µg C-CO2 g−1 h−1 soil) was determined using a gas chromatograph (MTI Analytical Instruments P200, Richmond, CA, USA) equipped with a thermal conductivity detector. Dry soil samples were re-wetted to 80% of their water holding capacity and then stored in tightly sealed vials. The CO2 concentration was measured at the beginning and the vials were incubated in an oven at 28 °C (±0.5 °C). CO2 measurements were then taken at least once a day every 24 h for 7 days. The metabolic quotient (QCO2; µg C-CO2 per µg MBC) was obtained by dividing the basal respiration by the MBC [33].

2.3.4. Soil Physical Properties

Bulk density was calculated by dividing the dry solid mass (after drying at 105 °C for 48 h) by the sample volume (100 cm3). The retention curve was determined in the laboratory using an Eijkelkamp® sand–kaolin box and a pressure plate apparatus on undisturbed (for absolute suction head |h| < 5 m) and disturbed (for 10 m < |h| < 150 m) samples.
Macroporosity was calculated as the difference between the total porosity and the water content at h = −100 cm suction head, corresponding to pores >30 µm in diameter. Porosity ε (m3/m3) was calculated as follows:
ϵ = 1 ρ b ρ s
where ρb is the bulk density (kg/m3) and ρs is the particle density (kg/m3). The particle density was estimated as a function of the clay and SOC content using the regression equation proposed in [37].
The plant available water capacity was estimated by subtracting the volumetric water content at the permanent wilting point (pF = 4.2) from the volumetric water content at h = −100 cm (pF = 2). The saturated hydraulic conductivity (Ks; m/s) was determined on 100 cm3 undisturbed soil samples using an Eijkelkamp® constant head permeameter in the laboratory.

2.4. Evaluation of the Soil Health Index

The methodology of [19] was used in the present study to calculate the soil health index (SHI). This involves three main steps [38]: (i) the identification and selection of a minimum data set (MDS) of indicators to reduce data redundancy, (ii) the transformation of the selected indicators into scores, and (iii) the integration of the indicator scores into a comparative SHI. To select the MDS, standardized principal component analysis (PCA) and Pearson correlation tests were performed on all indicators [38]. Only principal components (PCs) with eigenvalues ≥ 1 and explaining at least 5% of the total variability were considered [19,39]. At the level of each PC, only those factors whose absolute load values did not exceed 10% of the highest factor load were considered as key indicators [19]. If several indicators were retained in a PC with this approach, the Pearson correlation coefficient was used in order to verify the strength of the correlations between the indicators [40]. Whenever the correlation coefficient between two variables was ≥0.6, only the most highly weighted indicator was used [19,39].
Following the selection of the MDS of indicators, a non-linear scoring function was used to transform the soil indicator values into scores ranging from 0 to 1. A sigmoidal function was used for this purpose (Equation (2)). Equation (2) has been widely [19,40,41,42].
S = 1 ( 1 + x x 0 b )
where S is the score of observation x for a given soil indicator, x is the indicator value, and x0 is the mean value of the soil indicator. Using the mean value ensures that the sigmoidal curve is centered on a normalized value of 0.5. b is the slope value of the equation. In the absence of site-specific slope values, values of −2.5 were used for a “more is better” curve (for most variables) and +2.5 for a “less is better” curve (i.e., electrical conductivity, C/N ratio, BD) [40,41,42].
Finally, the SHI (Equation (3)) was calculated using the indicator score and weight values as follows [19,40,41,42,43]:
SHI = i = 1 n S i W i
where Si is the indicator score calculated by Equation (2) and n is the number of indicators selected in the MDS. Wi is the weighting factor of the selected soil indicators, which was determined as follows. For each PC, a weighting factor was estimated by considering the ratio of the percentage of variance explained by the PC to the total variance explained by all PCs with eigenvalues ≥ 1 [19]. If only one variable was retained for a given PC, the weight of the variable was set equal to the weight of the PC.
If multiple variables were retained for a given PC, then the weight of each variable was considered equal to the weight of the PC divided by the number of variables retained, i.e., variables within a PC were weighted equally, ensuring that the sum of all weighting factors = 1. When multiple variables were retained within a given PC, adjusting the weight of each variable by the strength of its correlation with the PC was considered but not implemented because, due to the criteria used for variable selection, the correlation coefficients between the variables and the PC were necessarily similar (less than 10% deviation; see above). In addition, other previous studies have also used fixed weights for all variables retained in a given PC [19,41].
Using the methodology described above, we used two approaches to determine the MDS and calculate the SHI. The first approach was to perform separate PCAs for chemical, biological, and physical properties and then calculate the average of the chemical, biological, and physical SHIs (hereafter referred to as the mean SHI (SHImean)). The second approach was to calculate a global SHI by performing a single PCA on all indicators (SHIglobal). Both SHIs were calculated for the 18 fields for which the data sets were complete.

2.5. Statistical Analysis

Correlations between soil indicators were evaluated using the Pearson correlation test. Normalized principal component analysis (PCA) and other statistical analyses were performed using the XLSTAT software (2017 version). Descriptive and regression analyses were performed to describe soil characteristics and to analyze changes in soil health over time, respectively.

3. Results

3.1. Soil Chemical, Biological, and Physical Properties

The soil texture at the Kuinima site is predominantly sandy loam (Table 1). The total carbon content varied widely from low (0.5%) to very high (3.4%) (Table 1). The same trend was observed for Ntot. The CEC varied between 3.4 and 17.6 cmol+ kg−1 and the sum of exchangeable bases between 2.4 and 17.1 cmol+ kg−1. The available phosphorus also varied widely, from 21.3 to 169.3 mg kg−1. The pH values were, on average, close to neutral (mean = 6.6). Only three plots had a pH < 5.5. The soils were not saline (EC < 255 µS cm−1).
Enzymatic activity varied considerably among the plots. Betaglucosidase ranged from 11 to 66.5 µg g−1 h−1, with a mean of 34.3 µg g−1 h−1. Phosphatase had values between 57 and 280 µg g−1 h−1, with a mean of 177.9 µg g−1 h−1 (Table 1). FDA activity ranged between 50.9 and 217.9 µg g−1 h−1, whereas the urease levels ranged from 175 to 830 µg g−1 h−1 (Table 1). The resulting GME ranged from 65 to 212 µg g−1 h−1.
Respiratory activity ranged from 0.39 to 2 µg C-CO2 g−1 h−1, while the MBC varied from 12 to 114 µg g−1 (Table 1). An average QCO2 of 0.03 µg C-CO2 µg−1MBC h−1 was found, with minimum and maximum values of 0.005 and 0.08 µg C-CO2 µg−1MBC h−1, respectively. Qmic varied from 0.6 to 9.9 mg g−1, with a mean of 2.9 mg g−1.
The NH4+ content was low (mean = 6.27 µg g−1) compared to NO3 (mean = 41.84 µg g−1; Table 1). The ratio of Nmin to total N varied from 1.6 to 8.5 mg g−1, while the C/N ratio ranged from 10 to 16.
The bulk density varied between 1.05 and 1.34 g cm−3, while the plant available water capacity ranged between 14 and 26%. The macroporosity was high and varied between 22 and 37%. The saturated hydraulic conductivity averaged 1.5 × 10⁻⁵ m s−1 (Table 1).
Compared to the control plots, most of the investigated properties improved with the number of years of cultivation, as can be observed from the significant correlations between many individual variables and the duration of cultivation (Table S1).

3.2. Selection of Indicators

For the soil chemical indicators, the first four PCs were selected. Together, these four PCs explained 95% of the total variance (Table S2). The indicators with high loadings were the CEC, Ntot, and Ctot in the first PC (PC-1), but only the CEC was retained due to the strong correlations between these three indicators (Table S1). In PC-2, PC-3, and PC-4, the pH, P-Bray, and electrical conductivity were selected due to their high loadings (Table S1). Based on the weight of each PC (Table S2), the chemical SHI was calculated as follows (Equation (4)):
S H I c h e m = 0.59 C E C + 0.20 p H + 0.13 P   B r a y + 0.07 e l e c t r i c a l   c o n d u c t i v i t y
For the soil biological indicators, the first three PCs with eigenvalues ≥ 1 explained 70% of the total variance (Table S3). In PC-1, GME was retained. In PC-2, the QCO2, Nmin/Ntot ratio, and MBC were highly weighted, but the MBC was not retained because it was highly correlated with the QCO2 (Table S1). For PC-3, the C/N ratio was retained. Based on the weight of each PC (Table S3), the resulting equation for the calculation of the biological SHI is given by Equation (5):
S H I b i o l = 0.51 G M E + 0.16 Q C O 2 + 0.16 N m i n N t o t + 0.17 C N
For the soil physical indicators, the first three PCs all had eigenvalues ≥ 1 (Table S4). Together, they explained 82% of the total variance. PAWC was retained in the first PC. Silt content had a high factor loading for PC-1, but was not retained due to its strong correlation with PAWC. Bulk density and clay content were retained in PC-2 and PC-3, respectively. Based on the weight of each PC (Table S4), the calculation of the physical SHI is given by Equation (6):
S H I p h y s = 0.44 P A W C + 0.37 B D + 0.19 C l a y
When the PCA was performed on all indicators combined (chemical, biological, physical), the first six PCs with eigenvalues ≥ 1 explained 85% of the total variance (Table S5). In PC-1, the CEC, Ctot, and Ntot had high factor loadings, but only the CEC was selected due to the strong correlations between the variables (Table S1). In PC-2, the macroporosity (Macpo), FDA, and bulk density had high factor loadings, but the bulk density was not retained due to its strong correlation with the macroporosity (Table S1). Nmin/Not was retained in PC-3, while phosphatase and NH4+ were selected for PC-4. For the fifth PC, the pH, Qmic, and Ks were selected. Finally, the clay content and PAWC were selected in PC-6. For the global SHI, the calculation of the SHI is given by Equation (7), using the weights of each PC provided in Table S5.
S H I g l o b a l = 0.40 C E C + 0.095 F D A + 0.095 M a c p o + 0.15 N m i n N t o t + 0.075 p h o s p h a t a s e + 0.075 N H 4 + + 0.03 p H + 0.03 Q m i c + 0.03 K s + 0.025 C l a y + 0.025 P A W C
Both approaches (SHIglobal and SHImean) resulted in the selection of 11 indicators for the MDS out of a total of 26. Both approaches had five variables in common: CEC, pH, Nmin/Ntot, PAWC, and clay content. For the remaining six indicators of the MDS, the two approaches led to the selection of very different indicators: P Bray, EC, GME, QCO2, C/N, and bulk density were selected for SHImean, while FDA, phosphatase, NH4+, Qmic, macroporosity, and Ks were selected for SHIglobal.

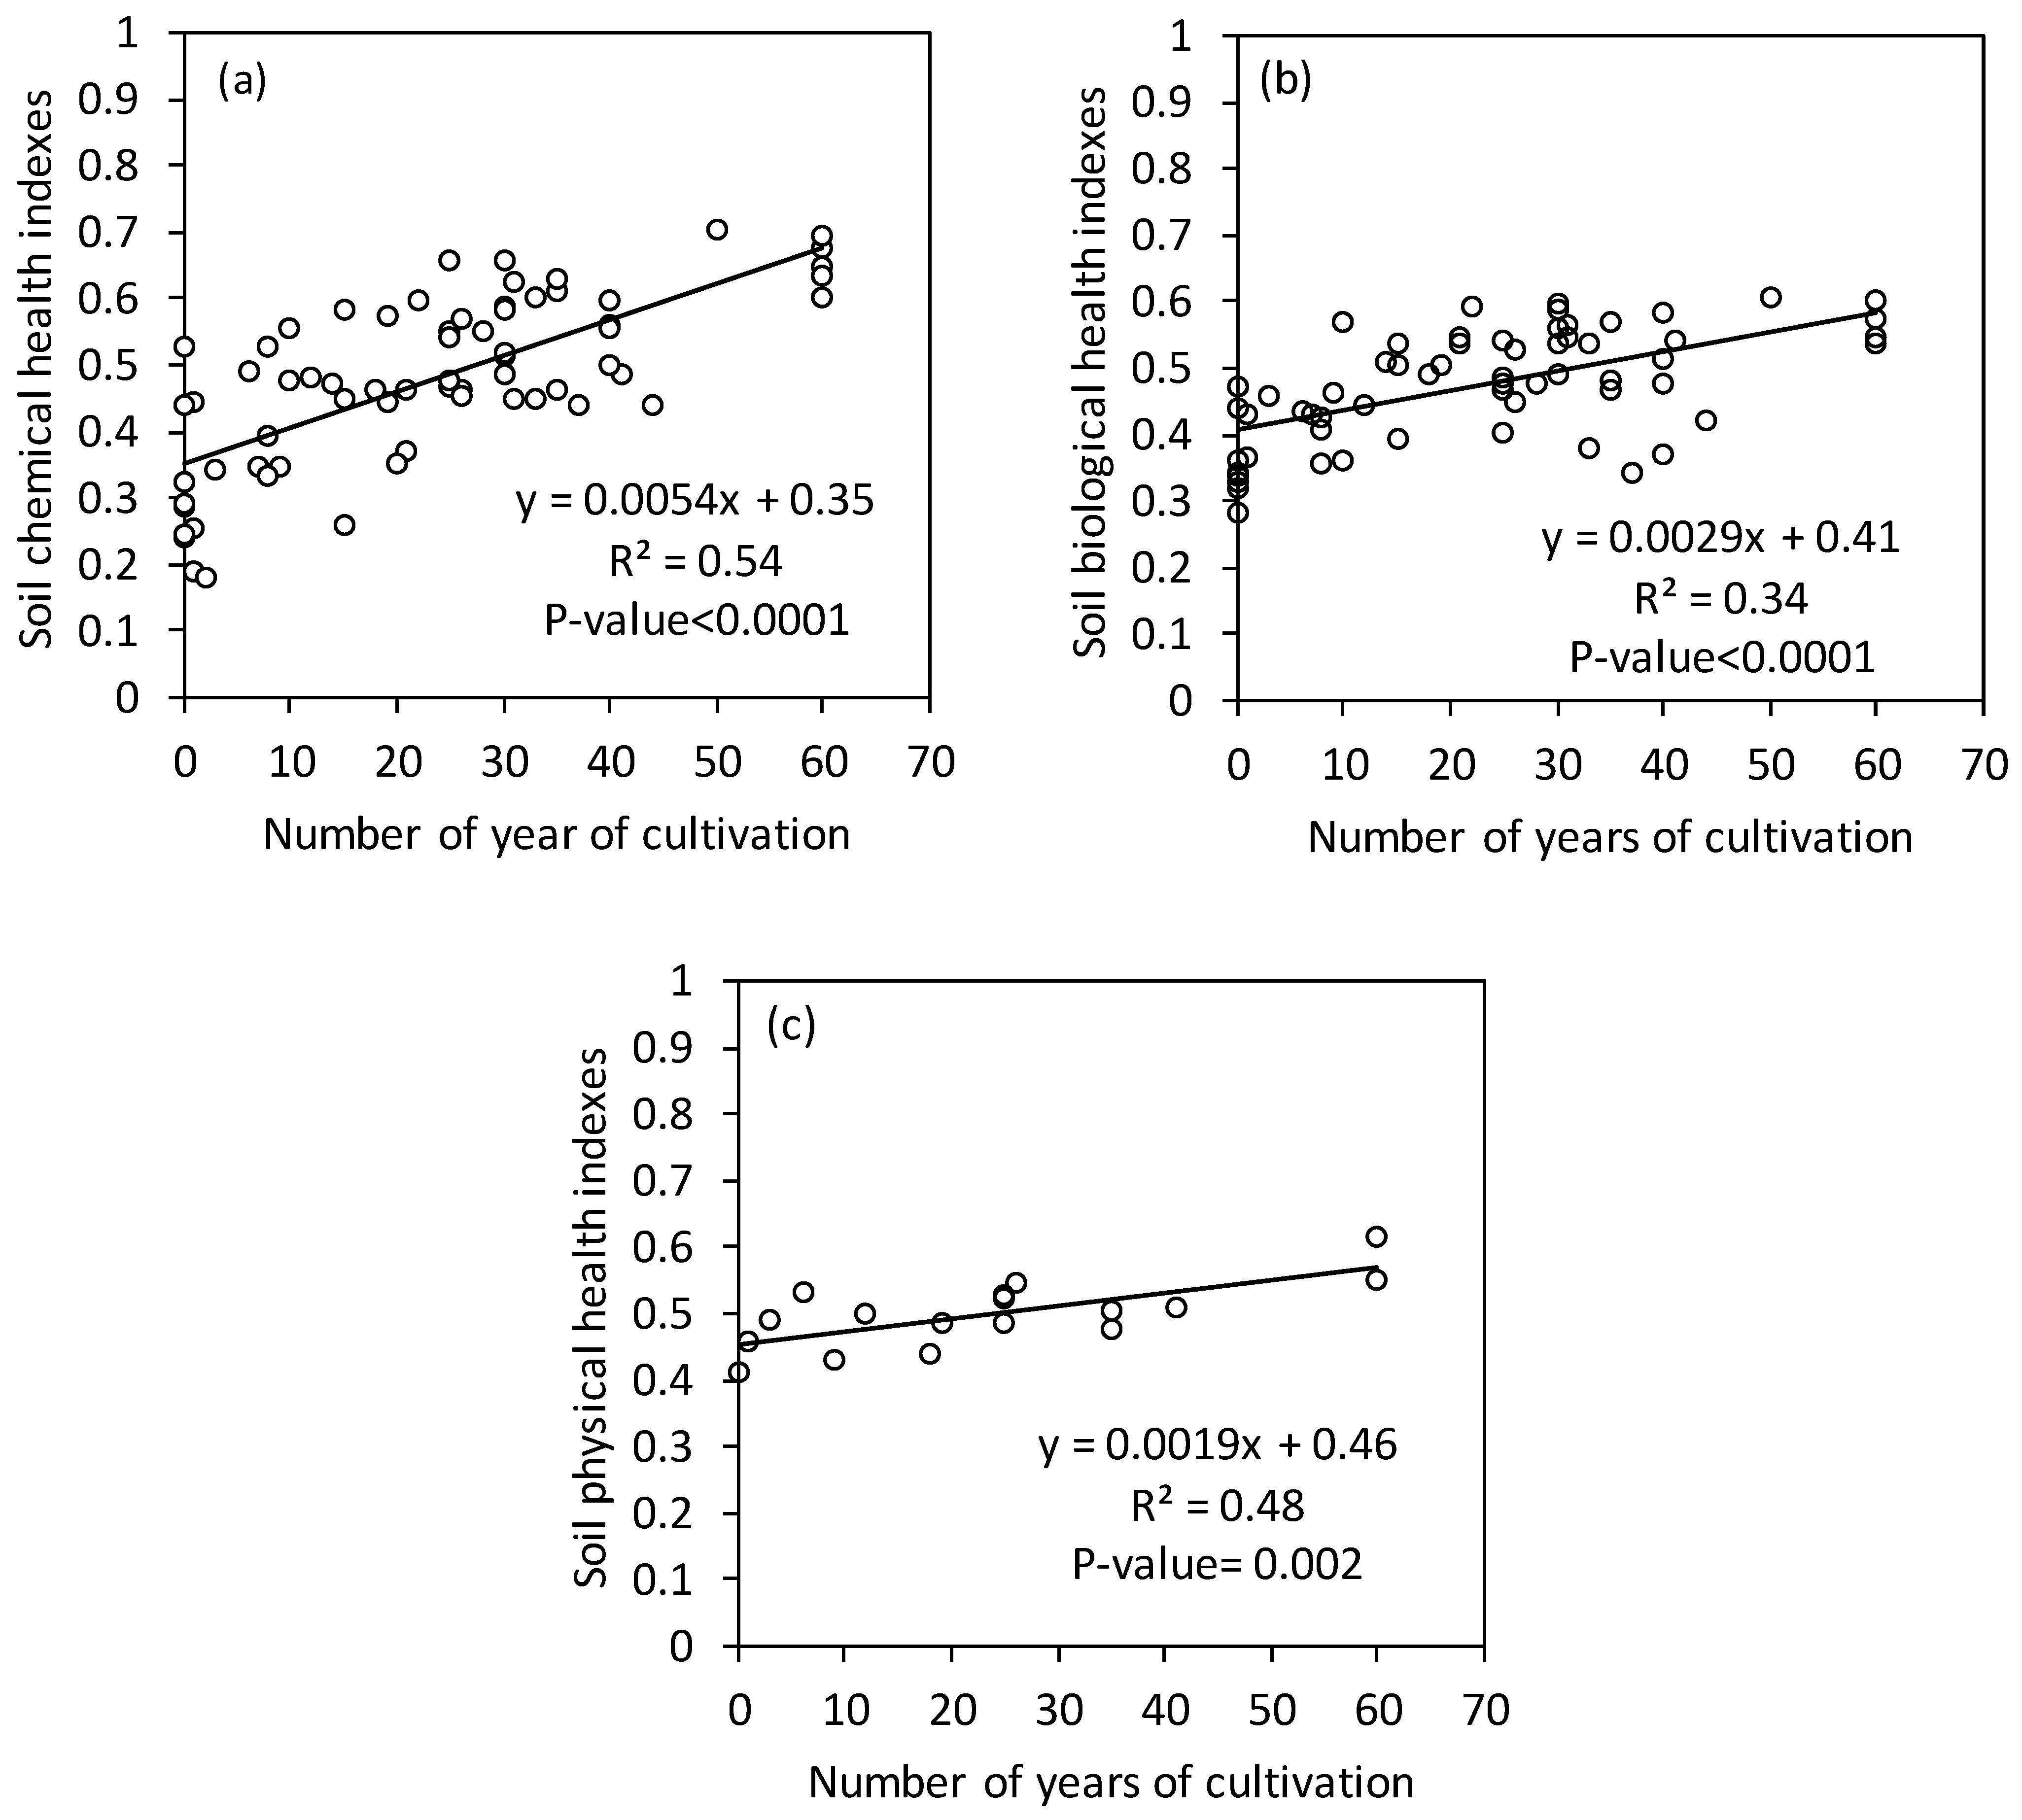
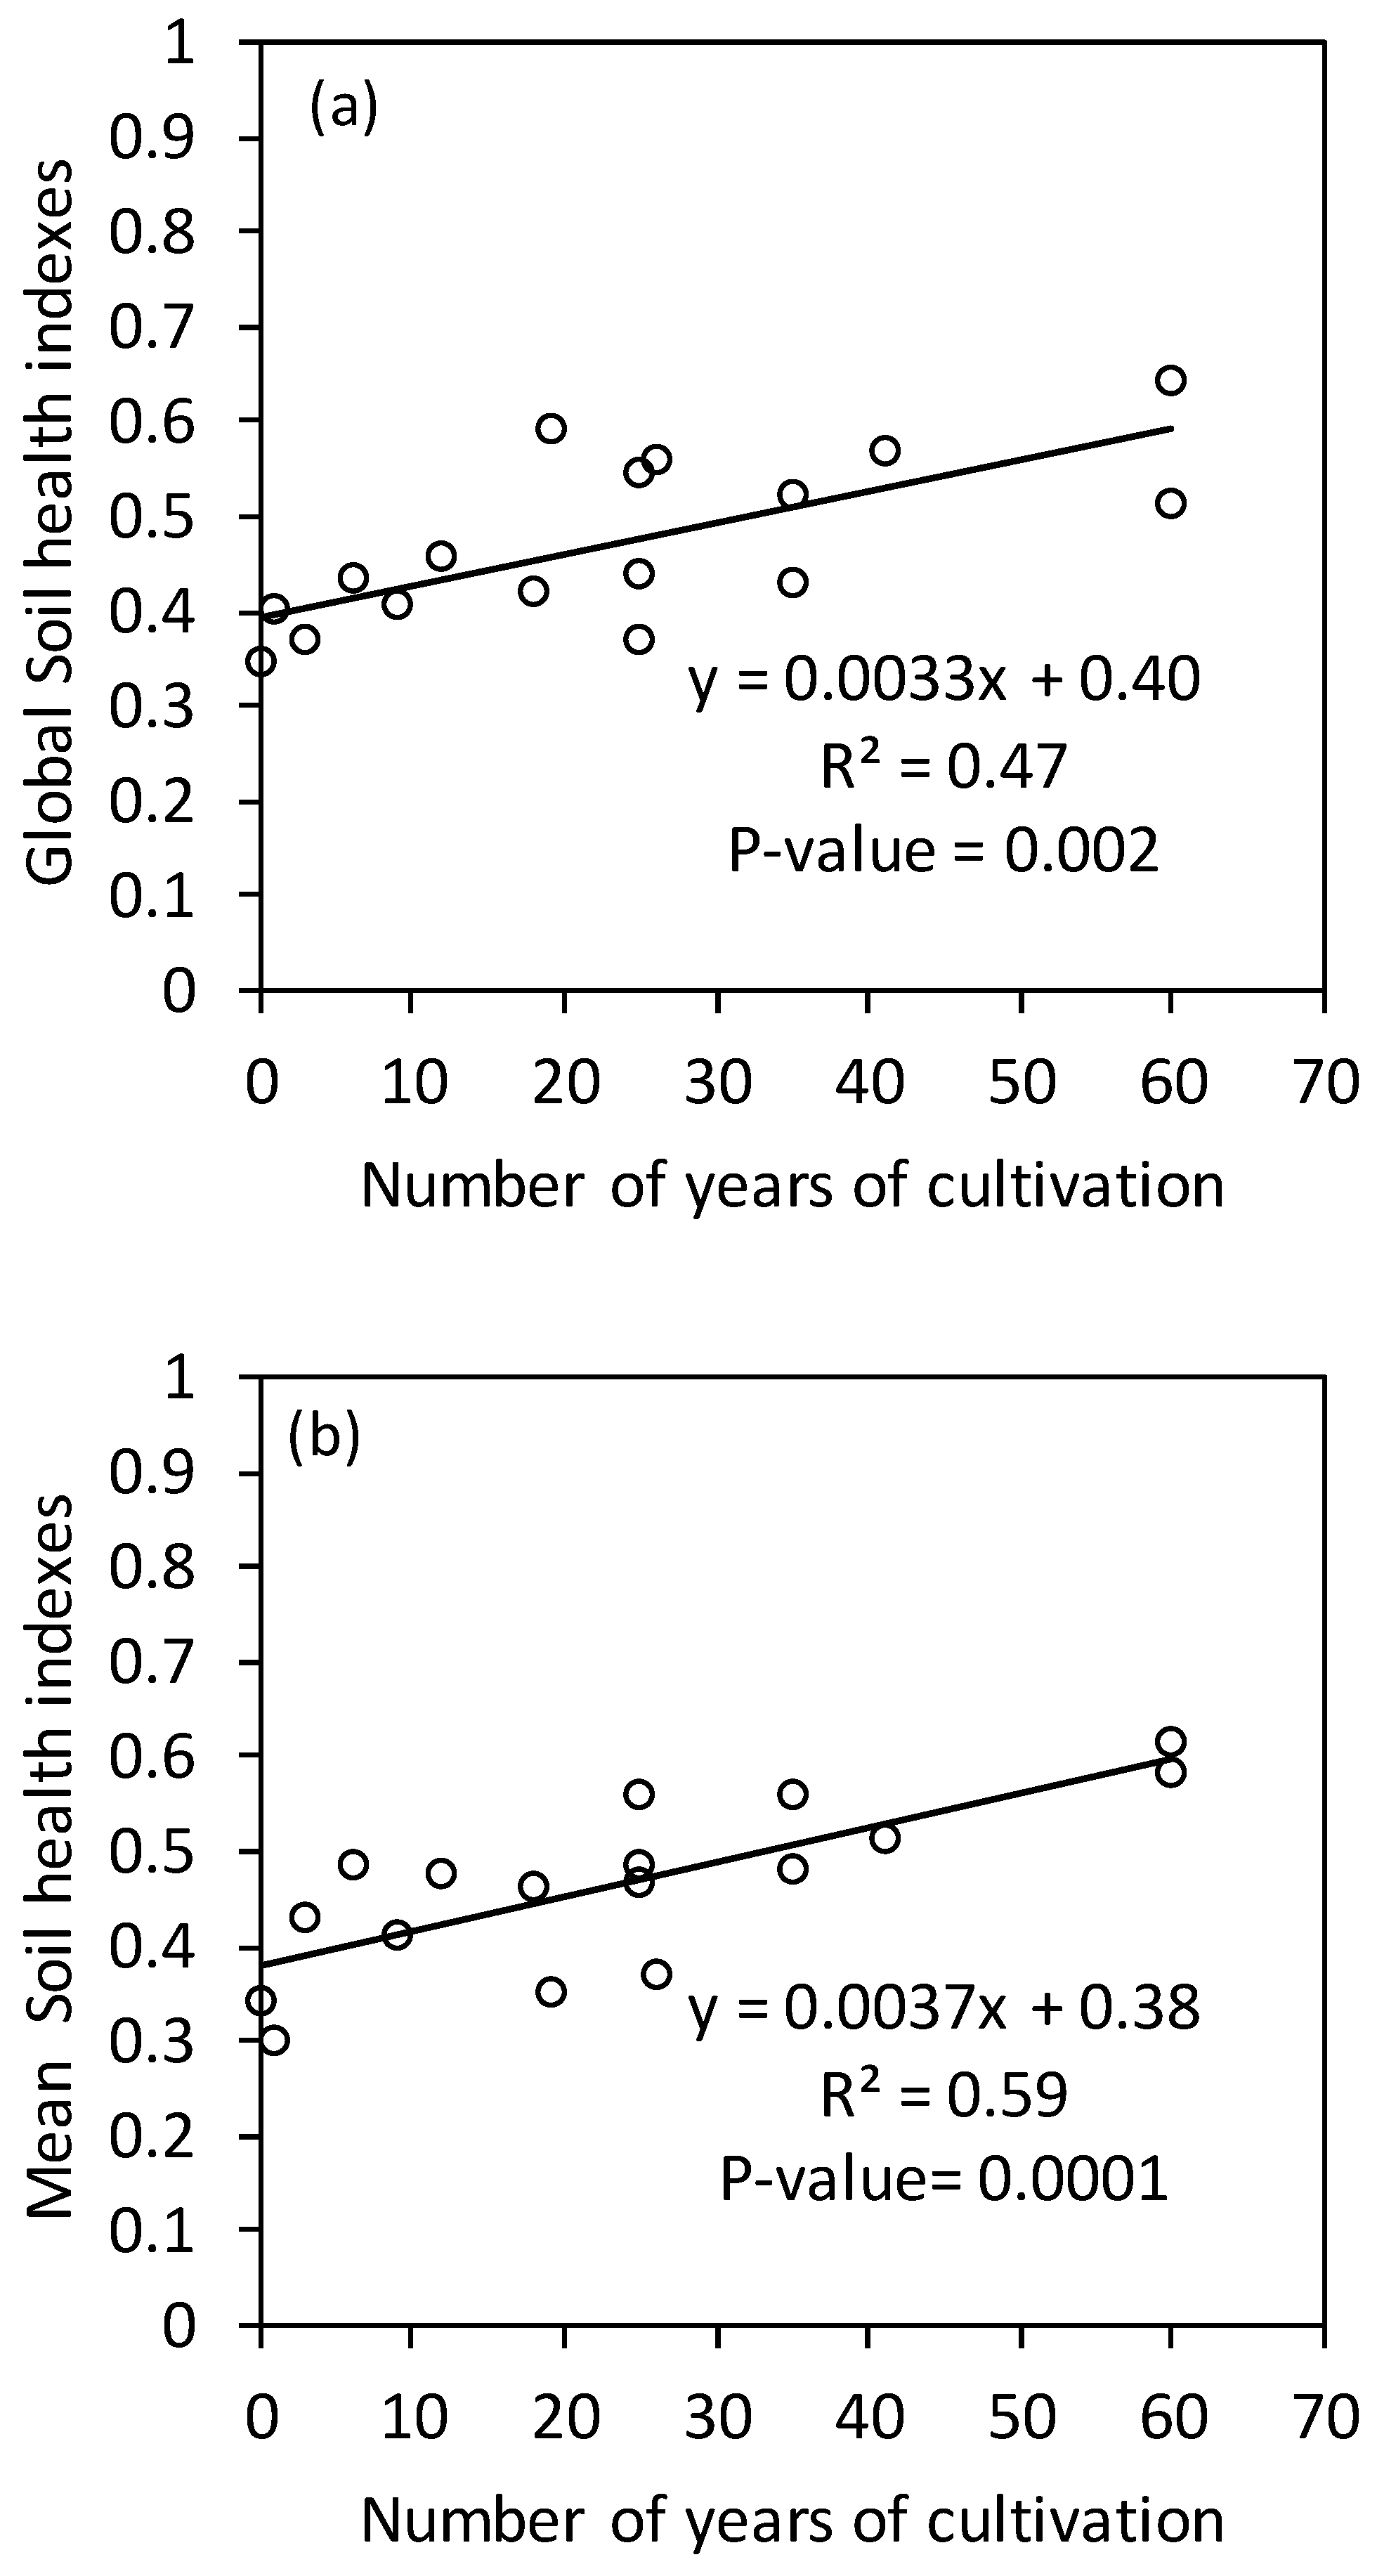
3.3. Effects of the Duration of Cultivation on the Soil Health Index

The chemical, biological, and physical quality indices all improved with the number of years of production, showing a significant (p < 0.002) linear trend (Figure 2). SHIchem almost doubled, increasing from an average of 0.35 for 0 years of cultivation to an average of 0.67 after 60 years of cultivation (Figure 2a). Although not as strongly as SHIchem, SHIbiol also increased from a mean of 0.41 for 0 years of cultivation to a mean of 0.58 after 60 years (Figure 2b). For both indices, large variability was observed relative to the mean trend (RMSE = 0.10 for SHIchem and RMSE = 0.07 for SHIbiol). Compared to the chemical and biological SHIs, the increase in the physical SHI was the slowest, from a mean of 0.46 for 0 years of cultivation to a mean of 0.57 after 60 years. For SHIphys, the variability (RMSE = 0.04) was lower than for SHIchem and SHIbiol.
Both the global soil health index and the mean soil health index improved significantly with the number of years of cultivation, showing a linear trend (Figure 3). However, the mean SHI appears to be slightly more sensitive (greater slope of the linear regression) than the global SHI. In addition, the duration of cultivation explained a larger proportion of the total variance in the case of SHImean (R2 = 0.59) compared to SHIglobal (R2 = 0.47). The level of variability relative to the mean trend was similar for the mean and global SHIs, with RMSE = 0.06 in both cases.
The global and mean SHIs were significantly correlated, although not very strongly (r = 0.51; Table 2). Finally, SHIbiol was very strongly correlated with SHIchem (r = 0.78) but much less correlated with SHIphys (r = 0.48). The global SHI was correlated most strongly with SHIchem and least strongly with SHIphys, whereas the mean SHI was correlated equally with all three components.

4. Discussion

4.1. Soil Chemical, Biological, and Physical Characteristics

During this study, we hypothesized that the site was homogeneous at the outset and that the control plots were representative of the site as a whole in terms of initial values. Compared to the control plots, most of the investigated properties improved with the number of years of cultivation. The increase in the Ctot and Ntot content with the number of years of cultivation can be attributed to the frequent and large inputs of organic amendments [26]. In [12], the rate of organic inputs in urban vegetable production sites was estimated at an average of 51 t DM ha−1 year−1, not accounting for the roots that remain in the soil after each harvest. In tropical soils dominated by low-activity clay (kaolinite), the SOM content is the main factor influencing the CEC [44]. Therefore, the increase in Ctot probably explains the large increase in CEC over time, which is also supported by the strong correlation between the CEC and Ctot. Although not significant, the soil pH also tended to increase over time, possibly because of the large application rates of composted material, often of near-neutral pH, on soils that were inherently slightly acidic. The organic amendments probably also helped to buffer the acidification that can result from high application rates of mineral N fertilizers. Ref. [12] reported annual fertilizer N inputs of 1274 kg N ha−1. In parallel with the increase in Ctot and CEC, the exchangeable bases also increased. The high inputs of mineral P fertilizers [12] and the high SOM content can largely explain the large increase in the available P content. In addition, the regular application of large amounts of organic amendments and the near-neutral soil pH may have limited P immobilization by Fe and Al oxides, a common problem in highly weathered tropical soils [45].
Organic amendments improved most biological indicators. It has been widely documented that the addition of organic amendments significantly improves various indicators of biological activity [46,47,48,49,50]. This is supported by the strong correlations between Ctot and most biological indicators. Thus, even though all producers use pesticides regularly and often at high rates [12], it appears that any potentially deleterious effects of practices such as intensive pesticide use are outweighed by the benefits of increased C availability in the present situation. A notable exception to the overall positive trend is the C/N ratio, which tended to increase with increasing production time. The organic amendments used by the farmers have C/N ratios between 15.5 and 21.3 [12]. These values are adequate for use as soil amendments and therefore do not seem to explain the increase in the C/N ratio of SOM. The increase in the C/N ratio may result from the fact that the amounts exceed the capacity of the microorganisms to transform the organic amendments into SOM, either because of insufficient N availability or because of other limiting factors affecting the biological activity. Although the MBC and, even more so, microbial respiration increased with increasing Ctot (Table S1), the microbial biomass per unit SOC tended to decrease with increasing carbon content (and duration of cultivation), which seems to indicate a limitation in the capacity of soil microorganisms to transform the added organic amendments. Finally, the high SOM content also had a positive effect on the soil physical properties (Table S1). Such positive effects of organic amendments on soil physical quality have been well documented in other contexts [14].
Some variables commonly reported in soil health studies were not included in this study, such as the aggregate stability, exchangeable aluminum, and indicators of heavy metal contamination [23]. Several studies have reported heavy metal contamination in urban vegetable production sites in developing countries [17,51]. This contamination results from polluted urban recycled water used as a soil amendment, as well as industrial wastewater used for irrigation. However, Ref. [51] investigated a market gardening site in Bobo-Dioulasso and found that the heavy metal concentrations were low compared to the safety threshold for arable soils. Although the site investigated in [51] was different from Kuinima, it was also an intensive vegetable production site within the same city. In addition, the river adjacent to the Kuinima site does not discharge water from industrial sites, and farmers in Kuinima now use only well water for irrigation, so contamination from wastewater seems unlikely. Therefore, given the findings of [51] and the high cost of analysis, heavy metal concentrations were not investigated. Exchangeable Al3+ was not measured independently. However, the presence of exchangeable Al3+ becomes significant only at pH < 5.5 [52]. Only three sampled plots had pH < 5.5. In addition, for plots with pH < 5.5, exchangeable Al3+ is expected to be strongly correlated with the pH, with the latter being part of the MDS for both SHIs. Including exchangeable Al3+ would thus have been redundant. Moreover, the pH is a more versatile variable, providing indications regarding not only exchangeable Al3+ but also micronutrient availability [53].

4.2. Principal Component Analysis

The standard methodology used to determine the MDS allowed a 58% reduction in the number of variables required to calculate both the mean and global SHIs. Since the GME used in the mean SHI actually includes four different enzymes’ activity (betaglucosidase, phosphatase, urease, FDA), the global SHI, based on 11 variables, nevertheless appears to be more efficient in terms of data requirements than the mean SHI, which effectively requires the characterization of 14 variables. Both approaches resulted in the selection of chemical, biological, and physical variables, even though no constraints were applied to ensure this in the case of the global SHI. Nevertheless, the two approaches differed in the selection of variables for about half of the indicators, especially in terms of the selection of biological indicators.
Although Ctot and Ntot are good indicators of soil health [54], they were not included in the SHIs despite their high weight (Table S1). In fact, Ctot and Ntot are both highly correlated with the CEC (Table S1), which was included in both SHIs. The fact that Ctot was not explicitly retained for the calculation of the SHIs does not, however, invalidate the results of previous studies. Indeed, Ctot is strongly correlated with the mean SHI (r = 0.75) and the global SHI (r = 0.82). Although the loading of CEC in the present study was slightly higher than that of Ctot and Ntot (Table S2), thereby justifying its use in the calculation of SHIchem, it could be argued that Ctot should be used for practical applications because it is easier and cheaper to measure than the CEC.

4.3. Evolution of the Soil Health Index

Regardless of the approach used to calculate the SHI, a steady improvement in soil health is observed as the duration of cultivation increases. This can be attributed to the large inputs of organic amendments [55], which serve as a source of organic carbon for soil microorganisms and contribute to improvements in other soil health components. The relative improvement in soil health between 0 and 60 years appears to be strongest in the chemical SHI, followed by the biological and physical SHIs. This appears to be largely related to the nature of the variables used for each of the three components. This is also reflected in the minimum and maximum values of the variables. Accordingly, one would expect the soil biological and chemical indices to be more influenced by changes in soil health than the soil physical indices.
Despite the fact that the global and average SHIs are based on different indicators for more than half of their MDS, they evolve similarly. This can be attributed to the strong interdependence between the different indicators (Table S1), as already noted in [56] in different contexts. Nevertheless, the correlation between the mean and global SHIs is not very strong (r = 0.51), indicating that they convey different information to some extent.
For many individual indicators, considerable unexplained variability remained between plots after removing the temporal trend. This variability is likely due to the wide variety of crops and management practices used by farmers [12]. Aggregating the data at the level of the SHI reduced the unexplained variability. This greater robustness of the SHI compared to individual indicators would be an additional advantage when using the SHI to compare the impacts of agricultural practices on soil health, for example.
Although the global and mean SHIs evolve similarly over time, the use of the mean SHI seems preferable to the global SHI, even though the former requires a slightly larger number of analyses. This is because the former, by definition, explicitly integrates the three components of soil health. Although the global SHI also integrates variables from the three components, it appears to be most strongly driven by the chemical component. In addition, although the variability around the mean linear trend is similar for both approaches, the linear increase in soil health over time explains more of the total variance in the mean SHI than the global SHI, which may indicate the greater robustness of the former approach. Finally, the three components of the mean SHI can be analyzed separately, allowing a more refined interpretation of the effects of management practices.

4.4. SHI Methodology

Most authors agree on the main steps of soil health analysis [19,23]. The selection of MDS can be performed either by expert judgement [38] or by statistical methods [19]. These two approaches have been validated in [57]. However, Ref. [58] found that statistical models improved the prediction compared to expert judgment models. Furthermore, Ref. [23] argued that the method based on expert judgment may lack methodological transparency, which may compromise its application.
Regarding the standardization of scores, both linear and nonlinear functions have been used in the literature, but the representation of the functionality of many indicators seems to be better with nonlinear functions [57]. This justifies our use of a sigmoidal function with a higher (“more is better”) or lower (“less is better”) asymptote, depending on the variable. In the specific case of the soil pH, a bell-shaped function with an optimum between 6.3 and 7.2 might seem more appropriate [59], but, since the pH exceeded this optimum range in only a few cases, the use of a “more is better” sigmoidal function seemed appropriate.
In addition to the choice of the normalization function, additional hypotheses were determined regarding the centering of the sigmoidal function and its slope. These hypotheses are consistent with previous studies [40,41,42,43]. Nevertheless, the positioning and shape of the sigmoidal function should ideally be based on reference values and local knowledge. However, there is currently insufficient knowledge about biological activity indicators to define site-specific response functions. In addition, the optimal indicator values may be crop-dependent, yet a wide variety of crops are grown in urban vegetable garden sites [12]. Therefore, more effort should be made in the future to establish reference values and response functions for the assessment of soil health for vegetable production systems in weathered tropical soils.

5. Conclusions

Two soil health indices were calculated for urban vegetable soils using the standardized PCA method. Regardless of the approach used to calculate the index, the results showed a continuous improvement in soil health with the number of years of cultivation. This was attributed to the intensive use of organic amendments in these systems and suggests that urban gardening practices have a positive effect on soil health, despite the intensive use of chemical inputs.
Both methods of calculating the soil health index lead to a similar reduction in the number of indicators required for the minimum data set. However, about half of the selected indicators differ between the two approaches. Despite the high similarity between the two SHIs, calculating an average soil health index seems preferable as it reflects the three components of soil health in a more balanced way and explains a larger proportion of the temporal variability. To improve the methodology, reference values and indicator response functions should be established for the selected variables for tropical soils.

Supplementary Materials

The following supporting information can be downloaded at: https://www.mdpi.com/article/10.3390/soilsystems9020059/s1, Table S1: Correlation matrix between soil characteristics; Table S2: Result of principal component analysis of soil chemical indicators of vegetable fields to define the soil chemical health index (SHIchem); Table S3: Result of principal component analysis of soil biological indicators of vegetable fields to define the soil biological health index (SHIbiol); Table S4: Result of the principal component analysis of the soil physical indicators of the vegetable fields to define the soil physical health index (SHIphys); Table S5: Result of the principal component analysis of the chemical, biological and physical soil health indicators of the vegetable fields to define the global soil health index (SHIglobal).

Author Contributions

Conceptualization, R.A.O., C.L.B., F.C.K. and L.C.; methodology, R.A.O., C.L.B., F.C.K. and L.C.; validation, C.L.B., F.C.K. and L.C.; data collection, R.A.O.; supervision and validation of biological analyses, L.C.; data curation, R.A.O.; writing—original draft preparation, R.A.O. and C.L.B.; writing—review and editing, R.A.O., C.L.B., F.C.K. and L.C.; visualization, C.L.B., F.C.K. and L.C.; supervision, C.L.B., F.C.K. and L.C.; project administration, F.C.K.; funding acquisition, C.L.B. and F.C.K. All authors have read and agreed to the published version of the manuscript.

Funding

This research was funded by the “Academie de recherche et d’enseignement supérieur” (ARES-CCD).

Institutional Review Board Statement

Not applicable.

Informed Consent Statement

Not applicable.

Data Availability Statement

Data are available upon request from the corresponding author.

Acknowledgments

The authors would like to thank the LAMA laboratory, IRD US IMAGO, Dakar; Savadogo Idrissa (IRSAT); Lydie Lardy, Moustapha Sanè, Mahécor Diouf, and Lamine Dieng (LMI-IESOL); Sié Amoro Ouattara and Mamourou Ouattara (INERA); Marco Bravin (UCLouvain); the “Féderation des Producteurs et Productrices Agricoles du Burkina Faso” (FEPAB); and all of the vegetable producers in Kuinima for their support and availability.

Conflicts of Interest

The authors have no conflicts of interest.

References

  1. Lehmann, J.; Bossio, D.A.; Kögel-Knabner, I.; Rillig, M.C. The concept and future prospects of soil health. Nat. Rev. Earth Environ. 2020, 1, 544–553. [Google Scholar] [CrossRef]
  2. Wienhold, B.J.; Andrews, S.S.; Karlen, D.L. Soil Quality: A Review of the Science and Experiences in the USA. Environ. Geochem. Health 2004, 26, 89–95. [Google Scholar] [CrossRef] [PubMed]
  3. Muñoz-Rojas, M. Soil quality indicators: Critical tools in ecosystem restoration. Curr. Opin. Environ. Sci. Heal. 2018, 5, 47–52. [Google Scholar] [CrossRef]
  4. Granatstein, D.; Bezdicek, D.F. The Need for a Soil Quality Index: Local and Regional Perspectives. Am. J. Altern. Agric. 1992, 7, 12–16. [Google Scholar] [CrossRef]
  5. Chahal, I.; Hooker, D.C.; Deen, B.; Janovicek, K.; Eerd, L.L. Van. Soil & Tillage Research Long-term effects of crop rotation, tillage, and fertilizer nitrogen on soil health indicators and crop productivity in a temperate climate. Soil Tillage Res. 2021, 213, 105121. [Google Scholar] [CrossRef]
  6. Bai, Z.; Caspari, T.; Gonzalez, M.R.; Batjes, N.H.; Mäder, P.; Bünemann, E.K.; Tóth, Z. Effects of agricultural management practices on soil quality: A review of long-term experiments for Europe and China. Agric. Ecosyst. Environ. 2018, 265, 1–7. [Google Scholar] [CrossRef]
  7. Koishi, A.; Bragazza, L.; Maltas, A.; Guillaume, T.; Sinaj, S. Long-term effects of organic amendments on soil organic matter quantity and quality in conventional cropping systems in Switzerland. Agronomy 2020, 10, 1977. [Google Scholar] [CrossRef]
  8. Koulibaly, B.; Dakuo, D.; Traoré, O.; Ouattara, K. Long-term Effects of Crops Residues Management on Soil Chemical Properties and Yields in Cotton—Maize—Sorghum Rotation System in Burkina Faso. J. Agric. Ecol. Res. 2017, 10, 1–11. [Google Scholar] [CrossRef]
  9. Norris, C.E.; Congreves, K.A. Alternative management practices improve soil health indices in intensive vegetable cropping systems: A review. Front. Environ. Sci. 2018, 6, 1–18. [Google Scholar] [CrossRef]
  10. Son, D.; Somda, I.; Legreve, A.; Schiffers, B. Pratiques phytosanitaires des producteurs de tomates du Burkina Faso et risques pour la santé et l’environnement. Cahiers Agric. 2017, 26, 25005. [Google Scholar] [CrossRef]
  11. Lompo, D.J.-P.; Compaoré, E.; Sedogo, M.P.; Melapie, M.; Bielders, C.L.; Schlecht, E.; Buerkert, A. Horizontal Flows of Nitrogen, Potassium, and Carbon in Urban Vegetables Gardens of Bobo Dioulasso, Burkina Faso. Nutr. Cycl. Agroecosyst. 2019, 115, 189–199. [Google Scholar] [CrossRef]
  12. Ouédraogo, R.A.; Kambiré, F.C.; Kestemont, M.; Bielders, C.L. Caractériser La Diversité Des Exploitations Maraîchères de La Région de Bobo-Dioulasso Au Burkina Faso Pour Faciliter Leur Transition Agroécologique. Cah. Agric. 2019, 28, 20. [Google Scholar] [CrossRef]
  13. Zerbo, I.; Dabiré, K.; Kaboré, S.A.; Sawadogo, C.M.; Thiombiano, A. Plant Agrobiodiversity, Agricultural and Phytosanitary Practices of Market Garden Crops in the Centre-East Region of Burkina Faso. J. Sustain. Agric. Environ. 2024, 3, 1–15. [Google Scholar] [CrossRef]
  14. Ridder, N.; Keulen, H. Some Aspects of the Role of Organic Matter in Sustainable Intensified Arable Farming Systems in the West-African Semi-Arid-Tropics (SAT). Fertil. Res. 1990, 26, 299–310. [Google Scholar] [CrossRef]
  15. Abdulkadir, A.; Leffelaar, P.A.; Agbenin, J.O.; Giller, K.E. Nutrient Flows and Balances in Urban and Peri-Urban Agroecosystems of Kano, Nigeria. Nutr. Cycl. Agroecosyst. 2013, 95, 231–254. [Google Scholar] [CrossRef]
  16. Ahouangninou, C.; Martin, T.; Edorh, P.; Bio-Bangana, S.; Samuel, O.; St-Laurent, L.; Dion, S.; Fayomi, B. Characterization of Health and Environmental Risks of Pesticide Use in Market-Gardening in the Rural City of Tori-Bossito in Benin, West Africa. J. Environ. Prot. 2012, 3, 241–248. [Google Scholar] [CrossRef]
  17. Kiba, D.I.; Zongo, N.A.; Lompo, F.; Jansa, J.; Compaore, E.; Sedogo, P.M.; Frossard, E. The Diversity of Fertilization Practices Affects Soil and Crop Quality in Urban Vegetable Sites of Burkina Faso. Eur. J. Agron. 2012, 38, 12–21. [Google Scholar] [CrossRef]
  18. Doran, J.W.; Sarrantonio, M.; Liebig, M.A. Soil health and sustainability. In Advances in Agronomy; Sparks, D.L., Ed.; Academic Press: San Diego, CA, USA, 1996; Volume 56, pp. 1–54. [Google Scholar] [CrossRef]
  19. Andrews, S.S.; Mitchell, J.P.; Mancinelli, R.; Karlen, D.L.; Hartz, T.K.; Horwath, W.R.; Pettygrove, G.S.; Scow, K.M.; Munk, D.S. On-Farm Assessment of Soil Quality in California’s Central Valley. Agron. J. 2002, 94, 12–23. [Google Scholar] [CrossRef]
  20. Qu, M.; Chen, Y.; Khan, A.; Liu, P. Enhancing maize yield stability, soil health, and microbial diversity via long-term manure practices: Insights from a 14-year trial. Environ. Technol. Innov. 2025, 38, 104177. [Google Scholar] [CrossRef]
  21. Liu, B.; Zhang, Y.; Yi, X.; Zheng, H.; Ni, K.; Ma, Q.; Cai, Y.; Ma, L.; Shi, Y.; Yang, X.; et al. Partially replacing chemical fertilizer with manure improves soil quality and ecosystem multifunctionality in a tea plantation. Agric. Ecosyst. Environ. 2025, 378, 109284. [Google Scholar] [CrossRef]
  22. Rezapour, S.; Nouri, A.; Jalil, H.M.; Hawkins, S.A.; Lukas, S.B. Influence of treated wastewater irrigation on soil nutritional-chemical attributes using soil quality index. Sustainability 2021, 13, 1952. [Google Scholar] [CrossRef]
  23. Bünemann, E.K.; Bongiorno, G.; Bai, Z.; Creamer, R.E.; De Deyn, G.; de Goede, R.; Fleskens, L.; Geissen, V.; Kuyper, T.W.; Mäder, P.; et al. Soil Quality—A Critical Review. Soil Biol. Biochem. 2018, 120, 105–125. [Google Scholar] [CrossRef]
  24. Bhardwaj, A.K.; Jasrotia, P.; Hamilton, S.K.; Robertson, G.P. Ecological management of intensively cropped agro-ecosystems improves soil quality with sustained productivity. Agric. Ecosyst. Environ. 2011, 140, 419–429. [Google Scholar] [CrossRef]
  25. Jones, A.; Breuning-Madsen, H.; Brossard, M.; Chapelle, J.; Dampha, A.; Deckers, J.; Dewitte, O.; Dondeyne, S.; Gallali, T.; Hallett, S.; et al. (Eds.) Atlas Des Sols D’Afrique; Publications Office: Hong Kong, China, 2015. [Google Scholar]
  26. Ouédraogo, R.A.; Chartin, C.; Kambiré, F.C.; van Wesemael, B.; Delvaux, B.; Milogo, H.; Bielders, C.L. Short and Long-Term Impact of Urban Gardening on Soil Organic Carbon Fractions in Lixisols (Burkina Faso). Geoderma 2020, 362, 114110. [Google Scholar] [CrossRef]
  27. Bray, R.H.; Kurtz, L.T. Determination of total, organic and available forms of phosphorus insoils. Soil. Sci. 1945, 59, 39–45. [Google Scholar] [CrossRef]
  28. Okalebo, J.R.; Gathua, K.W.; Paul, L.W. Laboratory Methods of Soil and Plant Analysis: A Working Manual, 2nd ed.; SACRED Africa: Nairobi, Kenya, 2002; pp. 1–131. [Google Scholar]
  29. Hayano, K.A. Method for the Determination of β-Glucosidase Activity in Soil. Soil Sci. Plant Nutr. 1973, 19, 103–108. [Google Scholar] [CrossRef]
  30. Makoi, J.H.J.R.; Ndakidemi, P.A. Selected soil enzymes: Examples of their potential roles in the ecosystem. African J. Biotechnol. 2008, 7, 181–191. Available online: https://www.ajol.info/index.php/ajb/article/view/58355 (accessed on 11 March 2025).
  31. Tabatabai, M.A.; Bremner, J.M. Use of P-Nitrophenyl Phosphate for Assay of Soil Phosphatase Activity. Soil Biol. Biochem. 1969, 1, 301–307. [Google Scholar] [CrossRef]
  32. Adam, G.; Duncan, H. Development of a Sensitive and Rapid Method for the Measurement of Total Microbial Activity Using Fluorescein Diacetate (FDA) in a Range of Soils. Soil Biol. Biochem. 2001, 33, 943–951. [Google Scholar] [CrossRef]
  33. Paz-Ferreiro, J.; Gascó, G.; Gutiérrez, B.; Méndez, A. Soil Biochemical Activities and the Geometric Mean of Enzyme Activities after Application of Sewage Sludge and Sewage Sludge Biochar to Soil. Biol. Fertil. Soils 2012, 48, 511–517. [Google Scholar] [CrossRef]
  34. Vance, E.D.; Brookes, P.C.; Jenkinson, D.S. An Extraction Method for Measuring Soil Microbial Biomass, C. Soil Biol. Biochem. 1987, 19, 703–707. [Google Scholar] [CrossRef]
  35. Rössner, H.; Kuhnert-Finkernagel, R.; Öhlinger, R.; Beck, T.; Baumgarten, A.; Heilmann, B. Indirect estimation of microbial biomass. In Methods in Soil Biology; Schinner, F., Ohlinger, R., Kandeler, E., Margesin, R., Eds.; Springer: Berlin/Heidelberg, Germany, 1993; pp. 47–75. [Google Scholar]
  36. Rutgers, M.; Schouten, A.J.; Bloem, J.; van Eekeren, N.; de Goede, R.G.M.; Jagersop Akkerhuis, G.A.J.M.; vander Wal, A.; Mulder, C.; Brussaard, L.; Breure, A.M. Biological Measurements in a Nationwide Soil Monitoring Network. Eur. J. Soil Sci. 2009, 60, 820–832. [Google Scholar] [CrossRef]
  37. Schjønning, P.; McBride, R.A.; Keller, T.; Obour, P.B. Corrigendum to ‘Predicting Soil Particle Density from Clay and Soil Organic Matter Contents’ [Geoderma 286 (2017) 83–87]. Geoderma 2017, 292, 150. [Google Scholar] [CrossRef]
  38. Doran, J.W.; Parkin, T.B. Defining and assessing soil quality. In Defining Soil Quality for a Sustainable Environment; Doran, J.W., Coleman, J.W., Bezdicek, D.F., Eds.; Special Publications, ASA-SSSA; Soil Science Society of Amer: Madison, WI, USA, 1994; Volume 35, pp. 3–21. [Google Scholar]
  39. Andrews, S.S.; Flora, C.B.; Mitchell, J.P.; Karlen, D.L. Growers’ perceptions and acceptance of soil quality indices. Geoderma 2003, 114, 187–213. [Google Scholar] [CrossRef]
  40. Bastida, F.; Luis Moreno, J.; Hernández, T.; García, C. Microbiological Degradation Index of Soils in a Semiarid Climate. Soil Biol. Biochem. 2006, 38, 3463–3473. [Google Scholar] [CrossRef]
  41. Zhang, Y.; Xu, X.; Li, Z.; Liu, M.; Xu, C.; Zhang, R.; Luo, W. Effects of vegetation restoration on soil quality in degraded karst landscapes of southwest China. Sci. Total Environ. 2019, 650, 2657–2665. [Google Scholar] [CrossRef]
  42. Sharma, K.L.; Mandal, U.K.; Srinivas, K.; Vittal, K.P.R.; Mandal, B.; Grace, J.K.; Ramesh, V. Long-Term Soil Management Effects on Crop Yields and Soil Quality in a Dryland Alfisol. Soil Tillage Res. 2005, 83, 246–259. [Google Scholar] [CrossRef]
  43. Masto, R.E.; Chhonkar, P.K.; Singh, D.; Patra, A.K. Alternative Soil Quality Indices for Evaluating the Effect of Intensive Cropping, Fertilisation and Manuring for 31 Years in the Semi-Arid Soils of India. Environ. Monit. Assess. 2008, 136, 419–435. [Google Scholar] [CrossRef]
  44. da Costa, A.C.S.; Junior, I.G.d.S.; Canton, L.C.; Gil, L.G.; Figueiredo, R. Contribution of the chemical and mineralogical properties of sandy-loam tropical soils to the cation exchange capacity. Rev. Bras. Cienc. Solo 2020, 44, 1–18. [Google Scholar] [CrossRef]
  45. Liptzin, D.; Silver, W.L. Effects of Carbon Additions on Iron Reduction and Phosphorus Availability in a Humid Tropical Forest Soil. Soil Biol. Biochem. 2009, 41, 1696–1702. [Google Scholar] [CrossRef]
  46. Ebhin Masto, R.; Chhonkar, P.K.; Singh, D.; Patra, A.K. Changes in Soil Biological and Biochemical Characteristics in a Long-Term Field Trial on a Sub-Tropical Inceptisol. Soil Biol. Biochem. 2006, 38, 1577–1582. [Google Scholar] [CrossRef]
  47. Acosta-Martinez, V.; Zobeck, T.M.; Gill, T.E.; Kennedy, A.C. Enzyme Activities and Microbial Community Structure in Semiarid Agricultural Soils. Biol. Fertil. Soils 2003, 38, 216–227. [Google Scholar] [CrossRef]
  48. Smukler, S.M.; Jackson, L.E.; Murphree, L.; Yokota, R.; Koike, S.T.; Smith, R.F. Transition to Large-Scale Organic Vegetable Production in the Salinas Valley, California. Agric. Ecosyst. Environ. 2008, 126, 168–188. [Google Scholar] [CrossRef]
  49. Kallenbach, C.; Grandy, A.S. Controls over Soil Microbial Biomass Responses to Carbon Amendments in Agricultural Systems: A Meta-Analysis. Agric. Ecosyst. Environ. 2011, 144, 241–252. [Google Scholar] [CrossRef]
  50. Li, J.; Cooper, J.M.; Lin, Z.; Li, Y.; Yang, X.; Zhao, B. Soil Microbial Community Structure and Function Are Significantly Affected by Long-Term Organic and Mineral Fertilization Regimes in the North China Plain. Appl. Soil Ecol. 2015, 96, 75–87. [Google Scholar] [CrossRef]
  51. Abdu, N.; Abdulkadir, A.; Agbenin, J.O.; Buerkert, A. Vertical Distribution of Heavy Metals in Wastewater-Irrigated Vegetable Garden Soils of Three West African Cities. Nutr. Cycl. Agroecosyst. 2011, 89, 387–397. [Google Scholar] [CrossRef]
  52. Sanchez, P.A. Properties and Management of Soils in the Tropics, 2nd ed.; Cambridge University Press: Cambridge, UK, 2019. [Google Scholar] [CrossRef]
  53. Gondal, A.H.; Hussain, I.; Ijaz, A.B.; Zafar, A.; Imran, B.; Zafar, H.; Sohai, M.D.; Niazi, H.; Touseef, M.; Khan, A.A.; et al. Influence of Soil Ph and Microbes on Mineral Solubility and Plant Nutrition: A Review. Int. J. Agric. Biol. Sci. 2021, 5, 71–81. [Google Scholar]
  54. Andrews, S.S.; Carroll, C.R. Designing a Soil Quality Assessment Tool for Sustainable Agroecosystem Management. Ecological. Appl. 2001, 11, 1573–1585. [Google Scholar] [CrossRef]
  55. Kirchmann, H.; Haberhauer, G.; Kandeler, E.; Sessitsch, A.; Gerzabek, M.H. Effects of level and quality of organic matter input on carbon storage and biological activity in soil: Synthesis of a long-term experiment. Global. Biogeochem. Cycles 2004, 18, 1–9. [Google Scholar] [CrossRef]
  56. Arshad, M.A.; Martin, S. Identifying critical limits for soil quality indicators in agro-ecosystems. Agric. Ecosyst. Environ. 2002, 88, 153–160. [Google Scholar] [CrossRef]
  57. Andrews, S.S.; Karlen, D.L.; Mitchell, J.P. A Comparison of Soil Quality Indexing Methods for Vegetable Production Systems in Northern California. Agric. Ecosyst. Environ. 2002, 90, 25–45. [Google Scholar] [CrossRef]
  58. Svoray, T.; Michailov, E.; Cohen, A.; Rokah, L.; Sturm, A. Predicting Gully Initiation: Comparing Data Mining Techniques, Analytical Hierarchy Processes and the Topographic Threshold. Earth Surf. Process. Landf. 2012, 37, 607–619. [Google Scholar] [CrossRef]
  59. Truog, E. Soil Reaction Influence on Availability of Plant Nutrients. Soil Sci. Soc. Am. J. 1947, 11, 305–308. [Google Scholar] [CrossRef]
Figure 2. Evolution of the chemical (a), biological (b), and physical (c) soil health indices as a function of the number of years of cultivation. n = 69 for (a,b); n = 18 for (c).
Soilsystems 09 00059 g002
Figure 3. Evolution of global soil health indices (a) and mean soil health indices (b) as a function of the number of years in cultivation. n = 18.
Soilsystems 09 00059 g003
Table 1. Selected chemical, biological, and physical characteristics of the market garden fields.
CharacteristicVariableUnitMinMaxMedianMeanSt.Dev.CVn
ChemicalCtotg kg−15.534.719.518.77.10.3869
Ntotg kg−10.562.551.441.460.50.3469
pH-5.07.66.66.60.580.0969
SBEcmol kg−12.417.16.86.82.60.3869
CECcmol kg−13.417.610.510.53.50.3369
P Braymg kg−121.3169.353.362.331.40.5069
ECµS cm−11725595101440.4469
BiologicalBetaglu-cosidaseµg g−1 h−111.066.533.134.3110.3269
Phosphataseµg g−1 h−157.0280.0179.0177.957.80.3269
FDAµg g−1 h−150.9217.9142.0142.336.50.2669
Uréaseµg g−1 h−1175.0830.1445.5436.2145.80.3369
GMEµg g−1 h−164.6212.4139.6137.333.10.2469
Respµg g−1 h−10.391.981.000.990.310.3169
MBCµg g−112.0114.043.04819.90.4169
QCO2µg C-CO2 µg−1 MBC h−10.0050.080.020.030.020.6769
NH4+µg g−12.041.22.86.371.1169
NO3µg g−19.5114.839.241.821.40.5169
Nmin/Ntotmg g−11.558.533.063.021.20.4069
C/N-9.615.912.712.81.70.1369
Qmicmg g−10.599.902.742.911.640.5669
PhysicalClay%82311123.10.2669
Silt%81612131.80.1469
Sand%648276753.60.0569
BDg cm−31.051.341.131.160.080.0718
PAWC%1426212130.1418
Macpo%2237292940.1418
KSm s−12.4 × 10−64.3 × 10−51.2 × 10−51.5 × 10−51.1 × 10−50.7318
Min = minimum; Max = maximum; St.Dev. = standard deviation; CV= coefficient of variation; n = number of observations; Ctot = total organic carbon; Ntot = total nitrogen; SBE = sum of the exchangeable bases; CEC = cation exchange capacity; P Bray = available P (Bray-1); EC = electrical conductivity; FDA = fluorescein diacetate; GME = geometric mean of enzyme activity; Resp = basal respiration; MBC = microbial biomass carbon; QCO2= respiratory quotient; Nmin/Ntot = mineral nitrogen/total nitrogen; Qmic = microbial quotient; BD = bulk density; PAWC = plant available water capacity; Macpo = macroporosity; Ks = saturated hydraulic conductivity.
Table 2. Correlation matrix between chemical (SHIchem), biological (SHIbiol), and physical (SHIphys) soil quality indices of the vegetable fields and the number of years of cultivation. All correlations are statistically significant (p < 0.05).
VariableYearsSHIchemSHIbiolSHIphysSHImeanSHIglobal
Years10.650.650.670.750.66
SHIchem0.6510.780.670.660.83
SHIbiol0.650.7810.480.680.75
SHIphys0.670.670.4810.630.58
SHImean0.750.660.680.6310.51
SHIglobal0.660.830.750.580.511
Disclaimer/Publisher’s Note: The statements, opinions and data contained in all publications are solely those of the individual author(s) and contributor(s) and not of MDPI and/or the editor(s). MDPI and/or the editor(s) disclaim responsibility for any injury to people or property resulting from any ideas, methods, instructions or products referred to in the content.

