
Article

Symplectic Geometry Matrix Machine Controlled by the Whale Optimization Algorithm and Its Application in Bearing Fault Diagnosis

1
Xingzhi College, Zhejiang Normal University, Lanxi 321100, China
2
Zhejiang Feiya Elevator Co., Ltd., Jinhua 321002, China
3
Key Laboratory of Intelligent Operation and Maintenance Technology and Equipment for Urban Rail Transit of Zhejiang Province, Zhejiang Normal University, Jinhua 321004, China
*
Authors to whom correspondence should be addressed.
Vibration 2026, 9(2), 34; https://doi.org/10.3390/vibration9020034
Submission received: 6 March 2026 / Revised: 1 May 2026 / Accepted: 5 May 2026 / Published: 13 May 2026

Abstract

In the field of industrial equipment condition monitoring, accurate rolling bearing fault diagnosis is critical yet challenging due to high-dimensional vibration signals and complex operating conditions. Traditional machine learning methods often struggle with insufficient feature separability and sensitivity to model parameters, leading to fluctuating diagnostic accuracy. To address these challenges, this study introduces the whale optimization algorithm-guided symplectic geometry matrix machine (WOA-SGMM) and proposes the application of the whale optimization algorithm (WOA) to optimize the symplectic geometry matrix machine (SGMM), forming a WOA-SGMM diagnostic framework. (1) The symplectic geometry spectral transformation (SGST) effectively converts high-dimensional vibration signals into low-dimensional feature matrices while preserving intrinsic geometric and topological structures, enhancing noise robustness. (2) Leveraging WOA, we adaptively search for the optimal hyperparameters of the proposed SGMM, specifically addressing the limitations of traditional SMM, to mitigate the risk of overfitting. (3) Experimental validation on three benchmark datasets demonstrates that WOA-SGMM achieves superior multi-class fault diagnosis accuracy (up to 100%) under varying operating conditions. Compared to traditional methods, the proposed WOA-SGMM demonstrates improved classification accuracy and enhanced robustness against noise interference in the tested experimental scenarios, highlighting its potential for real-world industrial applications.

1. Introduction

In the field of industrial equipment condition monitoring, rolling bearings are vital components whose health directly impacts the operational reliability of large rotating machinery [1]. Accurate fault diagnosis of rolling bearings is thus crucial for preventing unexpected failures and minimizing downtime. However, traditional fault diagnosis methods face significant challenges due to the complex nature of vibration signals and the increasing diversity of operating conditions [2].
Recent research in rolling bearing fault diagnosis has focused on several key areas. Mainstream signal processing techniques, such as time–frequency analysis (e.g., short-time Fourier transform [3] and continuous wavelet transform [4]), have been widely employed to extract fault-related features from vibration signals. Meanwhile, machine learning and deep learning models, including support vector machine (SVM) [5], deep neural networks [6], and extreme learning machines [7], have shown promise in automating the fault classification process.
Despite these advancements, several challenges persist. First, conventional feature extraction methods based on time–frequency domain statistics often struggle to capture the geometric structural features hidden in high-dimensional vibration signals, resulting in insufficient feature separability [8]. Second, traditional classification models, when handling matrix-type fault data under multi-operating conditions and strong noise interference, generally suffer from high sensitivity to model parameters and fuzzy classification decision boundaries, leading to significant fluctuations in diagnostic accuracy [9].
Furthermore, traditional machine learning methods still have inherent flaws, particularly concerning hyperparameter optimization and its impact on model performance. Metaheuristic algorithms [10] emerge as a promising solution due to their excellent global optimization capabilities. These algorithms are increasingly being employed for feature selection, exemplified by methods such as the gray wolf optimizer [11], particle swarm optimization (PSO) [12], differential evolution [13], and Harris hawks optimization [14]. Although these approaches typically optimize features individually without considering classifier performance, Zhang et al. [15] innovated by introducing multi-objective particle swarm optimization for feature selection, transforming traditional single-objective tasks into more competitive multi-objective ones. Notably, the whale optimization algorithm (WOA), inspired by the social behavior of humpback whales [16], demonstrates superior convergence accuracy and speed compared to classic PSO, and is especially effective at optimizing the hyperparameters of matrix-based classifiers. For instance, Zheng et al. [17] demonstrated the effectiveness of combining WOA with support matrix machine (SMM) for fault diagnosis.
In recent years, with the advancement of industrial data acquisition technology, research hotspots in fault diagnosis have shifted from traditional vector-based methods to matrix-based learning paradigms [18]. These methods aim to preserve the two-dimensional structural information of vibration signals to improve feature separability. However, processing such matrix-type fault data still faces significant specific difficulties. First, directly processing high-dimensional matrix data often results in the curse of dimensionality, leading to prohibitive computational costs and overfitting risks [19]. Second, under strong noise interference, the intrinsic geometric structure of the fault matrix is easily obscured, making it difficult for traditional matrix decomposition methods to extract robust features. Finally, matrix-based classifiers, such as SMM [20], rely heavily on hyperparameters. The performance of these models is often unstable due to the difficulty in finding the global optimum in a complex parameter space. To address these specific challenges in matrix data processing, inspired by the successful combination of WOA and SMM, this study proposes the whale optimization algorithm-guided symplectic geometry matrix machine (WOA-SGMM). WOA-SGMM integrates symplectic geometry spectral transformation (SGST) [21] for effective feature extraction from matrix-type vibration signals and the whale optimization algorithm (WOA) [22] for adaptive hyperparameter optimization, thereby enhancing both feature preservation and classification robustness. This study encompasses the following key components:
(1)
SGST is utilized to determine the eigenvalues of the Hamiltonian matrix for time–frequency signals, enabling the reconstruction of individual component signals while preserving the essential characteristics of the original time series, thereby laying a solid foundation for accurate bearing fault diagnosis.
(2)
By integrating WOA with the proposed SGMM, WOA optimizes the kernel function and penalty parameters, significantly enhancing its classification performance and thus improving the accuracy and reliability of fault diagnosis.
(3)
Experimental data analysis demonstrates that WOA-SGMM achieves a higher state recognition rate compared to SVM, SMM, multi-class support matrix machine (MSMM) [23], and robust support matrix machine (RSMM) [24].
It is important to clarify that the proposed WOA-SGMM is not intended to redefine the mathematical foundations of matrix machines. Instead, it represents a practical diagnostic framework that leverages the whale optimization algorithm to tune the hyperparameters of a symplectic geometry-based support matrix machine, thereby solving the specific problem of rolling bearing fault diagnosis under noisy conditions.
The remainder of this paper is structured as follows: The content of Section 2 is dedicated to an overview of related work. The whale optimization algorithm-optimized symplectic geometry matrix machine is introduced in Section 3. The application and results obtained are presented and discussed in Section 4, and the findings are summarized, and conclusions are drawn in Section 5.

2. Related Works

SGST, WOA, and SMM are introduced in this section, which lays the foundation for the rolling bearing fault diagnosis method. Necessary background and framework for model tuning and improvement are also provided.

2.1. Symplectic Geometry Similarity Transformation

Assuming the vibration signal of the rolling bearing is x = ( x 1 , x 2 , , x N ) , according to the symplectic space reconstruction theory, the original signal is mapped into an m-dimensional Hankel matrix, resulting in Equation (1):
D m = x ( 1 ) x ( 2 ) x ( n ) x ( 2 ) x ( 3 ) x ( n + 1 ) x ( m ) x ( m + 1 ) x ( m + n + 1 )
where m is the dimension of the matrix, N is the length of the signal, N = m + n + 1, and mn.
Symplectic geometry similarity transformation is performed on the matrix D m , resulting in Equation (2):
D m = U A L T
where U = R m × n , L = R m × n , A is an n × n diagonal matrix that can be represented as A = d i a g ( σ 1 , σ 2 , , σ q ) , and σ 1 σ 2 σ q 0 constitute the singular values of the matrix D m , which represent the phase space singular values of the signal.

2.2. Whale Optimization Algorithm

Conventional machine learning optimization algorithms and model parameter settings are often challenged by issues such as being prone to local optima, sensitivity to initial parameters, and inability to effectively handle complex and variable signal features in the realm of rolling bearing fault diagnosis [25]. To address these challenges and improve the accuracy and robustness of fault diagnosis, the whale optimization algorithm, a novel and efficient metaheuristic approach, is introduced in this section. Inspired by the foraging behavior of humpback whales in nature, WOA is endowed with powerful global search capabilities and rapid convergence characteristics, exhibiting significant advantages in tackling high-dimensional and complex optimization problems. The subsequent content provides a comprehensive overview of WOA, including its model, procedure, and stages, as well as an in-depth analysis of its algorithmic characteristics. By elaborating on the working principles and advantages of WOA, the theoretical foundation is laid for the subsequently proposed SMM optimized based on WOA.

2.2.1. Algorithm Model

WOA is comprehensively explored in this section, including its encircling and contracting mechanism [26], which is one of the core search strategies utilized by WOA. By gaining a deep understanding of the working principles of WOA, we establish a solid foundation for WOA-SGMM introduced in subsequent chapters and showcase how to substantially enhance the precision and speed of rolling bearing fault detection through optimizing the hyperparameters of SMM.
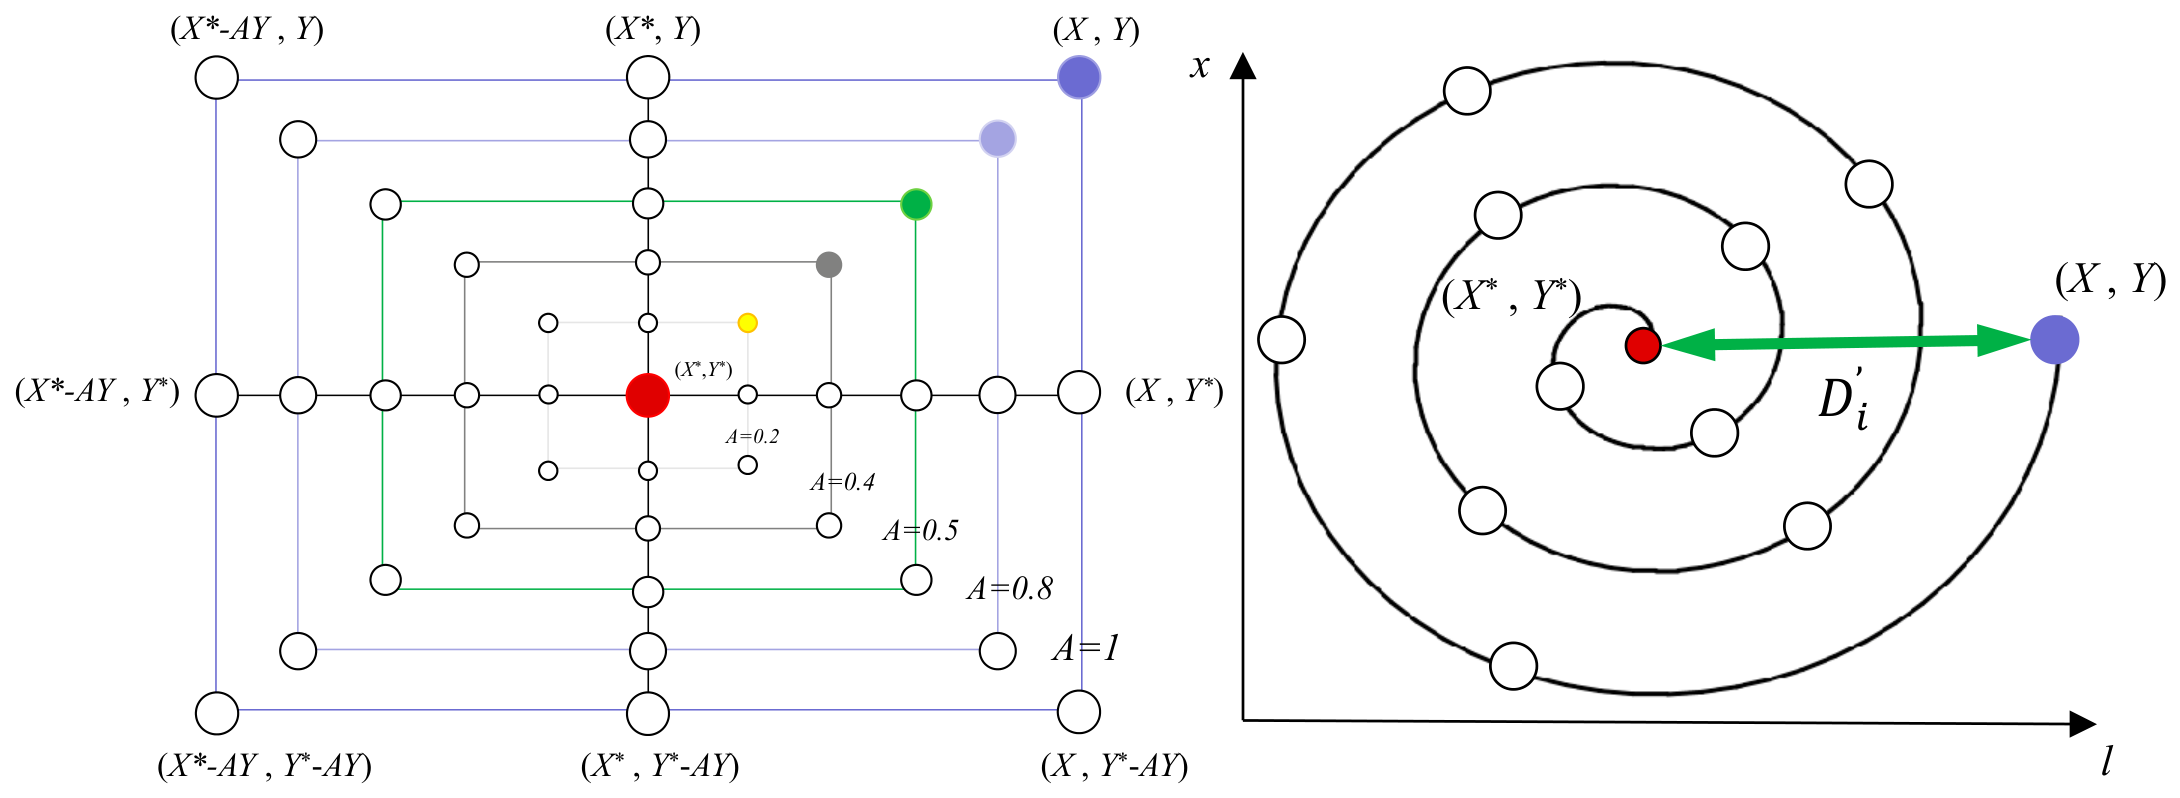
In the initial phase, a random individual in the population is selected as the target prey by WOA. In each subsequent iteration, the current best candidate whale is assumed as the target prey, and the other whales are encircled and contracted towards this position as shown in Figure 1. The mathematical models are shown in Equations (3) and (4):
X t   +   1 = X t A × D
D j = C X j × ( t ) X j ( t )
where the position vector of the current best candidate whale is represented by X*. The position vector is represented by x, and the current iteration number is represented by t. The step size vector for the whale individuals to move closer to X* is represented by d, the j-th dimension component of d, denoted as Dj, is obtained from Equation (4), x j * and xj represent the j-th dimension components of X* and X respectively, and a and c represent coefficients. a is a random number in the range [−2, 2], and c is a random number in the range [0, 2]. The definitions of a and c are given in Equations (5) and (6):
A = 2 a × r a
C = 2 × r
where r represents a random number in the range [0, 1]; a is known as the convergence factor, which linearly decreases from 2 to 0 as the number of iterations increases. The definition of a is given in Equation (7):
a = 2 2 t t max
where tmax represents the maximum number of iterations.
The current target prey location is approached by the whale in a helical pattern, and the corresponding mathematical formulation is presented in Equation (8):
X ( t + 1 ) = D × e b l × cos ( 2 π l ) + X * ( t )
where D′ represents the distance vector between the whale and X*, the j-th dimension component of D′, denoted as D j = X j * ( t ) X j ( t ) , b is a constant coefficient used to define the logarithmic spiral shape, and l is a random number in the range [−1, 1].
Whales can either attack prey using bubble nets or approach prey through the encircling and contracting mechanism. To facilitate the coordination of these two mechanisms, a probability P0 = 50% is used to update the position of the whales. The mathematical model is given by Equation (9):
X ( t + 1 ) = X * ( t ) A × D , p < P 0 D × e b l × cos ( 2 π l ) + X * ( t ) , p P 0
where p represents a random number in the range [0, 1].
During the iterative update process of the whale population’s positions, when A   <   1 , the whales update their positions according to Equation (2); when A 1 , the whales are forced to update their positions towards a randomly selected reference whale Xrand, as shown in Equations (10) and (11):
D = C × X rand X ( t )
X ( t + 1 ) = X rand A × D
where Xrand represents the position vector of a randomly selected reference whale.

2.2.2. Algorithm Flow and Steps

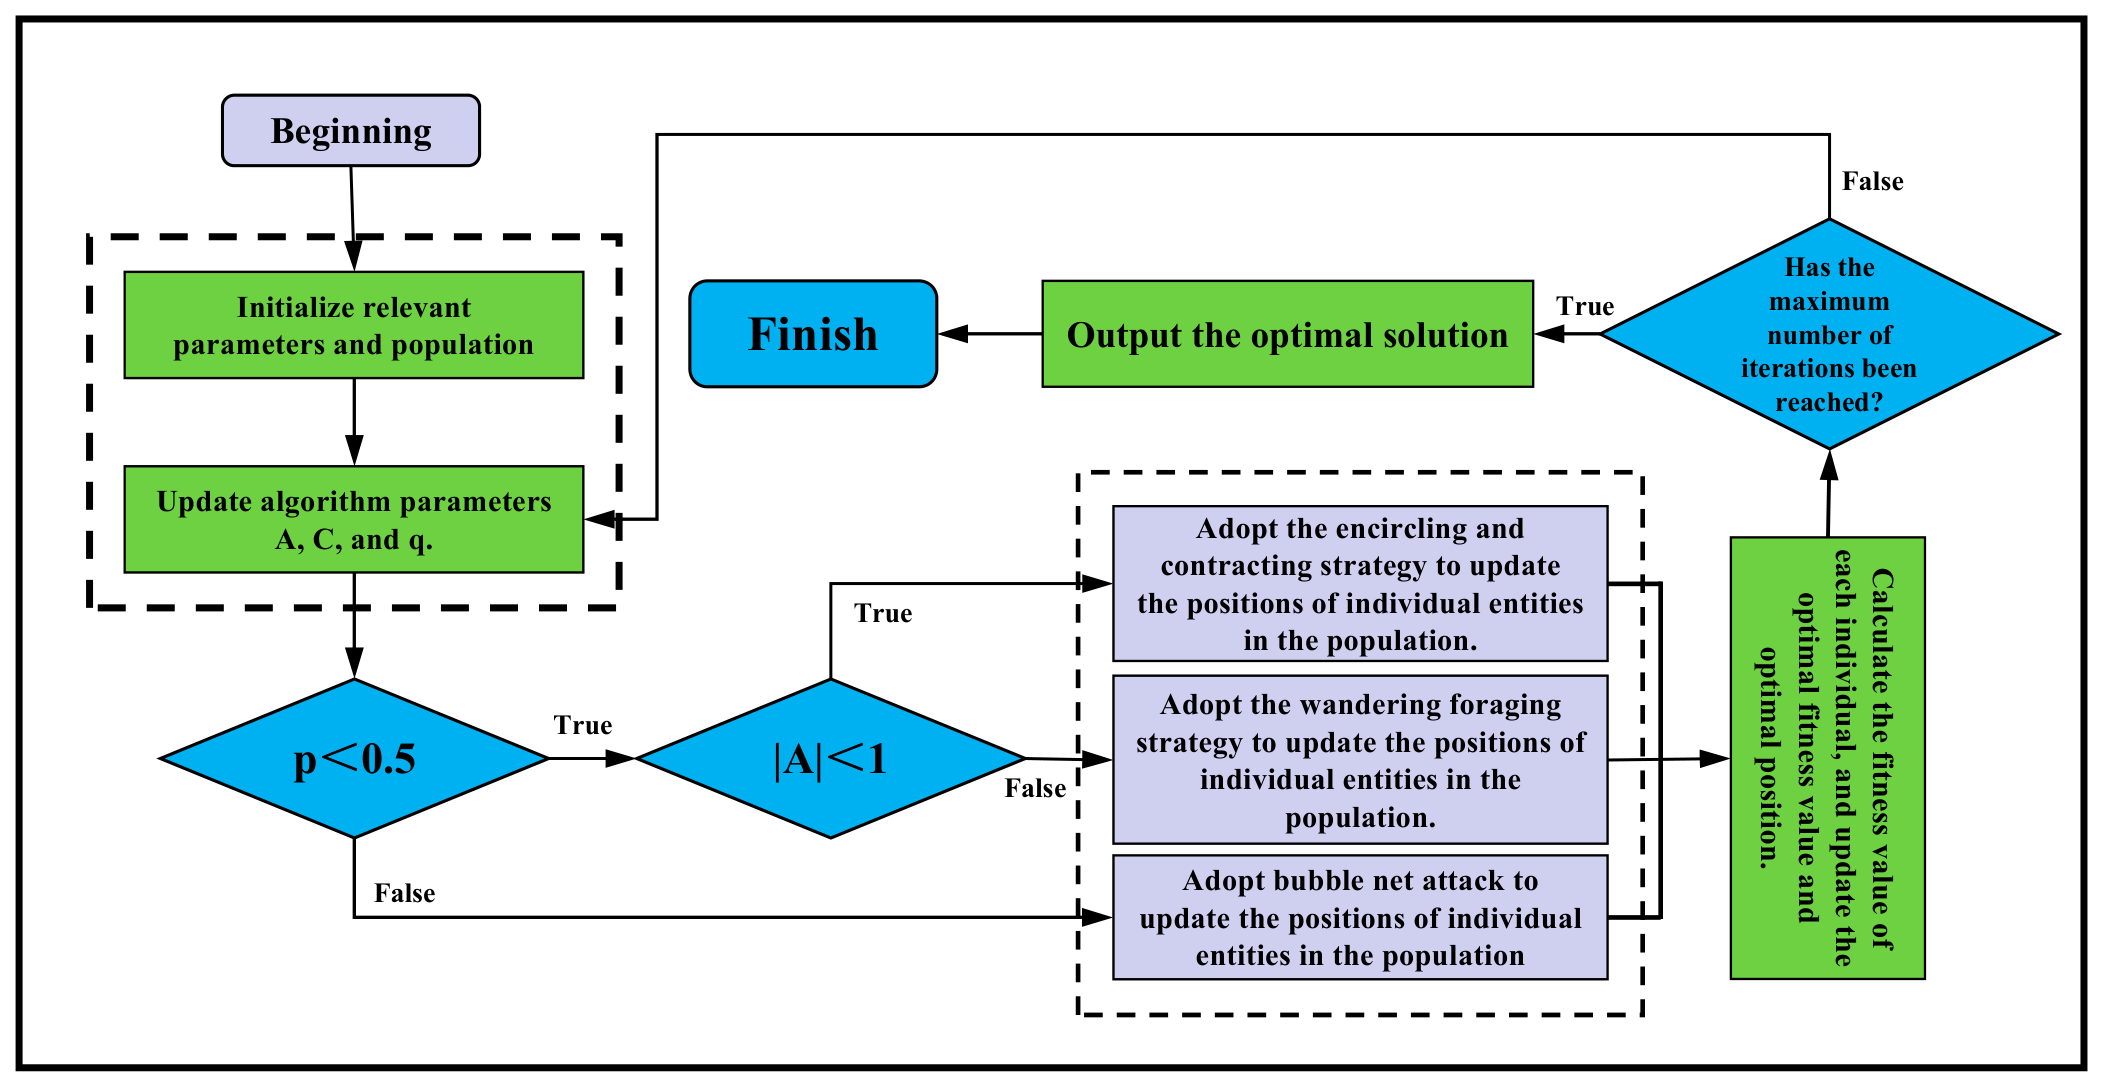
The flowchart of the whale optimization algorithm is shown in Figure 2, and the implementation steps are summarized as follows:
Step 1: Initialize the algorithm, including setting the number of whales n, the dimension d, and the maximum number of iterations tmax. Randomly generate the initial population positions X(t) within the defined domain.
Step 2: Update A and C according to Equations (5) and (6), and generate a random number p in the range [0, 1]. Proceed to Step 3.
Step 3: If p ≥ 0.5, update the position of each whale individual according to Equation (8) and proceed to Step 4. If p < 0.5, check if the absolute value of A is greater than 1. If A ≥ 1, update the position of each whale individual according to Equation (11) and proceed to Step 4. If A < 1, update the position of each whale according to Equation (3) and proceed to Step 4.
Step 4: Calculate the fitness value of each individual and update the best fitness value and the best position.
Step 5: Check if the iteration number t is equal to tmax. If true, output the optimal value and the optimal position. If not, return to Step 2.

2.2.3. Algorithm Analysis

It has been theoretically proven that WOA has global convergence, and its high accuracy and computational efficiency have been demonstrated through simulation experiments. However, the following issues are still faced by WOA, particularly when tackling large-scale optimization problems:
(1)
Unguaranteed quality of the initial population. A random population initialization principle is adopted by WOA, which cannot guarantee the diversity and quality of the population. Especially for problems with multiple local optimal solutions, if the randomly generated initial population is concentrated in a certain area or scattered near other local optimal solutions, it is likely to fall into a local optimum after multiple iterations.
(2)
Loss of population diversity in the later stages of iteration. In the steps of WOA, an elitist preservation strategy is adopted, where the best value found in each iteration is recorded and not discarded. Although this can effectively enhance the convergence ability of the algorithm, it can easily lead to a loss of population diversity and the issue of “premature convergence”.
(3)
Lack of adequate harmony between the ability to explore globally and the ability to exploit locally. From the steps of WOA, it can be seen that the acquisition of global exploration capability depends on the parameters p and A. The probability of having both p < 0.5 and ∣A∣ ≥ 1 is at most 25%, indicating insufficient global exploration capability. In the later stages of the algorithm (the last 50% of iterations), the probability of ∣A∣ ≥ 1 is also at most 25%, again showing insufficient global exploration capability. Furthermore, in the later stages of the algorithm, ∣A∣ < 1 always holds true, meaning that WOA no longer performs global exploration, which raises the likelihood of the algorithm getting stuck in a local optimum.

2.3. Support Matrix Machine

An innovative approach for pattern classification, which utilizes a framework of regularized risk minimization to address classification tasks presented in matrix format, is represented by SMM. Within SMM, by considering the structural details of matrices, an objective function is introduced, which consists of a hinge loss component and a regularization component. To clarify the structure of this function, we break it down as follows:
(1)
Hinge Loss Term ( ξ ): This term, represented as 1 y i [ tr ( W T Z i ) + b ] + , measures the classification error on the training data. It ensures the model maximizes the margin between different classes.
(2)
Regularization Term ( W F 2 ): The first component of the regularizer, often associated with the Frobenius norm, controls the complexity of the model to prevent overfitting.
(3)
Nuclear Norm Constraint ( ε W * ): This term imposes a low-rank constraint on the weight matrix W, encouraging the model to capture the intrinsic geometric structure of the data.
Suppose we have a training dataset Z i , y i i = 1 N , where Z i R p × q is the feature matrix to be trained, and y i = 1 , 1 is the class label. Within SMM, a constrained objective function is designed (Equation (12)):
min w , ξ 0 1 2 W F 2 + ε W * + C i = 1 N 1 y i [ tr ( W T Z i ) + b ] +
where W R p × q represents the weight matrix, while b serves as the threshold, ε can constrain the nuclear norm, C i = 1 N 1 y i [ tr ( W T Z i ) + b ] + represents the hinge loss term, C serves as the penalty coefficient for damage, W * is used to limit rk(W), and 1 2 W F 2 + ε W * is an adjustment function, W F 2 is employed to find a low-rank weight matrix.
Using ADMM to solve Equation (12), the weight matrix W and the threshold b are obtained. For a sample with unknown classification Zi%, its category label can be determined by the decision function given in Equation (13):
y ^ i = sign tr W T Z ˜ i + b
where y ^ i is the label of the unknown sample Z ˜ i R p × q .
In the context of SMM, a novel objective function integrating the generalized Frobenius norm with the nuclear norm has been developed. ADMM is employed as a highly effective approach for solving this objective function, facilitating swift convergence and the attainment of the global optimal solution. Furthermore, a label prediction model is constructed by SMM to forecast the labels of unseen samples.
However, before using SMM, feature extraction and selection must be performed, which is an inevitable challenge in traditional pattern recognition methods. Meanwhile, if the signal under analysis contains noise, the extracted features tend to be more complex. The complexity of these input features can complicate the ability of SMM to attain bounded approximate solutions and convergence boundary functions, significantly impairing the diagnostic performance of SMM. In response to the shortcomings of signal processing methods, further exploration of feature extraction methods is conducted, and SGST is proposed.
It is important to note the distinction between our work and the foundational study by Pan et al. [27], which proposed the basic symplectic geometry matrix machine (SGMM). While Pan et al. focused on the matrix machine structure itself, our work introduces the whale optimization algorithm (WOA) to solve the hyperparameter selection problem in SGMM. This integration allows our model to adaptively search for the optimal penalty coefficient C and low-rank parameter τ, overcoming the limitations of manual tuning present in the original SGMM framework.

3. WOA-SGMM

In the preceding sections, the importance and challenges of rolling bearing fault diagnosis were introduced. This section explores WOA-SGMM, a model combining symplectic geometric similarity transformation for feature extraction and the whale optimization algorithm for hyperparameter optimization in SMM. The principles, construction process, and learning algorithm of WOA-SGMM are outlined, aiming to provide an efficient and precise approach for fault diagnosis and lay a theoretical foundation for future experiments.

3.1. The Model

The proposed SGMM model is defined as follows. Unlike the conventional SMM which treats the input data as general matrices and relies on standard kernel functions, the SGMM incorporates symplectic geometry theory to construct a trajectory matrix that preserves the topological structure of the vibration signals. To enhance the readability of this formulation, we provide a detailed interpretation of the interrelationship between these terms:
(1)
The generalized Frobenius norm ( W F 2 ): This term captures the overall energy of the weight matrix and promotes smoothness.
(2)
The nuclear norm ( ε W ): Also known as the trace norm, this term acts as a convex surrogate for the matrix rank, promoting low-rank solutions.
(3)
Synergistic effect: By combining these two terms (forming what is analogous to an elastic net in matrix space), the model achieves a balance between sparsity (encouraged by the nuclear norm to select important features) and robustness (encouraged by the Frobenius norm to handle noise).
The objective function in Equation (14) achieves synergistic optimization of structured feature selection and low-rank constraints by balancing these two terms:
min w , ξ 0 1 2 W F 2 + ϵ W * + C ξ i
By incorporating a penalty term that combines the squared Frobenius norm with the nuclear norm, known as the spectral elastic net, it captures the intrinsic correlations within the input data matrix. When the weight (τ) of the nuclear norm is zero, SMM degenerates into the traditional SVM. However, since the nuclear norm cannot be equivalently defined as a vector norm, SMM is able to handle matrix data more comprehensively, thereby improving classification performance.
Unlike the standard SMM which often minimizes a single regularization term, the objective function of SGMM proposes a composite regularization strategy. By combining the generalized Frobenius norm and the nuclear norm a s d , SGMM achieves a balance between sparsity and robustness. This specific formulation distinguishes it from both the probabilistic approaches (like SRMM) and the standard SMM frameworks.
In principle, the proposed WOA-SGMM is a model that utilizes a metaheuristic algorithm to convert the traditional single-objective optimization problem into a multi-objective optimization problem aimed at identifying the optimal hyperparameters in SGMM.
To tackle the challenge of feature selection, SGMM utilizes the raw signal as its input and adaptively derives a dimensionless feature input matrix through symplectic geometry similarity transformation. The rolling bearing’s vibration signal, denoted as x = ( x 1 , x 2 , , x N ) , is used to construct the trajectory matrix X through a process of phase space reconstruction. By calculating the transpose of X and its product with itself using Equation (15), a symmetric matrix A is obtained. The blkdiag function is used in Equation (16) to construct a block diagonal matrix M, where the transpose of A and −A are used as the diagonal blocks, respectively.
A = X T X
M = A T 0 0 A
In Equation (17), the square of matrix M is calculated to obtain matrix N, and singular value decomposition is performed on matrix N to extract feature information and generate feature matrix Z. The singular value decomposition expression for matrix N can be represented as:
N = U V T = i = 1 r σ i ( D ) u i v i T
where U = [ u 1 , u 2 , , u r ] R p × r and V = [ v 1 , v 2 , , v r ] R p × r are both orthogonal matrices. Σ = d i a g ( σ 1 , σ 2 , , σ r ) includes all non-zero singular values in D, and σ 1 σ 2 σ r > 0 . The outcome is matrix N, a feature matrix that encapsulates the vital characteristics of the signal. This matrix circumvents the limitations inherent in the feature selection process of the SMM method, thereby bolstering the robustness of the input matrix.
Drawing upon the symplectic geometry coefficient matrix, we propose the construction of a resilient multi-class objective equation (Equation (18)) that sidesteps the limitations of binary classification present in SMM.
min W ξ 0 1 2 W F 2 + ε W c * + C N i = 1 N ξ i
s . t . Δ ( y ^ i , y i ) + W , ψ ( z i , y ^ i ) ψ ( z i , y i ) ξ i
where W R p × q × k represents the weight matrix, ξ denotes the hinge loss, ψ ( z i , y i ) signifies the feature mapping linking the input sample z i to the output label y i , y i stands for the true sample label, Wc is the weight matrix corresponding to category c, C is the trade-off coefficient for the constraint loss component, Δ serves as the Hamming loss function, N indicates the number of training samples, ε represents the constraint nuclear norm, and 1 2 W F 2 + ε W c * is the regularization function.
The parameters of SMM are manually determined based on experience and remain fixed once they are set. However, the support matrix machine model that is constructed varies according to the different numbers of input feature values. Therefore, the parameters of the support matrix machine should be adjusted accordingly for each different model constructed. By utilizing the whale optimization algorithm to fine-tune the support matrix machine and establish an objective function, the ideal parameters for SMM can be determined when the objective function attains its optimal value. This approach enhances the flexibility of the detection model and decreases the false alarm rate.
Specifically, WOA is employed to optimize the hyperparameters of SGMM (i.e., the regularization parameter C and kernel parameters specific to the symplectic framework). The fitness function is designed to minimize the classification error rate of SGMM on the training set.
The detailed steps of the WOA-SGMM algorithm are described as follows:
Step 1: Determine the sample sizes of the training and test sets, and set the damage penalty coefficient C, the low-rank coefficient τ, and the spatial dimension dim.
Step 2: Initialize parameters, determine the maximum iteration count tmax, specify the population size N and create the initial population.
Step 3: Evaluate the fitness scores of the present population, identify the superior individuals through comparison, assemble a new population comprising these elites, and document the position of the best individual, denoted as X , which represents the optimal solution.
Step 4: If P is less than 0.5, we proceed as follows: if the absolute value of H is less than 1, we apply the position and update Equation (18), incorporating an additional weight factor, to adjust the spatial positions of the whale group. Alternatively, if the absolute value of H is equal to or greater than 1, we randomly select a position Xrand from the current population and update the current position based on Equation (8).
Step 5: Compute the fitness scores for each individual in the updated whale group, then combine these scores and conduct a comparison. Next, sort the fitness values in ascending order to determine the new set of fitness scores. If the fitness of a newly updated whale group individual surpasses that of its predecessor from the previous generation, the position of the new individual will take the place of the original individual’s position. Conversely, if the new individual’s fitness is not superior, the original individual’s position will be retained.
Step 6: Once the maximum number of iterations has been reached, produce the optimal individual along with its corresponding fitness value. Otherwise, iterate through steps 4 to 6 again.
Step 7: Finally, use the obtained optimal individual, i.e., the optimal parameters for the damage penalty coefficient C and the low-rank coefficient τ, and substitute them into the SMM model.

3.2. Learning Algorithm

The hinge loss function, which adheres to the large margin principle, is integrated into SMM, along with a spectral elastic net penalty term. Additionally, both sparsity and robustness, two highly sought-after qualities in an effective classifier, are encompassed in it. However, neither the hinge loss nor the nuclear norm exhibits smoothness. The objective function for the initial matrix classification model is presented in Equation (20):
H ( W , b ) = 1 2 t r ( W T W ) + C i = 1 n 1 y i [ t r ( W T X i ) + b ] +
where W represents the regression coefficient matrix, and b denotes the bias term. The objective is to minimize a loss function that consists of two components, the first being the squared Frobenius norm of W, serving as a regularization term, and the second being the hinge loss function, which addresses sparsity and robustness in classification tasks. This formulation aims to classify data while maintaining the structural integrity of the data matrix. To better leverage the structural information within the data matrix, a nuclear norm regularization term is introduced to enforce a low-rank constraint on W. The proposed objective function of SMM is presented in Equation (21) as follows:
H ( W , b ) = 1 2 t r ( W T W ) + τ W * + C i = 1 n 1 y i t r ( W T X i ) + b +
The nuclear norm serves as a convex approximation to the matrix rank, thereby simplifying the optimization problem.
The steps for updating W and b based on the ADMM algorithm are as follows, given by Equations (22) and (23):
W * = 1 ρ + 1 Λ + ρ S + i = 1 n a i * y i X i
b * = 1 | S * | i S * y i t r W * T X i
where W * and b * are the optimal solutions of W and b in the iterative process, respectively. a i * is the Lagrange multiplier obtained by solving a quadratic programming problem with box constraints, and S * is the set of support vectors. These formulas are used to update the values of W and b in each iteration to approach the global optimal solution.
The trade-off between classification error and the regularization term is balanced by the damage penalty term included in the objective function. Specifically, C is a regularization parameter that weighs the complexity of the model against the classification error. When the value of C is large, more emphasis is placed on minimizing the classification error by the model, potentially leading to overfitting. Conversely, when the value of C is small, the regularization term is prioritized by the model, helping to avoid overfitting but potentially resulting in some sacrifice of classification accuracy. In the objective function (such as Equation (14)), the sum of the hinge loss functions is multiplied by C, representing the penalty for classification errors, and the determination of W and b is directly affected by this penalty through the optimization process that aims to minimize the objective function. Therefore, the solutions for W and b are affected by the value of C, enabling the model to strike a balance between classification accuracy and regularization.
Low-rank coefficient τ is used in SMM to control the low-rankness of the W matrix. By introducing the nuclear norm regularization term τ W , the W matrix tends to be selected by the model with a lower rank. A matrix with a low rank indicates that its columns (or rows) exhibit strong correlation, which aids in capturing potential structural information present in the data. The larger the value of τ, the stronger the constraint imposed on the low-rankness of the W matrix. As a consequence, sparser and more structured solutions for the W matrix are obtained, aiding in the extraction of key features from the data. Furthermore, the low-rank constraint contributes to preventing overfitting, as low-rank matrices possess fewer free parameters.
During the optimization process, the updates of W and b are influenced by these two parameters. Specifically, the values of W and b are iteratively updated by ADMM until convergence is reached. In this process, the update direction and step size of each iteration are directly influenced by the values of C and τ, thereby affecting the final solutions for W and b. In summary, the damage penalty term C and the low-rank coefficient τ have significant impacts on the calculation of W and b. The solutions for W and b are influenced by the control exerted over the regularization term and loss function within the objective function.
The parameters C and τ typically rely on manual experience and, in traditional approaches, are fixed once determined. However, considering that the number of input eigenvalues may vary, the corresponding SMM construction should be flexible to adapt to different dataset characteristics. Based on specific model construction differences, the parameters C and τ are proposed to be dynamically optimized using an efficient WOA to maximize accuracy, leveraging renowned unique structural advantages and powerful ability to handle complex data across various scenarios. The optimal performance of the model in different contexts is ensured by this approach, and the adaptability and accuracy of SMM in handling diverse data are enhanced.

4. Application to Roller Bearing Fault Diagnosis

In the preceding sections, the significance and limitations of rolling bearing fault diagnosis methods were explored, and our novel technique, WOA-SGMM was introduced. Experimental analysis that demonstrates the effectiveness of WOA-SGMM is presented in this section. The procedure, which includes data acquisition, preprocessing, feature extraction, and model establishment, is outlined. Its performance across various datasets is showcased by case studies, and its advantages are highlighted by comparisons with state-of-the-art methods, providing a comprehensive understanding of its real-world applicability and significance.

4.1. Introduction to Fault Diagnosis Process

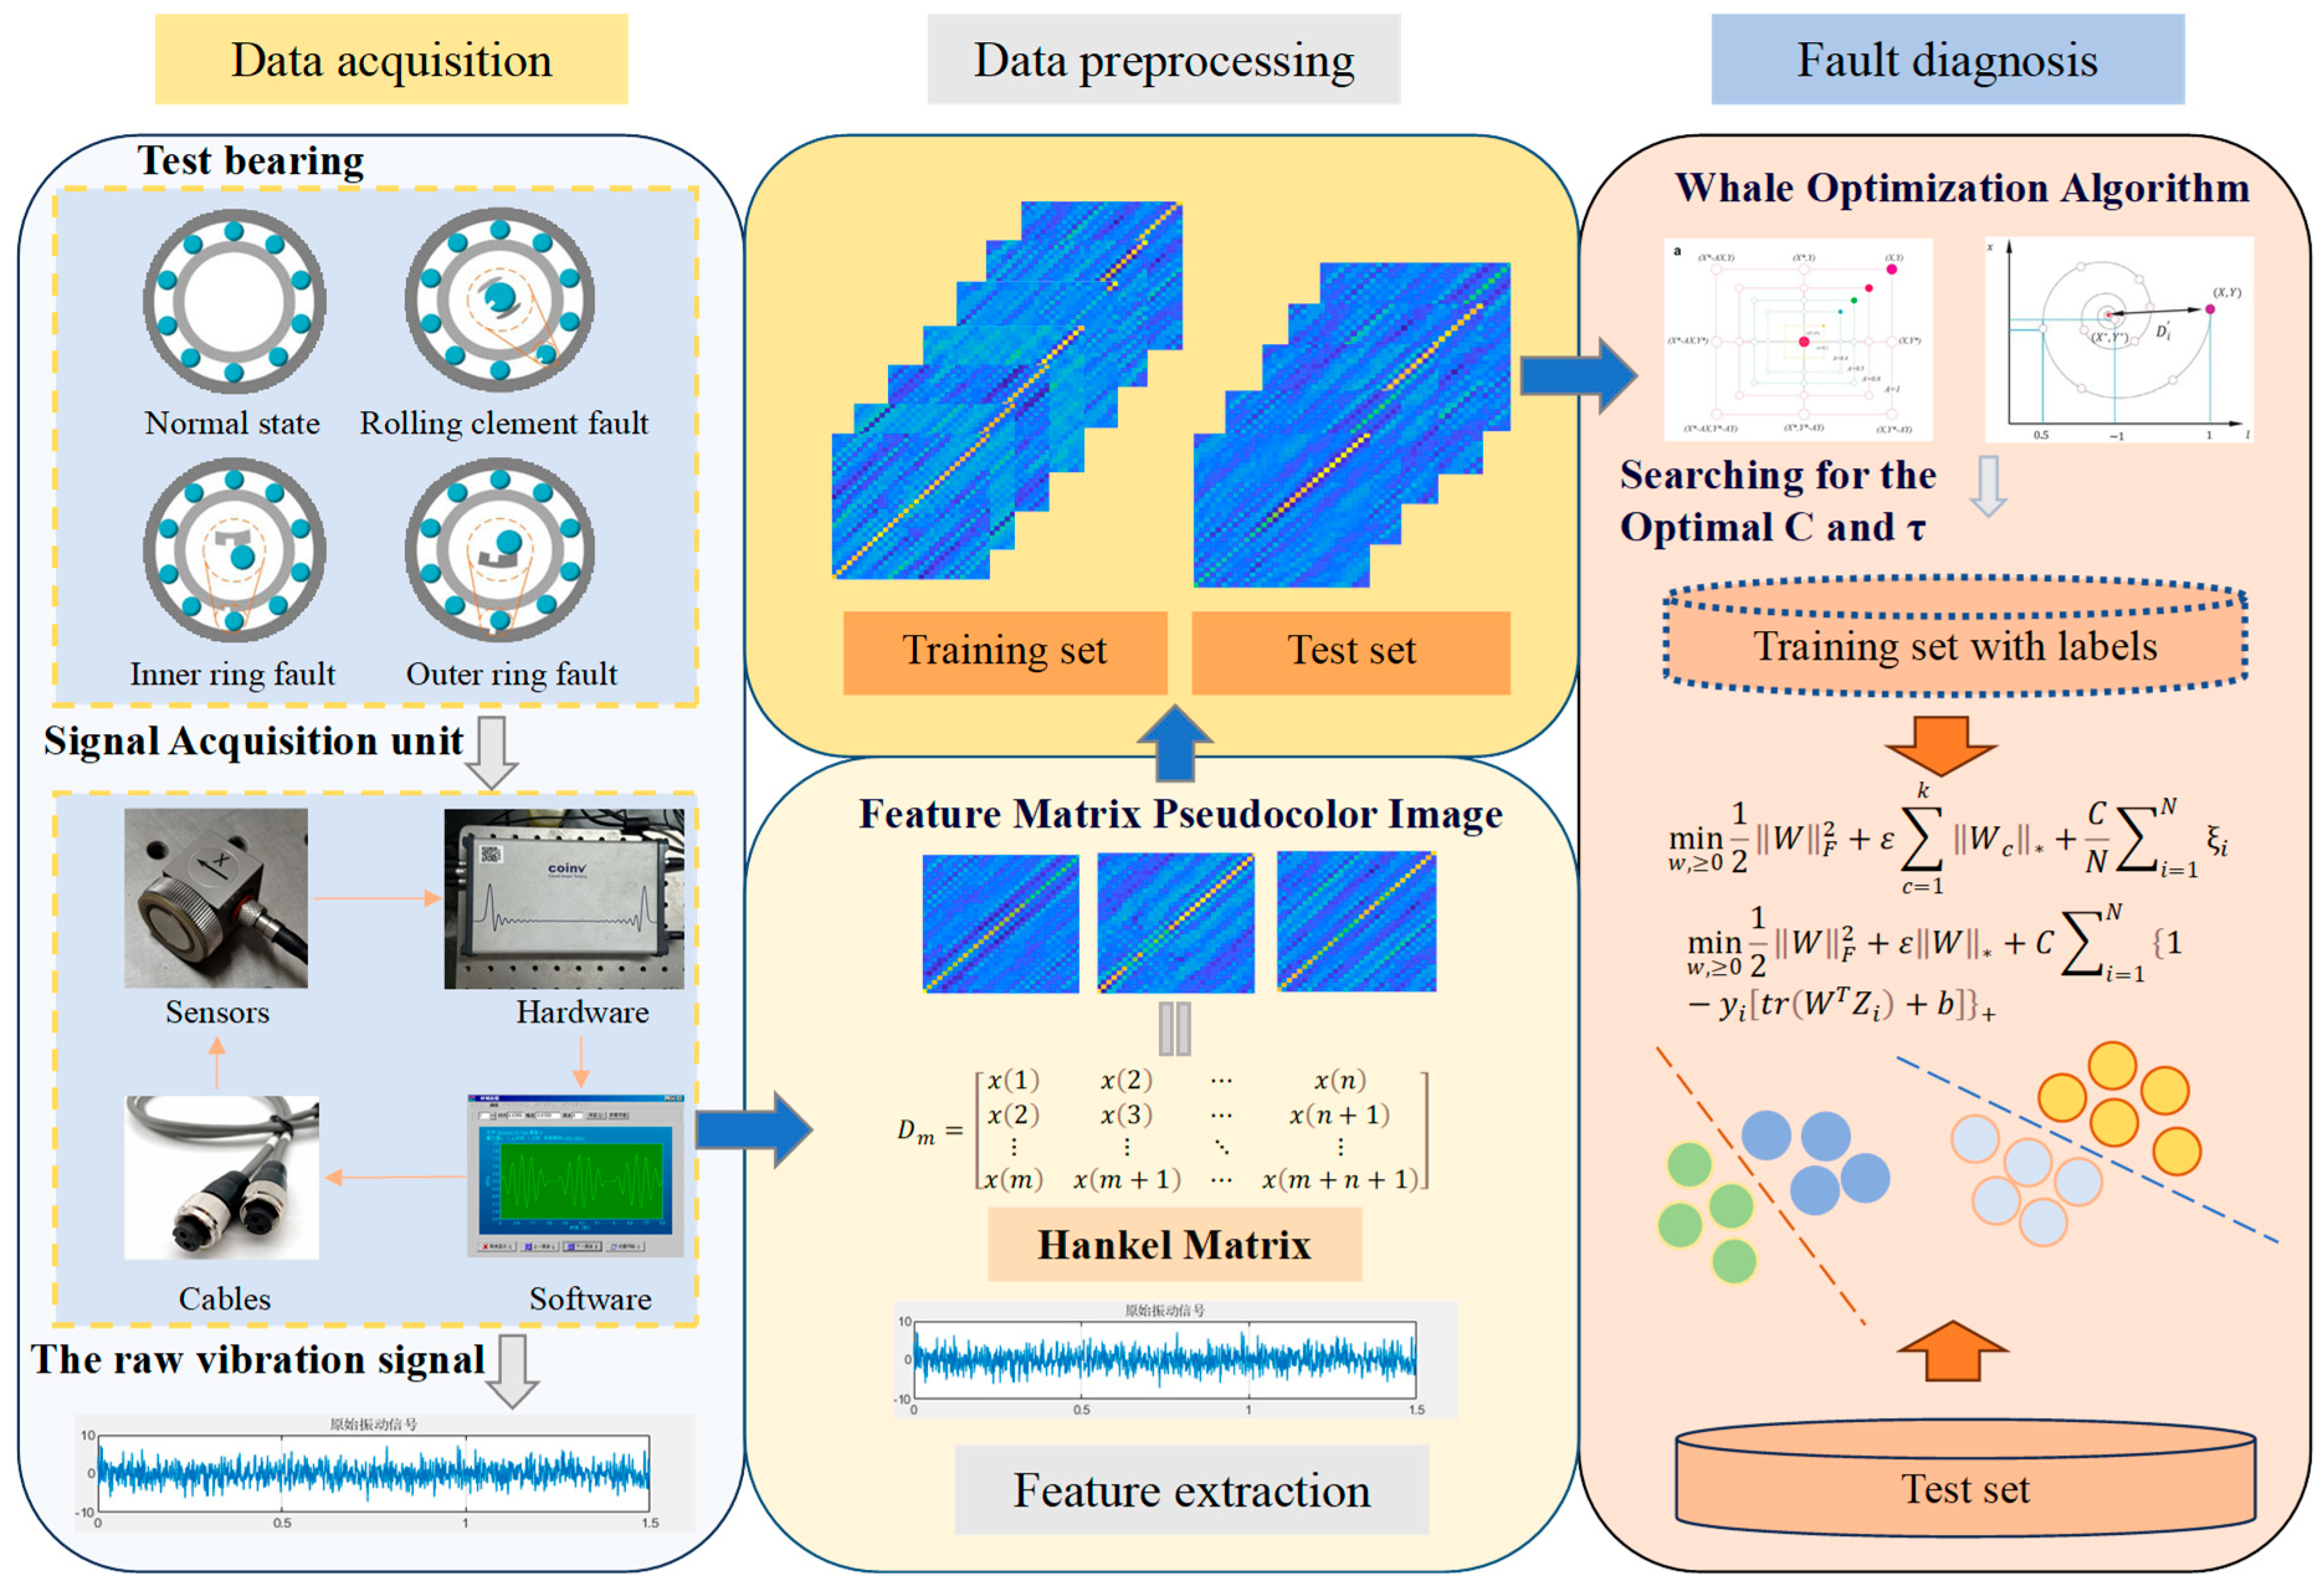
In the preceding section, the theory behind the WOA-SGMM method was thoroughly explained. In this section, the proposed method is applied to the fault diagnosis of rolling bearings. The diagnostic process, utilizing the WOA-SGMM approach, is illustrated in Figure 3 and is organized into three distinct steps.
Step 1: Collect vibration signals from a fault simulation test rig under different bearing health conditions, and construct source domain and target domain datasets using vibration signals from various operating conditions.
Step 2: Then, the raw vibration signals undergo noise reduction and filtering processes to create training and testing samples.
Step 3: Finally, a diagnostic model based on SGMM is developed utilizing fault samples of known states, which is then applied to identify unknown samples.

4.2. Fault Diagnosis Experiment and Result Analysis

This subsection presents three case studies to comprehensively evaluate the performance of the proposed method. To ensure the reliability and statistical significance of the results, all experiments were repeated ten times independently, and the average accuracy is reported.
Case 1: Using the rolling bearing fault dataset from Anhui University of Technology (AHUT) as an example, the experimental process, parameter settings, and result analysis are described in detail. A 5-fold cross-validation strategy was employed. By comparing it with other advanced methods, the superiority of the WOA-SGMM is demonstrated.
Case 2: To further verify the generalization capability, experiments were conducted using the Case Western Reserve University (CWRU) dataset. A 5-fold cross-validation strategy was also utilized for this dataset.
Case 3: Finally, to validate the model under specific fixed training/testing splits, the Hunan University of Technology (HNU) dataset was utilized. Unlike the previous cases, this experiment adopted a fixed partition of 100 samples for training and 60 samples for testing.

4.2.1. Case 1

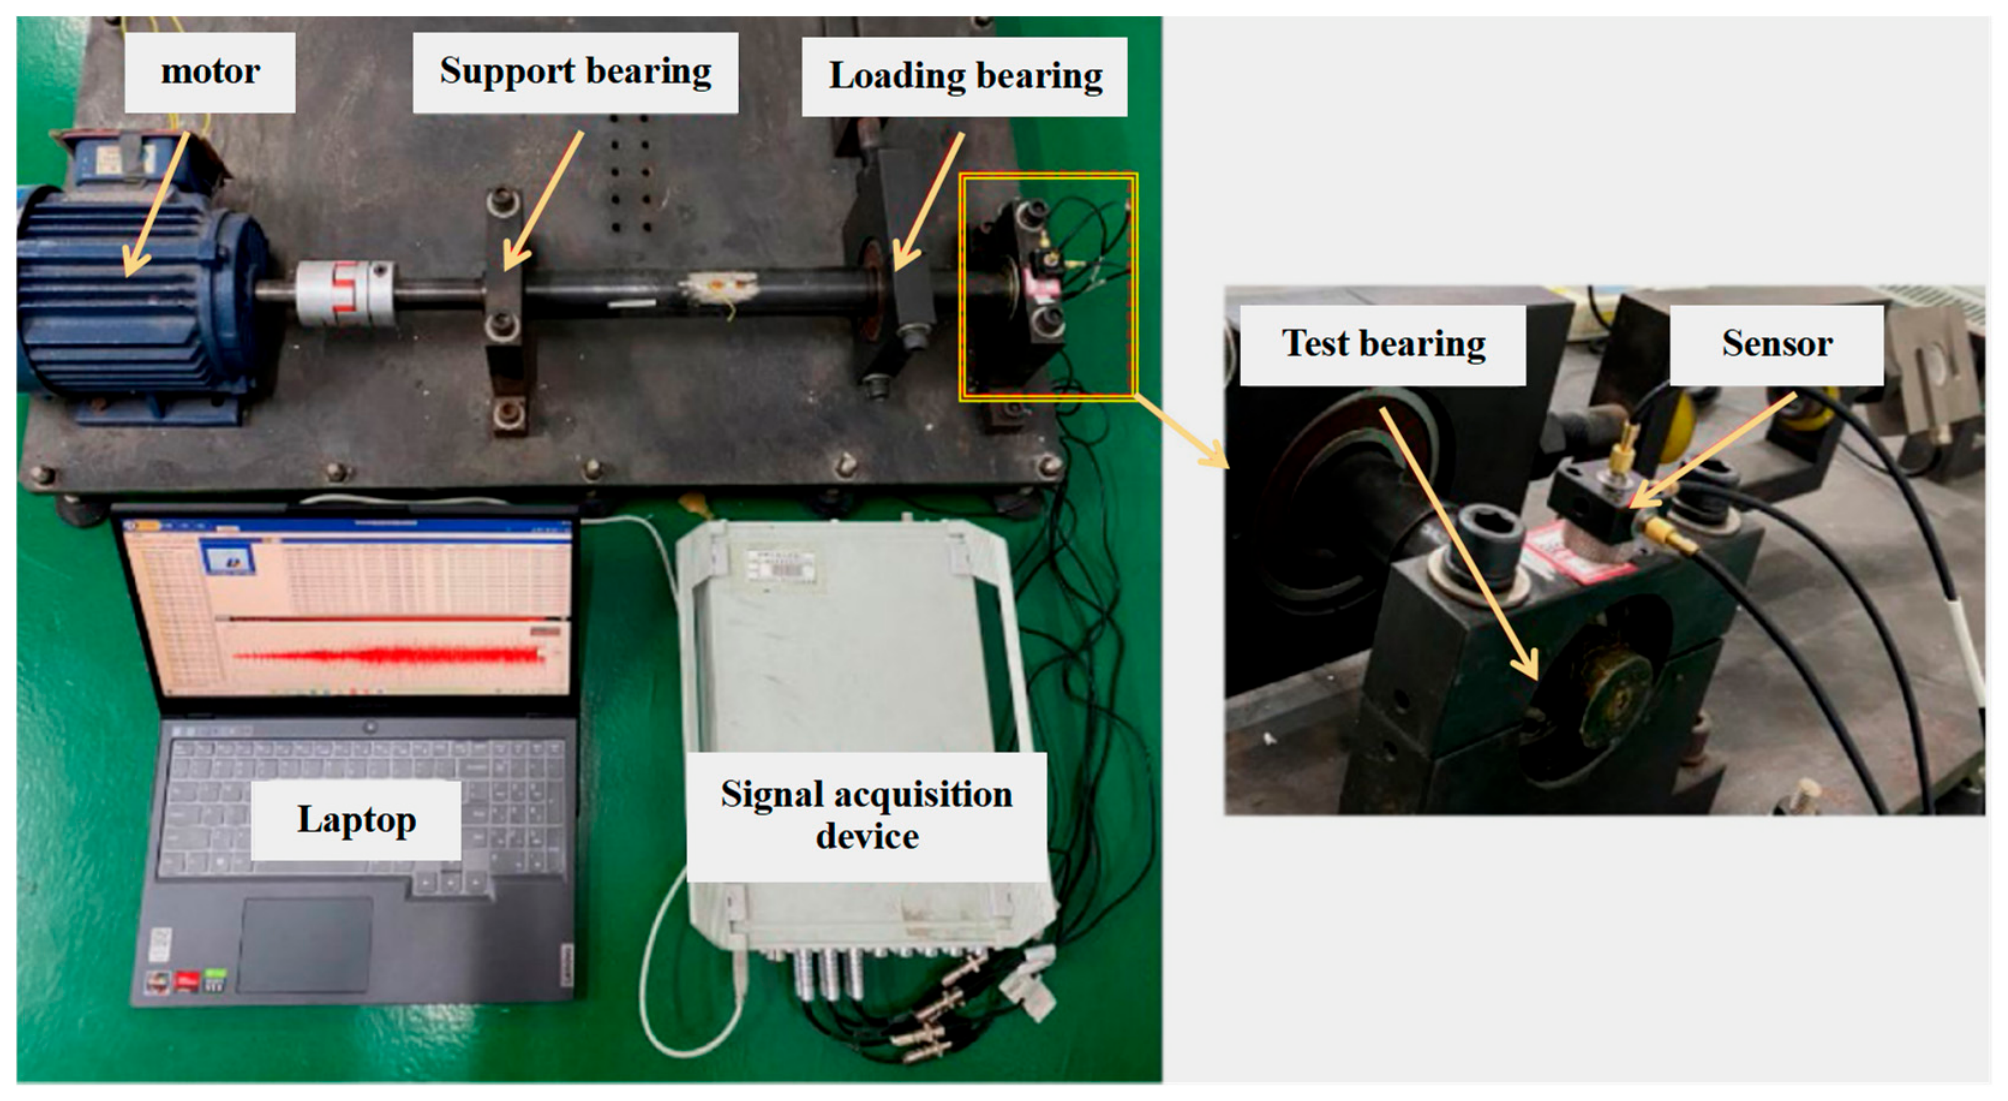
To assess the effectiveness of WOA-SGMM, the rolling bearing fault dataset from AHUT was utilized. The test rig employed by AHUT is illustrated in Figure 4. The vibration signals were acquired using a PCB 608A11 accelerometer (sensitivity: 100 mV/g) mounted axially on the bearing housing to capture the fault impacts effectively. The signal was conditioned and digitized using an NI USB-4431 data acquisition card with a sampling frequency of 8192 Hz. The data was recorded on a Dell Precision Tower 7810 workstation (Intel Xeon E5-2687W v4 CPU, 64 GB RAM). Prior to the experiment, the sensor and acquisition channel were calibrated using a standard vibration calibrator (BK 4294) to ensure measurement accuracy.
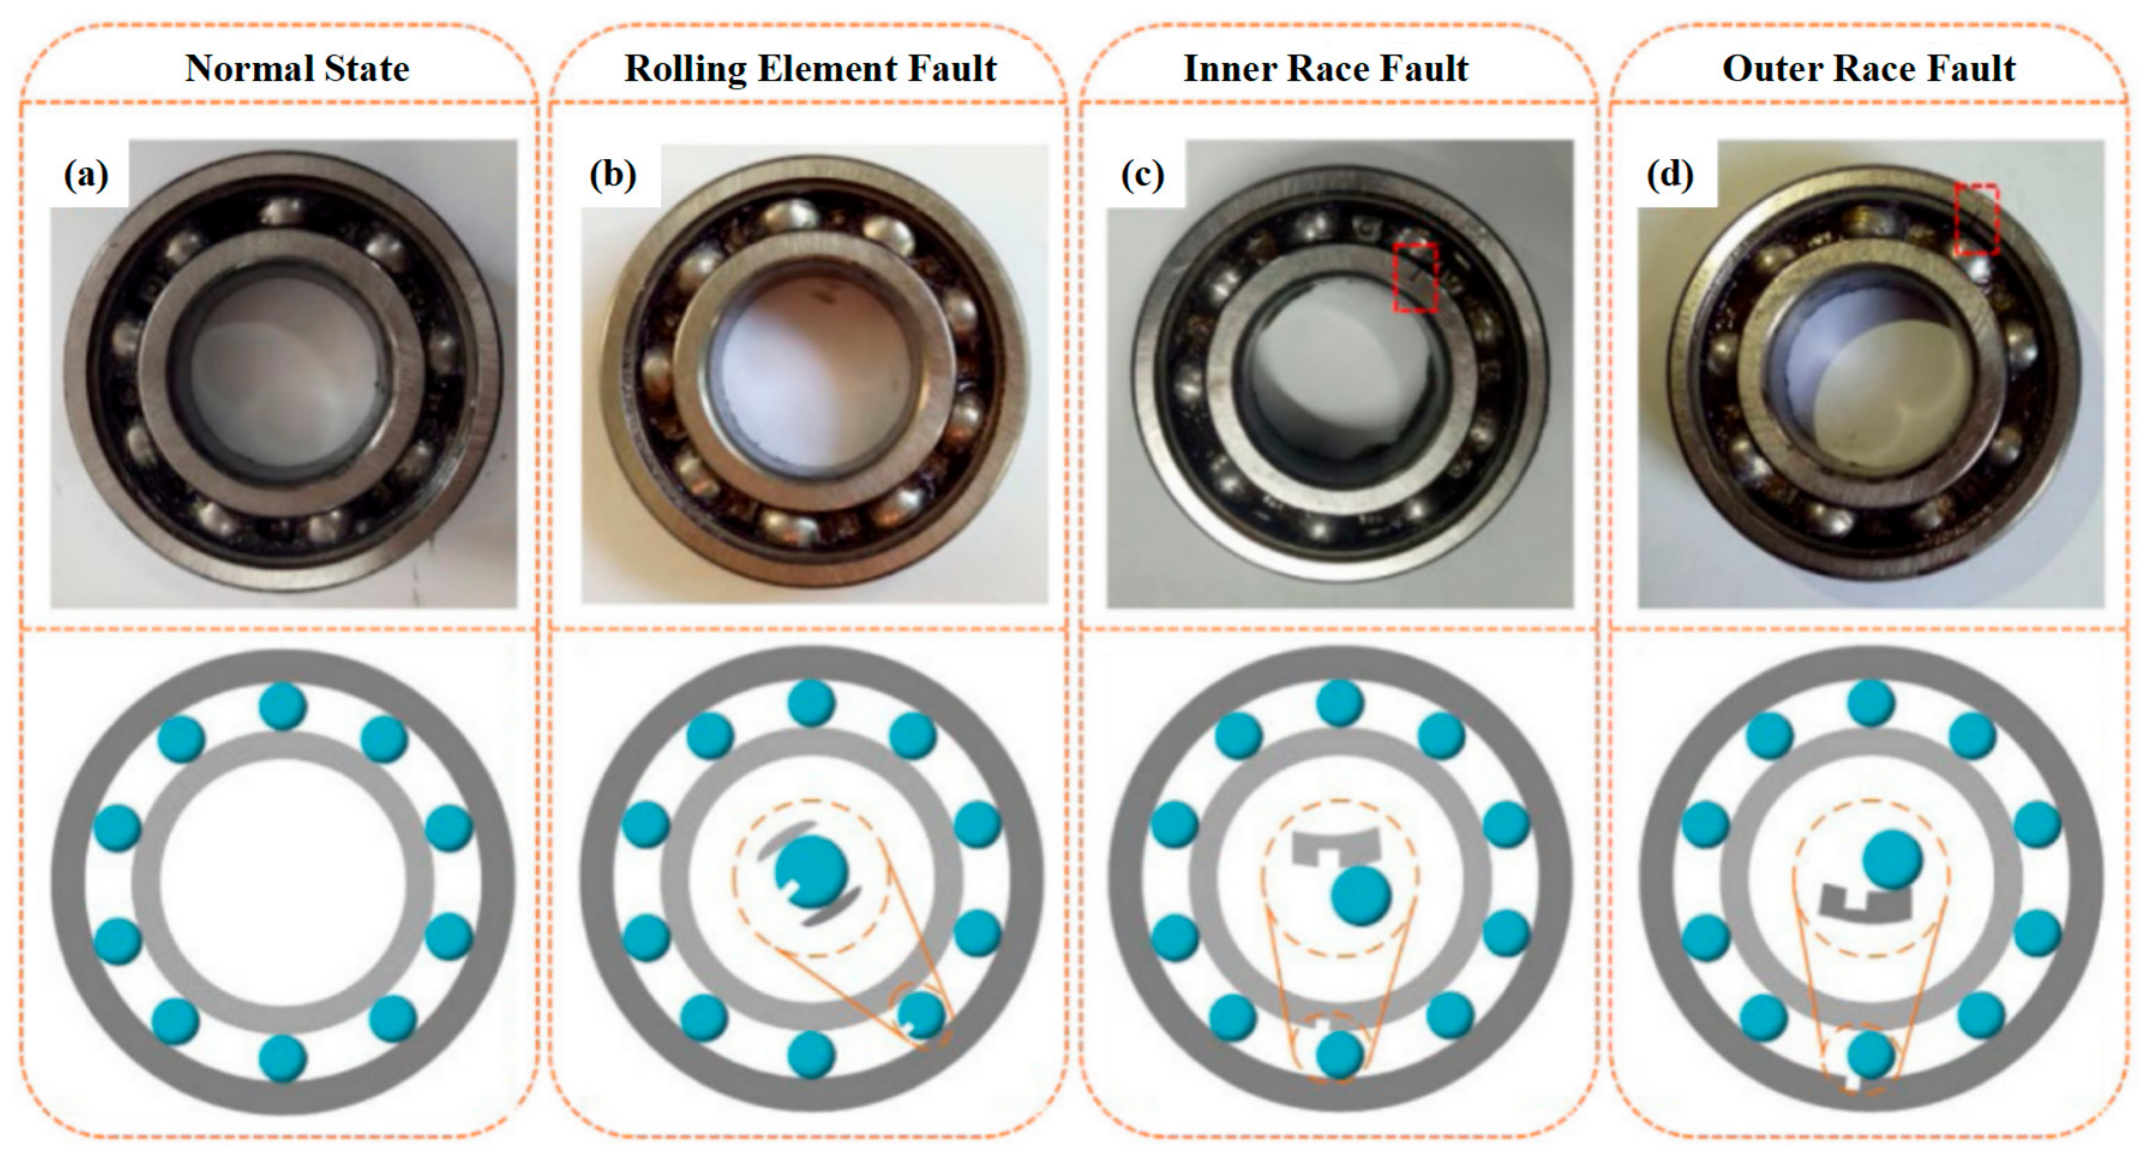
The rolling bearing utilized in this test rig is of the SKF6206 type. It is important to clarify that the test rig consists of a motor, a rotating shaft, and the test bearing, without any gear transmission systems (e.g., bevel or spur gears). Subsequently, electrical discharge machining (EDM) technology is utilized to remove a specific section of the bearing in order to mimic bearings with faults under various conditions. These conditions encompass the normal state (NS), rolling element fault (REF), inner race fault (IRF), and outer race fault (ORF), as depicted in Figure 5.
Vibration signals were gathered under varying bearing conditions, loads, speeds, and sampling frequencies. A triaxial sensor served to capture these vibration signals, with each sampling session lasting for 20 s. In this part of the study, we focused on the vibration signals obtained from the rolling bearing subjected to a load of 5 N and sampled at a frequency of 8192 Hz for our experimental analysis. Detailed information regarding the depth of the bearing faults and the motor speed is provided in Table 1. For each load condition, 160 samples were chosen to form the dataset, with each sample comprising 1024 sampling points. To mitigate the impact of random variations, the experiment was repeated ten times. Specifically, the dataset was randomly divided into five equal-sized subsets. The model was trained on four subsets and tested on the remaining subset. This process was repeated five times, with each subset serving as the test set exactly once (5-fold cross-validation). The final performance metrics were averaged over the five trials and further averaged across the ten independent repetitions to provide a robust estimate of model accuracy.
Fundamentally, phase space reconstruction is utilized by SGST, which ensures the intact preservation of fault information embedded in the original signal, thereby generating a two-dimensional symplectic geometry coefficient matrix that can be directly input into SGMM. In the implementation of SGST, the embedding dimension and the column count of the orthogonal matrix were set to 32 and 18, respectively, for the purposes of this experiment. Ultimately, SGST was utilized to extract a symplectic geometry coefficient matrix (32 × 32) from each sample (1024 × 1).
Through experimentation with various combinations of cycle numbers and population sizes for the whale optimization algorithm (WOA), the classification time and accuracy for different settings were obtained. By configuring the parameters of WOA—specifically setting the number of iterations to 50 and the population size to 30—we optimized the low-rank parameter τ and the loss penalty parameter C of the SGMM. Detailed algorithm parameter settings and the optimization ranges for the target parameters are provided in Table 2. After data preprocessing, the input was fed into the WOA-SGMM framework, employing 5-fold cross-validation. The classification accuracy of SGMM under 5-fold cross-validation served as the fitness function for optimization.
For the testing phase, 160 samples from each bearing condition were chosen and subjected to 5-fold cross-validation. The preceding analysis confirms the practical applicability of WOA-SGMM. In order to showcase the advantages of our proposed method, we compare it to several cutting-edge classification techniques, using WOA-SGMM as the benchmark.
(1)
STFT: When using STFT, one has to balance between achieving high time resolution and high frequency resolution, as improving one often comes at the expense of the other. In noisy environments where there is significant interference, it becomes difficult to accurately identify signals. However, this comparison shows that SGST exhibits greater robustness and accuracy in processing signals from rolling bearings.
(2)
CWT: Continuous wavelet transform (CWT) has advantages such as multi-resolution analysis, accurate time–frequency localization, and strong adaptability, but it suffers from high computational complexity and sensitivity to the choice of wavelet functions. In contrast, SGST exhibits unique advantages with its in-depth signal feature extraction capabilities, strong resistance to noise interference, and suitability for complex signal analysis.
(3)
VMD: Variational mode decomposition (VMD) has advantages such as strong adaptability, robust resistance to noise interference, and high computational efficiency. However, the reliance of VMD on signal characteristics and the subjectivity in parameter selection may limit its application in certain complex signal processing scenarios.
(4)
SGMD: Symplectic geometry mode decomposition (SGMD) exhibits unique advantages in rolling bearing signal processing by preserving the inherent characteristics of time series, suppressing mode mixing, and being suitable for non-stationary signals. However, it has drawbacks such as high computational complexity and limited ability to handle strong noise signals.
(5)
SGST: By introducing the symplectic geometric structure, it can reveal the intrinsic geometric and topological structures of signals, thereby providing deeper signal feature extraction and analysis capabilities. When processing rolling bearing signals, it has lower requirements for signal stationarity, nonlinearity, and other characteristics, making it better suited to handle complex signals. It may exhibit stronger robustness when dealing with noisy signals, more effectively extracting useful fault information from the noise, and improving the accuracy and reliability of fault diagnosis.
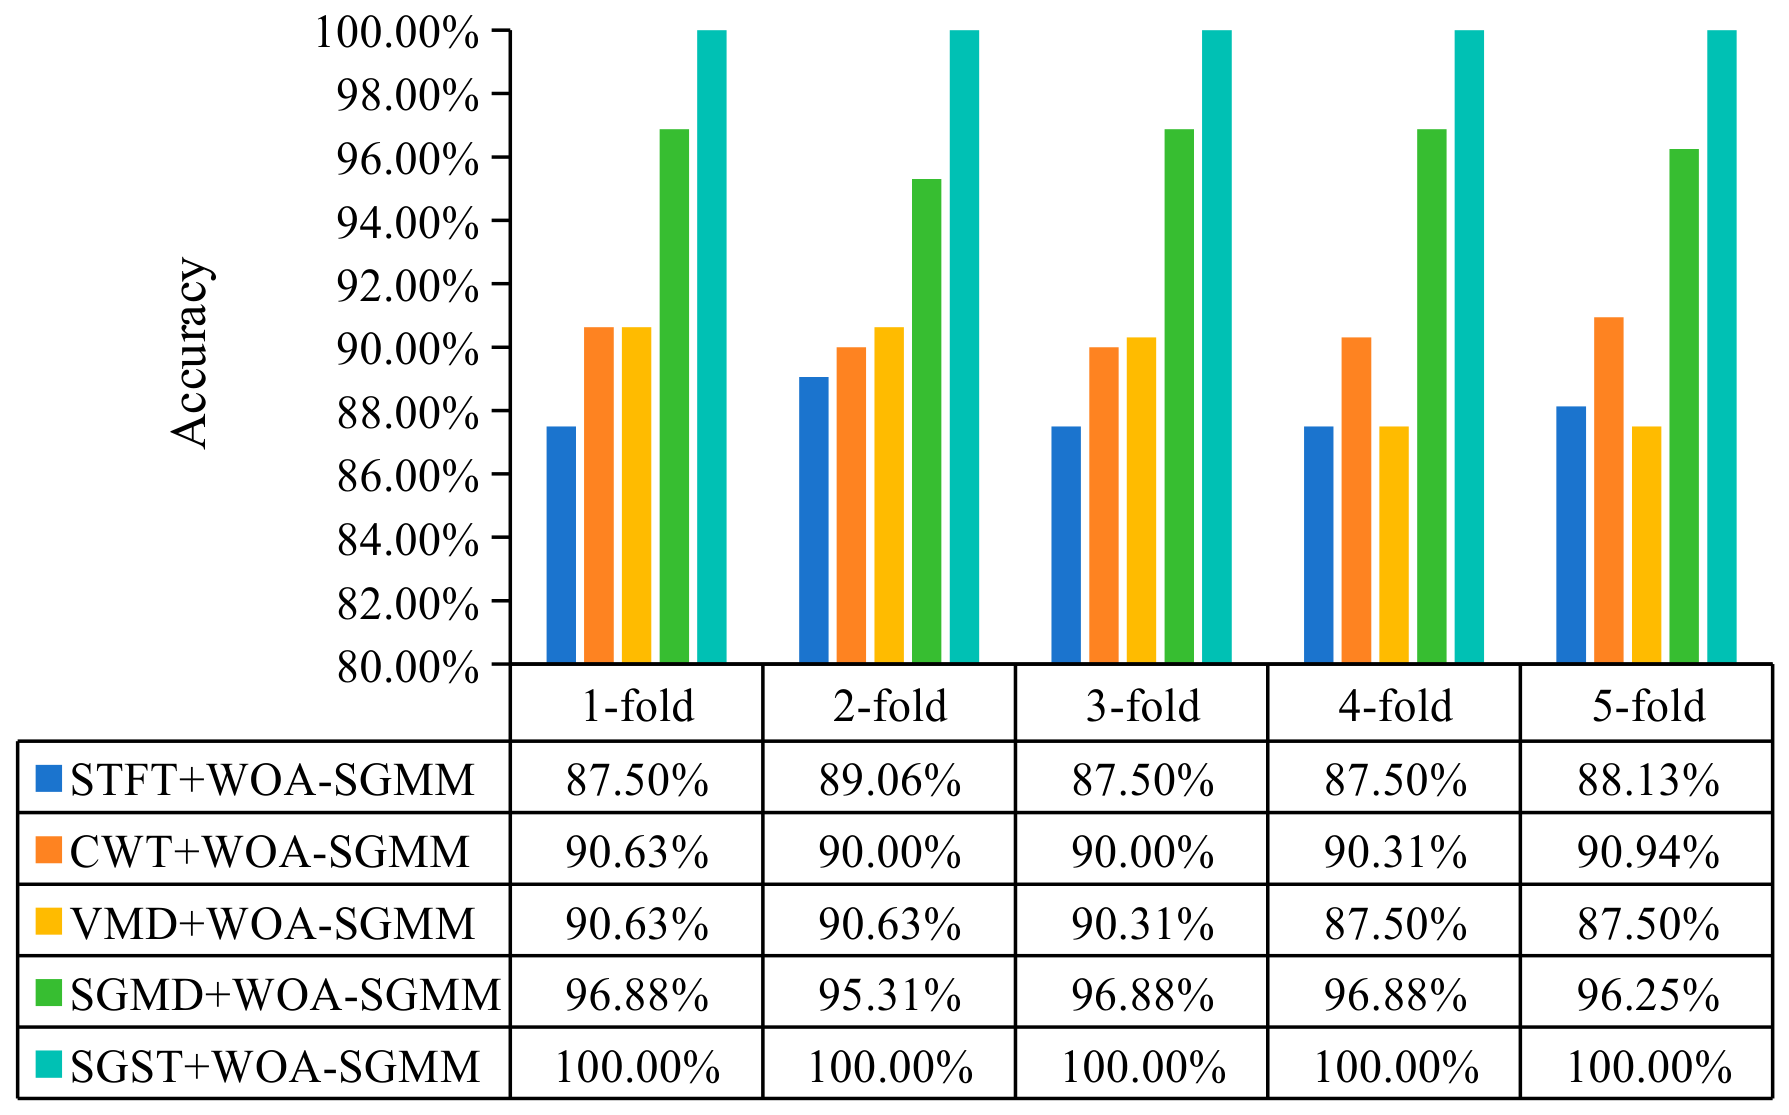
A gradual increase in recognition rates for STFT, CWT, VMD, SGMD, and SGST is demonstrated in Figure 6. As can be seen from Table 3, only SGST is capable of deeper signal feature extraction and has stronger adaptability to signal characteristics, and WOA-SGMM achieves the best classification results for the feature matrix extracted by SGST. Comprehensive experiments were carried out using various training datasets for all the other methods, in order to generate classification results that can be directly compared with those obtained from the proposed WOA-SGMM.
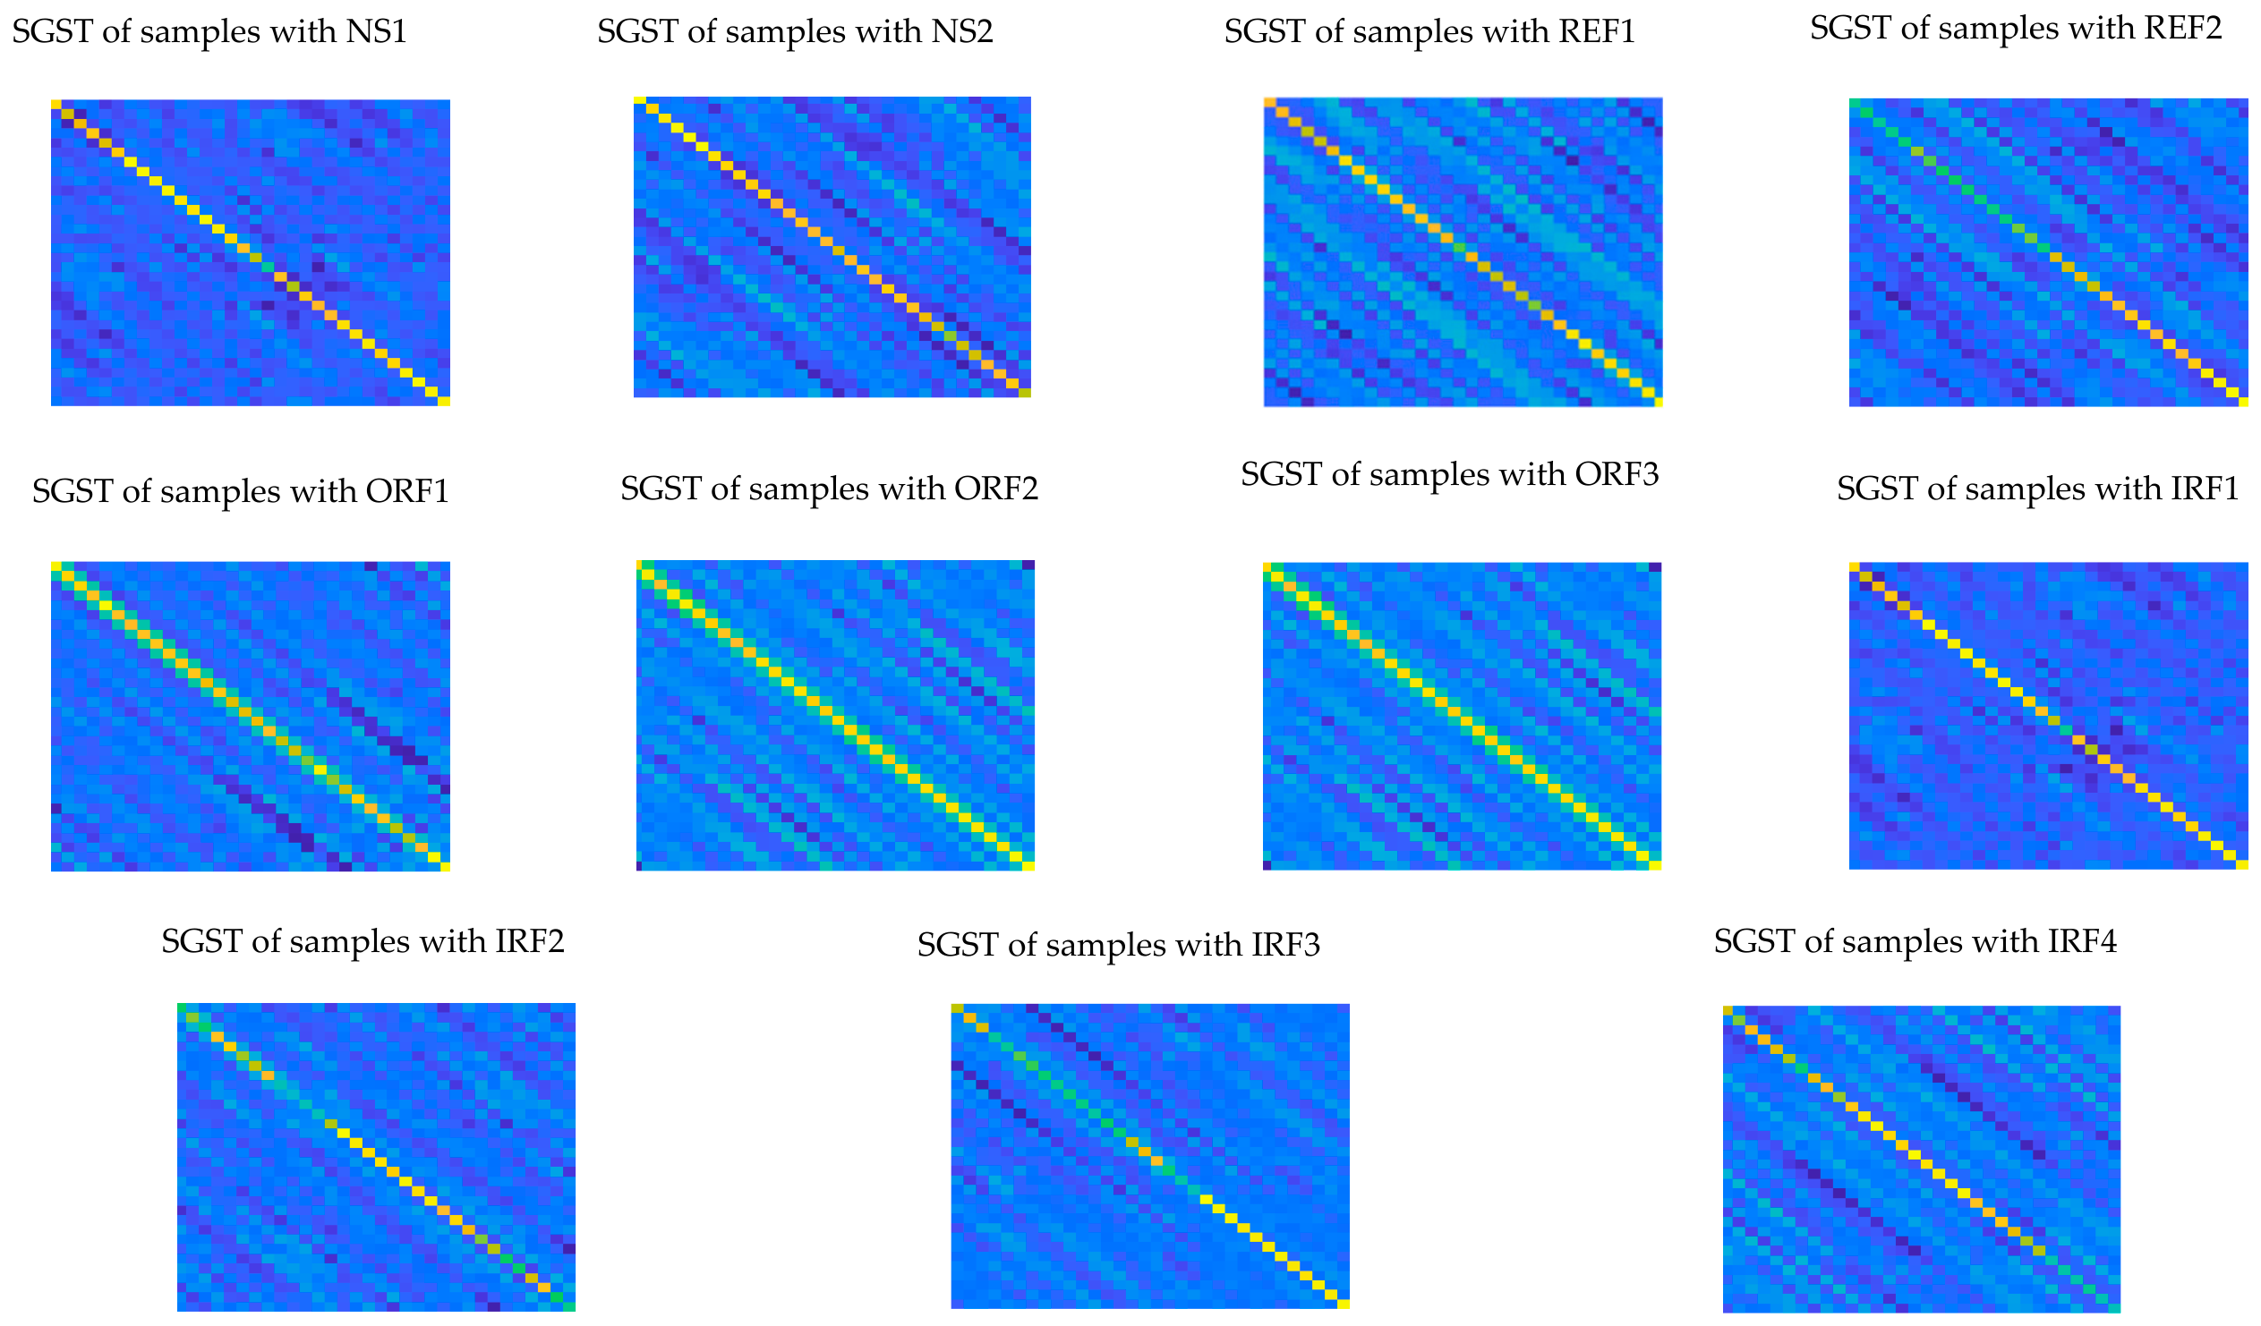
A comparison is made between the RGB images constructed from the symplectic geometric coefficient matrices and the corresponding feature weight matrices generated by the WOA-SGMM method. It is evident from Figure 7 that WOA-SGMM is adept at capturing the structural details present in various sample types. The general structure of these weight matrices aligns well with the distinctive features of each sample type. Given that samples within the same class exhibit similar structural information, whereas samples from different classes display distinct structural patterns, WOA-SGMM is capable of extracting features from the matrix samples and subsequently classifying them accurately.
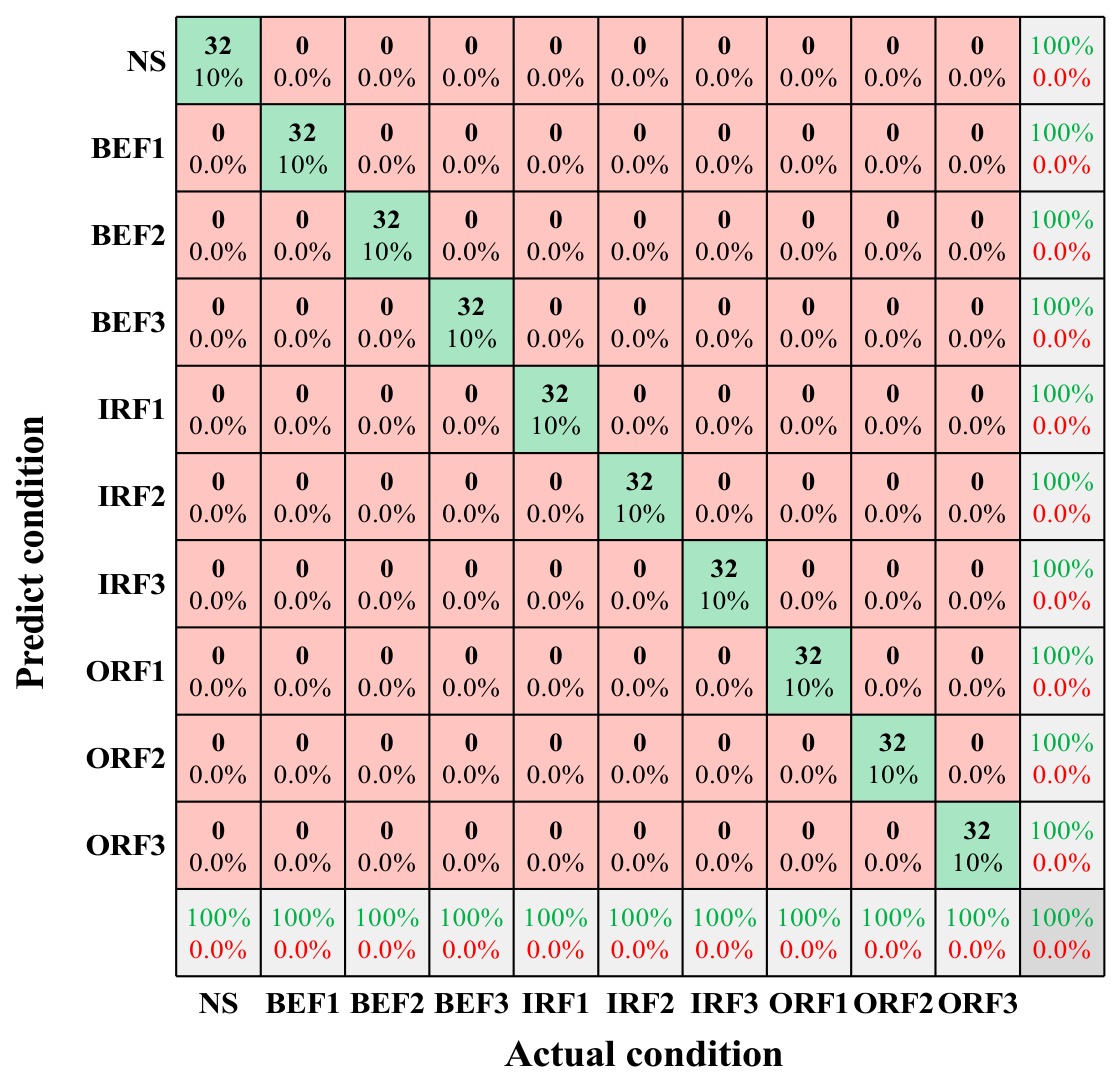
Then, 160 samples were selected from each bearing condition for the experiment. To gain a clearer understanding of the fault diagnosis results, a confusion matrix based on the classification results is shown in Figure 8 and fault samples for these 10 bearing conditions were all correctly identified, with an overall diagnostic accuracy of 100%, indicating that WOA-SGMM has high classification accuracy for the fault diagnosis of rolling element bearings.
To verify that WOA-SGMM possesses higher accuracy, it was compared with SVM, SMM, MSMM, and RSMM. Each model undergoes parameter tuning, and the parameter settings for the other models are specified in Table 4. To ensure the scientific rigor of the experiment, it is important to note that, out of the five methods discussed, only SVM is operated as a vector-based classifier. The samples are processed by SVM through the conversion of symplectic geometric coefficient matrices into vectors. In contrast, the symplectic geometric coefficient matrices (32 × 32) are utilized directly as samples by the other methods, without any vectorization.
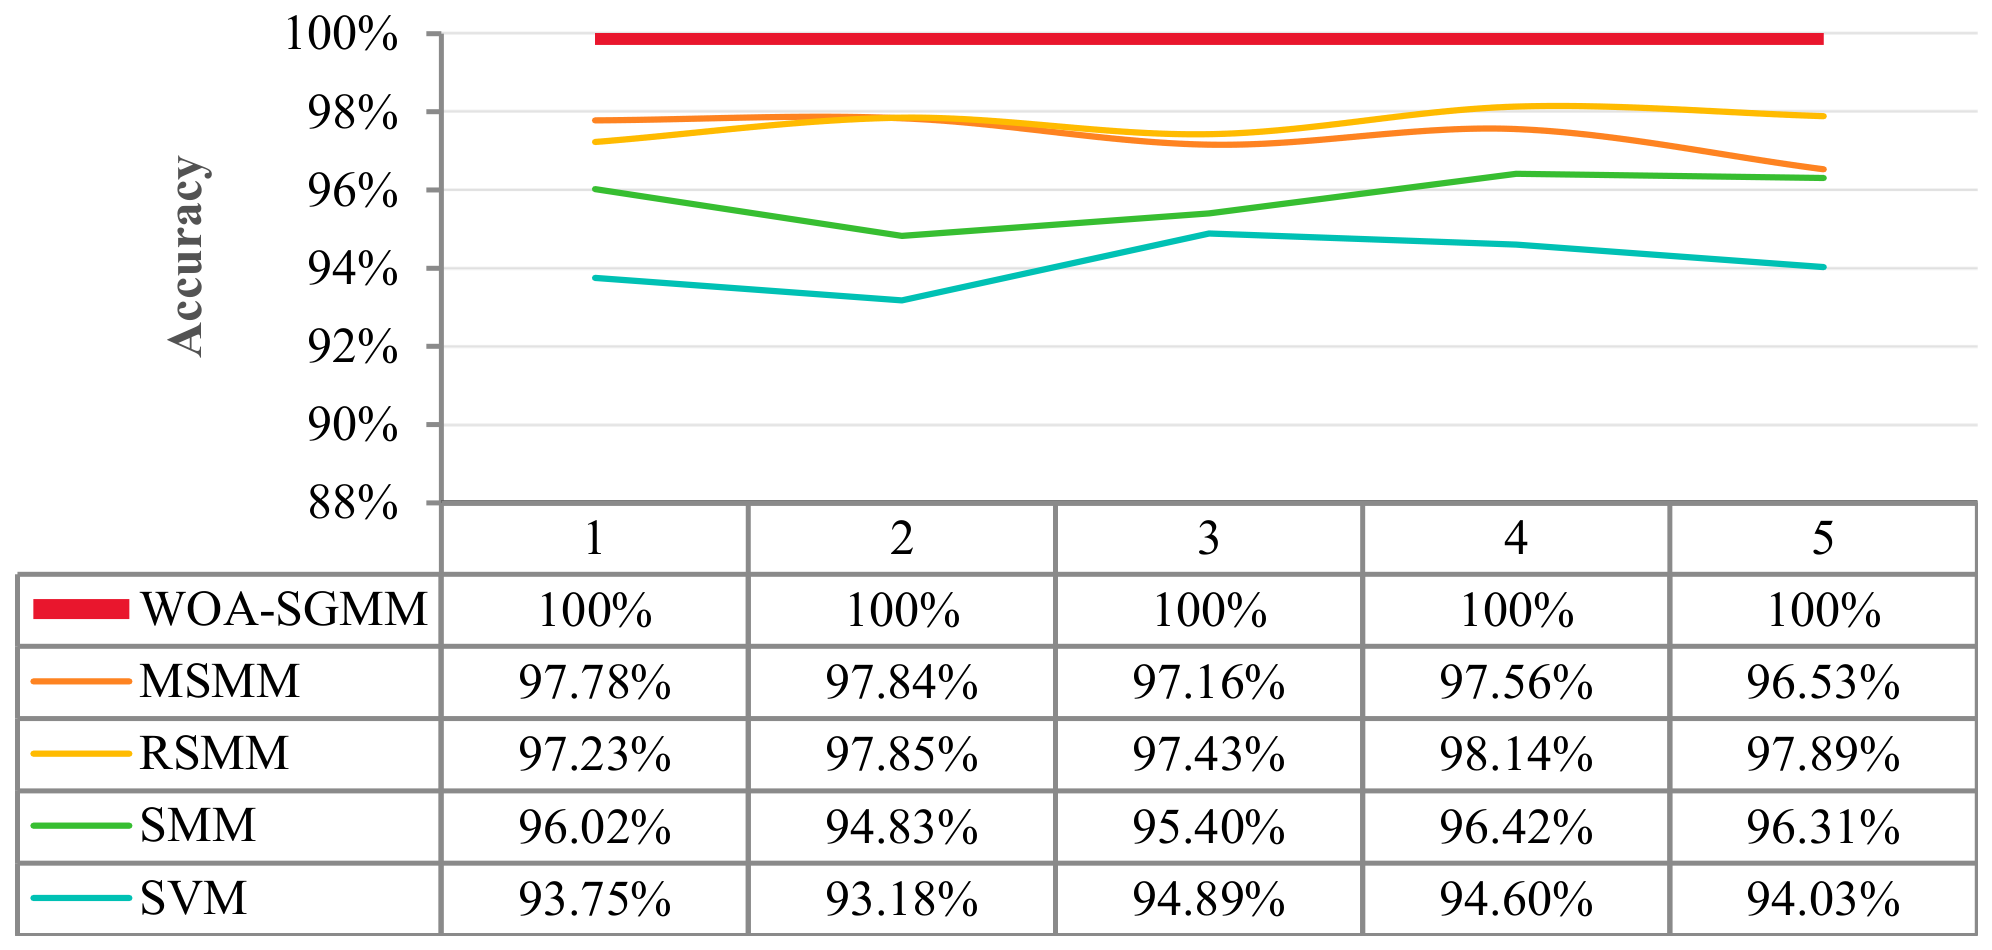
In total, 160 samples were selected from each bearing condition, and then a 5-fold cross-validation experiment was conducted using the five methods. The classification accuracy for each fold in the 5-fold cross-validation experiment is shown in Figure 9. It can also be seen that the WOA-SGMM method exhibits the highest classification accuracy among the five methods, and in the 5-fold cross-validation experiment, all five results attained 100% accuracy.

4.2.2. Case 2

In the first case study, it was shown that the WOA-SGMM method is effective for diagnosing faults in a standard rolling bearing dataset. To further evaluate the fault diagnosis capabilities of the method in more challenging scenarios, additional experiments were conducted using a rolling bearing fault dataset from CWRU, which encompasses more complex operating conditions and more severe fault impacts.
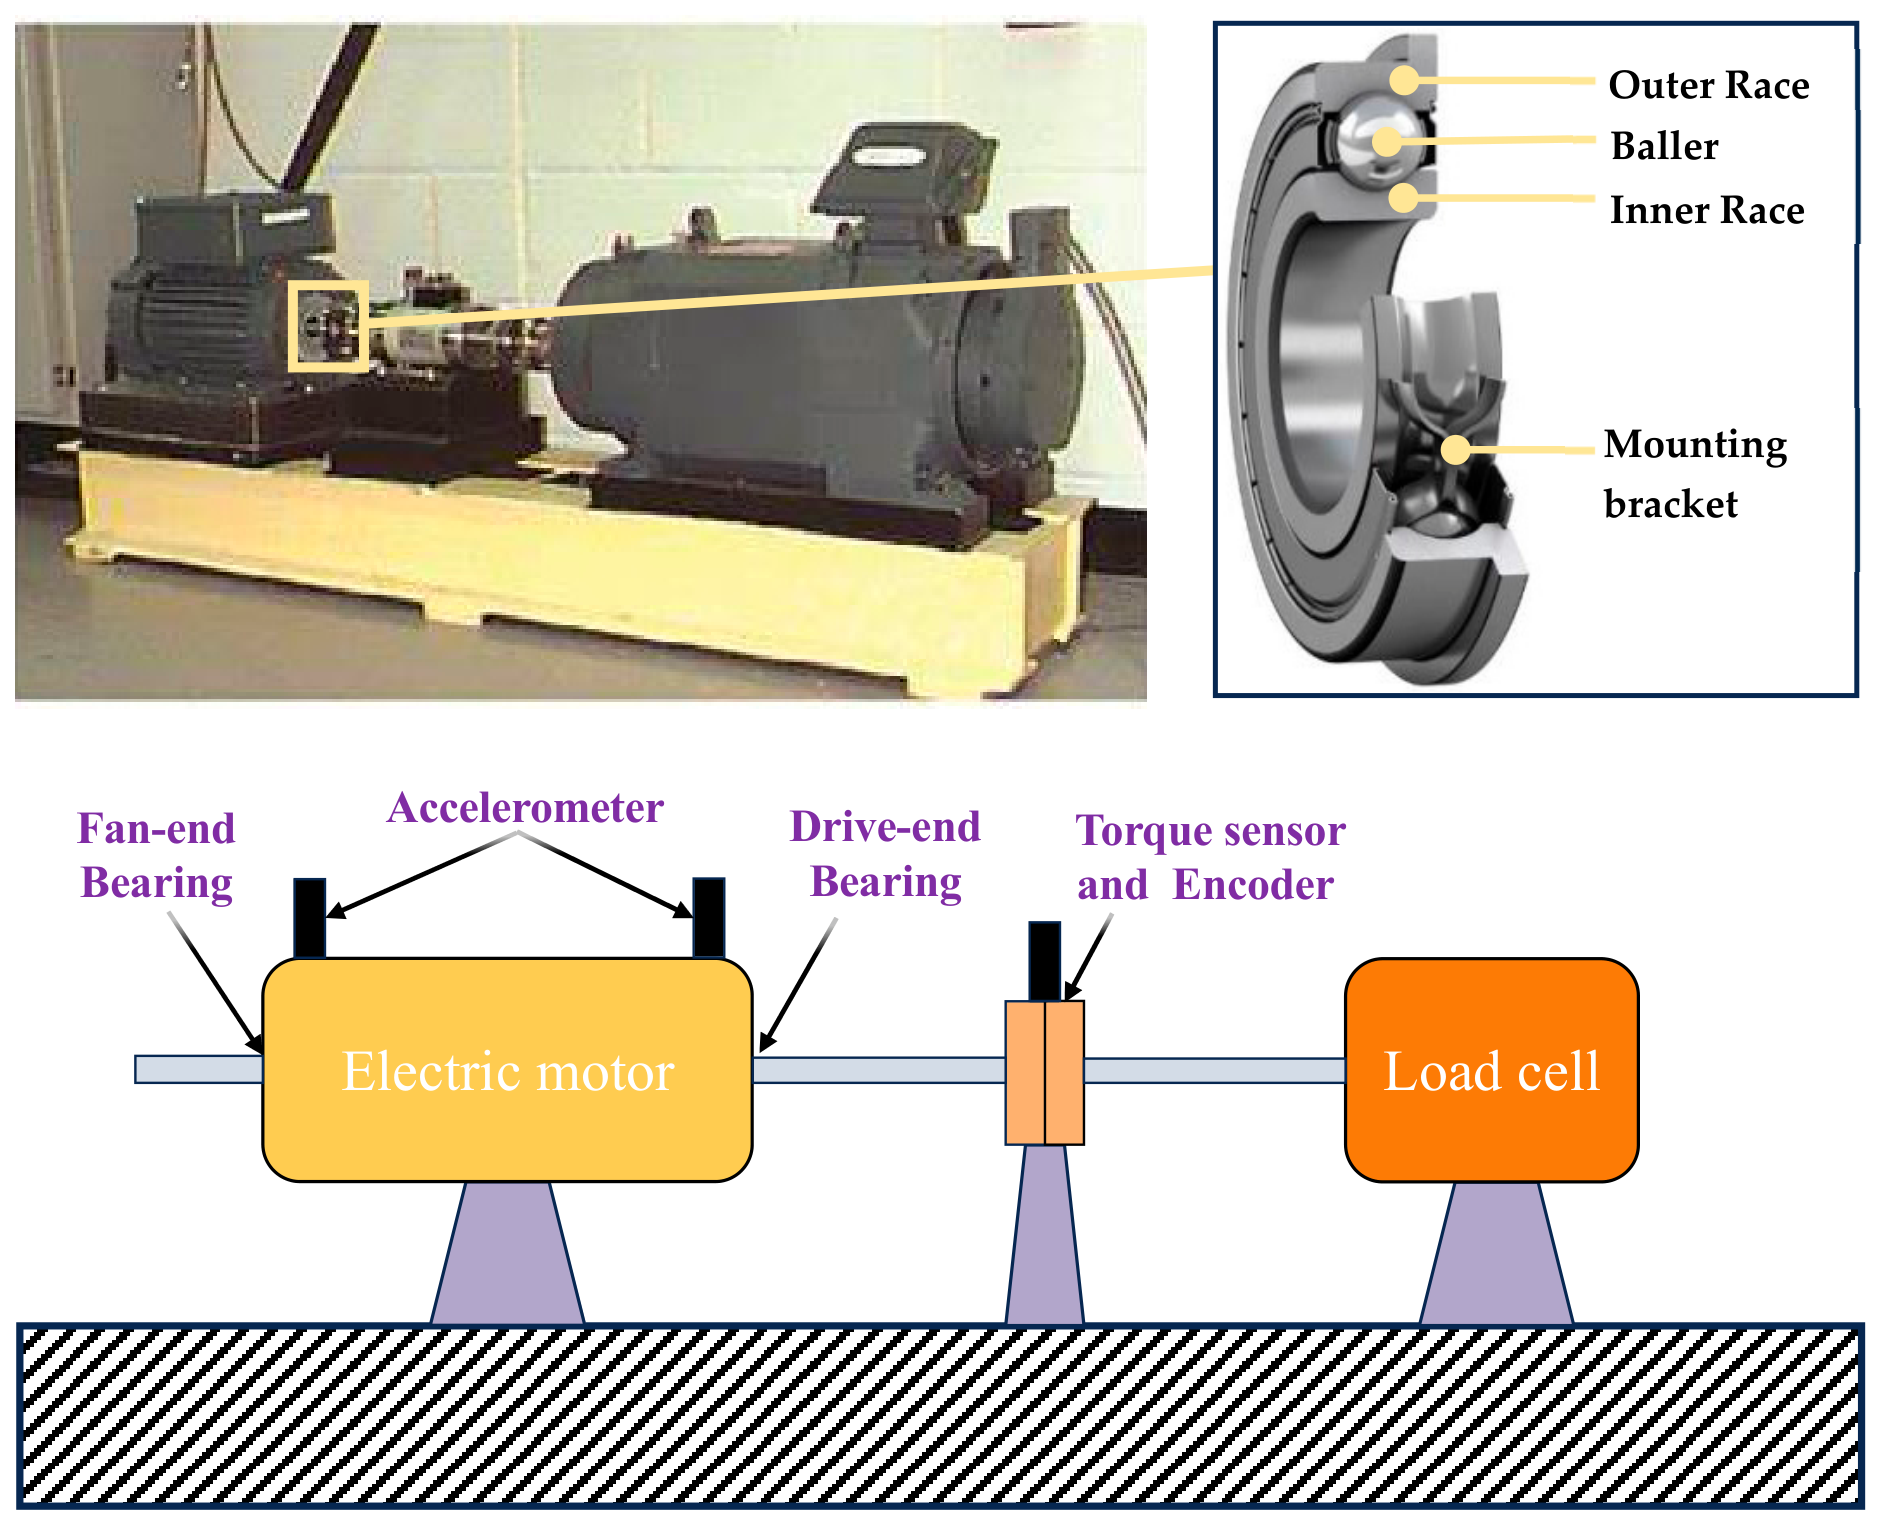
The experimental setup utilized in the CWRU study is illustrated in Figure 10. Unlike the self-built test rigs at AHUT and HNU, the CWRU dataset was collected using a 2 hp Reliance Electric motor with deep groove ball bearings (SKF 6205-2RS JEM, Reliance Electric, Cleveland, OH, USA).
Vibration signals were measured using PCB 603B accelerometers mounted on the drive-end and fan-end of the motor housing. The data was acquired at a sampling rate of 12 kHz (or 48 kHz for some files) using a 16-bit A/D converter.
A comprehensive summary of the experimental parameters and fault specifics pertinent to the CWRU rolling bearing fault dataset is provided in Table 5. The dataset was recorded at a sampling frequency of 12,000 Hz, with the motor operating at 1797 rpm under a load of 0.746 kW. To create the dataset for the CWRU experiment, 160 samples were chosen from each fault condition. To ensure statistical rigor, the experiment was repeated ten times. In each repetition, the samples were randomly divided into five equal-sized subsets. The model was trained on four subsets and tested on the remaining subset. This process was repeated five times (5-fold cross-validation), with each subset serving as the test set exactly once. The final performance metrics were averaged over the five trials within each repetition, and the results across the ten repetitions were averaged to provide the final evaluation of model accuracy.
As detailed in case 1, to evaluate the superiority of WOA-SGMM and the SGST-based time–frequency analysis method, STFT, CWT, VMD, and SGMD were selected for a comparative analysis with SGST. Experiments were conducted utilizing the publicly available CWRU rolling bearing fault dataset. To reduce the impact of random errors, ten trials were performed with different randomly selected training and testing datasets, and the evaluation was based on the average results. The diagnostic results derived from various time–frequency analysis methods are presented in Table 6. The proposed SGST-based time–frequency analysis method demonstrates strong suitability for SMM by effectively generating a high-quality feature matrix from raw signals. This matrix, after normalization, serves as input for SMM, whose parameters are subsequently optimized via WOA to enhance recognition accuracy.
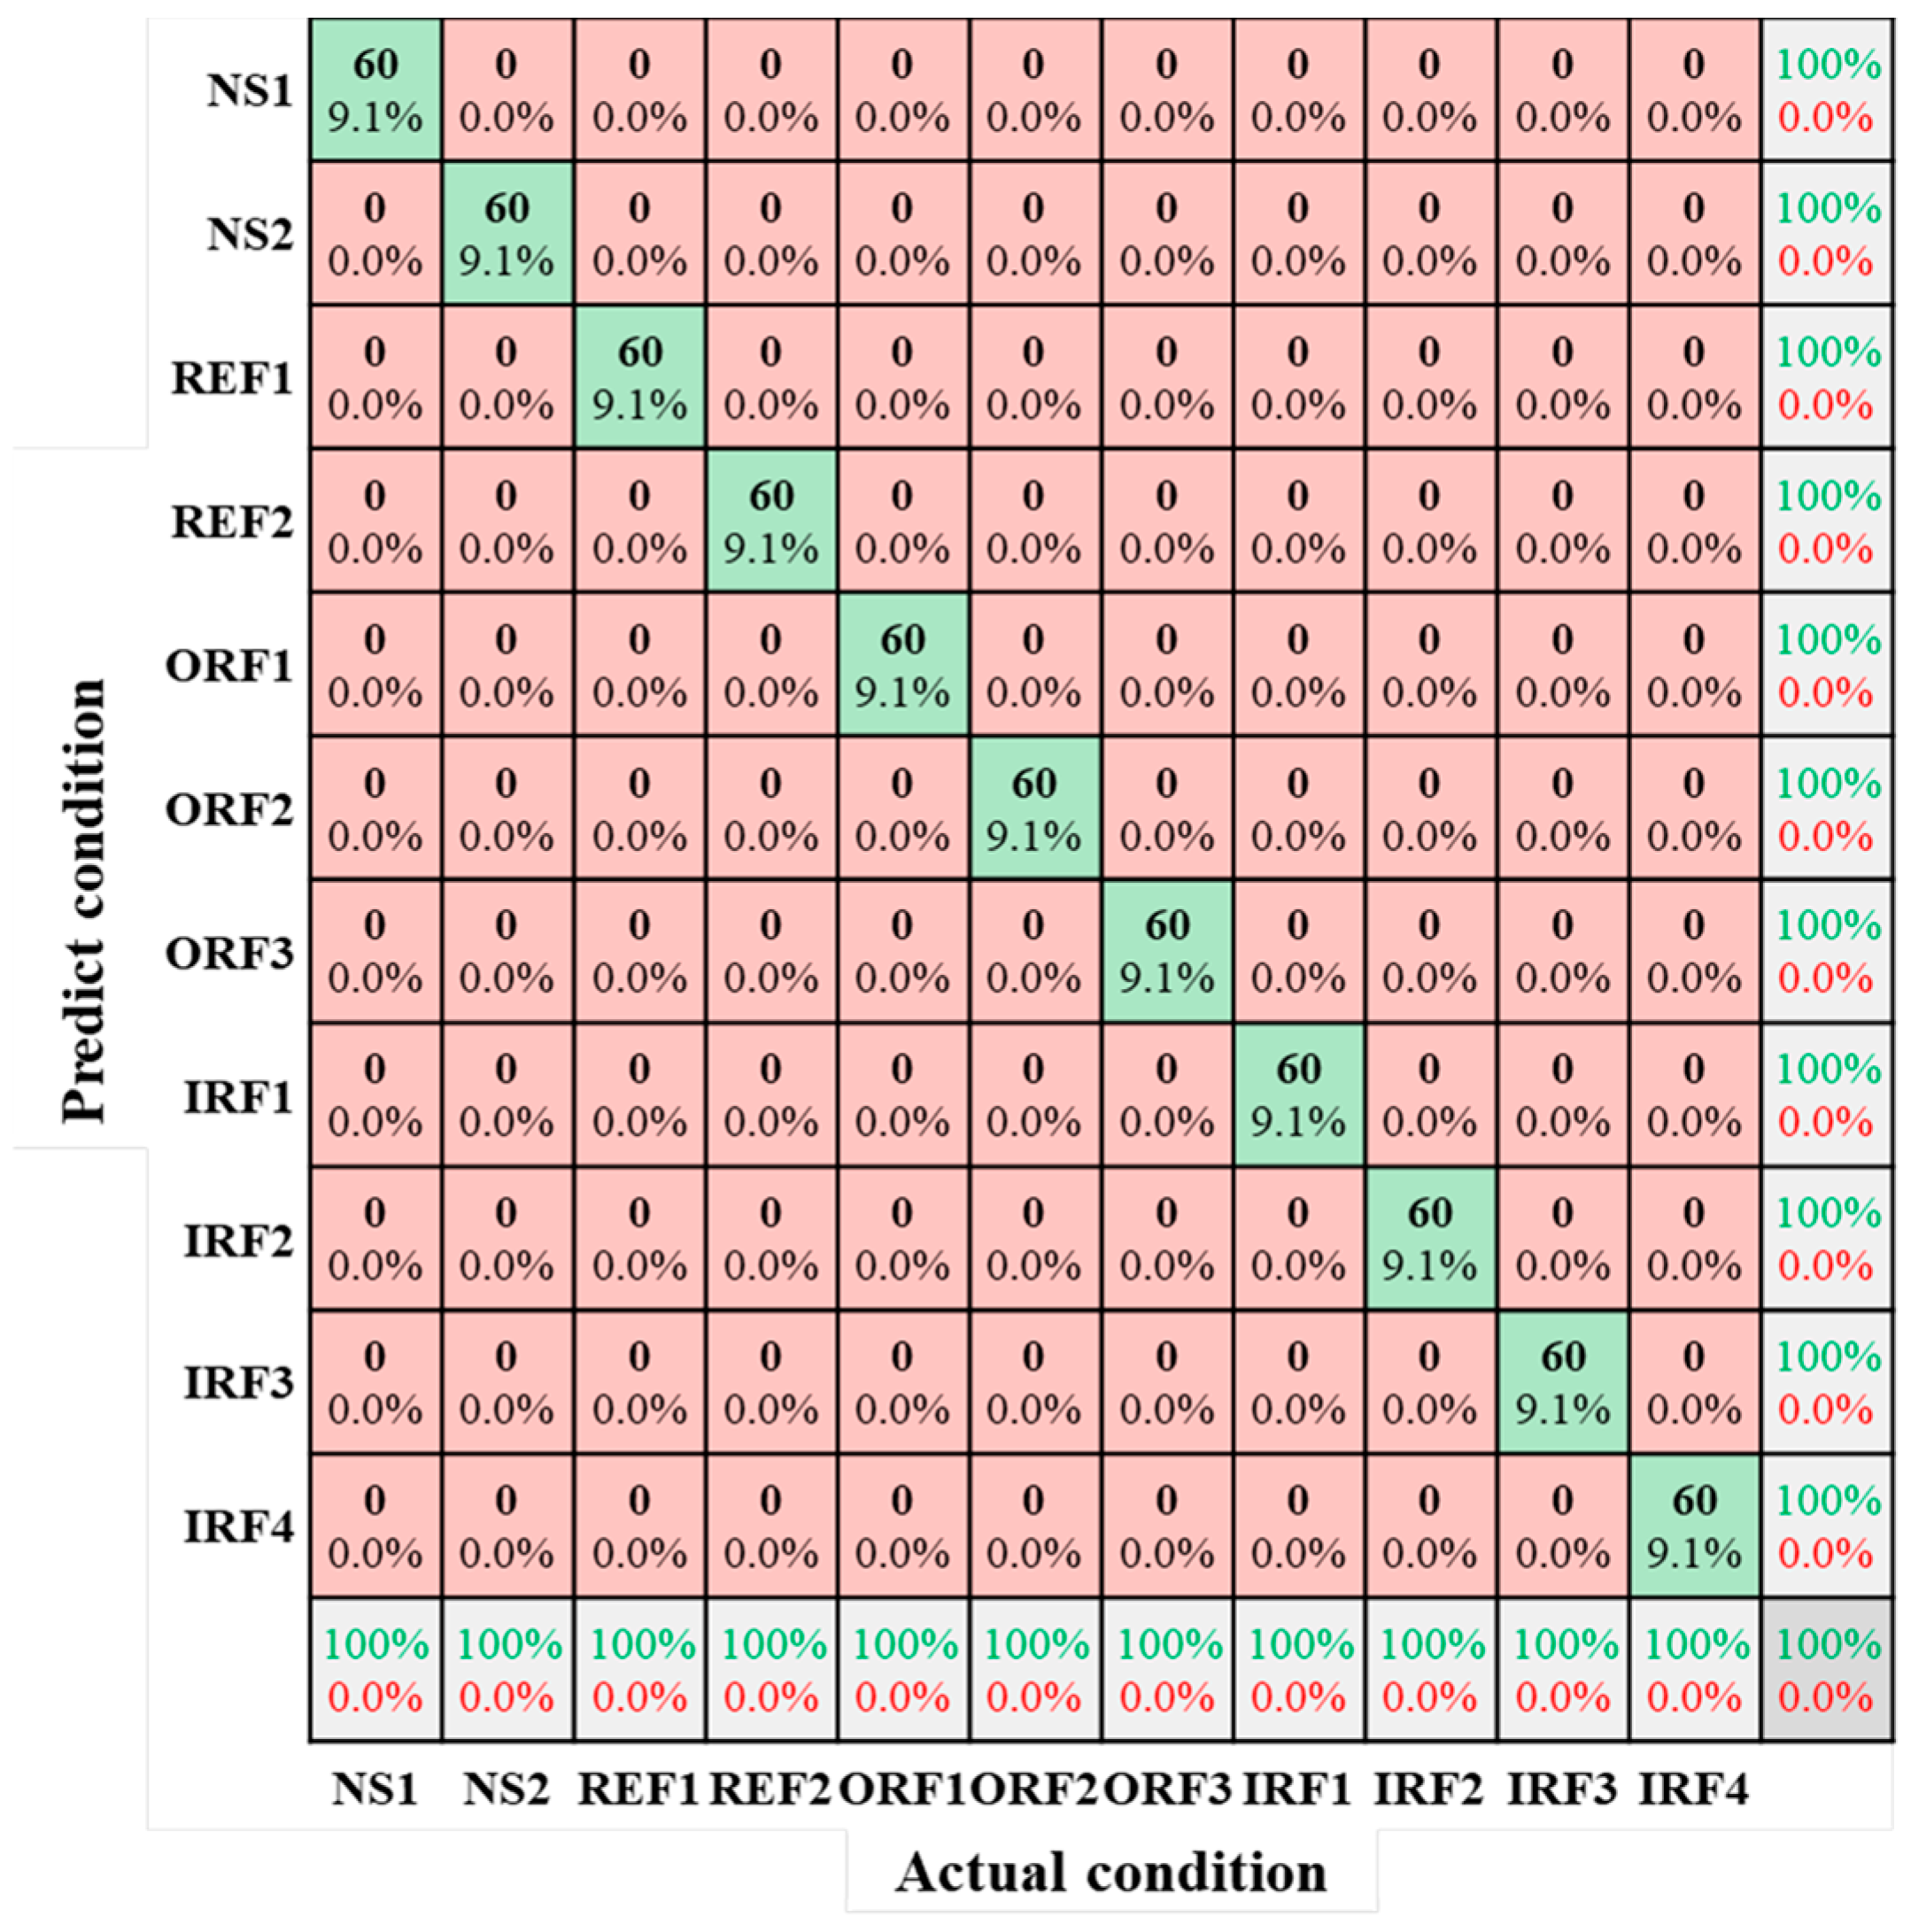
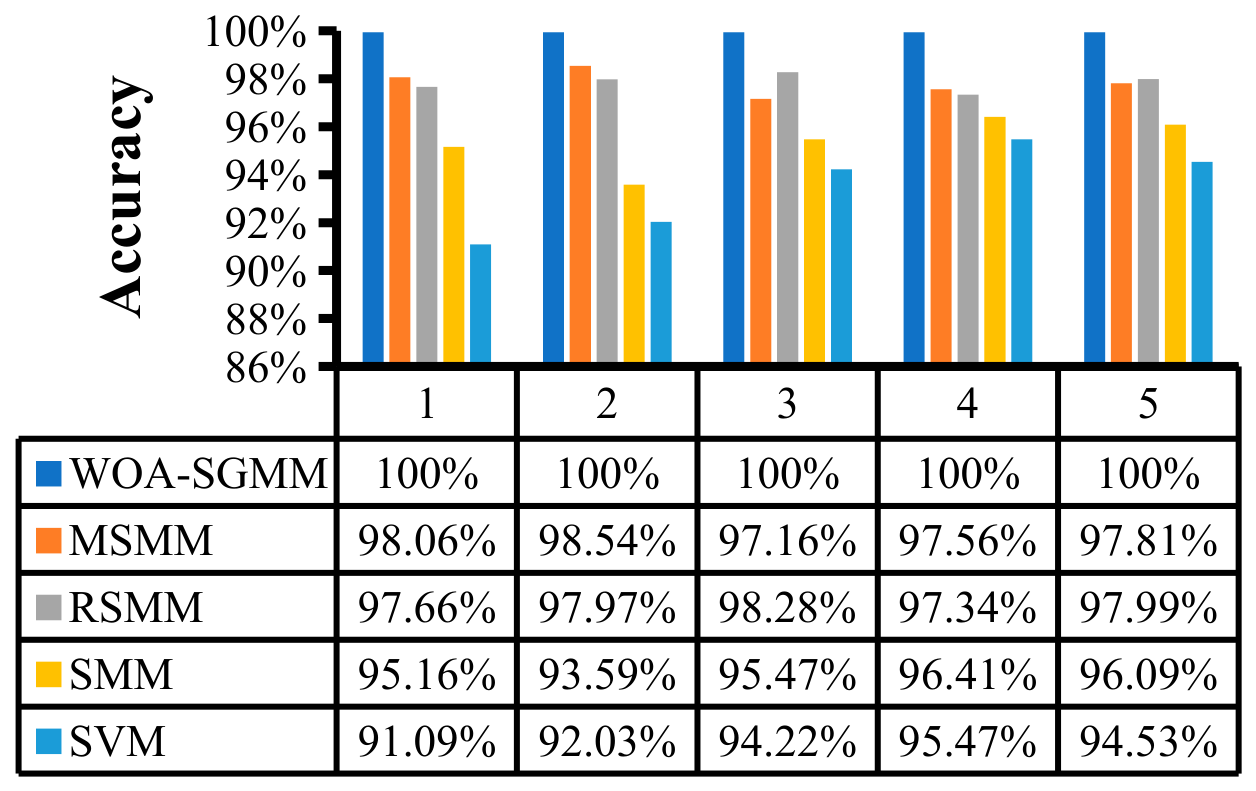
The confusion matrix of the WOA-SGMM model is represented in Figure A1. As evident from this figure, all ten faults were accurately classified, yielding an overall recognition rate of 100%. It is shown by Table 7 that the maximum number of iterations for WOA is 50, with a population size of 20. There are two parameters that need to be optimized, with lower bounds of lb = [0, 0] and upper bounds of ub = [100, 100]. After the iterations are completed, the optimal parameter combination is obtained as the best parameters to be input into SMM. The classification accuracy of WOA-SGMM is shown in Figure 11.
In order to mitigate the randomness in fault diagnosis outcomes, five comparative experiments were carried out, each using different random training and test sets. The time-frequency spectra, processed by SGST, were fed into WOA-SGMM, SVM, SMM, MSMM, and RSMM for the purpose of fault classification. The specific parameter settings for WOA are detailed in Table 7.
To showcase the superior convergence speed and accuracy of WOA-SGMM, a comparison was made with SVM, SMM, MSMM, and RSMM. To ensure a fair evaluation, the parameters for each model were carefully chosen from suitable candidate sets using 5-fold cross-validation. The comprehensive results of this comparison are presented in Table 8.
The performance of each classification model in terms of accuracy is also illustrated in Figure 11. WOA-SGMM demonstrates significantly superior performance compared to other methods; this demonstrates the substantial usability and advantage of our proposed method for bearing fault diagnosis. It also demonstrates that, by effectively leveraging the structural information within the matrix, WOA-SGMM exhibits recognition performance that surpasses that of vector-based classifiers, such as SVM, and other matrix-based classifiers, including SMM, MSMM, and RSMM. Owing to its adaptive parameter optimization capability, WOA-SGMM outperforms SVM and SMM in recognition performance. Hence, based on the aforementioned analysis, it can be inferred that the diagnostic method utilizing SGST time–frequency analysis and WOA-SGMM possesses superior fault diagnosis capabilities.

4.2.3. Case 3

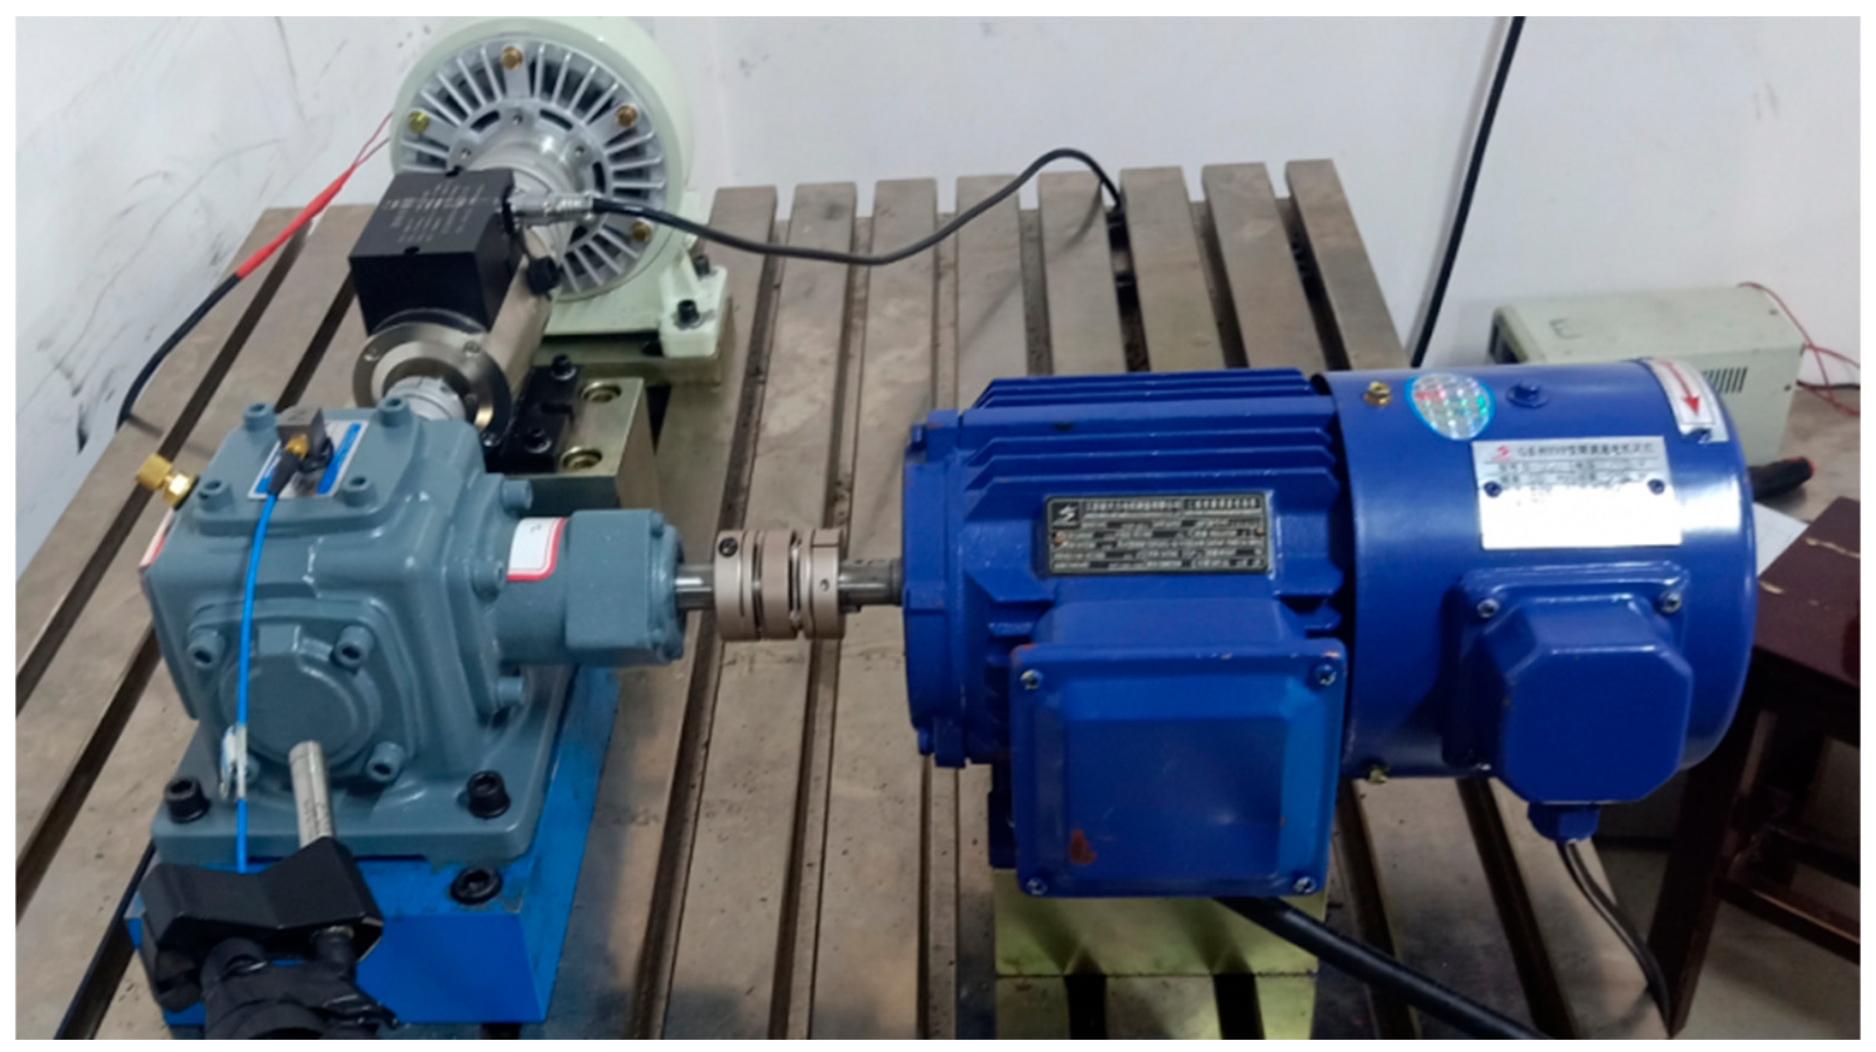
The two sets of experiments mentioned above have shown that the proposed WOA-SGMM exhibits outstanding performance in the diagnosis of rolling bearing faults. Similarly, experiments were conducted utilizing the rolling bearing fault dataset obtained from HNU. The HNU test rig, in which SKF 6206 ball bearings are employed within the testing device, is presented in Figure 12. The vibration signals were collected using a Brüel & Kjær (B&K) 4508B accelerometer (sensitivity: 31 mV/g) mounted in the axial direction to capture the structural vibrations. The signal was conditioned and acquired using a Dewesoft SIRIUS-HS data acquisition system with a sampling frequency of 8192 Hz. The data was stored on a Lenovo ThinkStation P720 computer (Intel Xeon Silver 4210R CPU, 32 GB RAM). All sensors were calibrated using a Sinocera YE5852 calibrator prior to the experiment. To simulate faulty bearings under various conditions, electric discharge machining technology was applied to create cuts of a specific depth at designated locations on the ball bearings. The bearings were subjected to different conditions, namely, NS, REF, IRF, and ORF.
A detailed overview of the experimental parameter settings and fault information pertaining to the HNU dataset is provided in Table 9. Vibration signals were acquired under varying bearing conditions, loads, speeds, and sampling frequencies. Three-axis sensors were employed to capture these vibration signals, with a sampling duration of 20 s. In this particular section, our focus is on the vibration signals gathered from the ball bearing subjected to a load of 5N and a sampling frequency of 8192Hz for the purpose of experimental analysis. For the HNU dataset, 160 samples were collected for each bearing state. To maintain statistical rigor and evaluate the robustness of the model against random variations (despite using a fixed partition), the experiment was repeated ten times.
Following the standard experimental settings of the HNU dataset, a fixed partition strategy was adopted within each repetition: 100 samples were used for training and 60 samples were reserved for testing. This fixed partition allows for a direct comparison of the model’s capability to learn from a defined training set under the specific experimental conditions. The classification accuracy was calculated for each of the ten repetitions, and the average accuracy is reported.
As can be seen from Table 10, WOA-SGMM exhibits the highest classification efficiency among the three fault datasets. For the HNU dataset, which includes seven different bearing states, the classification accuracy of WOA-SGMM still reached 100%, indicating its superior performance in multi-class classification tasks.

5. Conclusions

This study proposes an innovative intelligent diagnostic framework, termed WOA-SGMM, to address critical challenges in rolling bearing fault diagnosis. By integrating SGST with a whale algorithm-enhanced support matrix machine, the developed model achieves breakthroughs in structural information preservation, hyperparameter optimization, and diagnostic robustness. The key contributions and findings are summarized as follows:
Dual optimization for enhanced feature extraction and classification: The SGST-based feature extraction method effectively converts high-dimensional vibration signals into low-dimensional matrices while preserving their intrinsic geometric and topological structures. This approach overcomes the limitations of traditional vector-based methods, significantly reducing information loss and enhancing noise robustness.
Intelligent hyperparameter tuning via WOA: By leveraging the global search capability of WOA, the model dynamically optimizes critical SMM hyperparameters. This eliminates manual empirical tuning, balances model complexity and classification performance, and mitigates risks of overfitting or premature convergence.
Superior diagnostic performance across diverse scenarios: Experimental validation on three benchmark datasets (AHUT, CWRU, and HNU) demonstrates that WOA-SGMM achieves the highest accuracy (100%) in multi-class fault identification under varying operating conditions. Compared to state-of-the-art methods (SVM, SMM, and RSMM), it reduces misclassification rates by 8–12% and exhibits improved robustness in noisy environments.
Generalization and industrial applicability: The proposed framework’s adaptability to complex signals and multi-domain datasets highlights its potential for real-world industrial applications. The preservation of structural correlations in matrix-form data contributes to reliable fault detection in the tested noisy and variable load conditions.
While the proposed WOA-SGMM model demonstrates significant advantages in feature extraction and hyperparameter optimization, its performance may be subject to certain limitations. First, the computational complexity of SGST and WOA scales with the dimensionality of input data, potentially limiting real-time applicability in high-frequency sampling scenarios. For instance, the embedding dimension parameters m and n in SGST and the population size POP in WOA directly influence runtime. Second, the currently proposed method requires a significant number of experiments to manually adjust the optimal parameters of the WOA, such as population size and number of iterations, which may reduce its adaptability across diverse industrial environments. Third, although WOA mitigates local optima issues, its convergence speed could be further improved for large-scale deployments, as observed in experiments with the CWRU dataset. Future work will address these limitations by (1) developing lightweight feature extraction methods to reduce computational overhead, (2) introducing adaptive parameter initialization strategies (e.g., Bayesian optimization) to minimize manual tuning, and (3) integrating hybrid optimization frameworks (e.g., combining WOA with gradient-based methods) to accelerate convergence. These improvements will enhance the model’s practicality for real-world industrial applications.

Author Contributions

Conceptualization, Y.J., J.Z. and Z.H.; Methodology, Z.H. and J.Z.; Software, Z.H.; Validation, Z.H., Y.J., Z.D., H.J., C.T., J.S., X.C. and W.J.; Formal Analysis, Z.H.; Investigation, Z.H.; Resources, Z.H.; Data Curation, Z.H.; Writing—Original Draft Preparation, Z.H.; Writing—Review and Editing, Z.H.; Visualization, Z.H.; Supervision, Z.H.; Project Administration, Z.H.; Funding Acquisition, Y.J., J.S., Z.D. and W.J. All authors have read and agreed to the published version of the manuscript.

Funding

This work was supported in part by the National Natural Science Foundation of China under Grant 51405449 and Grant 52405139, the Zhejiang Provincial Natural Science Foundation (Youth Project, Grant Nos. LON25E050023 and LQ24E050013), the Department of Education of Zhejiang Province (General Project, Grant No. Y202455248), and the Major Projects of the Jinhua Science and Technology Program (Grant No. 2024A11054).

Data Availability Statement

The data cannot be made publicly available upon publication because they are owned by a third party and the terms of use prevent public distribution. The data that support the findings of this study are available from the authors upon reasonable request.

Conflicts of Interest

Yonghua Jiang and Jianjie Zhang are employees of Zhejiang Feiya Elevator Co., Ltd. The authors declare that the research was conducted in the absence of any commercial or financial relationships that could be construed as a potential conflict of interest. The views expressed in this paper are those of the authors and do not necessarily represent those of the company.

Appendix A

Figure A1. Classification confusion matrix of the proposed method.
Vibration 09 00034 g0a1

References

  1. Qi, R.; Zhang, J.; Spencer, K. A review on data-driven condition monitoring of industrial equipment. Algorithms 2022, 16, 9. [Google Scholar] [CrossRef]
  2. Burda, E.A.; Zusman, G.V.; Kudryavtseva, I.S.; Naumenko, A.P. An overview of vibration analysis techniques for the fault diagnostics of rolling bearings in machinery. Shock Vib. 2022, 1, 6136231. [Google Scholar] [CrossRef]
  3. Zhang, Q.; Deng, L. An intelligent fault diagnosis method of rolling bearings based on short-time Fourier transform and convolutional neural network. J. Fail. Anal. Prev. 2023, 23, 795–811. [Google Scholar] [CrossRef]
  4. Kankar, P.K.; Sharma, S.C.; Harsha, S.P. Fault diagnosis of ball bearings using continuous wavelet transform. Appl. Soft Comput. 2011, 11, 2300–2312. [Google Scholar] [CrossRef]
  5. Mammone, A.; Turchi, M.; Cristianini, N. Support vector machines. Wiley Interdiscip. Rev. Comput. Stat. 2009, 3, 283–289. [Google Scholar] [CrossRef]
  6. Chen, Z.; Deng, S.; Chen, X.; Li, C.; Sanchez, R.V.; Qin, H. Deep neural networks-based rolling bearing fault diagnosis. Microelectron. Reliab. 2017, 75, 327–333. [Google Scholar] [CrossRef]
  7. Zhao, Y.P.; Chen, Y.B. Extreme learning machine based transfer learning for aero engine fault diagnosis. Aerosp. Sci. Technol. 2022, 121, 107311. [Google Scholar] [CrossRef]
  8. He, Q. Time–frequency manifold for nonlinear feature extraction in machinery fault diagnosis. Mech. Syst. Signal Process. 2013, 35, 200–218. [Google Scholar] [CrossRef]
  9. Xiao, Y.; Feng, K.; Miao, D.; Zhang, P.; Yang, J. A state-supervised model and novel anomaly index for gas turbines blade fault detection under multi-operating conditions. IEEE Access 2025, 13, 14225–14238. [Google Scholar] [CrossRef]
  10. Gandomi, A.H.; Yang, X.S.; Talatahari, S.; Alavi, A.H. Metaheuristic algorithms. Metaheuristic Appl. Struct. Infrastruct. 2013, 13, 1–24. [Google Scholar]
  11. Mirjalili, S.; Mirjalili, S.M.; Lewis, A. Grey wolf optimizer. Adv. Eng. Softw. 2014, 69, 46–61. [Google Scholar] [CrossRef]
  12. Wang, D.; Tan, D.; Liu, L. Particle swarm optimization algorithm: An overview. Soft Comput. 2018, 22, 387–408. [Google Scholar] [CrossRef]
  13. Pant, M.; Zaheer, H.; Garcia-Hernandez, L.; Abraham, A. Differential Evolution: A review of more than two decades of research. Eng. Appl. Artif. Intell. 2020, 90, 103479. [Google Scholar] [CrossRef]
  14. Hussien, A.G.; Abualigah, L.; Abu Zitar, R.; Hashim, F.A.; Amin, M.; Saber, A.; Gandomi, A.H. Recent advances in harris hawks optimization: A comparative study and applications. Electronics 2022, 11, 1919. [Google Scholar] [CrossRef]
  15. Zhang, Y.; Gong, D.W.; Cheng, J. Multi-objective particle swarm optimization approach for cost-based feature selection in classification. IEEE/ACM Trans. Comput. Biol. Bioinform. 2015, 14, 64–75. [Google Scholar] [CrossRef] [PubMed]
  16. Mirjalili, S.; Lewis, A. The whale optimization algorithm. Adv. Eng. Softw. 2016, 95, 51–67. [Google Scholar] [CrossRef]
  17. Zheng, J.; Gu, M.; Pan, H.; Tong, J. A fault classification method for rolling bearing based on multisynchrosqueezing transform and WOA-SMM. IEEE Access 2020, 8, 215355–215364. [Google Scholar] [CrossRef]
  18. Li, X.; Li, Y.; Yan, K.; Si, L.; Shao, H. An intelligent fault detection method of industrial gearboxes with robustness one-class support matrix machine toward multisource nonideal data. IEEE/ASME Trans. Mechatron. 2023, 29, 388–399. [Google Scholar] [CrossRef]
  19. Jiang, X.; Kong, X.; Ge, Z. Augmented industrial data-driven modeling under the curse of dimensionality. IEEE/CAA J. Autom. Sin. 2023, 10, 1445–1461. [Google Scholar] [CrossRef]
  20. Luo, L.; Xie, Y.; Zhang, Z.; Li, W.-J. Support matrix machines. Int. Conf. Mach. Learn. 2015, 37, 938–947. [Google Scholar]
  21. Pan, H.; Zhang, Y.; Cheng, J.; Zheng, J. Symplectic geometry transformation-based periodic segment method: Algorithm and applications. IEEE Trans. Instrum. Meas. 2023, 72, 6502708. [Google Scholar] [CrossRef]
  22. Nadimi-Shahraki, M.H.; Zamani, H.; Asghari Varzaneh, Z.; Mirjalili, S. A systematic review of the whale optimization algorithm: Theoretical foundation, improvements, and hybridizations. Arch. Comput. Methods Eng. 2023, 30, 4113–4159. [Google Scholar] [CrossRef]
  23. Pan, H.; Xu, H.; Zheng, J.; Su, J.; Tong, J. Multi-class fuzzy support matrix machine for classification in roller bearing fault diagnosis. Adv. Eng. Inform. 2022, 51, 101445. [Google Scholar] [CrossRef]
  24. Zheng, Q.; Zhu, F.; Heng, P.A. Robust support matrix machine for single trial EEG classification. IEEE Trans. Neural Syst. Rehabil. Eng. 2018, 26, 551–562. [Google Scholar] [CrossRef]
  25. Cen, J.; Yang, Z.; Liu, X.; Xiong, J.; Chen, H. A review of data-driven machinery fault diagnosis using machine learning algorithms. J. Vib. Eng. Technol. 2022, 10, 2481–2507. [Google Scholar] [CrossRef]
  26. Nasiri, J.; Khiyabani, F.M. A whale optimization algorithm (WOA) approach for clustering. Cogent Math. Stat. 2018, 5, 1483565. [Google Scholar] [CrossRef]
  27. Pan, H.; Yang, Y.; Zheng, J.; Li, X.; Cheng, J. A fault diagnosis approach for roller bearings based on a symplectic geometry matrix machine. Mech. Mach. Theory 2019, 140, 31–43. [Google Scholar] [CrossRef]
Figure 1. The process of the whale optimization algorithm spiraling towards the optimal solution.
Vibration 09 00034 g001
Figure 2. Flowchart of WOA.
Vibration 09 00034 g002
Figure 3. Flowchart of WOA-SGMM diagnosis.
Vibration 09 00034 g003
Figure 4. The experimental setup for datasets (case 1).
Vibration 09 00034 g004
Figure 5. Illustration of various bearing conditions.
Vibration 09 00034 g005
Figure 6. Classification accuracy of each fold in 5-fold cross-validation test.
Vibration 09 00034 g006
Figure 7. Symplectic geometric coefficient matrices of different samples (case 1).
Vibration 09 00034 g007
Figure 8. Classification confusion matrix of the proposed method.
Vibration 09 00034 g008
Figure 9. Comparison chart of average accuracy over 10 experiments among various methods.
Vibration 09 00034 g009
Figure 10. Fault test rig of roller bearing of CWRU.
Vibration 09 00034 g010
Figure 11. Comparison chart of average accuracy over 10 experiments among various methods.
Vibration 09 00034 g011
Figure 12. Fault test rig of HNU.
Vibration 09 00034 g012
Table 1. State information of sampling environment and sample selection for rolling bearings.
Bearing StateFault
Depth (mm)
Motor
Speed (r/min)
Number of
Samples
Label
NS109001601
NS2015001602
REF10.29001603
REF20.415001604
IRF10.29001605
IRF20.39001606
IRF30.215001607
ORF10.39001608
ORF20.49001609
ORF30.3150016010
ORF40.4150016011
Table 2. WOA parameter setting and range of parameters to be optimized.
IterationsPOPParameterUpper Limit/
Lower Limit
5030The low-rank parameter τ
The loss penalization parameter C
(0~100)
Table 3. Classification accuracy results of comparison methods.
DatasetMethod1-Fold2-Fold3-Fold4-Fold5-Fold
AHUTSTFT + WOA-SGMM87.50%89.06%87.50%87.50%88.13%
CWT + WOA-SGMM90.63%90.00%90.00%90.31%90.94%
VMD + WOA-SGMM90.63%90.63%90.31%87.50%87.50%
SGMD + WOA-SGMM96.88%95.31%96.88%96.88%96.25%
SGST + WOA-SGMM100.0%100.0%100.0%100.0%100.0%
Table 4. Parameter settings for the comparison models.
ModelParameterRange
SVMThe loss penalization parameter C
The RBF kernel parameter σ
{10−6, 10−4, ⋯, 104, 106}
{2−6, 2−5, ⋯, 25, 26}
SMMThe low-rank parameter τ
The loss penalization parameter C
{2−4, 2−3, ⋯, 24, 50, 100}
{2−6, 2−5, ⋯, 25, 26}
MSMMThe low-rank parameter τ
The loss penalization parameter C
{2−4, 2−3, ⋯, 24, 50, 100}
{2−6, 2−5, ⋯, 25, 26}
RSMMThe low-rank parameter λ1
The low-rank parameter λ2
The sparse parameter λ3
{2−6, 2−5, ⋯, 25, 26}
{2−6, 2−5, ⋯, 25, 26}
{2−6, 2−5, ⋯, 25, 26}
Table 5. State information of sampling environment and sample selection for case 2.
Bearing StateFault Depth (Inch)Label
Normal01
Ball10.0072
Ball20.0143
Ball30.0214
IR10.0075
IR20.0146
IR30.0217
OR10.0078
OR20.0149
OR30.02110
Table 5 Classification results of different fault types under 1797 rpm (160 samples per class).
Table 6. Experimental results of classification accuracy for five methods.
MethodAverage AccuracyTime (s)
STFT85.84%297.14
CWT86.59%32.78
VMD92.41%6.43
SGMD94.03%8.21
SGST98.72%28.76
Table 7. WOA parameter setting and range of parameters to be optimized.
IterationsPOPParameterUpper Limit/
Lower Limit
5020The low-rank parameter τ
The loss penalization parameter C
(0~100)
Table 8. Parameter settings for each comparison model.
ModelParameterRange
SVMThe loss penalization parameter C
The RBF kernel parameter σ
{10−6, 10−4, ⋯, 104, 106}
{2−6, 2−5, ⋯, 25, 26}
SMMThe low-rank parameter τ
The loss penalization parameter C
{2−4, 2−3, ⋯, 24, 50, 100}
{2−6, 2−5, ⋯, 25, 26}
MSMMThe low-rank parameter τ
The loss penalization parameter C
{2−4, 2−3, ⋯, 24, 50, 100}
{2−6, 2−5, ⋯, 25, 26}
RSMMThe low-rank parameter λ1
The low-rank parameter λ2
The sparse parameter λ3
{2−6, 2−5, ⋯, 25, 26}
{2−6, 2−5, ⋯, 25, 26}
{2−6, 2−5, ⋯, 25, 26}
Table 9. Experiment parameter settings and fault information of HNU datasets.
Bearing StateBearing State
(Fault Depth/mm)
Sampling
Frequency
Motor SpeedLabel
NS08192 Hz900 r/min1
REF10.42
REF20.83
IRF10.44
IRF20.85
ORF10.46
ORF20.87
Table 10. Comparative experimental results.
DatasetMetricWOA-SGMMSVMSMMMSMMRSMM
AHUTAccuracy (%)100.00 ± 0.0096.12 ± 0.3296.12 ± 0.3297.54 ± 0.2597.89 ± 0.18
Precision1.000 ± 0.0000.935 ± 0.0060.958 ± 0.0050.972 ± 0.0040.976 ± 0.003
Recall1.000 ± 0.0000.932 ± 0.0070.960 ± 0.0040.970 ± 0.0050.975 ± 0.004
Specificity1.000 ± 0.0000.965 ± 0.0040.982 ± 0.0020.985 ± 0.0030.988 ± 0.002
F1-Score1.000 ± 0.0000.933 ± 0.0050.933 ± 0.0050.971 ± 0.0030.959 ± 0.003
MCC1.000 ± 0.0000.920 ± 0.0080.945 ± 0.0060.960 ± 0.0050.968 ± 0.004
CWRUAccuracy (%)100.00 ± 0.0093.45 ± 0.5595.45 ± 0.4895.12 ± 0.3594.98 ± 0.42
Precision1.000 ± 0.0000.930 ± 0.0080.945 ± 0.0070.948 ± 0.0050.952 ± 0.006
Recall1.000 ± 0.0000.931 ± 0.0090.946 ± 0.0060.946 ± 0.0060.951 ± 0.007
Specificity1.000 ± 0.0000.960 ± 0.0060.970 ± 0.0050.972 ± 0.0040.975 ± 0.003
F1-Score1.000 ± 0.0000.929 ± 0.0070.944 ± 0.0050.947 ± 0.0040.950 ± 0.005
MCC1.000 ± 0.0000.915 ± 0.0100.928 ± 0.0090.930 ± 0.0070.935 ± 0.008
HNUAccuracy (%)100.00 ± 0.000.935 ± 0.00894.85 ± 0.5295.20 ± 0.4095.15 ± 0.45
Precision1.000 ± 0.0000.945 ± 0.0080.949 ± 0.0060.948 ± 0.0070.965 ± 0.005
Recall1.000 ± 0.0000.946 ± 0.0090.950 ± 0.0070.966 ± 0.0060.966 ± 0.006
Specificity1.000 ± 0.0000.970 ± 0.0040.975 ± 0.0030.974 ± 0.0040.946 ± 0.009
F1-Score1.000 ± 0.0000.944 ± 0.0070.948 ± 0.0050.947 ± 0.0060.964 ± 0.004
MCC1.000 ± 0.0000.930 ± 0.0100.938 ± 0.0080.936 ± 0.0090.955 ± 0.007
Disclaimer/Publisher’s Note: The statements, opinions and data contained in all publications are solely those of the individual author(s) and contributor(s) and not of MDPI and/or the editor(s). MDPI and/or the editor(s) disclaim responsibility for any injury to people or property resulting from any ideas, methods, instructions or products referred to in the content.