Article

Integration of Lattice Structures into the Boring Bars as a Passive Chatter Suppression Technique: Concepualization, Modelling and Simulation

1
Department of Mechanical Engineering, Faculty of Engineering and Architecture, Recep Tayyip Erdoğan University, 53100 Rize, Turkey
2
Department of Mechanical Engineering, Faculty of Technology, University of Afyon Kocatepe, 03200 Afyonkarahisar, Turkey
3
Department of Mechanical Engineering, Faculty of Engineering and Natural Sciences, Ankara Yıldırım Beyazıt University, 06010 Ankara, Turkey
*
Authors to whom correspondence should be addressed.
Vibration 2025, 8(2), 29; https://doi.org/10.3390/vibration8020029
Submission received: 3 March 2025 / Revised: 21 May 2025 / Accepted: 27 May 2025 / Published: 5 June 2025
(This article belongs to the Special Issue Vibration Damping)

Abstract

:
The present study concentrates on passive damping technology, in which the damping of vibrations is accomplished by the integration of lattice structures into the boring bar. To complete this process, several steps must be followed. First, the largest possible hollow space within the boring bar was determined, and the two main influencing factors—stiffness and natural frequency—were harmonized. A rigorous analysis of vibration reduction was conducted on the basis of a validated simulation model. This analysis involved six distinct lattice structures designed using ANSYS SpaceClaim 19.0. In light of the findings, a specialized, application-specific CAD simulation tool was developed, employing appropriate methodologies to circumvent the limitations of conventional CAD software. For the hollow integrated into the boring bar, ellipsoidal shapes were shown to be preferable to cylindrical ones due to their superior dynamic performance. The initial lattice structure, namely a cube lattice with side cross supports, exhibited an enhancement in damping of 55.58% in comparison with the reference model. Following this result, five additional modelling steps were performed, leading to an optimal outcome with a 67.79% reduction in vibrations. Moreover, the modifications made to the beam diameter of the lattice units yielded enhanced dynamic performance, as evidenced by a vibration suppression of 69.81%. The implementation of complex modelling steps, such as the integration of a hollow and the integration of lattice structures, could be successfully achieved through the development of a suitable and user-friendly simulation tool. The effectiveness of the simulation tool in enabling parameterized modelling for scalable lattice structures was demonstrated. This approach was found to be expeditious in terms of the time required for implementation. The potential exists for the extension of this simulation tool, with the objective of facilitating research projects with a view to optimization, i.e., a large number of research projects.

1. Introduction

In the field of machining, the issue of unstable vibrations is of particular significance. These factors have been shown to significantly impair productivity, particularly during the machining of superalloys, which are used in a wide range of applications (Figure 1). In comparison with milling and turning, drilling and boring are the most demanding machining techniques. Boring bars are subject to vibrations of a considerable magnitude due to their elongated, slender, and cantilever geometry and their inherently low structural damping [1]. These vibrations are commonly categorized as free, forced, and self-excited. Free vibration can be defined as the naturally dampened oscillatory motion of a part subsequent to the application of a sudden impact. Forced vibrations are a consequence of periodic and continuous forces. These can be addressed by applying predicted internal or perturbation forces to the system’s transfer function. In other words, the solution of ordinary differential equations is employed in the time domain [2]. Depending on the magnitude of the cutting forces, the process of material removal can result in the destabilization of the material, which, in turn, can precipitate self-excited vibrations, also referred to as chatter [3]. Chatter has been shown to exert a detrimental effect on the quality of the workpieces and the tool life, as well as on the machine components [4]. The machining of titanium and nickel-based alloys is a complex process, often associated with high costs due to the limited capabilities of the cutting tools, which can only operate at relatively low speeds and have a limited tool life. Consequently, these materials have been found to generate a greater amount of chatter due to the necessity of higher cutting forces because of their hardness and strength.
Self-excited vibrations depend on the motion parameters of the vibrating system and arise solely from the presence of a variable force. Furthermore, vibrations are generated within the system due to the presence of internal feedback loops between the motion of the machine tool housing elements (components of the mass-damper-spring system) and the operational process [13]. The phenomenon of self-excited vibrations is primarily attributable to the regenerative effect. The resultant cutting force generates vibrations in the tool, thereby creating a wavy surface on the workpiece. This surface is a reflection of the relative motion between the tool and the workpiece. These irregularities result in variations in chip thickness, which in turn affects the cutting force and causes further vibration. The issue of chatter has been the focus of academic research since the 1950s. Consequently, a plethora of studies have been conducted that describe the methods by which chatter can be detected, avoided, reduced, or controlled, as well as modelled and predicted [14,15]. Various methodologies have been used to investigate the generation mechanisms of chatter and to identify and validate chatter control strategies [16,17]. In the field of machining, the identification of dynamic reactions is initiated through the utilization of sensors, with the subsequent determination of stable and unstable regions being achieved through chatter stability analysis. However, the prediction and suppression of chatter will continue to pose a significant challenge in the future, primarily due to the following factors: increasing material removal rate, limitations in the design procedure, low friction guiding systems, lightweight design, manufacture of flexible parts, process parameter selection, regeneration disturbance, process damping maximization, system stiffness enhancement, and system damping enhancement [18].
Vibration reduction can be achieved using various methods, including active, passive, and hybrid dampers [19]. Active dampers are equipped with sophisticated mechanisms that facilitate the instantaneous measurement of vibrations. These systems use complex algorithms to calculate the reactive motion and then apply counteracting forces to suppress vibrations. In the context of passive damping, the impact of material and design modifications on damping efficacy is examined. The employment of additive parts is identified as a simple and straightforward approach [20,21]. As illustrated in Table 1, the active and passive methods are characterized by a number of distinct features [22].
In the context of machining pre-drilled workpieces, the utilization of long and cantilever tool holders is imperative, particularly in the case of deep holes. These tool holders, known as boring bars, are composed of solid round steel, and their performance is influenced by two primary factors: stiffness and natural frequency [23]. While the cross-sectional area and moment of inertia remain uniform for a solid boring bar, these parameters are subject to alteration upon the introduction of a hollow within the tool holder during the modification process. It is evident that the length of the hollow is directly proportional to the decrease in static stiffness, while the diameter is inversely proportional to the increase in natural frequency. It is therefore of great importance that both factors are coordinated in order to optimize the hollow. Additionally, the position of the hollow significantly affects the natural frequency. The creation of the hollow in closer proximity to the cutting edge has been demonstrated to result in an increase in the natural frequency, owing to a decrease in the inertia of the region in close proximity to the aforementioned cutting edge. In the context of tool holder modification, it is anticipated that the hollow will be sufficiently dimensioned to accommodate the integration of lattice structures, which consist of a network of trusses comprising struts or plates that are interconnected with each other. This integration has the potential to produce a structural response characterized by reduced vibrations [24]. Lattice structures have a wide range of applications, ranging from sheet-like parts with simple 2D patterns [25,26,27,28] to 3D solid parts filled with complex shapes such as Triply Periodic Minimal Surfaces (TPMS) [29,30,31]. The utilization of these designs engenders numerous advantages, including enhanced heat dissipation [32,33], vibration and impact damping [33,34], and weight reduction [29]. In addition to the aforementioned critical improvements, it has been demonstrated that exceptional mechanical properties [35] can be obtained, such as negative Poisson’s ratio [36] at the same porosity level [37]. Kagome [38,39], cubic [26,30,38,40], octahedron [21,41], star, hexagon, and diamond [33,35,42] are the most commonly studied lattice structures due to their relatively simple and effective characteristics. For these lattice structures, dynamic performances and behaviors are determined by their density [40], dimension [27], and orientation [41,42].
Given the complexity of implementing lattice structures in this sector, rigorous modelling and analysis are crucial. To ensure the efficient use of resources, it is first necessary to undertake modelling, followed by analysis, and then production. It is imperative to recognize that the methodologies employed in the fabrication of lattice structures are, by their very nature, typically laborious and expensive. Therefore, modelling and analysis must be carried out with the utmost precision. The recent surge in interest in the design of lattice structures is largely attributable to the advent of additive manufacturing (AM). Consequently, a plethora of CAD (Computer-Aided Design) programs have been developed [43]. Commercial CAD software faces several difficulties in the generation of lattice structure models [24]. It is evident that most parametric CAD software tools do not fully utilize the potential for freedom of form and design. Instead, they are dependent on different criteria (for example, usability, reliability, availability, performance, support, and cost) that significantly influence the decision-making process [44]. It can be concluded that, despite the ease with which lattice structures can now be employed, no significant breakthroughs have yet been achieved in terms of design methods and CAD tools for general applications [45]. The conception of a lattice structure model in the CAD environment presents numerous challenges. It is not possible for product designers to automatically generate different types of configurations [24]. It has to consider issues of homogenization, which means that the individual lattice units must be much smaller than the design space in all directions, and of periodicity (the material inside the lattice unit must be such that it corresponds to the material in the adjoining lattice unit) [46]. The merits of lattice structures have recently come to the fore in production technologies. Yang et al. [47] aimed to increase damping by integrating six different lattice structures into the cutting tool during the milling operations. In this process, three distinct cell sizes and filling ratios were utilized for the fabrication of lattice structures. An investigation into the modal properties indicated that the design incorporating an FCC lattice exhibited superior performance, thus prompting the execution of experimental tests with this design. Following the conclusion of the experimental phase, a maximum enhancement of up to 100% in terms of stability limit was achieved. In a separate study, Yang et al. [48] similarly modified the milling tool with a lattice structure. However, damping particles were also incorporated into the lattice structure. It is evident that the combination of the damping capability of the particles with the lattice structure has resulted in an enhancement of the stability limit that exceeds 200% in comparison with the conventional cutting tool. The use of a lattice structure can be observed in turning as well as milling operations. Vogel et al. [21] modified a tool holder with a lattice structure, subsequently filling it with a variety of damping particles. Consequently, the lowest amplitude result was obtained by filling the lattice structure with 50% WC-ZrO2. Even though the effect of filling particles is studied in detail, the existing literature reveals a necessity for further research, which must focus specifically on the hollow geometry and lattice parameters of boring bars. It is therefore essential to present a methodology that demonstrates and explains the optimal modification procedure of boring bars for integrating lattice structures.
The topology with periodic lattice structures repeating in all directions has been shown to exhibit both great strength and high specific stiffness. To achieve integration of the periodic lattice structure, it is necessary to trim the structure outside or inside the design space. However, this may result in the lattice unit becoming non-conformal to the boundary surfaces of the design space. To generate a complete lattice structure, each CAD lattice unit must be designed to receive inputs and provide feedback to support the formation of the overall structure. There is still a considerable amount of research and development work to be carried out in the field of adapted commercial design solutions. Consequently, each innovation constitutes a substantial enhancement to the process [49]. In particular, the number of individual CAD lattice unit models is too high for the creation of lattice structures, so alternative approaches are needed [50]. Commercial CAD software often relies on parametric Non-Uniform Rational B-Spline (NURBS) systems, which are suitable for traditional manufacturing models but pose challenges for generating complex digital 3D lattice structures [46,51]. The manual design of lattice structures, where multiple lattice units need to be connected and integrated into a design space such as a hollow, reaches a level of complexity that cannot be solved by conventional CAD software [52].
In this paper, the initial step involved the formulation of a simulation model for the establishment of a design space (hollow) for a boring bar, and the subsequent development of a 3D lattice simulation model. The objective of this study was to utilize the design space to assess the vibrations of five distinct 3D lattice structures. The objective of the numerical analysis is to ascertain whether a reduction in undesirable vibrations can be achieved with this method (Figure 2).
Based on the results and the possibility to reduce the vibrations with this method, the second step was the development of a parameterized CAD software tool (Figure 3). This tool enables the special application, i.e., for the analysis of the vibration reductions with different 3D lattice structures, and will be a great support for future research work. The primary focus of this paper is the practical numerical implementation and development of suitable numerical approaches. It does not concern itself with concrete vibration analyses or with a comparison of their simulated and experimental results. This research constitutes a fundamental basis in itself, thus paving the way for future studies in this domain. To summarize this paper:
  • calculate a suitable design space for a mold with an existing boring bar base body
  • make it available in a simulation model in order to
    fill this design space with 3D lattice structures and
    use the finite element method (FEM) simulation to determine whether and on what approximate scale the undesirable vibrations during machining could be reduced using this method.
Figure 3. Step by step methodology (mathematical model, parametric modelling, CAD and GUI development), resulted lattice structure and achievements (user-friendliness, accurate modelling, efficient and scalable software).
Vibration 08 00029 g003

2. Determination of an Optimal Design Space and Testing 3D Lattices Simulation Model

In this study, the basics and the numerical determination of an optimal design space for a boring bar and the testing of the 3D lattices simulation model are presented. The accuracy of the simulation model has been verified experimentally.

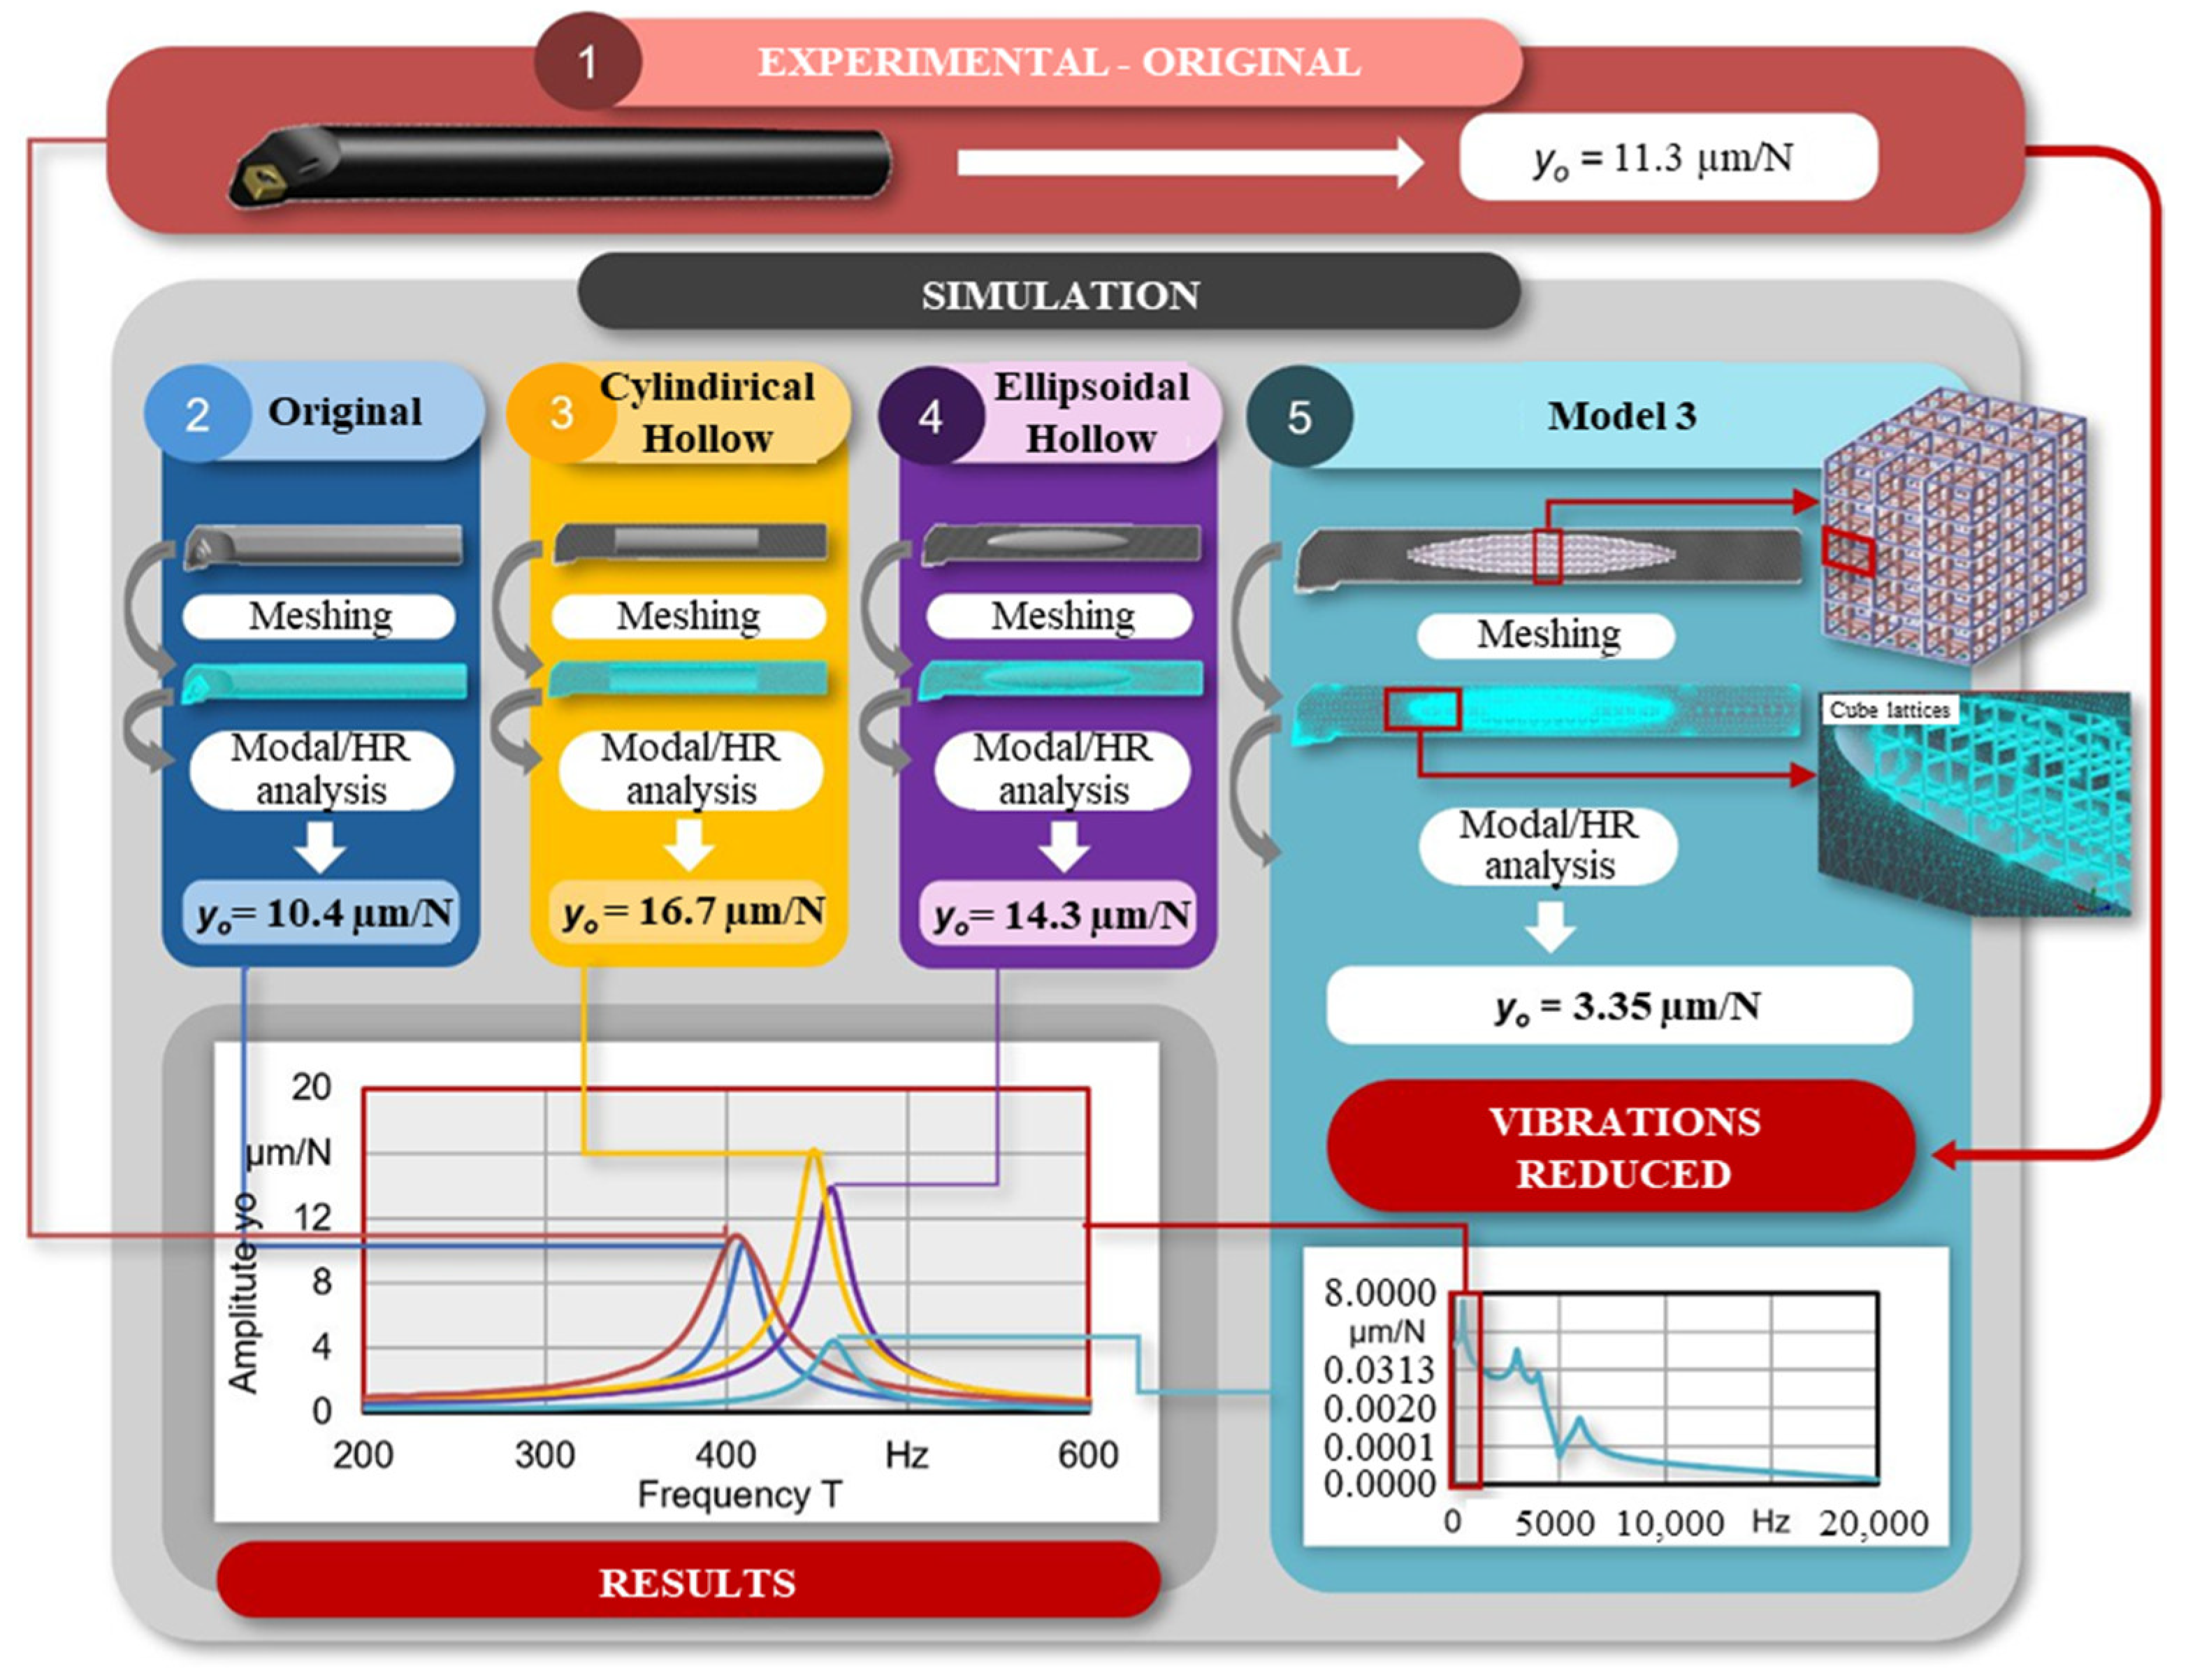
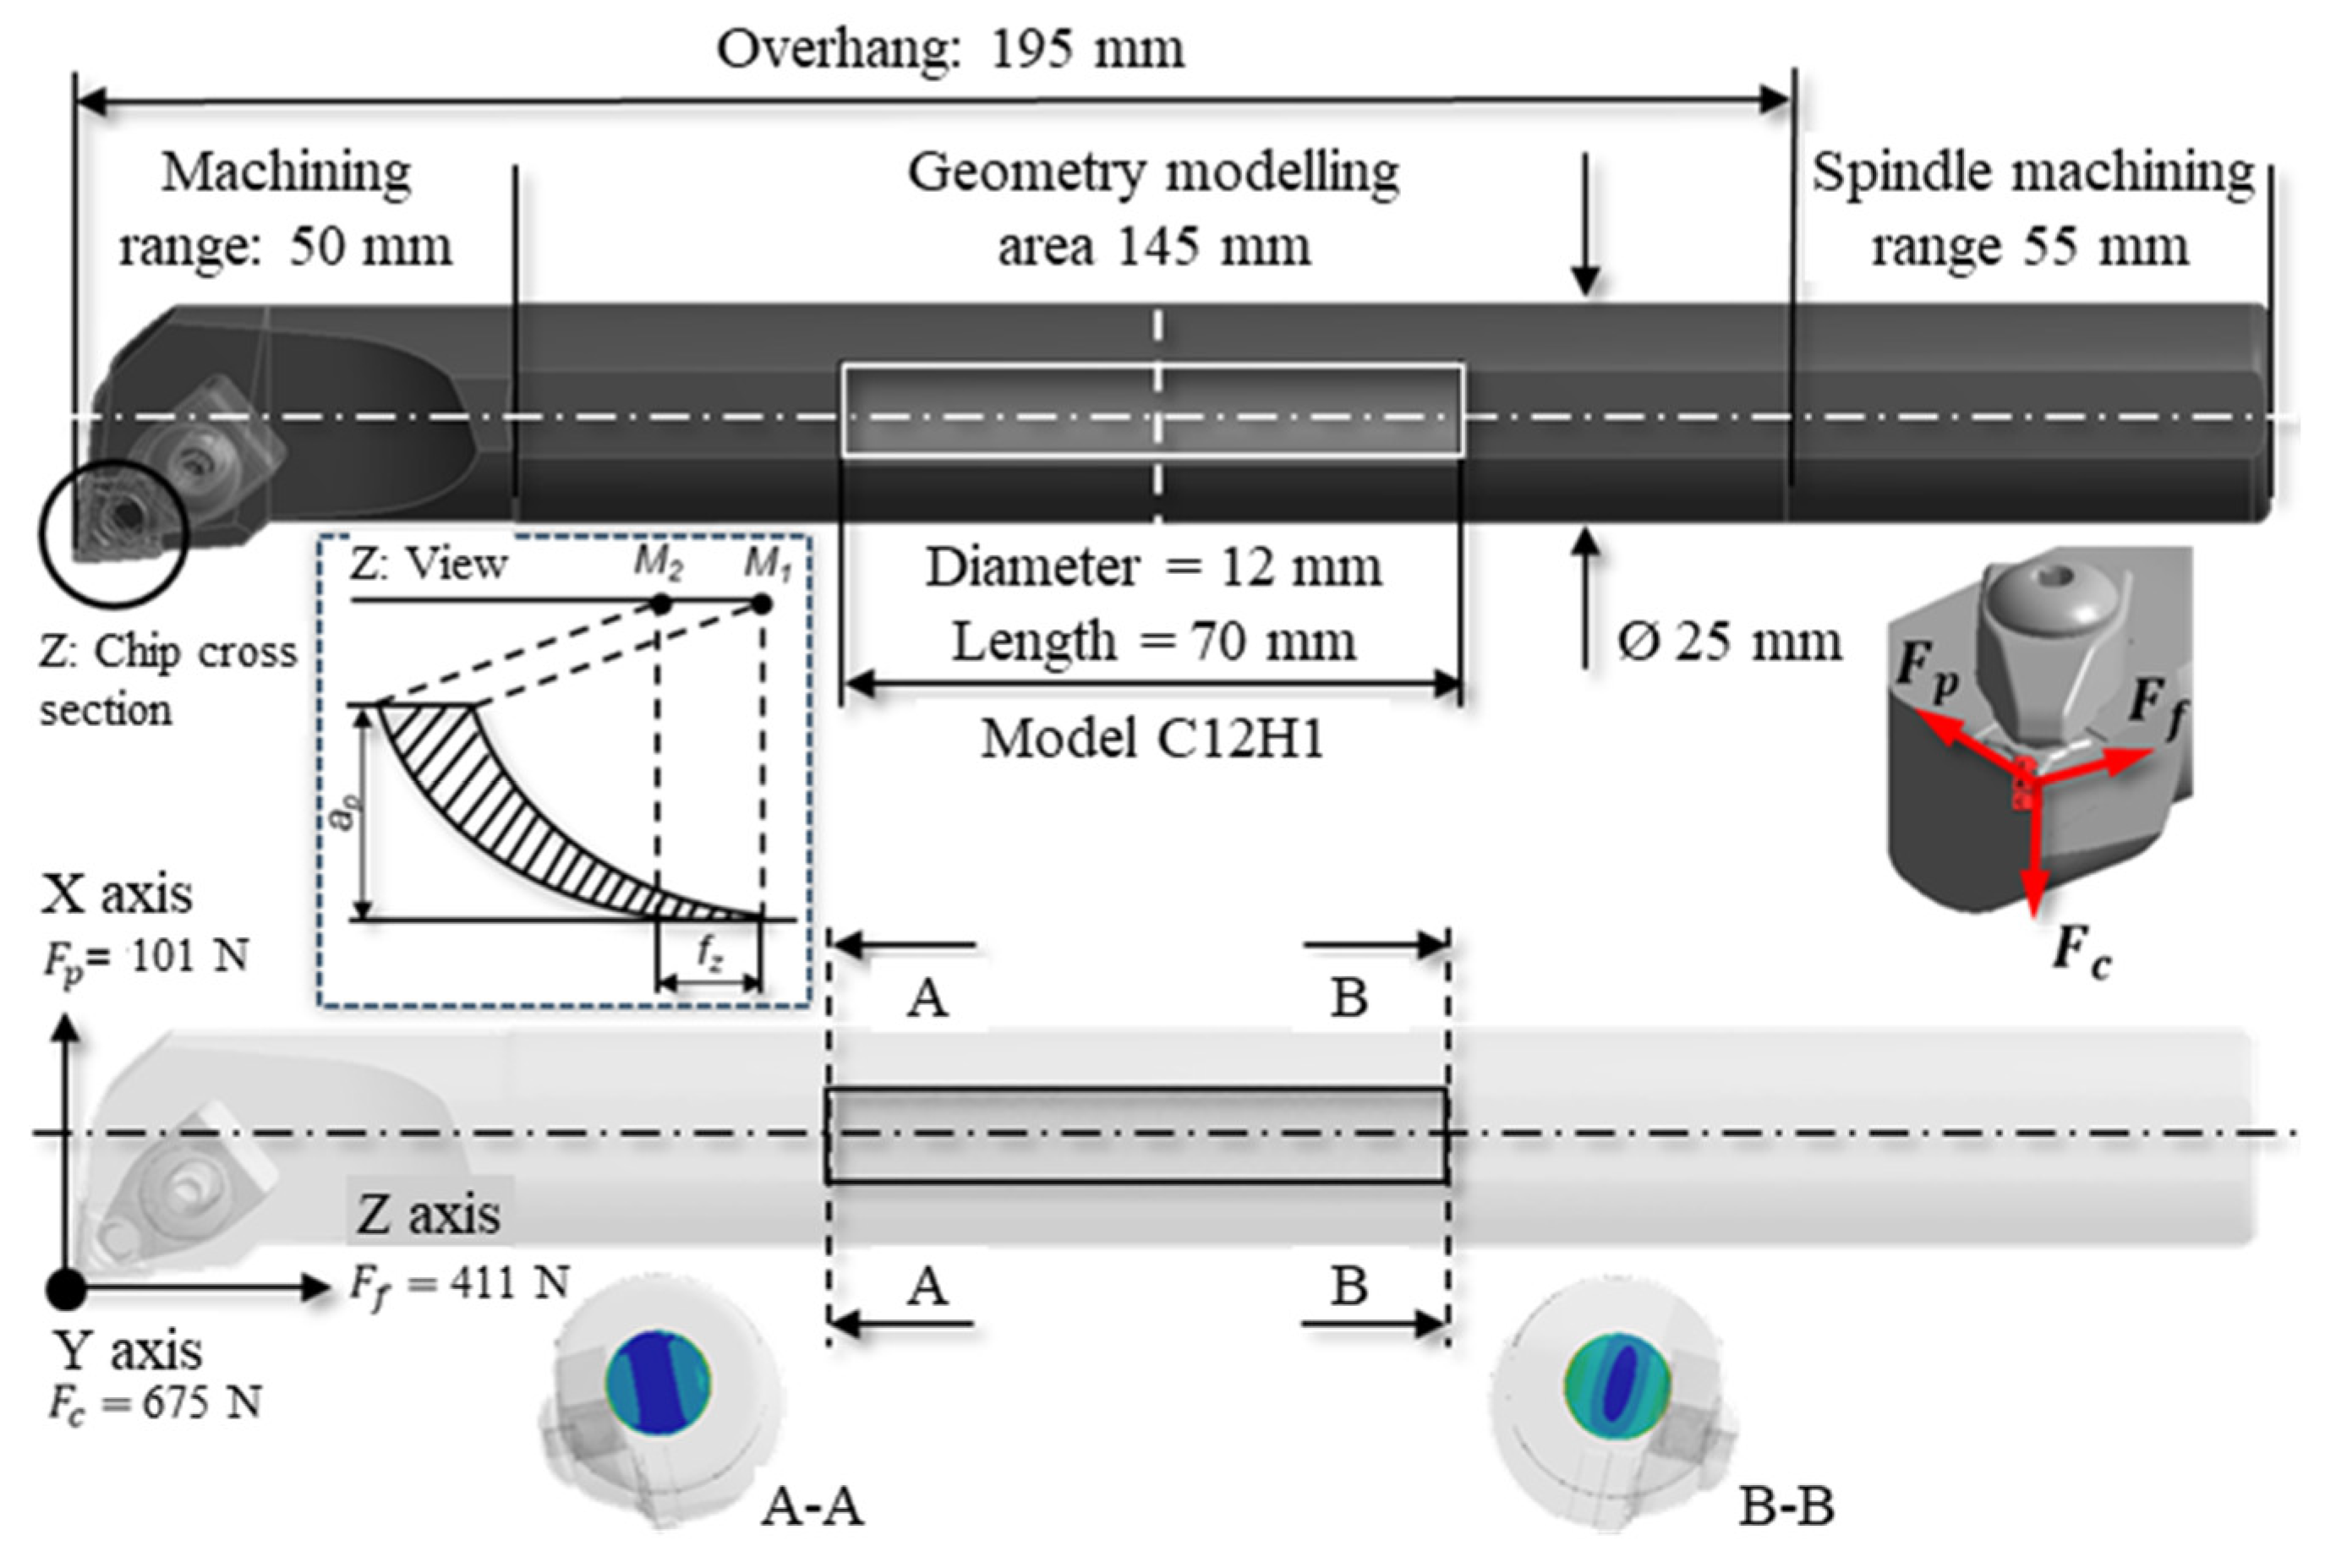
2.1. Experimental Setup for First Step

Boring tests were conducted to obtain the dynamic behavior of the original boring bar. Therefore, the simulative and experimental results of the original boring bar were compared and evaluated. The tests were carried out on a Spinner TC400 52 MC CNC Lathe (Faculty of Technology, University of Afyon Kocatepe/Turkey) using a boring bar made of chrome-vanadium alloyed spring steel (51CrV4) under wet conditions (a water-soluble coolant). The chemical composition and material properties of steel are given in Table 2.
Inconel 718, which is a nickel-based super alloy, was used in the tests as the work material. First, a pilot hole with a diameter of d = 20 mm was drilled into the workpiece. For this purpose, an indexable insert drill (ISO code: 870-2000-20LX1-5) and a cutting insert (ISO code: 870-2000-20-MM 2334) suitable for this drill were used. The pilot hole was then enlarged up to d = 30 mm. The reference drill rod (ISO code: E20S-SCLCR 09-R) with a diameter of d = 25 mm was used for hole enlargement. In the study, the cutting conditions recommended by the tool manufacturer were taken into consideration. In this framework, boring tests were performed at a constant cutting speed (Vc = 75 m/min), feed (f = 0.1 mm/rev), and depth of cut (ap = 2 mm). Each of the tests was repeated three times for statistical validation. A new indexable insert was fixed on the tool holder at the beginning of each test to ensure comparable results. The cutting forces created during machining were measured using a Kistler 9119A dynamometer (Faculty of Technology, University of Afyon Kocatepe/Turkey) (Figure 4a). To measure the natural frequencies of the reference tool, an accelerometer was connected to the tooltip. The dynamic characteristics of the boring bar were measured using a hammer (Dytran brand, model number 5800B4). An accelerometer (Dytran brand, model number 322F1) was mounted at the position of interest to measure the response. A four-channel data acquisition system (Novian brand, model number S04) was used in combination with CutPRO’s® Tap Testing measurement module [53]. Since the stability of machining operations is governed by the dynamics of the tool in radial and tangential directions [54,55], i.e., the X and Y directions in Figure 4b, the amplitude value of the tool holder was obtained by applying the hammer test in the X and Y directions. As can be seen from Figure 4b, the Real and Imaginary graphs obtained in the X and Y axes overlap with each other. This confirms that the boring bar exhibits similar dynamic characteristics in both axes.

2.2. Modal Analysis and Harmonic Response Analysis with ANSYS

Simulative modal analysis using the FEM is an effective and reliable choice to determine the quality of the lattice structure and its dynamic properties. For the FEM, different solution functions are available in ANSYS such as the Reduced Method, the Subspace Method, Unsymmetrical Method, and Damped Method. There is also the Block Lanczos Method, which is suitable for undamped linear systems with symmetrical matrices [56].
In general, the FEM attributes discretization to the differential equation systems, so that typical structural dynamic problems arise during the solution. Based on d’Alembert’s principle, the generalized equation of motion of the discretization process of a continuous structure can be described by FEM:
M q ¨ + C q ˙ + K q = f ( t )
where M is the mass matrix, q ¨ the second derivative of the displacement q, q ˙ is the velocity, C the damping matrix, K is the stiffness matrix, and f(t) is the vector of applied forces at time t. In ANSYS, programmed FEM codes exist for the solution of static displacement and static stresses, natural frequencies and mode forms, forced harmonic response amplitude and dynamic stress, transient dynamic behavior, and transient stresses, so that the first part of the solution for the free oscillation of the structure can be given with the following matrix equation:
M q ¨ + K q = 0
With this equation, the natural frequencies and the mode forms of linear undamped systems can be determined and correspond mathematically to the solution of an eigenvalue problem. With modal analysis, the dynamic properties of the model can be understood, and based on this, a harmonic response analysis can be performed to determine the behavior of the structure under a stationary sinusoidal (harmonic) load at a certain frequency:
f = f m a x e j ψ e j Ω t
q = q m a x e j θ e j Ω t
where e j is the sinusoidal motion with a phase shift and Ω is the excitation frequency at which the load is applied. There may be a force shift ψ due to different loads and a phase shift θ . The answer to harmonic response analysis is then solved with:
Ω 2 M + j Ω C + K x 1 + j x 2 = F 1 + j F 2

2.3. Development of a Simulation Model

In this section, a simulation model is developed for the passive damping modification of the boring bar, aiming to insert the largest possible and most suitable volume defined by an optimized diameter-to-length ratio of a hollow into the bar. During the simulations, a modal damping ratio of 2% was assumed throughout the structure to account for energy dissipation effects. For the finite element mesh, Solid186 tetrahedral elements (3D, second-order elements) were used, with a maximum element size of 2 mm to ensure sufficient accuracy in capturing the dynamic behavior. The material properties of the boring bar correspond to chrome-vanadium steel (51CrV4), as listed in Table 2. The boring bar was fixed at the clamping (tool holder) end as a boundary condition. An excitation force of 5 N was applied at the tool tip, acting separately in the X and Y directions to simulate operational vibrations. The frequency range for the analysis was set from 200 Hz to 800 Hz, with a step size of 1 Hz to capture the resonance peaks accurately. The Block Lanczos Method was utilized as the solver approach for the eigenvalue extraction during the modal analysis stage.
The allowable bending stress of the material is an important criterion that must not be exceeded during the modification. Figure 5 gives an overview of the modification procedure for the cylindrical hollow space. The procedure involves two preliminary steps and they utilize the same bending stress equations. The initial step pertains to the analytical calculations of the original boring bar, whereas the subsequent step employs the identical approach to the simulated model. In a similar manner, the third and fourth steps also utilize the same control mechanism for a modified boring bar with a cylindrical hollow.
The allowable bending stress value for the boring bar material 51CrV4 is σ b a l l o w a b l e = 183.3 MPa. For reference tool 1, the existing bending stresses were calculated analytically, and the existing values of the bending stress were validated with the simulated reference model 2. On this basis, it was possible to simulate the cylindrical hollow model. To be able to validate the cylindrical hollow model as well, the existing bending stresses were calculated analogously in the same way as described above and were compared with the existing simulation values.
It is evident that, in light of the aforementioned validation, the subsequent determination and selection of additional cylindrical hollows, characterized by heterogeneity in terms of length and diameter, can be facilitated on the basis of this criterion. The appropriate dimension for the cylindrical hollow is also to be used for the ellipsoidal hollow. Due to the ellipsoidal geometry, the analytical calculation cannot be performed, so a different solution was used to validate the simulation model (Figure 6). For the analyses, the measured force data from the test were considered.

2.4. Determination of the Maximum Hollow Volume by FEM Simulation

Dynamic stiffness is defined as the ability to resist process-induced vibrational forces. This factor is strongly dependent on the tool overhang and the diameter of the boring bar [57]. This explains why the dynamic stiffness in boring is typically low and decreases as the L/d ratio increases, thereby amplifying vibrations [58]. As the hollow is modified, the internal cross-sectional area changes and so does the area moment of inertia, marked A-A and B-B in Figure 7. It is located to the left and right sides of where the hollow ends. The dimensions of the boring bar, acting forces on it, and the boundary conditions for the simulation are also shown in Figure 7. A cylindrical hollow space was selected in the geometry modelling area to perform the validation. As the drill starts to remove material, the feed and depth of cut create a comma-shaped chip profile. This real intervention situation was considered in the simulations.
In the run-up to the modification, the existing bending stress on the:
  • reference model (original boring bar) was calculated analytically with σ ( A v a i l i a b l e ) = 42.90 MPa. This value is far below the permissible bending stress σ ( A l l o w a b l e ) = 183.3 MPa, which means that the criterion is fulfilled.
  • The cylindrical hollow space was also calculated analytically. This value is also far below the allowable bending stress with σ ( A l l o w a b l e ) = 45.30 MPa.
Subsequently, the reference model (original boring bar) and the model of the cylindrical hollow space were generated and structured for the simulation. These are shown in Figure 8, although pragmatically the ellipsoidal hollow is also shown here, which will not be discussed until Section 2.6.
  • The simulation of the reference model (original boring bar) resulted in a value of σ ( A v a i l i a b l e )   = 43.30 MPa for the existing bending stress. Validated with the analytical value, a very good agreement was achieved with only a marginal deviation of 0.92%.
  • Based on the validated reference model, the simulation of the cylindrical hollow was performed and an existing bending stress of σ ( A v a i l i a b l e )   = 47.76 MPa was achieved. Validated with the analytical value, a very good agreement was also obtained by a small deviation of 5.15%.
For the cylindrical hollow, different lengths and diameters were selected and all configurations were simulated. The results are listed and graphically illustrated in Table 3. In the region of the moment of inertia B-B, the values of the bending stresses are higher than in area A-A for all results. For the models C21H2 and C21H3, the allowable bending stress is already exceeded and the model C21H1 is only just below it. However, since the length here is only L = 70 mm and the aim is to achieve the largest possible hollow volume, these were no longer considered in subsequent analyses. The models with diameters of d = 12 mm and 15 mm are also no longer included in the analyses for the same reason. It is evident that the model C18H3 has been deemed eligible for progression to subsequent phases of the investigative process, which will involve a range of analytical procedures.

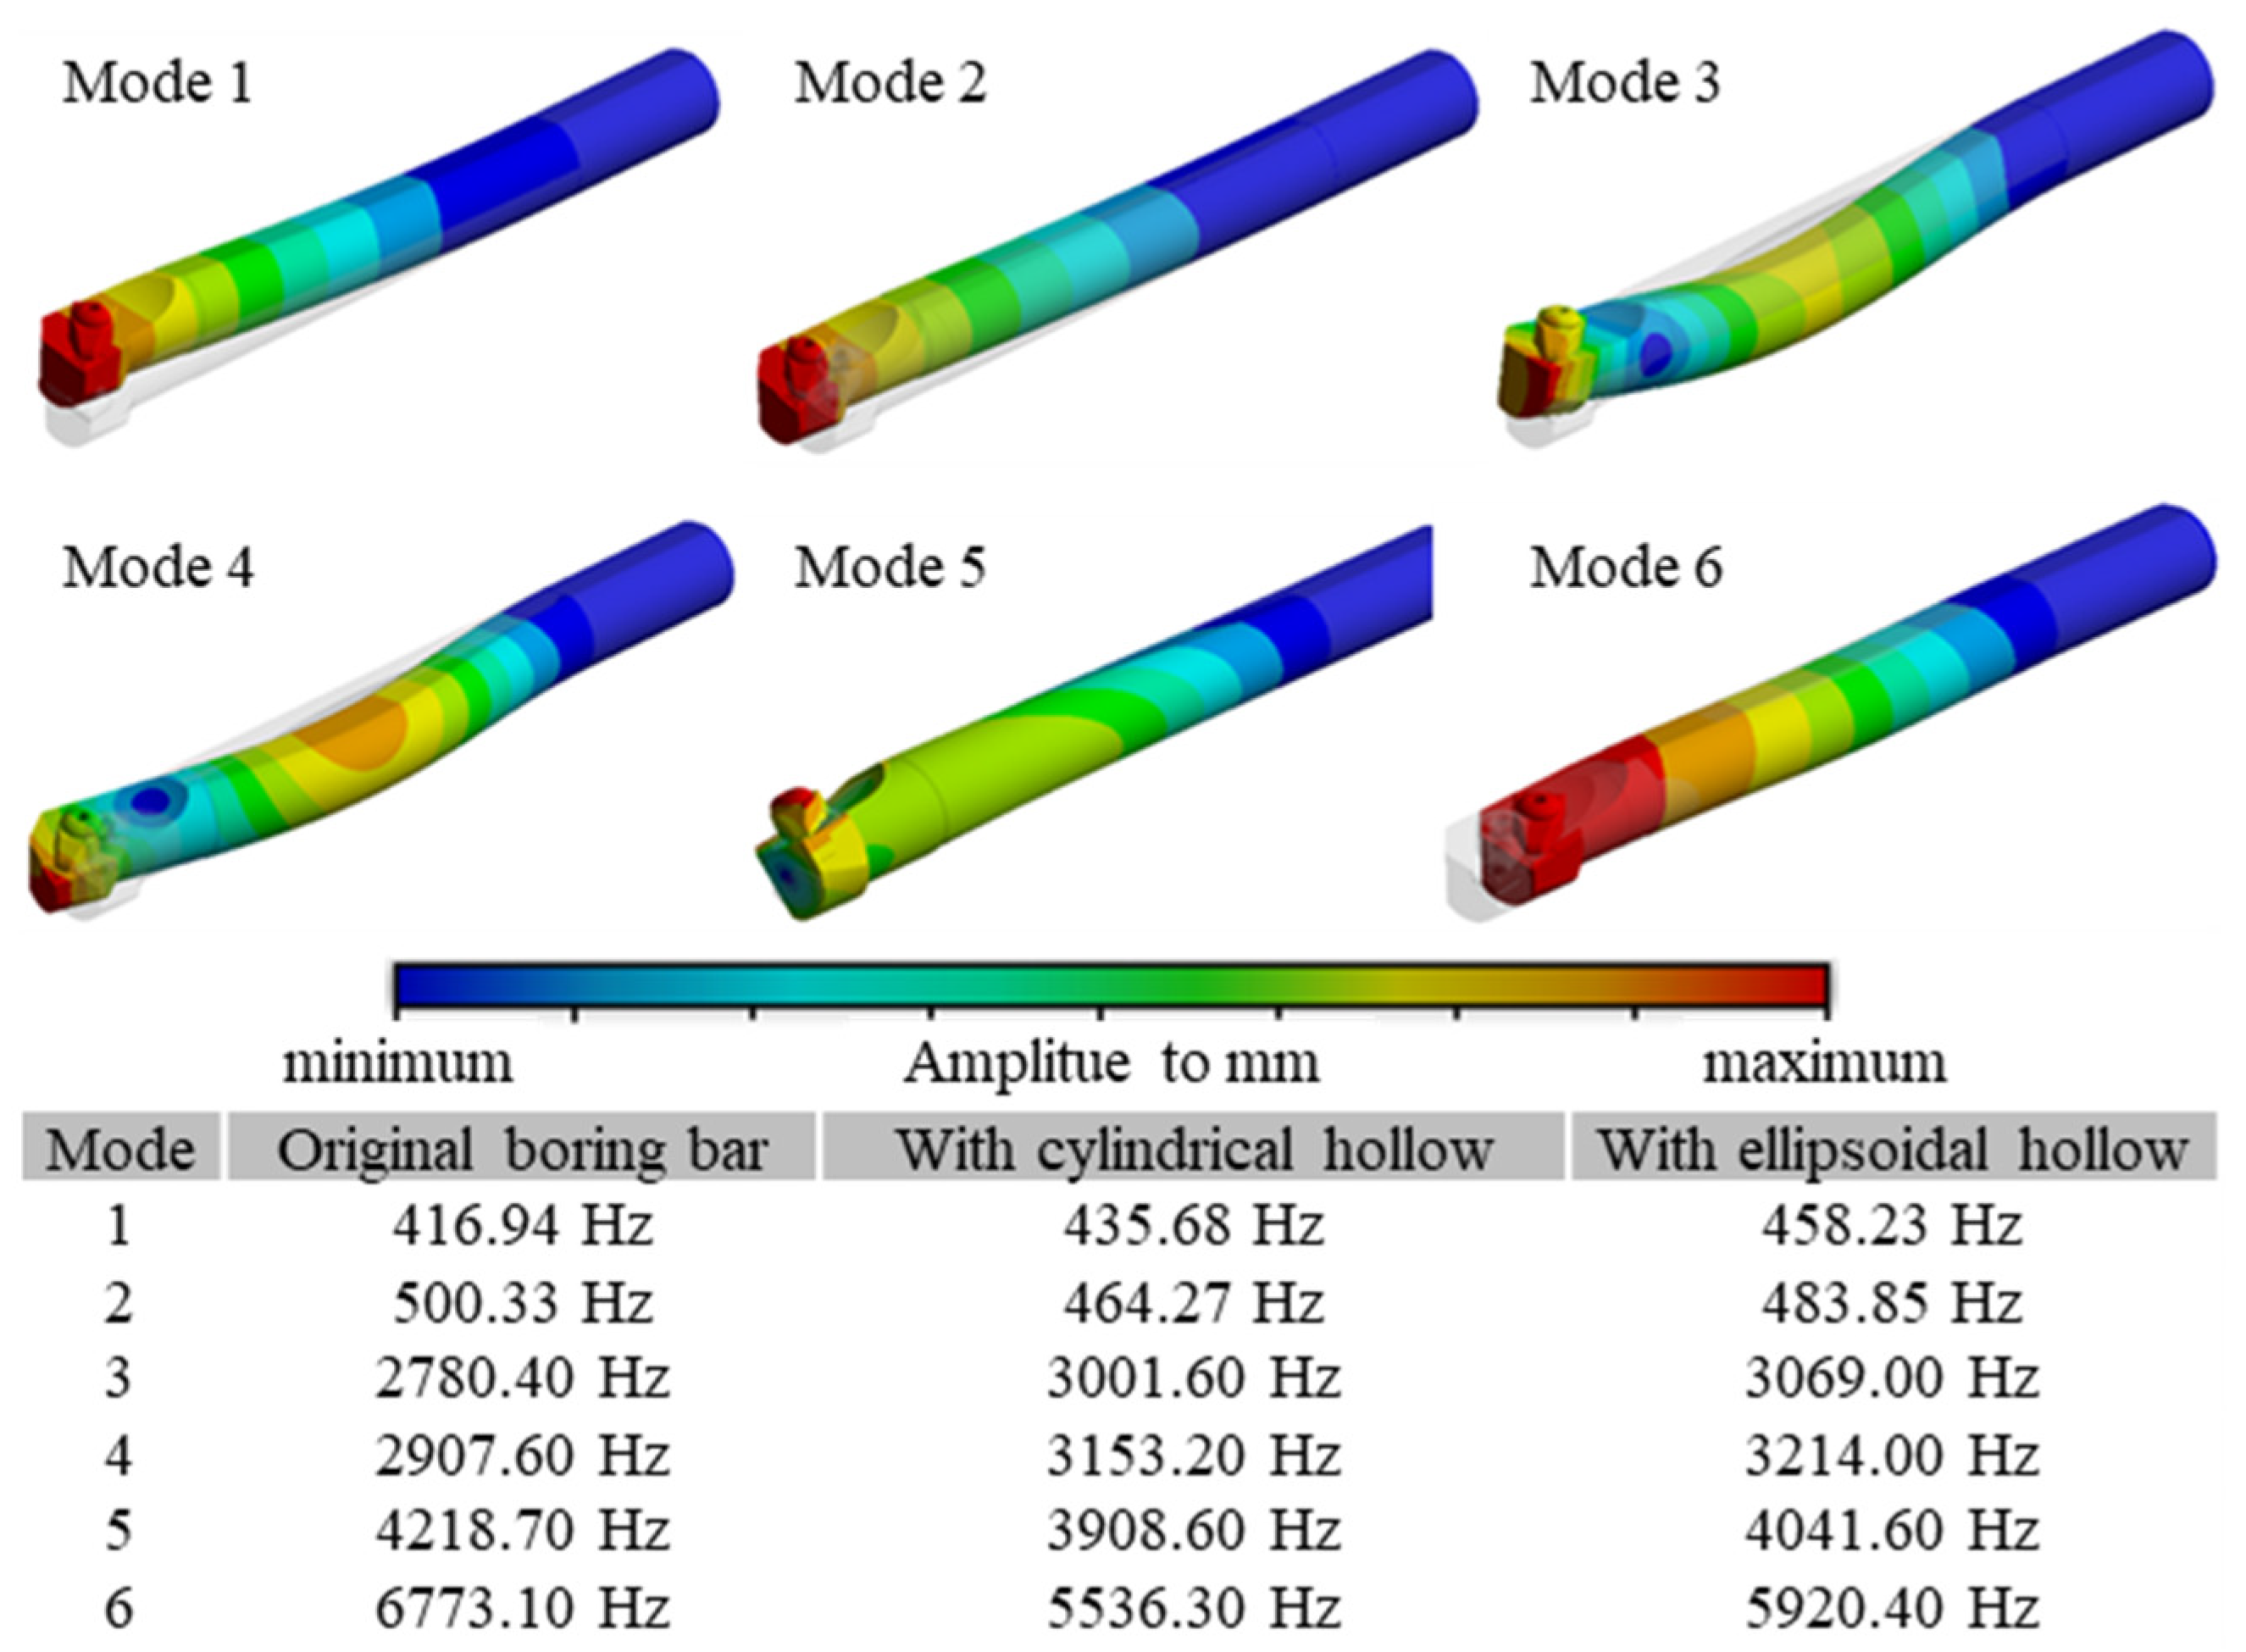
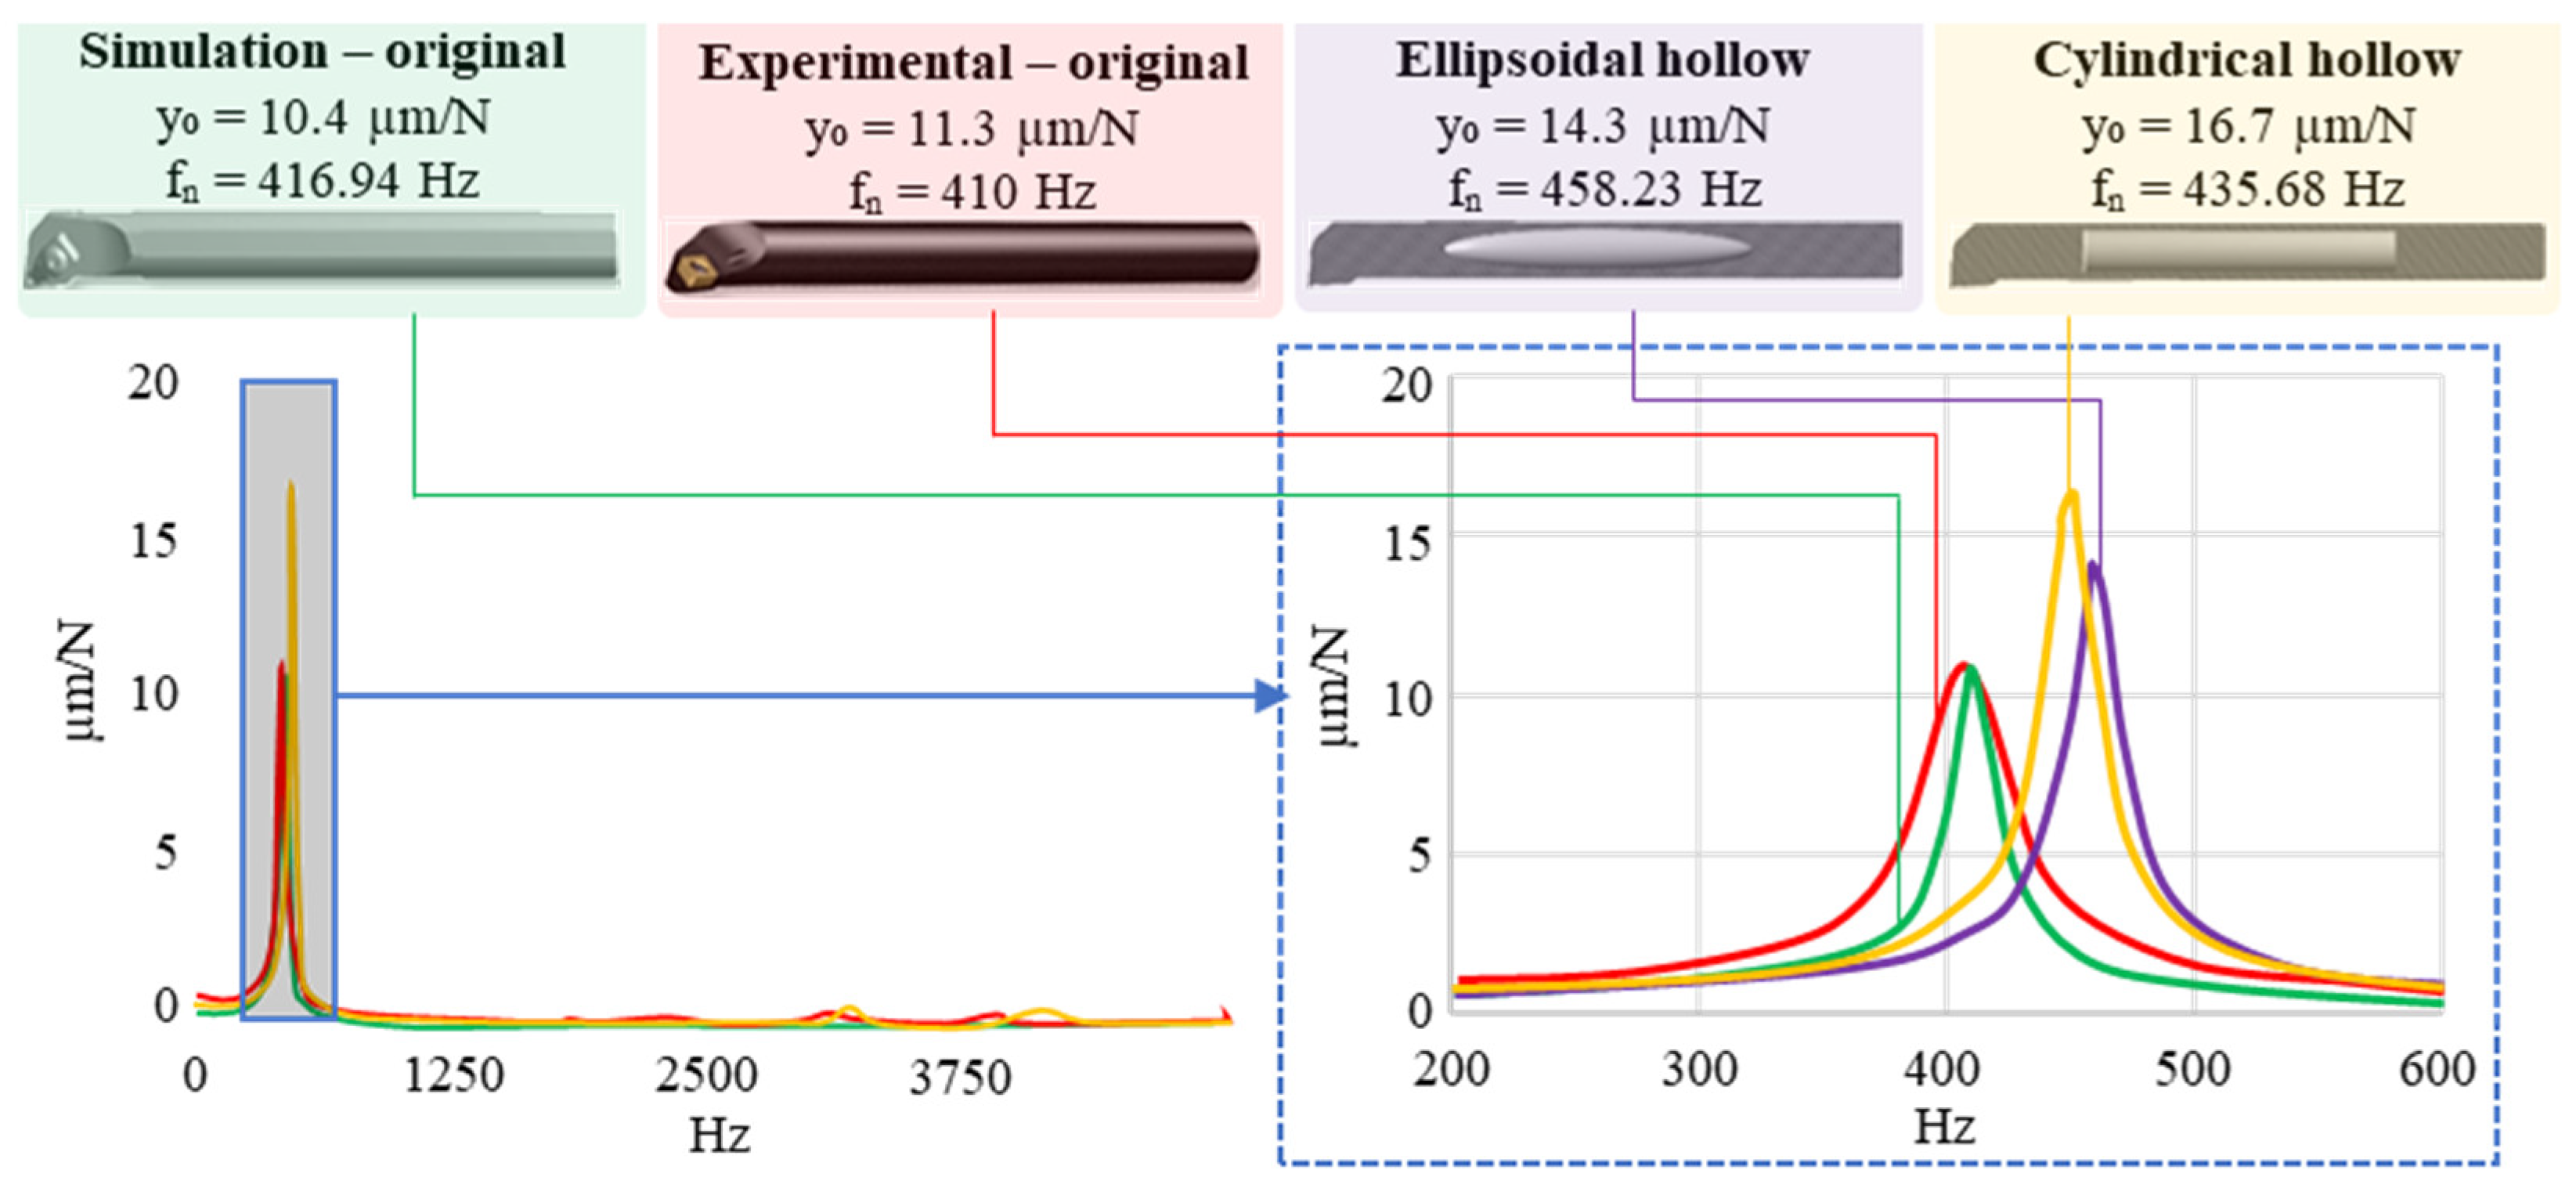
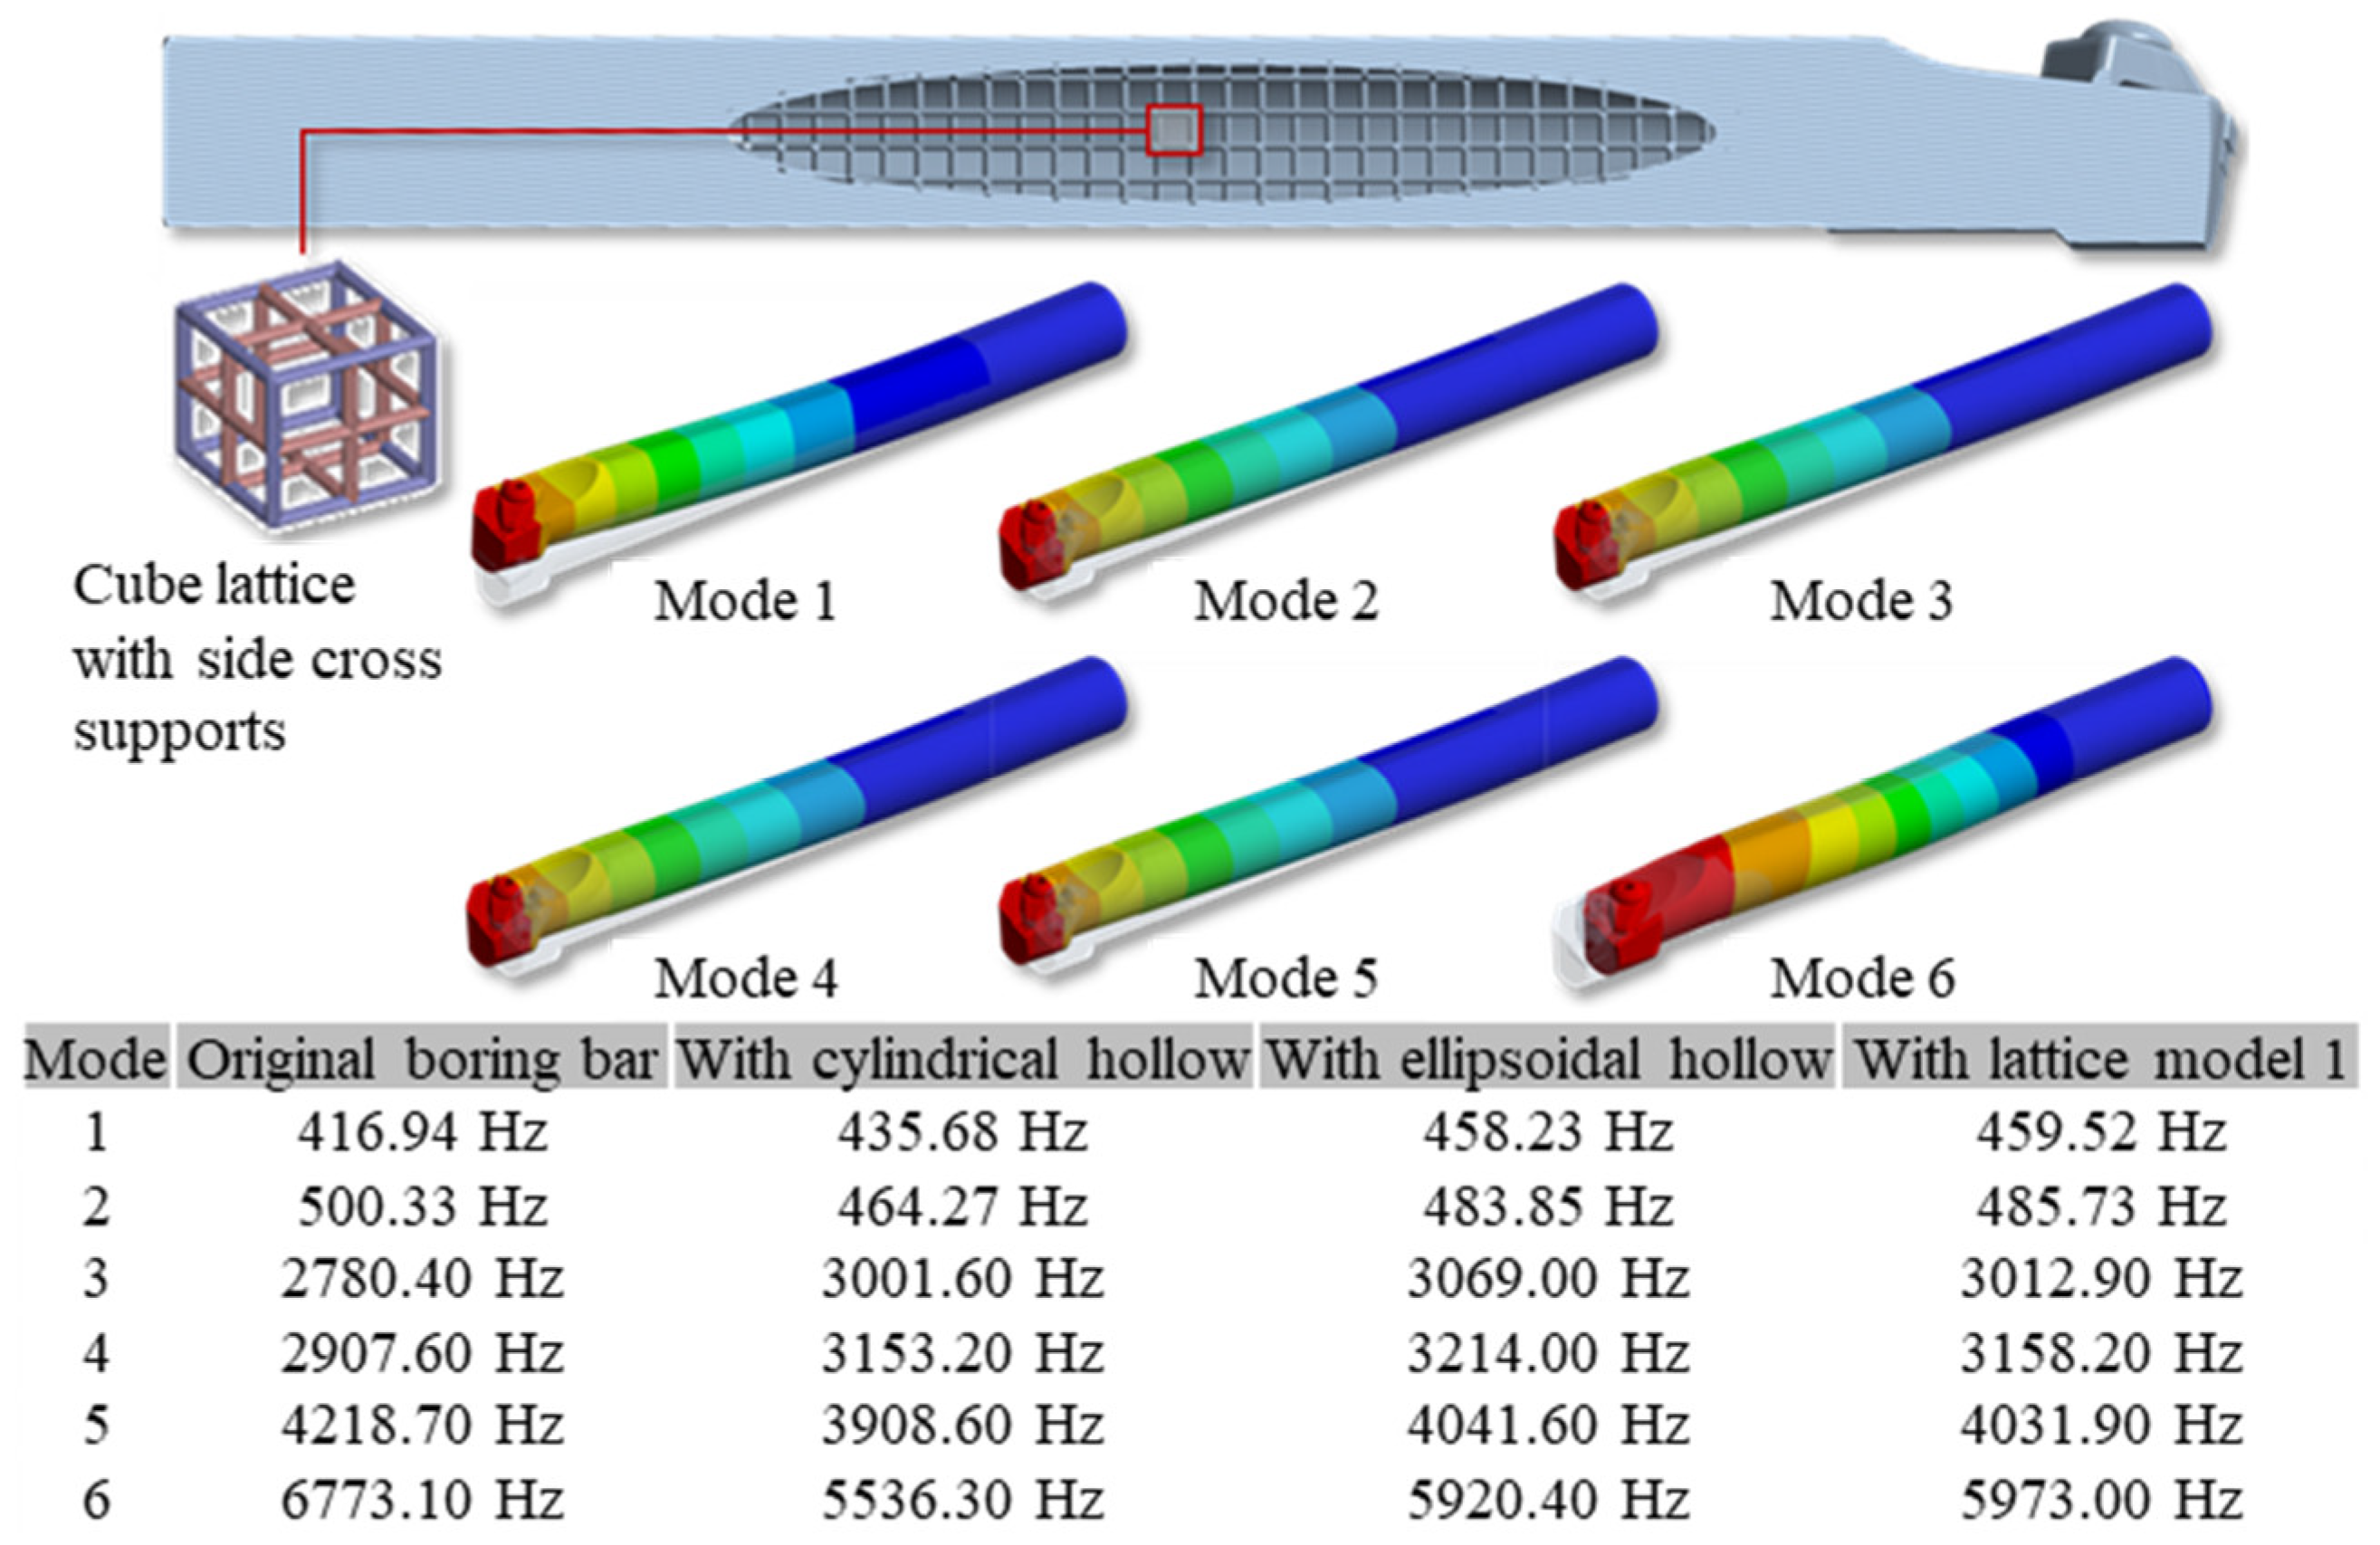
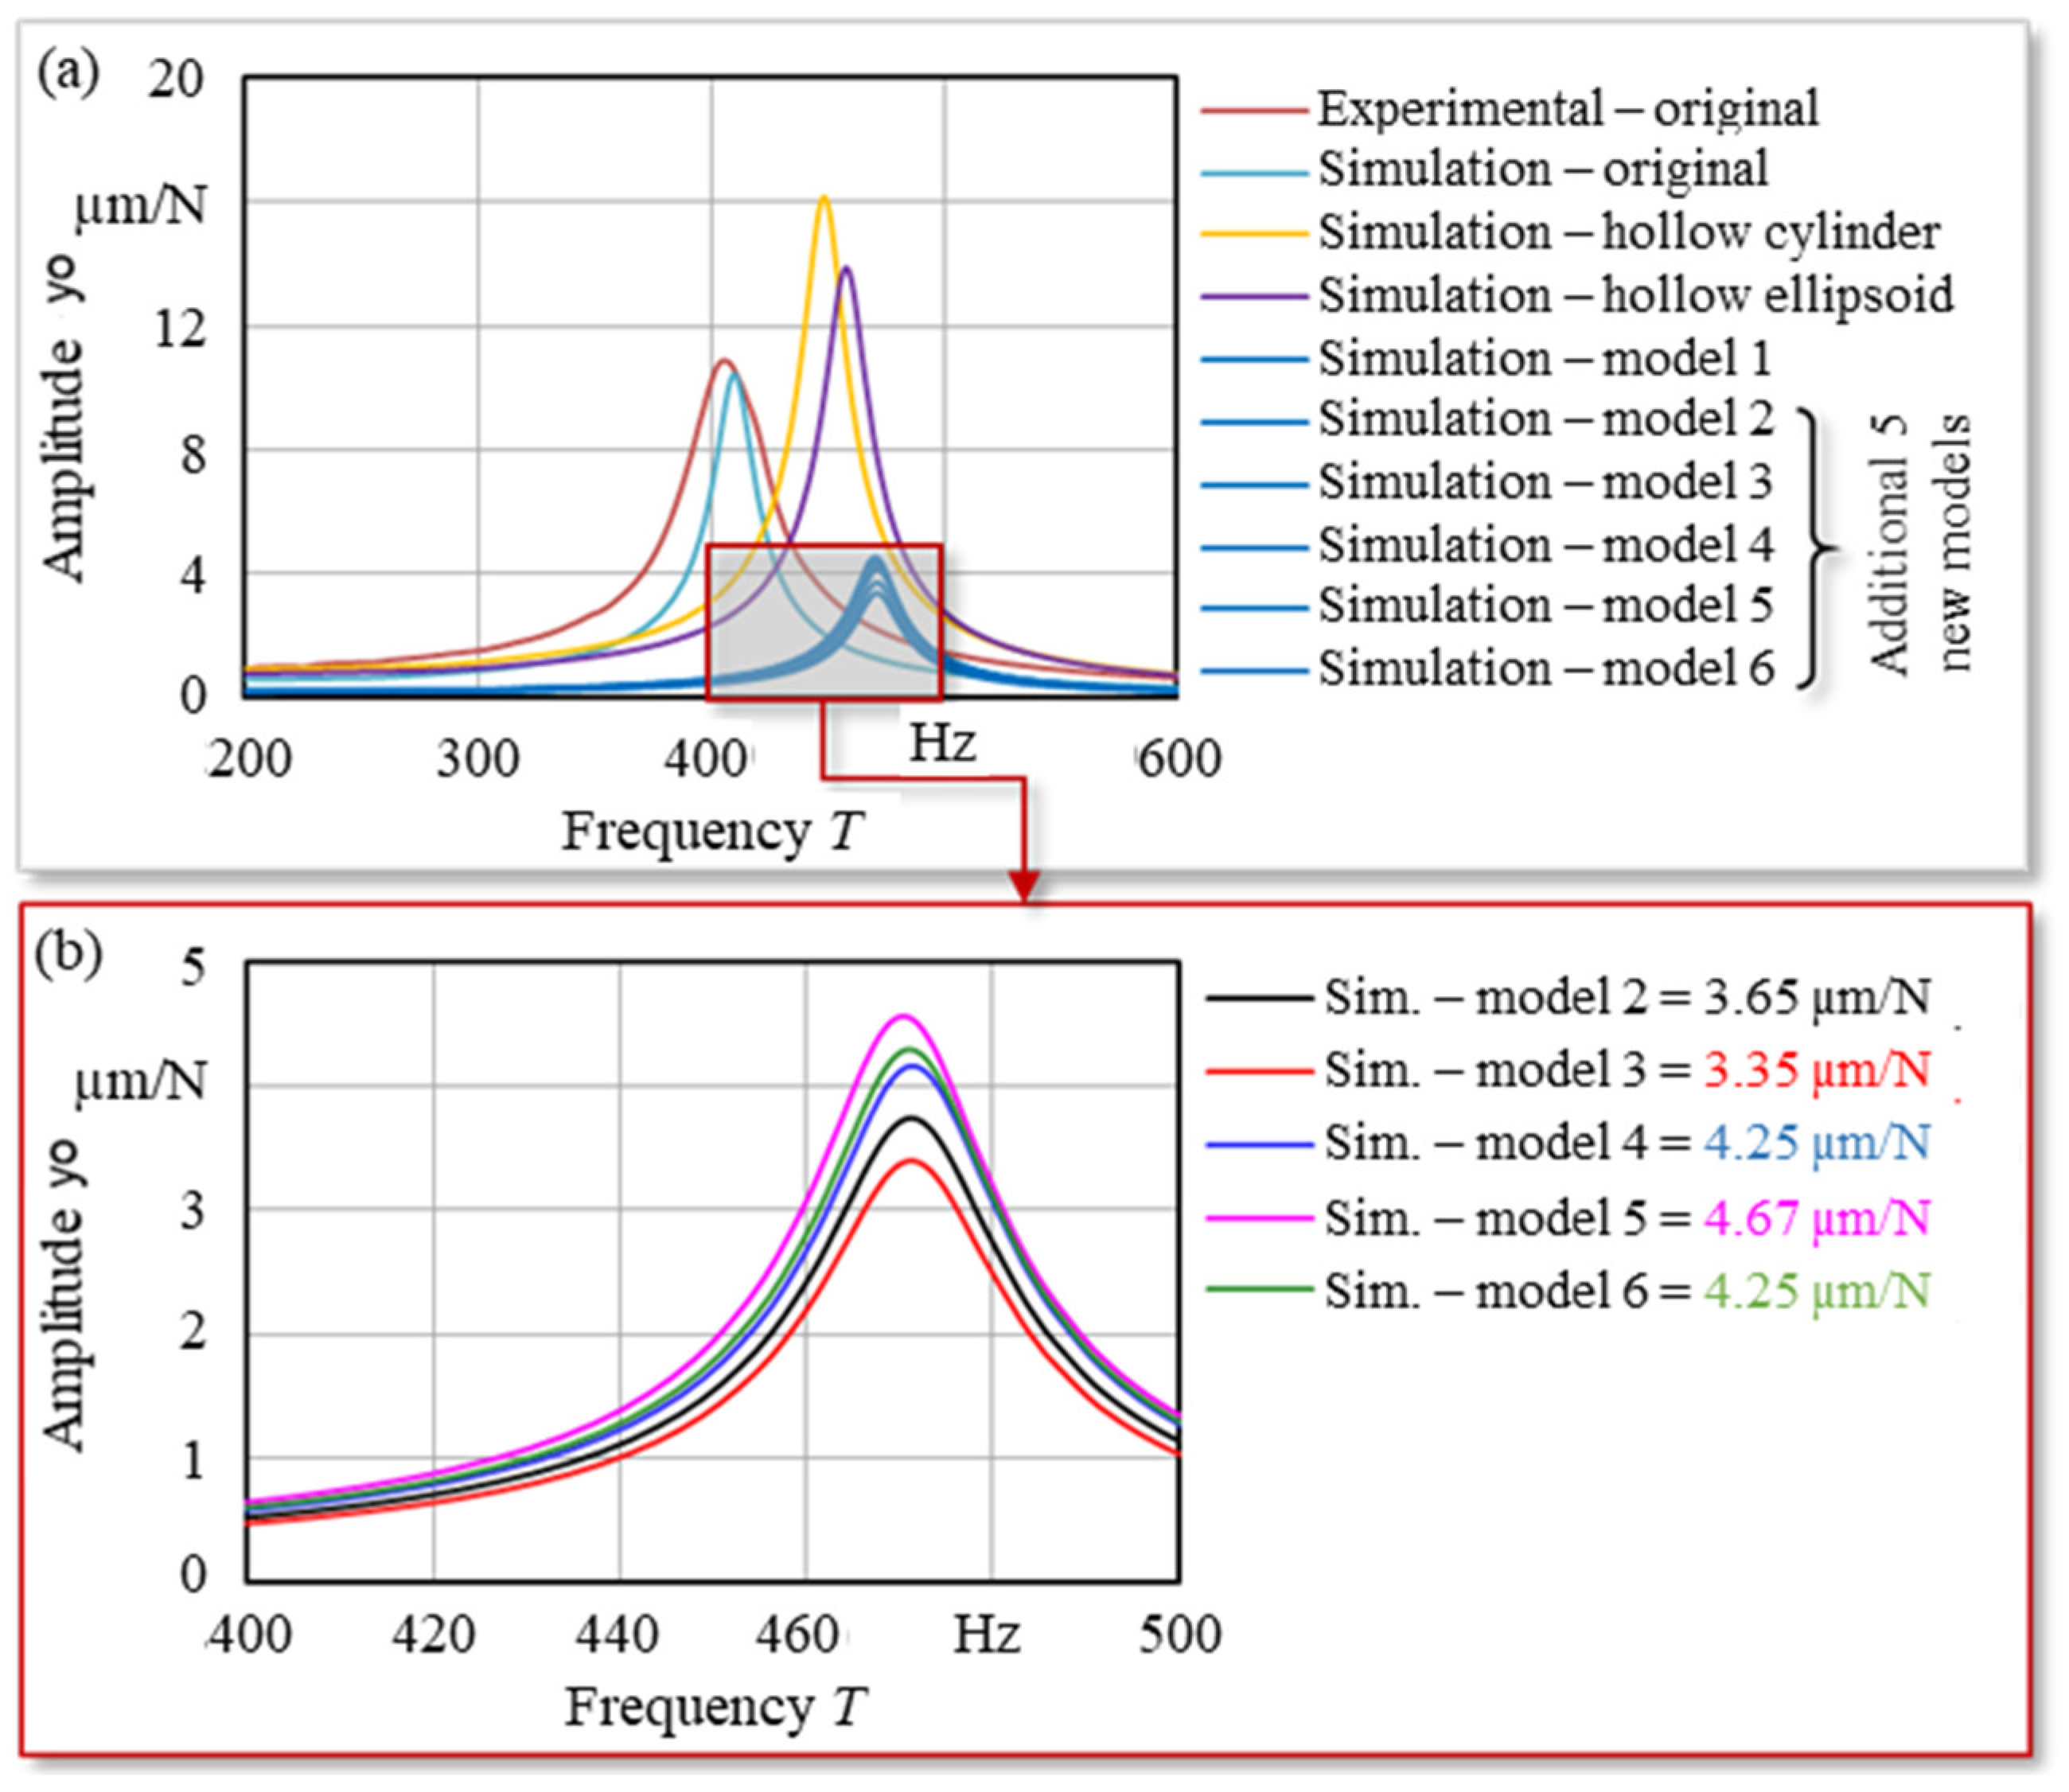
2.5. Modal Analysis and Harmonic Response Analysis of the Modified Hollow

For the modification of the ellipsoidal hollow, the same dimensions are used as for the C18H3 model, i.e., d = 18 mm and L = 130 mm. A harmonic response analysis (HRA) is performed with the ANSYS software, and the resulting amplitude and frequency are compared. Subsequently, the HRA is also carried out with the two modified hollows. Therefore, it will be possible to decide which geometry (elliptical or cylindrical) has the lower vibration amplitude.
The basis of HRA is modal analysis, which is used for determining the natural frequencies and natural oscillations. The vibration modes are investigated without excitation or loading (non-linear changes or influences). Based on the reference model (original boring bar), the two modified hollows are taken into account in the idealization and discretization using FEM. For this purpose, the clamping length of the boring bars and the material properties were determined. Obtained results are given in Figure 9. The modal analysis resulted in six rigid body eigenmodes for each boring bar. It can be seen that the respective frequencies of the reference model (original boring bar) are higher than those of the modified boring bars. The frequencies of the cylindrical hollow are lower than those of the ellipsoidal hollow.
The HRA was initiated with the reference model (original boring bar), utilizing the findings from the modal analysis and the experimental determination of loads. It can be seen that the largest deflection, i.e., oscillation, occurs both in the experiment and in the simulation around an amplitude of y 0 = 11.3   μ m / N and a frequency of T = 416.94 Hz for the first mode. With this very good agreement, the reference model (original boring bar) also shows that the validity requirements are met and can be used predictively (Figure 10).
The HRA was performed in the same way with the two modified boring bars, i.e., C18H3 and E18H3 (Figure 11). The cutting force values used in the analysis were taken from Figure 7. As expected, the stiffness of the two boring bars in which a hollow form was inserted was reduced, which is why the deflection is higher than in the experiment and in the reference model (original boring bar). Interestingly, the E18H3 exhibited a significantly lower vibration amplitude compared to the C18H3. The development of the simulation model has not only allowed the determination of a suitable hollow volume with a weighting according to the two variables, diameter and length, but also a more suitable hollow shape.

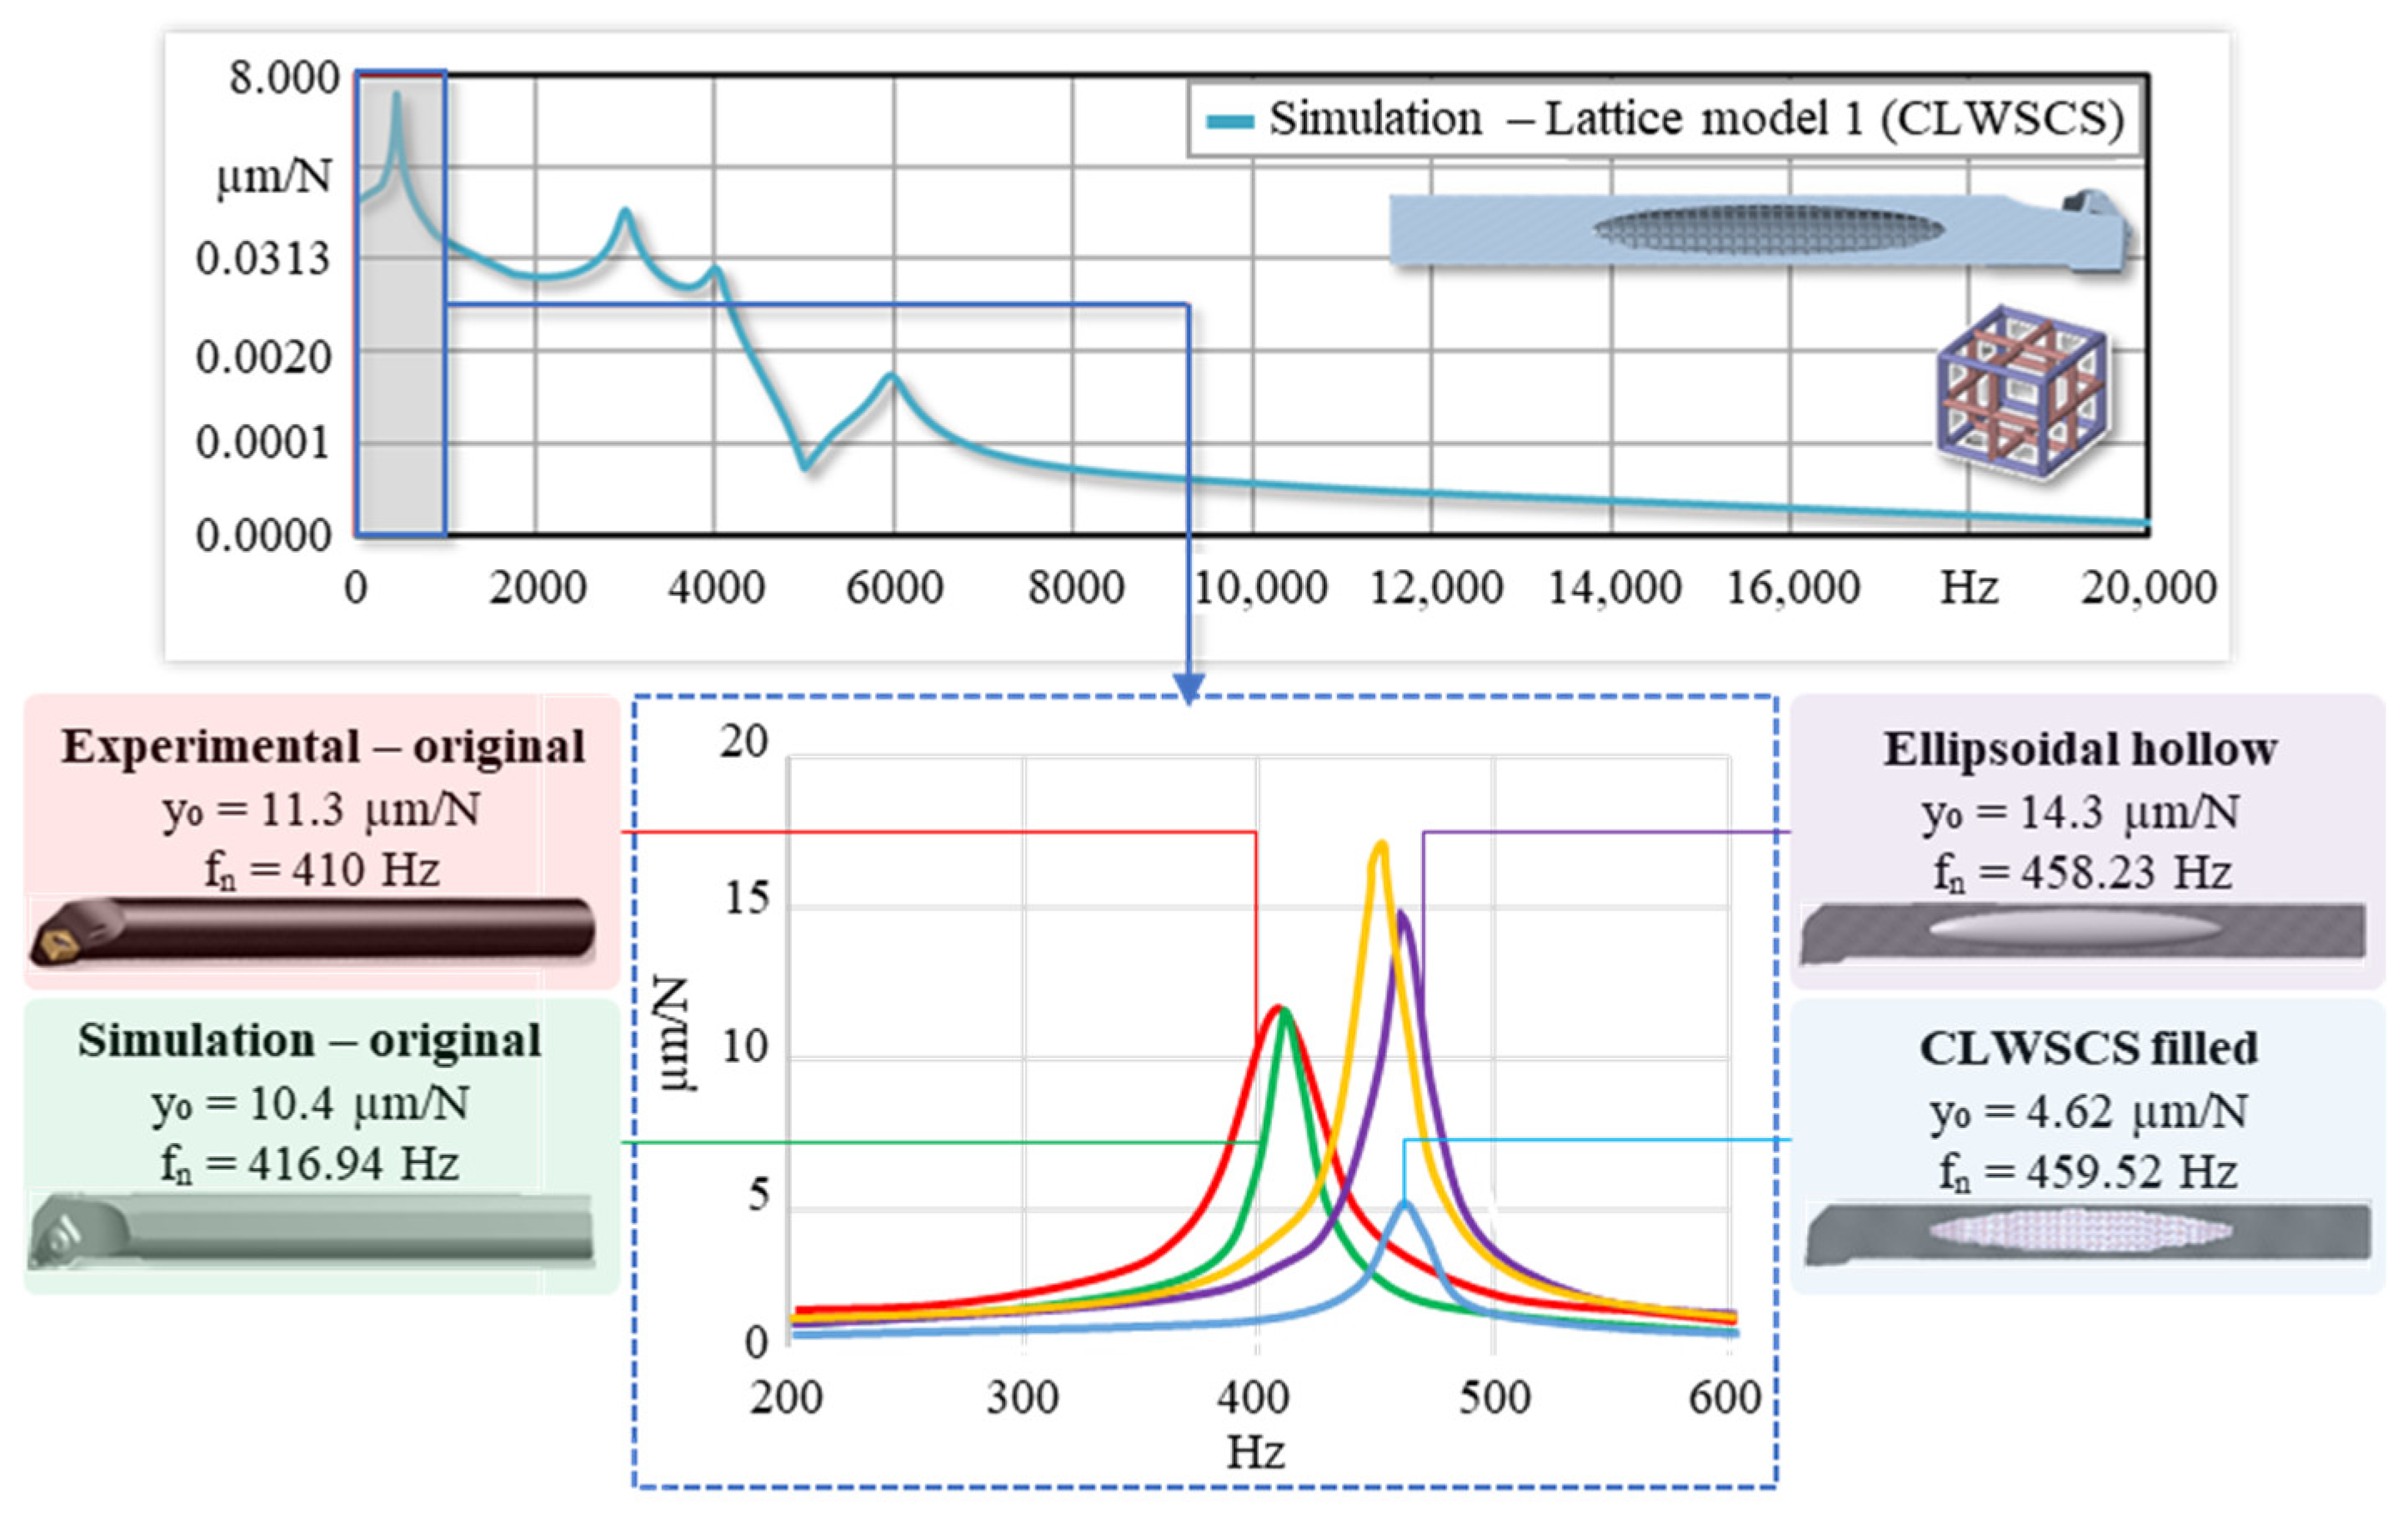
2.6. FEM Reference Model Damping Analysis with Lattice Cube

Several studies have highlighted the influence of lattice structures on the vibration behavior of products [59,60,61,62]. Therefore, this study models the effect of lattice structures on chatter—a critical issue in boring—for the first time. In this context, a single type of lattice structure of CLWSCS (Cube lattice with side cross support), which is believed to have a vibration-damping effect, was preferred. The modelled boring bar E18H3 was filled with a lattice structure consisting of individual cube lattices with side cross supports (Figure 12). As mentioned before, since the modelling phase is extremely difficult, this issue is discussed separately, and the solution-related studies are explained in Section 3. The 3D lattice structure has several advantageous properties compared to the reference model (original boring bar), such as good energy absorption properties, specific stiffness, lower weight/density, and multifunctionality. These properties are further enhanced by the addition of cross-support. The filled model was subjected to Harmonic Response Analysis (HRA) using the same methodology described earlier.
The structuring of the cube lattice structure, which is located in the ellipsoidal hollow of the boring bar, was very challenging. The physical properties of the vibration behavior to be analyzed are strongly dependent on the degree of structuring. The structures are tetrahedral-independent structures, which means that the element size is independent of the local geometry (Figure 13). The structure of the three-dimensional cube lattices could not be solved individually but had to be solved in conjunction with the neighboring cubes at all nodes and the edge junctions of the hollow.
Figure 14 shows the respective frequencies and the six eigenmodes of the modified boring bar. Compared to the modes of the reference model in Figure 9, the modes of the modified model show a more balanced behavior. The vibration characteristics, especially in modes 3 and 4, are very well balanced compared to the reference model. Overall, it can be seen that the vibrations are very well absorbed and damped by the lattice structure throughout the modified tool.
Figure 15 shows the final results of the HRA. While the amplitude in the E18H3 model was still higher than in the reference model, it has rapidly decreased by 67.69% due to the filling of the lattice structure by lattice model when it is compared to the E18H3 model. The frequency range between the model E18H3 model and the lattice model 1 is almost identical, and the vibration process takes place at 416.94 Hz on the one hand and 459.52 Hz on the other. Compared to the reference model (original boring bar), the amplitude decreases from y 0   = 10.4 μm/N to y 0   = 4.62 μm/N with the lattice structure (cube lattice with side cross support). As a result, the vibrations of the boring bar are significantly reduced by 55.58% compared to the reference model (original boring bar).

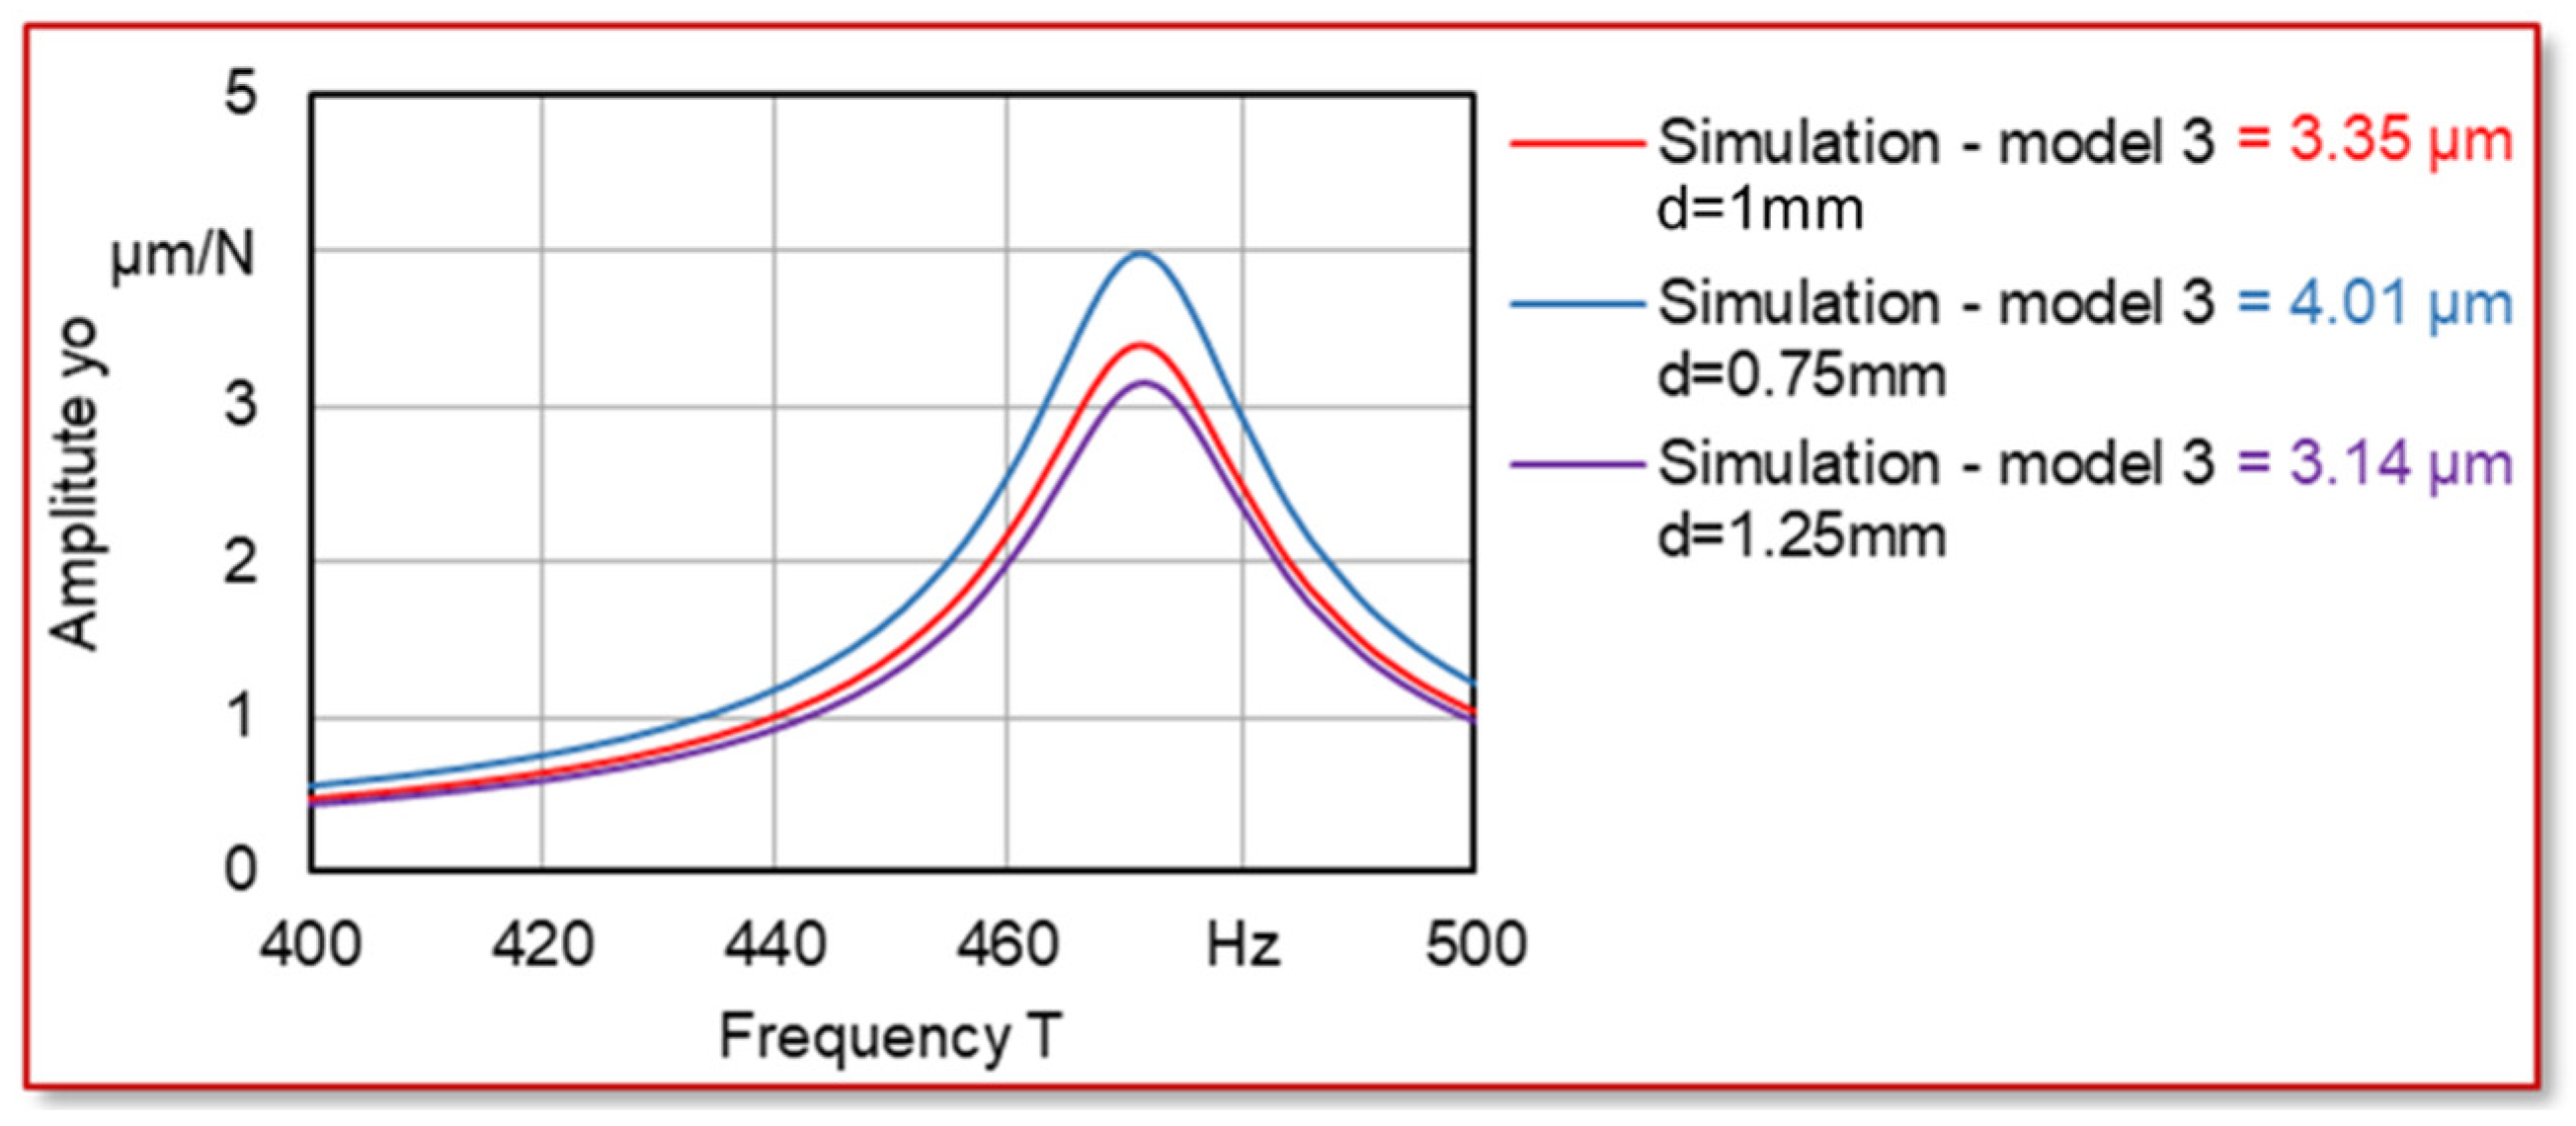
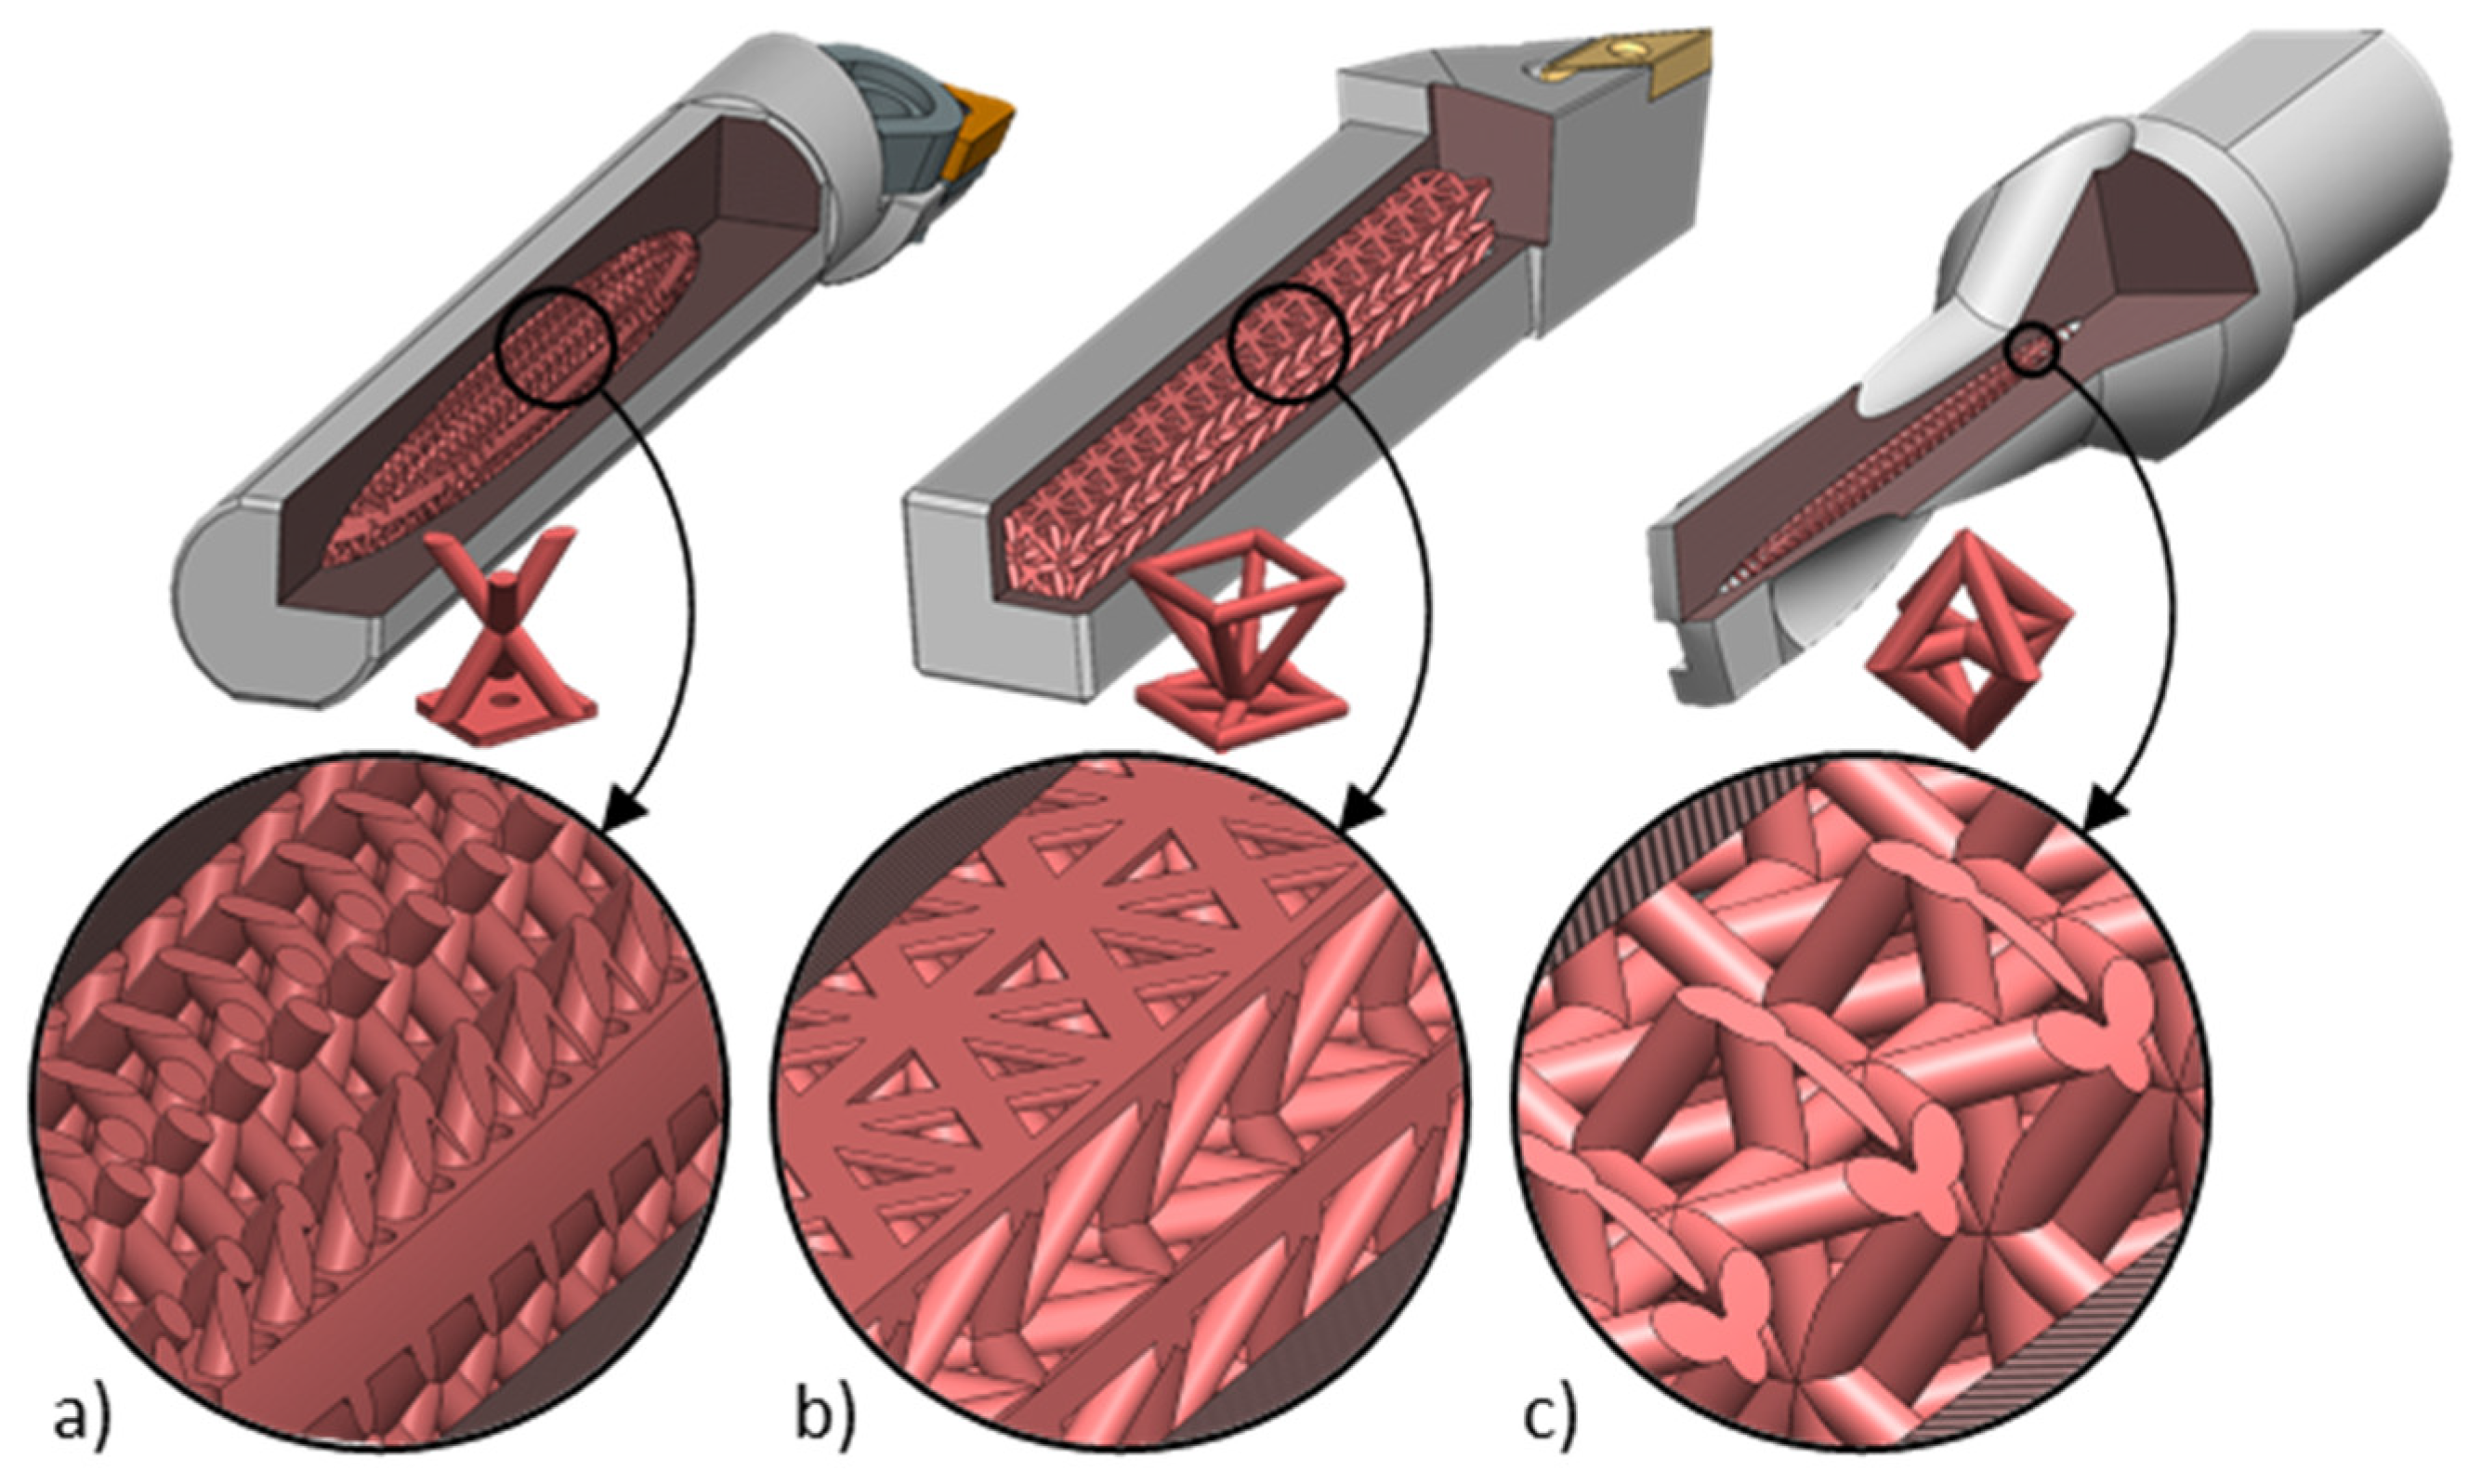
2.7. Testing of Different 3D Lattice Structures

Following this evaluation and the new knowledge gained, further numerical analyses were carried out. Five 3D lattice structures were used for filling the ellipsoidal hollow, which are discussed below (Figure 16).
The common feature of these structures is that the rod elements in the 3D lattice structures have a junction point. This junction point is located either at the center or at the base of the center of the 3D lattice structures. During the modelling phase, the beam diameters and lattice unit heights have been kept constant as 1 mm and 8.8 mm, respectively, for all lattice types. However, when the beam diameter and 3D lattice structure height are equalized, the area density of the lattice structure changes and cannot be controlled. Therefore, the relative density for each 3D lattice structure is different.
Figure 17a presents the vibration behavior of all models, including the reference model (original boring bar), experimental results, and the five newly designed 3D lattice structure models. In addition, the vibration behavior of the two hollows (E18H3 (ellipsoidal) and C18H3 (cylindrical)) was also taken into account. All newly simulated models clearly show a remarkably lower vibration behavior. These have been enlarged in the lower image section for detailed analysis. Compared to the already simulated models, the vibration process begins much later in models 2–6, namely at an average of 470 HZ, with an equally significant reduction in amplitude. Model 3 shows an amplitude of y 0   = 3.35 μm/N. Compared to model 1, model 3 shows a further vibration reduction of 28.57% and, compared to the reference model, an improvement of 67.79% was achieved.
For further analysis, the beam diameter of Model 3 was varied from 1 mm by 0.25 mm in two directions (Figure 18). On the one hand, the beam diameter was reduced to 0.75 mm, and on the other hand, it was increased to 1.25 mm. The results show that the reduction leads to lower stability and thus to a higher vibration behavior than with a beam diameter of 1 mm. In contrast, increasing the beam diameter to 1.25 mm shows an improvement of 6.27% compared to 1 mm.
Due to the relative density, this increases from 4.7% (1 mm beam diameter) to 5.9 mm with a beam diameter of 1.25 mm. To maintain these properties (stability and energy absorption) and, above all, the lightweight structure, a further increase in the beam diameter does not appear to make sense.

2.8. Computation Time for the Simulations

The computation time for the FEM simulations depends on the complexity of the algorithms, such as the stiffness and force matrices, as well as the deformation and stress fields. The formation takes place via the nodes and elements as well as the boundary conditions. At each simulation time step, the structure is updated, and the partial differential equations are solved iteratively in three-dimensional space. For each finite element, a set of equations is solved. Neighboring elements have common nodes, and these shift with each deformation. The solver loosens the system of equations until the displacements are available for each node, and this requires large computing resources (Table 4). Compared to the reference model (original boring bar), the number of nodes and elements is understandably reduced for the modified boring bars with hollow space. However, once the ellipsoidal hollow space is filled with 3D cube lattice structures, the number of nodes increases significantly.
The analyzed models had a very high number of nodes and elements and had to be solved numerically in their entire filling lattice structure. The lattices, which were already very small in size, required a correspondingly very fine structuring for good resolution. At the nodes, the numerical calculation generates a linear system of equations for the characteristic quantities of the structure. Solving the system of equations for the unknowns represents the problem. The calculation of the forces and deformations of the structure triggers a discrete displacement and forces at the nodes. Since an evaluation only takes place at discrete points, intermediate values must be suitably interpolated. The independent displacement possibilities of a node are called degrees of freedom, i.e., in the three-dimensional calculation, a node has three translational degrees of freedom and three rotational degrees of freedom in x, y, and z directions. The total degree of freedom of an FE model is the sum of all node degrees of freedom and determines the computational complexity.

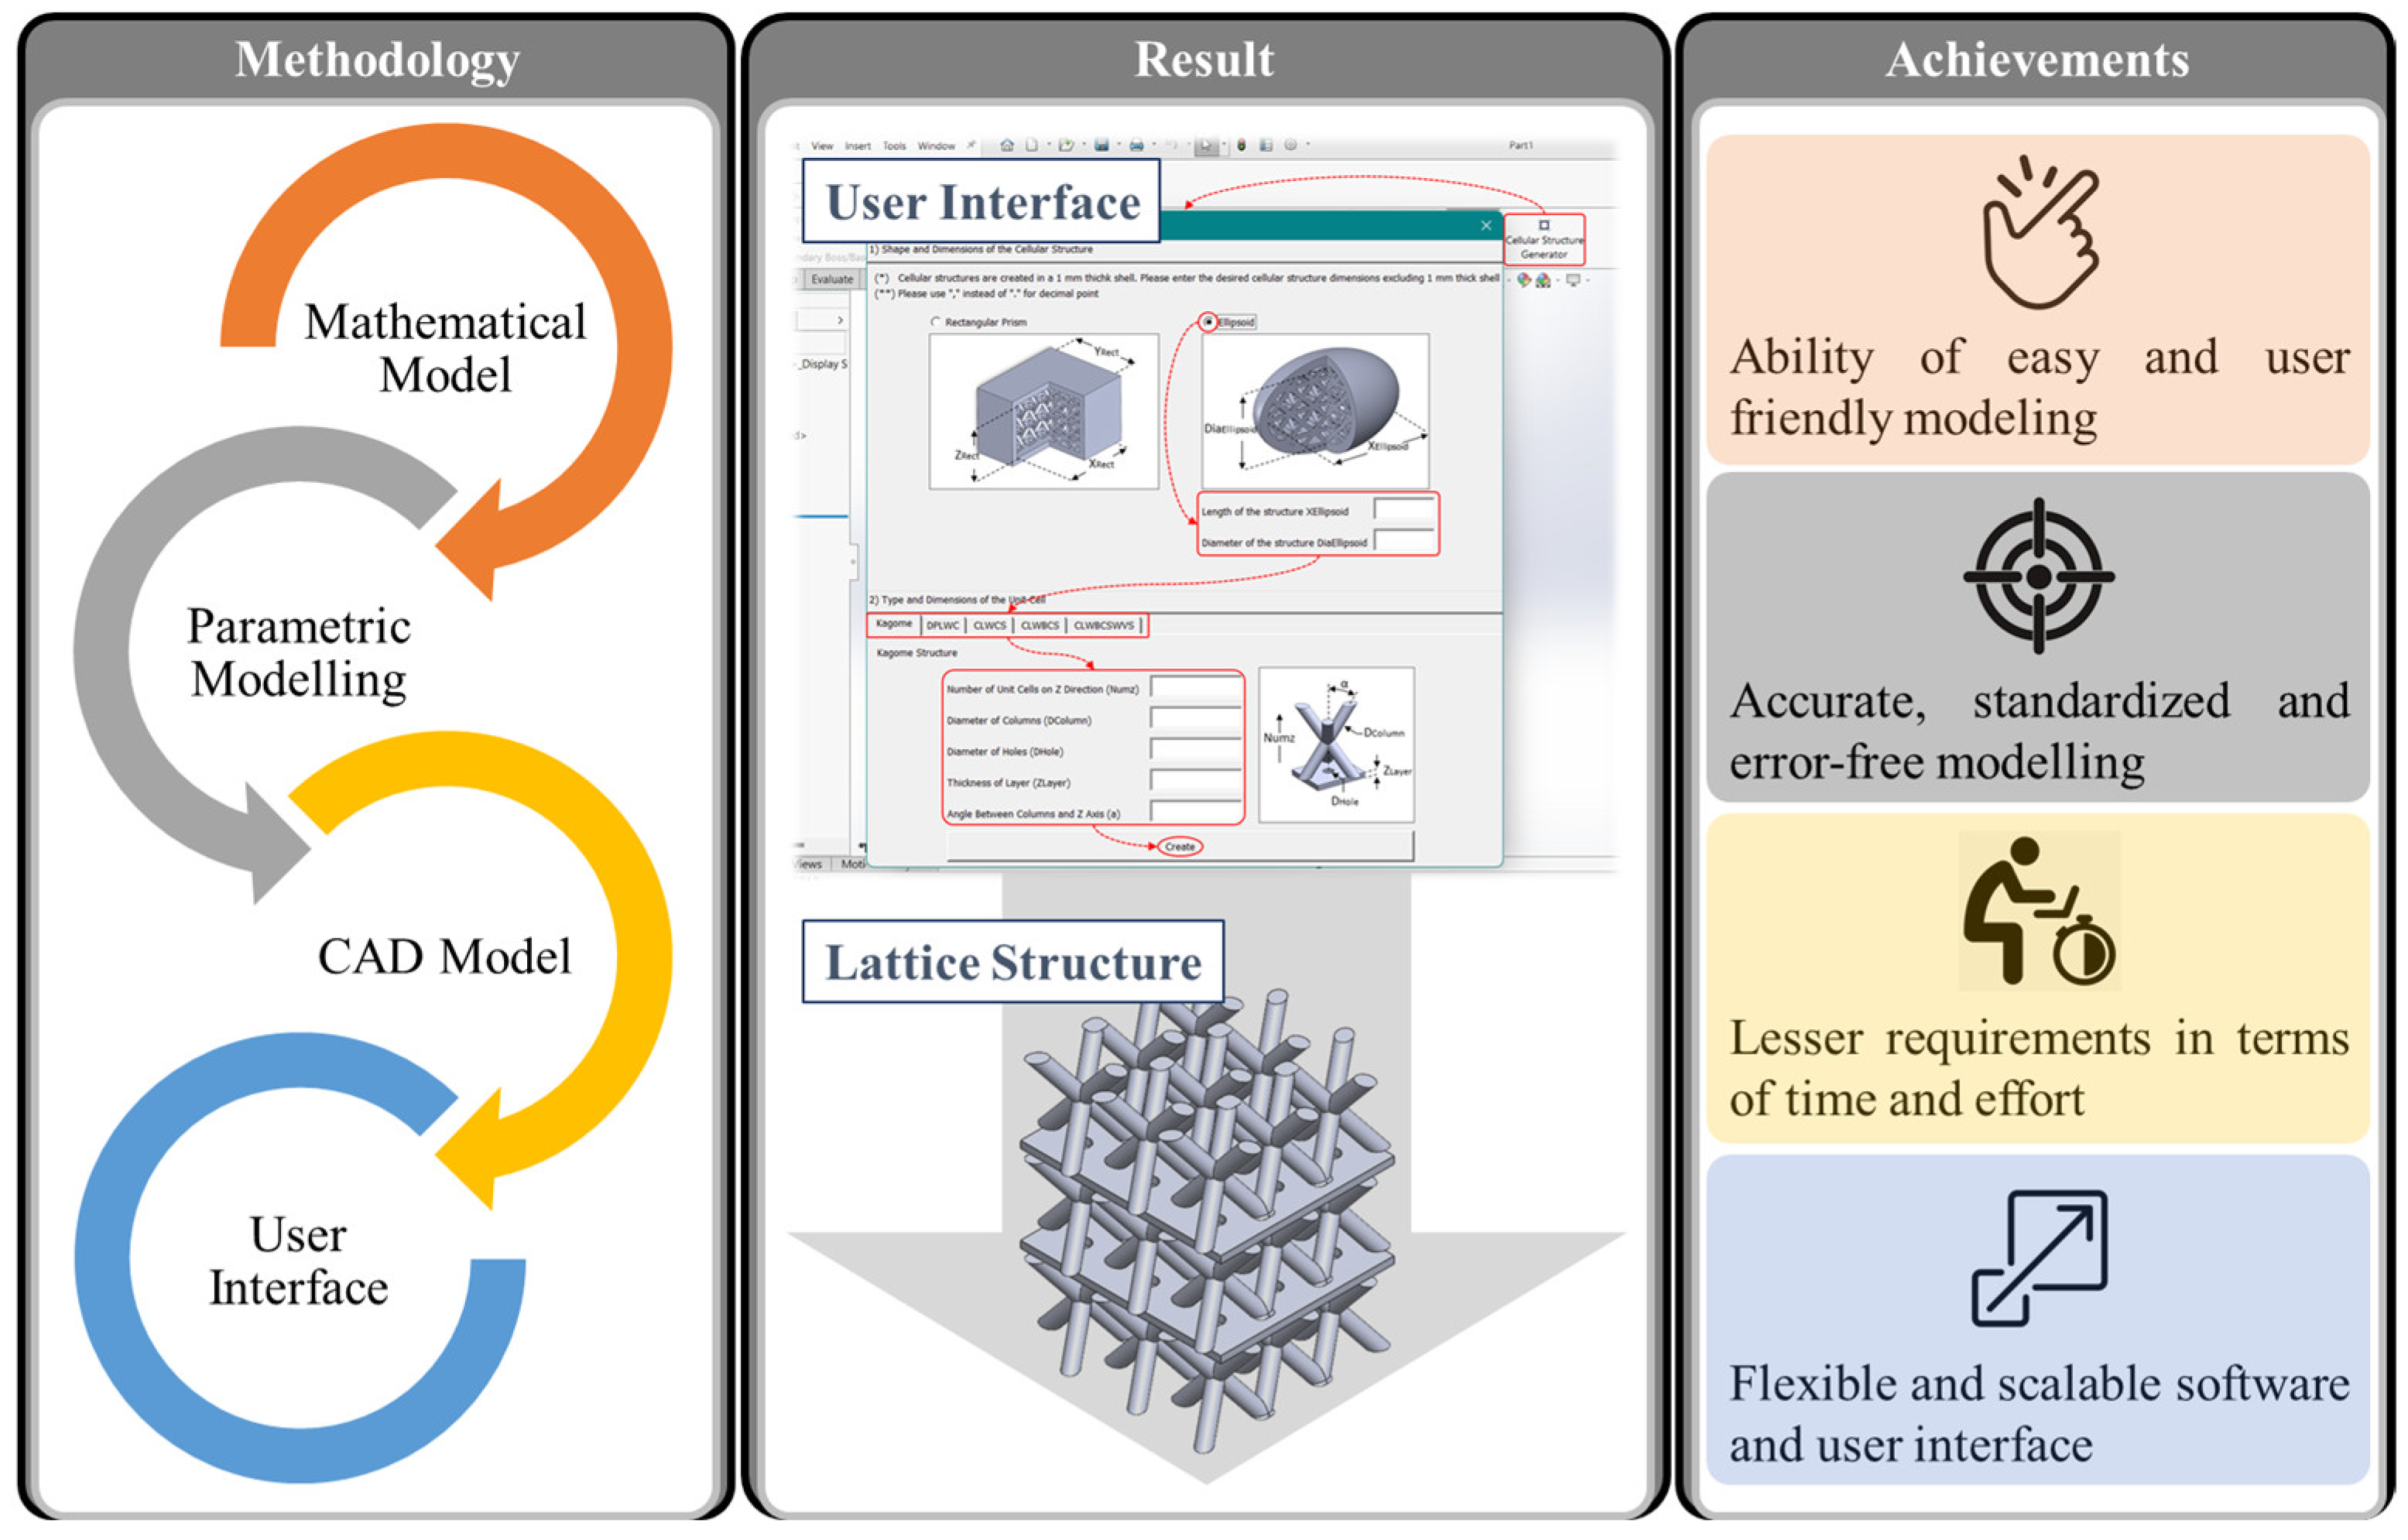
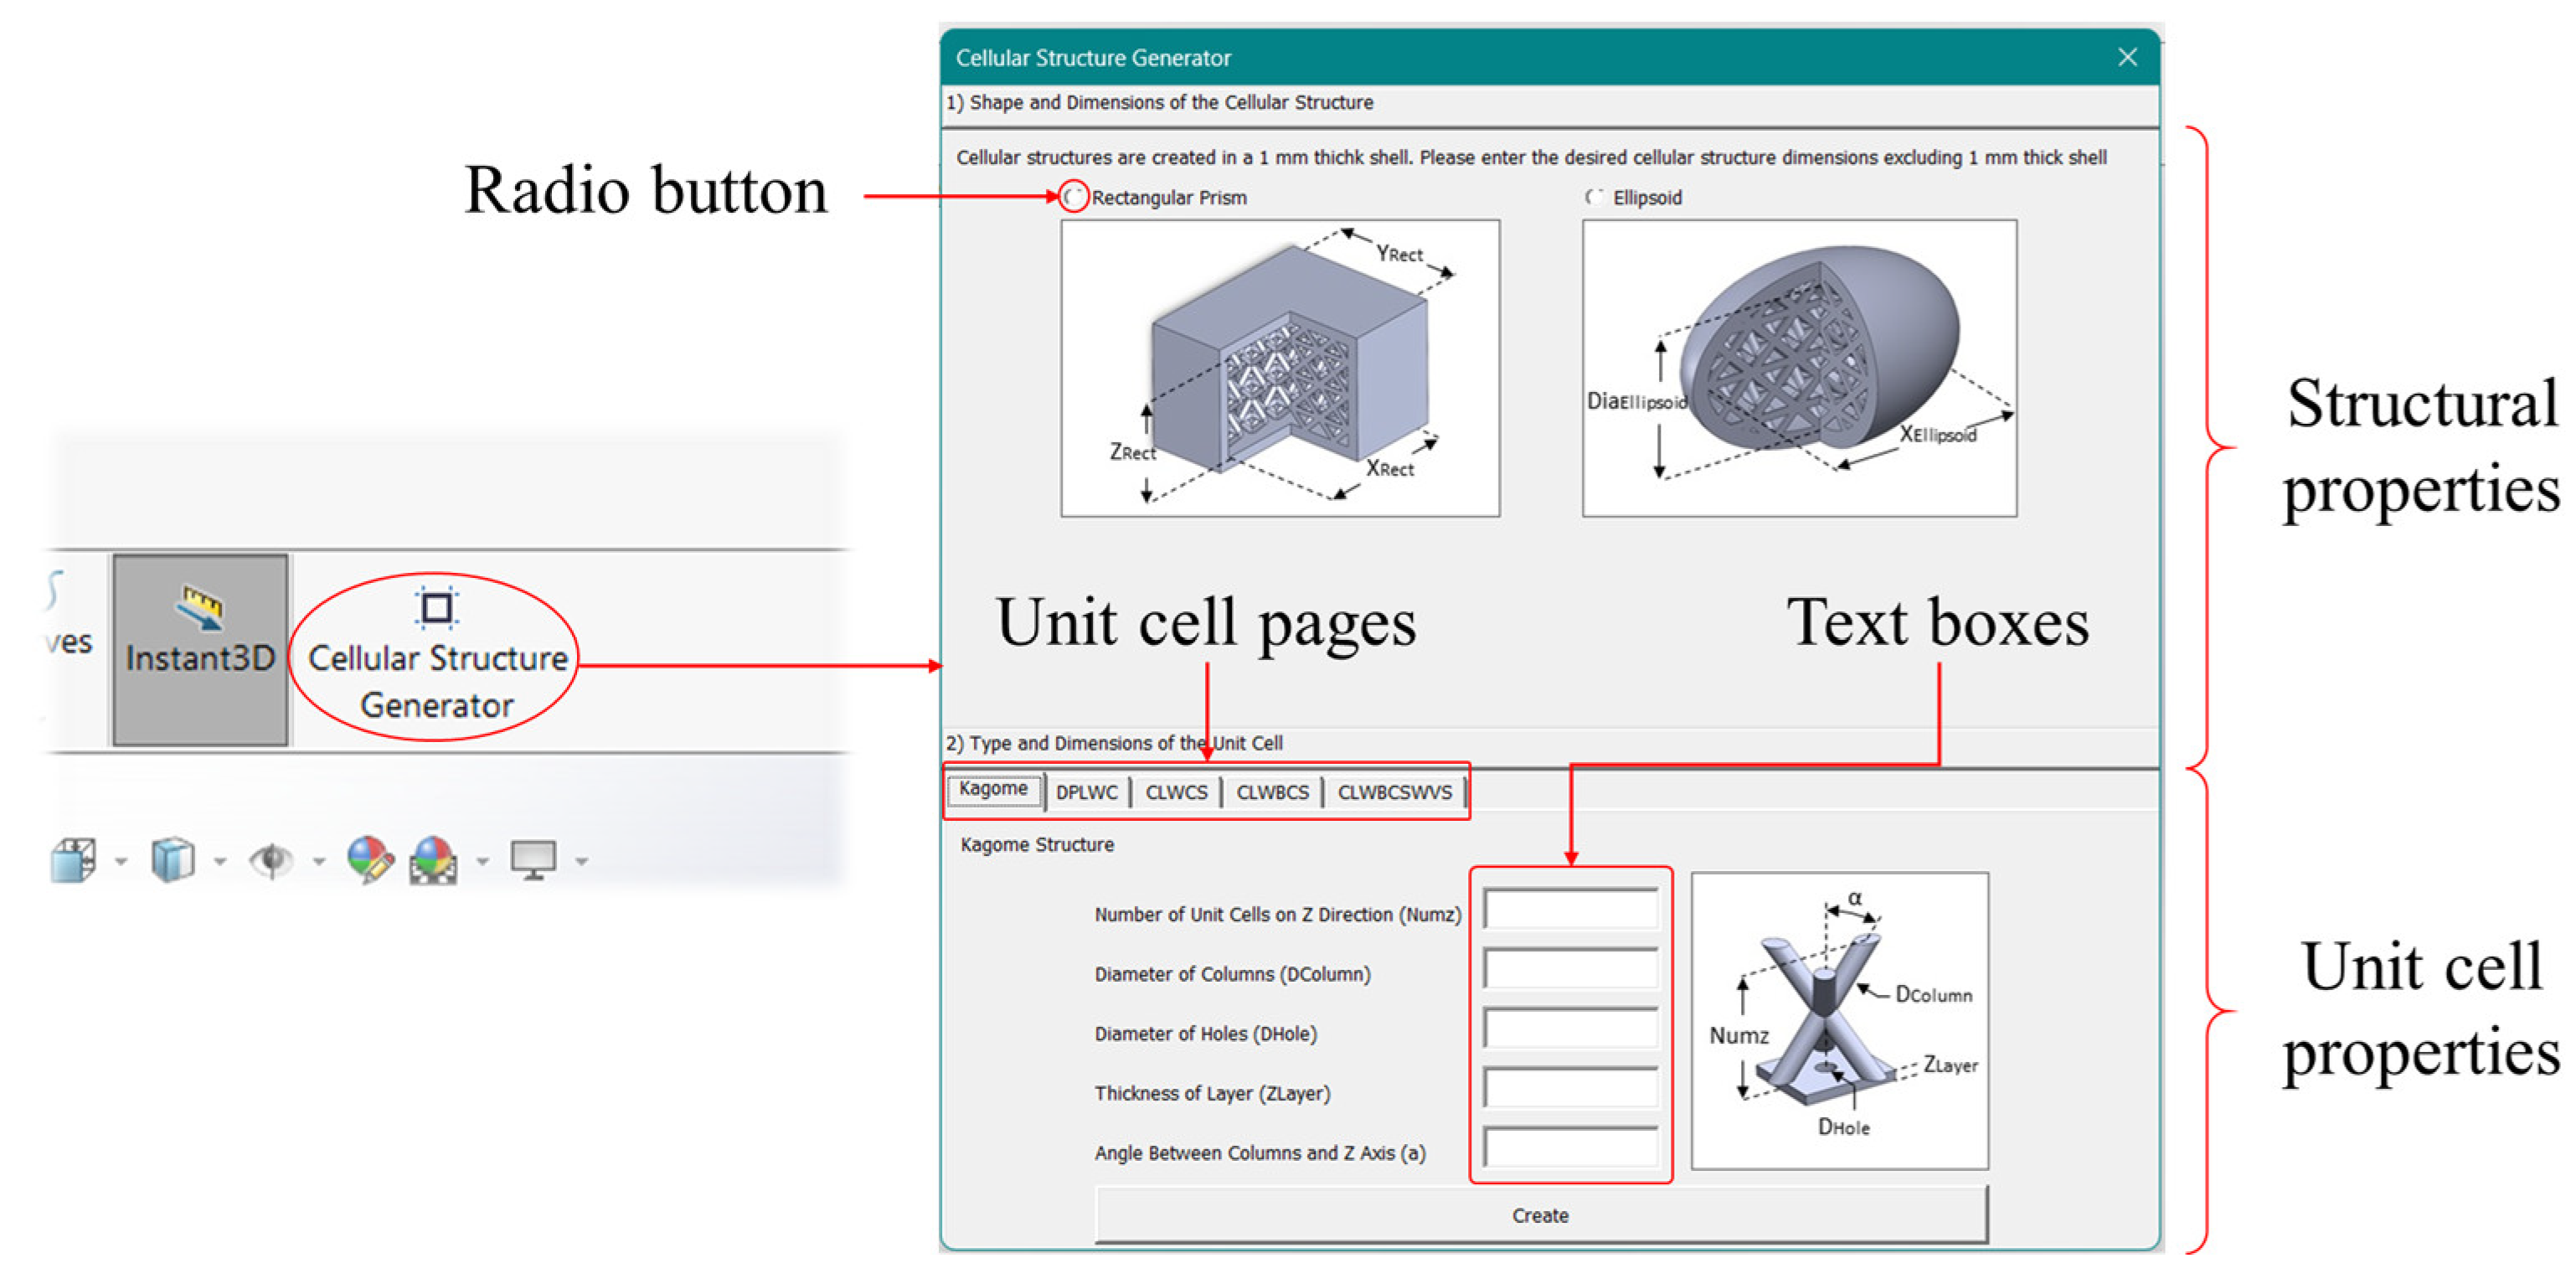
3. Development of a Specific Parametric CAD Software Tool

As previously stated, the process of manually creating lattice structures is notably laborious and time-consuming. Furthermore, it is important to note that designs created during this process are susceptible to inaccuracies in production, which can be attributed to human error. It is evident that, in instances where the lattice structure is produced on a single occasion, the modelling process becomes unfeasible in scenarios where a multitude of designs are utilized during the study. Consequently, there is a necessity for a tool that can address and eliminate these difficulties. The following sections are devoted to an explanation of the fundamentals and the evolution of a particular parametric CAD software tool.

3.1. Methodology

The lattice unit density [37], dimensions [35], and the orientation [63,64] of the constitutive supports determines the behavior of the lattice structure. For example, supports parallel to the applied force increase the stiffness of the component, while structures perpendicular to this force can provide flexibility. The parameters are adjusted and analyzed using each individual model, which requires very large quantities of models. For this reason, a specific parametric CAD software tool is being developed. The CAD Software SolidWorks 2020 and its Application Programming Interface (API), which contains multiple functions that can be called Visual Basic for Applications (VBA), was used. With this method, five different lattice units were modelled (Table 5).
As the first step of the modelling process, the selected lattice units were defined with all their properties and mathematical models were created accordingly. Then, parametric modelling software was created to be compatible with mathematical models. Finally, the user interface was developed to increase ease of use.

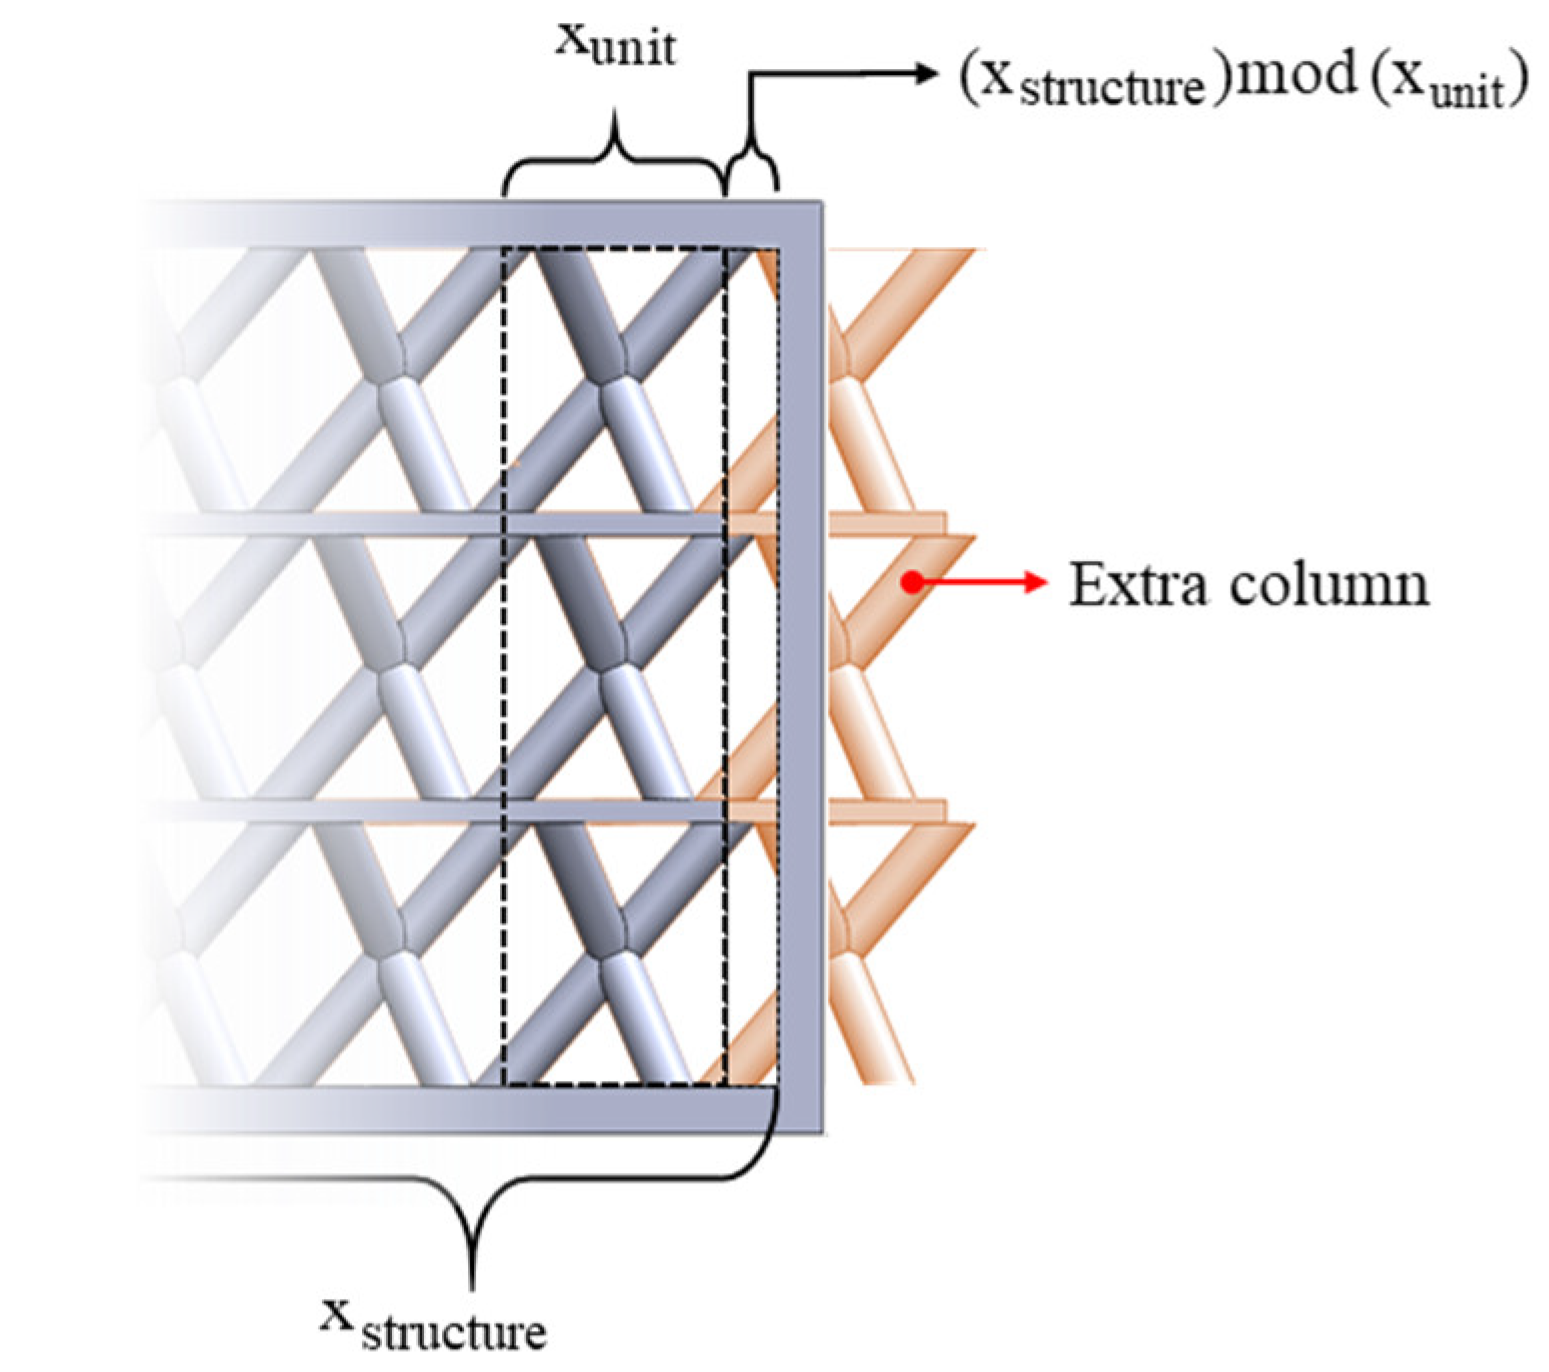
3.2. Mathematical Model of 3D Lattice Structures

The modelling strategy aimed to fill an empty shell volume with a lattice structure. This design space can be selected in the specific parametric CAD software tool as an ellipsoidal or rectangular prism. At the stage of lattice unit multiplication, the lattice structure is allowed to extend beyond the desired volume to avoid surface defects and topological errors. As shown in Table 5, lattice units have different geometric and topological properties. Therefore, the number and orientation of lattice structure must be determined according to the lattice unit and shell parameters (Figure 19).
In developing the mathematical models, rather than developing separate formulae for each lattice unit, an attempt was made to develop general models that could be applied to all lattice unit types. Therefore, similar steps were taken to determine and calculate lattice units and lattice structure parameters.
The aim was to develop general models that can be applied to all lattice units. Therefore, steps were taken to determine and calculate lattice units and lattice structure parameters. Several parameters have been selected as user-defined inputs and are explained in the following sections. The first is the number of lattice units on the z-axis (NumZ). The value of NumZ is used to calculate the length of the lattice unit in the z-axis (zunit) and the number of lattice units in the x- and y-axes (xunit and yunit). The zunit parameter can be calculated using the following equation:
z u n i t = z s t r u c t u r e ( N u m z 1 z l a y e r ) N u m z
where Zstructure is the height of the volume to be filled with lattice units and zlayer is the separation layer thickness of the Kagome unit. The value of zlayer must be set to zero for other lattice unit types. The separation layer is placed as a unifying interlayer under the supports with the diameter of dColumn. This layer is defined by the user, as the zlayer changes the height of the supports in the z-axis at a fixed zunit (Figure 20).
Although the height of the lattice unit on the z-axis has been specified, the dimensions on the x- and y-axes need to be determined. There is a relationship between outer dimensions for each type of lattice unit. However, while determining these dimensions, it was necessary to consider the Kagome lattice unit separately from other lattice units. As shown in Figure 20, the Kagome lattice unit consists of three supports that intersect at the center at an angle of 120° around the axis of rotation. When this model is viewed parallel to the z axis, a hexagonal pattern with 60° angles is observed. Thus, the properties of the equilateral hexagon can be used when establishing the relationship between xunit and yunit. Furthermore, these supports are tilted from the z-axis by an angle α. As another user-defined variable, α was supplied to the relevant equations. As a result, the relationship between the outer dimension of the Kagome lattice unit was defined by considering the previously explained α and zunit values as follows:
x u n i t = z u n i t     tan ( α )
y u n i t = x u n i t     tan ( 60 ° )
On the other hand, the values of zunit, yunit, and xunit are the same for all lattice units except Kagome because the geometric shapes of the lattice units are cubic. Cubic lattice units with similar characteristics do not have a separating layer between the lattice unit layers. Considering these characteristics of cubic lattice units, the outer dimensions were redefined by updating Equations (7) and (8) as follows:
x u n i t = y u n i t = z u n i t
After defining the Kagome structure, the characteristics of the cubic lattice unit types are presented in the following sections. The first cubic lattice unit, CLWCS, consists of supports and a cubic frame. These supports extend from the top corner to the bottom corner in the form of volume diagonals within the cubic frame and are arranged symmetrically around the axis of rotation at 45° (Figure 21).
Similar to the previous lattice unit, the CLWBCS has a cubic frame. However, the lattice unit contains two different types of supports: main and cross supports. Main supports start from the top corners of the cubic frame and intersect in the center of the xy plane. On the other hand, two diagonal supports on the xy plane represent the cross-support (Figure 22).
The structure of CLWBCWVS is almost identical to that of CLWBCS. The only difference between these two structures is the absence of vertical frame elements (Figure 23).
As the last lattice unit type, the DPLWC resembles two pyramids joined from the base. For this lattice unit, instead of a cubic frame, there are two sets of main supports and two cross supports. The main supports are positioned at a 45° angle to the z-axis, while making a rotation of 90° around the axis of rotation. In addition, two transverse (cross) supports are placed on the symmetry plane (Figure 24).

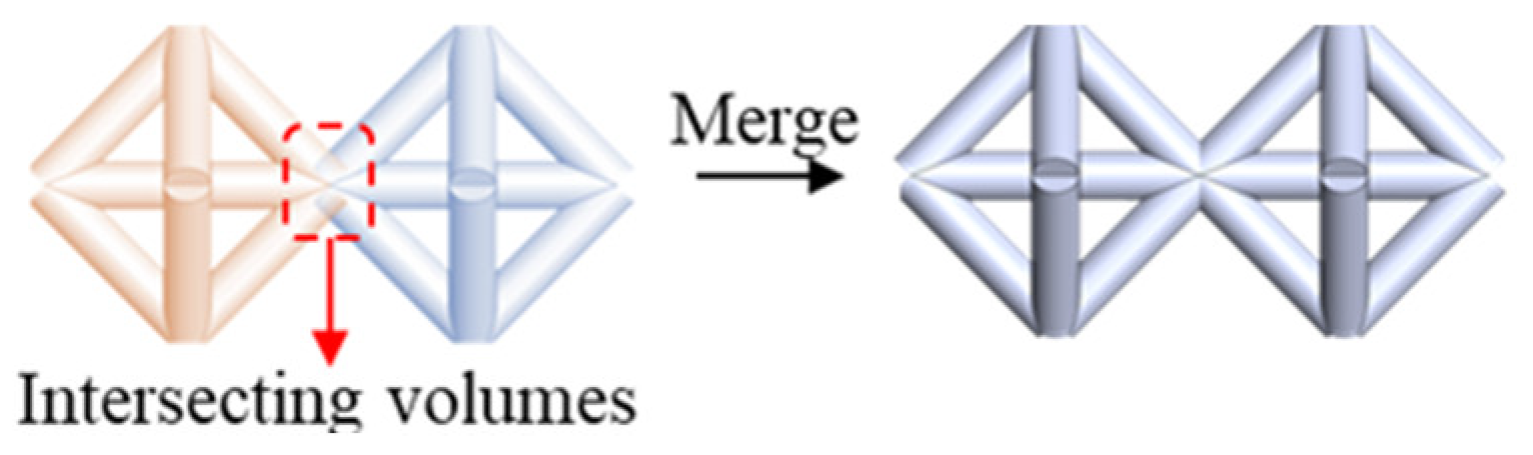
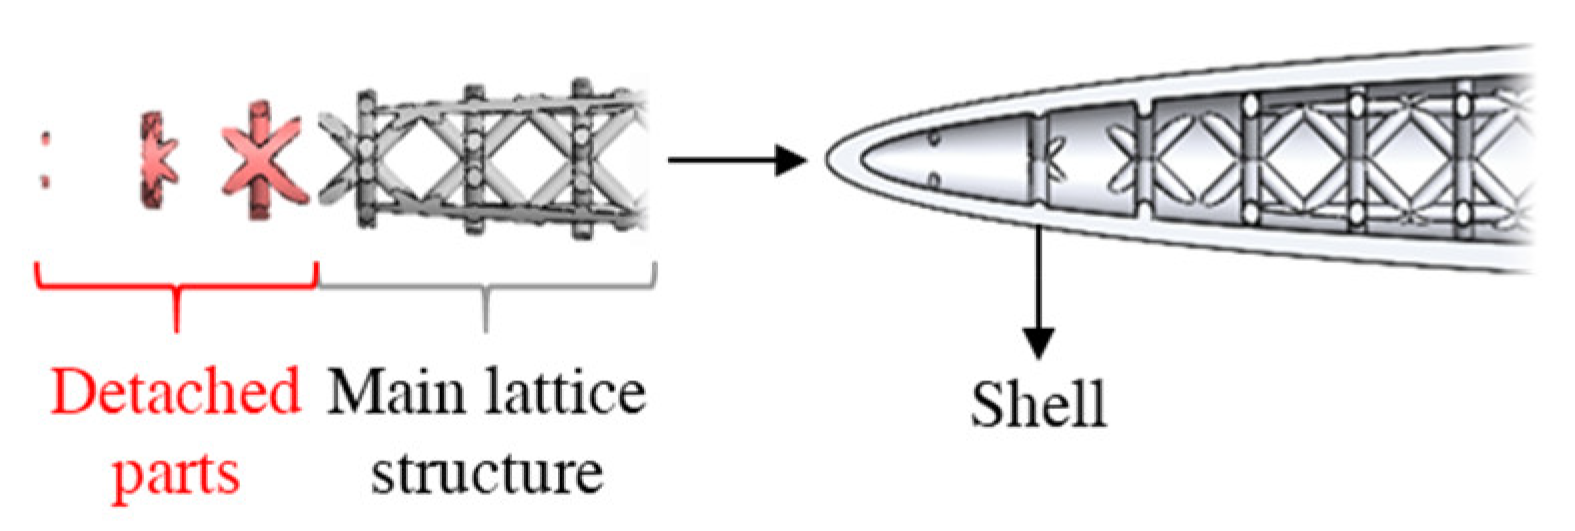
3.3. Lattice Structure Generation

The unique characteristics of each lattice unit were taken into account, and their individual layers and supports were modeled separately. These features were combined to form a complete 3D lattice structure. Since a lattice unit is not capable of any practical use, it must be multiplicated in each direction of the Cartesian coordinate system to construct a versatile lattice structure. Two critical improvements were implemented to ensure accurate and seamless connections between lattice units. The first improvement is the merging of lattice unit boundaries during multiplication. In this step, the volumes of the lattice structures were properly merged to prevent the formation of zero-thickness volumes between lattice units (Figure 25).
The second improvement is to create a thin shell around the lattice unit multiplication. This shell has a crucial function as a unifying cover. There may be parts detached from the main lattice unit after the trimming process. Therefore, a 1 mm thick shell is placed around the lattice unit to prevent the loss of these parts and to ensure that they can be used along with the main body (Figure 26). In addition, this shell provides convenience in both merging and positioning the parts while placing the lattice structure into the part where it will be used.
Using Equations (6)–(9), the values of xunit, yunit, and zunit of all lattice units were calculated. Since the goal is to construct a lattice structure based on the external dimensions of a single lattice unit, the number of units to be replicated along each axis must be determined. While the lattice unit dimensions on the x and y axes are calculated in accordance with the input parameters, the lattice structure dimensions are freely defined by the user. As a result, the calculated lattice unit dimensions and the desired lattice structure size may not always match. Additional lattice structure columns are used to avoid any space between the generated lattice unit array and the lattice structure volume. For this reason, the number of lattice units that can fill the structure volume has been calculated using the modulo operation in mathematics (Figure 27).
The number of lattice units multiplied in the x and y directions is calculated using Equations (10) and (11). After creating a lattice structure with extra features, its unwanted parts are trimmed to obtain a continuous and consistent lattice structure.
N u m x = x m e s h x s t r u c t u r e   m o d   x u n i t x u n i t + 1
N u m y = y s t r u c t u r e y s t r u c t u r e   m o d   y u n i t y u n i t + 1

3.4. Modelling in the Specific Parametric CAD Software Tool

The mathematical equations were used to model the lattice units and their structures within the parametric CAD software tool environment. In this step, user-defined inputs and relationships between all parameters were taken into account to obtain a flexible and scalable model. This model considered not only the different lattice units, but also the lattice structures at different levels. This allows the selected volume to be filled with the preferred lattice unit type and size. However, at this stage, it is necessary to intervene in the software code used for modelling, which can lead to various errors. A user interface has been developed to overcome these problems. This has resulted in the development of an effective and visual parametric modelling method, the details of which are explained in the following sections.

3.5. Computer Aided Parametric Modelling

A technique similar to microservice architecture is used throughout the development of the parametric CAD software tool. This approach used small parts of code to perform specific tasks throughout the modelling operations. These code parts were divided into five groups:
  • lattice unit generation,
  • multiplication,
  • shell generation,
  • trimming, and
  • scaling.
Initially, the software generates a selected lattice unit type using the parameters entered by the user. The Kagome lattice unit requires six user-defined inputs (xstructure, Numz, dColumn, dHole, Zlayer, and α) to define its geometric properties, while three parameters (xstructure, Numz, and dColumn) are sufficient for other cubic lattice units. The subsequent code section replicates the lattice units along the x, y, and z axes. To determine the number of lattice units to be used in the multiplication process, it is necessary to calculate Numx and Numy in addition to the Numz value previously entered by the user. Using values derived from the mathematical equations in Section 3.2 and Section 3.3, the lattice units are arrayed to form the raw lattice structure. To facilitate subsequent operations, the resulting structure (raw lattice structure) is placed at the origin of the cartesian coordinate system. Following the arraying process, the lattice structure may exceed the target dimensions. It is therefore necessary to trim the raw lattice structure into a finer state. However, in order to avoid surface defects and to maintain the integrity of the structure, the structure is enveloped by a shell according to the selected structure volume type: rectangular prism or ellipsoid. User-defined values are used to create the shell. The trimming process removes unnecessary parts to achieve the desired structure type. However, after the trimming process, the lattice structure has the correct shape but the wrong size. This problem is caused by an incompatibility between the units of two development environments. A unit of a value entered as millimeters via the API is converted to meters in SolidWorks. The result is a solid model that is much larger than the desired size. This problem is overcome by scaling to 1/1000 as a final operation. As a result, a consistent and flexible code structure was created by combining discrete blocks of code that perform specific operations. Figure 28 shows the flowchart of the software developed. This flowchart was created by considering the BPMN model, where:
  • Start Event (Vibration 08 00029 i007) indicates the start of the process;
  • The exclusive gateway (Vibration 08 00029 i008) directs sequence flows to only one of the outgoing branches. When merging flows, the exclusive gateway waits for an incoming branch to complete before continuing the flow;
  • The parallel gateway (Vibration 08 00029 i009) directs the process path down multiple outbound sequence flows to be followed in parallel. When merging flows, the parallel gateway acts as a synchronization mechanism, waiting for all branches to complete before continuing the flow; and
  • End event (Vibration 08 00029 i010) indicates where a path will end.
Figure 28. Flowchart of the parametric CAD software tool functions.
Vibration 08 00029 g028

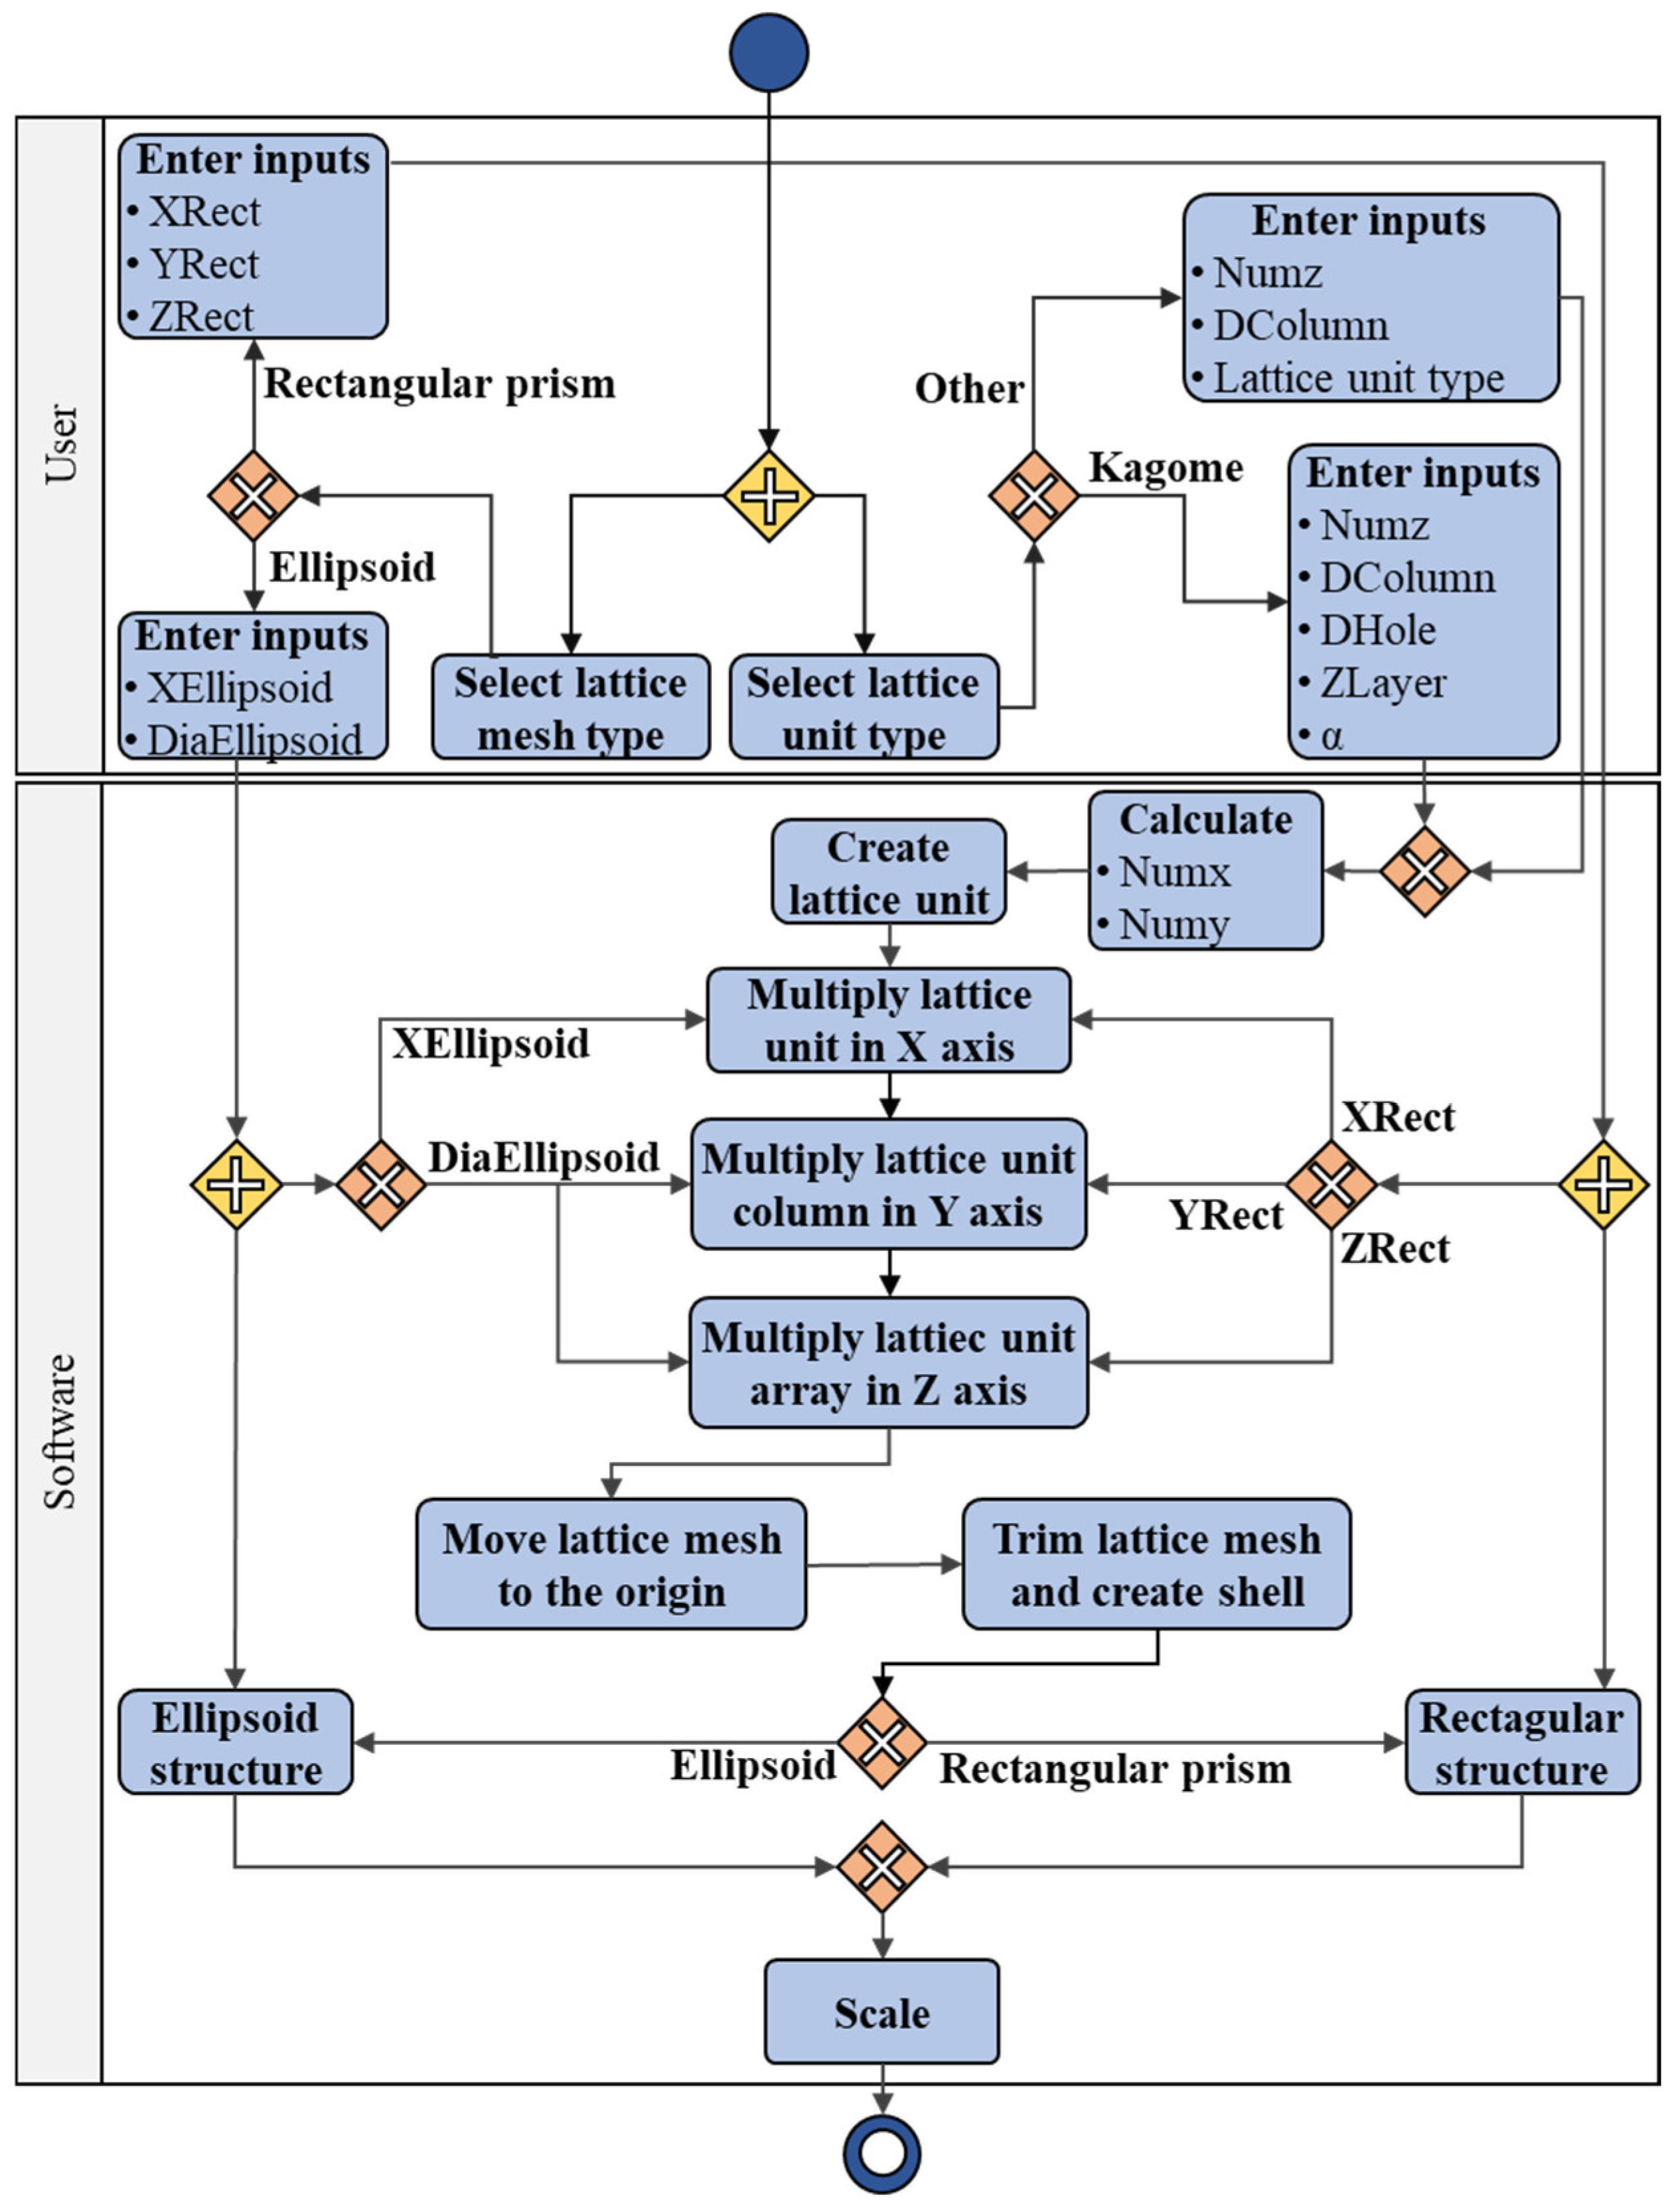
3.6. The User Interface

While the parametric and automatic modelling capability for the desired lattice structures was achieved, a user-friendly interface was needed to facilitate the developed parametric CAD software tool for the user. A user interface was developed with the principle of minimum user interaction, and a button was placed on the SolidWorks toolbar for easy access to the user interface (Figure 29).
The interface consists of two main sections. To make the necessary selections and complete the data input, the required buttons and text boxes have been embedded in the relevant sections of the interface. In the upper section, where the structural properties can be defined, there are two shell type options, specified as rectangular prism and ellipsoid. For guidance, the user is initially presented with two options for selecting the shell structure using radio buttons placed above the relevant visual. Once the selection has been made by clicking on the radio buttons, the input parameters of the relevant shell type volume become visible and allow data to be entered (Figure 30).
As mentioned earlier, the lattice structure is placed inside a 1 mm thick shell to avoid topological and geometric errors. The shell type and its parameters, defined by the user, determine the volume type and dimensions to be filled by the lattice units. The shell thickness is excluded from these defined dimensions. Once the shell type has been defined, the lattice unit parameters can be defined using the second section of the interface. This section allows the user to select the desired lattice unit type using predefined lattice unit pages. A tab has been prepared for each lattice unit type and its data input components have been placed in the appropriate tabs. When a lattice unit tab is selected, the user inputs the required parameters in the designated text boxes and clicks the “Create” button to automatically generate the final lattice structure. The appropriate text boxes have been constructed separately for each lattice unit type in the relevant tabs (Figure 31).

4. Discussion

This study, which sought to passively suppress the chatter, was conducted in two significant stages. In the initial stage, the hammer impact test was conducted using the original boring bar to ensure the reliability of the simulation. A comparison of the obtained results with the simulations revealed an approximate 8% variation in amplitude. This negligible discrepancy led to the conclusion that the simulation model exhibited adequate precision. Consequently, the simulation model, employed as the fundamental framework for this study, has been validated. To utilize the lattice structure for the purpose of enhancing the dynamic performance of the boring bar, it is first necessary to create a hollow geometry within the boring bar. The behavior and strength of the boring bar against both dynamic and static loads are affected by this space. This is due to the fact that the change in the internal cross-section and its length also changes the surface moments of inertia. Consequently, this results in a decrease in static stiffness and an increase in natural frequency. It is therefore essential to first ascertain the geometries and subsequently define the dimensional limits of these geometries. In this study, cylinder and ellipsoid shapes were utilized as the two hollow geometries of choice, a decision that was made due to the high strength they provide. These geometries, which are radially symmetrical about the boring bar axis, can be defined with two parameters: width and diameter. Consequently, a total of 12 designs were created for each geometry by utilizing 4 distinct diameter values (12, 15, 18, and 20 mm) and 3 different length values (70, 100, and 130 mm). Subsequently, an examination was conducted of the predicted bending stresses that would occur in the designs. It was determined that the design dimensions with a diameter of 18 mm and a length of 130 mm, which offer the most volume among the acceptable designs (has a maximum bending stress below the allowable maximum = 183.3 MPa), were to be selected. An investigation was conducted to examine the damping and frequency values of the ellipsoid and cylindrical hollow geometries created using specific dimensions. The results demonstrated significant differences in both damping and frequency values. The frequency value of the first mode, which was approximately 410 Hz for the original boring bar, increased to over 430 Hz with the incorporation of the cylindrical hollow. In the case of the ellipsoid hollow, this value reached around 450 Hz, representing an approximate 10% increase. A very different result was obtained for the amplitude values. When the cylindrical hollow was placed inside the boring bar, the vibration amplitude increased from approximately 10.4 µm/N to 16.7 µm/N. However, the results were slightly improved by the use of the ellipsoid hollow as opposed to the cylindrical hollow, with the ellipsoid hollow performing approximately 14% better than the cylindrical hollow and reducing the amplitude value to 14.3 mµ/N. Although the results seem to have deteriorated, this is quite expected. A hollow created at the free end of the boring bar causes the mass, and therefore the inertia, to decrease. This increase in natural frequency is accompanied by a decrease in the damping ability and the strength of the boring bar due to the removal of material, resulting in an increase in amplitude value. However, this situation can be enhanced by incorporating a lattice structure within the hollow. The ellipsoid hollow, selected due to its superior dynamic performance, was filled with a cube lattice that featured side cross supports. The lattice unit height and column diameter were selected as 5.94 mm and 1 mm, respectively. The collective structure of the lattice units provided significant dynamic stiffness to the boring bar by affecting its mass and, consequently, its natural frequency to a minimum extent. The result was an amplitude value of 4.62 µm/N, representing a 55.58% improvement in amplitude value compared to the original boring bar. The findings of this study led to the modelling of five additional lattice structures, with the ellipsoidal hollow being filled. Of the total six lattice structures, model 3, with a 1.25 mm beam diameter, exhibited the most optimal results, with a 69.81% reduction in vibrations compared to the original boring bar. This outcome demonstrates that the configuration of the columns and supports that form the lattice units exerts a significant influence on the dynamic performance. The proposed approach provides a flexible, scalable foundation for future research, including experimental validations and optimization studies on lattice-integrated tool holders. The integration of novel hollow geometries and lattice types expands the applications of lattice structures beyond conventional uses, such as in boring bars, to encompass various tool holders (Figure 32) and diverse components in different domains.
In the second stage of the study, a modelling tool was utilized throughout the research process, rather than being a result that emerged at the conclusion of the study. In the creation phase of the tool, lattice units with all their parameters were initially considered, and mathematical models were subsequently created. Utilizing the mathematical models, a macro was coded over the SolidWorks API to perform the modelling process. The objective was to minimize the number of steps required to create the desired model. Various precautions were taken to prevent topology errors, and the modelling process was performed automatically without any issues. Although the modelling process was automated at this stage, an interface was required where parameters could be selected for long-term use. The final part of the modelling tool was the design of the user interface. The tool’s benefits extend beyond the creation of the desired lattice structure. The integration of automatic modelling techniques offers significant advantages in design processes, particularly in reducing the time spent on manual modelling. The minimization of modelling steps has been demonstrated to result in expedited outcomes, thereby enhancing the efficiency of the overall modelling process. This automation also helps to prevent user errors that often arise during repetitive manual tasks, ensuring the production of standardized models. Furthermore, the measures implemented within the system address critical issues such as zero-thickness volumes, insufficient lattice units, and topology errors, which can otherwise complicate the design process. A significant advantage of the developed interface is that it functions as a protective barrier between the user and the source code, thereby preventing unintended errors. Furthermore, the system enables users to select parameters with ease, thereby ensuring the creation of lattice structures that are fully compliant with hollow geometry requirements. Finally, the integration of various hollow geometries and lattice unit types into the parametric modelling tool enhances flexibility and enables the design of more complex, customized structures. It is evident that these advancements have a significant impact on the modelling process, enhancing its efficiency and precision. Furthermore, they empower the user with enhanced control, contributing to an optimized experience.

5. Conclusions

While this study primarily focuses on the development and validation of a simulation framework and modelling tool, it is intended to serve as a basis for future fundamental investigations into the optimization of lattice structures for vibration suppression in machining applications. To this end, a new methodology for integrating lattice structures into boring bars for passive chatter suppression was proposed, simulated, and evaluated. The key outcomes of the research can be summarized as follows:
  • A validated FEM-based simulation model was developed, accurately predicting the dynamic behavior of the boring bar.
  • In comparison with the cylindrical hollow, the optimal design was determined as ellipsoidal hollow shape by considering natural frequency and decrease in vibration amplitude.
  • Six different lattice structures were designed, modelled, and analyzed, with the best-performing design achieving up to a 69.81% reduction in vibration amplitude.
  • A dedicated parametric CAD simulation tool was developed to enable rapid and error-free generation of complex lattice structures.

Author Contributions

E.O.: Project administration, Supervision, Conceptualization, Methodology, Software, Validation, Visualization, Writing—original draft, Writing—review and editing. K.A.: Resources, Data Curation, Writing—Review and Editing. A.Ç.: Investigation, Resources, Writing—Review and Editing. H.A.Ç.: Methodology, Software, Writing—Review and Editing. All authors have read and agreed to the published version of the manuscript.

Funding

This work was supported by grants from the Scientific and Technological Research Council of Turkey (TUBITAK) and the Support Program for Scientific and Technological Research Projects-2232 [grant number 121C068].

Data Availability Statement

The original contributions presented in this study are included in the article. Further inquiries can be directed to the corresponding authors.

Conflicts of Interest

The authors declare no conflicts of interest.

Nomenclature

Abbreviations
2DTwo DimensionalFEFinite Element
3DThree DimensionalFEMFinite Element Method
AMAdditive Manufacturing GUIGraphical User Interface
APIApplication Programming InterfaceHRAHarmonic Response Analysis
BPMNBusiness Process Model and NotationISOInternational Organization for Standardization
CCarbonMnManganese
CADComputer Aided DesignNURBSNon-uniform Rational Basis Spline
CLWBCSCube Lattice with Bottom Centre SupportsPPhosphorus
CLWBCWVSCube Lattice with Bottom Centre Without Vertical SupportsSSulphide
CLWCSCube Lattice with Centre SupportsSiSilicon
CNCComputer Numeric ControlTPMSTriply Periodic Minimal Surfaces
CrChromiumVVanadium
DAQData acquisitionVBAVisual Basic for Applications
DPLWCDouble Pyramid Lattice with Cross
Latin Letters
ACross sectional areaNumyNumber of lattice units in the y-axis direction
apDepth of cut (mm)NumzNumber of lattice units in the z-axis direction
CDamping matrixVcCutting speed (m/min)
dDiameter (mm)xstructureLength of the lattice structure in x-axis direction (mm)
dcolumnDiameter of the columns (mm)xunitLength of the lattice unit in x-axis direction (mm)
dholeDiameter of the holes (mm)y0Vibration amplitude (µm/N)
EModulus of elasticityystructureLength of the lattice structure in y-axis direction (mm)
ejSinusoidal motionyunitLength of the lattice unit in y-axis direction (mm)
FForce (N)zlayerThickness of the separation layer between the lattice rows (mm)
fFeed (mm/rev)zstructureLength of the lattice structure in z-axis direction (mm)
KStiffness matrixzunitLength of the lattice unit in z-axis direction (mm)
LLength (mm)TVibration frequency (Hz)
L/dSlenderness ratiotTime (s)
NumxNumber of lattice units in the x-axis direction
Greek Letters
αAngle between a support and vertical axis for kagome lattice (°)σbBending stress (MPa)
θPhase shiftψForce shift
ρDensity (kg/m3)ΩExcitation frequency
σStress (MPa)

References

  1. Yadav, A.; Talaviya, D.; Bansal, A.; Law, M. Design of chatter-resistant damped boring bars using a receptance coupling approach. J. Manuf. Mater. Process. 2020, 4, 53. [Google Scholar] [CrossRef]
  2. Altintas, Y. Manufacturing Automation, 2nd ed.; Cambridge University Press: Cambridge, UK, 2012. [Google Scholar]
  3. Beri, B.; Meszaros, G.; Stepan, G. Machining of slender workpieces subjected to time-periodic axial force: Stability and chatter suppression. J. Sound Vib. 2021, 504, 116114. [Google Scholar] [CrossRef]
  4. Baklouti, W.; Mrad, C.; Nasri, R. Numerical study of the chatter phenomenon in orthogonal turning. Int. J. Adv. Manuf. Technol. 2018, 99, 755–764. [Google Scholar] [CrossRef]
  5. Yıldırım, G. Milli savaş uçağı KAAN, ASELSAN ile “BİLGE KAAN” olacak. 2024. Available online: https://www.aa.com.tr/tr/savunma-sanayisi/milli-savas-ucagi-kaan-aselsan-ile-bilge-kaan-olacak/3145409 (accessed on 28 April 2025).
  6. TEI-TF10000 Turbofan Motoru n.d. Available online: https://www.tei.com.tr/urunler/tei-tf10000-turbofan-motoru (accessed on 28 April 2025).
  7. Kubilay. TEI-TF6000 Turbofan Uçak Motoru. 2023. Available online: https://www.yerlivemilliteknoloji.com/tei-tf6000-turbofan-ucak-motoru/ (accessed on 28 April 2025).
  8. Şahin, G.; Aslanoğlu, V. Karadeniz’de yeni sondajlar yeni keşifler yolda. 2020. Available online: https://www.star.com.tr/acik-gorus/karadenizde-yeni-sondajlar-yeni-kesifler-yolda-haber-1568927/ (accessed on 28 April 2025).
  9. Türkiye’nin ilk yerli rüzgar gülü Bursa’daki RES’te. 2017. Available online: https://www.hurriyet.com.tr/ekonomi/turkiyenin-ilk-yerli-ruzgar-gulu-bursadaki-reste-40548746 (accessed on 28 April 2025).
  10. Medical Implants n.d. Available online: https://www.hiperbaric.com/en/hip-technology/hip-sectors/medical-implants/ (accessed on 28 April 2025).
  11. Diagnosis of Chatter Marks n.d. Available online: https://www.planlauf.com/en/measurement/diagnosis-of-chatter-marks/ (accessed on 28 April 2025).
  12. Keep a Close Eye on Piston Scuffing to Prevent Scoring and Seizing n.d. Available online: https://gesrepair.com/keep-a-close-eye-on-piston-scuffing-to-prevent-scoring-and-seizing/ (accessed on 28 April 2025).
  13. Parus, A.; Pajor, M.; Hoffmann, M. Suppression of self-excited vibration in cutting process using piezoelectric and electromagnetic actuators. Adv. Manuf. Sci. Technol. 2009, 33, 35–50. [Google Scholar]
  14. Quintana, G.; Ciurana, J. Chatter in machining processes: A review. Int. J. Mach. Tools Manuf. 2011, 51, 363–376. [Google Scholar] [CrossRef]
  15. Sun, Y.; Zheng, M.; Jiang, S.; Zhan, D.; Wang, R. A State-of-the-Art Review on Chatter Stability in Machining Thin−Walled Parts. Machines 2023, 11, 359. [Google Scholar] [CrossRef]
  16. Mehrabadi, I.M.; Nouri, M.; Madoliat, R. Investigating chatter vibration in deep drilling, including process damping and the gyroscopic effect. Int. J. Mach. Tools Manuf. 2009, 49, 939–946. [Google Scholar] [CrossRef]
  17. Muhammad, B.B.; Wan, M.; Feng, J.; Zhang, W.H. Dynamic damping of machining vibration: A review. Int. J. Adv. Manuf. Technol. 2017, 89, 2935–2952. [Google Scholar] [CrossRef]
  18. Munoa, J.; Beudaert, X.; Dombovari, Z.; Altintas, Y.; Budak, E.; Brecher, C.; Stepan, G. Chatter suppression techniques in metal cutting. CIRP Ann. 2016, 65, 785–808. [Google Scholar] [CrossRef]
  19. Khatake, P.; Nitnaware, P.T. Vibration mitigation using passive damper in machining. Int. J. Mod. 2013, 3, 3649–3652. [Google Scholar]
  20. Thomas, W.; Fulop, Z.; Szilágyi, A. Passive Damping Techniques for Vibration Suppression in Boring Operation with Long Overhangs. In Vehicle and Automotive Engineering 3; Jármai, K., Voith, K., Eds.; Springer: Singapore, 2021; Volume 22, pp. 256–264. [Google Scholar] [CrossRef]
  21. Vogel, F.A.M.; Berger, S.; Özkaya, E.; Biermann, D. Vibration suppression in turning TiAl6V4 using additively manufactured tool holders with specially structured, particle filled hollow elements. Procedia Manuf. 2019, 40, 32–37. [Google Scholar] [CrossRef]
  22. Aggogeri, F.; Borboni, A.; Merlo, A.; Pellegrini, N.; Ricatto, R. Vibration damping analysis of lightweight structures in machine tools. Materials 2017, 10, 297. [Google Scholar] [CrossRef] [PubMed]
  23. Szuba, P.; Zou, Q.; Barber, G.C.; Yang, L. Optimization of hollow cantilevered boring bar stiffness. Mach. Sci. Technol. 2005, 9, 325–343. [Google Scholar] [CrossRef]
  24. Nguyen, D.S. Design of lattice structure for additive manufacturing in CAD environment. J. Adv. Mech. Des. Syst. Manuf. 2019, 13, 19-00175. [Google Scholar] [CrossRef]
  25. Thalhamer, A.; Fleisch, M.; Schuecker, C.; Fuchs, P.F.; Schlögl, S.; Berer, M. A black-box optimization strategy for customizable global elastic deformation behavior of unit cell-based tri-anti-chiral metamaterials. Adv. Eng. Softw. 2023, 186, 103553. [Google Scholar] [CrossRef]
  26. Chen, K.; Fang, S.; Gao, Q.; Zou, D.; Cao, J.; Liao, W.H. An enhanced nonlinear piezoelectric energy harvester with multiple rotating square unit cells. Mech. Syst. Signal Process. 2022, 173, 109065. [Google Scholar] [CrossRef]
  27. Chen, X.; Ren, W.; Sun, Y.; Zhang, J.; Yang, J.; Wang, K.; Gong, Y.; Zhang, Z.; Bai, L. Adjusting unit cell three-dimensional posture and mirror array: A novel lattice structure design approach. Mater. Des. 2022, 221, 110852. [Google Scholar] [CrossRef]
  28. Fongsamootr, T.; Suttakul, P.; Tippayawong, N.; Nanakorn, P.; Cappellini, C. Bending behavior of 2D periodic plates with different unit cells: Numerical and experimental investigations. Mater. Today Commun. 2022, 31, 103774. [Google Scholar] [CrossRef]
  29. Préve, D.; Lenarda, P.; Maskery, I.; Paggi, M. A comprehensive characterization of fracture in unit cell open foams generated from Triply Periodic Minimal Surfaces. Eng. Fract. Mech. 2023, 277, 108949. [Google Scholar] [CrossRef]
  30. Sauermoser-Yri, M.; Veldurthi, N.; Wölfle, C.H.; Svartvatn, P.J.; Flo Hoem, S.O.; Lid, M.J.; Bock, R.; Palko, J.W.; Torgersen, J. On the porosity-dependent permeability and conductivity of triply periodic minimal surface based porous media. J. Mater. Res. Technol. 2023, 27, 585–599. [Google Scholar] [CrossRef]
  31. Wang, S.; Zhang, L.; Tang, M.; Cai, C.; Wu, J.; Zhang, Z.; Shi, Y. Field-driven design and performance evaluation of dual functionally graded triply periodic minimal surface structures for additive manufacturing. Mater. Des. 2023, 233, 112257. [Google Scholar] [CrossRef]
  32. Yan, K.; Wang, J.; Li, L.; Deng, H. Numerical investigation into thermo-hydraulic characteristics and mixing performance of triply periodic minimal surface-structured heat exchangers. Appl. Therm. Eng. 2023, 230, 120748. [Google Scholar] [CrossRef]
  33. Kaur, I.; Singh, P. Flow and Thermal Transport Through Unit Cell Topologies of Cubic and Octahedron Families. Int. J. Heat Mass Transf. 2020, 158, 119784. [Google Scholar] [CrossRef]
  34. Dharmaraj, M.; Kumar, K.V.S.; Sridhar, C. Crashworthiness unit cell design investigation for energy absorption analysis. Mater. Today Proc. 2021, 50, 1282–1290. [Google Scholar] [CrossRef]
  35. Zhang, Z.J.; Butscher, A.; Watts, S.; Tortorelli, D.A. Anisotropic yield models for lattice unit cell structures exploiting orthotropic symmetry. Comput. Methods Appl. Mech. Eng. 2022, 394, 114935. [Google Scholar] [CrossRef]
  36. Cui, J.; Zhang, L.; Gain, A.K. A novel auxetic unit cell for 3D metamaterials of designated negative Poisson’s ratio. Int. J. Mech. Sci. 2023, 260, 108614. [Google Scholar] [CrossRef]
  37. Deshmukh, S.; Kumar, S.; Wagh, A.; Krishnan, S.; Ramamoorthy, S. Selection of periodic cellular structures for multifunctional applications directly based on their unit cell geometry. Int. J. Mech. Sci. 2022, 220, 107133. [Google Scholar] [CrossRef]
  38. Corbett, T.M.; Thole, K.A. Large eddy simulations of kagome and body centered cubic lattice cells. Int. J. Heat Mass Transf. 2024, 218, 124808. [Google Scholar] [CrossRef]
  39. An, X.; Sun, G.; Yuan, X.; Tian, Y.; Hou, X.; Fan, H. Design of Kagome lattice composite sandwich metastructures with high load bearing and low frequency vibration reduction properties. Compos. Part A Appl. Sci. Manuf. 2023, 174, 107716. [Google Scholar] [CrossRef]
  40. Xu, W.; Yu, A.; Lu, X.; Tamaddon, M.; Wang, M.; Zhang, J.; Zhang, J.; Qu, X.; Liu, C.; Su, B. Design and performance evaluation of additively manufactured composite lattice structures of commercially pure Ti (CP–Ti). Bioact. Mater. 2021, 6, 1215–1222. [Google Scholar] [CrossRef]
  41. Yao, J.; Su, Y.; Scarpa, F.; Li, Y. An optimization approach to design deformation patterns in perforated mechanical metamaterials using distributions of Poisson’s ratio-based unit cells. Compos. Struct. 2022, 281, 115015. [Google Scholar] [CrossRef]
  42. Seto, Y.; Ullah, A.S.; Kubo, A.; D’Addona, D.M.; Teti, R. On the Porous Structuring using Unit Cells. Procedia CIRP 2021, 99, 381–386. [Google Scholar] [CrossRef]
  43. Maskery, I.; Parry, L.A.; Padrão, D.; Hague, R.J.M.; Ashcroft, I.A. FLatt Pack: A research-focussed lattice design program. Addit. Manuf. 2022, 49, 102510. [Google Scholar] [CrossRef]
  44. Geyer, S.; Hölzl, C. Comparison of CAD Software for Designing Cellular Structures for Additive Manufacturing. Appl. Sci. 2024, 14, 3360. [Google Scholar] [CrossRef]
  45. Azman, A.H.; Vignat, F.; Villeneuve, F. Evaluating current cad tools performances in the context of design for additive manufacturing. In Proceedings of the Joint Conference on Mechanical, Design Engineering & Advanced Manufacturing, Toulouse, France, 18–20 June 2014; pp. 1–7. [Google Scholar]
  46. Thompson, M.K.; Moroni, G.; Vaneker, T.; Fadel, G.; Campbell, R.I.; Gibson, I.; Bernard, A.; Schulz, J.; Graf, P.; Ahuja, B.; et al. Design for Additive Manufacturing: Trends, opportunities, considerations, and constraints. CIRP Ann. 2016, 65, 737–760. [Google Scholar] [CrossRef]
  47. Yang, Y.; Yang, Y.; Liu, H.C.; Wan, M.; Zhang, W.H. A new cutting tool filled with metallic lattice and design method for vibration suppression in milling. Mech. Syst. Signal Process. 2024, 212, 111310. [Google Scholar] [CrossRef]
  48. Yang, Y.; Liu, H.-L.; Yuan, J.-W.; Kong, W.-L.; Wan, M.; Zang, W.-H. Development of an anti-vibration cutting tool combining the lattice structures infill with damping particles. Mech. Syst. Signal Process. 2025, 228, 112425. [Google Scholar] [CrossRef]
  49. Jared, B.H.; Aguilo, M.A.; Beghini, L.L.; Boyce, B.L.; Clark, B.W.; Cook, A.; Kaehr, B.J.; Robbins, J. Additive manufacturing: Toward holistic design. Scr. Mater. 2017, 135, 141–147. [Google Scholar] [CrossRef]
  50. Robbins, J.; Owen, S.J.; Clark, B.W.; Voth, T.E. An efficient and scalable approach for generating topologically optimized cellular structures for additive manufacturing. Addit. Manuf. 2016, 12, 296–304. [Google Scholar] [CrossRef]
  51. Azman, A.H.; Vignat, F.; Villeneuve, F. Cad tools and file format performance evaluation in designing lattice structures for additive manufacturing. J. Teknol. 2018, 80, 87–95. [Google Scholar] [CrossRef]
  52. Downing, D.; McMillan, M.; Brandt, M.; Leary, M. Programmatic lattice generation tools for additive manufacture [Formula presented]. Softw. Impacts 2022, 12, 100262. [Google Scholar] [CrossRef]
  53. Manufacturing Automation Laboratories n.d. Available online: https://www.malinc.com/ (accessed on 28 April 2025).
  54. Budak, E.; Ozlu, E. Analytical Modeling of Chatter Stability in Turning and Boring Operations: A Multi-Dimensional Approach. CIRP Ann. 2007, 56, 401–404. [Google Scholar] [CrossRef]
  55. Ozlu, E.; Budak, E. Analytical modeling of chatter stability in turning and boring operations—Part I: Model development. J. Manuf. Sci. Eng. 2007, 129, 726–732. [Google Scholar] [CrossRef]
  56. Lanczos, C. An Iteration Method for the Solution of the Eigenvalue Problem of Linear Differentail and Integral Operators. J. Res. Natl. Bur. Stand. 1950, 45, 255–282. [Google Scholar] [CrossRef]
  57. Astarloa, A.; Comak, A.; Mancisidor, I.; Fernandes, M.H.; Munoa, J.; Dombovari, Z. Improvement of boring operations by means of mode coupling effect. CIRP J. Manuf. Sci. Technol. 2022, 37, 633–644. [Google Scholar] [CrossRef]
  58. Houck, L.; Schmitz, T.L.; Smith, K.S. A tuned holder for increased boring bar dynamic stiffness. J. Manuf. Process. 2011, 13, 24–29. [Google Scholar] [CrossRef]
  59. Cheng, L.; Liang, X.; Belski, E.; Wang, X.; Sietins, J.M.; Ludwick, S.; To, A.C. Natural frequency optimization of variable-density additive manufactured lattice structure: Theory and experimental validation. J. Manuf. Sci. Eng. Trans. ASME 2018, 140, 105002. [Google Scholar] [CrossRef]
  60. Nightingale, M.; Hewson, R.; Santer, M. Multiscale optimisation of resonant frequencies for lattice-based additive manufactured structures. Struct. Multidiscip. Optim. 2021, 63, 1187–1201. [Google Scholar] [CrossRef]
  61. Xia, Q.; Shi, T.; Wang, M.Y. A level set based shape and topology optimization method for maximizing the simple or repeated first eigenvalue of structure vibration. Struct. Multidiscip. Optim. 2011, 43, 473–485. [Google Scholar] [CrossRef]
  62. Elmadih, W.A.; Syam, W.P.; Maskery, I.; Leach, R. Additively manufactured lattice structures for precision engineering applications. In Proceedings of the 32nd Annual Meeting of American Society for Precision Engineering, Charlotte, NC, USA, 29 October–3 November 2017; pp. 164–169. [Google Scholar]
  63. Huang, Y.; Wan, A.R.O.; Schmidt, K.; Sefont, P.; Singamneni, S.; Chen, Z.W. Effects of cell orientation on compressive behaviour of electron beam powder bed fusion Ti6Al4V lattice structures. Mater. Today Proc. 2023; in press. [Google Scholar] [CrossRef]
  64. Li, Y.; Pavier, M.; Coules, H. Fracture behaviour of octet-truss lattices in different orientations. Procedia Struct. Integr. 2022, 37, 49–56. [Google Scholar] [CrossRef]
Figure 1. Application examples and mechanism of chatter. In accordance with the literature [5,6,7,8,9,10,11,12].
Vibration 08 00029 g001
Figure 2. Schematic illustration of the first step: Determination of an optimal design space for a boring bar; testing of varying 3D lattice structures which was created by ANSYS SpaceClaim19.0 CAD software; evaluation of various modified Boring bar simulation models using modal and harmonic response analysis (HRA).
Vibration 08 00029 g002
Figure 4. (a) Experimental setup for force measurement, (b) Tap testing system, and (c) real and (d) imaginary parts for X and Y axis.
Vibration 08 00029 g004
Figure 5. A procedure for the validation of the simulation model; control steps for original (step 1–2) and modified (step 3–4) boring bars followed by the finding of largest volume for elliptical hollow (step 5).
Vibration 08 00029 g005
Figure 6. Procedure for the validation of the simulation model; validation of the simulated boring bar (step 7) by the experimental test (step 6) and implementing the modifications of cylindrical (step 8) and ellipsoidal (step 9) hollow geometries.
Vibration 08 00029 g006
Figure 7. Dimensions of the boring bar; geometry modelling area with cylindrical hollow model C12H1, cross-sections (A-A and B-B), and the corresponding moments of inertia.
Vibration 08 00029 g007
Figure 8. Structuring of the boring bar: original boring bar model, cylindrical hollow model, and ellipsoidal hollow model.
Vibration 08 00029 g008
Figure 9. Solutions of the modal analysis: natural frequencies of three models for six eigenmodes.
Vibration 08 00029 g009
Figure 10. (a) Experimental validation and (b) comparison of the simulation results with the experimental data.
Vibration 08 00029 g010
Figure 11. Comparison of the results: validation of the simulation model and the dynamic performance of hollow models (E18H3 and C18H3).
Vibration 08 00029 g011
Figure 12. Ellipsoidal hollow filled with cube lattices.
Vibration 08 00029 g012
Figure 13. Ellipsoidal hollow with cube lattices.
Vibration 08 00029 g013
Figure 14. Modal analysis of the modified boring bar.
Vibration 08 00029 g014
Figure 15. Comparison of the results: comparison of model C18H3 and E18H3 and the effect of lattice structure.
Vibration 08 00029 g015
Figure 16. Different 3D Lattices structures for analysis of vibration reduction.
Vibration 08 00029 g016
Figure 17. (a) Comparison of the results and (b) the zoomed view.
Vibration 08 00029 g017
Figure 18. Comparison of two varying beam diameters in model 3.
Vibration 08 00029 g018
Figure 19. Lattice structure and lattice unit with their outer dimensions in cartesian coordinate system.
Vibration 08 00029 g019
Figure 20. Kagome lattice unit and its features.
Vibration 08 00029 g020
Figure 21. CLWS lattice unit and its features.
Vibration 08 00029 g021
Figure 22. CLWBCS lattice unit and its features.
Vibration 08 00029 g022
Figure 23. CLWBCWVS lattice unit and its features.
Vibration 08 00029 g023
Figure 24. DPLWC lattice unit and its features.
Vibration 08 00029 g024
Figure 25. Merging of lattice units.
Vibration 08 00029 g025
Figure 26. The lattice unit parts detached from the lattice structure.
Vibration 08 00029 g026
Figure 27. Lattice unit layout approach.
Vibration 08 00029 g027
Figure 29. User interface for the parametric modelling method.
Vibration 08 00029 g029
Figure 30. Selection of the shell type and size.
Vibration 08 00029 g030
Figure 31. Selection of lattice unit type and size.
Vibration 08 00029 g031
Figure 32. Potential use of cellular structures in the manufacturing industry: (a) boring bar with Kagome lattice unit structure; (b) tool holder with CLWBCWVS lattice unit structure; and (c) indexable insert drill with DPLWC lattice unit structure.
Vibration 08 00029 g032
Table 1. Characteristics of active and passive damping methods [22].
Vibration DampingCharacteristics
Active MethodsInstallation of additional devices, such as actuators
Use of advanced and complex control algorithms
Knowledge of vibrations eigen-frequencies
Model-based strategy
Passive MethodsBased on viscoelastic materials, viscous fluids, magnetic, or passive piezoelectric, lightweight materials
Vibration energy dissipation or redirection
Cost effective
Dampers are usually small size and easy to install
Table 2. Chemical and mechanical properties of the boring bar material (51CrV4).
PhysicalTensile StrengthYield PointElongationContractionImpact
Resistance
Elasticity
Modulus
DensityPoisson’s Ratio
1000–1200 MPa>550 MPa>10%>45%>30 J210 × 103 MPa7.7 kg/dm30.29
Chemical C %Si %Mn %P %S %Cr %V %
Minimum0.47-0.70--0.900.10
Maximum0.550.401.100.0250.0251.200.25
Table 3. Insertion of a cylindrical hollow into the boring bar and simulation of the available bending stress.
ModelModified DiameterLengthBending Stress
in Section A-A
Bending Stress
in Section B-B
C12H112 mm70 mm47.768 MPa63.119 MPa
C12H212 mm100 mm36.219 MPa65.659 MPa
C12H312 mm130 mm32.275 MPa59.626 MPa
C15H115 mm70 mm60.100 MPa81.006 MPa
C15H215 mm100 mm48.598 MPa92.165 MPa
C15H315 mm130 mm46.153 MPa94.645 MPa
C18H118 mm70 mm81.493 MPa118.690 MPa
C18H218 mm100 mm71.630 MPa128.910 MPa
C18H318 mm130 mm62.477 MPa131.050 MPa
C21H121 mm70 mm121.370 MPa175.840 MPa
C21H221 mm100 mm102.110 MPa217.450 MPa
C21H321 mm130 mm90.315 MPa255.730 MPa
Vibration 08 00029 i001
Table 4. Computational resources for simulation.
NodeElementsData SizeSimulation Time
High-End Workstation FeaturesHP Z800
2× CPU Intel Xeon W5580, 3.50 GHz, 8 MB L3, 1333 MHz Memory, 130W32
144 GB (4 × 12 GB; 6 × 16 GB) DDR3-1333 ECC Registered RAM 2-CPU
NVIDIA Quadro FX 5800 4 GB PCIe Graphics Card
1110 W 89% (SILVER) Efficient wide-ranging, active Power Factor Correction
FEM- MODAL/HRA reference model (full)1855.1201360.49247.54 GB4 h 22 min
FEM- MODAL/HRA cylindrical hollow model1470.612960.95851.55 GB5 h 38 min
FEM- MODAL/HRA ellipsoidal hollow model 1201.598798.92154.29 GB 12 h 59 min
FEM static/mechanical analysis 13 models (see Table 3)--120.18 GB32 d 10 h 46 min
FEM-MODAL/HRA ellipsoidal hollow with simulation model 128,816.22519,167.250277.15 GB10 d 21 h 27 min
FEM-MODAL/HRA ellipsoidal hollow with simulation model 227,972.31518,245.017263.27 GB10 d 10 h 13 min
FEM-MODAL/HRA ellipsoidal hollow with simulation model 328,012.06418,644.344265.05 GB11 d 7 h 38 min
FEM-MODAL/HRA ellipsoidal hollow with simulation model 429,106.92419,909.789281.98 GB11 d 13 h 3 min
FEM-MODAL/HRA ellipsoidal hollow with simulation model 529,181.18119,960.379282.23 GB11 d 33 h 42 min
FEM-MODAL/HRA ellipsoidal hollow with simulation model 628,776.86119,227.129278.33 GB11 d 47 h 7 min
FEM-MODAL/HRA ellipsoidal hollow with simulation model 3
d = 0.75 mm
27,004.15417,991.879259.85 GB10 d 1 h 41 min
FEM- MODAL/HRA ellipsoidal hollow with simulation model 3
d = 1.25 mm
29,914.36120,044.485291.96 GB12 d 5 h 52 min
Table 5. Lattice unit types used for the specific parametric CAD software tool.
#Type of Lattice UnitModel#Type of Lattice UnitModel
1KagomeVibration 08 00029 i0024CLWBCWVS
(Cube Lattice with Bottom Centre Without Vertical Supports)
Vibration 08 00029 i003
2CLWCS
(Cube Lattice with Center Supports)
Vibration 08 00029 i0045DPLWC
(Double Pyramid Lattice with Cross)
Vibration 08 00029 i005
3CLWBCS
(Cube Lattice with Bottom Center Supports)
Vibration 08 00029 i006
Disclaimer/Publisher’s Note: The statements, opinions and data contained in all publications are solely those of the individual author(s) and contributor(s) and not of MDPI and/or the editor(s). MDPI and/or the editor(s) disclaim responsibility for any injury to people or property resulting from any ideas, methods, instructions or products referred to in the content.

