3.3.1. DOE Setup
In the DOE module of GT-SUITE v2016, there are many sampling methods, including full factorial, D-Optimum, Latin Hypercube, D-Optimum Latin Hypercube, etc. In this study, the Latin hypercube sampling (LHS) method was adopted for the generation of design points. LHS is a stratified random sampling technique that divides the range of each input variable into n non-overlapping intervals of equal marginal probability, where n is the number of design runs. From each interval, a single value is randomly sampled without replacement. This ensures that every variable’s entire range is uniformly represented, even with a relatively small number of experiments. Compared to full factorial designs, which require kn runs for k factors each at n levels and quickly become prohibitive, LHS provides excellent space-filling properties with far fewer design points. Compared to simple random Monte Carlo sampling, LHS avoids the clustering of points in certain regions and guarantees more even coverage of the parameter space. The Latin Hypercube method satisfies the uniformity and orthogonality requirements of DOE while enabling precise fitting of the response surface with a relatively small number of experiments.
In the DOE module of GT-SUITE v2016, the DIT and diesel injection duration (DID) were selected as independent variables. The upper and lower limit values of the two factors are shown in
Table 6. Changes in DID affect the time distribution of fuel injection, atomization quality and air mixing efficiency. A reasonable DID can optimize combustion and emissions, so DID was selected as a parameter for collaborative optimization with DIT. DOE was performed under operating conditions of a 50% NSGA. DOE optimization was conducted at a 50% NGSR. With a significant level of diesel substitution, the project offers high economic value. Furthermore, during normal engine operation, the system runs stably at a 50% substitution rate. Combustion consists of a combination of diesel diffusion combustion and natural gas premixed combustion, demonstrating good optimization potential. At substitution rates above 50%, issues such as insufficient ignition energy, unstable ignition, and deteriorated combustion are likely to occur. Within the safe operating range, 50% is the substitution ratio that ensures stable operation without significant power loss, making it a representative and typical operating condition for DOE optimization. The DIT range for the DOE was restricted to 5–8 °CA BTDC. As demonstrated in
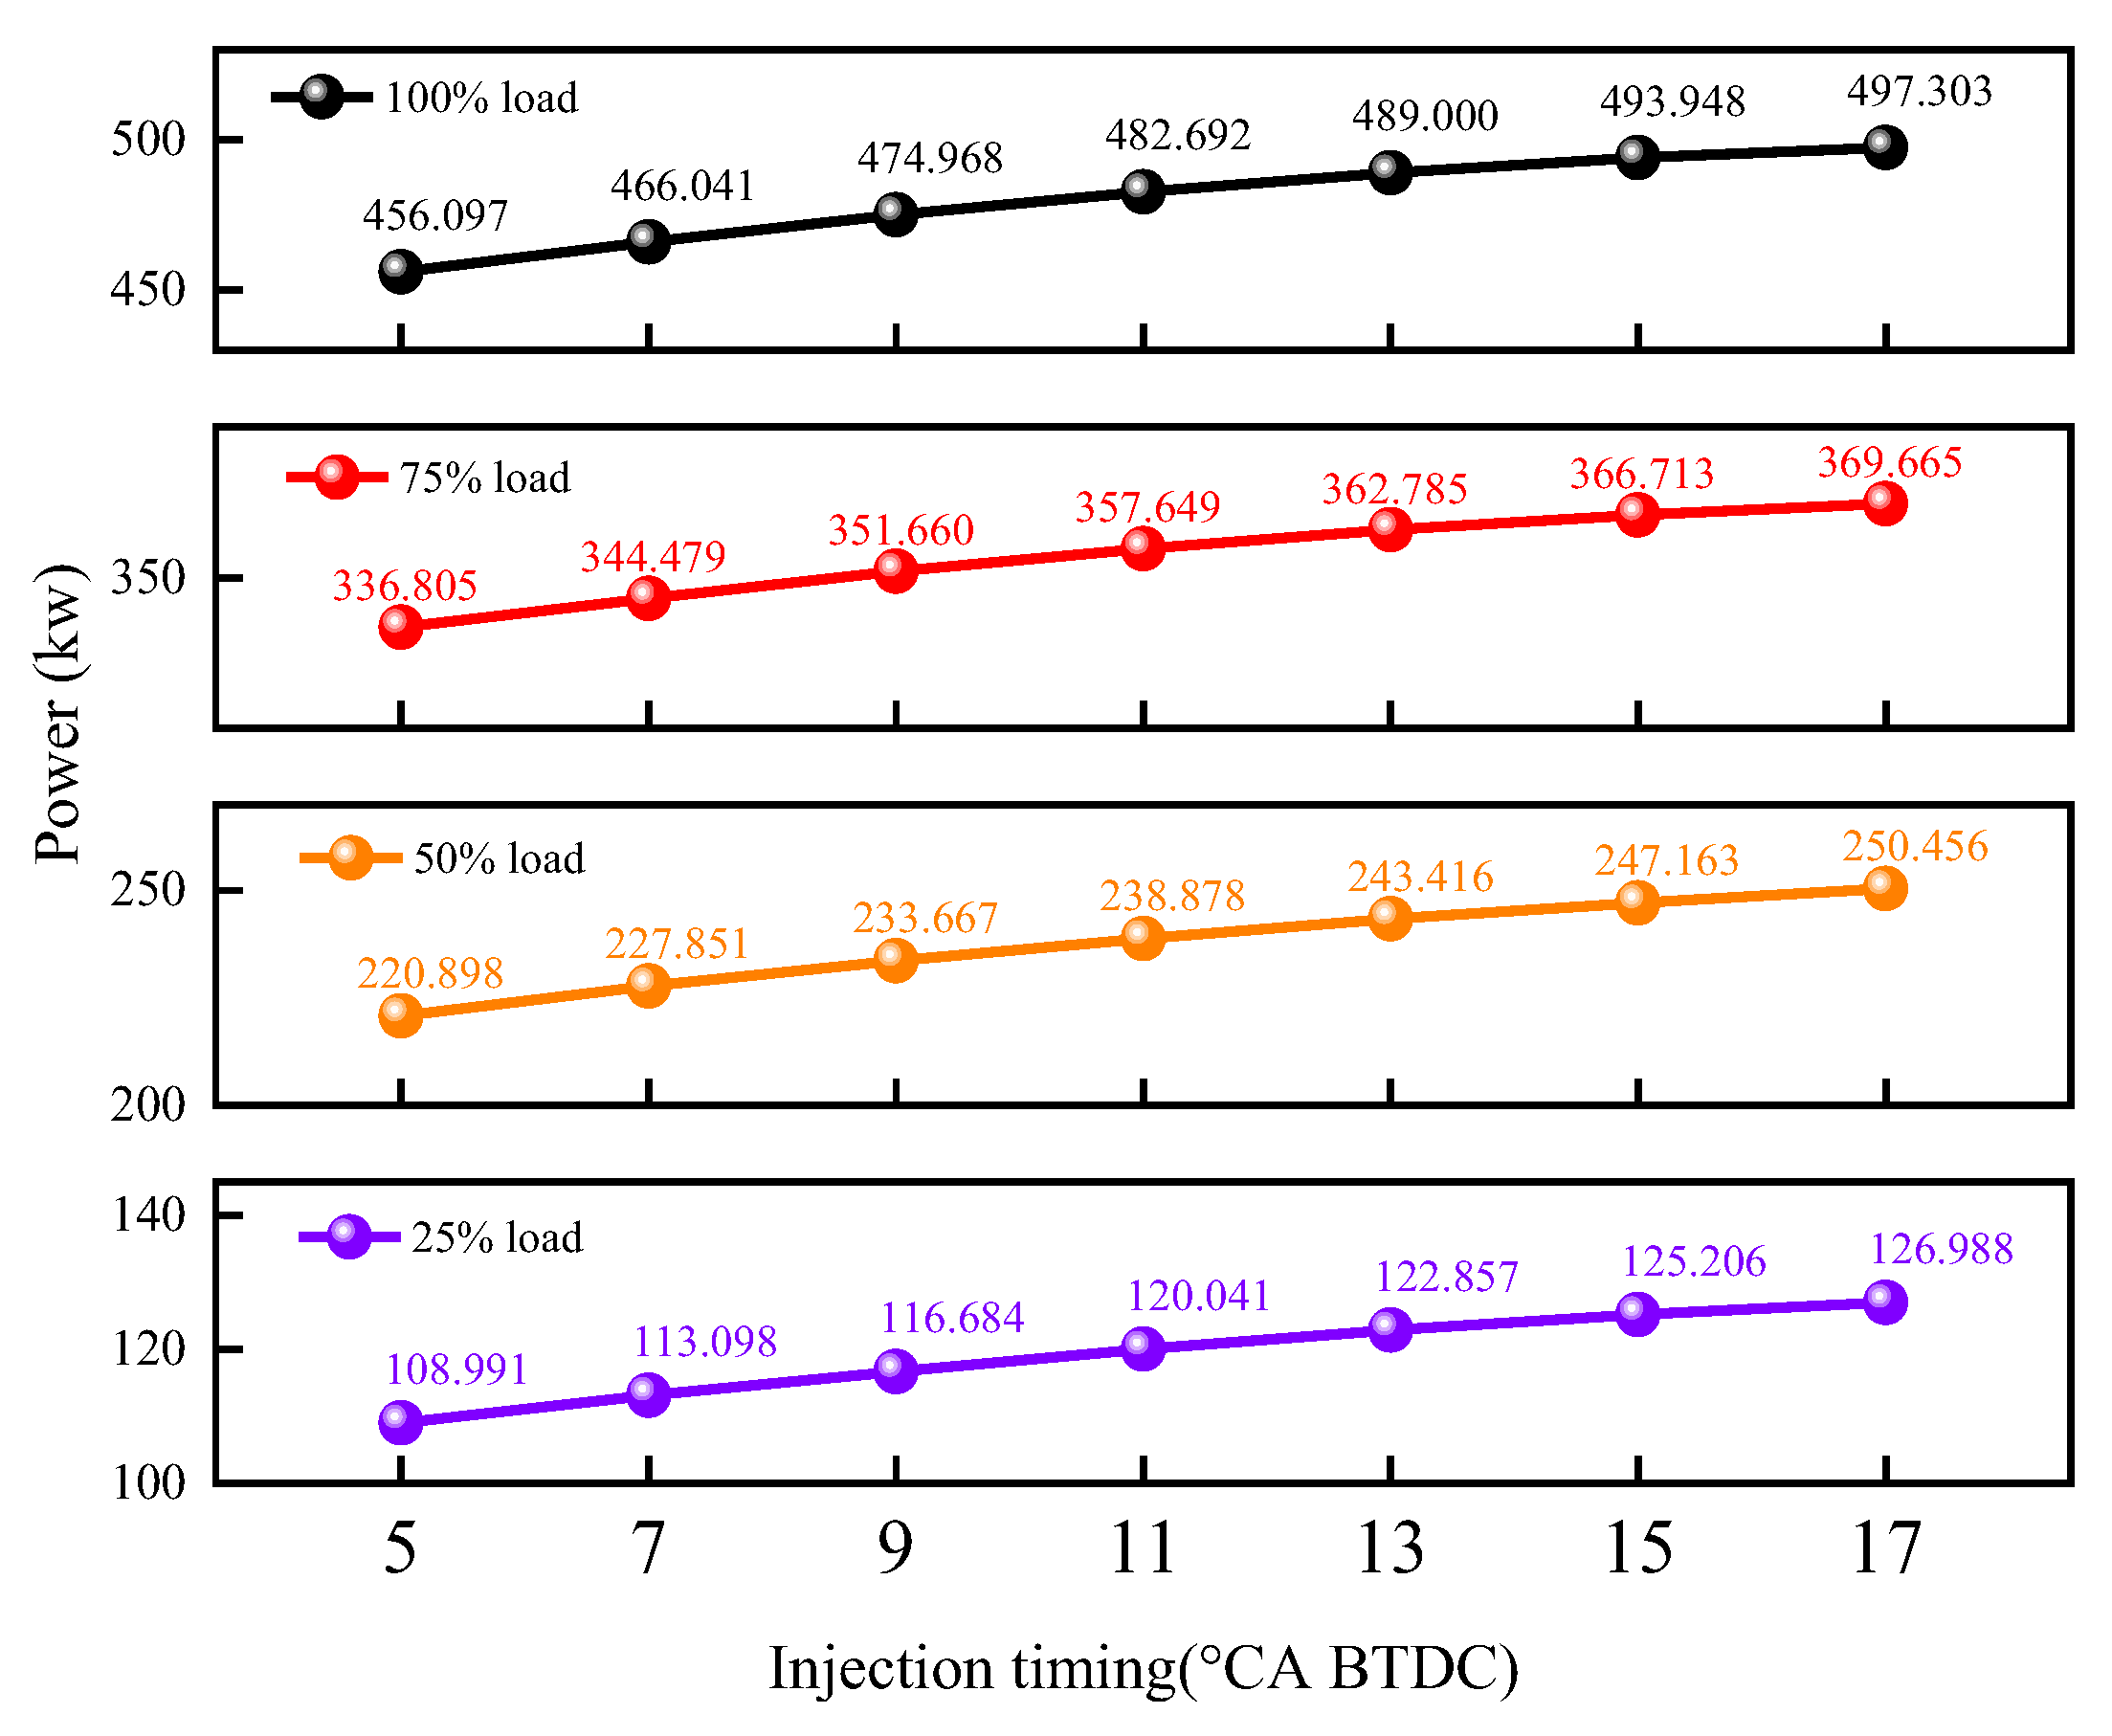
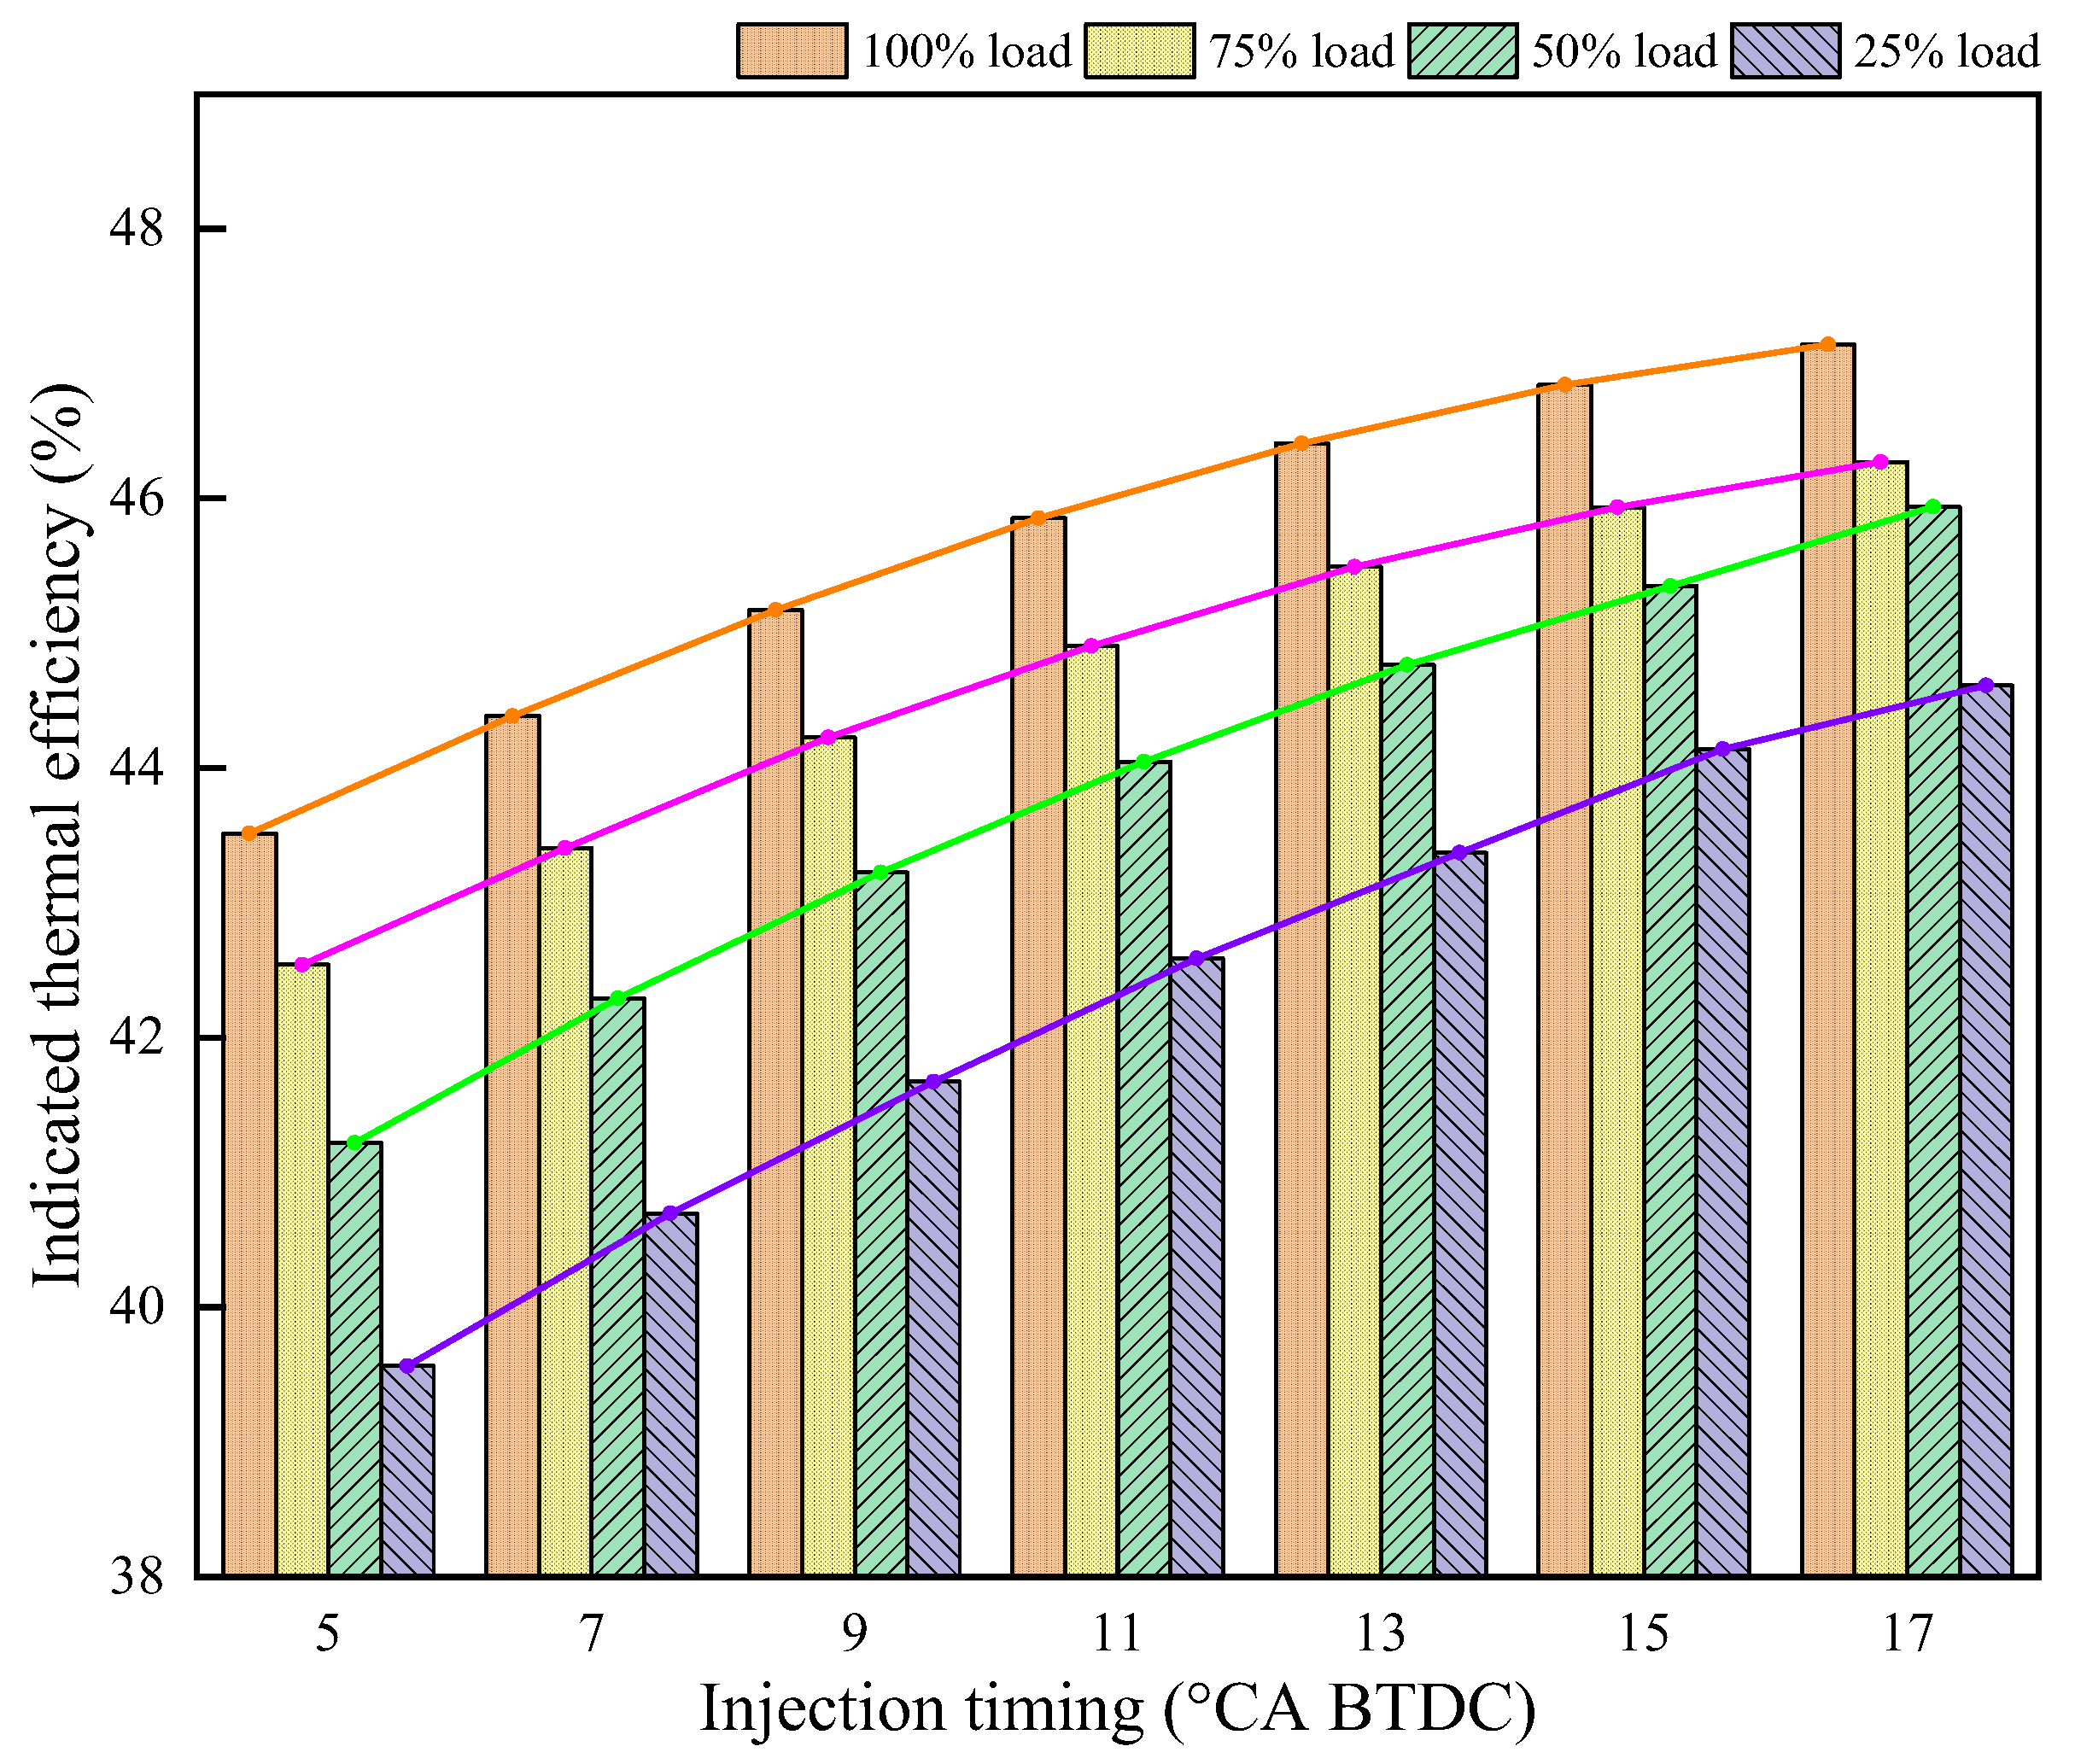
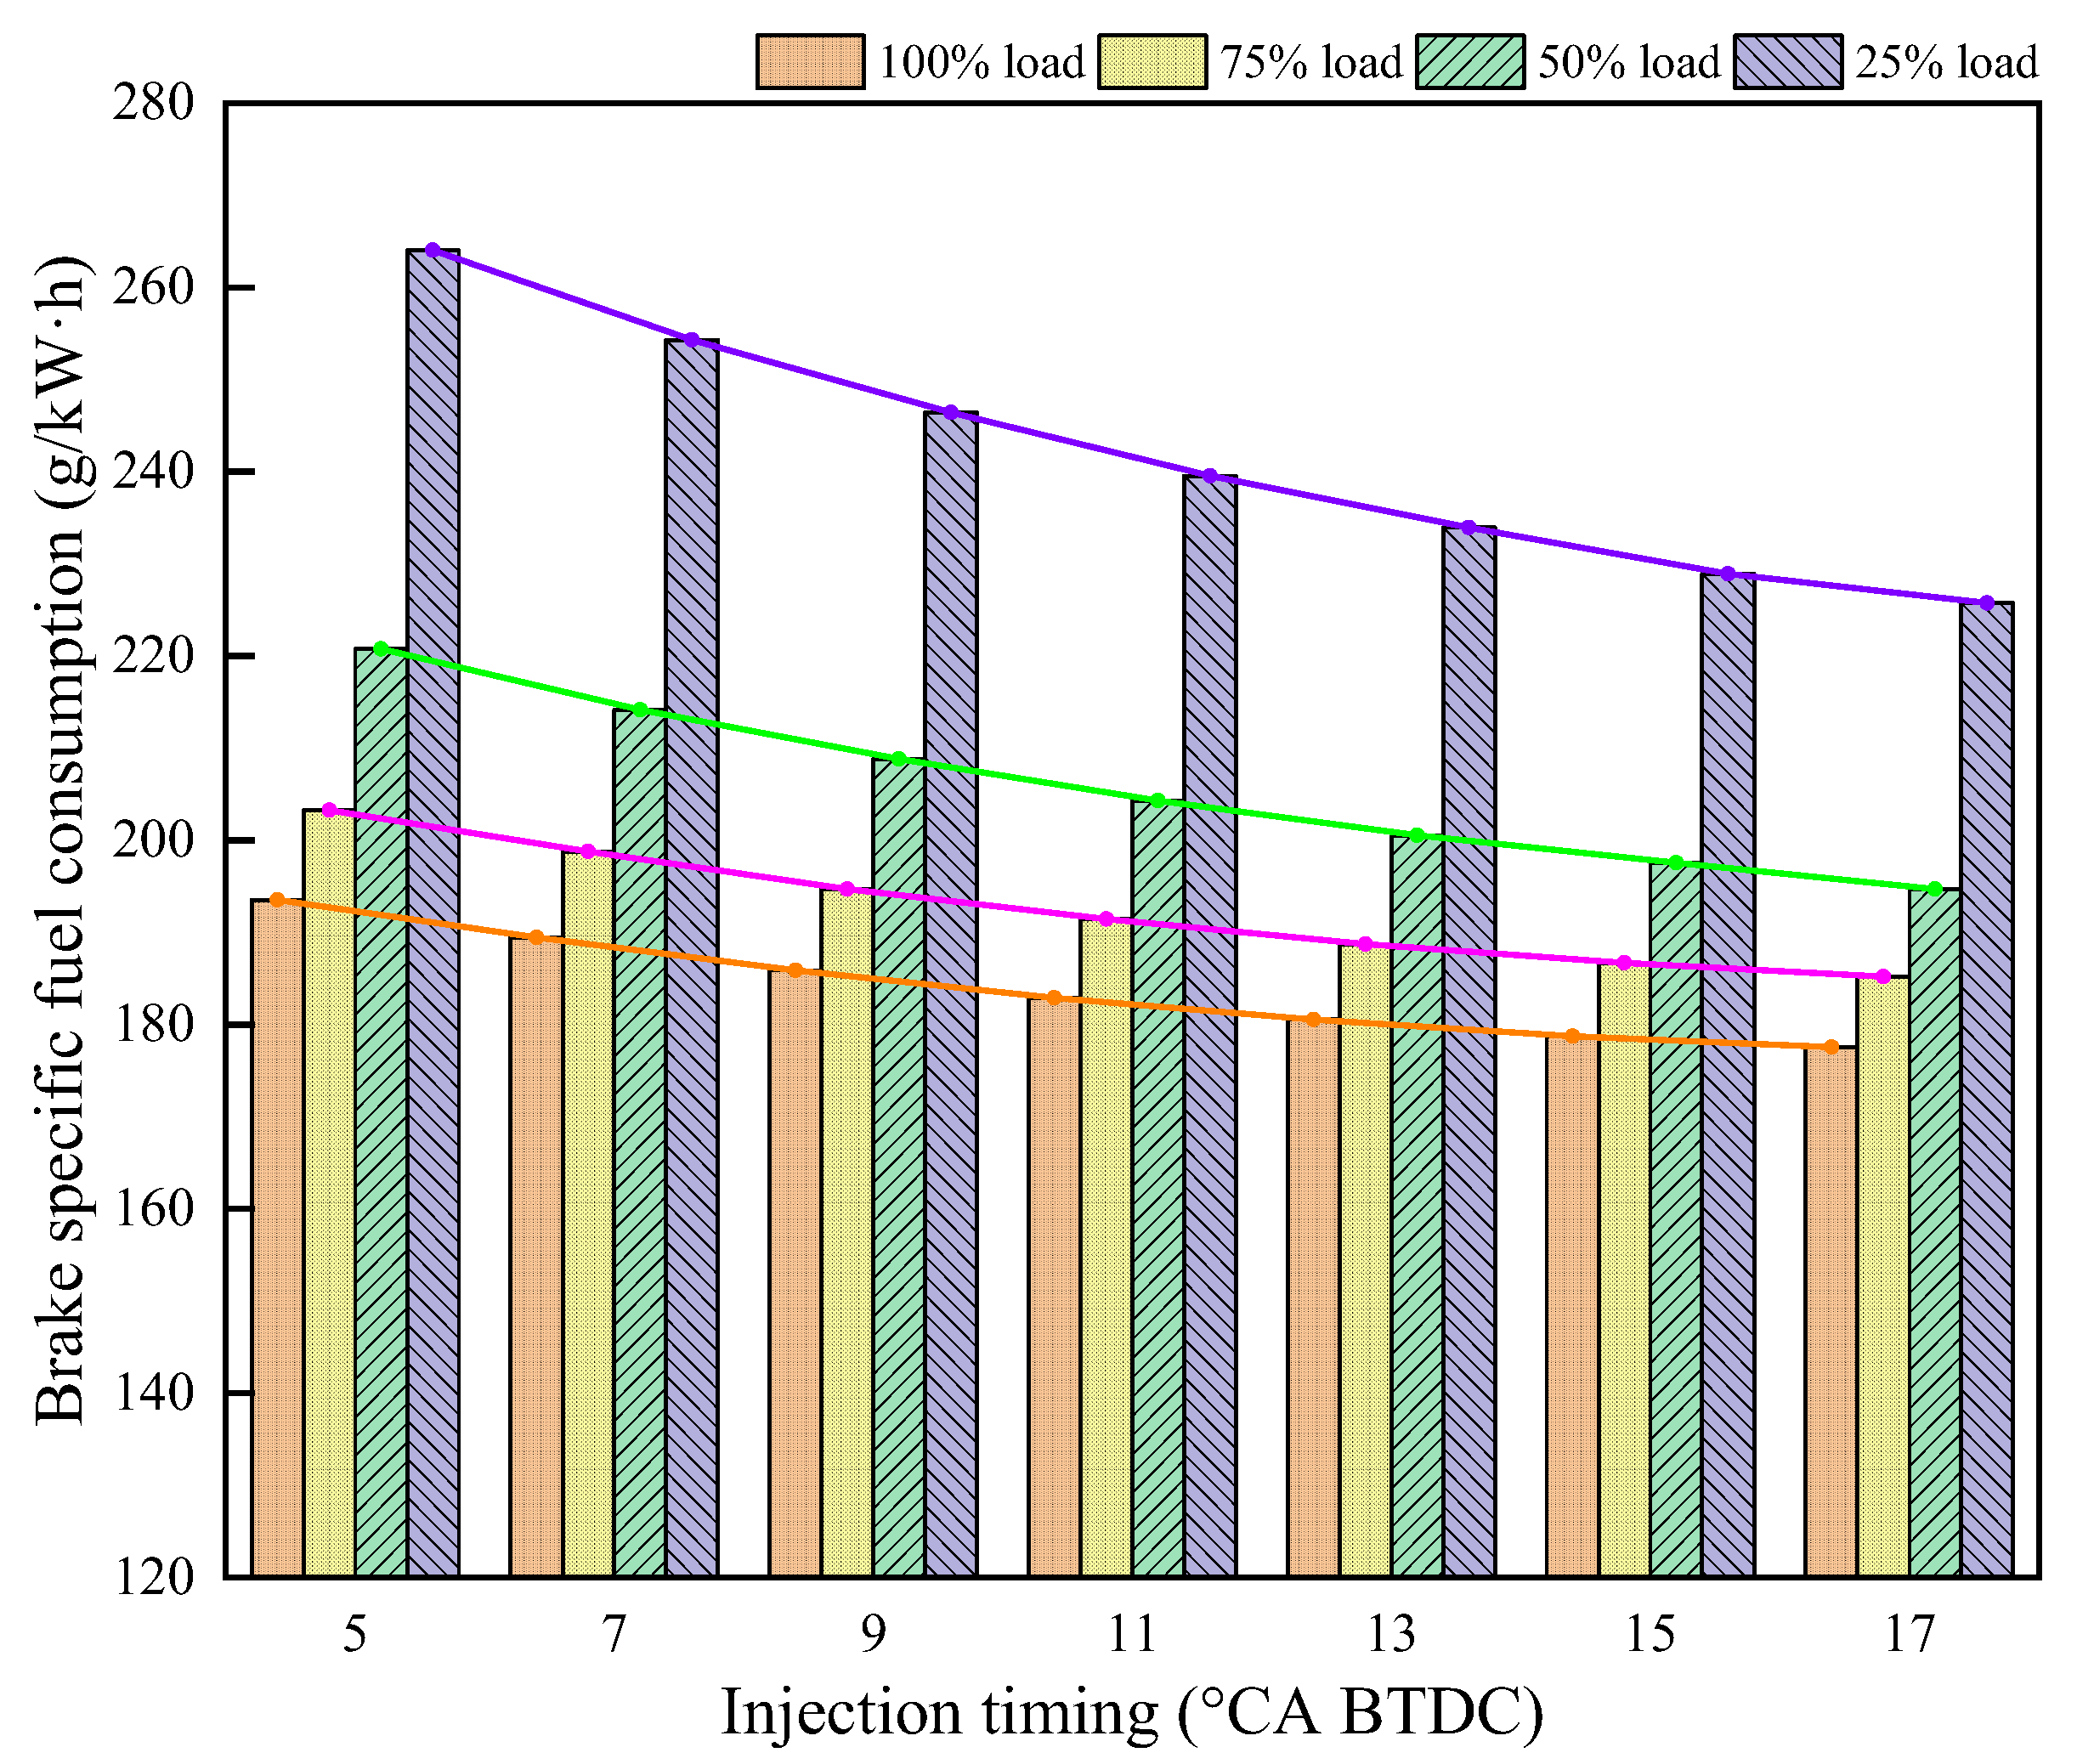
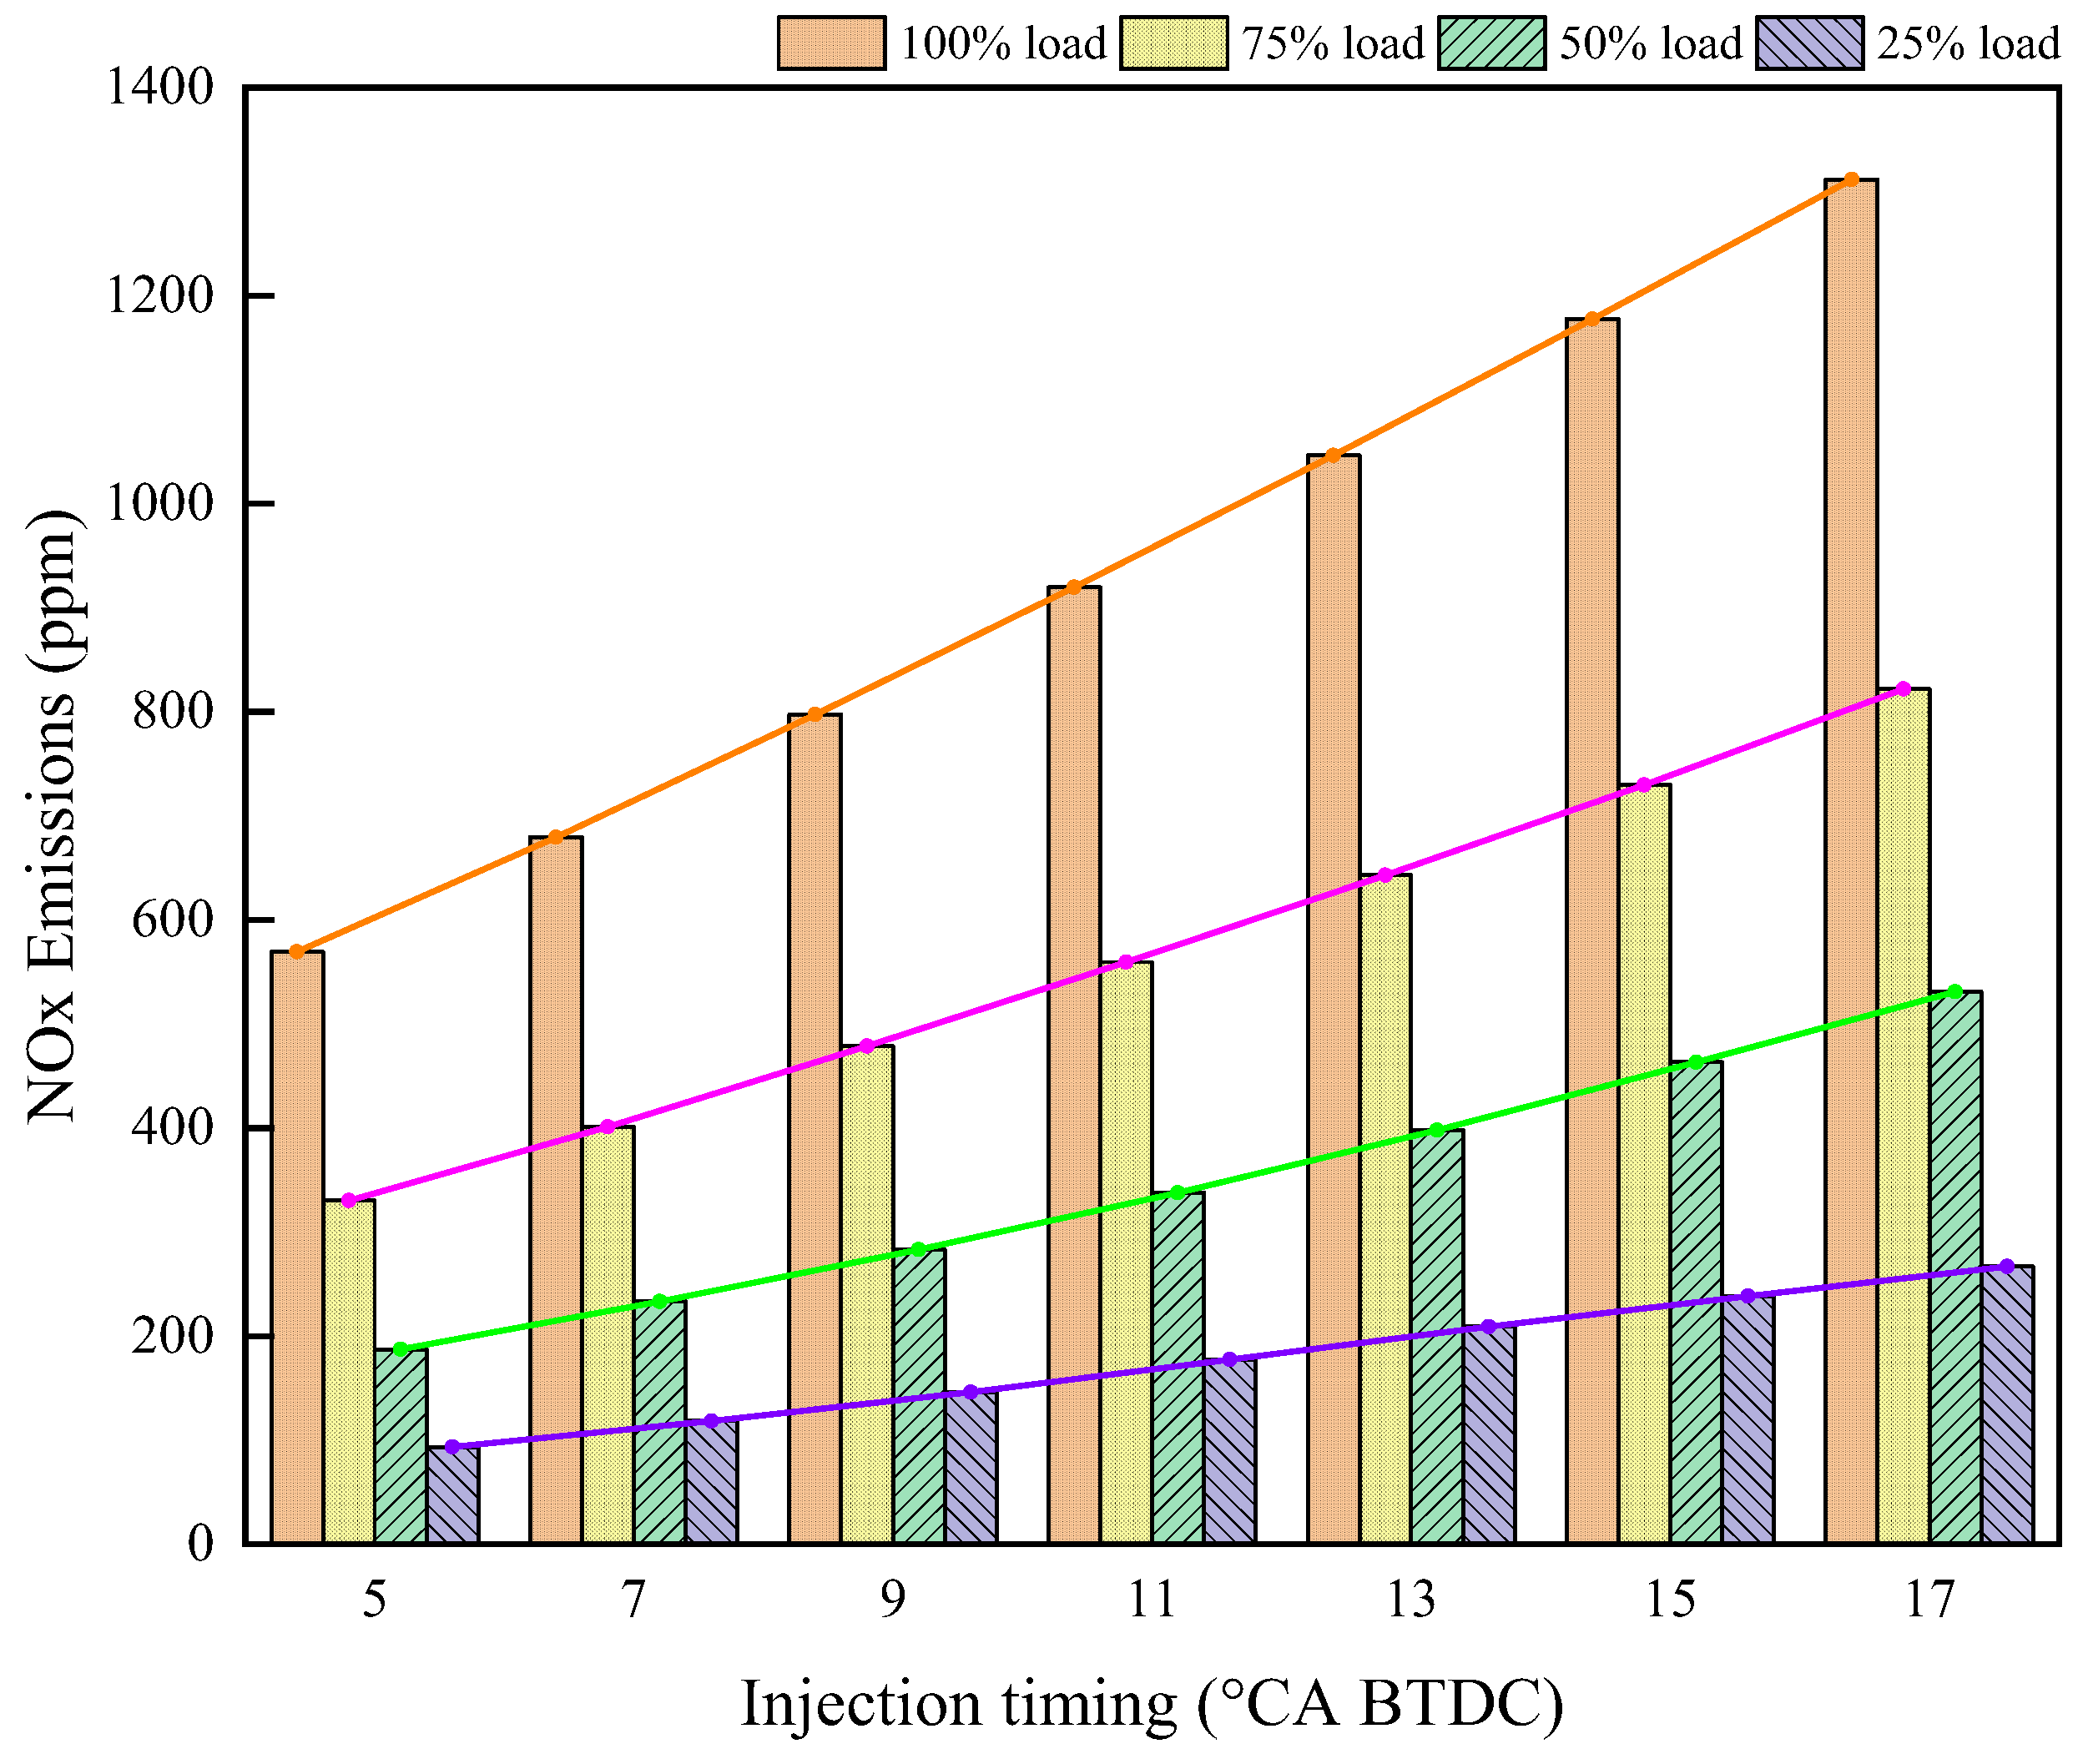
Section 3.2, advancing DIT beyond 8 °CA BTDC at full load yields diminishing improvements in power and ITE while drastically increasing NO
x emissions. Therefore, the DIT was restricted to 5–8 °CA BTDC because this interval provides a favorable compromise between power improvement and NO
x control. This also improves the accuracy of DOE optimization. The number of experiments was 35, and Latin Hypercube sampling was performed. The resulting Latin Hypercube array is shown in
Table 7. Simulation experiments were conducted at NGSRs of 50% and 100% loads, and power, ITE, BSFC, and NO
x emissions were selected as responses. The DOE experimental results are also shown in
Table 7.
3.3.2. RSM Model and Optimization
RSM is an experimental design method that combines statistics and mathematical modeling. It can describe the relationship between input variables and output responses using response surface equations. The basic principle of RSM is to use a low-order polynomial function to approximate a true, unknown continuous surface function within a finite experimental range. By fitting an explicit mathematical model using a small number of carefully designed experimental points, RSM is used to analyze the effects of factors, predict responses, and identify optimal operating conditions. After conducting DOE, regression analysis can be used to fit the experimental data, thereby constructing a response surface and then using analysis of variance (ANOVA) to evaluate the applicability and statistical significance of the model [
46].
Using Design Expert software, the results of the 35 sets of experiments in the DOE were analyzed to obtain mathematical regression models for pressure, power, BSFC, ITE, and NO
x. The regression equations obtained based on the coded factors are shown below:
where
x is DIT (°CA BTDC), and
y is DID (°CA).
To verify the adequacy and statistical significance of the fitted models, analysis of variance (ANOVA) was performed. The fitting quality of the response surface is mainly composed of three evaluation indicators, namely the coefficient of determination (R
2), the adjusted coefficient (Adj·R
2), and the predicted coefficient (Pre·R
2). R
2 measures the proportion of total variability explained by the model. Adj·R
2 corrects R
2 for the number of predictors. Pre·R
2 assesses the model’s predictive capability. The closer these three coefficients are to 1, the better the quality of the fitted response surface. As shown in
Table 8 and
Table 9, the R
2, Adj·R
2 and Pre·R
2 are higher than 0.99, which indicates that the quality of response surface is satisfactory.
ANOVA was then performed to test the model, where the F-value and
p-value can be used to assess the validity of the model. The F-value reflects the significance of the model, while the
p-value is typically compared to a given significance level (commonly 0.05 or 0.01). Generally, a
p-value < 0.05 denotes a significant influence between the factor and target, while a
p-value < 0.01 indicates a more strongly significant influence. Based on the results in
Table 8 and
Table 9, it can be seen that the
p-values for power, BSFC, ITE, and NO
x are all less than 0.05, indicating that the linear terms (x and y), interaction term (xy), and quadratic terms (x
2 and y
2) all exhibited significant effects on power, ITE, BSFC, and NO
x emissions. Furthermore, according to Equations (17)–(20), the absolute values of the coefficients follow the order of x > x
2 > y > xy > y
2. This indicates that the independent variable x is the dominant factor affecting engine performance and emissions, with both its linear and quadratic terms exerting substantially greater influences on the response variables than those of y. The statistically significant interaction term (xy) suggests the existence of a coupling effect between the two control parameters, whereas the quadratic nonlinearity associated with y is relatively weak. Variable x exhibits a clear trade-off between performance and emissions: advancing DIT can significantly suppress NO
x formation but simultaneously reduces power output and thermal efficiency while increasing fuel consumption. In contrast, increasing y can provide modest but concurrent improvements in power performance, fuel economy, and emission characteristics. For NO
x emissions, the significant xy term in Equation (20) indicates that the effect of DIT is dependent on the selected DID, demonstrating a coupled influence of the two injection parameters on NO
x formation. Advancing DIT generally promotes earlier combustion phasing and increases the in-cylinder temperature, which tends to increase NO
x emissions. However, extending DID distributes the heat release process over a longer crank angle duration and alleviates local temperature peaks, thereby mitigating the NO
x increase induced by advanced DIT. The relatively small coefficient of the y
2 term suggests that the nonlinear influence of DID on NO
x is limited within the investigated range.
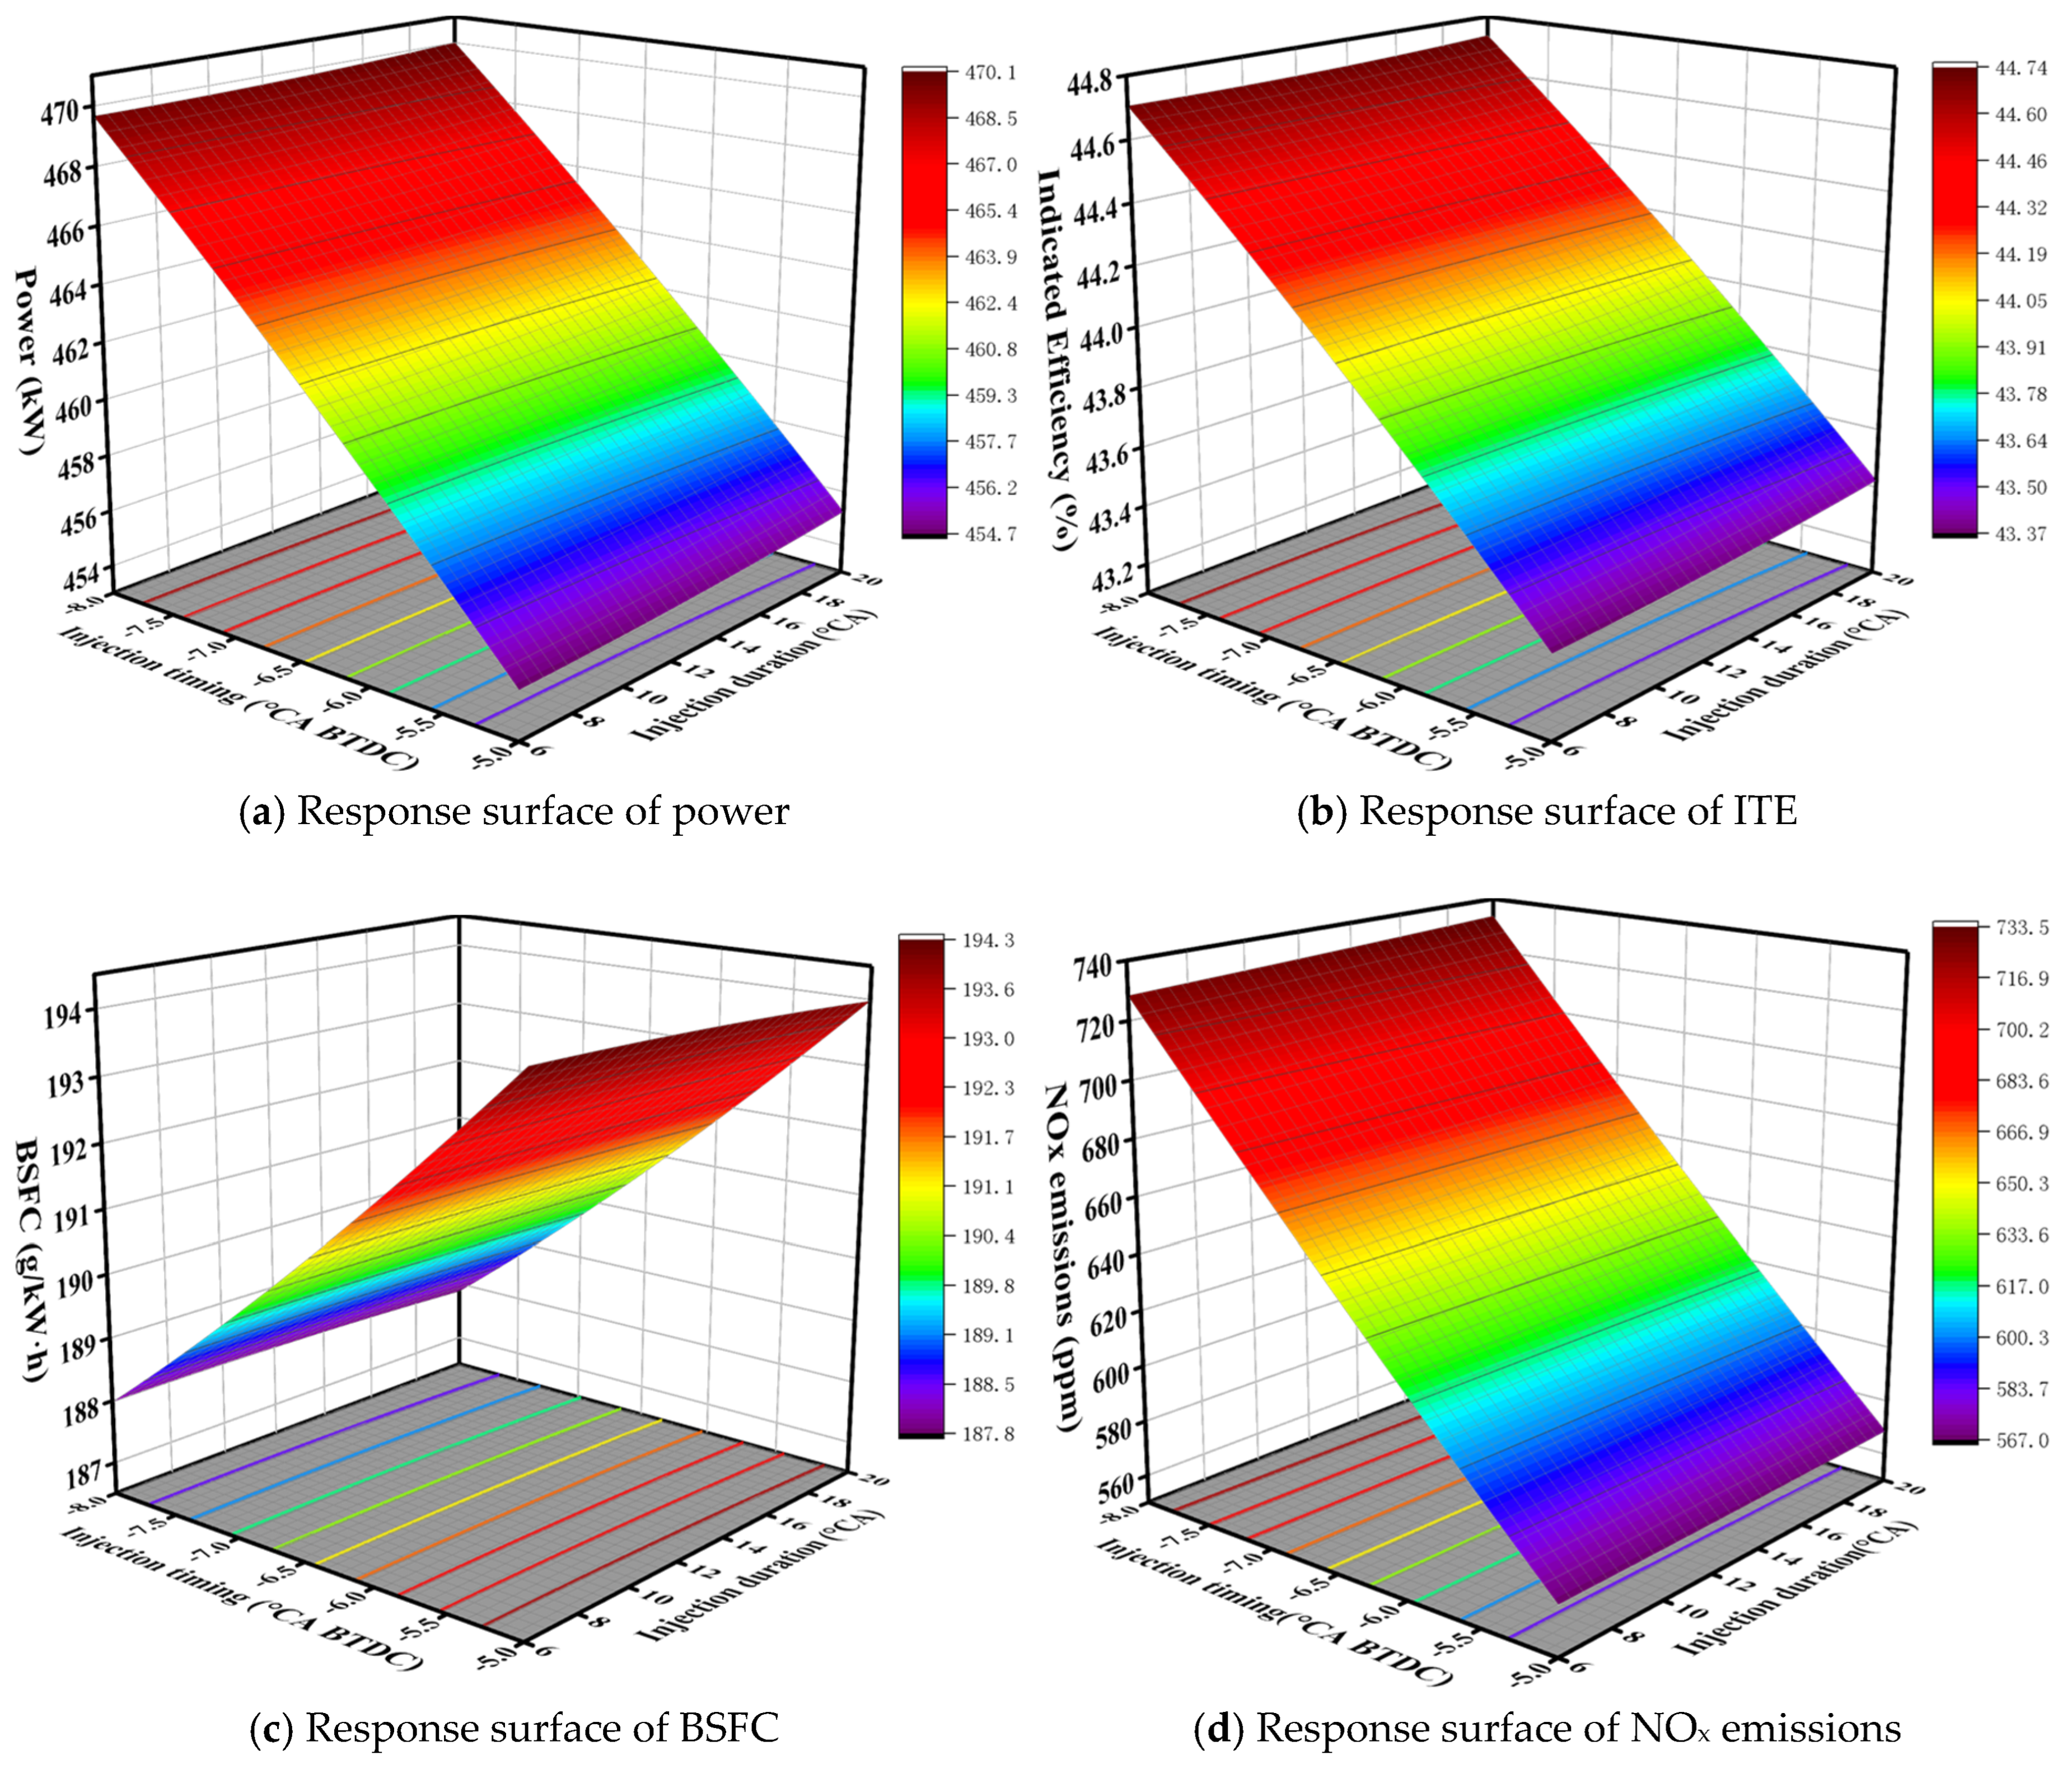
Figure 19 shows the response surfaces of DIT and DID on power, ITE, BSFC, and NO
x. As DIT advanced and DID extended, power and ITE showed an upward trend, while BSFC showed a downward trend. However, NO
x emissions increased. Therefore, it is necessary to use optimization algorithms to optimize power, economy and emissions.
The Design Optimization module in DOE-POST can be used to optimize power, ITE, BSFC, and NO
x. The optimization algorithms include GA Standard optimization and Multi-Objective Pareto optimization. GA Standard was used for optimization. The maximum number of generations was set to 1000. Convergence was defined as occurring when the metrics remain unchanged after 200 generations. The sample size and mutation rate were set to 20 and 10%. The optimization objectives were maximum power, maximum ITE, minimum BSFC, and minimum NO
x emissions.
Figure 19 demonstrates that the improvement of power output and fuel economy is inherently accompanied by a trade-off with NO
x emissions. Therefore, the ideal optimization objectives cannot be achieved simultaneously within the operating range investigated. Consequently, the optimization performed in this study should be regarded as a decision-support process rather than a search for a unique global optimum. To accommodate different engineering priorities, two recommended optimization schemes were proposed based on the response surface model. The maximum cylinder pressure when the NGSR is 0 was set as the constraint for optimizing the diesel–NG dual-fuel engine.
The optimization results are shown below:
When engine performance and fuel economy were prioritized, NO
x emissions were treated as a secondary consideration, automatic optimization was performed based on the above settings, and the final scheme was as follows: DIT = −7.521994 °CA and DID = 10.545455 °CA. The results of the response surface prediction are shown in
Table 10. The prediction results have a certain degree of error, so the final scheme needs to be substituted back into the simulation model for calculation to obtain accurate results. The approximate values for the final scheme are as follows: DIT = −7.52 °CA and DID = 10.55 °CA. The results obtained from the simulation model calculation were compared with the response surface prediction results in
Table 10. The recommended value of DIT = −7.52 °CA was obtained directly from the GA optimization process rather than being manually selected. During the optimization, the maximum cylinder pressure under pure diesel operation was imposed as a constraint. Further advancing the injection timing tended to increase the peak cylinder pressure and could violate the prescribed pressure limit. Consequently, the optimization converged to DIT = −7.52 °CA as the preferred operating condition rather than a more advanced injection timing. Under the adopted optimization strategy, this operating condition provided the most favorable overall performance in terms of power output, ITE, BSFC, and NO
x emissions.
As can be seen from the table, the results of the response surface prediction show very little error compared to the simulation calculation results, indicating that the response surface model has excellent fitting performance and high reliability, enabling precise prediction of the engine model results.
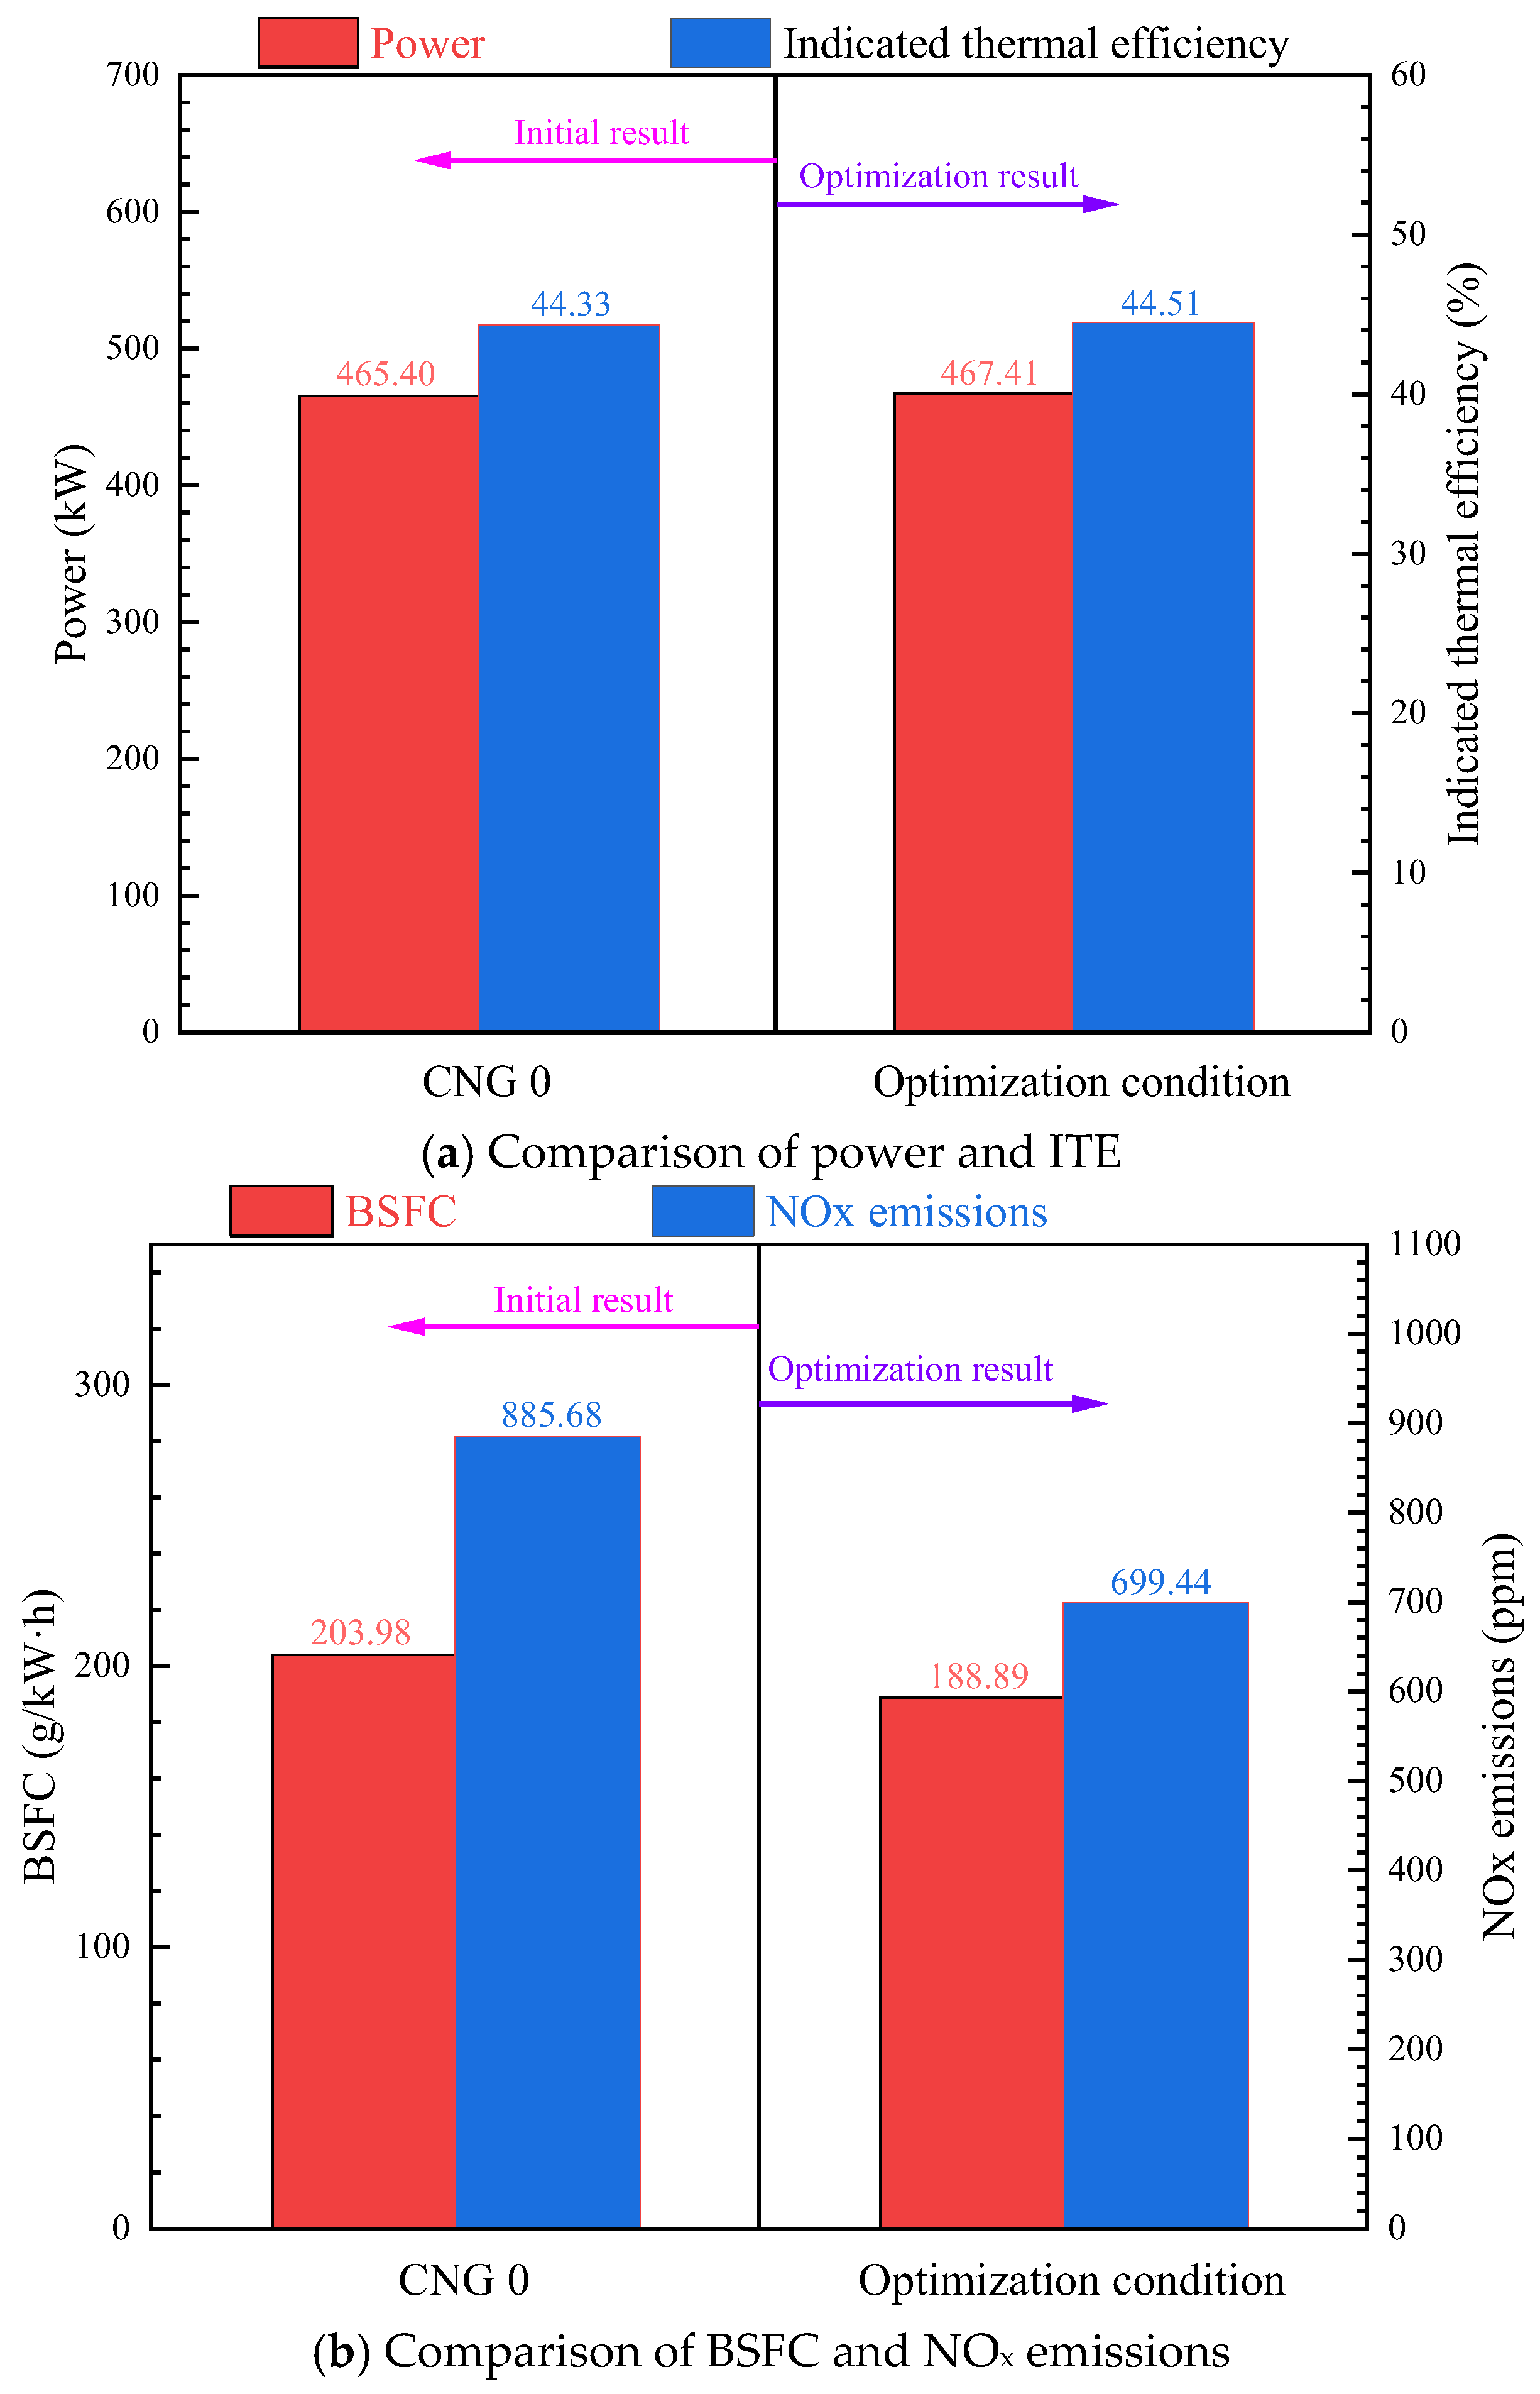
The optimal scheme was compared with the results when the NGSR was 0, and the comparison results are displayed in
Figure 20.
By optimizing the DIT and DID, compared to pure diesel mode, power increased by 0.431%, ITE increased by 0.396%, BSFC decreased by 7.397%, and NOx emissions decreased by 27.027%. Therefore, while maintaining power performance, the diesel–NG dual-fuel engine can reduce fuel consumption and significantly reduce NOx emissions, demonstrating the advantages of dual fuel.
For applications where stricter emission control is required, an alternative optimization scheme was developed with greater emphasis on NO
x reduction. When the optimization objective focused on emissions as the priority, automatic optimization was performed based on the above settings, and the final scheme was as follows: DIT = −5.002933 °CA and DID = 6.013685 °CA. Similarly, the final scheme was approximated, with DIT = −5 °CA and DID = 6.01 °CA substituted into the simulation model. The results are shown in
Table 11.
From the table, the results of response surface prediction show very little error compared to the simulation calculations, further proving the high predictive accuracy of the response surface model.
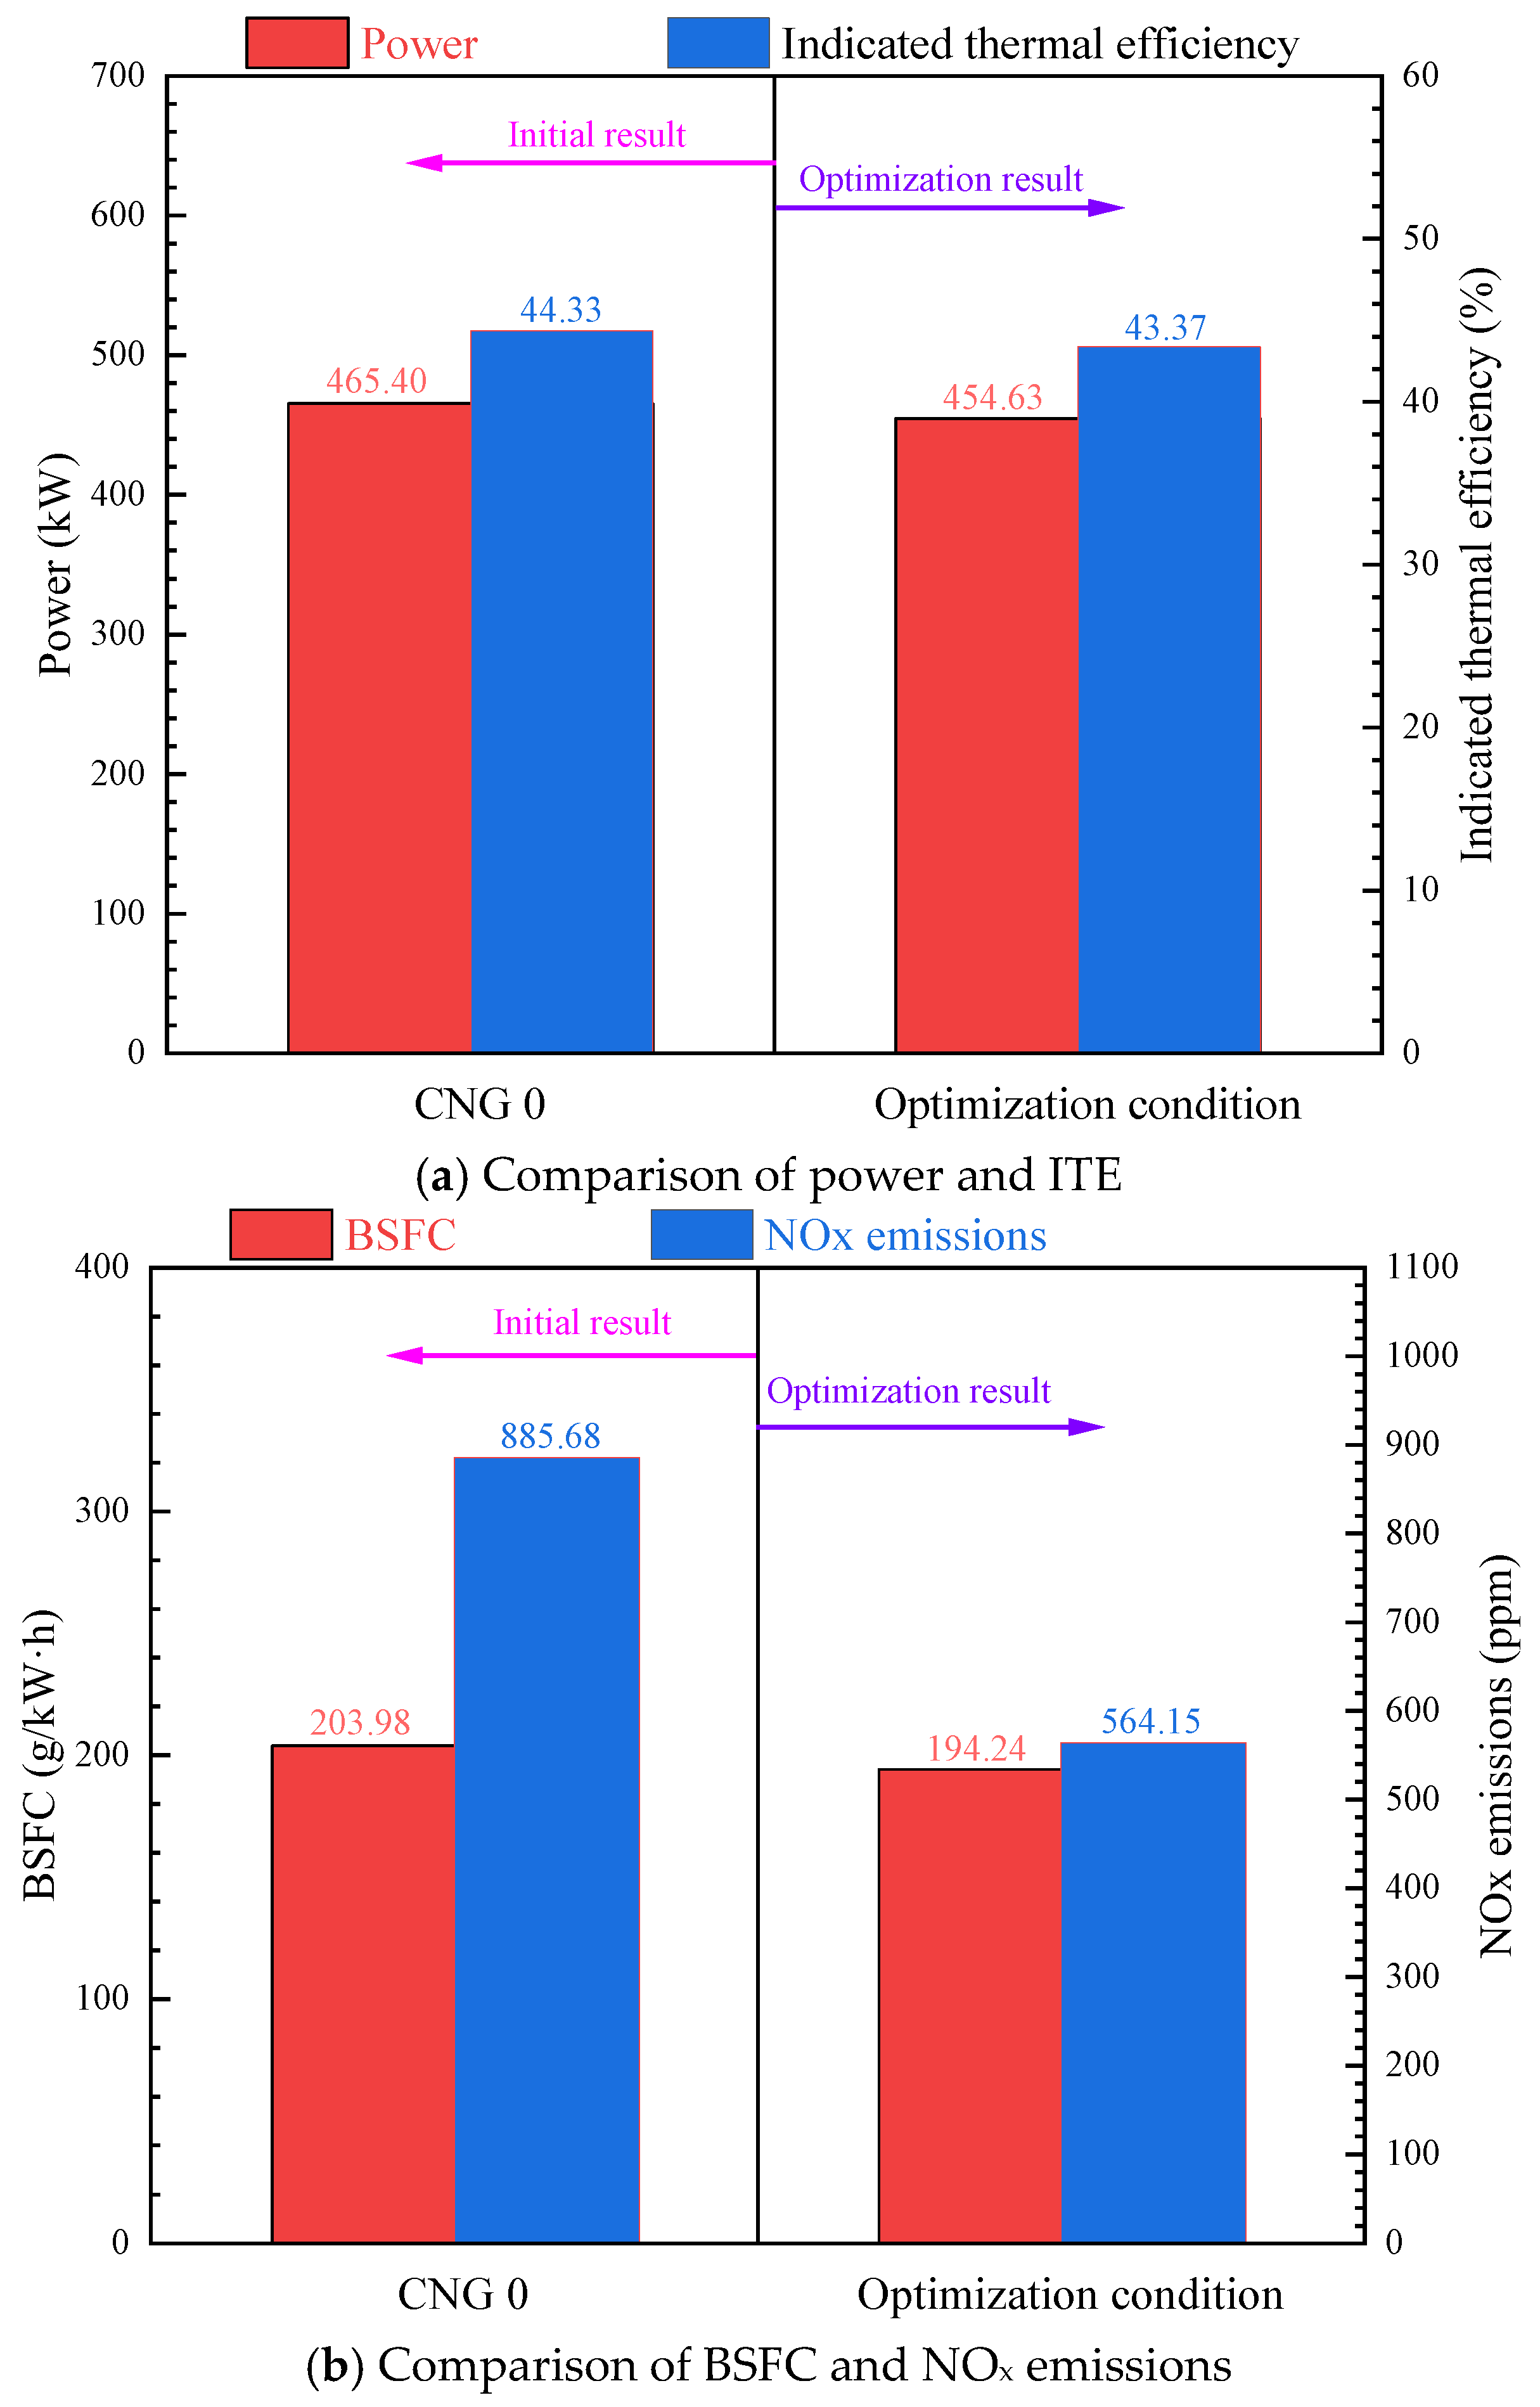
Similarly, comparing the optimized results with the pure diesel mode, the comparison results are displayed in
Figure 21. Power decreased by 2.315%, ITE decreased by 2.167%, and power performance decreased significantly, but BSFC decreased by 4.775% and NO
x emissions decreased by 36.303%, indicating that NO
x emissions were optimized to a considerable extent. Compared with the performance-oriented scheme, this strategy achieved a substantially lower NO
x emission level at the expense of a slight reduction in power output and fuel economy. Such a scheme may be more suitable for future operating scenarios with increasingly stringent emission regulations.
One limitation of the present study is that the RSM models were constructed based on simulation results obtained at NGSRs of 50% and 100% loads, with DIT ranging from 8 to 5 °CA BTDC and DID ranging from 6 to 20 °CA. Within this investigated range, the response surface models demonstrated good predictive capability and accurately represented the simulation results generated by the validated GT-SUITE v2016 model. However, the predictive accuracy of these models outside the investigated operating and parameter range has not been verified and may require further calibration and validation before practical application. In addition, it should be noted that the proposed dual-fuel combustion model was indirectly validated by comparison with published experimental heat release characteristics because dedicated dual-fuel experimental data for the investigated engine were unavailable. Although the predicted heat release profile agrees well with the published combustion behavior under similar combustion strategies and operating conditions, a direct quantitative validation against experimental measurements for the same engine could not be performed. Therefore, the optimized DIT and DID values obtained in this study should be regarded as engineering guidance for future diesel–natural gas dual-fuel experimental investigations rather than universally applicable optimal solutions. Future work will focus on conducting dual-fuel engine experiments to validate the simulation predictions and further assess the applicability of the proposed optimization strategy under practical operating conditions.