1. Introduction
Cross-laminated timber (CLT) has become one of the most important engineered wood products used in contemporary timber construction. It is manufactured from orthogonally arranged and adhesively bonded layers of dimension lumber, resulting in panels with high in-plane and out-of-plane load-bearing capacity, good dimensional stability, and a high degree of prefabrication. These properties make CLT suitable for wall, floor, and roof elements in residential, commercial, and public buildings, including multi-story timber and hybrid timber structures [
1,
2]. From an environmental perspective, CLT is also attractive because timber stores biogenic carbon and can reduce the embodied carbon of buildings when used as a substitute for more emission-intensive materials such as concrete and steel [
3]. These structural and sustainability advantages have contributed to the increasing use of CLT in modern building practice [
2,
4].
As the use of CLT expands from single structural elements to complex multi-layer wall and floor assemblies, fire performance can no longer be interpreted only at the level of the exposed timber panel. In real buildings, CLT is commonly combined with linings, service cavities, secondary timber frames, insulation layers and surface protection systems. These additional layers may improve fire protection, but they may also introduce new failure mechanisms related to concealed heating, cavity combustion, loss of protective integrity and delayed ignition of combustible components.
Despite these benefits, the combustible nature of wood remains a key fire safety issue. When exposed to heat, wood undergoes a sequence of thermal degradation processes, including moisture evaporation, pre-pyrolytic degradation of hemicellulose, active pyrolysis and combustion of cellulose and lignin, and oxidative degradation of the remaining char [
5,
6]. In CLT elements, the char layer formed during fire exposure has a dual role. It is a product of combustion, but it also acts as a protective layer that reduces heat transfer to the underlying virgin wood. This insulating effect helps CLT members retain part of their load-bearing capacity during fire exposure [
1,
7]. However, the apparent reduction rate of the CLT cross-section and the integrity of the protective char layer depend on several factors, including wood density, moisture content, heat flux, ventilation conditions, panel layup, adhesive performance at elevated temperature, and whether the surface is directly exposed or protected by encapsulation materials. The basic thermal degradation process of wood remains governed by moisture release, pyrolysis and char oxidation, but adhesive behavior and panel layup may influence char-layer integrity, lamella fall-off and renewed exposure of fresh timber.
One specific concern in CLT fire performance is the possible fall-off of charred layers or protective layers. Char fall-off may expose fresh wood to heat, increase the rate of fuel contribution, and in some cases contribute to renewed fire growth or a secondary increase in fire intensity [
4,
7]. The behavior of adhesive bond lines is particularly relevant in this context, as thermal degradation of the adhesive may influence the integrity of the charred layers. This issue has been particularly emphasized in European CLT fire-safety discussions and design approaches. In other jurisdictions, including North America, Japan, New Zealand and Australia, adhesive requirements and product approval procedures have been revised to reduce the likelihood of heat-induced delamination and char fall-off.
For this reason, many fire safety strategies for CLT rely on encapsulation with non-combustible or fire-resistant boards. Gypsum-based boards, including gypsum plasterboard and gypsum-fiber boards, are widely used because they delay heat transfer through dehydration and provide a temporary thermal barrier to the timber substrate [
8,
9]. Previous compartment and furnace studies have shown that encapsulated CLT assemblies can achieve substantial fire performance when the encapsulation remains intact; however, the performance depends strongly on board type, thickness, fixing method, joints, exposure conditions, and assembly detailing [
9,
10].
In practice, CLT wall systems are often incorporated into layered or sandwich-type assemblies. In such systems, the structural CLT panel may be separated from the external or internal lining by an installation cavity formed by a secondary frame. This cavity can accommodate services, insulation, or other functional layers, but it also introduces additional fire safety complexity. If the cavity contains combustible timber studs, these members may be heated through the lining and may undergo pyrolysis, glowing combustion, or flaming ignition. At the same time, the partially enclosed geometry of the cavity may restrict oxygen availability and allow smoke and volatile decomposition products to accumulate. As a result, the fire behavior of such assemblies cannot be assessed solely from the behavior of openly exposed CLT surfaces. It is governed by the interaction between temperature development, volatile generation, oxygen supply, cavity geometry, and the integrity of protective layers [
10,
11,
12].
Intumescent coatings are used mainly as surface-applied fire-protection systems intended to reduce ignitability, delay surface heating, limit flame spread and promote the formation of an insulating char layer. In timber applications, they are more commonly associated with reaction-to-fire improvement and delayed thermal degradation than with stand-alone fire-resistance classification of load-bearing assemblies. Typical intumescent formulations include an acid source, a carbon source, and a blowing agent. During thermal activation, the coating decomposes and expands, forming an insulating char layer while releasing gaseous decomposition products such as water vapor, carbon dioxide, ammonia, and other volatile compounds, depending on the formulation [
13,
14]. The protective effect of such coatings is influenced by application rate, dry film thickness, curing conditions, substrate properties, exposure intensity, and mechanical integrity of the expanded char. Previous studies have reported that intumescent coatings can delay the onset of wood charring, reduce the rate of mass loss, and increase residual char yield under laboratory-scale thermal exposure [
14,
15,
16,
17,
18]. However, their behavior in enclosed timber cavities may differ from that observed in open bench-scale tests.
Simultaneous thermal analysis (STA), combining thermogravimetry (TG), derivative thermogravimetry (DTG), and differential scanning calorimetry (DSC), is a useful method for characterizing the thermal degradation of wood, fire-retardant treatments, and coated wood substrates. In such measurements, TG records the overall mass change during heating, DTG identifies the temperature ranges with the highest mass-loss intensity, and DSC provides complementary heat-flow information related to endothermic and exothermic processes such as moisture release, coating activation, pyrolysis and oxidation. Previous studies have shown that thermal analysis can support the evaluation of fire-retardant and intumescent systems applied to wood by identifying degradation stages, changes in char yield, and differences in heat-flow behavior [
15,
16]. Although STA does not reproduce the geometry, ventilation, heat transfer, cracking, or flame conditions of a wall assembly test, it provides material-level information that can support the interpretation of larger-scale fire-test observations.
Despite the growing body of research on CLT fire performance, board encapsulation and intumescent coatings, most available studies evaluate either openly exposed timber, conventionally encapsulated CLT, or the material-level behavior of coated wood specimens. Considerably less attention has been paid to the coupled behavior of intumescent-coated CLT surfaces, combustible timber studs and partially enclosed installation cavities exposed to sustained radiant heating. This configuration is important because the protective layer may delay heat transfer to the CLT surface while the cavity itself may accumulate heat, smoke and volatile decomposition products. In such conditions, coating activation, volatile release, char formation, oxygen availability and the fire behavior of secondary combustible members may interact in ways that cannot be assessed from open-surface or bench-scale tests alone.
The present study addresses this issue through a comparative medium-scale experimental investigation of two CLT sandwich wall assemblies exposed to radiant heat flux. One assembly served as an uncoated reference specimen, while the second included PROMADUR® intumescent coating applied to the CLT surfaces. Both assemblies were monitored using thermocouples and visual observations during a 90 min exposure. In parallel, STA was performed on uncoated and coated CLT specimens under oxidative conditions to characterize their thermal decomposition behavior. The aim of this study was to compare the thermal and combustion response of an uncoated and an intumescent-coated CLT sandwich wall assembly under sustained medium-scale radiant exposure. The study specifically addressed three questions: (i) whether the PROMADUR® coating delays temperature increase at the CLT surface and in the wooden stud region; (ii) whether the coating modifies the observed combustion behavior inside the installation cavity; and (iii) whether STA data can support the interpretation of the assembly-level fire-test observations. The study was therefore designed as a comparative medium-scale assessment under a defined radiant heat-flux condition, not as a simulation of a fully developed standard fire or as a basis for assigning a fire-resistance rating.
2. Materials and Methods
2.1. Specimen Design and Materials
Two medium-scale sandwich wall specimens of identical nominal geometry were prepared for comparative fire testing. Each specimen had plan dimensions of 1.0 m × 1.0 m and consisted of a 90 mm thick three-ply cross-laminated timber panel manufactured from Norway spruce (Picea abies (L.) H. Karst.) laminations bonded with polyurethane adhesive. Norway spruce was selected because it is one of the most commonly used softwood species for structural timber and CLT production in Central Europe and represents a relevant material for regional timber construction practice. The tested panels represented a typical three-ply CLT configuration bonded with polyurethane adhesive. The certification status of the CLT product and adhesive system was not independently verified within this study; therefore, the results are interpreted as material- and assembly-specific observations for the tested specimens.
The CLT panel formed the load-bearing core of the assembly.
On both sides of the CLT panel, 12.5 mm gypsum-fiber boards were installed as protective linings. The gypsum-fiber boards were selected as board-based encapsulation layers commonly used in dry construction and fire-protection applications. The present study reports their nominal thickness and role in the tested assembly, while detailed manufacturer-specific classification data were not independently verified.
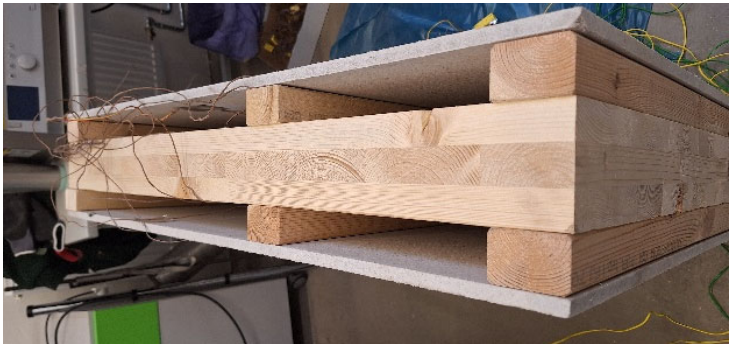
The boards were fixed to a secondary wooden stud frame made of 40 × 60 mm timber members. This configuration created a 40 mm installation cavity between the gypsum-fiber board and the CLT surface on each side of the panel. The total nominal thickness of the assembly was 195 mm. The wooden stud frame was included to represent a typical service cavity used in practical wall assemblies and to evaluate the thermal response of combustible framing members located within the cavity. The cross-section of both wall assemblies is shown in
Figure 1, and the main configuration parameters of Sample A and Sample B are summarized in
Table 1.
The assembly consisted of a 90 mm three-ply CLT panel, 12.5 mm gypsum-fiber boards, a 40 × 60 mm wooden stud frame, and a 40 mm installation cavity. Sample A was the uncoated reference assembly; Sample B had PROMADUR® intumescent coating (Etex Building Performance NV, Tisselt, Belgium) applied to the CLT surfaces facing the installation cavities.
The two specimens differed only in the surface treatment of the CLT panel. Sample A was used as the uncoated reference assembly. In Sample B, the CLT surfaces facing the installation cavities were treated with the PROMADUR® intumescent fire protection system. The coating was applied at a manufacturer-recommended application rate of 470 g/m2, corresponding to a wet film thickness of approximately 350–380 µm. After drying for approximately 24 h, PROMADUR® Top Coat Transparent (Etex Building Performance NV, Tisselt, Belgium) was applied at 100 g/m2 as a protective finishing layer. The topcoat was allowed to dry for approximately 8–10 h.
PROMADUR® was selected because it is a commercially available intumescent coating system intended for the surface protection of timber substrates. In this study, it was not evaluated as a stand-alone fire-resistance system, but as an additional protective layer applied to the CLT surfaces facing the installation cavities. PROMADUR® was selected because it is a commercially available intumescent coating system intended for the surface protection of timber substrates. In this study, it was evaluated only as an additional protective layer applied to the CLT surfaces facing the installation cavities, not as a stand-alone fire-resistance system. The choice of this coating was motivated by its practical availability and relevance for transparent or semi-transparent fire-protection applications on timber.
The nominal application rate and wet film thickness are reported because they were controlled during specimen preparation. The dry film thickness was not directly measured in this study. This should be considered a methodological limitation, as the fire-protective efficiency of intumescent coatings is commonly related to dry film thickness. The coated specimen was tested after the coating and topcoat had dried; however, the exact degree of chemical curing at the time of testing should be interpreted in relation to the manufacturer’s stated curing period.
The installation cavity was formed by the wooden stud frame and gypsum-fiber board lining. Its geometry, edge condition, and degree of enclosure are important for interpreting the observed fire behavior, because they influence heat transfer, smoke movement, oxygen availability, and the possible accumulation of volatile decomposition products. The cavity was therefore treated as a partially enclosed space rather than as an openly ventilated surface exposure. Any interpretation related to oxygen limitation or volatile accumulation is based on the observed assembly configuration and visual fire-test behavior, as oxygen concentration was not directly measured.
Only one specimen of each configuration was tested because the experiment was designed as an exploratory medium-scale comparative case study rather than as a statistically representative fire-resistance test series. The specimens were relatively large, instrumented wall assemblies requiring destructive testing, and the aim was to identify the main differences between the uncoated and coated configurations and to link the observed behavior with material-level STA results. Consequently, the results should be interpreted as comparative observations for the tested configuration, not as statistically generalized performance data.
The wall assemblies were stored under laboratory conditions before testing, but the moisture content of the CLT and wooden studs was not directly measured. This is a limitation of the study, because moisture content affects thermal inertia, initial mass loss and the onset of pyrolysis. The early STA mass loss should therefore be interpreted as indicative of moisture release under the tested material condition rather than as a controlled moisture-content comparison.
2.2. Medium-Scale Radiant Fire Exposure Test
Fire testing was performed in a medium-scale test chamber with internal dimensions of 1670 mm × 550 mm × 2010 mm. The heat source was a SGNF 100 propane–butane burner equipped with an automatic SIEMENS LME 41.092C2 burner control unit (Siemens AG, Munich, Germany). The burner system operated at a gas inlet pressure of 30–50 mbar. The radiant panel was preheated for 20 min before specimen exposure. After preheating, the panel surface temperature reached approximately 1000 °C.
The specimens were positioned at a distance of 200 mm from the radiant panel face. A nominal radiant heat flux of 20 kW/m2 was applied during the 90 min exposure. This exposure was selected to provide a sustained and repeatable medium-scale thermal load for comparative evaluation of the two assemblies. The test setup was not a standard furnace test and did not reproduce a full standard temperature–time fire curve.
The radiant heat flux of 20 kW/m2 and the 200 mm specimen distance were selected to provide a stable and sustained medium-scale radiant exposure suitable for comparative assessment of the two wall assemblies. This exposure level was not intended to reproduce a fully developed standard fire. It represents a moderate radiant heating condition that enables observation of gypsum-fiber board cracking, heat transfer into the cavity, coating activation and delayed combustion processes without immediate destruction of the assembly. The exposure severity is therefore lower than that of a standard furnace fire, and the results should be interpreted within this defined comparative test condition.
The insulation temperature criterion of STN EN 1363-1 was used only as a benchmark for evaluating the temperature rise on the unexposed face. According to this criterion, the temperature rise on the unexposed surface should not exceed 140 K on average or 180 K at any individual measuring point above the initial temperature. Accordingly, the insulation criterion was used only as a temperature-rise benchmark for comparing the unexposed-face response of the two specimens. It was not used to assign an integrity and insulation (EI) rating or any other formal fire-resistance classification, because the specimen size, heating regime and test configuration did not correspond to a standard furnace fire-resistance test.
Temperature development was monitored for 90 min using nickel-chromium (Ni-Cr) type K thermocouples connected to an Almemo 710 data logger (Ahlborn Mess- und Regelungstechnik GmbH, Holzkirchen, Germany). The thermocouples were stainless-steel sheathed type K thermocouples suitable for the expected temperature range of the test. Thermocouple junctions and leads located near the exposed region were protected using refractory tape. The selected thermocouple protection was considered adequate for the measured temperature range, which remained substantially below the maximum service temperature declared for the thermocouple insulation/protective sheath.
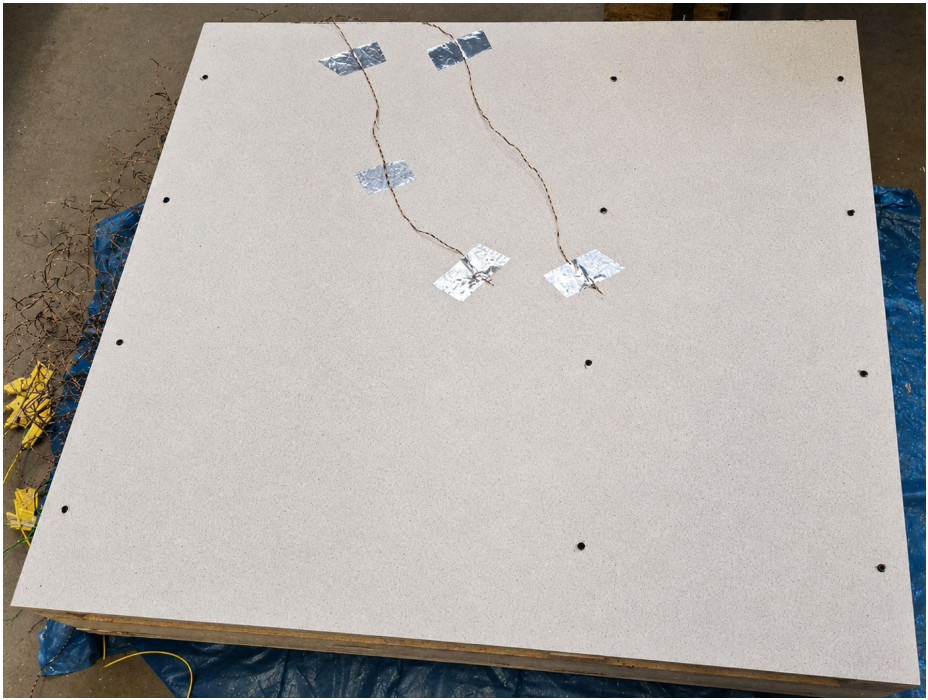
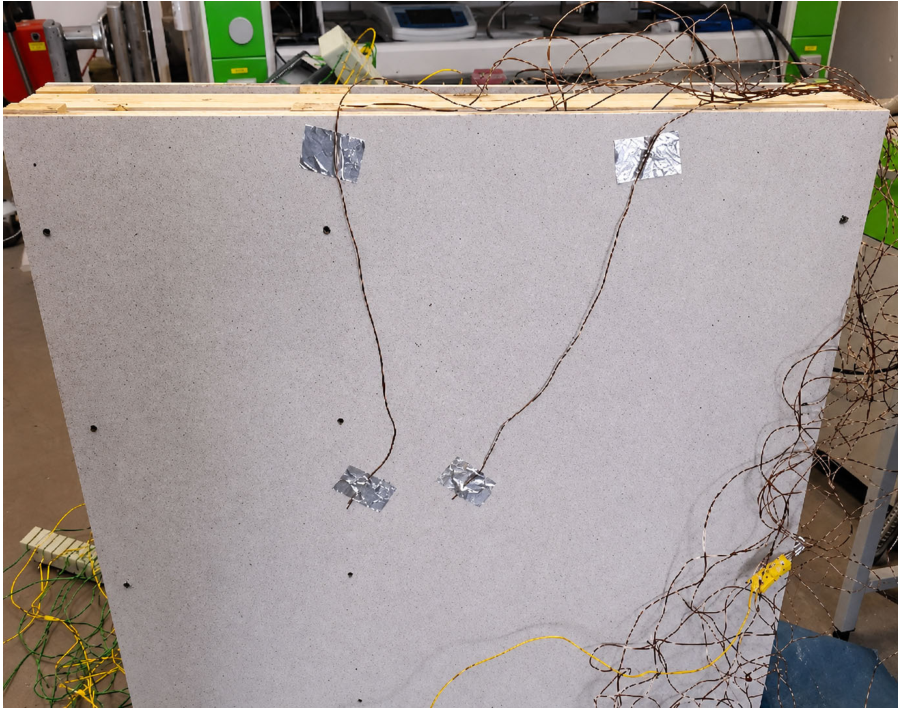
Data were recorded at 15 s intervals. Twelve thermocouples were installed in each specimen in two vertical measurement planes. One plane passed through the center of the specimen, and the second passed through the region of the central wooden stud. This arrangement enabled comparison of the thermal response through the general wall section and through the zone influenced by the combustible stud.
The thermocouple layout for Sample A is shown in
Figure 2, and the corresponding layout for Sample B is shown in
Figure 3. The same thermocouple designation and positioning were used for both specimens to allow direct comparison between the uncoated and coated assemblies.
Thermocouples T1, T3, T5, T7, T9, and T11 were positioned in the measurement plane passing through the wooden stud. Thermocouples T2, T4, T6, T8, T10, and T12 were positioned in the central measurement plane. The thermocouples were arranged from the exposed gypsum-fiber board face towards the installation cavity, CLT panel, and unexposed gypsum-fiber board face.
The thermocouple designation and positioning corresponded to those used for Sample A, allowing direct comparison between the uncoated and coated specimens. The CLT surfaces facing the installation cavities were protected with the PROMADUR® intumescent coating system.
The central-plane thermocouples were used to monitor the temperature profile through the exposed gypsum-fiber board, the installation cavity, the CLT surface, the CLT body, and the unexposed side. The stud-plane thermocouples were used to monitor temperatures in the region where the gypsum-fiber board, wooden stud, installation cavity, and CLT surface interacted. The measurement planes and the purpose of the thermocouple groups are summarized in
Table 2.
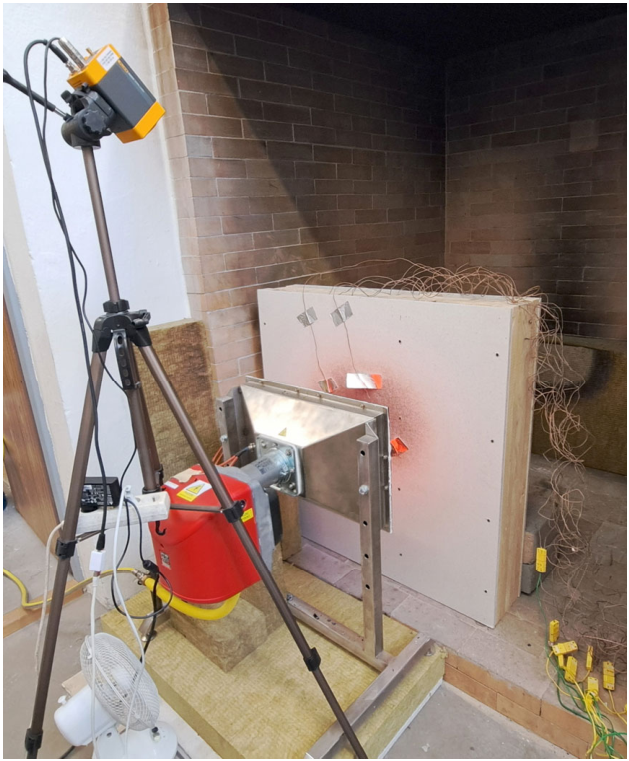
The medium-scale radiant exposure setup and specimen placement are shown in
Figure 4. The medium-scale radiant fire exposure setup consisted of radiant panel with dimensions of 500 mm × 300 mm installed in the test chamber with internal dimensions of 1670 mm × 550 mm × 2010 mm.
Visual observations were recorded during the tests, including cracking of the gypsum-fiber board, smoke release, intumescent foam development, glowing combustion, flaming combustion, and post-test degradation patterns. Thermal imaging was also carried out using a FLUKE RSE600 infrared camera (Fluke Corporation, Everett, WA, USA) to support the interpretation of surface temperature fields and localized heating zones.
The combustion gas extraction system of the test chamber had a diameter of 250 mm. Although smoke release and flame behavior were visually documented, oxygen concentration, gas composition, and heat release rate were not measured. Consequently, interpretations related to oxygen-limited combustion, volatile accumulation, and gaseous decomposition products should be understood as qualitative and mechanistic interpretations supported by temperature data, visual observations, and STA results, rather than as direct gas-analytical evidence.
2.3. Simultaneous Thermal Analysis (STA)
The thermal degradation behavior of both CLT samples, i.e., uncoated (Sample A, reference) and PROMADUR®-coated (Sample B), was characterized by simultaneous thermal analysis (STA) combining thermogravimetry (TG) and differential scanning calorimetry (DSC). Measurements were carried out on a NETZSCH STA 509 CLASSIC instrument (NETZSCH-Gerätebau GmbH, Selb, Germany) at the Department of Fire Protection, Faculty of Wood Sciences and Technology, Technical University in Zvolen.
Small specimens of approximately 5 × 5 mm were cut from the surface layer of each CLT panel: from the uncoated CLT panel (Sample A) and from the CLT panel coated with the PROMADUR® intumescent system (Sample B), including the dried coating layer. The specimens were placed in open aluminum oxide (Al2O3) crucibles (NETZSCH-Gerätebau GmbH, Selb, Germany) with a volume of 85 µL. Sample masses were 11.2 mg (Sample A) and 12.0 mg (Sample B).
The STA specimens were analyzed as whole small composite material samples, including wood and, in Sample B, the dried coating layer present on the surface. Therefore, STA does not isolate the coating response alone. Instead, it provides a comparative material-level response of the uncoated wood specimen and the coated wood–coating system under the same heating program and oxidative atmosphere.
Each measurement was performed under an oxidative atmosphere simulating fire-relevant conditions. Purge gas 1 (oxygen—O2) was supplied at a flow rate of 252.5 mL/min, purge gas 2 (N2) at 250.0 mL/min, and the protective gas (nitrogen—N2) at 250.0 mL/min. The temperature program consisted of a single dynamic heating segment from 25 °C to 500 °C at a constant heating rate of 25 K/min. The upper temperature of 500 °C and the heating rate of 25 K/min were selected to capture the main degradation stages relevant to moisture release, coating activation, wood pyrolysis and early char oxidation within a controlled STA program. These parameters were not intended to reproduce the transient heating conditions of a fully developed fire. The STA results are therefore used to support mechanistic interpretation of material degradation, not to simulate the wall-assembly fire exposure directly.
Raw data exported from the instrument included temperature (°C), time (min), DSC signal (µV/mg), and relative mass (%), recorded at 0.25 min intervals. The derivative thermogravimetric (DTG) curve (%/°C) was calculated numerically from the smoothed TG signal using a five-point moving average, and the rate of mass loss was expressed as a function of temperature.
The use of TG/DTG/DSC for evaluating coated wood materials is consistent with previous studies in which thermal analysis was applied to assess degradation stages, residual mass formation, and the protective action of fire-retardant or intumescent systems on wood substrates [
15,
16].
3. Results
3.1. Medium-Scale Fire Exposure Test—Sample A, Uncoated Reference Assembly
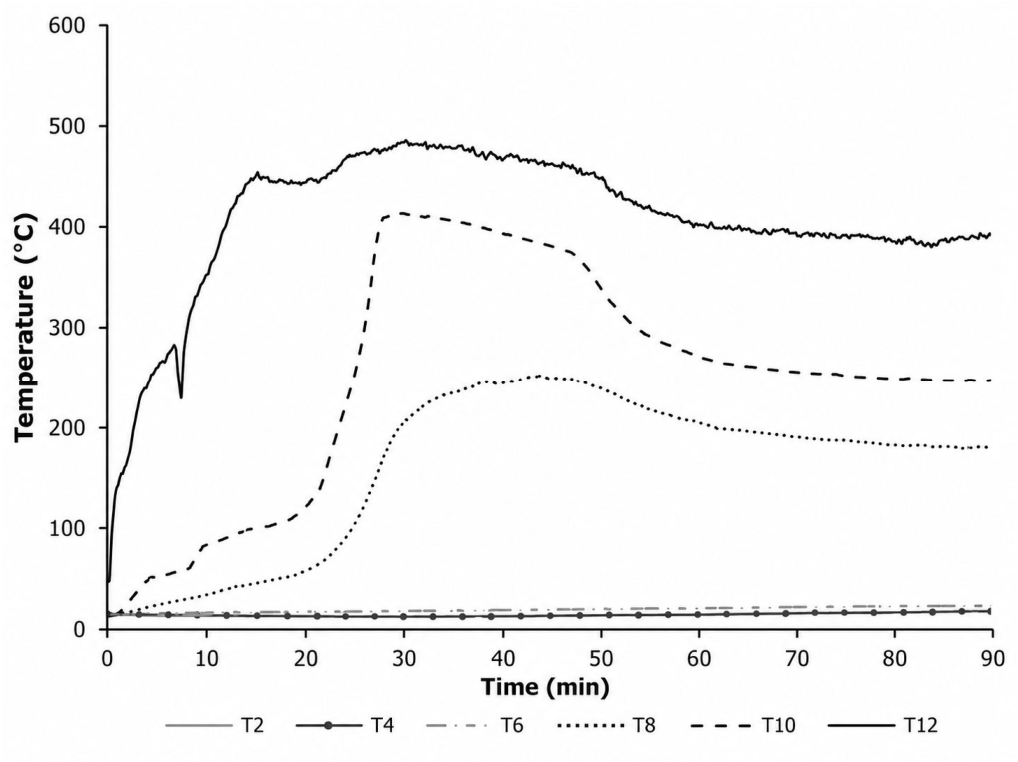
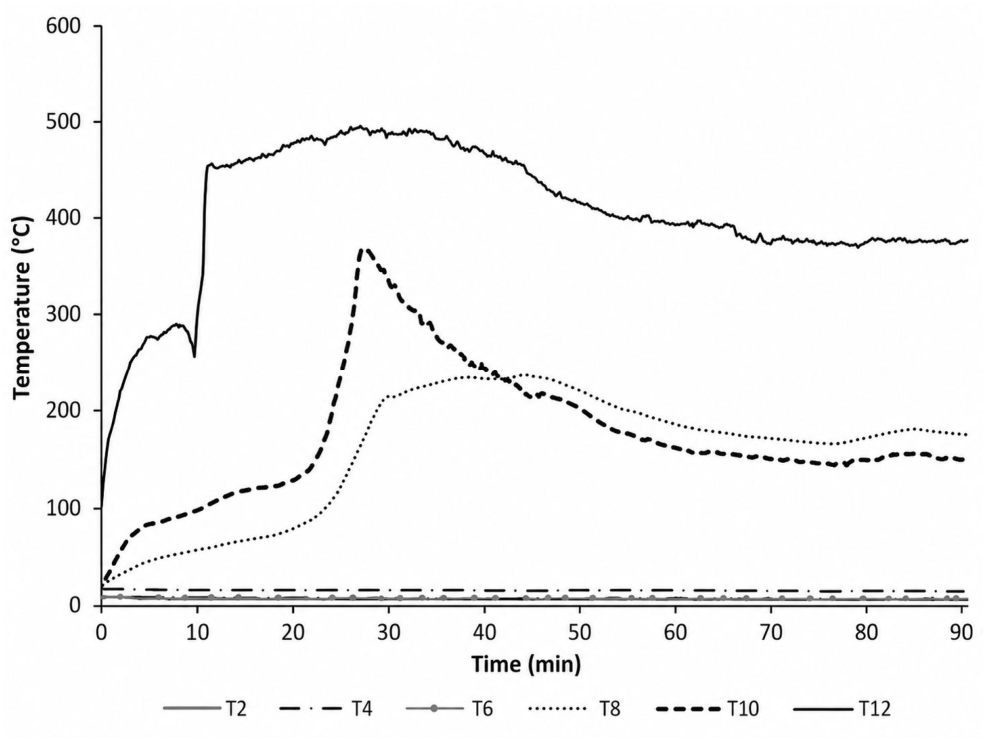
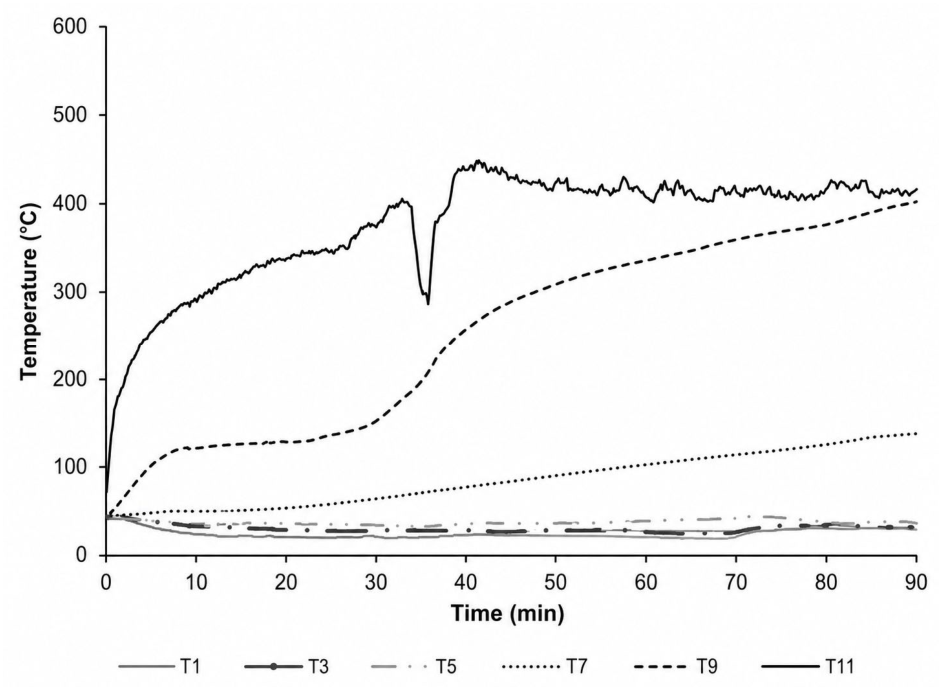
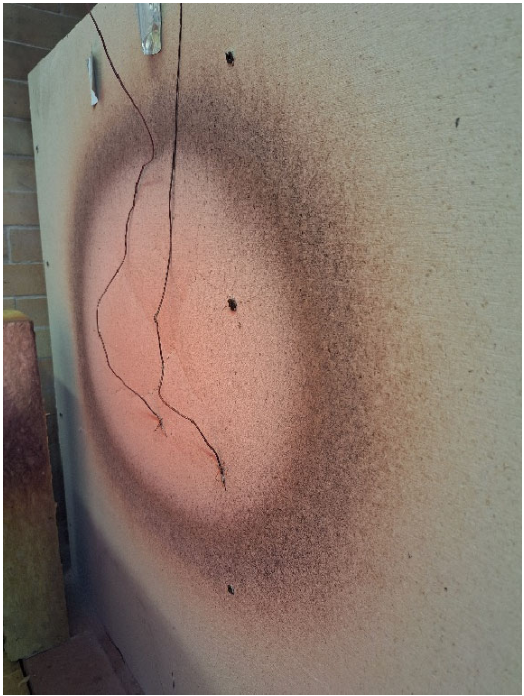
The temperature and crack development recorded in the uncoated reference specimen, Sample A, is shown in
Figure 5,
Figure 6 and
Figure 7.
Figure 5 presents the temperature–time profiles recorded through the central section of the assembly, while
Figure 7 presents the profiles recorded in the plane passing through the wooden stud.
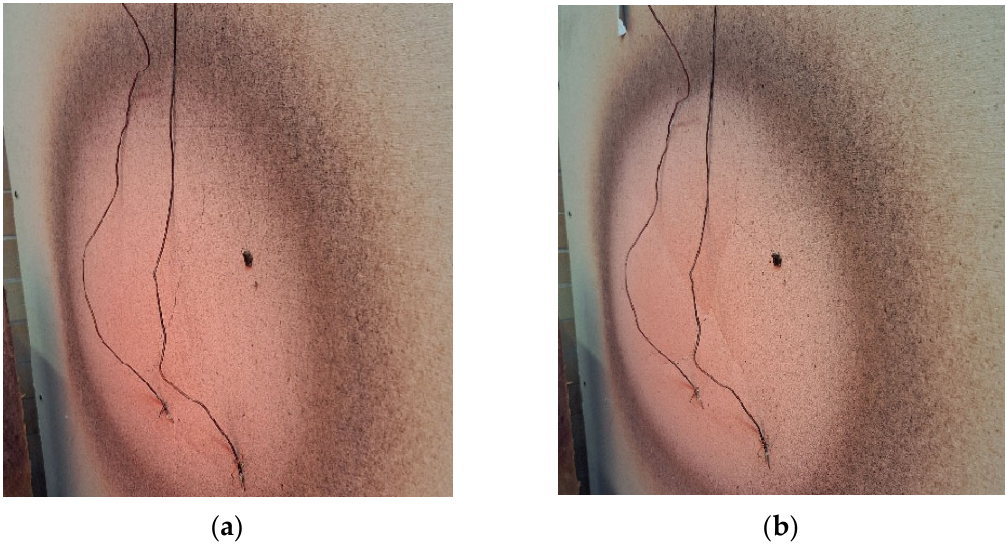
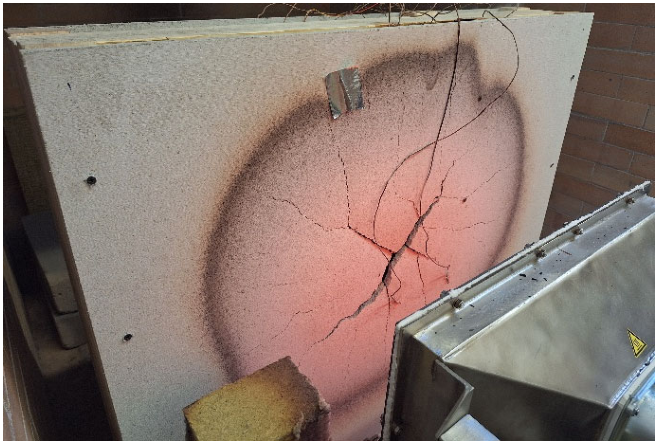
The first visible crack in the exposed gypsum-fiber board of Sample A appeared after approximately 26 min of exposure. This occurred slightly later than in Sample B. A wood odor was detected at approximately 32 min. At approximately 35 min, smoke release from the installation cavity became more intensive, and branching of the crack in the gypsum-fiber board was observed. The crack development is shown in
Figure 6.
In the central section of Sample A, the CLT surface temperature increased during the early phase of exposure and reached a maximum value of 250.6 °C at approximately 43 min. After this maximum, the temperature at this location gradually decreased until the end of the test. No flaming combustion was observed in the central installation cavity during the 90 min exposure.
The temperature–time profiles recorded in the stud plane are shown in
Figure 7.
The thermocouples monitored the thermal response in the region influenced by the wooden stud and the adjacent installation cavity.
At approximately 54 min, the temperature in the stud region reached approximately 400.1 °C. This event occurred earlier in Sample A than in Sample B, where the corresponding temperature level in the stud region was reached only near the end of the exposure. Glowing combustion of the wooden stud in Sample A was first observed at approximately 60 min. However, unlike Sample B, no transition to flaming combustion was observed during the 90 min test.
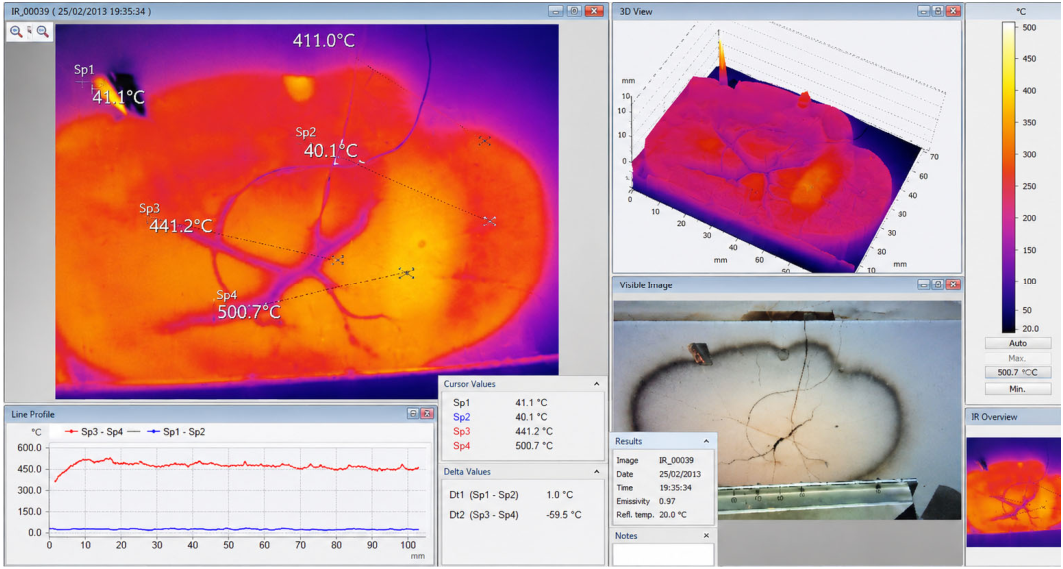
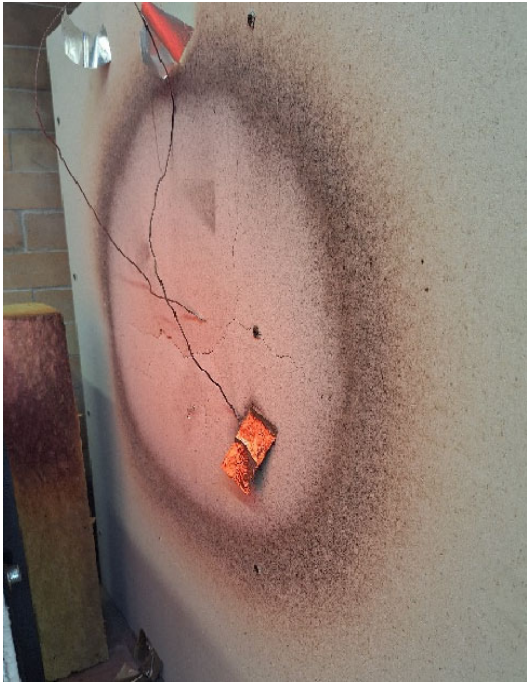
Thermal imaging performed at approximately 70 min confirmed a localized elevated temperature field in the region of the gypsum-fiber board crack and near the wooden stud. The thermal image and corresponding visual condition of the exposed surface are shown in
Figure 8 and
Figure 9.
The elevated temperature field is visible near the gypsum-fiber board crack and in the region of the wooden stud.
At the end of the 90 min exposure, glowing of the wooden stud was still visible at its contact region with the gypsum-fiber board, but no flaming combustion occurred in the installation cavity. This condition is shown in
Figure 10.
Luminous glowing of the wooden stud is visible near its contact with the gypsum-fiber board. No flaming combustion was observed during the test.
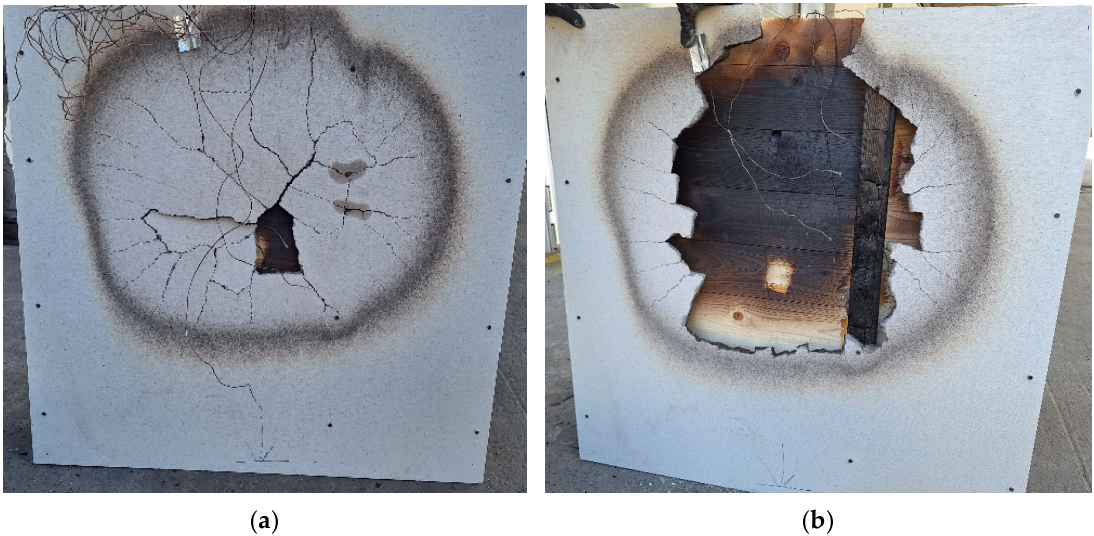
Post-test inspection showed surface carbonization and blackening of the exposed CLT surface, but no visually apparent structural degradation of the CLT panel in the observed region. The final condition of Sample A is shown in
Figure 11.
During the 90 min exposure, the temperatures recorded on the unexposed face of Sample A did not exceed the insulation temperature limits used as a benchmark according to STN EN 1363-1. Therefore, under the applied medium-scale radiant exposure, Sample A satisfied the insulation temperature criterion for the full test duration. As with Sample B, this result should not be interpreted as a formal fire resistance classification.
3.2. Medium-Scale Fire Exposure Test—Sample B, PROMADUR®-Coated Assembly
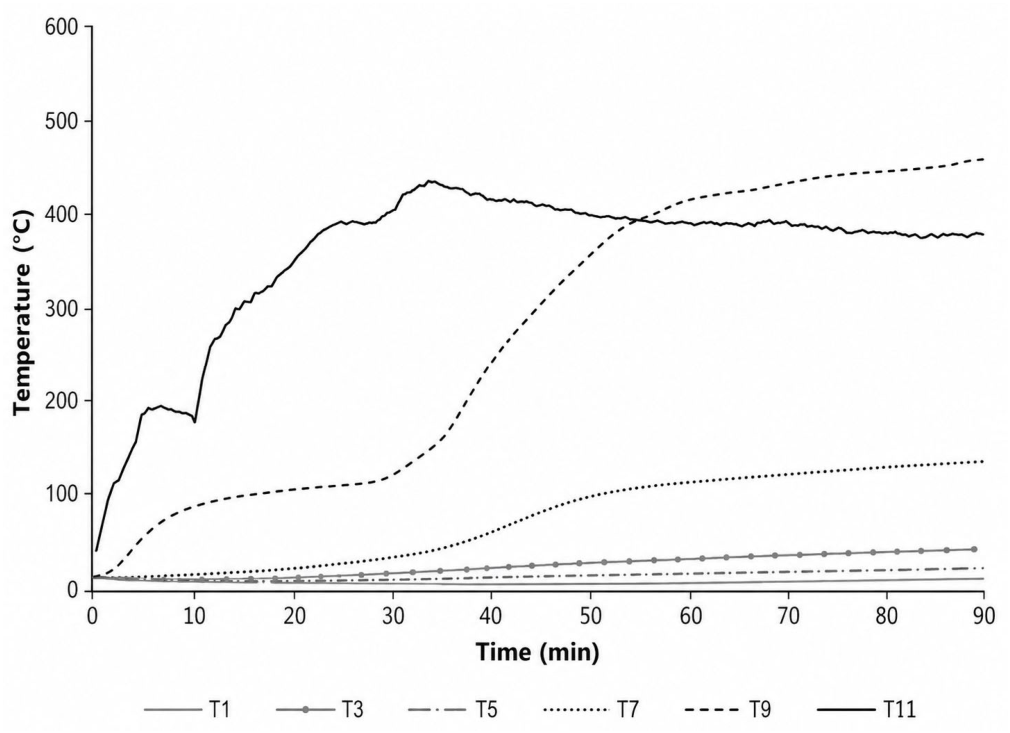
The temperature development recorded in Sample B during the 90 min medium-scale radiant exposure is shown in
Figure 12 and
Figure 13.
Figure 12 presents the temperature–time profiles recorded through the central section of the specimen, while
Figure 13 presents the profiles recorded in the vertical plane passing through the wooden stud.
The thermocouples monitored the temperature gradient from the exposed gypsum-fiber board face, through the installation cavity and CLT region, towards the unexposed side of the assembly.
The first visible crack on the exposed gypsum-fiber board was observed after approximately 22 min of exposure. The crack was initially fine, but it gradually widened during the subsequent phase of heating. At approximately 30 min, intensive smoke release from the installation cavity was observed. At this time, the temperature recorded at the CLT surface in the central measurement plane reached 158.9 °C. Progressive crack development on the exposed board surface was observed between 26 and 37 min, as shown in
Figure 14 and
Figure 15.
A fine crack is visible on the exposed gypsum-fiber board surface.
The crack on the exposed gypsum-fiber board surface had widened, and the first visible signs of intumescent foam development were observed on the CLT surface inside the installation cavity.
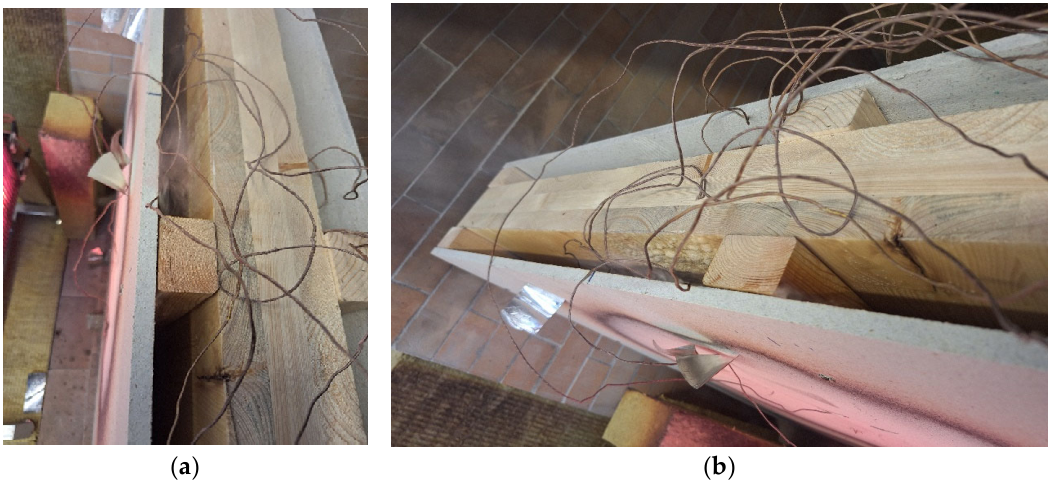
Between approximately 40 and 44 min, visible swelling of the PROMADUR
® intumescent coating was observed on the CLT surface inside the installation cavity. Smoke release from the cavity continued during this period. The internal appearance of the cavity during this stage is shown in
Figure 16.
In
Figure 16a, the visible expansion of the PROMADUR
® intumescent coating on the CLT surface is evident. In
Figure 16b, there is visible expansion of the PROMADUR
® intumescent coating on the CLT surface.
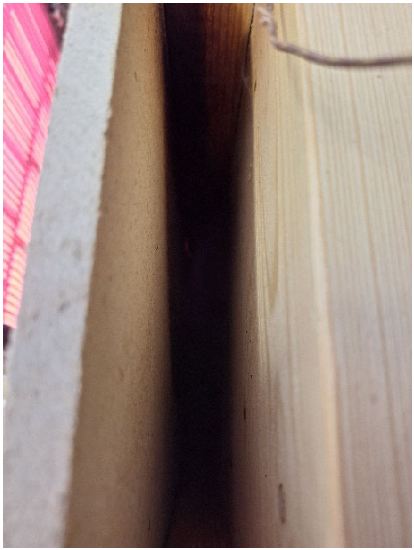
Because the intumescent layer developed inside the narrow installation cavity, its visual documentation was limited by the accessibility and viewing angle. The expanded coating was observed on the CLT surface facing the cavity, mainly in the region adjacent to the wooden stud.
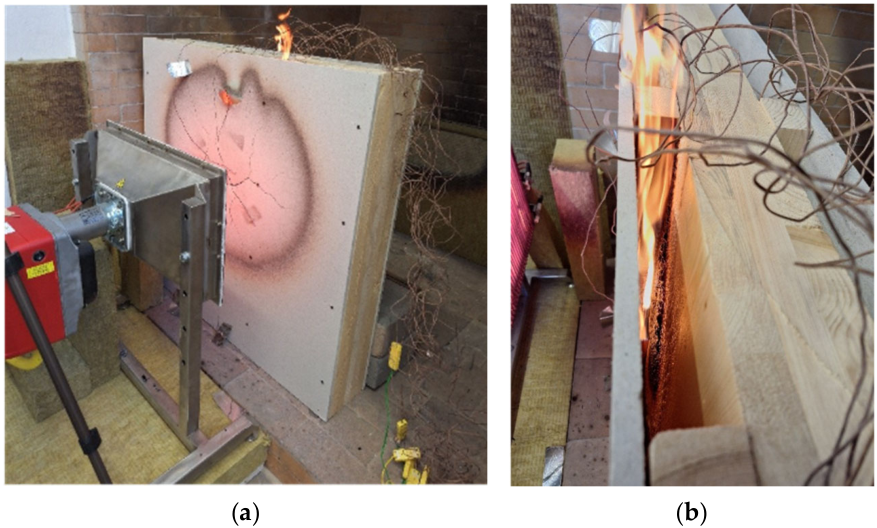
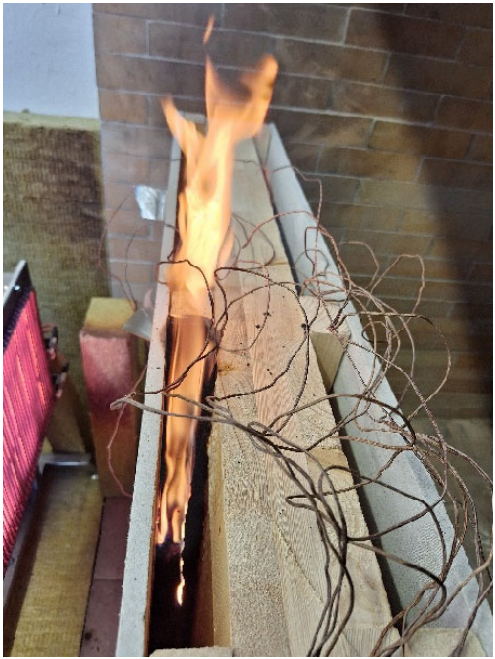
At approximately 60 min, intensive smoke release from the installation cavity was still visible. The temperature recorded at the CLT surface in the central section was 183.1 °C. Between approximately 65 and 72 min, glowing of the wooden stud was observed. Flaming combustion of the wooden stud was first observed at approximately 75 min. The flame then developed locally within the installation cavity, mainly in the region adjacent to the wooden stud. This stage is documented in
Figure 17.
At approximately 87 min, more intensive flaming was observed in the installation cavity near the wooden stud. Local degradation of the intumescent char and thermal damage to the adjacent CLT surface were visible. The specimen condition during this phase is shown in
Figure 18.
Intensive flaming was observed in the installation cavity near the wooden stud, with visible thermal degradation of the adjacent CLT surface.
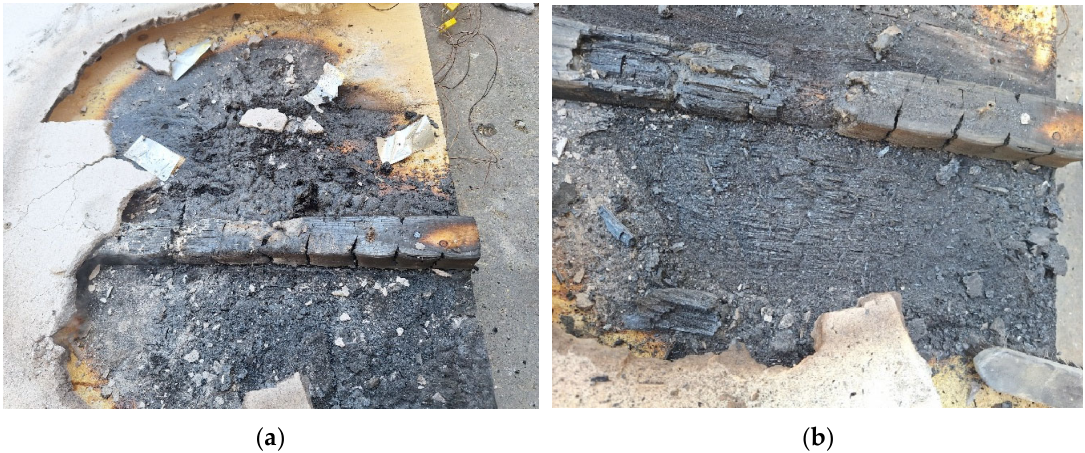
The test was terminated after 90 min. Post-test inspection confirmed degradation of the expanded intumescent layer on the CLT surface and thermal damage to the wooden stud. Local thermal degradation of the CLT surface was also observed in the region affected by cavity flaming. The post-test condition of Sample B is shown in
Figure 19.
During the 90 min exposure, the temperatures recorded on the unexposed face of Sample B did not exceed the insulation temperature limits used as a benchmark according to STN EN 1363-1. Therefore, under the applied medium-scale radiant exposure, Sample B satisfied the insulation temperature criterion for the full test duration. This result should not be interpreted as a formal fire resistance classification.
3.3. Comparison of Main Fire-Test Observations
The two specimens showed different thermal and combustion behavior during the 90 min exposure. Sample B, protected with the PROMADUR® intumescent coating, showed lower temperatures in selected regions of the assembly during the intermediate phase of exposure and delayed the development of high temperatures in the stud region. The critical temperature event in the stud region occurred approximately 35 min later in Sample B than in Sample A.
However, Sample B also exhibited a transition from glowing to flaming combustion of the wooden stud at approximately 75 min. This flaming developed locally in the installation cavity and led to degradation of the expanded intumescent layer and adjacent CLT surface. In contrast, Sample A showed higher early CLT surface temperatures and earlier glowing of the wooden stud, but no flaming combustion was observed during the test.
A summary of the main observed events is provided in
Table 3.
3.4. Simultaneous Thermal Analysis
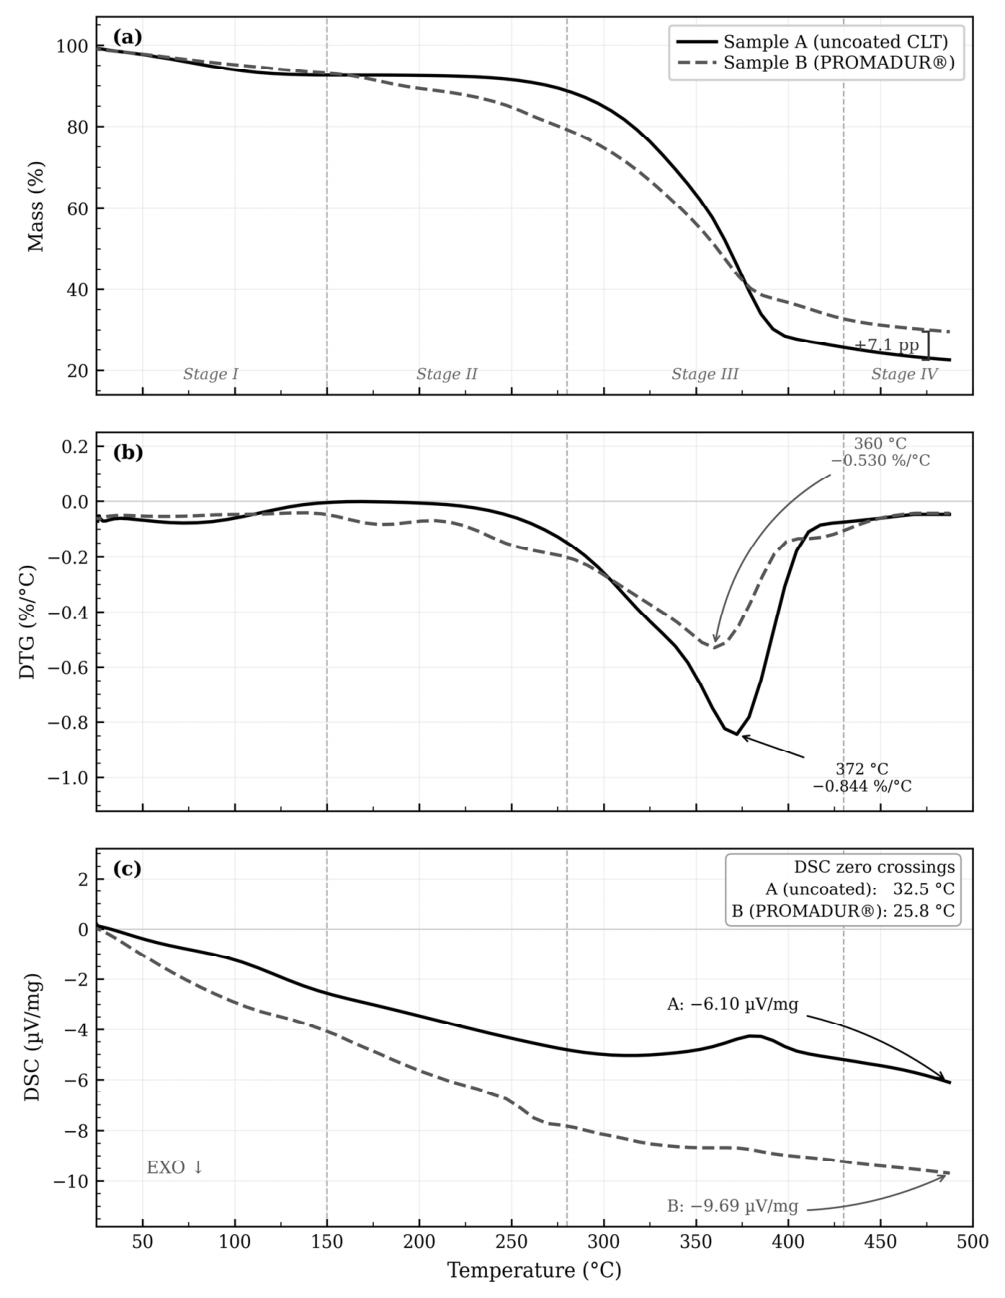
The TG, DTG, and DSC curves obtained from simultaneous thermal analysis of the uncoated and PROMADUR
®-coated CLT specimens are shown in
Figure 20. The results were evaluated over four temperature regions corresponding to the main stages of thermal degradation: moisture evaporation, pre-pyrolytic degradation and coating activation, main pyrolysis and combustion, and char oxidation.
Vertical dashed lines indicate the approximate boundaries between the main degradation stages at 150, 280, and 430 °C.
The main STA parameters are summarized in
Table 4.
Overall, the STA results showed three main differences between the uncoated and coated CLT specimens. First, the coated specimen exhibited greater mass loss in the 150–280 °C range, which is consistent with intumescent activation and the release of volatile or gaseous decomposition products. Second, the coated specimen showed a lower peak DTG rate during the main degradation stage, indicating a reduced maximum mass-loss intensity. Third, the coated specimen retained a higher residual mass at the end of the evaluated temperature range, supporting the formation of a protective solid residue. These results provide material-level support for interpreting the delayed heating observed in the coated wall assembly, but they do not reproduce the cavity-fire behavior observed at the assembly level.
TG curves (
Figure 20a) show relative mass as a function of temperature; DTG curves (
Figure 20b) show the rate of mass loss as a function of temperature; and DSC curves (
Figure 20c) show heat-flow response during heating under oxidative conditions.
3.4.1. Stage I—Moisture Evaporation (25–150 °C)
In the first temperature region, both specimens exhibited mass loss associated mainly with the release of free and bound moisture. Sample A lost 6.6 percentage points of its initial mass up to 150 °C, retaining 92.6% of its initial mass. Sample B lost 5.9 percentage points and retained 93.2% at 150 °C.
The difference between the two specimens in this stage was relatively small. Sample B retained 0.6 percentage points more mass than Sample A at 150 °C. The DSC signal showed no pronounced peak in this stage.
3.4.2. Stage II—Pre-Pyrolytic Degradation and Intumescent Reaction (150–280 °C)
The most pronounced difference between the two specimens in the lower-temperature region occurred between 150 and 280 °C. Sample A lost 4.2 percentage points of mass in this interval, decreasing from 92.6% at 150 °C to 88.4% at 280 °C. Sample B lost 13.4 percentage points, decreasing from 93.2% to 79.8% over the same temperature range.
At 200 °C, Sample A retained 92.5% of its initial mass, whereas Sample B retained 89.3%. At 250 °C, Sample A retained 91.3%, while Sample B retained 85.2%. The DTG values also differed. At 200 °C, the DTG rate was −0.006%/°C for Sample A and −0.071%/°C for Sample B. At 250 °C, the DTG rate was −0.060%/°C for Sample A and −0.150%/°C for Sample B.
These results show that the coated specimen underwent more intensive mass loss in the 150–280 °C range than the uncoated specimen. This temperature range corresponds to the interval in which intumescent coating activation was also visually observed during the fire test.
3.4.3. Stage III—Main Pyrolysis and Combustion (280–430 °C)
The largest mass loss occurred in the 280–430 °C interval for both specimens. Sample A decreased from 88.4% at 280 °C to 25.6% at 430 °C, corresponding to a mass loss of 62.8 percentage points. Sample B decreased from 79.8% to 32.6%, corresponding to a mass loss of 47.2 percentage points.
The peak DTG rate of Sample A was −0.844%/°C at approximately 372 °C. The peak DTG rate of Sample B was −0.530%/°C at approximately 360 °C. Thus, the coated specimen showed a lower maximum rate of mass loss than the uncoated specimen. The peak temperature of the coated specimen was also shifted to a slightly lower temperature.
At 300 °C, Sample A retained 85.7% of its initial mass, while Sample B retained 75.2%. At 400 °C, the trend was reversed: Sample A retained 28.5%, while Sample B retained 36.9%. This indicates that the coated specimen lost more mass in the lower-temperature interval but retained more solid residue after the main degradation stage had progressed.
3.4.4. Stage IV—Char Oxidation (430–500 °C)
Above 430 °C, both specimens showed further mass loss associated with oxidation of the remaining carbonaceous residue. The mass loss in this interval was similar for both specimens. Sample A decreased from 25.6% at 430 °C to 22.5% at 487 °C, while Sample B decreased from 32.6% to 29.6%.
At the end of the evaluated temperature range, Sample B retained 29.6% of its initial mass, whereas Sample A retained 22.5%. The coated specimen therefore showed a 7.1 percentage point higher residual mass than the uncoated specimen. This result indicates greater solid residue formation in the coated CLT specimen under the applied STA conditions.
Because the STA measurement was evaluated up to 487 °C, the term “residual mass at 487 °C” is used here instead of “final char yield.” The value should be interpreted as the residual mass under the specific STA program and oxidative atmosphere used in this study.
3.5. Summary of STA Mass Loss by Degradation Stage
The mass loss values calculated for the four degradation stages are summarized in
Table 5.
The coated specimen showed greater mass loss than the uncoated specimen in Stage II, but lower mass loss in Stage III. At the end of the evaluated STA temperature range, the coated specimen retained more residual mass than the uncoated specimen.
These STA results provide material-level data that support comparison of the uncoated and coated CLT materials. However, they should not be interpreted as a direct reproduction of the wall-assembly fire test, because the STA specimens were small, uniformly heated, and tested under controlled oxidative conditions without the geometry, ventilation, cracking, or flame spread conditions present in the medium-scale assembly test.
4. Discussion
4.1. Fire Performance Under Medium-Scale Radiant Exposure
Both tested assemblies satisfied the insulation temperature criterion of STN EN 1363-1 during the full 90 min exposure. However, this result should be interpreted strictly within the conditions of the present medium-scale radiant exposure test. The experiment was not a standard furnace fire resistance test and therefore does not provide a formal fire resistance classification. Rather, the criterion was used as a benchmark for comparing the thermal response of the uncoated and PROMADUR®-coated assemblies.
The applied radiant heat flux of 20 kW/m2 represents a moderate thermal exposure and is substantially less severe than the exposure associated with a standard fire-resistance furnace test. Therefore, the 90 min duration of the present test should not be compared directly with 90 min of standard fire resistance. The value of the test lies in the controlled comparison of two otherwise identical wall assemblies under the same sustained radiant exposure, rather than in reproducing a fully developed compartment fire. The results should therefore be interpreted as medium-scale comparative evidence for the tested configuration.
At first sight, the uncoated reference assembly may appear to have performed better than the coated assembly because no flaming combustion was observed in Sample A, whereas Sample B developed flaming of the wooden stud at approximately 75 min. However, the comparison is more complex. Sample B showed delayed development of high temperatures in the stud region and lower temperatures in selected regions during the intermediate stage of exposure, indicating a thermal-protection benefit of the intumescent coating. At the same time, the coated assembly later developed local flaming in the cavity, followed by degradation of the expanded char and adjacent CLT surface. The results therefore show that improved thermal protection of the CLT surface does not necessarily eliminate fire risk in a partially enclosed cavity containing combustible secondary framing. The uncoated assembly showed earlier heating and glowing, whereas the coated assembly showed delayed heating but a later transition to flaming.
The results confirm that the tested sandwich configuration, consisting of a 90 mm CLT panel encapsulated with gypsum-fiber boards and separated by a 40 mm installation cavity, was able to limit heat transfer to the unexposed face during the 90 min test. This is consistent with previous findings showing that board-based encapsulation can substantially delay heat transfer to CLT and reduce the contribution of timber to fire development, provided that the encapsulation remains sufficiently intact [
9,
10]. Nevertheless, the two specimens exhibited different internal thermal responses and different combustion behavior inside the installation cavity. This demonstrates that compliance with an insulation temperature benchmark on the unexposed face does not necessarily describe the full fire behavior of concealed combustible components within the wall assembly.
The coated specimen delayed the development of high temperatures in the stud region, while the uncoated specimen showed higher early CLT surface temperatures. At the same time, flaming combustion occurred only in the coated assembly. This contrast indicates that the fire behavior of enclosed CLT sandwich assemblies is governed not only by temperature rise, but also by the interaction of cavity geometry, oxygen availability, volatile generation, timber stud behavior, and the integrity of the protective layer [
10,
11,
12].
4.2. Moisture Release and Initial Thermal Response
The first STA stage, up to approximately 150 °C, was associated mainly with moisture release. Sample A lost 6.6 percentage points of its initial mass, while Sample B lost 5.9 percentage points. The difference was relatively small, but the slightly lower mass loss of the coated specimen may be related to the presence of the coating and transparent topcoat, which could have limited moisture exchange before testing.
Moisture release can contribute to the early thermal inertia of wood because part of the supplied heat is consumed by evaporation before intensive pyrolysis begins. This effect is one of the factors contributing to the delayed thermal degradation of timber under heating [
5,
19]. In the present fire tests, both assemblies showed a relatively gradual early temperature rise before visible cracking of the gypsum-fiber board. However, the small difference in Stage I mass loss between the two STA specimens should not be overinterpreted, particularly because the STA samples were small and did not reproduce the full heat-transfer conditions of the wall assemblies.
4.3. Stage II Mass Loss and Intumescent Activation
The most pronounced difference between the two STA specimens occurred in the 150–280 °C range. In this interval, the uncoated CLT specimen lost 4.2 percentage points of mass, whereas the PROMADUR®-coated specimen lost 13.4 percentage points. This additional mass loss is consistent with the thermal activation and decomposition of the intumescent coating system.
The increased mass loss of Sample B in the 150–280 °C interval is consistent with thermal activation of the intumescent coating. Phosphorus- and nitrogen-containing fire-retardant systems can modify the thermal degradation pathway of wood by promoting dehydration, reducing the rate of volatile release in the main degradation stage, and increasing the formation of carbonaceous residue [
5,
6,
15]. In intumescent coatings, this process is accompanied by expansion of the coating layer and formation of a porous protective char, as reported in previous studies on intumescent-coated timber and coated wood substrates [
13,
14,
16]. The increased mass loss observed in Sample B during Stage II is therefore consistent with coating activation, foam formation, and release of volatile or gaseous products. However, because no gas analysis such as Fourier-transform infrared spectroscopy (FTIR), mass spectrometry (MS), or gas chromatography (GC) was performed, the chemical composition and flammability of the released products cannot be directly confirmed from the present STA data alone.
The visual observations from the medium-scale test support this interpretation. In Sample B, intensive smoke release from the installation cavity was observed at approximately 30 min, when the CLT surface temperature reached 158.9 °C. Visible swelling of the intumescent layer followed between approximately 40 and 44 min. These observations correspond well with the temperature interval in which the STA data showed increased mass loss in the coated specimen. Thus, the STA results and fire-test observations are mutually consistent, although the link between coating-derived gases and later flaming behavior remains an interpretation rather than direct chemical proof.
4.4. Protective Effect of the Intumescent Coating
The PROMADUR® coating provided a clear intermediate-stage protective effect. The critical high-temperature event in the stud region occurred at approximately 54 min in Sample A and only at approximately 89 min in Sample B. This represents a delay of about 35 min in the coated assembly.
The STA results support this observation. The coated specimen showed a lower peak DTG rate than the uncoated specimen, decreasing from −0.844%/°C in Sample A to −0.530%/°C in Sample B. This corresponds to a reduction of approximately 37% in the maximum mass-loss rate. The coated specimen also retained more solid residue at higher temperatures, particularly above 400 °C. At 487 °C, Sample B retained 29.6% of its initial mass, compared with 22.5% for Sample A.
These findings are consistent with previous studies showing that intumescent coatings applied to timber or wood-based substrates can delay charring, reduce the rate of thermal degradation, and increase residual char formation, depending on coating formulation, dry film thickness, substrate type, and exposure conditions [
13,
14,
15,
16]. The expanded char layer acts as a temporary thermal barrier and can reduce heat transfer to the substrate. In the present assembly, this effect was reflected in delayed heating of the stud region and in lower temperatures in selected parts of the coated wall during the intermediate exposure period.
However, the protective effect was not maintained throughout the entire test without degradation. Once flaming combustion developed in the installation cavity, the intumescent char was locally damaged and the adjacent CLT surface was thermally affected. This indicates that the protective function of the coating depends not only on its thermal expansion and char-forming capacity, but also on the mechanical and thermal stability of the expanded layer under prolonged exposure and local flaming.
4.5. Thermal Inertia and Non-Flaming Behavior of the Uncoated Assembly
Sample A, the uncoated reference assembly, reached a maximum CLT surface temperature of 250.6 °C at approximately 43 min in the central section. After this peak, the temperature at this location decreased gradually until the end of the test. Although the wooden stud showed glowing combustion from approximately 60 min, no flaming combustion was observed in the installation cavity during the 90 min exposure.
The STA data help to contextualize this behavior. At approximately 250 °C, the uncoated CLT specimen retained 91.3% of its initial mass and showed a relatively low DTG rate of −0.060%/°C. This indicates that the material was still in an early stage of thermal degradation and had not yet reached the main pyrolysis interval. The formation of a surface char layer and the thermal inertia of the CLT panel probably contributed to the subsequent reduction in surface temperature.
The absence of flaming in Sample A despite local glowing of the stud suggests that temperature alone was not sufficient to initiate sustained flaming in the cavity. Wood ignition and flaming depend on the combined effect of temperature, heat flux, pyrolysis gas generation, oxygen availability, and local geometry [
1,
5,
19]. In a partially enclosed cavity, limited oxygen supply and restricted gas movement may suppress flaming even when local temperatures are elevated. Similar effects have been discussed in previous studies of encapsulated or compartmentalized mass timber assemblies, where ventilation, encapsulation integrity, and available oxygen strongly influenced fire development [
10,
11].
4.6. Flaming in the Coated Assembly: A Plausible Interpretation
One of the most important observations in this study was the different combustion behavior of the two assemblies. The coated assembly delayed heating in the stud region but eventually exhibited flaming combustion of the wooden stud at approximately 75 min, followed by more intensive local burning in the cavity. The uncoated assembly showed earlier heating and glowing of the stud, but no flaming combustion.
A plausible explanation is that the intumescent coating modified the thermal and chemical environment inside the installation cavity. The STA data showed that Sample B released substantially more mass than Sample A in the 150–280 °C interval. This additional mass loss is consistent with coating activation and the release of volatile or gaseous decomposition products. In the partially enclosed cavity, these products may have contributed to smoke accumulation and may have altered the local gas mixture before ignition of the stud. Once the stud transitioned from glowing to flaming combustion, the accumulated degradation products and the locally damaged coating char may have supported further flame development.
This interpretation is consistent with the observed sequence of events: smoke release at approximately 30 min, visible intumescent expansion at 40–44 min, glowing of the stud at 65–72 min, flaming at approximately 75 min, and intensive local cavity burning near 87 min. However, the explanation should be presented with caution. The present study did not measure oxygen concentration, gas composition, or heat release rate inside the cavity. Therefore, it cannot be concluded definitively that coating-derived volatiles were the direct cause of flaming combustion. The results rather indicate that the coating may have contributed to conditions favorable for flaming once a local ignition source became available.
This finding is important because it shows that a protective system can improve early thermal performance while also introducing additional complexity in enclosed combustible cavities. In such configurations, intumescent coating performance should be evaluated not only in terms of delayed charring or increased residual mass, but also in relation to cavity ventilation, combustible framing, smoke accumulation, and post-expansion char integrity.
4.7. Residual Mass, Char Formation, and Post-Protection Behavior
At the end of the evaluated STA temperature range, the coated specimen retained 29.6% of its initial mass, compared with 22.5% for the uncoated specimen. This 7.1 percentage point difference indicates greater residual solid formation in the coated sample. Increased residual mass is generally consistent with the char-promoting function of intumescent systems and with their ability to reduce the rate of substrate degradation [
13,
14,
15,
16].
In the medium-scale fire test, this char-forming effect corresponded to improved intermediate-stage thermal protection. The expanded intumescent layer delayed the rise in temperatures in the stud region and contributed to the 35 min delay in the critical temperature event. Nevertheless, the post-test condition of Sample B showed that the expanded layer was degraded in the region affected by local flaming. This suggests that the protective char was effective while it remained intact, but its performance decreased after local flame exposure and mechanical or thermal damage.
This dual behavior is relevant for practical design. In open or well-controlled laboratory exposures, increased char formation is generally beneficial. In enclosed wall cavities containing combustible studs, however, the integrity of the expanded char and the behavior of adjacent combustible components become equally important. The results therefore support the need to evaluate intumescent coatings at the assembly level, not only through small-scale material tests.
4.8. Design Implications
The results suggest several implications for the design of CLT sandwich wall assemblies with installation cavities.
First, board-based encapsulation remains an important primary protection strategy for CLT. In both tested assemblies, the gypsum-fiber boards contributed to limiting heat transfer to the unexposed face throughout the 90 min exposure. This agrees with previous research showing that encapsulation can delay timber involvement in fire, depending on board type, fixing, joints, and exposure severity [
9,
10].
Second, intumescent coating can provide additional thermal protection to the CLT surface and delay heating of combustible elements within the cavity. In the present study, the PROMADUR® coating delayed the critical high-temperature event in the stud region by approximately 35 min. This indicates that coating systems may be beneficial when used as part of a broader fire protection strategy.
Third, the presence of combustible wooden studs inside the cavity requires careful attention. In Sample B, the stud became the location where glowing and then flaming combustion developed. Future studies should therefore examine whether coating the lateral faces of the studs, replacing timber studs with non-combustible framing, modifying cavity ventilation, or improving cavity compartmentation can reduce the likelihood of flaming in similar assemblies. These options should be treated as design hypotheses requiring further validation, not as conclusions directly proven by the present two-specimen test.
Fourth, STA appears to be a useful complementary method for interpreting the thermal degradation behavior of coated and uncoated CLT materials. It can help compare mass-loss stages, peak degradation rates, and residual mass formation. However, STA should not be treated as a direct predictive substitute for assembly-level fire testing, because it does not reproduce cavity geometry, oxygen limitation, cracking, flame spread, or mechanical degradation of protective layers.
4.9. Limitations of the Study
Several limitations must be considered when interpreting the results.
Only one uncoated and one coated wall assembly were tested. The results therefore provide comparative observations for the tested configuration, but they are not statistically representative. Additional replicated tests would be required to confirm the repeatability of the observed behavior.
The fire exposure was performed using a medium-scale radiant panel setup. Although the insulation criterion of STN EN 1363-1 was used as a benchmark for unexposed-face temperature rise, the test was not a standard furnace test and does not provide a formal fire resistance rating.
The oxygen concentration, gas composition, and heat release rate inside the installation cavity were not measured. Therefore, interpretations concerning oxygen limitation, volatile accumulation, and the role of coating-derived gases remain qualitative and should be validated in future studies using direct gas analysis and oxygen monitoring.
The dry film thickness of the intumescent coating was not directly measured. Since intumescent performance depends strongly on dry film thickness, future studies should include dry film thickness (DFT) measurement and investigate multiple coating application rates.
The STA specimens were small and were tested under controlled oxidative conditions. They provided useful material-level data, but they did not reproduce the heat-transfer conditions, geometry, ventilation, cracking, or flame exposure present in the wall assembly test.
Finally, the findings are limited to the tested CLT thickness, gypsum-fiber board type, wooden stud configuration, cavity depth, coating system, and radiant heat flux. Further research should examine different cavity designs, coating thicknesses, framing materials, ventilation conditions, and replicated specimens.
5. Conclusions
This study compared the thermal and combustion behaviour of two medium-scale CLT sandwich wall assemblies exposed to a radiant heat flux of 20 kW/m2 for 90 min: an uncoated reference assembly and an assembly with PROMADUR® intumescent coating applied to the CLT surfaces facing the installation cavities. Based on the obtained results, the following conclusions can be drawn:
(1) Under the applied medium-scale radiant exposure, the unexposed-face temperatures of both assemblies remained below the insulation temperature-rise limits defined in STN EN 1363-1. However, these limits were used only as a comparative benchmark. The test does not represent a standard furnace fire-resistance test and cannot be used to assign a formal fire-resistance classification.
(2) The PROMADUR® intumescent coating improved the early and intermediate thermal protection of the CLT surface and delayed the development of high temperatures in the wooden stud region. The critical high-temperature event in the stud region occurred approximately 35 min later in the coated assembly than in the uncoated reference assembly.
(3) The two assemblies showed different combustion behavior in the installation cavity. The uncoated reference assembly reached higher early CLT surface temperatures and showed glowing combustion of the wooden stud, but no flaming combustion was observed during the 90 min exposure. In contrast, the coated assembly developed flaming combustion of the wooden stud at approximately 75 min, followed by degradation of the expanded intumescent char and local thermal damage to the adjacent CLT surface.
(4) The STA results supported the interpretation of the fire-test observations at the material level. The coated specimen showed greater mass loss in the 150–280 °C range, a lower peak DTG rate and a higher residual mass at the end of the test. These results are consistent with intumescent activation, volatile release and the formation of a protective char residue. Nevertheless, STA cannot reproduce the geometry, ventilation, flame exposure, board cracking or cavity combustion processes observed in the wall assembly test.
(5) The results indicate that intumescent coatings can improve the thermal protection of CLT surfaces in layered wall assemblies, but their effectiveness depends on the complete assembly configuration, including combustible secondary framing, cavity geometry, ventilation conditions and the stability of the expanded char. Further research should include replicated tests, direct dry film thickness measurement, higher or standardized fire exposure, heat release rate measurement, oxygen and gas analysis, and alternative cavity and stud configurations, including protected or non-combustible framing.