Article

Machine Learning Assessment of Fire Resistance in Seismically Designed Reinforced Concrete Structures

by
Mohammadreza Amiraslankhan
1,
Behrouz Behnam
1,*,
Ehsan Nazerfard
2 and
Maedeh Haghbin Yousefi
1
1
Department of Civil and Environmental Engineering, Amirkabir University of Technology, Tehran 1591634311, Iran
2
Department of Computer Engineering, Amirkabir University of Technology, Tehran 1591634311, Iran
*
Author to whom correspondence should be addressed.
Fire 2026, 9(6), 224; https://doi.org/10.3390/fire9060224
Submission received: 12 December 2025 / Revised: 3 January 2026 / Accepted: 5 January 2026 / Published: 28 May 2026
(This article belongs to the Special Issue Advances in Structural Fire Engineering)

Abstract

This research investigates the effect of seismic loading on FRRs of RC structures using different machine learning (ML) algorithms. First, 20 portal RC frames with varying span numbers and stories are designed for seismic loads. This is then expanded to over 1760 frames by including further specifications such as span length, soil type, and seismic levels. This dataset is derived using decision tree algorithms, ensuring a robust and comprehensive analysis of the relationship between seismic design considerations and FRRs. All the models are subjected to the ISO 834 fire curve. Employing different ML algorithms indicate that the Random Forest Regression provides an accuracy of 81.88%, outperforming alternative algorithms such as Gradient Boosting and Support Vector Regression. Overall, the results suggest that structural elements designed for higher seismic demands exhibit higher FRRs. Additionally, as the number of spans increases, the associated FRRs also increase. An equation is then proposed to correlate the required sprinklers and the FRRs of seismically designed structures, making it possible to adopt a cost-reduction strategy in establishing fire protection systems. The ML-based algorithms here present a functional approach that can assist engineers in reducing structural and fire protection design costs while meeting the fire safety needs.

1. Introduction

Depending on their use and importance, conventional urban buildings are designed to maintain sufficient resistance against potential fires for periods ranging from about 30 min to over 4 h. By definition, fire-resistance rating (FRR) consists of ensuring three factors: stability, integrity, and insulation when an element is subjected to the standard fire [1]. The question of what type of thermal pattern and under what temporal and spatial conditions urban buildings should be designed has been the subject of extensive discussions for several decades, leading to two different design approaches: prescriptive- and performance-based [2]. Under the prescriptive-based approach, each structural and non-structural element is designed using predefined guidelines. However, in the performance-based approach, specific performance objectives are first defined, and then operational solutions are proposed to achieve them. Thus, performance-based design can provide further flexibility for designers to ensure target safety while imposing lower costs on the project [3]. Performance-based design has been considered from various aspects. Among numerous research works, for example, Behnam [4] examined how structural configurations can affect FRRs of structures. Gernay [5] provided a performance-based design approach highlighting probabilistic risk assessment and cost–benefit analysis. Chaudhary et al. [6] developed a multi-objective optimization approach within a risk-based framework to meet the required fire safety. In a similar work, Irani and Behnam [7] proposed a cost-oriented approach for the fire safety design of structures. Leiras et al. [8] proposed a fire risk assessment methodology based on holistic analyses to determine the potential failure of crucial components of buildings. Gedam [9] advanced a performance-based approach for evaluating FRRs of RC structures employing the flexural carrying capacity.
In addition to the above-mentioned studies, performance-based design can also be discussed from the perspective of structural loading types. Note that currently, urban buildings are specifically designed to withstand not only gravitational loads but also at least one unexpected load, such as wind and earthquake. However, it is assumed that if a fire occurs, it is merely under normal conditions and not, for example, post-earthquake fires. Therefore, it is worth considering whether, for instance, the seismic design of conventional urban buildings has an impact on their structural performance when exposed to fire only. If it is determined that there is a difference between FRR based on different structural seismic loads, then a revised definition of FRR can be presented.
To thoroughly address this point, comprehensive studies should be performed by designing a large set of samples with varying architectural and structural characteristics under different loading conditions. Using such a process to estimate FRR can be very time-consuming, and the results are highly limited to the studies conducted. However, it might be possible to obtain results using artificial intelligence (AI) approaches that can be achieved in a relatively short time while being largely generalizable. In that case, FRR can be predicted based on a specific loading pattern and defined structural specifications. Among the AI-based approaches that have become very popular in recent years are machine learning (ML) algorithms. Specifically, ML algorithms in fire engineering have developed unprecedentedly. Using ML algorithms, it has become possible to predict human, material, and structural behaviors during fires. Among many studies that have predicted structural behaviors during fires using ML algorithms, one can refer to the studies of Naser [10,11], who developed AI-based frameworks for analyzing the complex behavior of RC members under fire, considering high-temperature material properties of concrete and reinforcement. Naser and Kodur [12] also predicted the FRRs of RC columns using ML-based algorithms. Gaveen et al. [13] developed a framework for predicting the thermal spalling of concrete tunnel lining under fire. Himeur et al. [14] employed the application of ML algorithms for forecasting fire hazards in warehouses, industrial facilities, and urban landscapes. Habib et al. [15] developed ML-based models for predicting the failure potential of FRP-strengthened RC beams subject to fire. Possidente and Couto [16] examined a series of ML algorithms to forecast the buckling possibility of trusses and bracing systems under fire, hence improving confidence layers for the fire design. Yang et al. [17] employed different ML algorithms to anticipate the compressive strength of geopolymer concrete from the ambient temperature to over 1000 °C. Recent studies on composite structural systems, including slim-floor beams and concrete-filled steel tube columns, have demonstrated that ML and hybrid soft-computing models can significantly outperform traditional code-based approaches in predicting structural performance under extreme conditions such as fire exposure and ultimate loading [18,19].
While ML algorithms are rapidly employed in various aspects of fire engineering, to the best of the authors’ knowledge, there is no ML-based study for forecasting FRRs of seismically designed structures. In the present research, using ML algorithms, the FRRs of low- and mid-rise RC buildings designed for seismic loads are predicted. The results here are important in several aspects. First, buildings designed for different seismic regions may have different FRRs. Second, given these different FRRs, one can have a project economy-based view regarding the use of fire extinguishing equipment inside buildings. This, in turn, can lead to creating a balance between safety and building economics that aligns with performance-based design.

2. Research Method

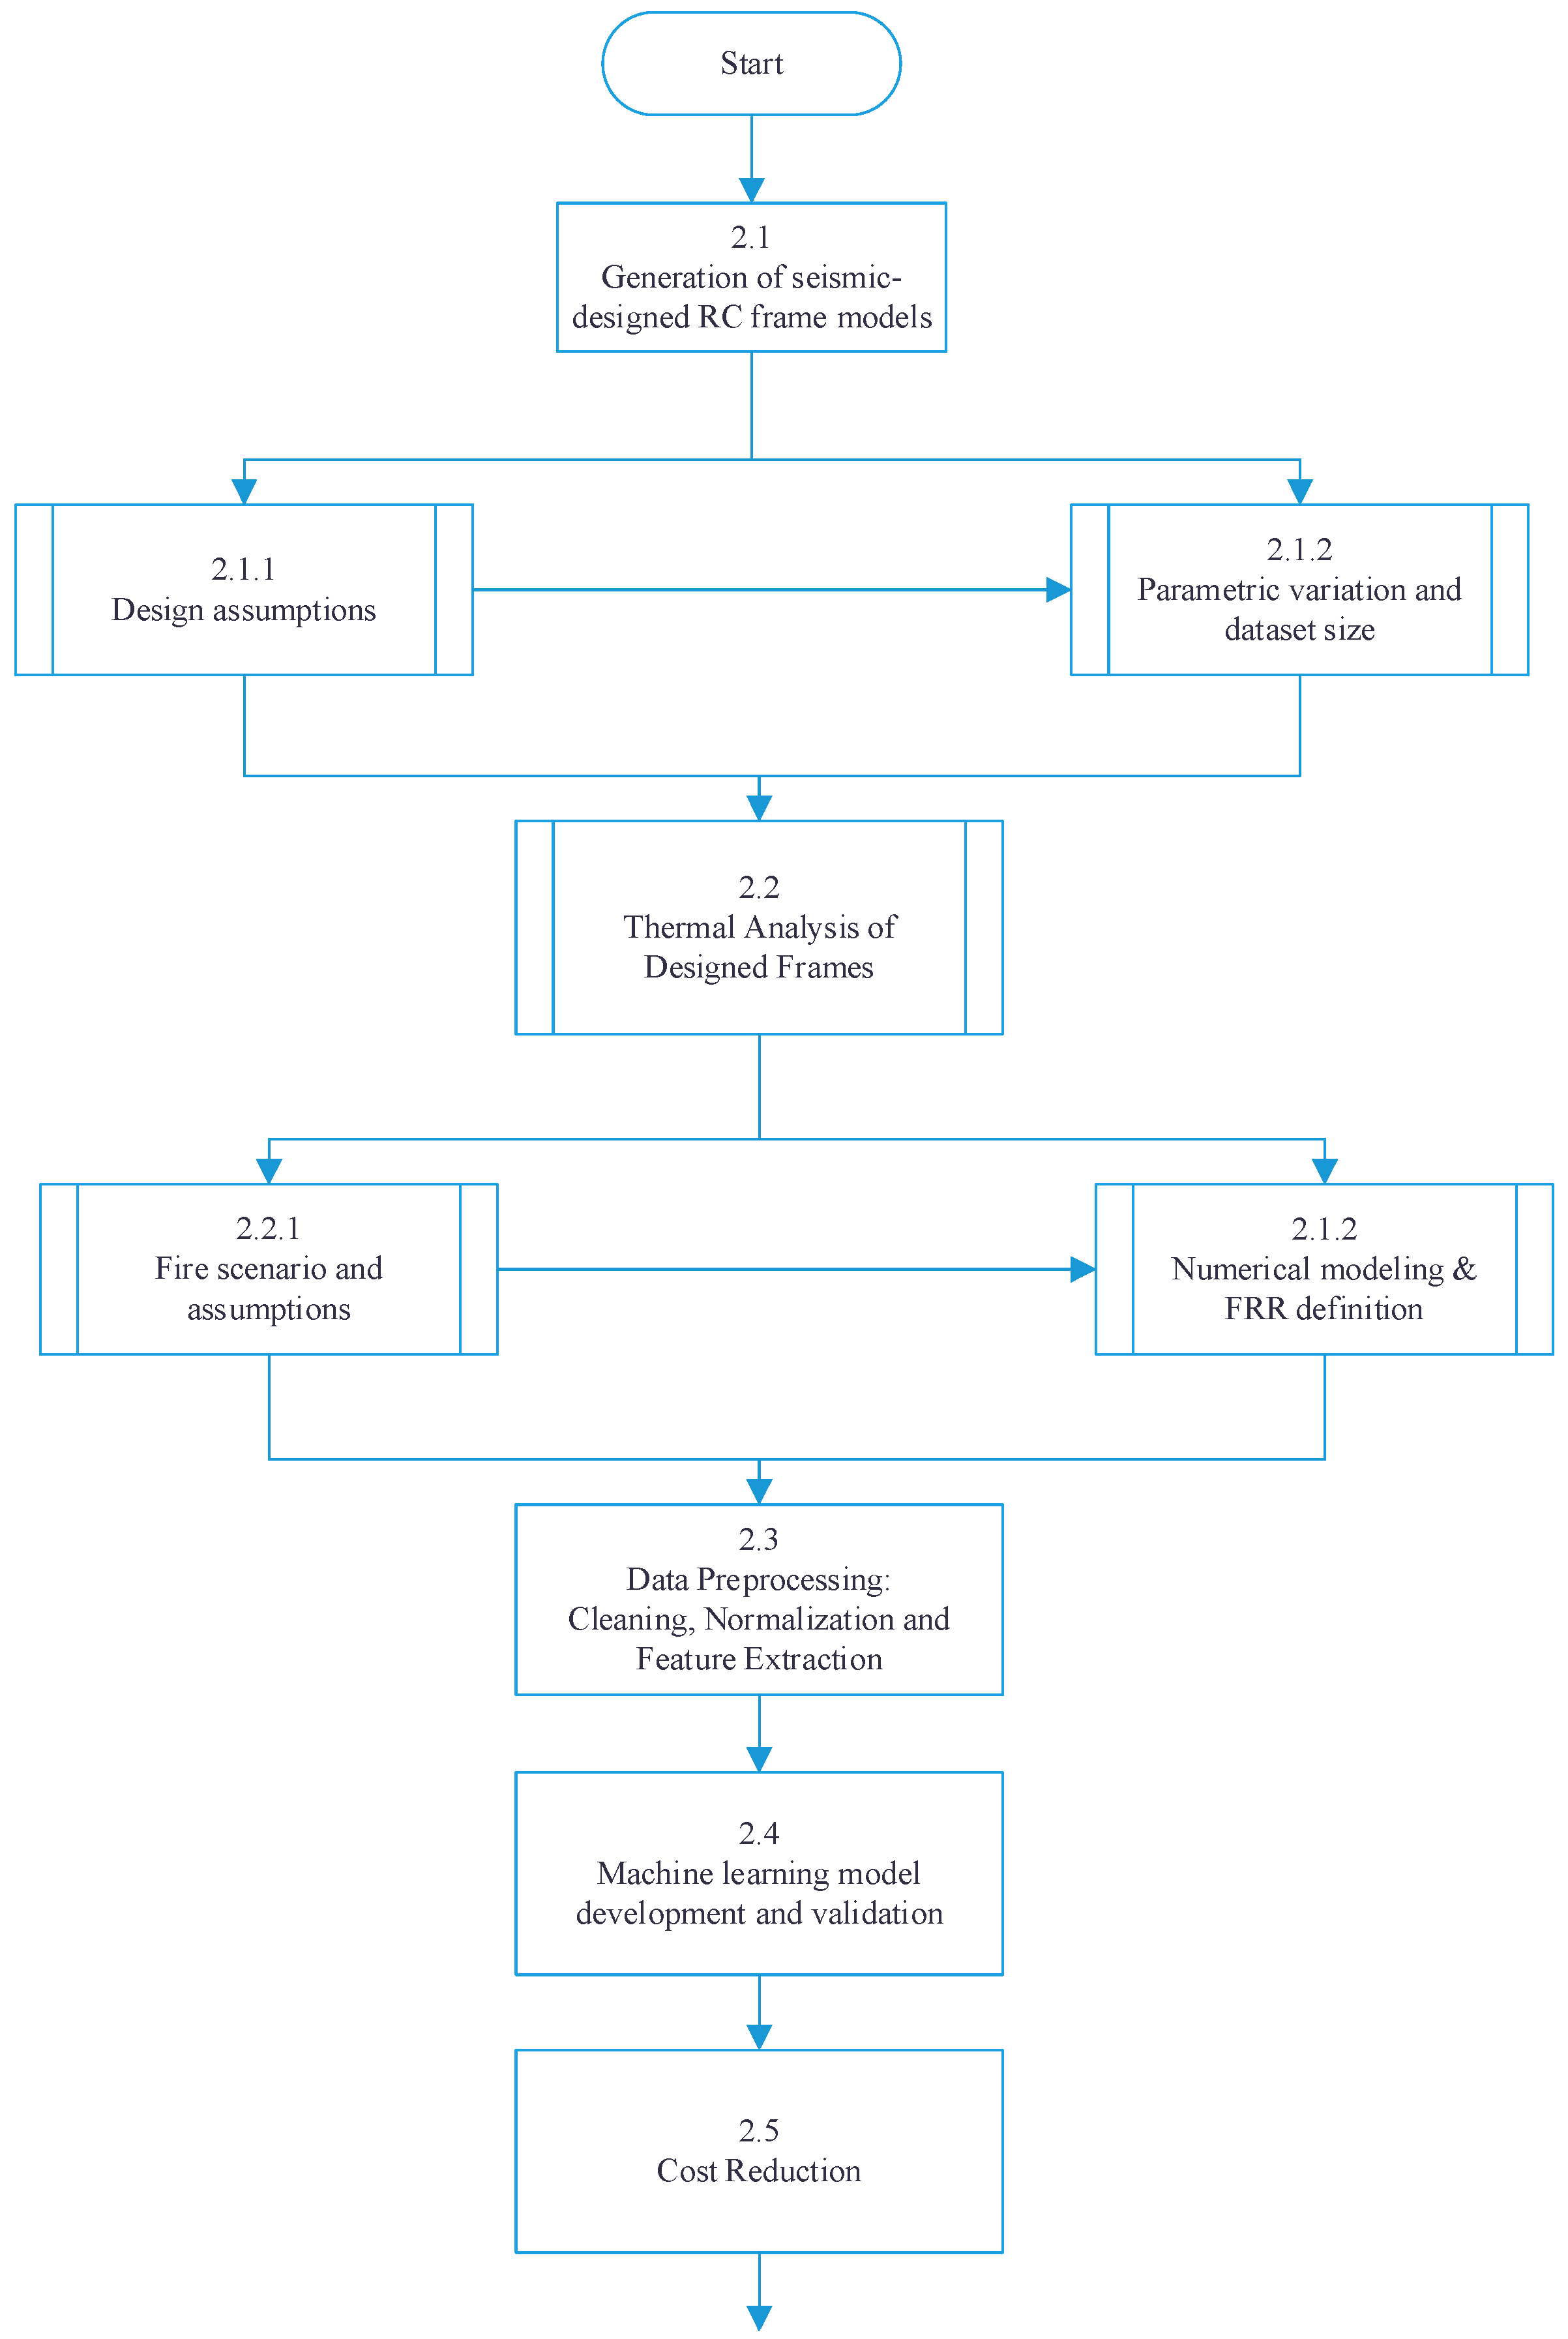
This section describes the research methodology adopted in this study. As illustrated in Figure 1, the methodology consists of five main phases:
(1)
Generation of seismically designed reinforced concrete (RC) frame models;
(2)
Thermal analysis of the designed frames;
(3)
Data preprocessing;
(4)
ML model development and validation;
(5)
Cost reduction analysis.
Each phase is described in the following subsections.
Figure 1. The study roadmap.
Fire 09 00224 g001

2.1. Generation of Seismic-Designed RC Frame Models

2.1.1. Design Assumptions

The selection of methods used here is based on capabilities and expected accuracy. Initial data are collected according to architectural and structural design standards and requirements, and cross-validation methods are employed to ensure the accuracy and generalizability of ML models. In this study, the ISO 834 standard [20] fire curve is adopted. Other relevant fire curves, such as natural and localized curves, are not employed. This exclusion aligns with the fact that the definition of FRR is based on the standard fire curve. Since the current study aims to predict the standard FRR, no alternative fire curves are utilized. Structural analyses are performed using the OpenSees software platform [21]. It is also worth noting that in this study, only the first floor is subjected to fire. While additional floors could also be involved in the fire, this scenario is not considered in the current assumptions. It should be mentioned that considering a vertically traveling fire scenario is important and complex, and it should be taken into account when investigating the performance of structures under fire, although it is not necessarily required for determining their FRRs.
A series of RC portal frames with varying numbers of spans and stories are designed based on the Iranian National Building Code, Part 6 (INBC6) [22], which is highly equivalent to ASCE-17 [23], and INBC10 [24], which is highly similar to ACI 318-08 [25].

2.1.2. Parametric Variation and Dataset Size

Initially, a one-story, one-span frame is designed, and then by increasing spans to 4 and stories to 5, a total of 20 samples are created. Additional parameters, including span length, soil type, and seismic hazard level, are subsequently varied, resulting in 698 distinct frame configurations.
To create a suitable platform for ML model training, a sufficiently large sample set is required. The spans are subdivided into 0.3 m segments, increasing the sample size to 1760 through the application of supervised decision-tree-based classification. Each frame is defined with a symbol like Fi-j-k-l-s, where i stands for the number of stories, j is the number of spans, k is the design base acceleration (A), l is the span length, and s is the soil type. For example, F4-3-0.3-4.2-2 means a frame with 4 stories, 3 spans, A = 0.3 g, span length of 4.2 m, and a soil type of 2.

2.2. Thermal Analysis of Designed Frames

2.2.1. Fire Scenario and Assumptions

All frames are subjected to the ISO 834 standard fire curve to allow direct comparison with FRR definitions. It is assumed that only the first floor of the specimens is subjected to thermal loads and that the fire does not travel to the upper floors.

2.2.2. Numerical Modeling

As mentioned in Section 2.1.1, thermal–structural analyses are performed using OpenSees, with Python scripting employed to automate model generation and thermal loading procedures.

2.3. Data Preprocessing

Before implementing the data, this step handles the missing data elements and modifies the incorrect entries into the correct ones. Normalizing data procedures have an advantage for the features, as the generated scales for these are independent of variations from large-scale features. The data is categorized using ML algorithms to optimize the selection of the most effective model inputs.

2.4. ML Model Development

In this study, several ML regression algorithms are examined to evaluate their capability in predicting the FRR of seismically designed RC frames. The selection of candidate models is guided by their proven effectiveness in handling non-linear relationships and complex interactions among structural and seismic parameters. Among the evaluated algorithms, Random Forest Regression demonstrated superior predictive performance and robustness when applied to the present dataset. This algorithm is particularly well suited for problems characterized by high-dimensional input spaces and interdependent variables, as it combines multiple decision trees into an ensemble framework that mitigates overfitting and enhances generalization.
Model training and evaluation were conducted using a supervised learning approach. The dataset was partitioned into training, validation, and testing subsets to ensure unbiased performance assessment. Model accuracy was quantified using Mean Squared Error (MSE), Mean Absolute Error (MAE), and the coefficient of determination (R2). These metrics provide complementary measures of prediction error magnitude, model bias, and explanatory power [26].

2.5. Cost Reduction

In the final step, a cost reduction approach is considered associated with the number of sprinklers within the frames. Based on the data analysis from the previous stages, the direct impact of increased FRRs on new sprinkler spacing according to NFPA 13 standards [27] is examined.

3. Case Study

3.1. Seismic Design

Structural capacity must exceed load demands for load-bearing purposes. This becomes particularly important in seismic regions, as seismic loads are significantly more complex than gravitational loads and can cause severe structural damage. To achieve this goal, various systems are proposed for seismic resistance. One type of seismic-resistant system is the moment frame system, which, by definition, consists of beams, columns, and rigid connections capable of resisting both gravitational and lateral loads. In this research, concrete 2D frames are designed in accordance with moderate ductility requirements [24]. Although three-dimensional (3D) models can capture torsional effects and spatial fire spread, previous studies have demonstrated that 2D frame models also provide reliable predictions of global structural response and fire resistance for regular, symmetric building layouts. Moreover, the use of 2D models enables efficient parametric analysis across a large number of structural configurations, which is essential for developing robust machine learning datasets. Thus, 2D modeling represents an appropriate balance between computational efficiency and predictive accuracy for the objectives of the present study. Here, in the first step, 20 base models are designed, as shown in Figure 2. Then, by changing the factors defined in Section 2.1.1, the number of frames reaches 698.
For designing, it is assumed that the dead and live loads are, respectively, 400 kg/m2 and 200 kg/m2. In addition to the load combination U = D + L, the combination U = 1.2D + 1.0E + 1.0L, which includes seismic load, is also used [22,24]. The soil type is considered either II or III as per INBC6.
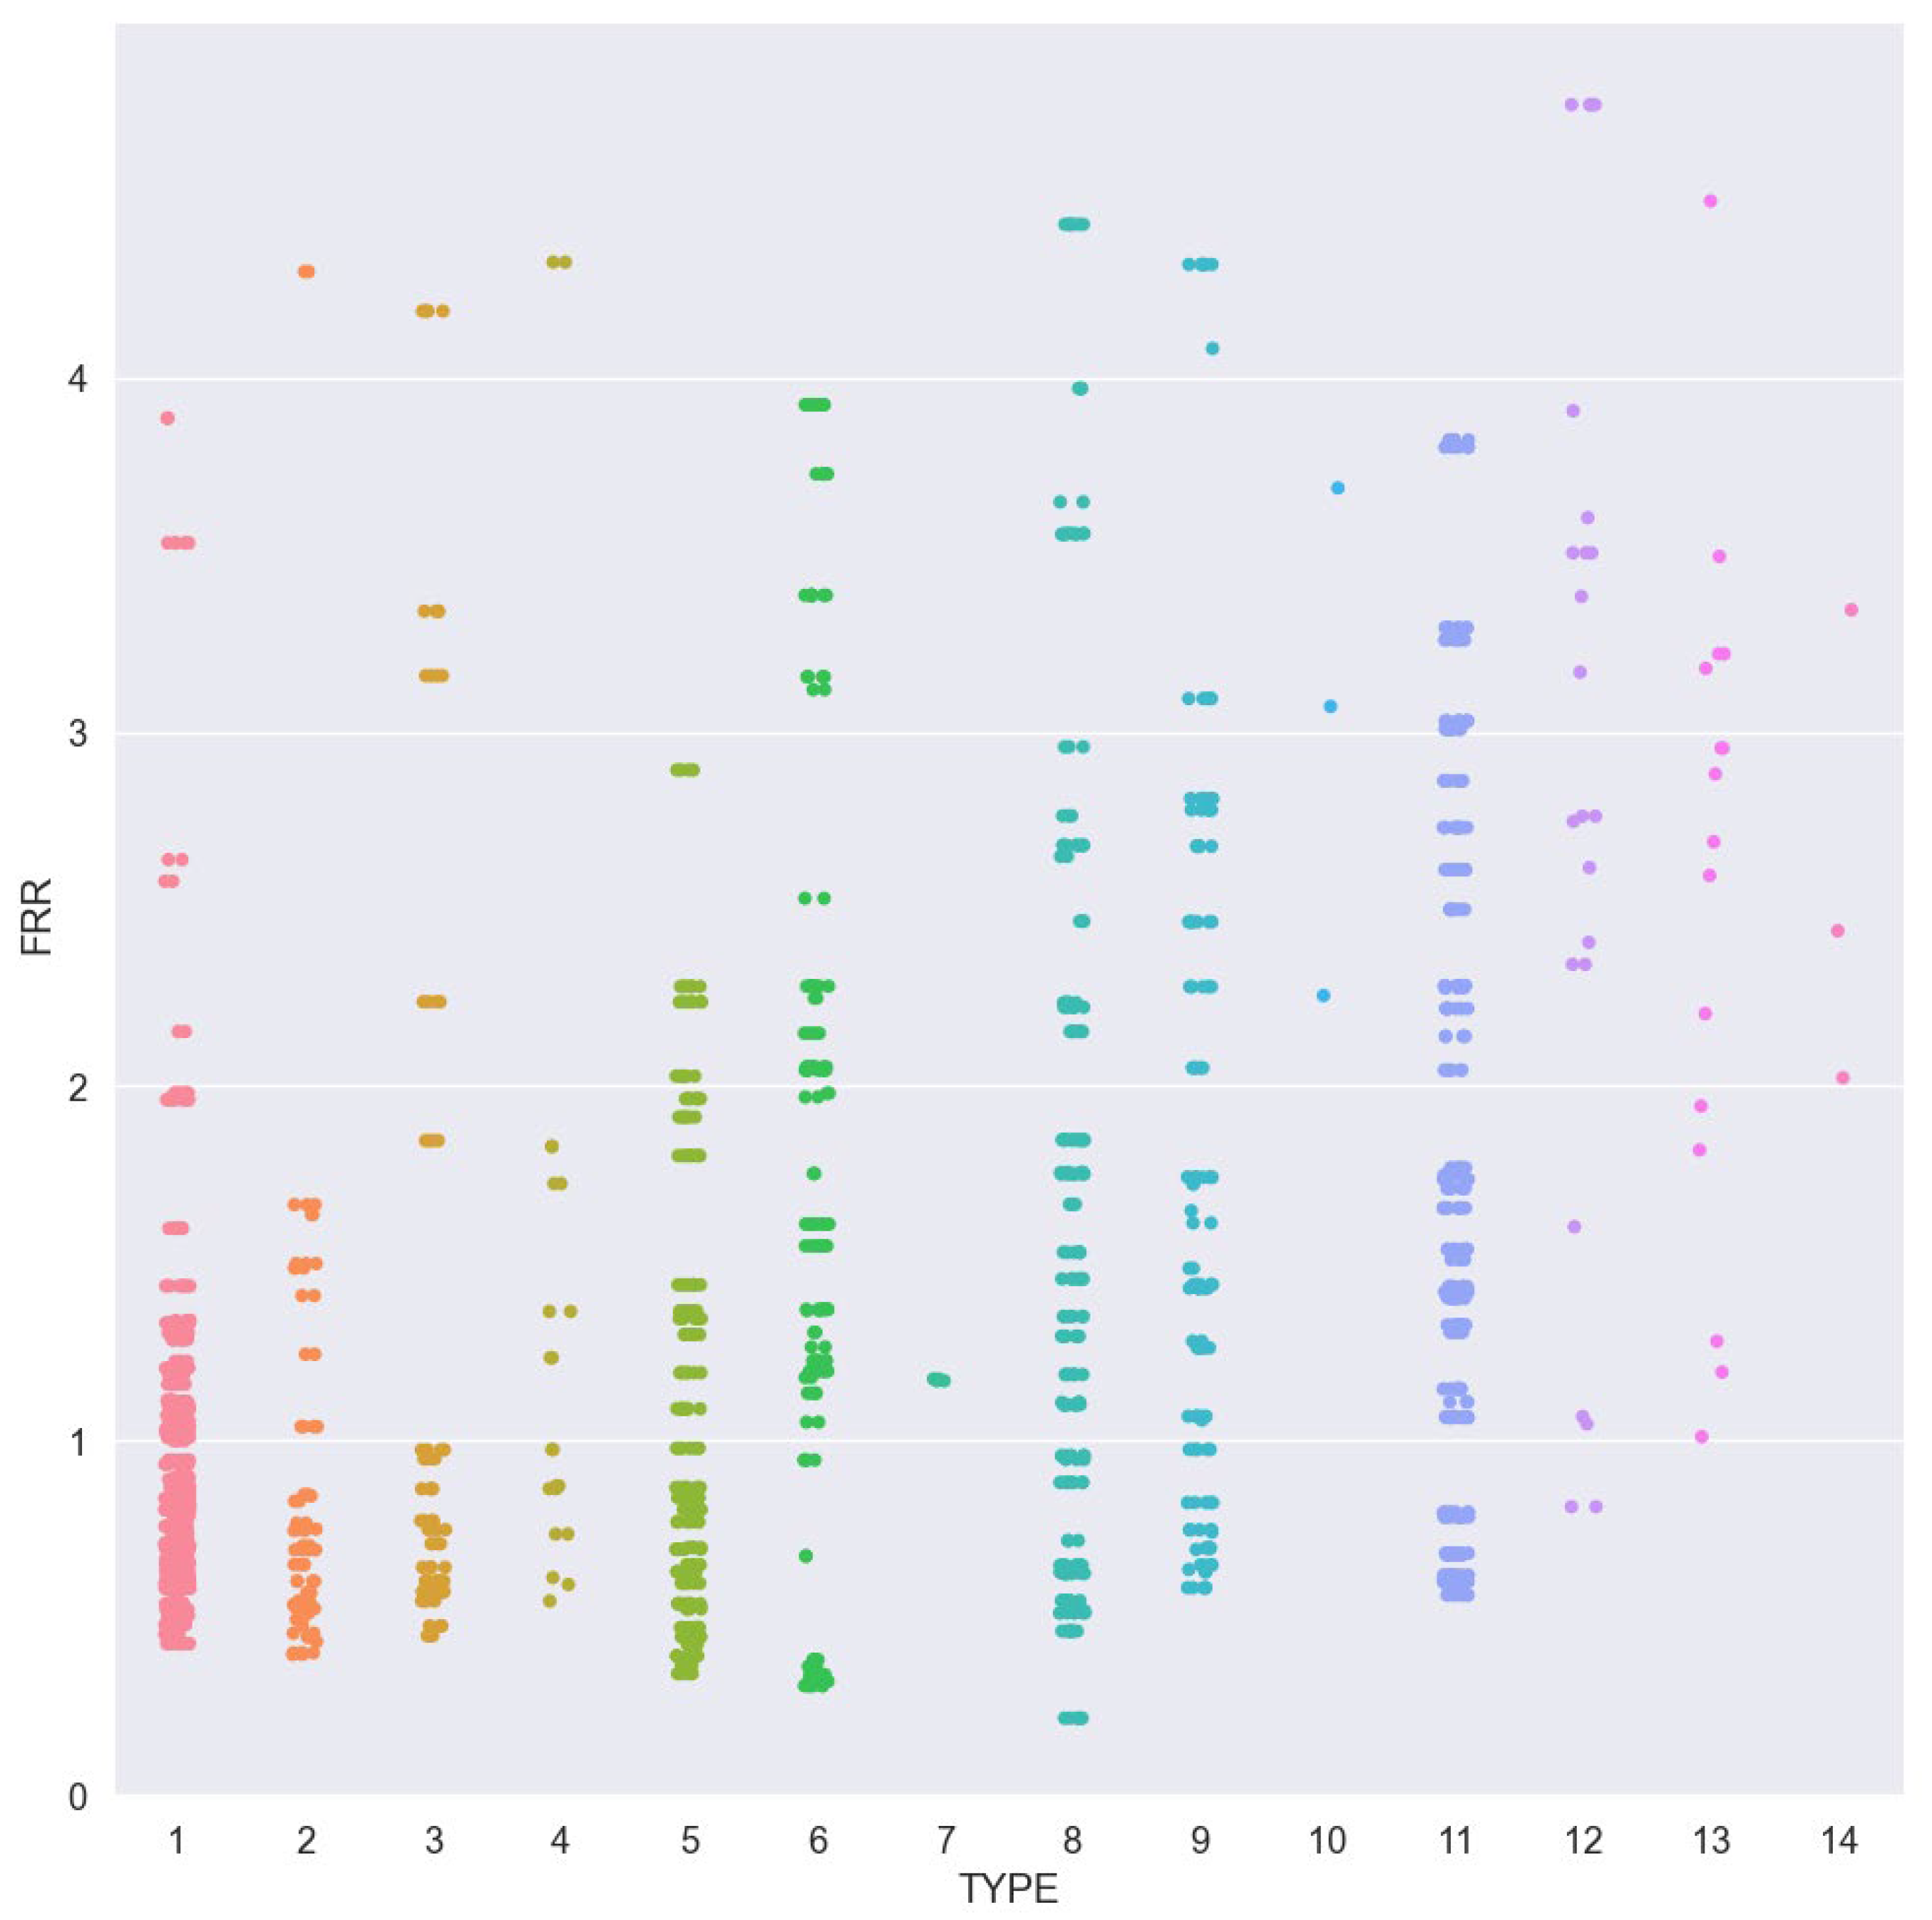
According to architectural design regulations, the required dimensions for parking spaces are 3.5 by 5 m from column axis to column axis. However, since there is no specific design difference between 3.5 m and 4 m spans in the frames, a minimum span of 4 m is assumed. Floor heights in urban areas typically range from 3 to 4 m, with 3.5 m being selected. During the design process, controls are implemented to regulate the structure’s natural period, drift, and minimum/maximum longitudinal reinforcement percentages [24]. Table 1 shows 14 types of the designed frames. Section dimensions in the frames with three or more stories are selected to better match practical construction requirements.
The decision tree algorithm stands as a prime supervised ML classification method among researchers and practitioners [28]. Decision trees operate by sorting samples based on feature values. Each decision tree node functions as a sample feature that requires classification, and its branches show possible node value choices [29]. The selected feature divides the data into multiple subsets. The recursive process keeps dividing subsets until completion. The algorithm continues splitting data until every entry in a section belongs to one class, or no more partitioning steps remain feasible [30].
Decision tree methodology serves here as a data analysis tool for predicting different features of 2D frame seismic design. The prediction process utilizes features such as the number of spans, number of floors, span length, the design base acceleration, and the soil type.
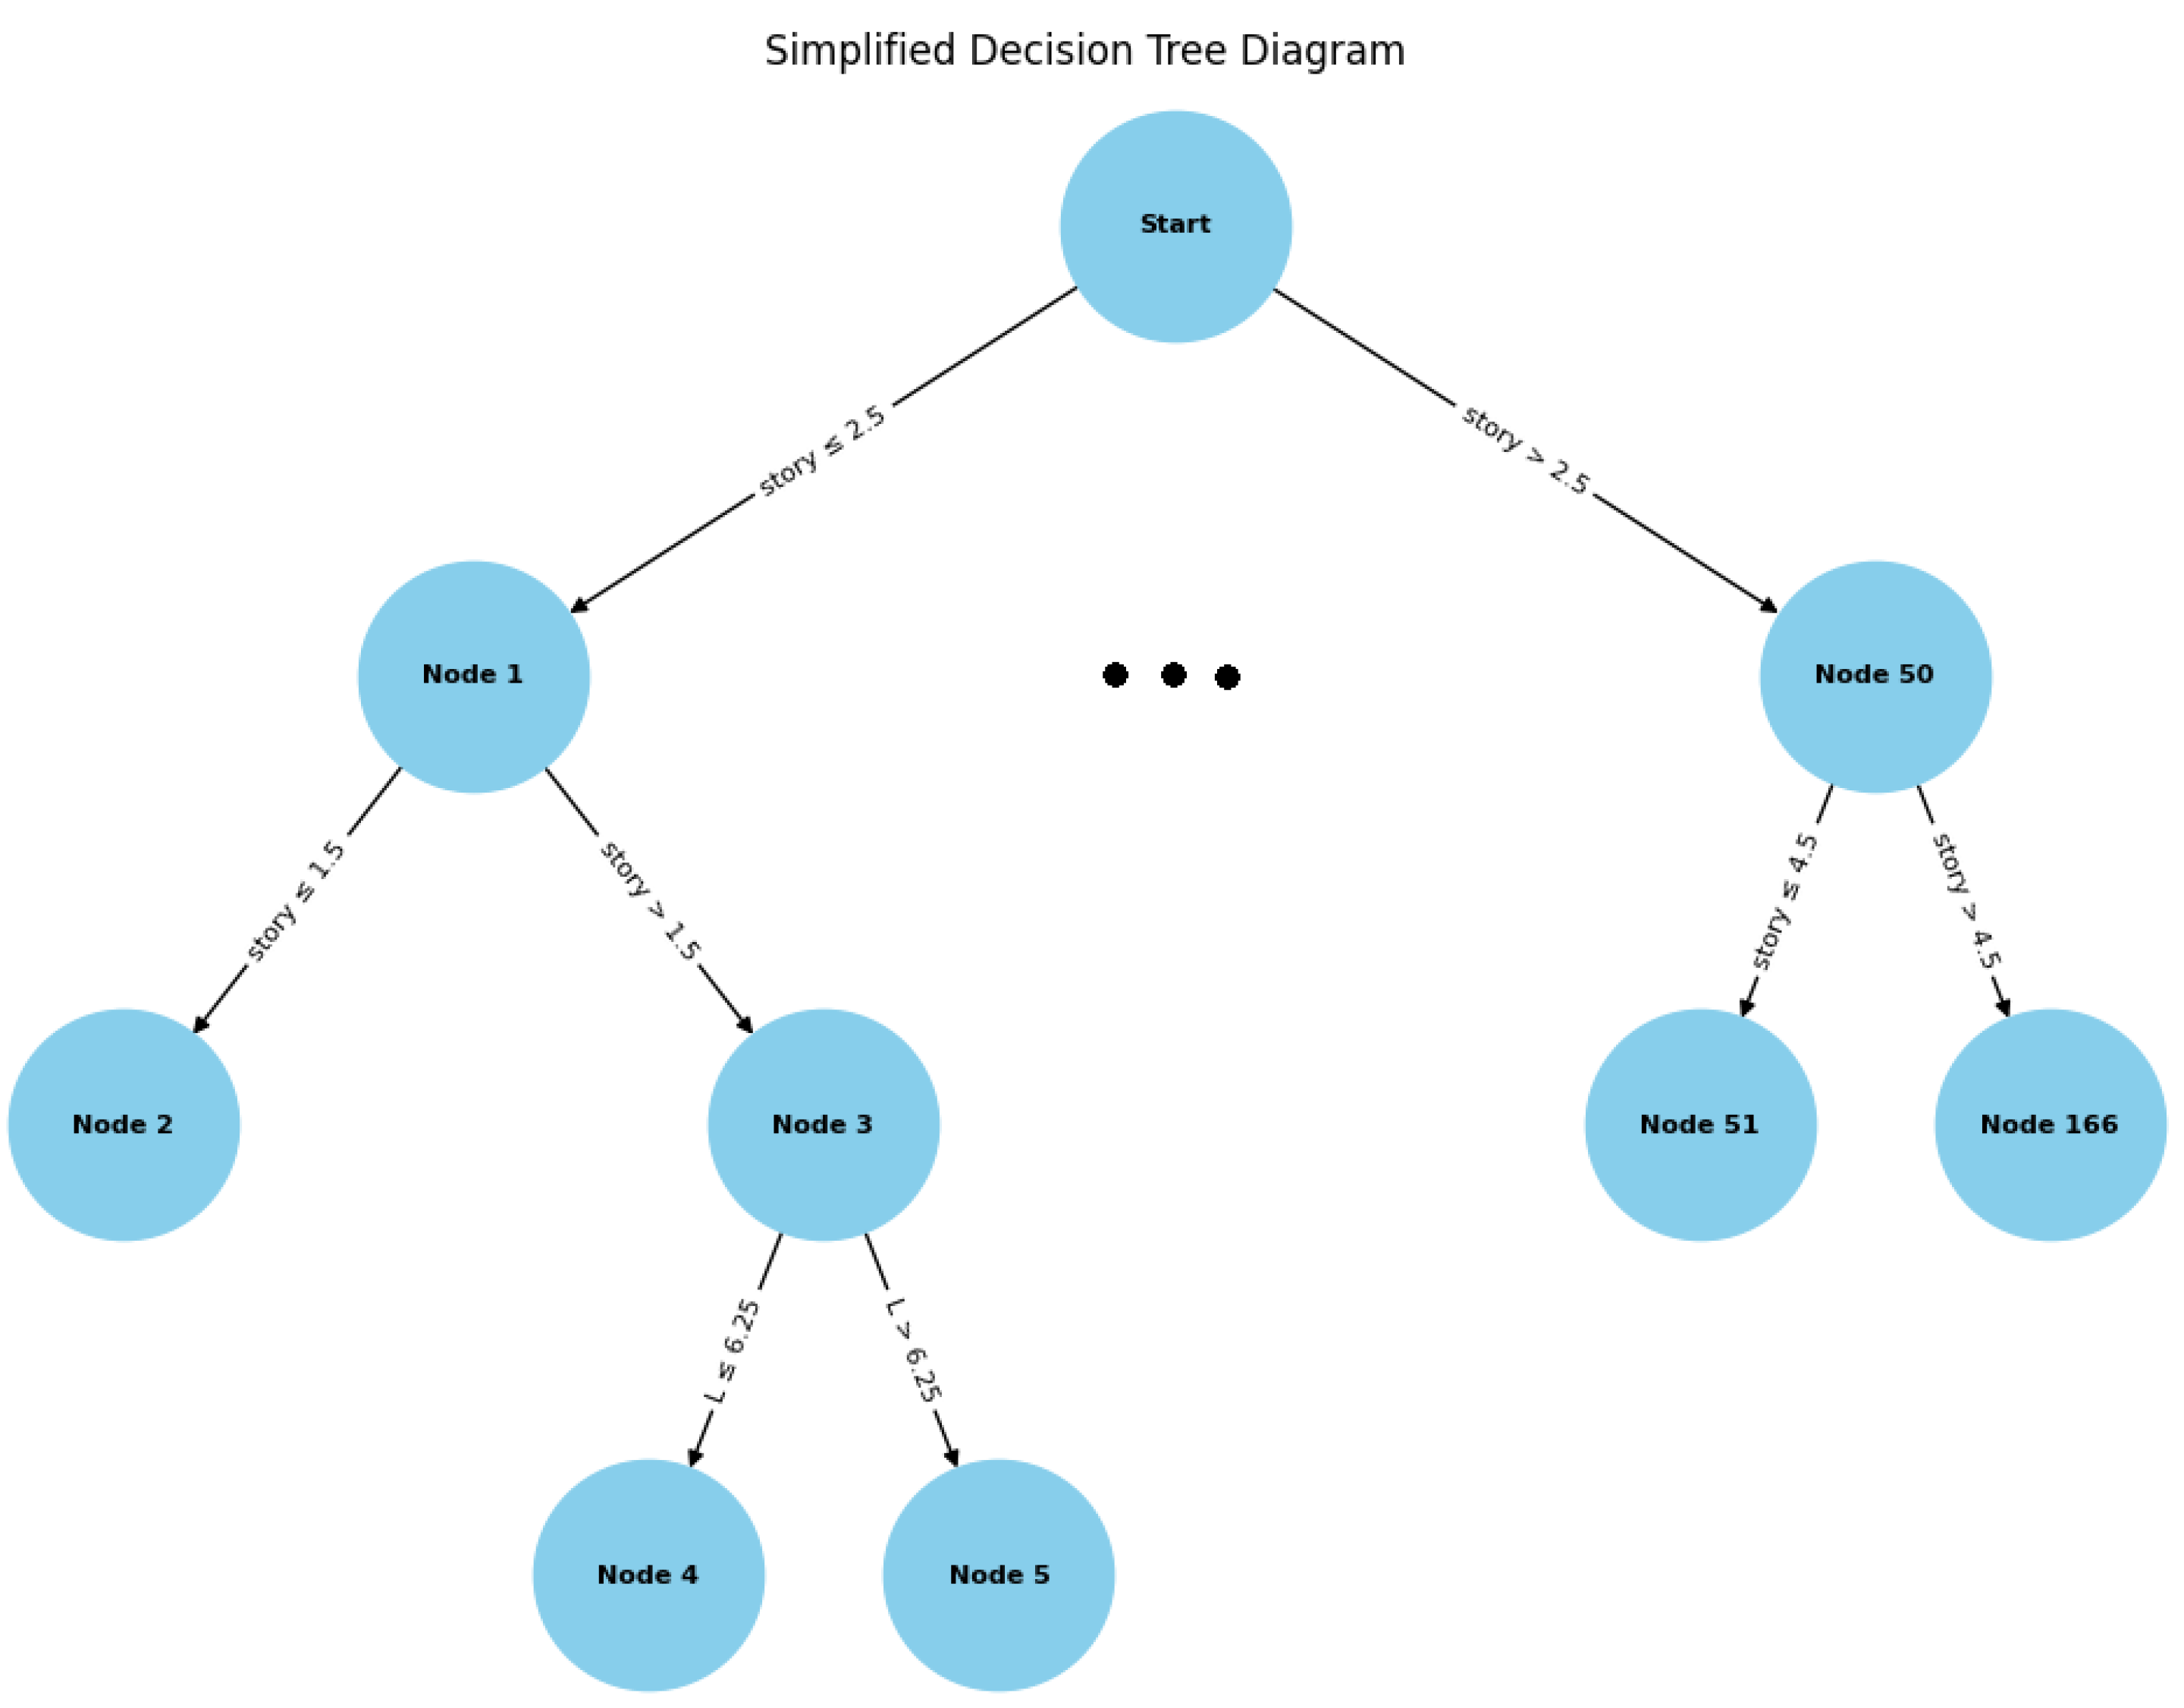
For model training, the data is first divided into three parts: training, testing, and validation. In this section, 70% of the data is allocated for model training, 15% for validation, and 15% for testing. Using the training data, the model constructs a decision tree where the number of floors is identified as the most influential feature. The first decision condition assesses whether the number of floors is greater than or less than 2.5, leading to two distinct paths. The conditions at each subsequent node are connected by logical “and” relationships, ultimately classifying the design type based on 14 predefined categories.
A simplified illustration of the built decision tree appears in Figure 3. The tree consists of nodes representing decision conditions, with branching outcomes that reflect different classification pathways. The decision process follows two primary paths depending on whether the number of floors is ≤2.5 or exceeds this threshold. Each subsequent node imposes additional conditions to ensure accurate classification.
Decision tree model optimization uses grid search, with cross-validation as its approach. The system uses an automated approach to test multiple hyperparameter sets and find the most effective configuration. The optimal parameters consist of maximum tree depth, together with minimum sample requirements to split nodes and create nodes, and the number of features for split selection and type of evaluation criterion [31]. Model assessment demonstrates that the decision tree model achieves 90.47% success in design type prediction. This decision tree method uses the number of spans and number of floors together with span length, design base acceleration ratio, and the soil type, resulting in accurate design type predictions and proving the excellent accuracy and efficiency of decision tree algorithms in classification systems.
Although Neural Networks are effective for complex learning tasks, they generally require large datasets to ensure stable training and reliable generalization. Given the limited dataset size in this study (698 samples), their application could lead to overfitting and reduced interpretability. In contrast, tree-based models such as decision trees are better suited to small- and medium-sized datasets, offering robust performance and improved transparency under these conditions [32].

3.2. Fire Resistance Calculation

Thermal analysis of the structure is performed using OpenSees in the Python programming environment. In recent years, OpenSees has significantly expanded for thermodynamic analysis by offering various thermal classes [33]. Generally, thermal finite elements have three main phases: predictor, corrector, and convergence checker [34]. Code classes for defining concrete02Thermal and Steel01Thermal materials have recently been added to the OpenSees source class. The Steel01Thermal material is derived from Steel01 behavior, incorporating temperature change effects according to European standards for carbon steel at different temperatures. Similarly, concrete02Thermal material is modeled after concrete02 behavior, incorporating temperature change effects according to European standards at different temperatures [35].
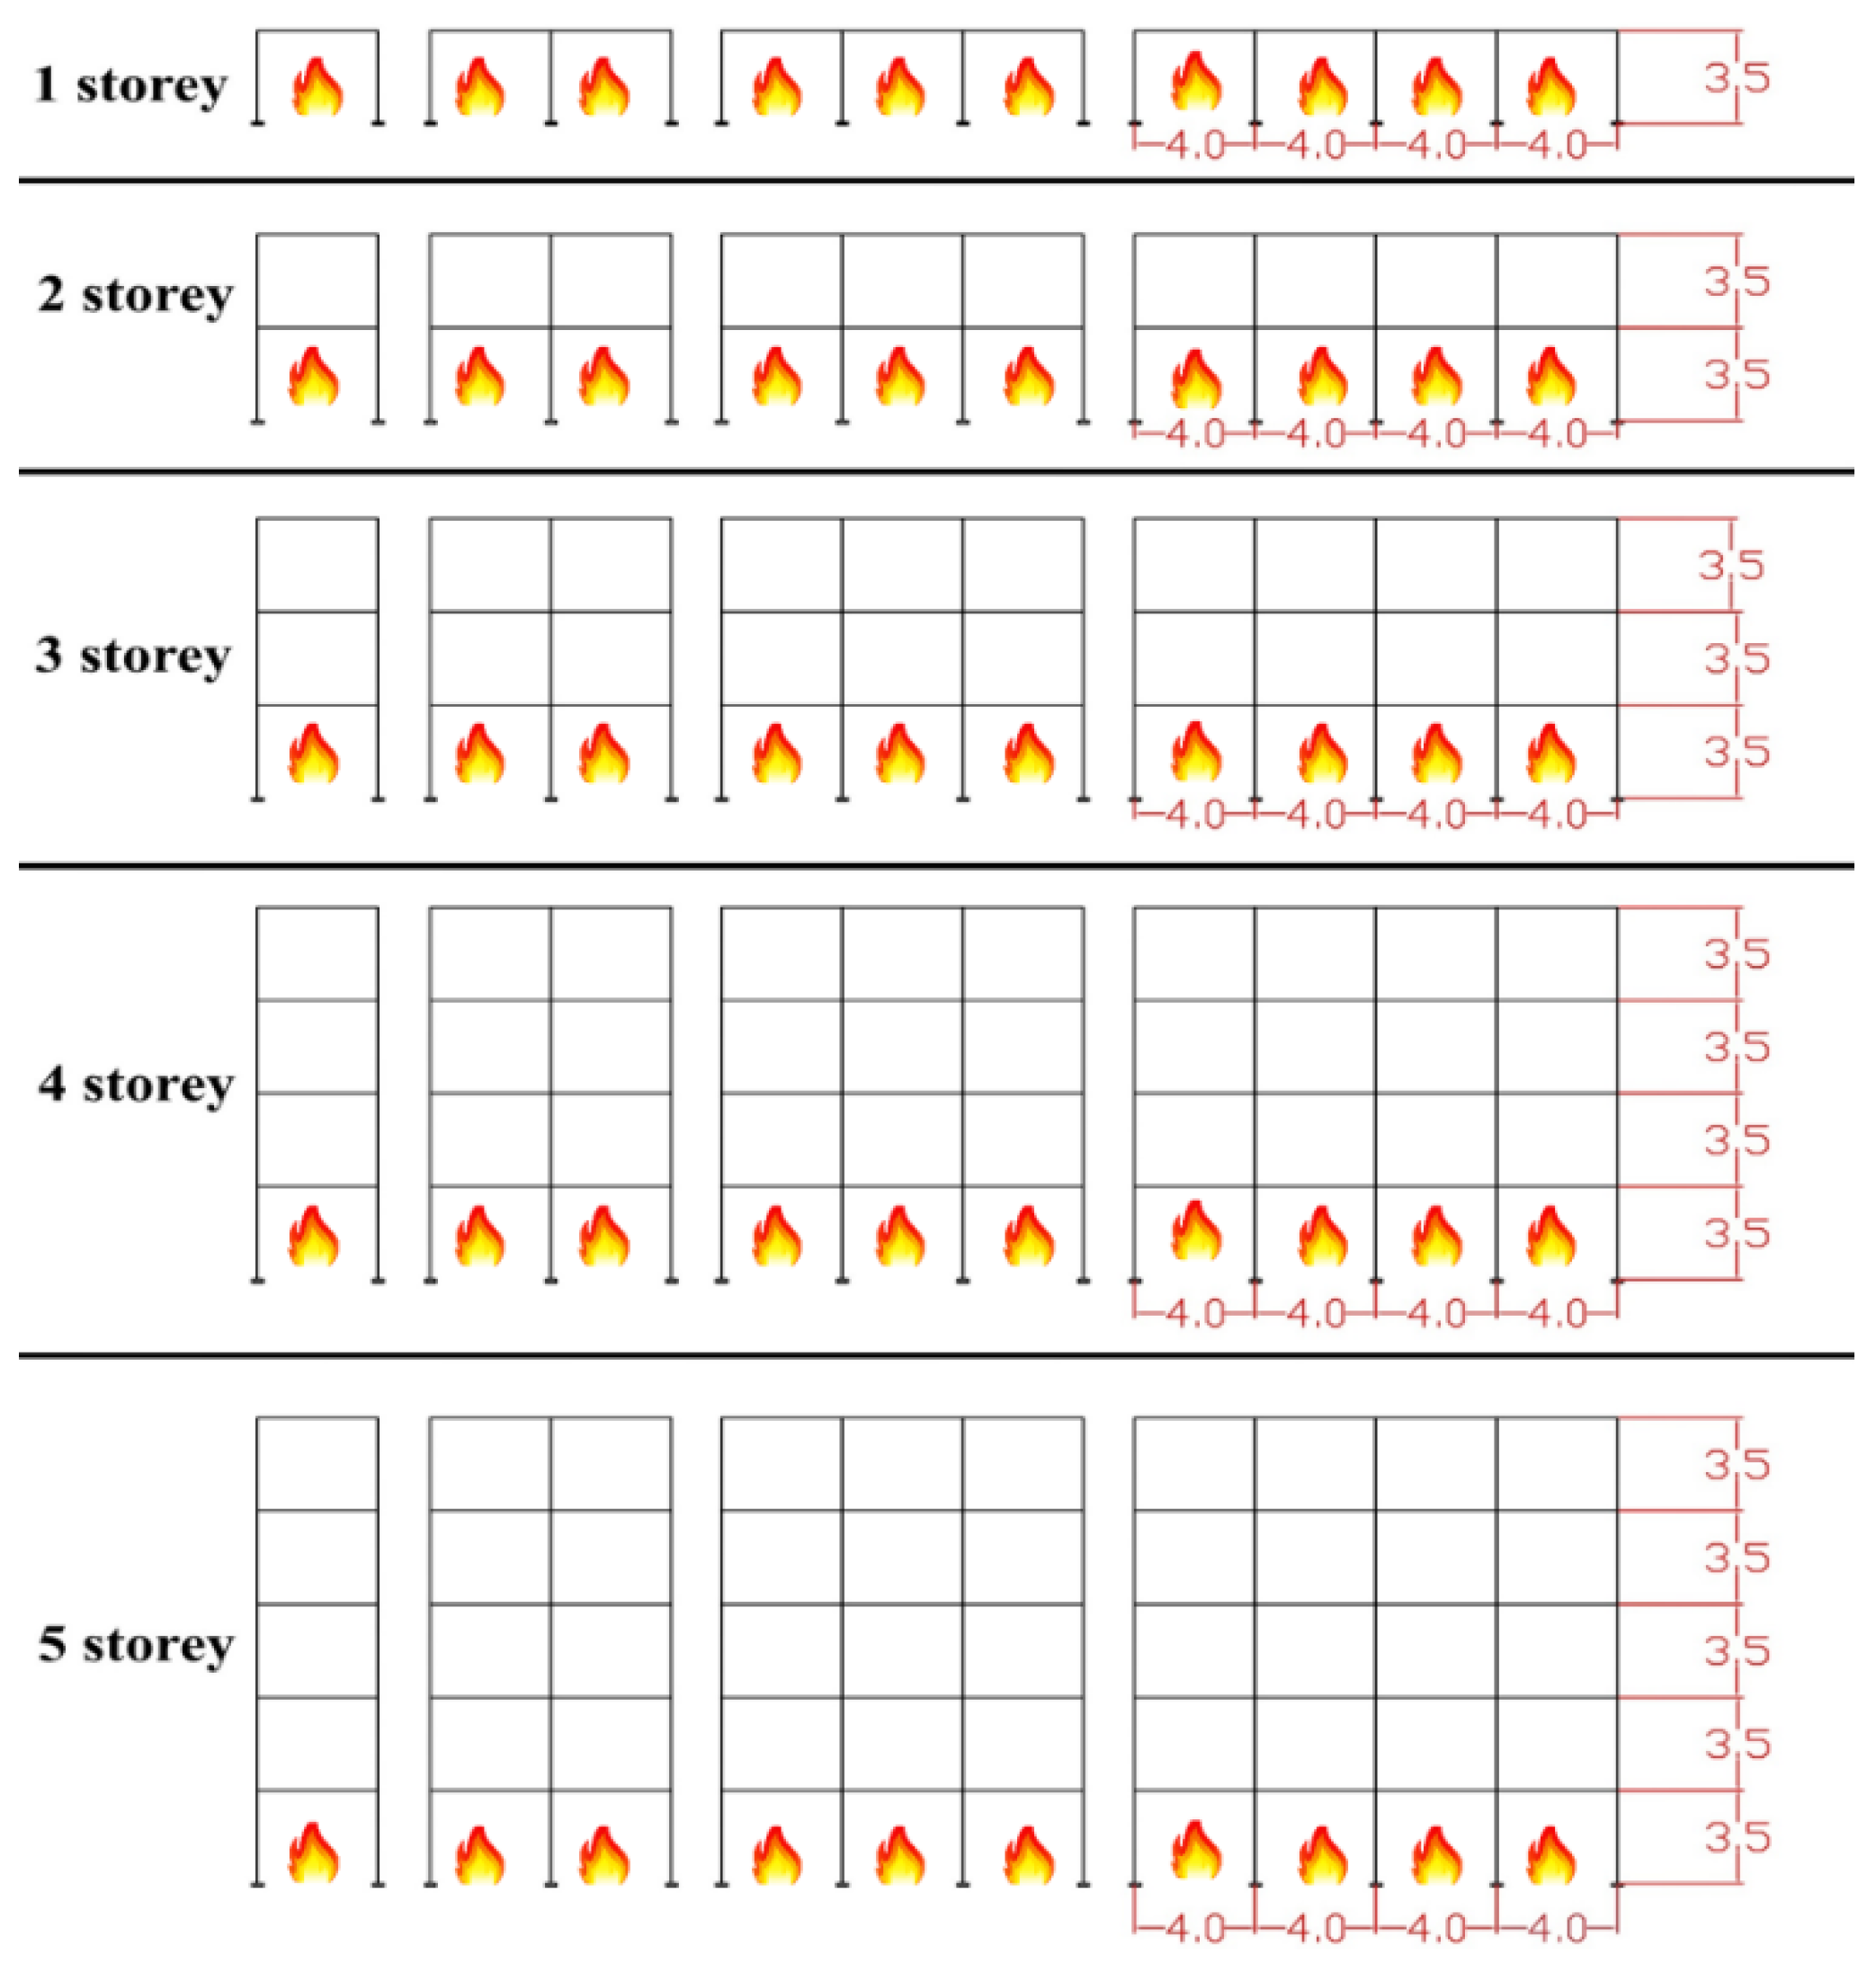
For thermal analysis purposes, FiberThermal sections are used to define moment frame elements. Thermal loads are defined by Python programming and applied to the desired floors of the frames. Structural failure is checked based on one of the following criteria: reinforcement temperature control (i.e., 550 °C), mid-span displacement L/20, or the rate of deflection L2/9000 d, where L and d represent beam length and section depth, respectively [36]. In summary, this code first defines concrete02Thermal and Steel01Thermal materials and then specifies FiberThermal sections for moment frame elements. Finally, the ISO 834 fire is applied to the first floor, as shown schematically in Figure 4, and thermal–structural analyses are performed. Since thermal analyses are conducted by Python programming, parameter optimization and modification are easily facilitated, and results are carefully examined.

3.3. Machine Learning

The inputs for an algorithm are the main features for FRR, such as the number of spans, number of floors, span length, soil type, and seismic hazard level.
The interpretation of model coefficients is affected by feature dependency, as individual features can significantly influence variations in other features, leading to potential misattributions of effect sizes and interactions. Such models demonstrate decreased susceptibility to training data overfitting, thus leading to improved performance when handling new data. The dependence of design features on other features leads to the elimination of specific features for enhanced learning performance [37]. ML algorithms usually require 70% of the data for training purposes, 15% for validation, and 15% for testing. There are several reasons behind this practice of division.
Model Training: A total of 70% of the data is used to learn the parameters of the model.
Hyperparameter Tuning: A total of 15% of the data is used for validation to monitor model performance during training and optimize parameters.
Evaluation: A total of 15% of the data is allocated for testing to measure actual model performance on new, unseen data.
Balance between Training and Evaluation: These ratios provide an appropriate balance between training and evaluation data.
Prevention of Overfitting and Underfitting: The ratios are set to prevent overfitting and underfitting [38]. Since using independent data for final model evaluation helps ensure generalizability and accuracy, this work follows this data division approach.
The data from prior phases led to the development of Random Forest Regression and Gradient Boosting, as well as Support Vector Regression. Random Forest Regression demonstrates strong capabilities in handling complex, non-linear data with interdependent variables. By integrating multiple decision trees into an ensemble, the risk of overfitting is effectively reduced [38]. Gradient Boosting delivers excellent prediction accuracy through its strength of creating robust predictions using elementary models. Reliable and adjustable models emerge from Gradient Boosting because they support diverse data formats along with multiple prediction challenges [37].
Table 2 compares the accuracy and error rates of Random Forest Regression, Gradient Boosting, and Support Vector Regression across test and validation datasets, using MSE, MAE, and the R2 as evaluation metrics. Random Forest Regression outperforms the other models, achieving the highest R2 and the lowest error rates. Gradient Boosting delivers comparable performance but remains slightly inferior. Among the three models, Support Vector Regression demonstrates the highest error rates and the lowest R2 values, indicating its weaker predictive performance. Therefore, Random Forest Regression is considered the preferred method.
The model is trained using a bootstrapping process, where multiple samples are drawn with replacements from the original dataset. Each bootstrap sample is used to construct a decision tree, with random feature subsets employed at each node to determine the best split. Trees are grown to their full depth without pruning. Predictions for new samples are obtained by aggregating the outputs from all trees in the forest [39].
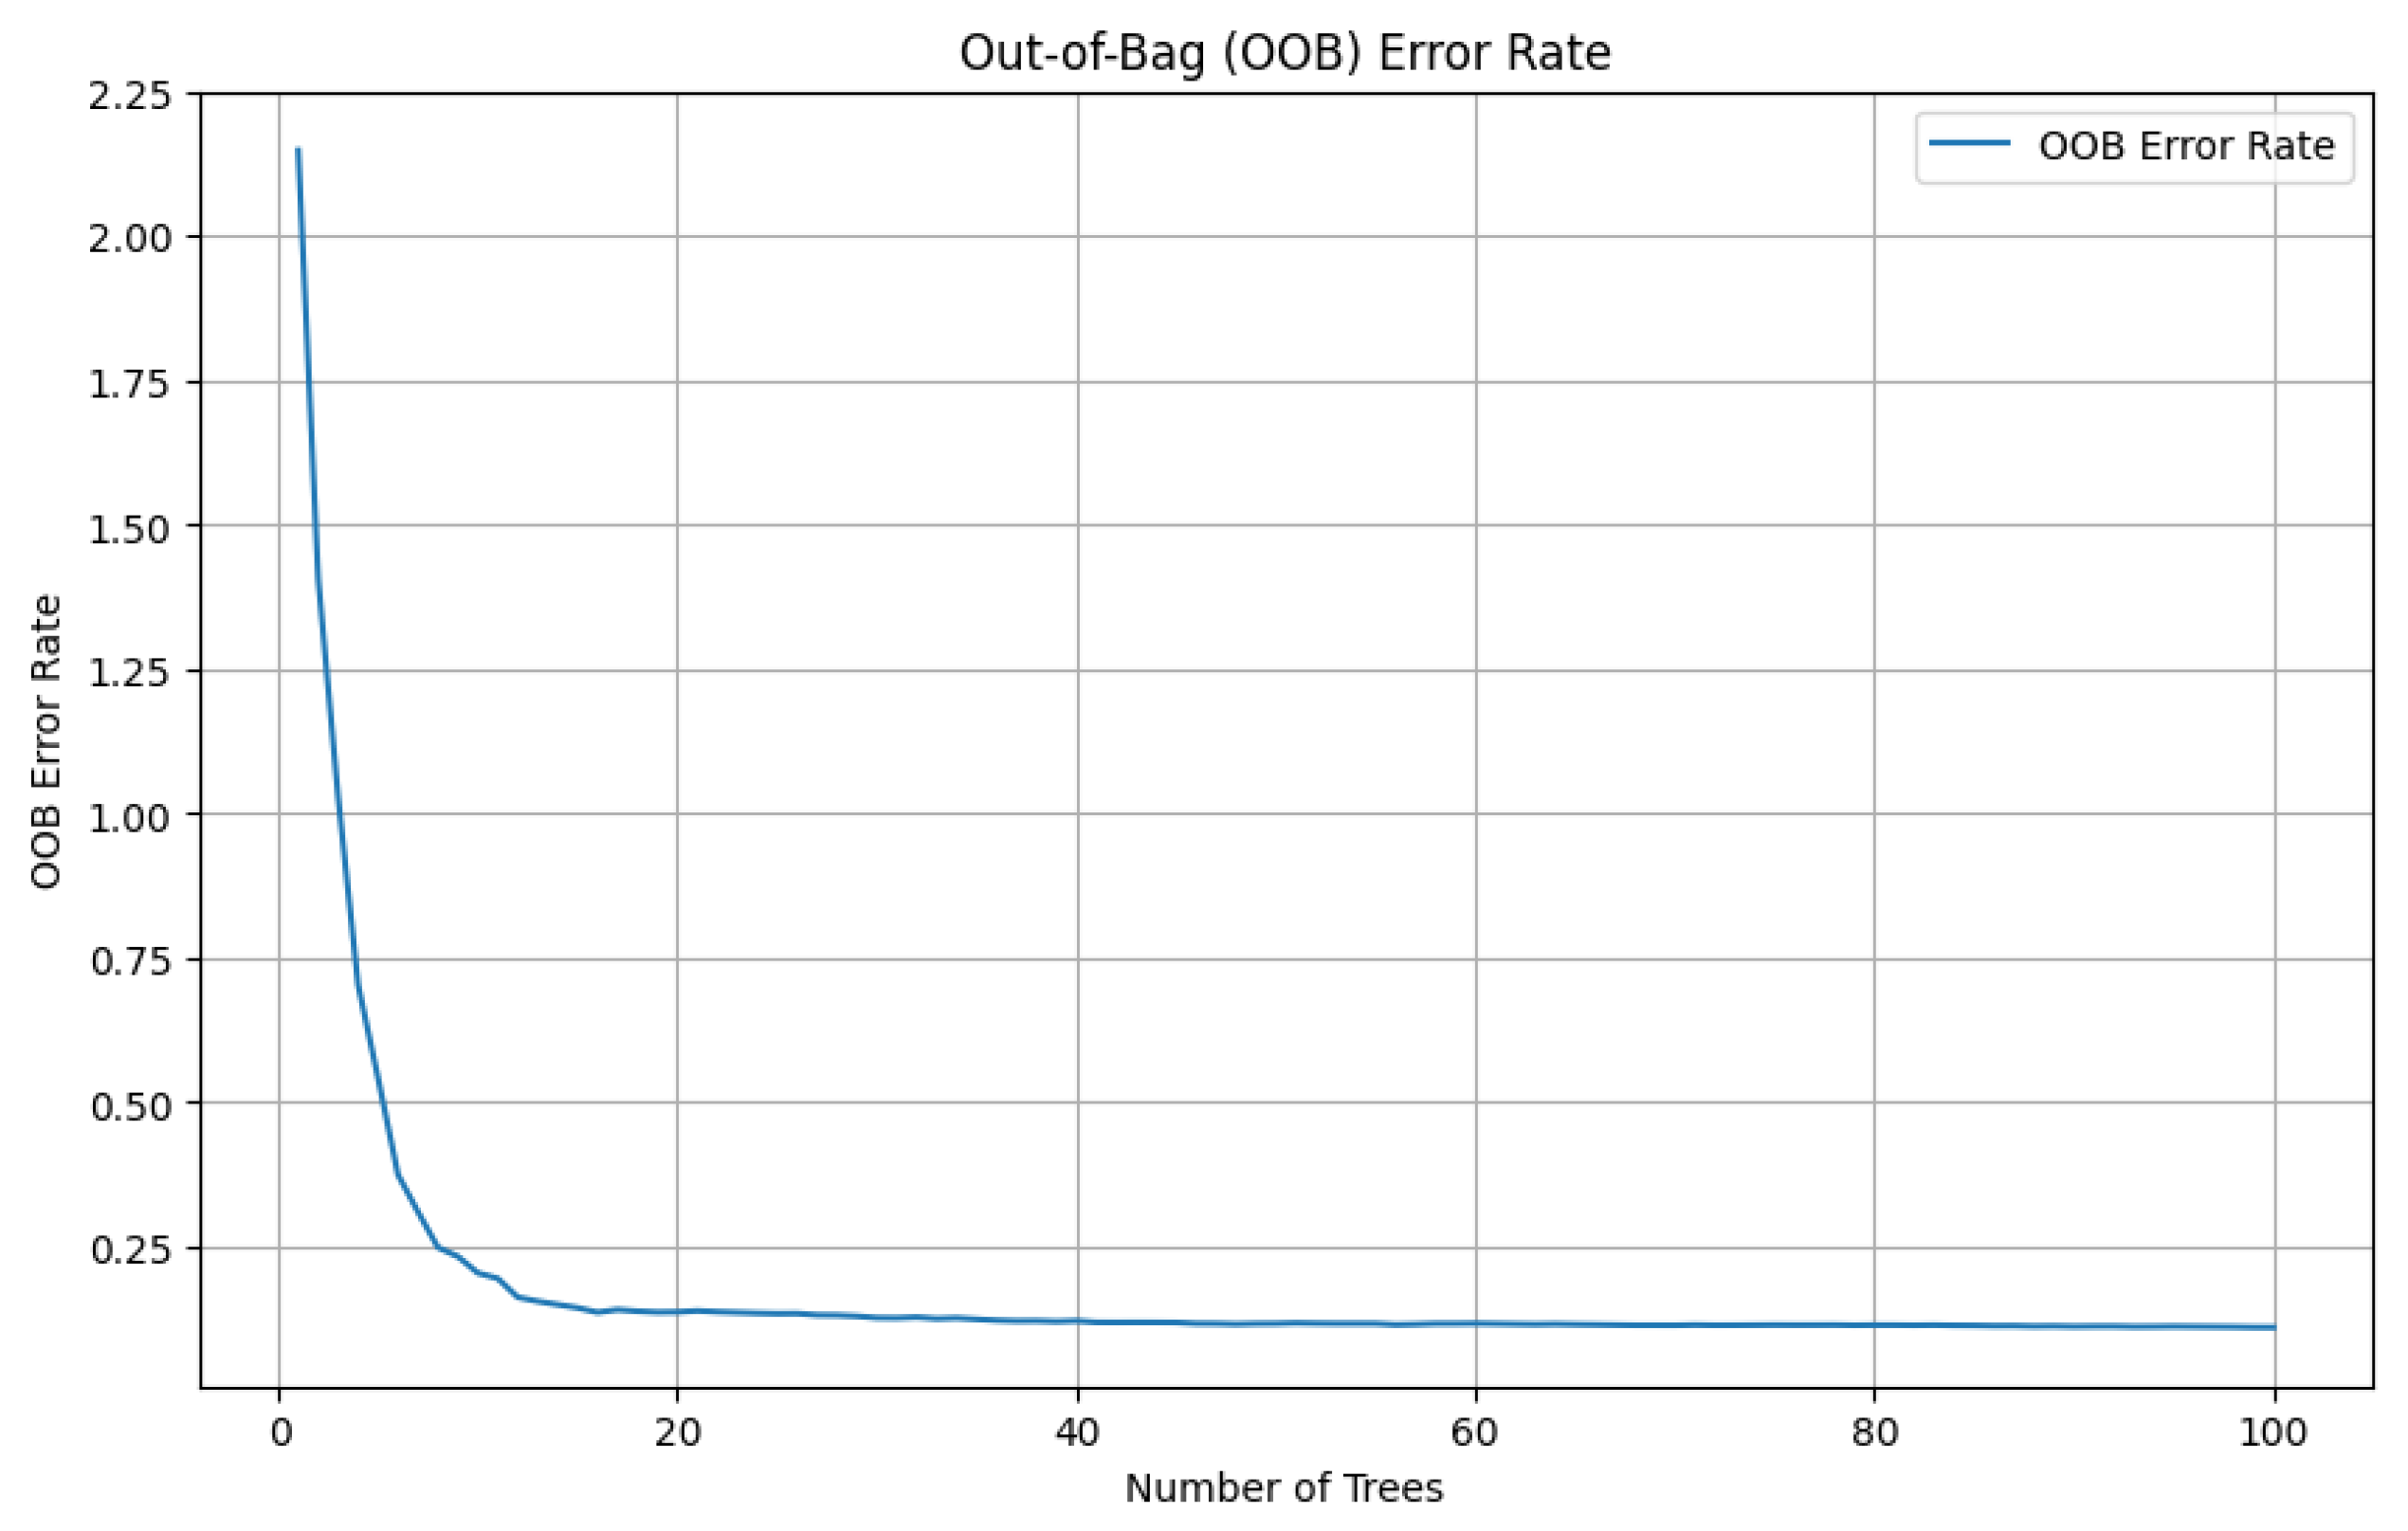
The Out-of-Bag (OOB) error rate appears in Figure 5 based on the Random Forest tree numbers. The demonstrated relationship between model accuracy and tree quantity is shown in this graph. The model accuracy shows a steep reduction when more trees are included for the initial part of the analysis. The error rate decreases with a lower slope after 20 trees are used. Increasing tree numbers leads to a decreased positive influence on error reduction. The accuracy level stabilizes at an almost constant rate when the tree quantity reaches approximately 40, and further additions of trees produce no noticeable improvements to model accuracy. Further, increasing the number of trees does not enhance performance but adds computational overhead. Thus, an optimal balance is required to achieve high accuracy while minimizing computational costs. The figure shows that the OOB error rate reaches its minimum value when the model operates with between 20 and 40 trees. Further addition of the trees fails to enhance the performance of the model.

4. Data Analysis

The analysis of seismic design on the FRRs for the models required a predictive model development through the examination of 1760 frames of testing. Through the analysis procedure, important findings were derived and are explained in the following sections.

4.1. Effect of Number of Stories

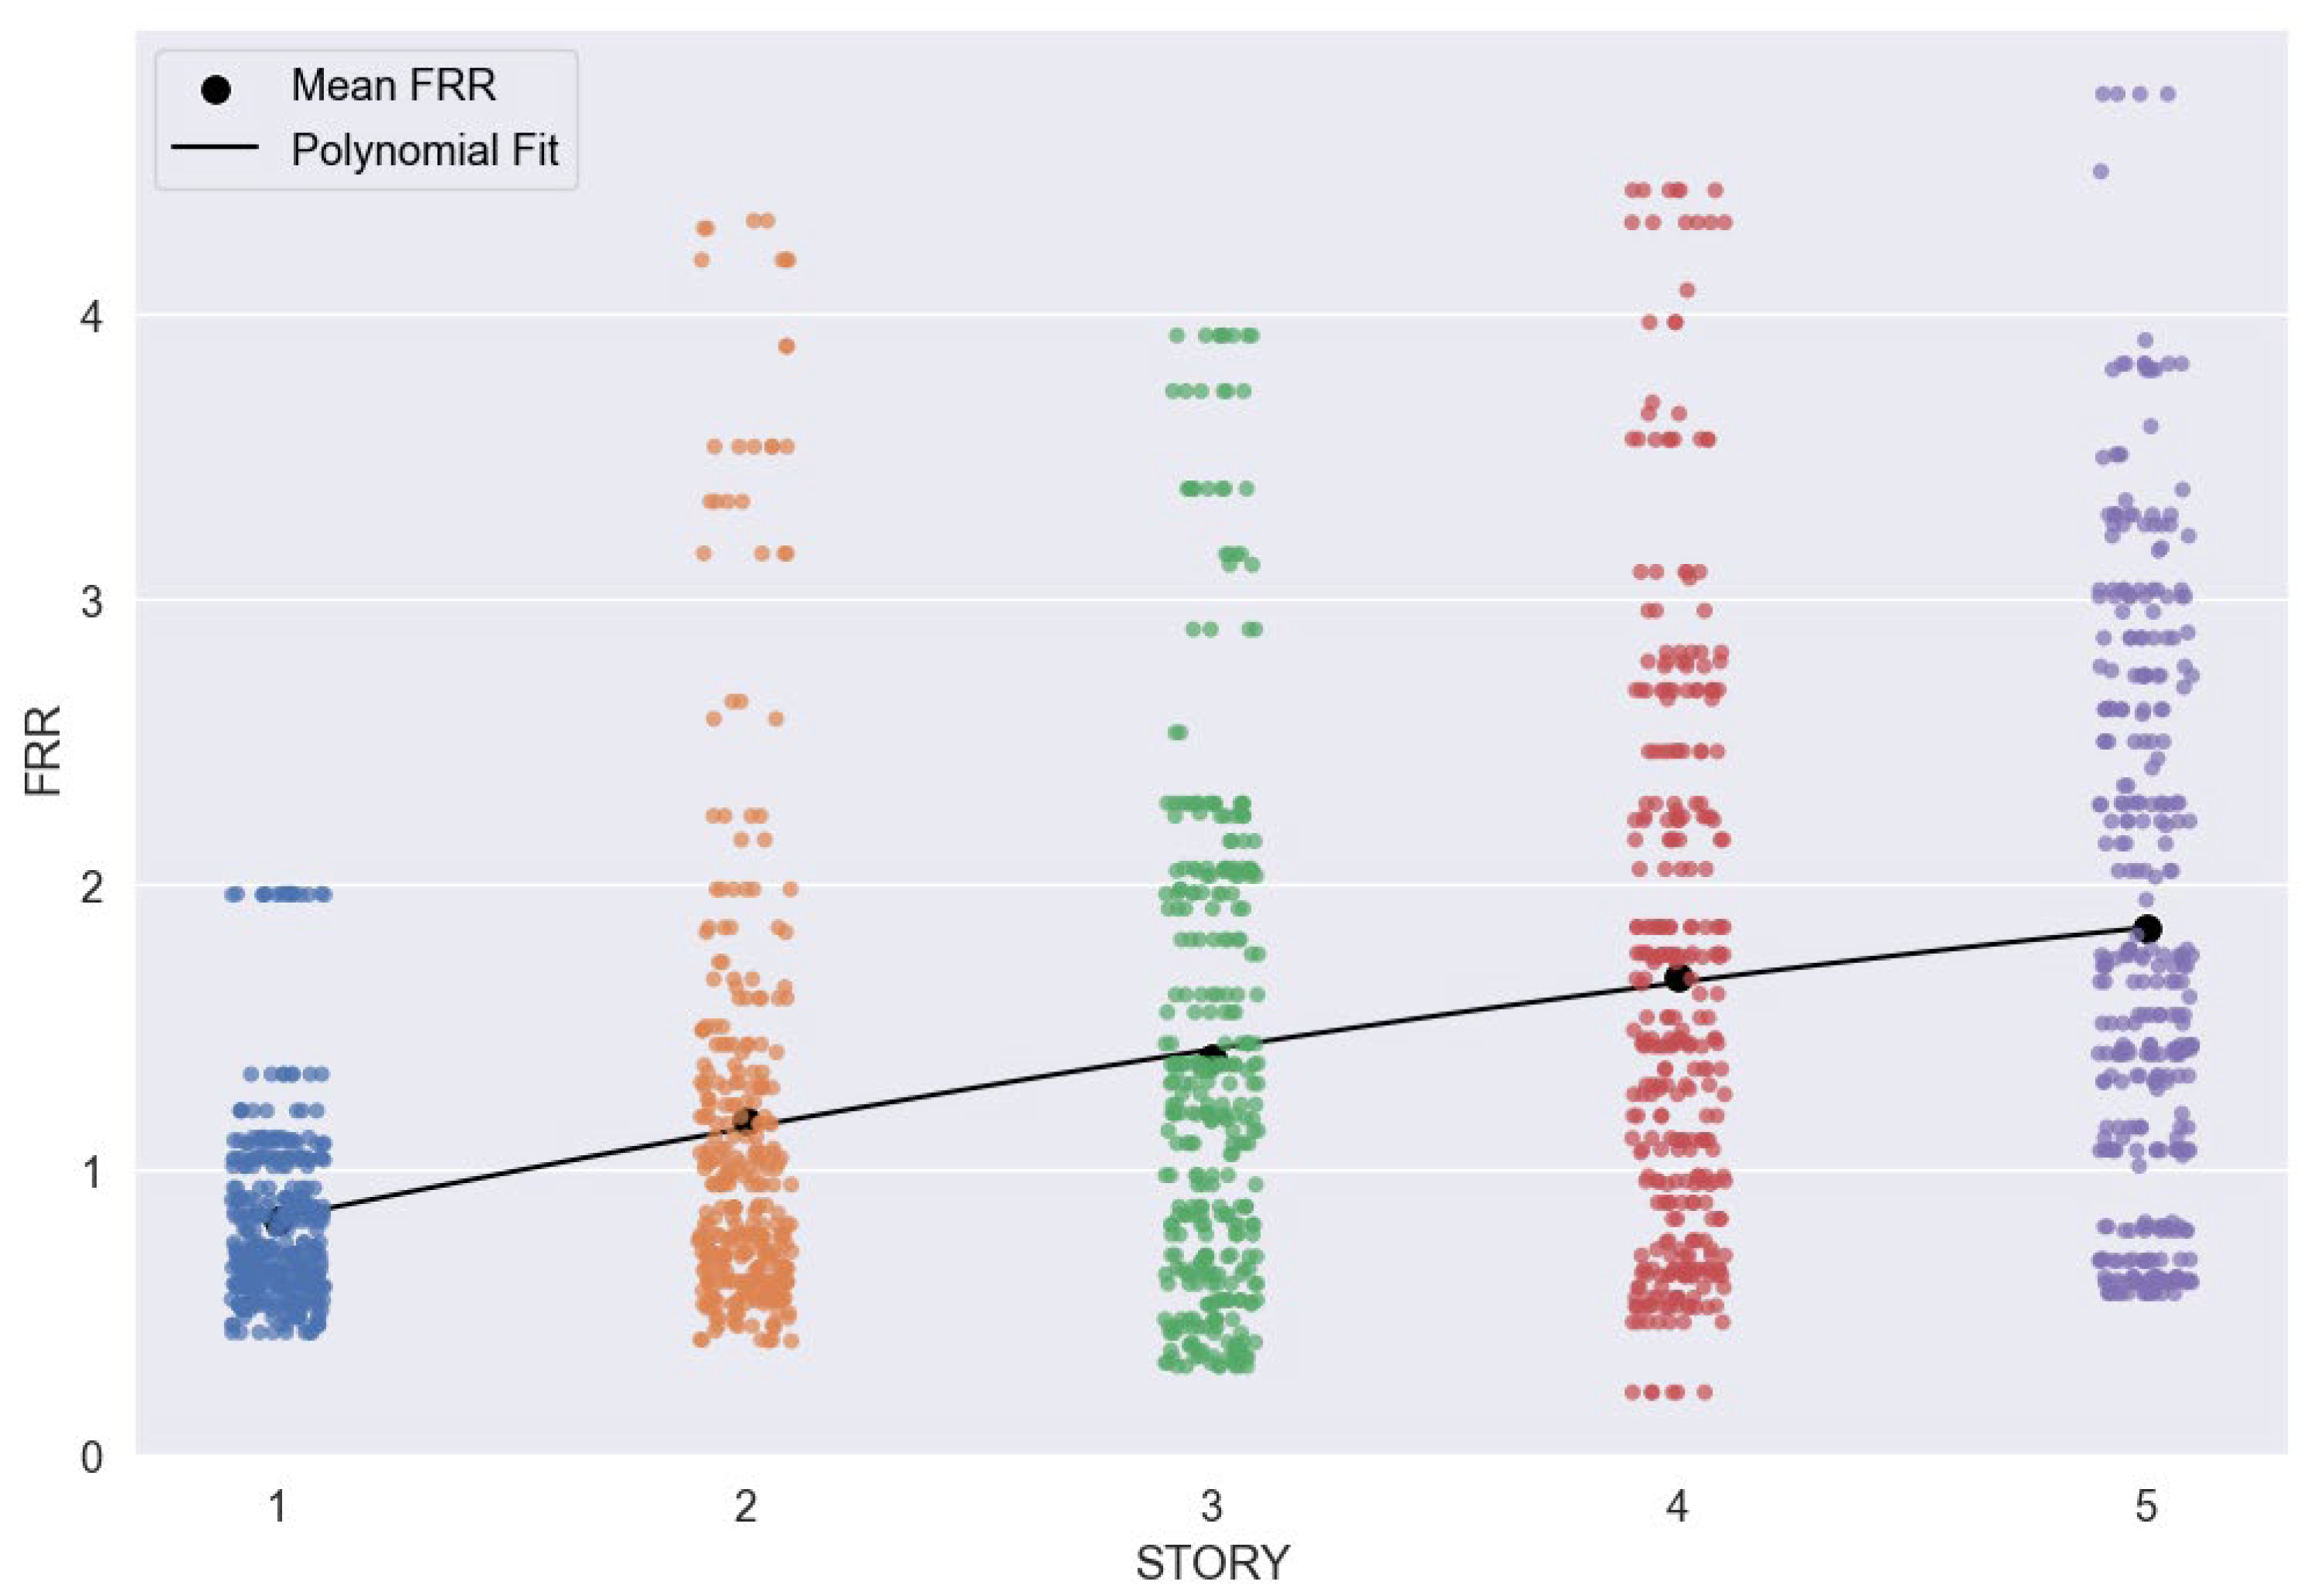
FRR increases in direct proportion to the number of stories; taller structures exhibit an enhanced capacity to absorb heat loads, thereby improving fire resistance. Figure 6 illustrates this positive correlation, with FRR values rising as the number of stories increases. Specifically, when the number of stories is one, the average FRR is 0.82 h, increasing to 1.17 h for two stories, 1.39 h for three stories, 1.67 h for four stories, and reaching 1.84 h for five stories. This trend highlights the structural benefits of multi-story buildings in enhancing fire performance.

4.2. Effect of Number of Spans

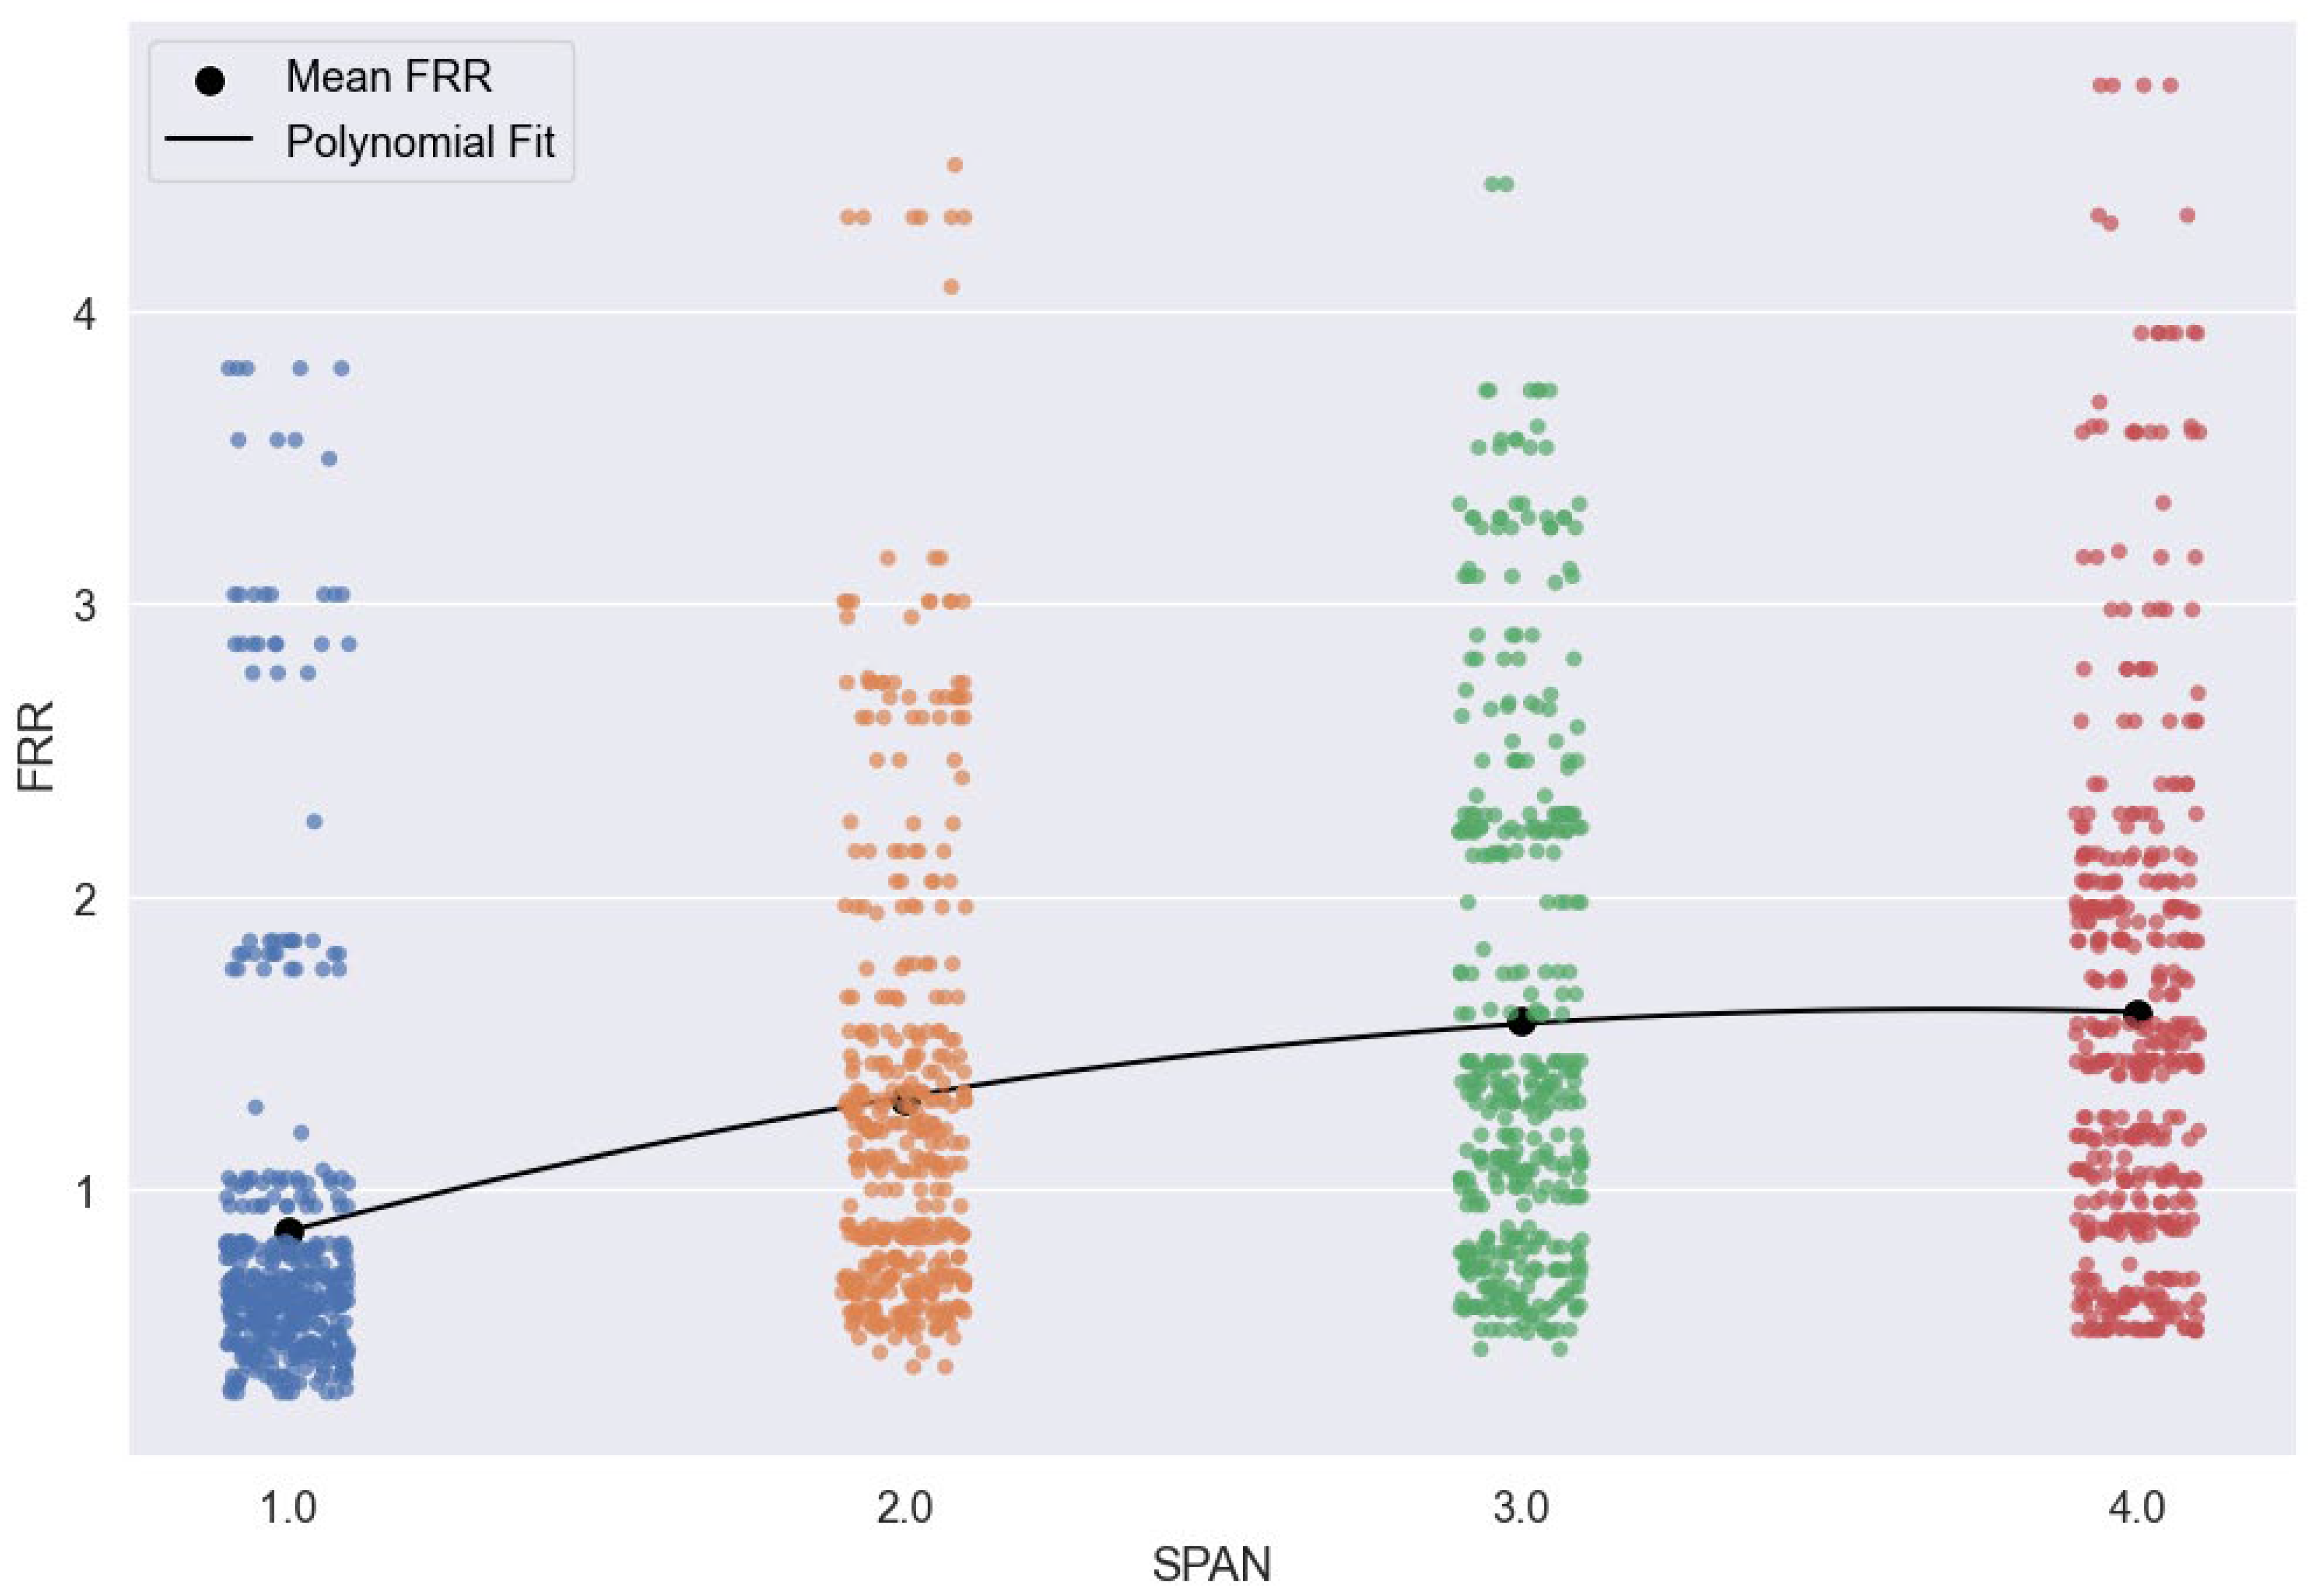
A larger number of spans within a structure enhances its redundancy, as additional spans enable the design to redistribute loads toward surviving structural components during the fire. This increase in structural redundancy effectively mitigates the concentration of thermal loads, thereby improving overall fire safety performance. As illustrated in Figure 7, the FRR demonstrates a positive correlation with the number of spans: an average FRR of 0.86 is observed for one span, 1.30 for two spans, 1.58 for three spans, and 1.60 for four spans. These findings highlight the importance of incorporating multiple spans in design to bolster fire resistance through fire load distribution. However, this trend indicates that beyond a certain level of redundancy, the impact diminishes, and the FRR stabilizes.

4.3. Effect of Seismic Hazard Level

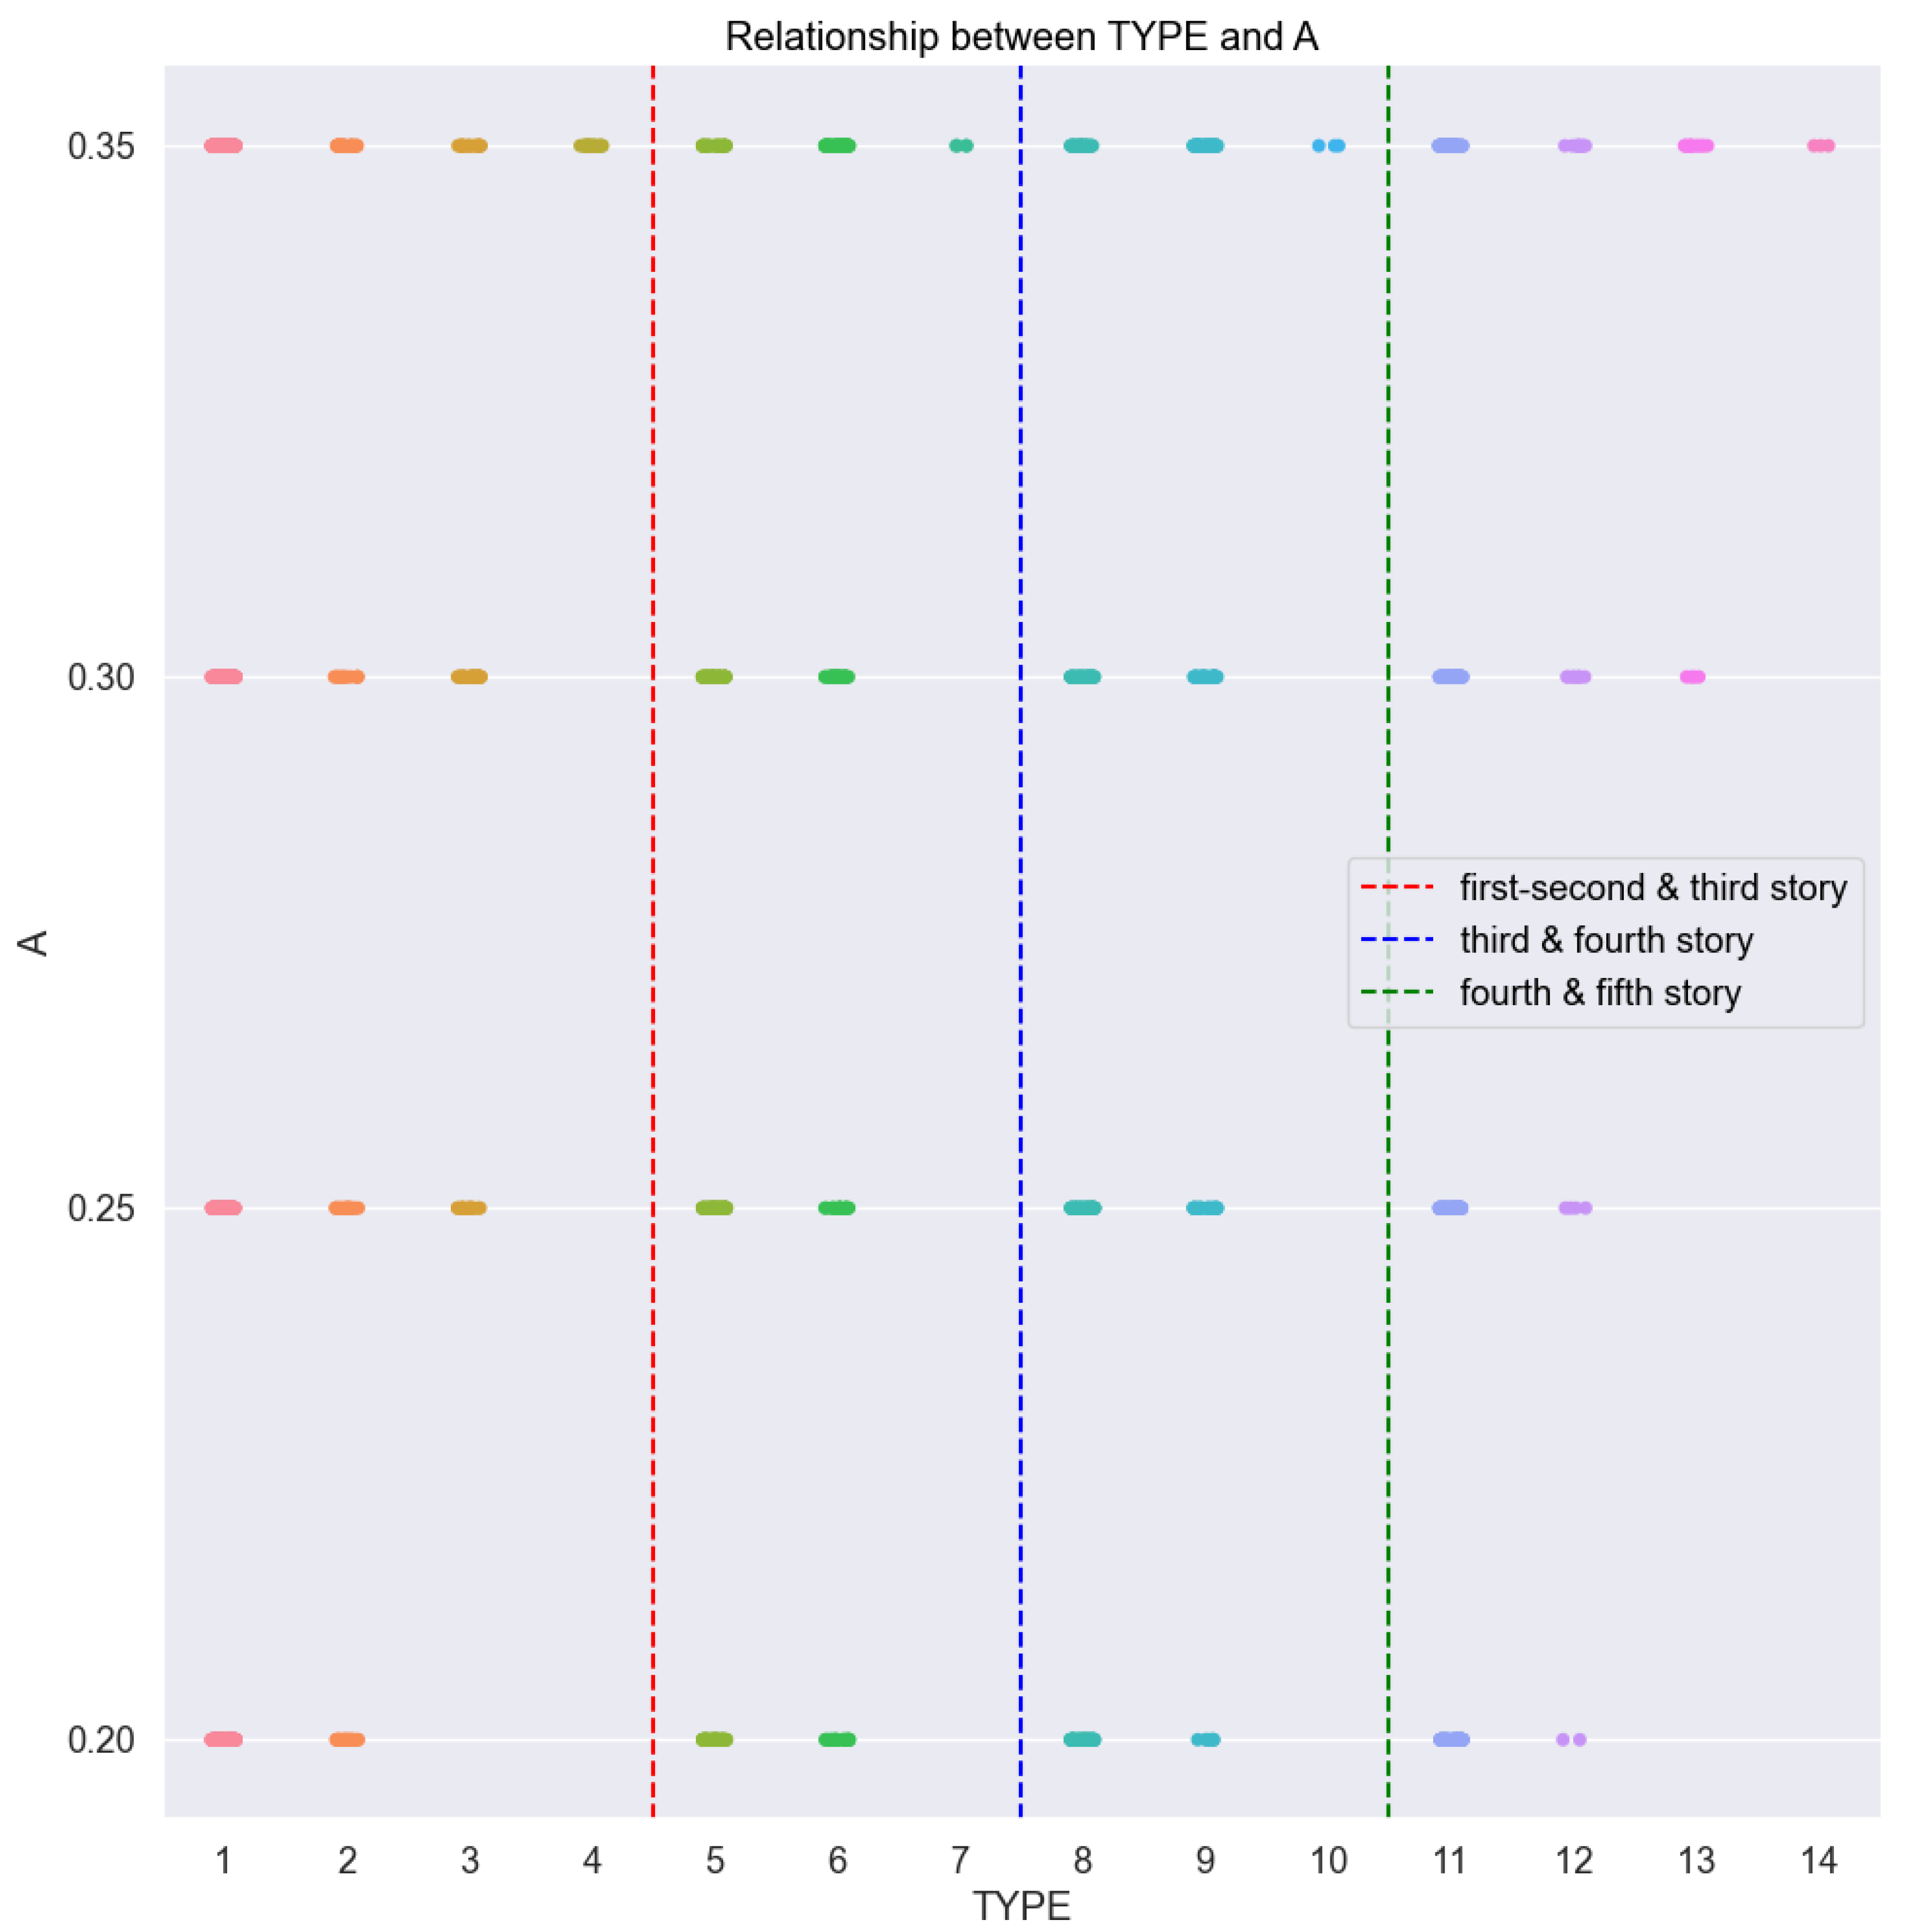
As Figure 8 illustrates, seismic hazard levels increase the physical size of structural elements, thus enhancing their fire-resistance potential.
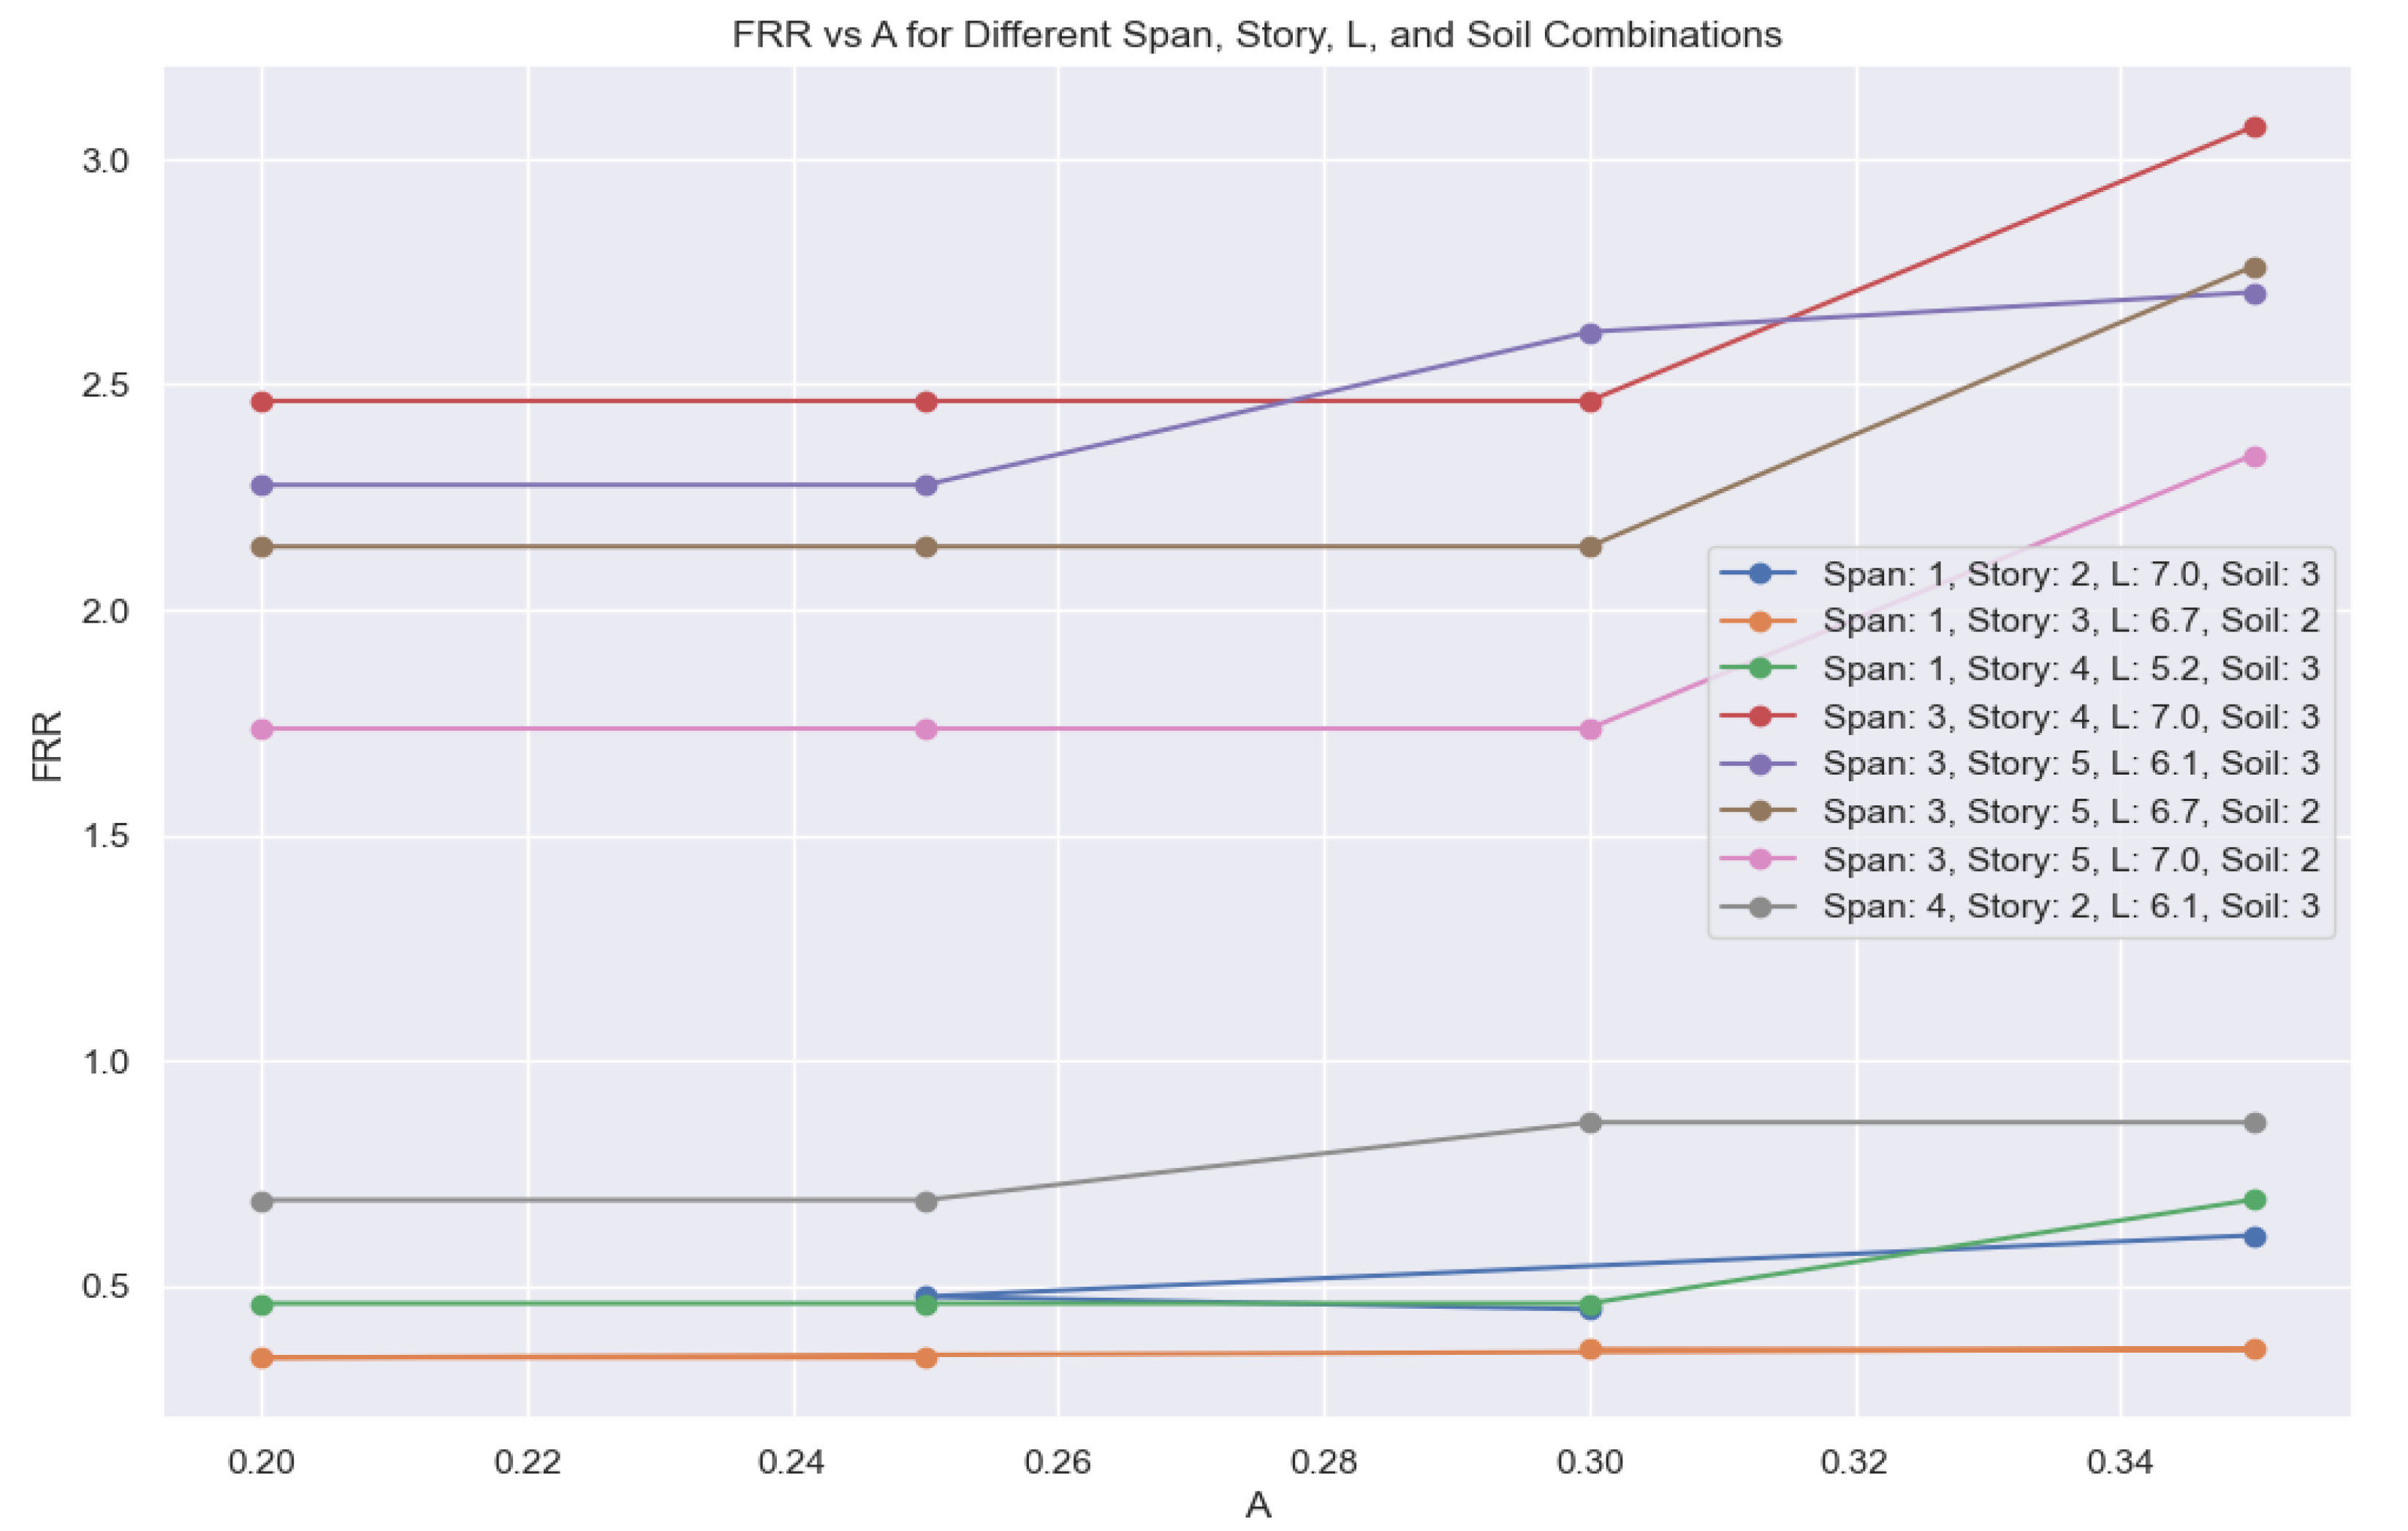
Using ten randomly chosen samples, the results here show the connection between FRR and the base acceleration (A). The relationship demonstrates different combinations of spans, stories, span lengths, and soil types, as shown in Figure 9. The FRR of construction elements tends to increase as the base accelerations increase. A limited number of instances exist where the base acceleration increases have no impact on structural design, resulting in stable FRRs. Specific FRR persists in cases that combine “1 span alongside 2 stories with 7 m span length and soil type 3” as examples. FRR increases proportionally when section dimensions expand. Building frames that are built to withstand stronger earthquakes possess enhanced FRR incidents. The data presented in Figure 10 shows how a section area affects FRR. Stronger structural reinforcement and larger sections are required by increased seismic hazard levels to achieve better FRRs.

4.4. Effect of Span Length

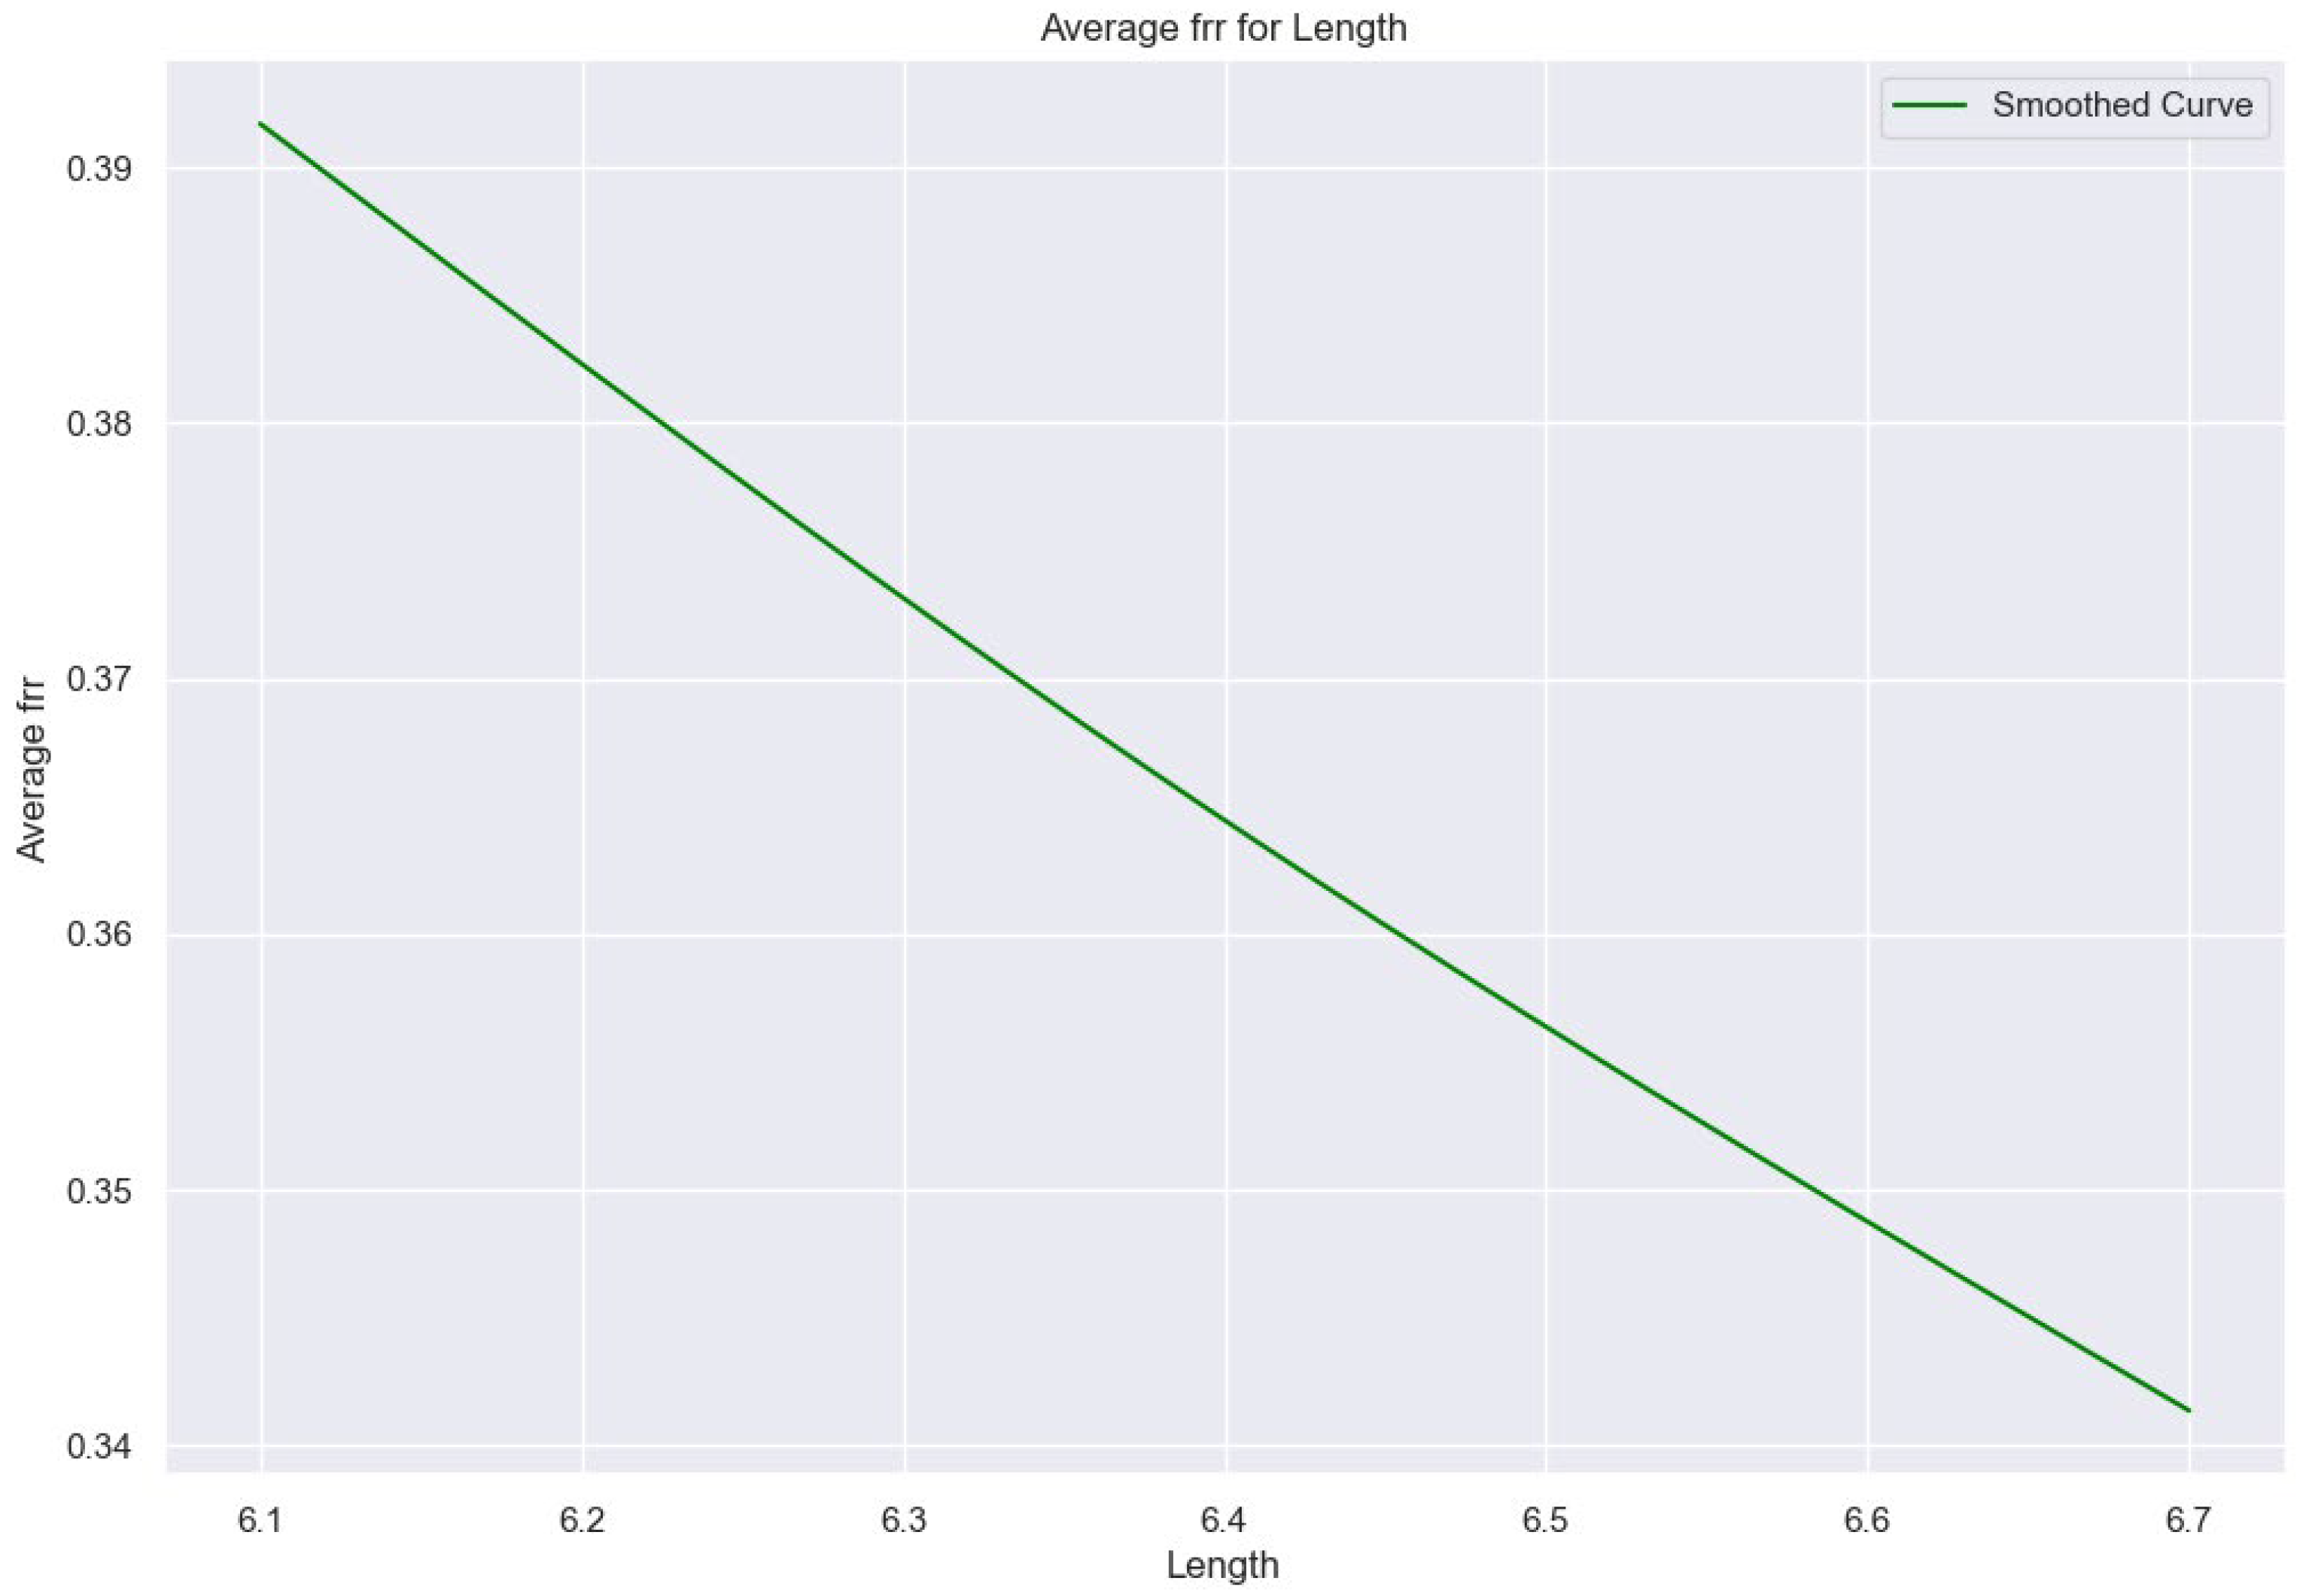
The results demonstrate a clear inverse relationship between FRR and span length, with FRR decreasing as span length increases. As illustrated in Figure 11, while these other factors are held constant, the FRR exhibits a proportional decrease with increasing span length, particularly within the critical range of 6.1 to 7.0 m. This suggests that buildings with longer spans are more prone to the effects of thermal loading, potentially compromising their FRR.

4.5. Random Forest Model Analysis for FRR Prediction

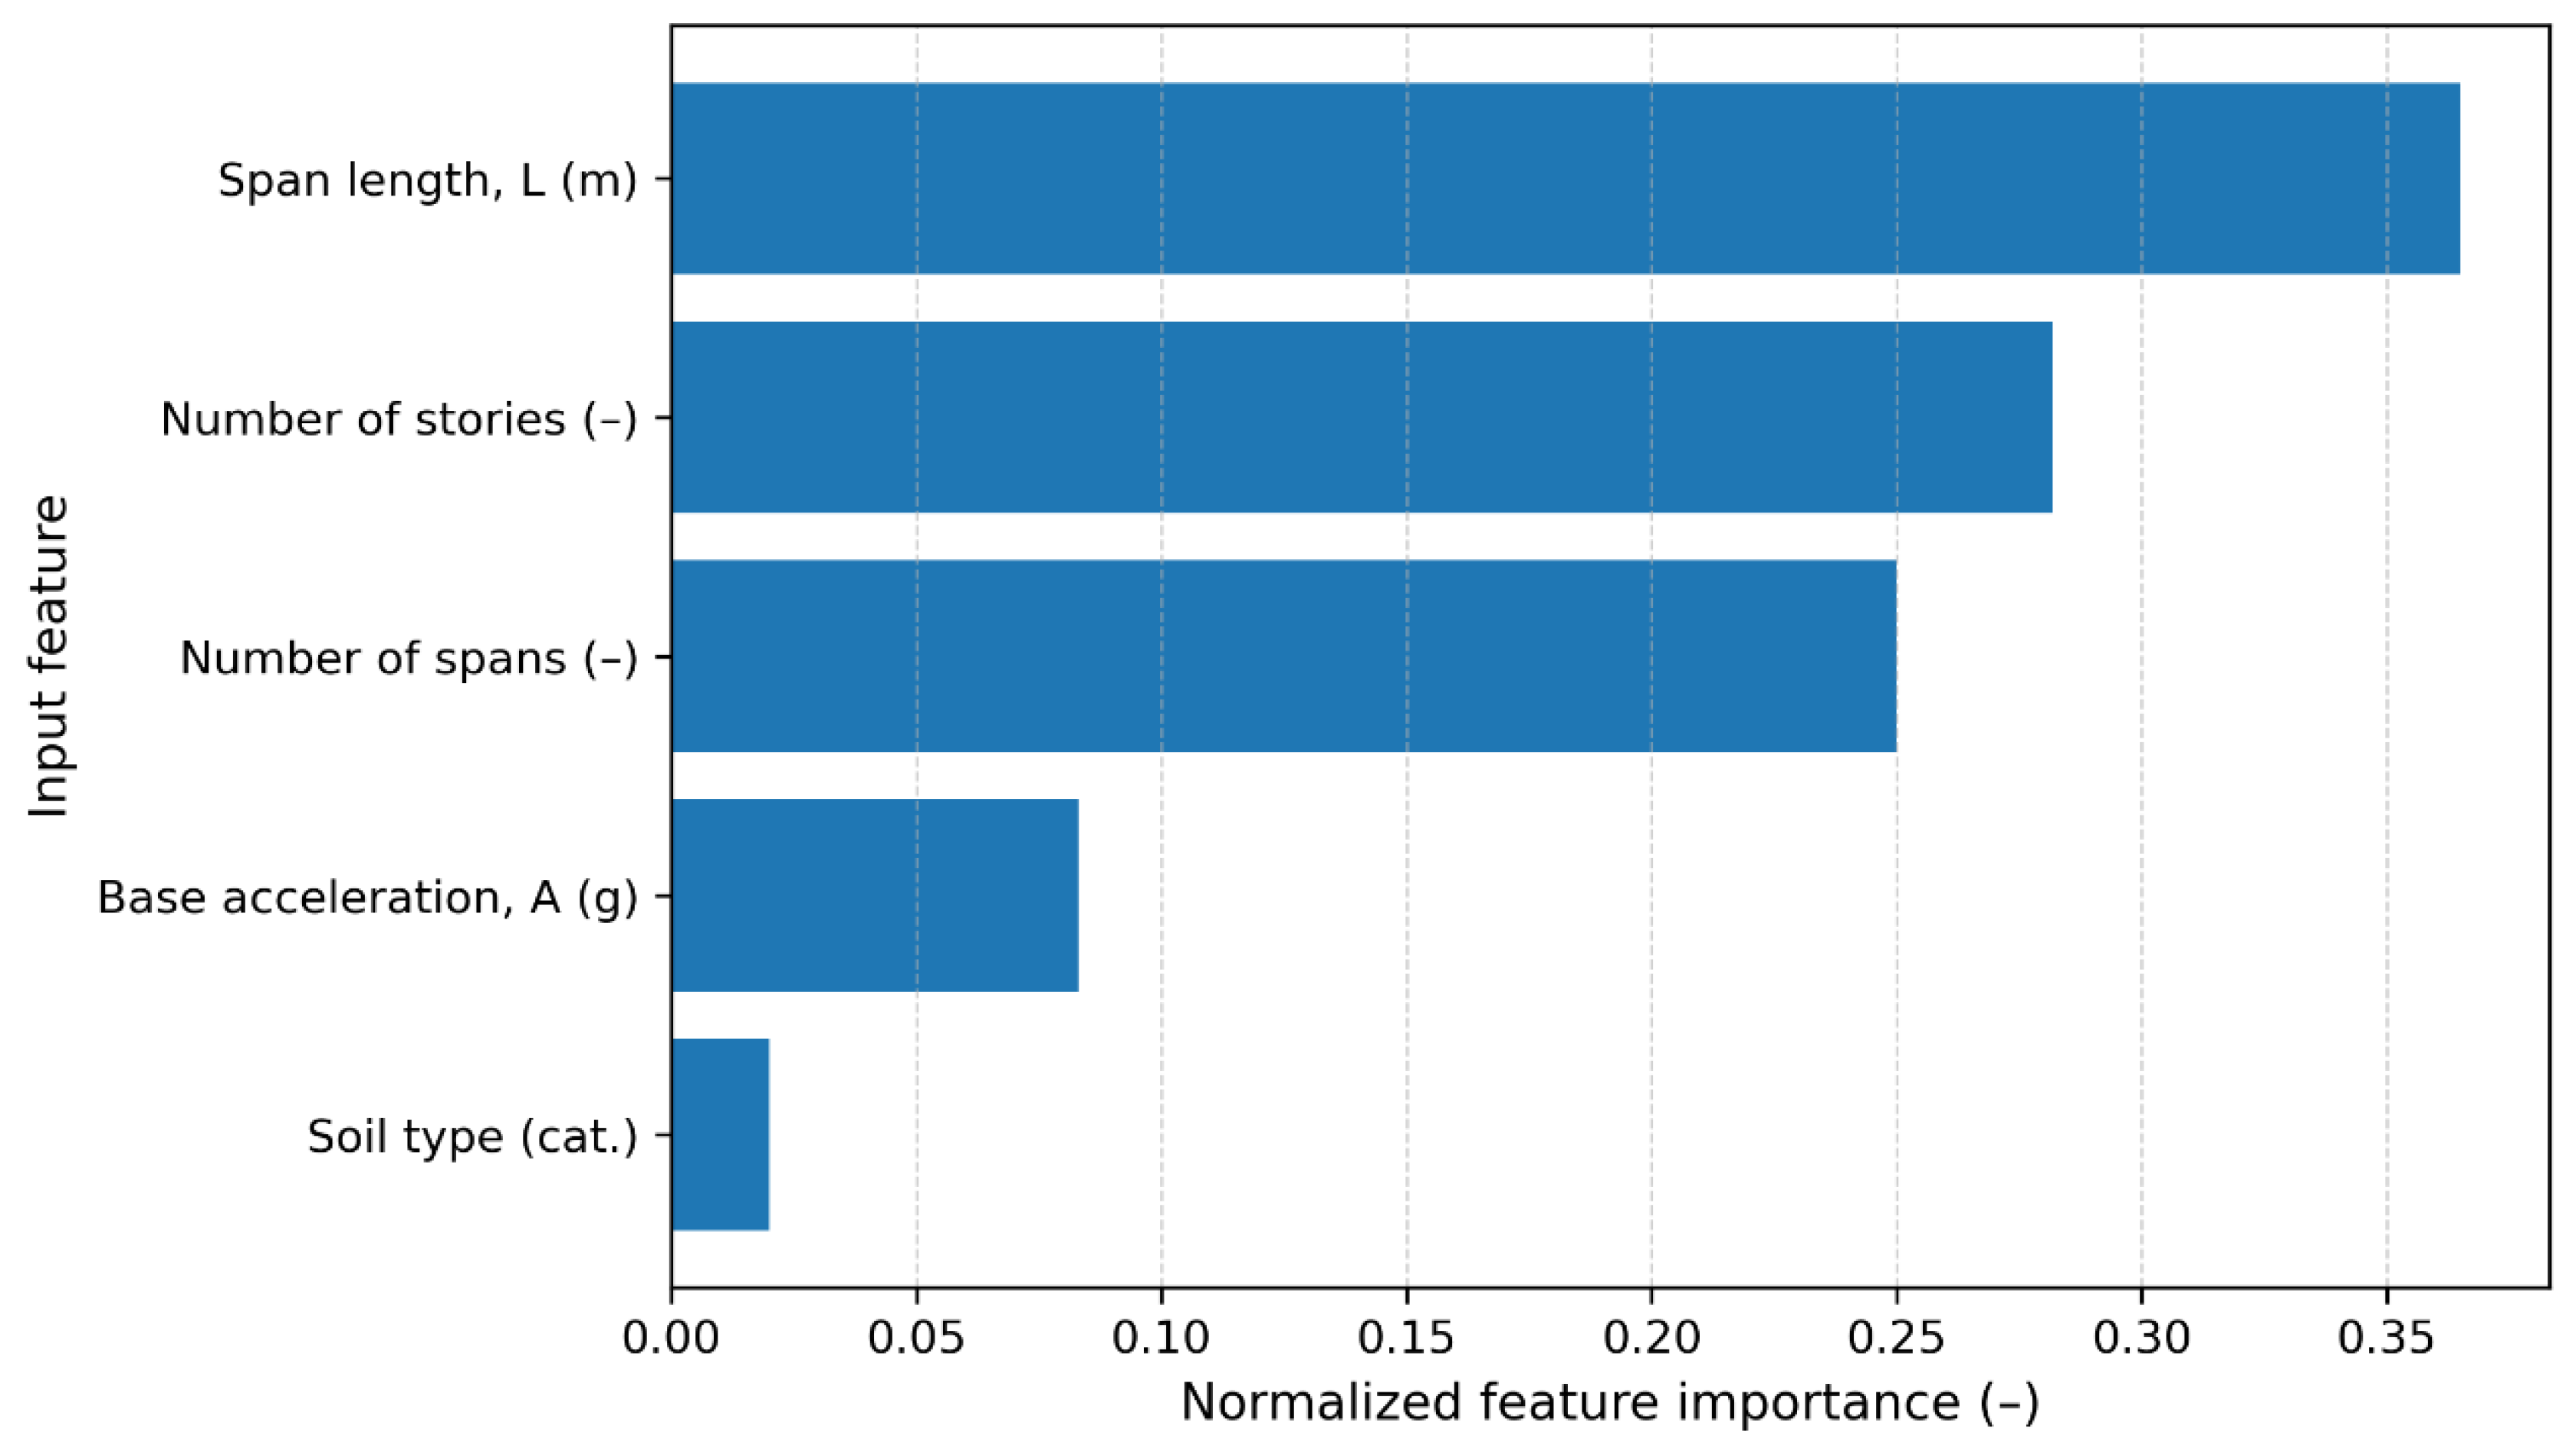
Figure 12 shows the relative importance of different features in predicting FRR using Random Forest Regression. As shown, span length is of the highest importance, with approximately 35% weight. Following that are the number of stories, the number of spans, and the design base acceleration in subsequent ranks. Finally, soil type has the least importance in the model, contributing less than 5%. This analysis highlights that span length and the number of stories are the primary determinants of FRR. Furthermore, as shown in Figure 12, when the number of spans, span length, and number of stories remain constant, the base acceleration has a more pronounced effect on FRR.
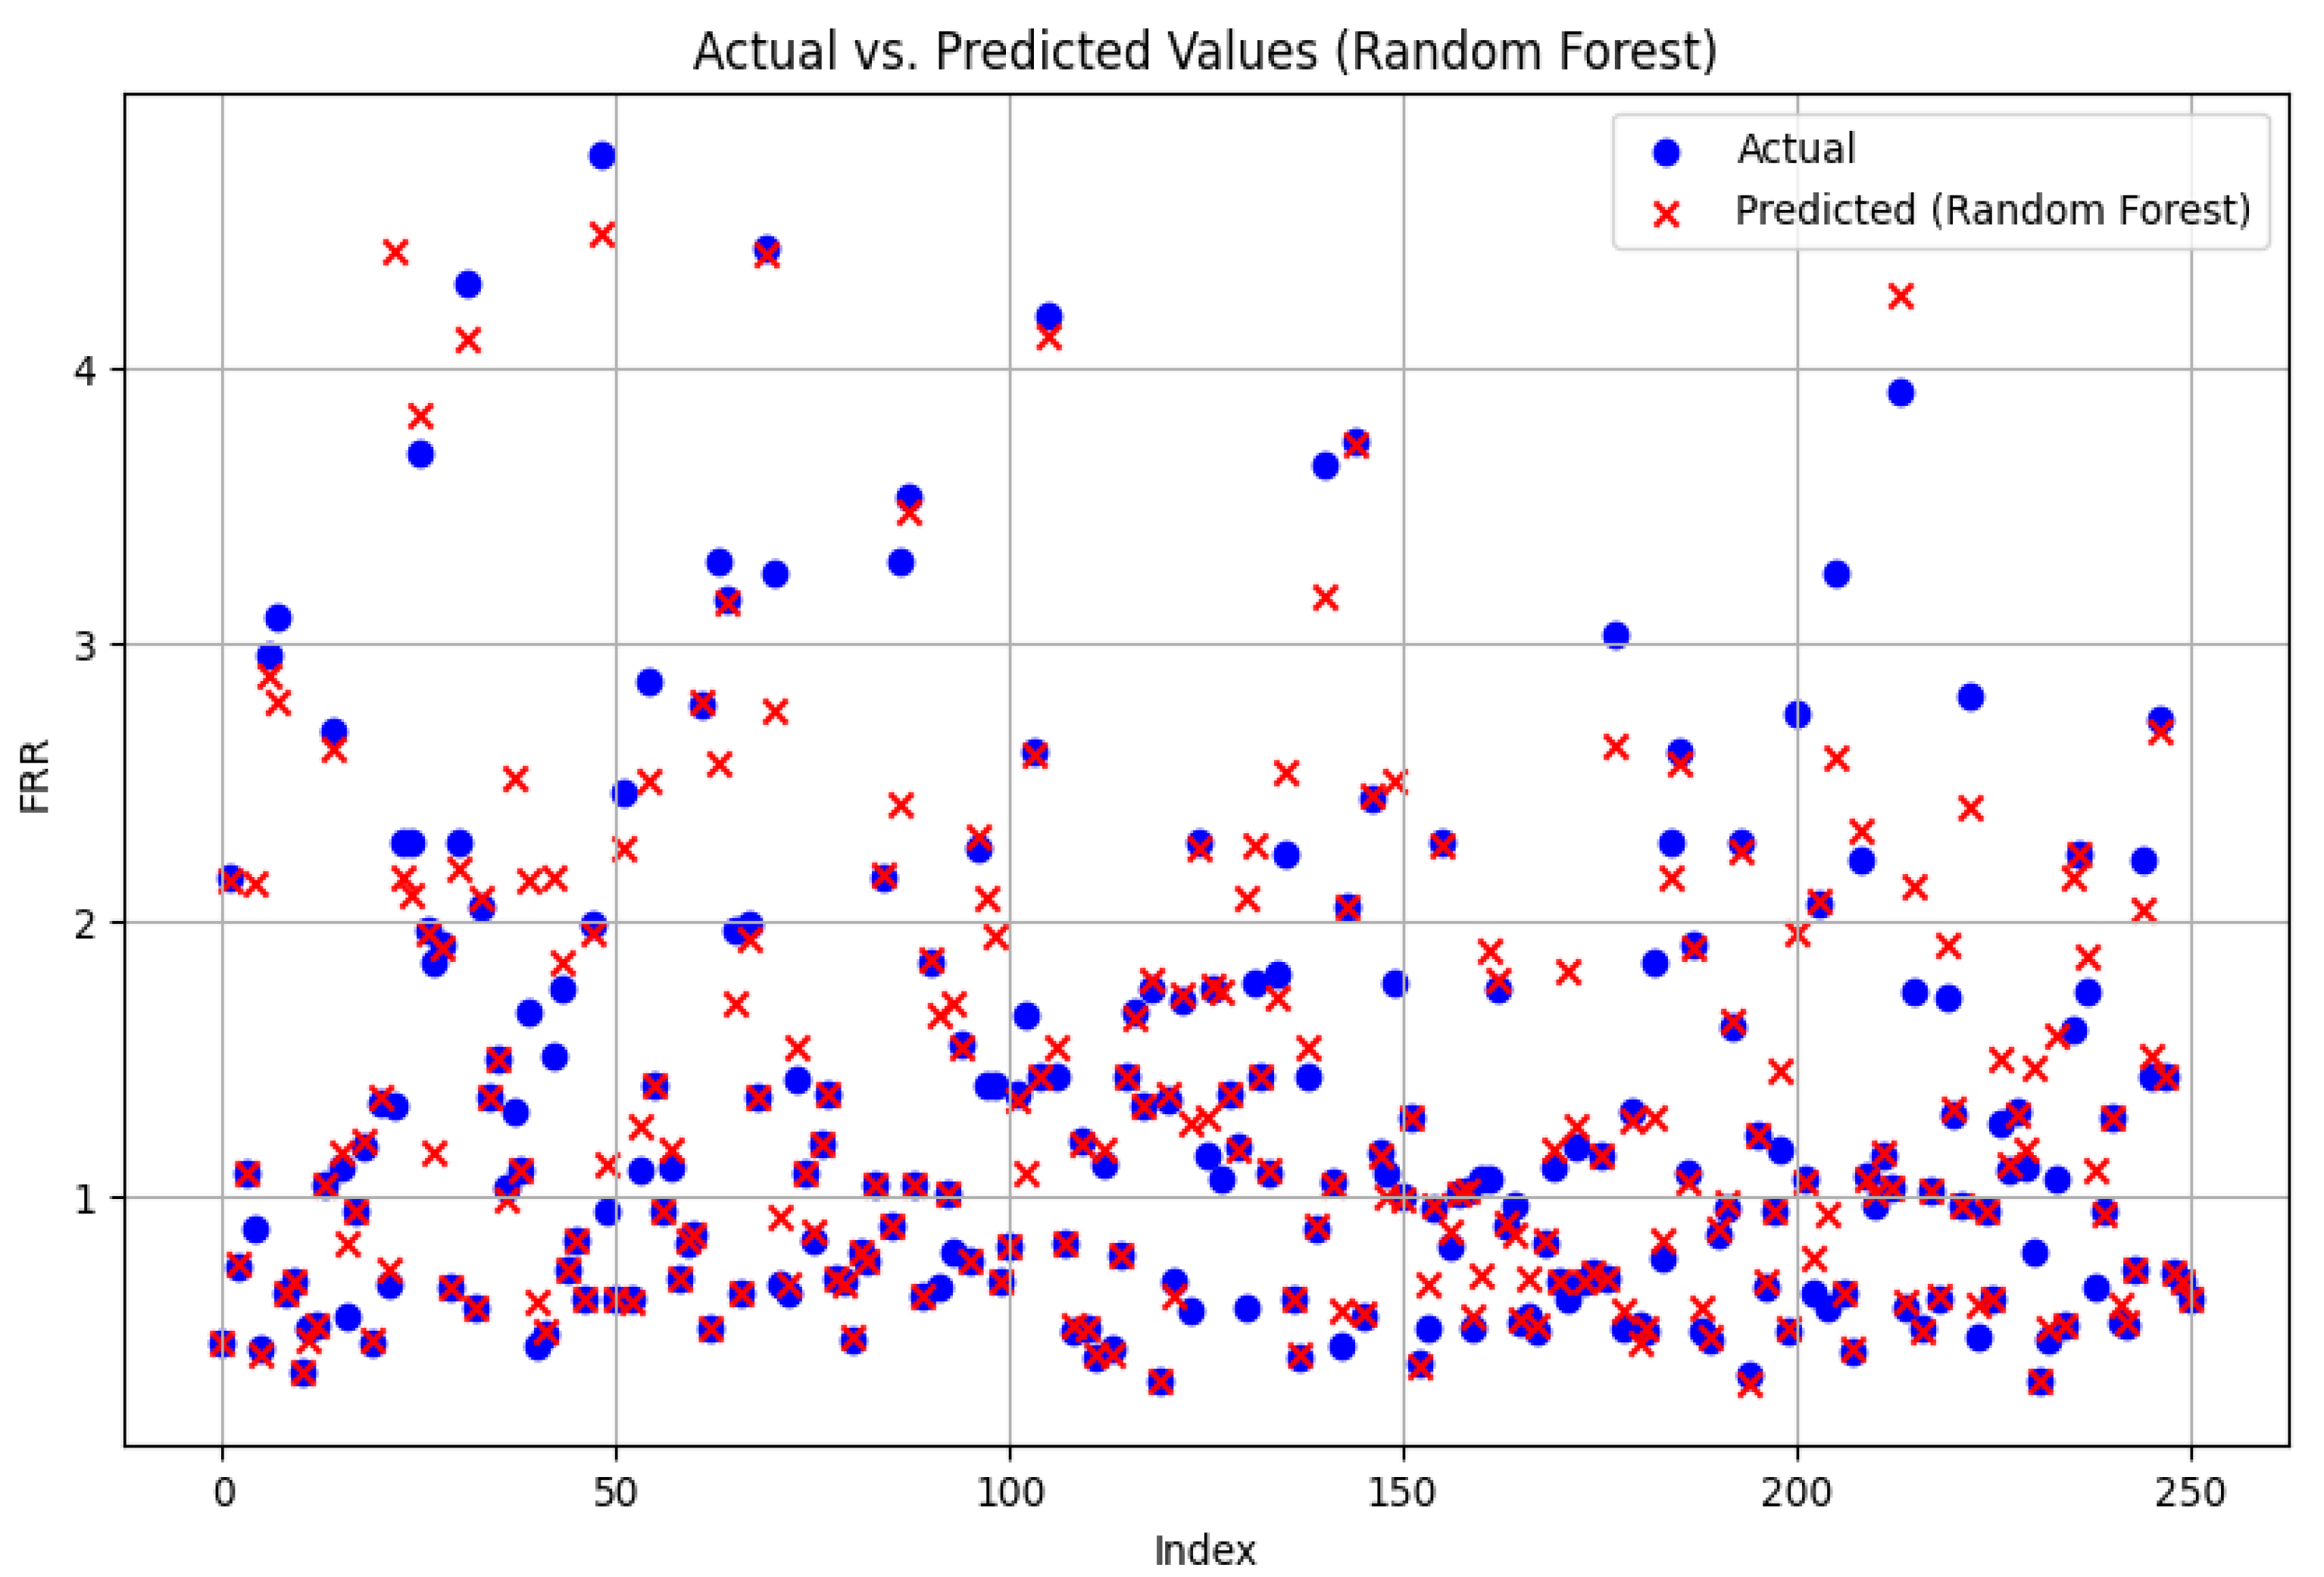
Figure 13 compares actual values with predictions made by the Random Forest Regression. Blue points represent actual FRRs, while red points show values predicted by the Random Forest Regression.
Figure 13 illustrates both actual data points (blue) and predicted values (red), demonstrating a close fit and indicating a high level of accuracy in FRR predictions. The model performs particularly well for FRR under 2 h, where the majority of dataset points are concentrated. However, due to the limited availability of data for FRR exceeding 4 h, prediction errors are more pronounced in this range.
To further compare the prediction accuracy of different ML algorithms, Table 3 presents the FRR values for one of the studied models obtained from OpenSees, alongside predicted values from the Random Forest Regression, Gradient Boosting, and Support Vector Regression algorithms. Full results and the decision tree are available at https://github.com/MohammadrezaAslankhan/ML-based-Fire-Resistance-Rating-of-Seismically-Designed-RC-Structures-.git (accessed on 5 December 2025).

4.6. Economic Analysis of ML-Based Models

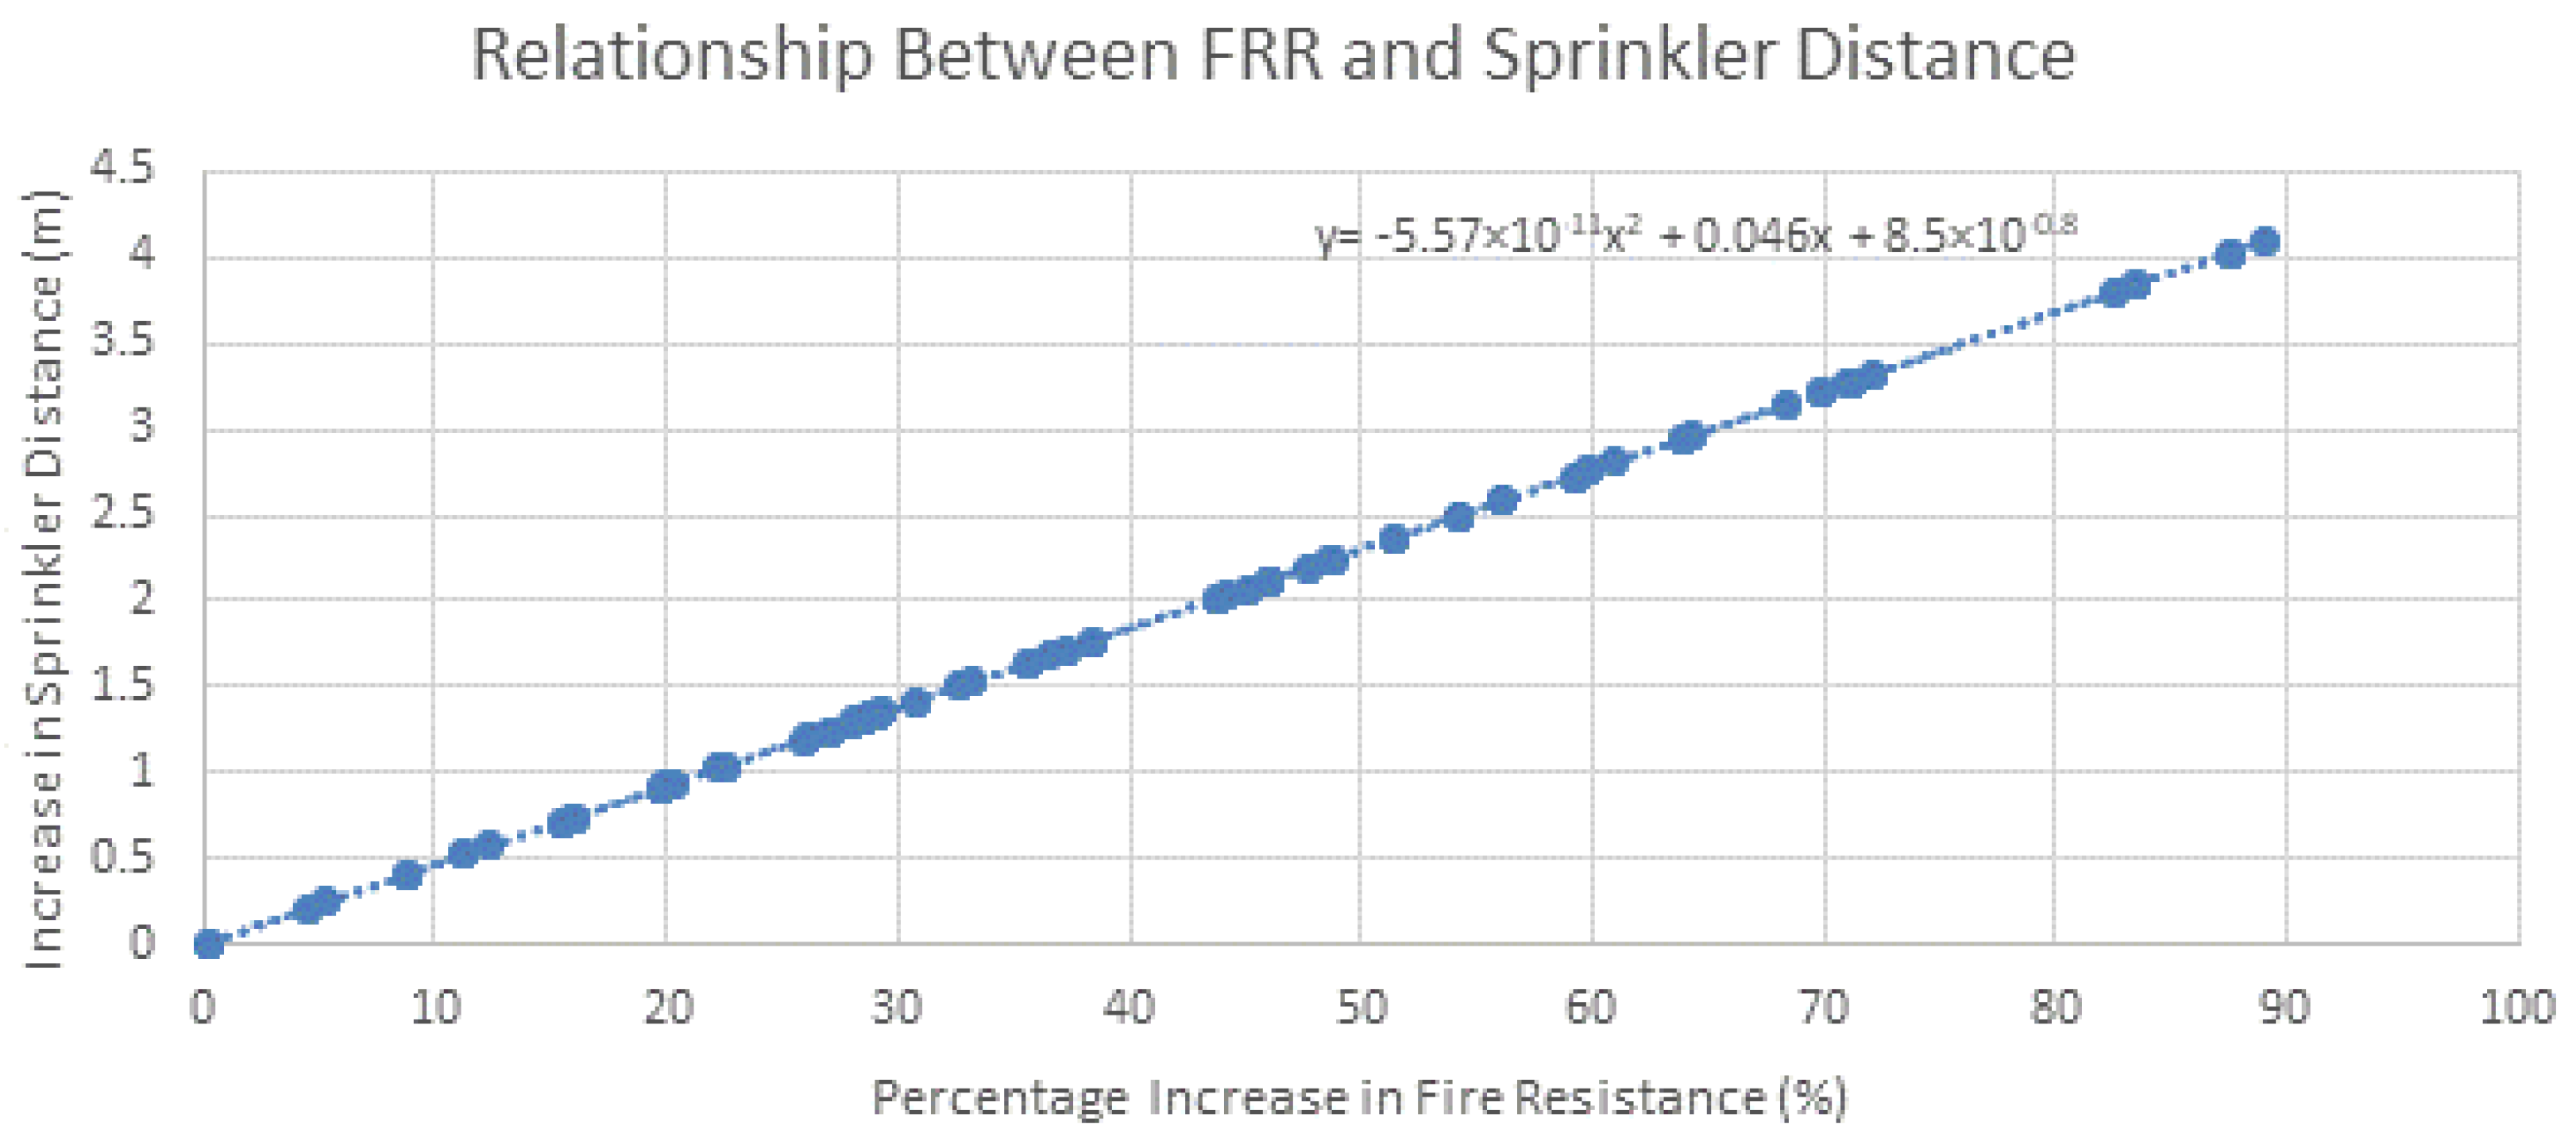
Based on the presented information, it can now be discussed how an improved FRR can impact on the dimensions of sprinklers. The data presented in Figure 14 shows that an increase in FRR leads to a reduction in coverage density and an increase in sprinkler spacing. This decrease in sprinkler density results in cost savings for the installation of fire suppression systems and, therefore, lowers ongoing maintenance expenses.
A detailed study examines the relationship between fire-resistance improvements and modified sprinkler spacing. The percentage change in FRR is presented on the left-hand side of Equation (1). Equation (2) illustrates the correlation between modifications in FRR and the adjusted sprinkler distance (Δd) between lower and higher seismic zones.
F R R i n c r e a s e d = F R R A F R R A F R R A × 100
d = 5.57 × 10 11 x 2 + 0.046 x + 8.5 × 10 0.8
Δd: Difference in sprinkler spacing (new vs. old) for frames designed in seismic zones;
FRRA: FRR for higher seismic zone;
FRRA’: FRR for lower seismic zone.
According to NFPA 13, the maximum allowable spacing for conventional sprinklers in Light and Ordinary Hazard areas is around 4.6 m. However, increasing FRRs from 0.21 to 1.74 h can allow for larger spacing between sprinklers. Although this adjustment may exceed the prescribed limits, the results indicate that the number of sprinklers required across a 19.6 m stretch can be reduced from 5 to 3. This reduction directly affects cost savings in sprinkler heads, piping, and water supply requirements. These findings highlight the benefits of integrating structural and fire safety optimization, where achieving both effective fire safety and cost-effectiveness is essential.
For instance, the life cycle cost (LCC) of a single sprinkler over 50 years is often estimated to be USD 332, based on Equations (3) and (4), which account for the total cost of a sprinkler, including installation, maintenance, and operational costs. Note that, a 50-year analysis period reflects the seismic return period typically used in structural design [40]. This timeframe aligns with standard design assumptions, ensuring that the sprinkler system’s LCC is assessed consistently with the building’s expected lifespan and the seismic risks it may face.
Table 4 illustrates that structures with higher FRRs require fewer sprinklers, resulting in potential cost savings per compartment. These savings underscore how seismic-resilient design contributes to long-term fire safety cost reduction by enhancing FRR and thereby allowing a reduction in the number of required sprinklers [41].
P V = A × 1 ( 1 + i ) n i
Cost (50 years) = Initial Cost + Maintenance PV
where PV is Present Value, A is the Annual recurring cost, i is the interest rate, and n is the number of years.

5. Summary and Conclusions

This study investigated the influence of seismic design parameters on the fire-resistance ratings (FRRs) of reinforced concrete (RC) structures, addressing a critical gap in fire safety engineering. While FRR is traditionally treated as an independent design factor, the findings of this study demonstrate that seismic design parameters can significantly influence a structure’s fire resistance performance. These insights are essential for integrating fire protection strategies into earthquake-resistant structural systems, enhancing the overall safety and performance of buildings in seismic regions.
To achieve the above point, advanced machine learning (ML) algorithms, particularly the Random Forest Regression, were employed due to their superior predictive capabilities in forecasting complex problems. The model achieved a test accuracy of 81.88%, outperforming alternative algorithms such as Gradient Boosting and Support Vector Regression. The research methodology involved a comprehensive evaluation of two-dimensional RC frames, considering key design parameters—span length, number of stories, number of spans, type of soil, and the seismic base acceleration—to assess their influence on FRR. Thermal performance was assessed through simulations using OpenSees for fire, which utilized the ISO 834 curve to simulate the temperature–time relationship. This curve, widely adopted for fire testing, provides a standardized approach to assess thermal degradation and structural performance under elevated temperatures.
As part of the case study, the research began by designing 20 reference models; they were then expanded to 698 frames with varying seismic parameters. The dataset was subsequently extended to 1760 frames, derived using decision tree algorithms, ensuring a robust and comprehensive analysis of the relationship between seismic design considerations and FRRs.
The key findings from this study include
  • Structural elements designed for higher seismic demands exhibit higher FRRs due to increased cross-sectional dimensions;
  • An increase in the number of spans and stories enhances FRRs by improving the redundancy of the system;
  • Longer spans, however, adversely impact FRRs due to increased deflection and greater susceptibility to thermal degradation;
  • The research establishes a direct correlation between seismic design improvements and cost reductions in fire protection systems, particularly in reducing sprinkler density and spacing.
These findings offer beneficial insights for the integration of seismic design and fire safety requirements in urban buildings located in regions susceptible to seismic risks. The use of ML algorithms to predict FRRs based on seismic parameters presents a novel approach that can assist the engineering community in optimizing structural and fire safety designs, ensuring required safety on the one hand and cost efficiency on the other hand.

Author Contributions

Conceptualization, M.A.; Methodology, M.A. and B.B.; Software, E.N. and M.H.Y.; Validation, E.N.; Investigation, M.A.; Data curation, E.N. and M.H.Y.; Writing—original draft, M.A. and M.H.Y.; Writing—review & editing, B.B.; Visualization, M.H.Y.; Supervision, B.B. and E.N.; Project administration, B.B. All authors have read and agreed to the published version of the manuscript.

Funding

This research received no external funding.

Data Availability Statement

The results and data of the study here are available from http://library.aut.ac.ir (accessed on 5 December 2025). Please contact via limaster@aut.ac.ir.

Conflicts of Interest

The authors declare no conflicts of interest.

References

  1. Harmathy, T.Z.; Sultan, M.A.; MacLaurin, J.W. Comparison of severity of exposure in ASTM E 119 and ISO 834 fire resistance tests. ASTM J. Test. Eval. 1987, 15, 8. [Google Scholar] [CrossRef]
  2. Hadjisophocleous, G.V.; Benichou, N.; Tamim, A.S. Literature Review of Performance-Based Fire Codes and Design Environment. J. Fire Prot. Eng. 1998, 9, 12–40. [Google Scholar] [CrossRef]
  3. Hadjisophocleous, G.V.; Benichou, N. Performance criteria used in fire safety design. Autom. Constr. 1999, 8, 489–501. [Google Scholar] [CrossRef]
  4. Behnam, B. Modifications to fire resistance ratings of steel frames based on structural configuration: A probabilistic-based approach. Struct. Eng. Mech. 2021, 77, 661. [Google Scholar]
  5. Gernay, T. Performance-based design for structures in fire: Advances, challenges, and perspectives. Fire Saf. J. 2024, 142, 104036. [Google Scholar] [CrossRef]
  6. Chaudhary, R.K.; Gernay, T.; Van Coile, R. Multi-objective optimization of structural fire design. Fire Saf. J. 2024, 146, 104139. [Google Scholar] [CrossRef]
  7. Irãni, M.; Behnam, B. Cost-oriented fire safety design of urban structures. Proc. Inst. Civ. Eng.—Struct. Build. 2025, 178, 173–189. [Google Scholar] [CrossRef]
  8. Leiras, A.B.; Rodrigues, J.P.C.; Meacham, B.J. A performance-based fire risk analysis for buildings. Archit. Struct. Constr. 2021, 1, 143–175. [Google Scholar] [CrossRef]
  9. Gedam, B.A. Fire resistance design method for reinforced concrete beams to evaluate fire-resistance rating. Structures 2021, 33, 855–877. [Google Scholar] [CrossRef]
  10. Naser, M.Z. Mechanistically Informed Machine Learning and Artificial Intelligence in Fire Engineering and Sciences. Fire Technol. 2021, 57, 2741–2784. [Google Scholar] [CrossRef]
  11. Naser, M.Z. AI-based cognitive framework for evaluating response of concrete structures in extreme conditions. Eng. Appl. Artif. Intell. 2019, 81, 437–449. [Google Scholar] [CrossRef]
  12. Naser, M.Z.; Kodur, V.K. Explainable machine learning using real, synthetic and augmented fire tests to predict fire resistance and spalling of RC columns. Eng. Struct. 2022, 253, 113824. [Google Scholar] [CrossRef]
  13. Sirisena, G.; Jayasinghe, T.; Gunawardena, T.; Zhang, L.; Mendis, P.; Mangalathu, S. Machine learning-based framework for predicting the fire-induced spalling in concrete tunnel linings. Tunn. Undergr. Space Technol. 2024, 153, 106000. [Google Scholar] [CrossRef]
  14. Himeur, Y.; Elnour, M.; Fadli, F.; Meskin, N.; Petri, I.; Rezgui, Y.; Bensaali, F. AI-big data analytics for building automation and management systems: A survey, actual challenges and future perspectives. Artif. Intell. Rev. 2023, 56, 4929–5021. [Google Scholar] [CrossRef]
  15. Habib, A.; Barakat, S.; Al-Toubat, S.; Junaid, M.T.; Maalej, M. Developing Machine Learning Models for Identifying the Failure Potential of Fire-Exposed FRP-Strengthened Concrete Beams. Arab. J. Sci. Eng. 2024, 50, 8475–8490. [Google Scholar] [CrossRef]
  16. Possidente, L.; Couto, C. Explained fire resistance machine learning models for compressed steel members of trusses and bracing systems. Eng. Appl. Artif. Intell. 2024, 139, 109571. [Google Scholar] [CrossRef]
  17. Yang, H.; Li, H.; Jiang, J. Predictive modeling of compressive strength of geopolymer concrete before and after high temperature applying machine learning algorithms. Struct. Concr. 2024, 26, 1699–1732. [Google Scholar] [CrossRef]
  18. Asteris, P.G.; Maraveas, C.; Chountalas, A.T.; Sophianopoulos, D.S.; Alam, N. Fire resistance prediction of slim-floor asymmetric steel beams using single hidden layer ANN models that employ multiple activation functions. Steel Compos. Struct. 2022, 44, 24–36. [Google Scholar]
  19. Liao, J.; Asteris, P.G.; Cavaleri, L.; Mohammed, A.S.; Lemonis, M.E.; Tsoukalas, M.Z.; Skentou, A.D.; Maraveas, C.; Koopialipoor, M.; Armaghani, D.J. Novel fuzzy-based optimization approaches for the prediction of ultimate axial load of circular concrete-filled steel tubes. Buildings 2021, 11, 629. [Google Scholar] [CrossRef]
  20. ISO 834; Fire-Resistance Tests—Elements of Building Construction—Part 1: General Requirements. British Standards Institute: London, UK, 2025.
  21. McKenna, F. OpenSees: A framework for earthquake engineering simulation. Comput. Sci. Eng. 2011, 13, 58–66. [Google Scholar] [CrossRef]
  22. Iranian National Building Codes in Part 6: Loading (Gravity, Earthquake, Wind); Ministry of Housing and Urban Development: Tehran, Iran, 2014.
  23. American Society of Civil Engineers. Minimum Design Loads and Associated Criteria for Buildings and Other Structures; American Society of Civil Engineers: Reston, VA, USA, 2017. [Google Scholar]
  24. Iranian National Building Codes in Part 10: Desing of Concrete Structures; Ministry of Housing and Urban Development: Tehran, Iran, 2014.
  25. ACI 318-08; Building Code Requirements for Structural Concrete (ACI 318-08) and Commentary. American Concrete Institute: Farmington Hills, MI, USA, 2008.
  26. Dewi, C.; Chen, R.-C. Random forest and support vector machine on features selection for regression analysis. Int. J. Innov. Comput. Inf. Control. 2019, 15, 2027–2037. [Google Scholar]
  27. National Fire Protection Association. 13-Standard for the Installation of Sprinkler Systems; National Fire Protection Association: Quincy, MA, USA, 2013. [Google Scholar]
  28. Jordan, M.I.; Mitchell, T.M. Machine learning: Trends, perspectives, and prospects. Science 2015, 349, 255–260. [Google Scholar] [CrossRef] [PubMed]
  29. Kotsiantis, S.B.; Zaharakis, I.; Pintelas, P. Supervised machine learning: A review of classification techniques. Emerg. Artif. Intell. Appl. Comput. Eng. 2007, 160, 3–24. [Google Scholar]
  30. Breiman, L.; Friedman, J.; Olshen, R.A.; Stone, C.J. Classification and Regression Trees; Routledge: London, UK, 2017. [Google Scholar]
  31. Maimon, O.Z.; Rokach, L. Data Mining with Decision Trees: Theory and Applications; World Scientific: Singapore, 2014; Volume 81. [Google Scholar]
  32. Srivastava, N.; Hinton, G.; Krizhevsky, A.; Sutskever, I.; Salakhutdinov, R. Dropout: A simple way to prevent neural networks from overfitting. J. Mach. Learn. Res. 2014, 15, 1929–1958. [Google Scholar]
  33. Jiang, J.; Jiang, L.; Kotsovinos, P.; Zhang, J.; Usmani, A.; McKenna, F.; Li, G.-Q. OpenSees software architecture for the analysis of structures in fire. J. Comput. Civ. Eng. 2015, 29, 04014030. [Google Scholar] [CrossRef]
  34. Jiang, J.; Usmani, A. Modeling of steel frame structures in fire using OpenSees. Comput. Struct. 2013, 118, 90–99. [Google Scholar] [CrossRef]
  35. EN 1994-1-2:2006; Eurocode 4–Design of Composite Steel and Concrete Structures. Part 1–2, in General Rules–Structural Fire Design. European Committee for Standardization: Brussels, Belgium, 2005.
  36. Ryan, J.; Robertson, A. Proposed criteria for defining load failure of beams, floors and roof constructions during fire tests. J. Res. Natl. Bur. Stand.-C Eng. Instrum. 1959, 63, 1999. [Google Scholar] [CrossRef]
  37. James, G.; Witten, D.; Hastie, T.; Tibshirani, R. An Introduction to Statistical Learning; Springer: Berlin/Heidelberg, Germany, 2013; Volume 112. [Google Scholar]
  38. Bishop, C.M. Pattern Recognition and Machine Learning by Christopher M. Bishop; Springer Science + Business Media, LLC: New York, NY, USA, 2006. [Google Scholar]
  39. Breiman, L. Random forests. Mach. Learn. 2001, 45, 5–32. [Google Scholar] [CrossRef]
  40. American Society of Civil Engineers. Minimum Design Loads and Associated Criteria for Buildings and Other Structures (ASCE/SEI 7-22); American Society of Civil Engineers: Reston, VA, USA, 2022. [Google Scholar]
  41. Sullivan, W.G.; Wicks, E.M.; Koelling, C.P. Engineering Economy; Pearson: London, UK, 2015. [Google Scholar]
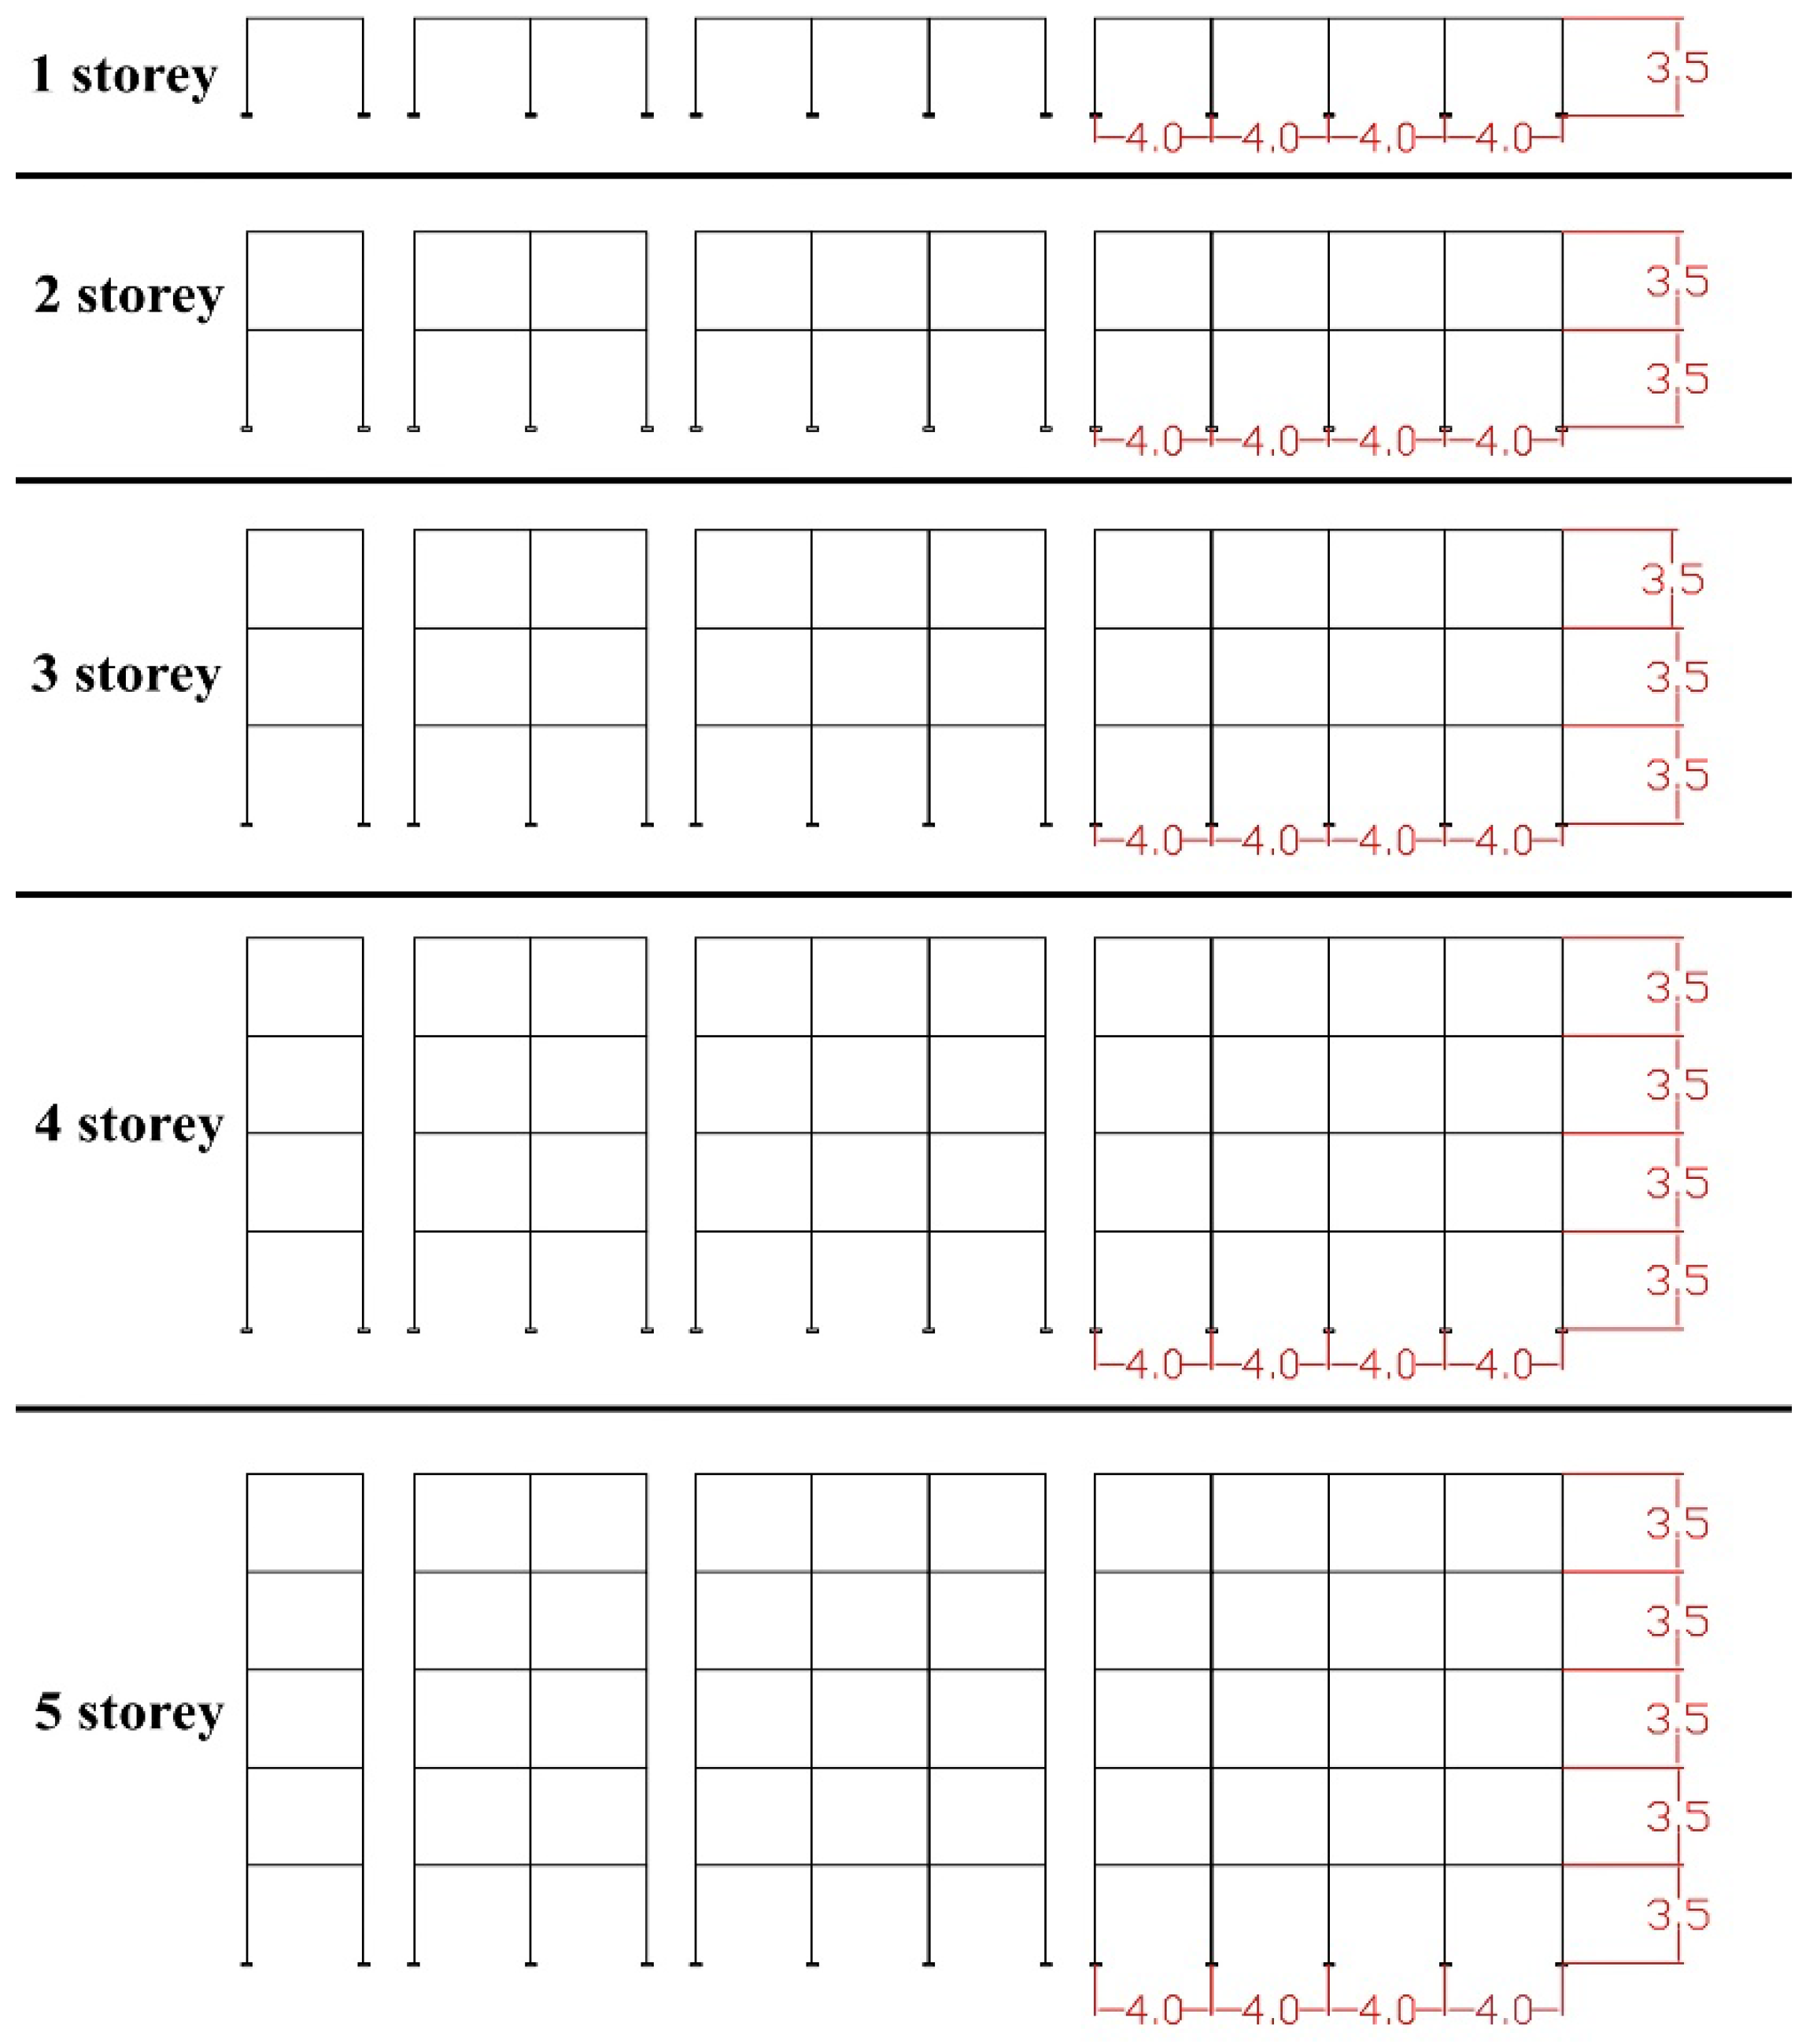
Figure 2. The base models.
Fire 09 00224 g002
Figure 3. Simplified view of the decision tree.
Fire 09 00224 g003
Figure 4. The location of the ISO834 fire on the frames.
Fire 09 00224 g004
Figure 5. Maximum tree length.
Fire 09 00224 g005
Figure 6. Changes in the FRRs based on the number of stories.
Fire 09 00224 g006
Figure 7. Changes in the FRRs based on the number of spans.
Fire 09 00224 g007
Figure 8. Relationship between the design type and the base acceleration (A).
Fire 09 00224 g008
Figure 9. Changes in the FRRs based on the base acceleration.
Fire 09 00224 g009
Figure 10. Changes in the FRRs based on the designed sections.
Fire 09 00224 g010
Figure 11. Relationship between span length and FRR.
Fire 09 00224 g011
Figure 12. Feature importance in predicting FRRs.
Fire 09 00224 g012
Figure 13. Actual FRRs compared to the predicted values.
Fire 09 00224 g013
Figure 14. Percentage increase in FRR and sprinkler spacing.
Fire 09 00224 g014
Table 1. Designed sections.
No. of StoriesFloorsTypeColumn Size (cm)Reinforcement Bars (mm)Number of Bars
1–2 storiesFloors 1&2Type 125 × 25148
Type 225 × 251410
Type 325 × 251610
Type 430 × 301410
3 storiesFloors 1&2Type 525 × 251610
Type 630 × 301410
Type 735 × 352012
Floor 3Type 525 × 251410
Type 625 × 251410
Type 730 × 301410
4 storiesFloors 1&2Type 830 × 301410
Type 935 × 352012
Type 1035 × 352212
Floors 3&4Type 825 × 251410
Type 930 × 301410
Type 1035 × 352012
5 storiesFloors 1&2Type 1135 × 352012
Type 1235 × 352212
Type 1340 × 402212
Type 1440 × 402214
Floors 3&4Type 1130 × 301612
Type 1235 × 352012
Type 1335 × 352012
Type 1440 × 402212
Floor 5Type 1125 × 251610
Type 1230 × 301612
Type 1330 × 301612
Type 1435 × 352012
Table 2. Accuracy and error rates of ML algorithms.
Test Data
MSEMAER2
Random Forest Regression0.134470.187420.81878
Gradient Boosting0.214090.291920.71149
Support Vector Regression0.297130.326540.59958
Table 3. Comparison of OpenSees and predicted FRRs (h).
The FRRs by OpenSeesThe FRR by Random Forest RegressionThe FRR by Gradient BoostingThe FRR by Support Vector Regression
0.470.470.370.57
2.152.262.791.75
0.750.961.041.09
1.091.081.031.20
0.880.920.960.95
Table 4. Example of FRR’s effect on the number of sprinklers.
SpanStoryLSoilMin. of AMax. of AFRR of the min. AFRR of the max. ANumber of Sprinklers for the min. ANumber of Sprinklers for the max. ACost Saved
(50 Years)
444.920.20.350.215851.7432553$664
424.920.20.351.054891.4862254$332
235.220.20.350.648712.2481632$332
456.720.20.351.108583.5047264$664
256.730.20.351.50992.953632$332
Disclaimer/Publisher’s Note: The statements, opinions and data contained in all publications are solely those of the individual author(s) and contributor(s) and not of MDPI and/or the editor(s). MDPI and/or the editor(s) disclaim responsibility for any injury to people or property resulting from any ideas, methods, instructions or products referred to in the content.