Article

Simulation Study on Fire Resistance Performance of Substation Frameworks with Fire-Retardant Coating Under Heating Curve Conditions Specified by ISO 834 Standard


1
Sichuan Fire Research Institute of MEM, Chengdu 610036, China
2
Key Laboratory of Fire Protection and Retardant Technology, Ministry of Emergency Management, Chengdu 610036, China
3
Zhejiang Seaport Quzhou Port Co., Ltd., Quzhou 324000, China
4
Hangzhou Qianhang Shipyard Company Ltd., Hangzhou 311256, China
*
Author to whom correspondence should be addressed.
Fire 2026, 9(3), 133; https://doi.org/10.3390/fire9030133
Submission received: 29 January 2026 / Revised: 10 March 2026 / Accepted: 18 March 2026 / Published: 20 March 2026
(This article belongs to the Special Issue Fire Safety in the Built Environment)

Abstract

To analyze the fire resistance performance of the substation framework protected by fire-retardant coating, herringbone column structure substation frameworks under heating curve conditions specified by the ISO 834 standard were simulated using ABAQUS software. Moreover, this study investigated the temperature field, stress field, and displacement characteristics of the substation structure under typical fire scene conditions. The research results indicate the following: (1) Without fire-retardant coating, the surface temperature of the bare substation framework reaches 500 °C within a short period, and a large temperature difference between the interior and exterior of the steel pipe is caused, which may induce brittle cracking within the steel. Within the 1000 s period from the start of heating, the strength of the steel structure decreases with the increase in temperature. Stress is gradually concentrated on the steel structure, and the heated part of the bare steel truss undergoes a deformation displacement of more than 0.1 m, making it susceptible to brittle fractures in the steel. The maximum deflection of the steel structures exceeds the critical value of 0.07 m. (2) With fire-retardant coating, the surface temperature of the steel can be maintained below 310 °C, and the stress in most areas of the substation framework remains below 170 Mpa. The displacement and deformation of the transformer frame are significantly reduced, and the deformation can be maintained below 0.02 m. All positions of the substation framework are in the upward expansion stage, and the deflection does not exceed 0.02 m.

1. Introduction

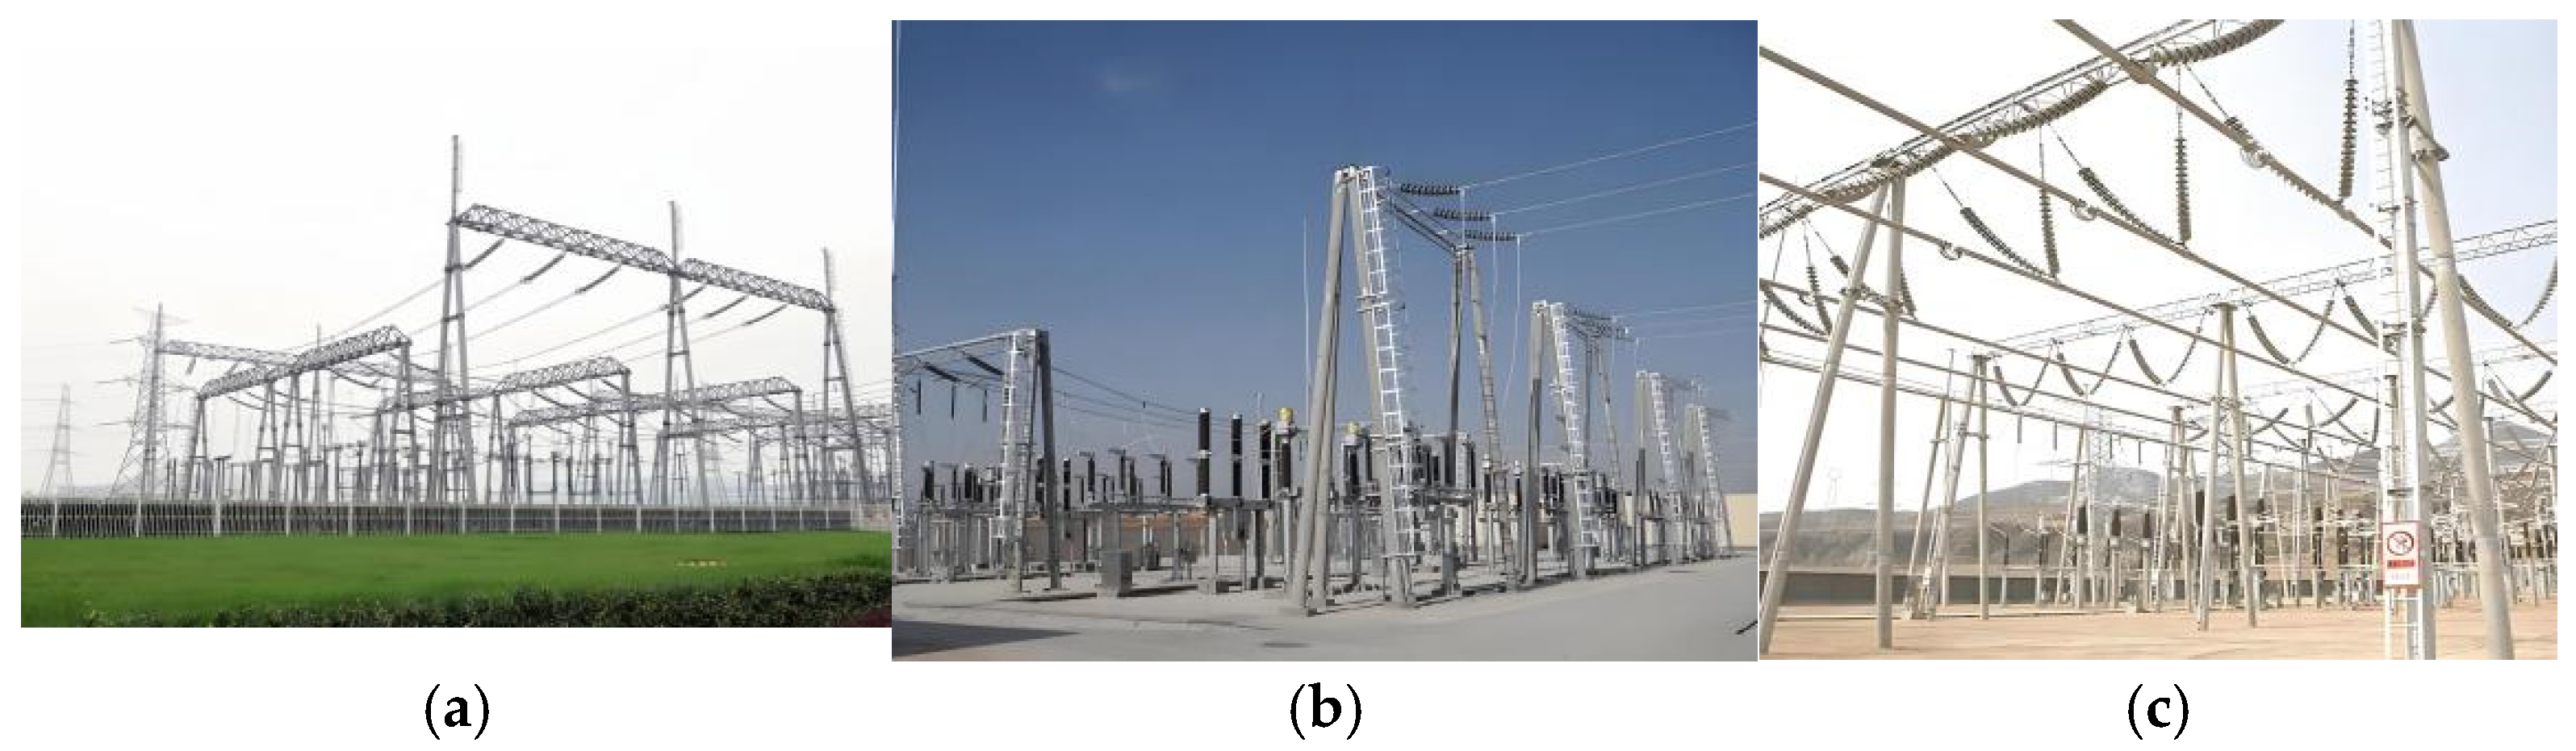
Driven by significant support from the Chinese government, the power industry’s infrastructure has experienced rapid development in recent years. With the continuous increase in the scale of substations and the improvement in voltage levels, the height of substation frameworks is progressively increasing and evolving. The substation framework is a key element in the power system and serves as a vital part of the electricity transmission and distribution network. Its primary function involves supporting, securing, and linking various electrical devices, as well as ensuring a safe and dependable operational environment. Owing to China’s extensive territory and the considerable variation in natural conditions across different regions, various types of substation frameworks have been developed to fulfill specific requirements, as shown in Figure 1 [1].
Steel exhibits a substantial thermal expansion coefficient and is prone to considerable deformation under high-temperature conditions. This can readily result in the failure of individual components and eventually cause the collapse of the entire structure. Moreover, the strength of steel without fire protection decreases to 2/3 of its initial strength at 350 °C; when the temperature reaches 500 °C, its strength is only half of the initial strength; once temperatures surpass 800 °C, the steel loses all its strength and stiffness, rendering it incapable of bearing loads. In the event of a substation fire, the ambient temperature can typically range between 800 and 1200 °C, and the temperature of steel without fire protection can reach over 600 °C within 20 min. Consequently, steel components without fire protection are highly susceptible to damage during a fire [2,3,4].
Researchers have investigated the high-temperature characteristics of steel components under fire conditions. Kirby B [5] conducted material characteristic tests on 43A and 50B steel under high temperatures and obtained the stress–strain curves of the steel at high temperatures. Fu et al. [6] studied the dynamic thermal expansion coefficient of Q235 steel during the cooling process through experimental measurements and model calculations. Chu et al. [7] explored the fire resistance of steel beams with integrated fire-resistant and decorative designs. In their study, five simply supported H-beams wrapped in this structure were subjected to fire testing in a furnace, and their temperature field and mechanical properties were summarized under ISO (International Organization for Standardization) 834 standard heating conditions. Lou et al. [8,9] conducted a study on the collapse behavior of a full-size 36 m × 12 m steel portal frame in natural fires. It was found that in the heated column when the critical temperature was about 1100 °C, the frame collapsed after 15 min of fire exposure.
The temperature field of steel structures, which refers to the temperature effect on the structural integrity, plays a crucial role in fire-resistant design. Based on ABAQUS software, some researchers have extensively investigated the effect of temperature increase on structural components during fires [10,11]. Palm [12] and Bolina [13] conducted transient thermal analyses on various components using ABAQUS software and obtained the temperature fields of the structural components. Ghojel et al. [14] proposed a heating calculation model for steel components considering the radiation effect. This model is computationally efficient and applicable to the majority of previously conducted fire tests. Considering the different aspect ratios, load ratios, and heating rates of the test columns, the furnace temperature, column temperature, lateral displacement, and axial displacement, Wang et al. [15] established a thermal–mechanical coupling analysis model for Q960 steel columns using ABAQUS finite element analysis software.
Through thermal–mechanical coupling tests and simulation studies on steel structures, it has been found that steel components without fire protection are highly susceptible to damage during a fire. To address this issue, protecting the steel structure becomes essential, and the most common method is to increase the fire protection layer of the steel structure. The fire protection layer of the steel structure mainly includes fire-retardant coatings and fire-retardant boards. Fire-retardant coatings are mainly divided into the following three types: ultra-thin fire-retardant coatings (coating thickness ≤ 3 mm), thin fire-retardant coatings (3 mm < coating thickness ≤ 7 mm), and thick fire-retardant coatings (>7 mm) [16,17]. The application of fire-retardant coatings has become a preferred solution in modern steel construction projects due to its straightforward application and adaptability to various structural element configurations and installation environments. Currently, studies on the structural behavior of steel beams subjected to fire are being widely conducted, and some researchers are exploring the availability of fire-resistant steel and fire-retardant coating. Through comparison tests, Ding et al. [18] determined that using fire-resistant steel as load-bearing components can greatly improve the fire-resistance performance of steel structures. Meng et al. [19] found through experiments that the bending of fire-resistant coated steel beams is closely related to temperature. Xu et al. [20] found that the surface characteristics and expansion ratios of coating materials in different regions under localized fires were consistent with the results obtained from previous furnace tests under uniform heating. Lucherini [21] designed three different experimental setups corresponding to three different fire scenarios and examined the influences of varying heating conditions and rates on the performances of two different types of thin intumescent coatings. Bilotta [22] conducted fire tests on steel components coated with intumescent fire paint and concluded that the fire-retardant coating protective layer can absorb heat and protect structural components from damage or excessive deformation. Cirpici et al. [23] introduced a prediction method for the expansion process and thermal conductivity of intumescent fire-retardant coatings under different conditions (by changing the section coefficient of steel components, the thickness of intumescent fire-retardant coatings, and the fire conditions). This approach can be utilized to determine the fire resistance of steel structures coated with fire-retardant materials.
Previous substation fire accidents have shown [2,24] that the load-bearing capacity and stiffness of steel structures decrease at high temperatures, and thermal expansion causes additional stress within the steel structures. The high temperature caused by the fire may lead to the instability and collapse of the steel structure of the substation. Previous studies have demonstrated the fire protection effect of the intumescent fire-retardant coating developed on the substrates of substation frameworks. In [25], numerical simulation research on the thermal coupling of substation frameworks under standard heating curve conditions was conducted using ABAQUS finite element analysis software, and the fire resistance performances of substation frameworks under the protection of fire-retardant coatings were analyzed and compared. This study aims to provide theoretical support for substation fire protection.

2. Establishment of Substation Framework Model

2.1. Material Properties of Steel at High Temperatures

2.1.1. Yield Strength

The design value of the strength for steel components is directly proportional to the yield strength. As the temperature increases, the yield strength of steel continuously decreases, and the yield section gradually becomes shorter or even disappears. A decrease in the yield strength may result in the load-bearing capacity of the truss being lower than the load effect, leading to structural collapse. The yield strength of steel at high temperatures is generally determined by the reduction factor ( η s T ). In the Code for Fire Safety of Steel Building Structures (GB 51249-2017) [26], the function of the reduction factor ( η s T ) can be described as follows:
η s T = 1.0 1.24 × 10 − 8 T s 3 − 2.096 × 10 − 5 T s 2 + 9.228 × 10 − 8 T s 3 − 0.2168 0.5 − T s / 200 20   ° C ≤ T s ≤ 300   ° C 300   ° C ≤ T s ≤ 800   ° C 800   ° C ≤ T s ≤ 1000   ° C
where T s represents the temperature of the steel material, °C.

2.1.2. Elastic Modulus

Just like with the yield strength, the elastic modulus of steel reduces as the temperature rises. The decrease in the elastic modulus of steel can lead to a decline in the performance of the substation frame itself, resulting in structural failure. The decrease in the elastic modulus of the steel pipes in the substation frame also causes a decrease in the stiffness of the truss structure, leading to structural damage. The reduction coefficient ( χ s T ) can be used to represent the elastic modulus of steel at high temperatures. The function of the elastic modulus reduction coefficient in the specification [26] is as follows:
χ s T = 7 T s − 4780 6 T s − 4760 1000 − T s 6 T s − 2800 20   ° C ≤ T s ≤ 600   ° C 600   ° C ≤ T s ≤ 1000   ° C

2.1.3. Physical Parameters of Q235 Steel

Q235 steel is a commonly used carbon structural steel. With a moderate carbon content, it possesses excellent comprehensive properties, including strength, plasticity, toughness and weldability. In this study, the steel used in the substation framework model was Q235 carbon steel, and its material properties are presented in Table 1 [27].

2.1.4. Stress–Strain Relationship

The stress–strain relationship model for steel under high temperature is typically categorized into two types: the continuous smooth model and the segmented straight-line model. The continuous smooth model is made up of connected curves, such as the EC3 steel constitutive model. In contrast, the segmented straight-line model is composed of connecting lines between key points, such as the isotropic reinforcement model. At present, the internationally most commonly adopted smooth-curve constitutive model is the stress–strain relationship outlined in the latest European EC3 Standard [28].

2.2. Principles and Methods of Fire Resistance Performance Analysis

2.2.1. Heat Transfer Mode of Steel Structures Under Fire

In the event of a fire in a steel structure building, the steel located on the side of the fire surface absorbs significant heat via heat convection and radiation from high-temperature smoke. As the surface temperature rises, heat is further diffused into the entire structural system through thermal conduction, resulting in an increase in the overall temperature of the structure. The spatial temperature distribution across all nodes during such a heating process is referred to as the temperature field. When flame heat is applied to steel structures, the primary heat transfer modes between the steel surface and high-temperature air involve thermal convection and thermal radiation.
Thermal convection refers to the heat transfer phenomenon that occurs between high-temperature and low-temperature objects when a fluid interacts with a solid surface [29]. This process can be described using Newton’s cooling equation as follows [30]:
q c o n v = h T 1 − T 2
where q c o n v represents the heat flux transferred to a unit area of steel components per unit time, W/m2; h is the convective heat transfer coefficient, W/(m2·°C); T 1 and T 2 are the high-temperature flame temperature and the surface temperature of the steel component, respectively.
Thermal radiation transfers heat to steel components by emitting electromagnetic waves, without requiring any medium for transmission. This process of heat transfer through thermal radiation can be represented by the Stefan Boltzmann equation as follows [31]:
q r a d = ε σ T 1 − 273 4 − T 2 − 273 4
where q r a d is the radiation heat transferred to a unit area of steel components per unit time, W/m2; ε represents the emissivity, ε = 0.8; σ represents the Stefan Boltzmann constant, σ = 5.67 × 10⁻⁸ W/m2·K.
The internal heat transfer within steel components is mainly carried out via thermal conduction, with the direction of heat flow consistently moving from the hotter region to the cooler region. The heat transfer process of thermal conduction can be expressed using Fourier’s law as follows:
Q Δ t = λ A T 1 − T 2 d
where Q is the heat transferred to the steel component within time Δ t , W; Δ t is the heat transfer time, s; λ is the thermal conductivity coefficient, W/m2·K; A is the heat transfer area, m2; d is the distance between two surfaces, m.

2.2.2. Fire Temperature Rise Curves

The most widely used fire temperature rise curve worldwide is the ISO 834 standard temperature rise curve. Europe proposes temperature curves for fire testing according to EN 1993-1-2 [32]. Due to different testing methods, some North American countries adopt the ASTM-E119 standard heating curve [33].
The fire temperature described by the above three standard heating curves is a function of time and is not related to the building space, combustible quantity, density, combustion performance, ventilation conditions, etc., which cannot provide more accurate estimates for fire resistance analysis. The main equipment room of the substation has a large space, and its fire temperature rise curve is significantly different from the general indoor fire temperature rise curve. This article uses the ISO 834 standard heating curve for manual calculation and verification in the fire resistance analysis of the rigid frame structure of the substation.
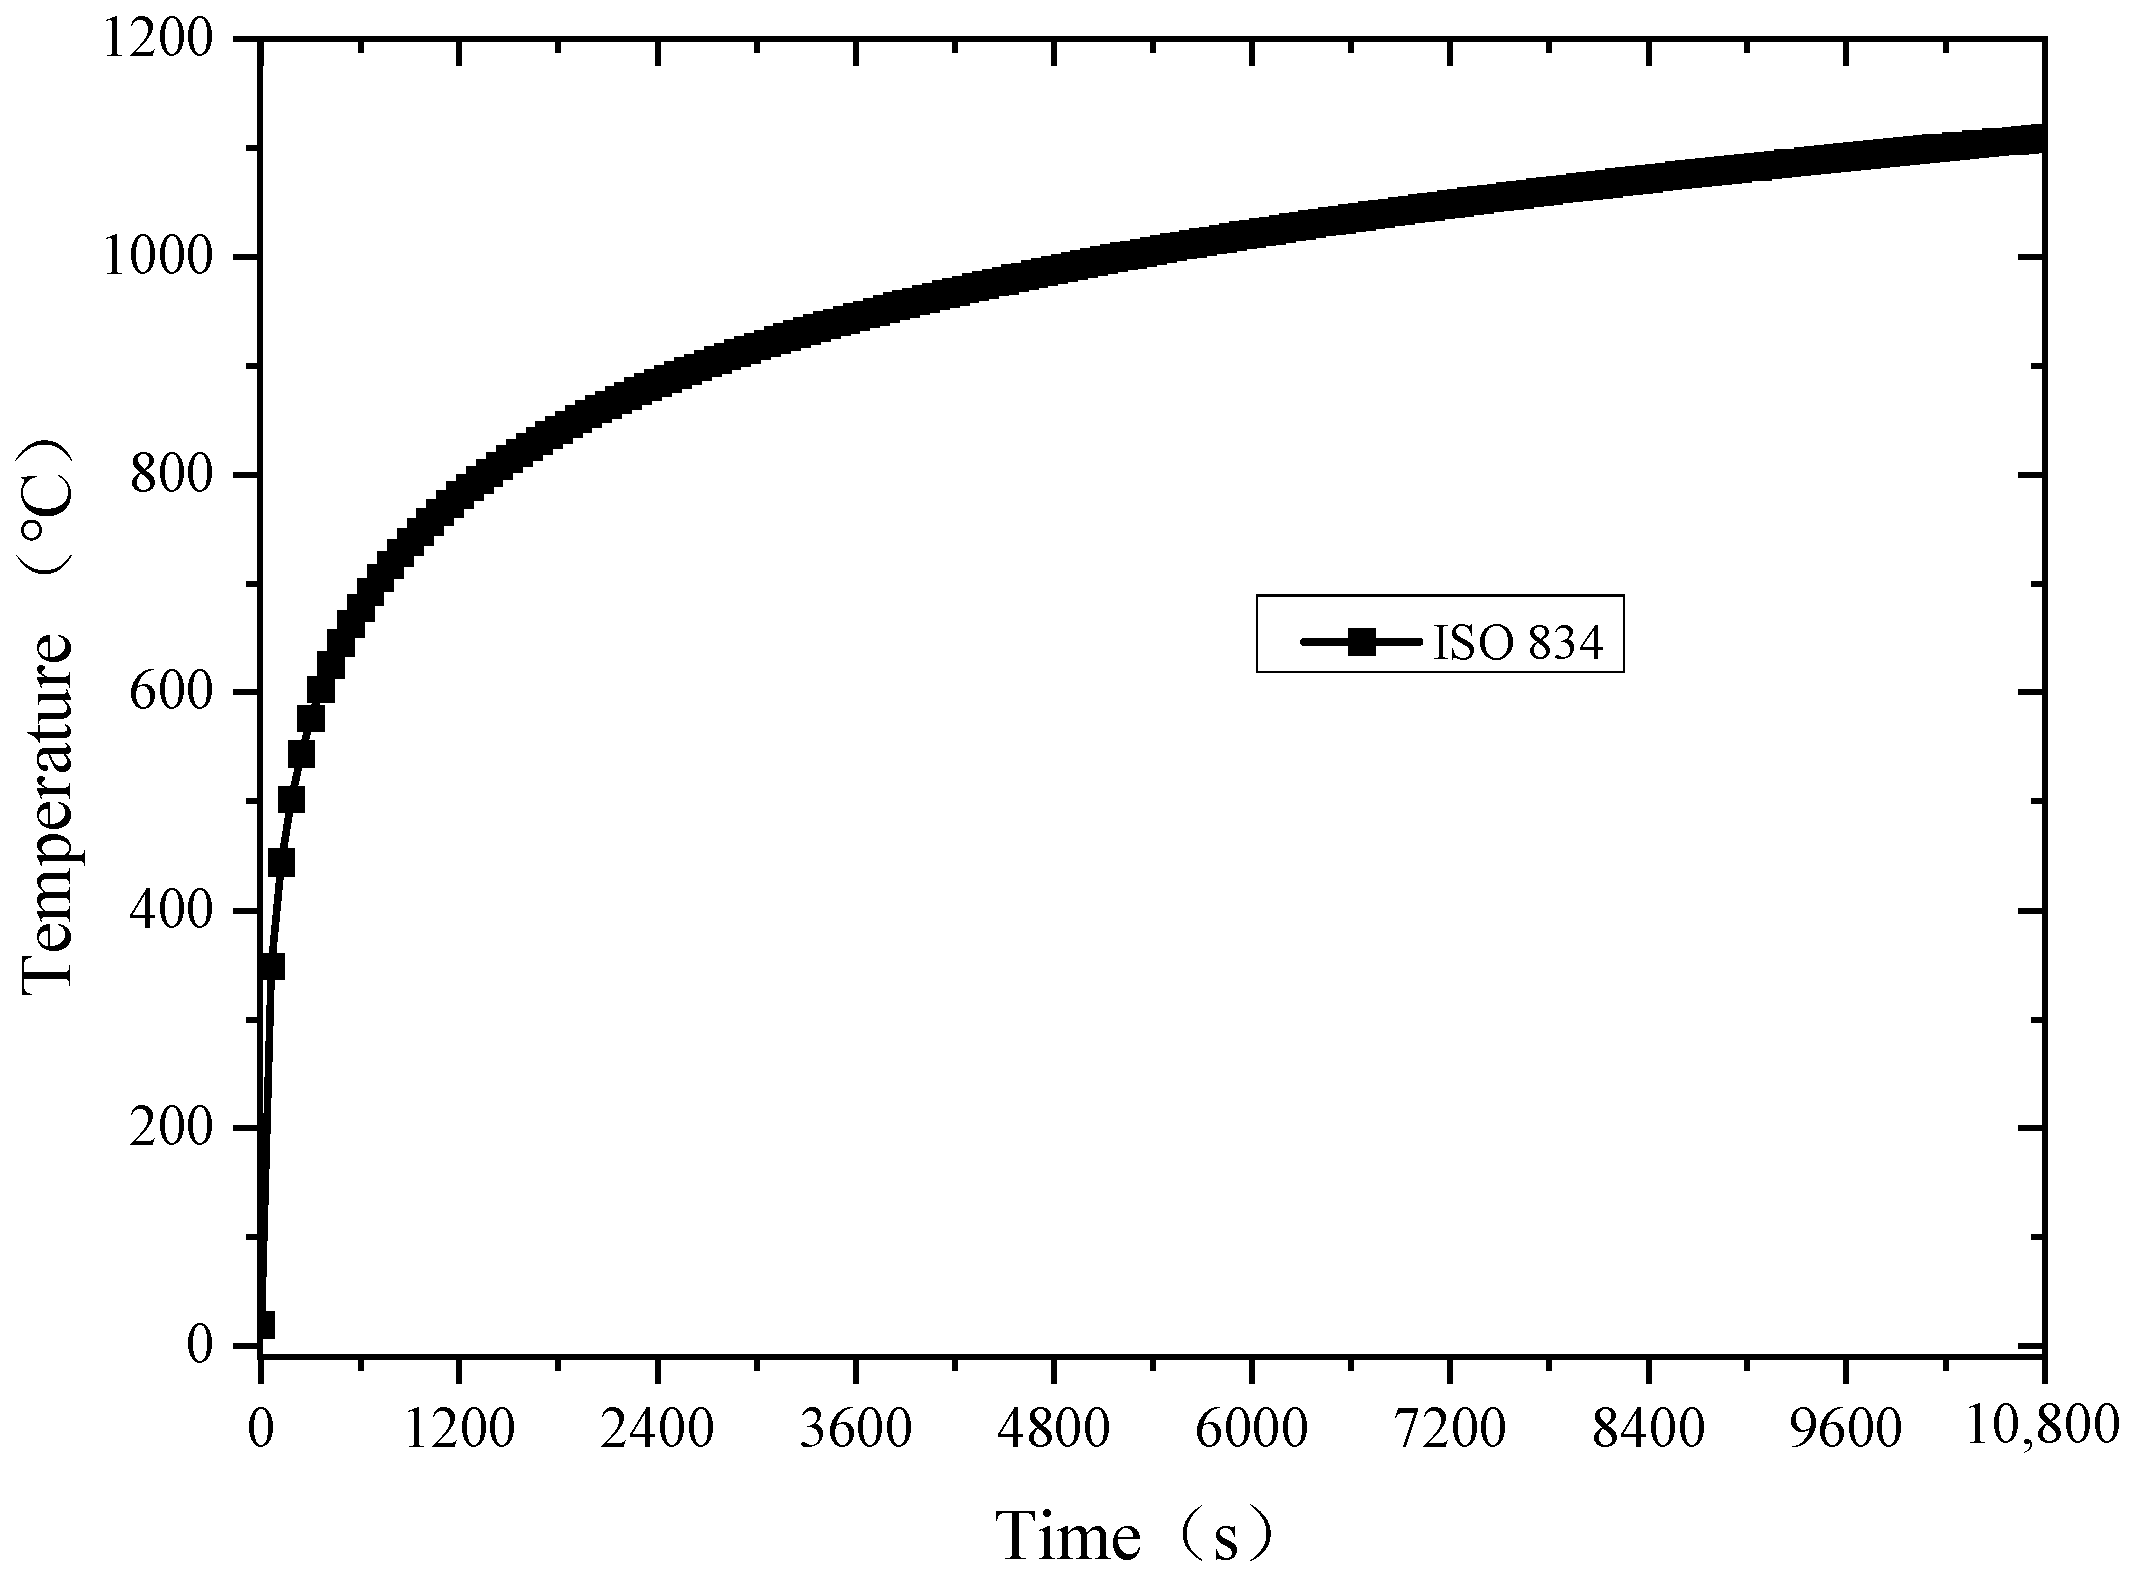
The ISO 834 series of standards serves as a fire resistance test method for building components, primarily focusing on the load-bearing capacity, thermal insulation, and integrity of load-bearing components under fire conditions [34]. The overall fire resistance performance of these components must comply with the ISO 834 standard, as shown in Figure 2. The function is presented as follows:
T = 345 lg 8 t + 1 + T 0

2.2.3. Calculation Method for Temperature Rise in Steel Components

For lightweight steel components with large cross-sectional shape coefficients, an iterative method is recommended by the Code for Fire Safety of Steel Building Structures [26] to calculate the temperature rise in steel structures under fire. The function for the iterative algorithm used to calculate the temperature rise in unprotected steel components is as follows:
Δ T s = ( F / V ) ρ s c s α c T g − T s + ε Γ σ T g + 273 4 − T s + 273 4 Δ t
where T s represents the temperature rise of the steel component over time ( t ,   t + Δ t ), °C; Δ t is the time step, s; T g and T s are the average temperature of the hot flue gas and the internal temperature of the steel component at time (t), °C; F/V is the cross-sectional shape factor of steel components without fire protection, m−1; α c represents the convective heat transfer coefficient, with a value of 25 W/(m2·°C); ε Γ is the comprehensive radiation rate, which can be obtained from the previous study [26].
The iterative algorithm equation for calculating the temperature rise in steel components with a fire protection layer is as follows:
Δ T s = α ⋅ 1 ρ s c s ⋅ F i V ⋅ T g − T s Δ t
In this simulation, an intumescent fire-retardant coating is used to protect the steel frame; thus,
α = 1 / R i
where R i represents the equivalent thermal resistance, m2·°C.
The above functions are only applicable to lightweight steel components with uniform temperature distribution. However, this study intends to explore the influence of the construction form of the fire protection layer on the thermal response characteristics of the structure, necessitating a more precise comprehension of the temperature distribution within the components. Therefore, ABAQUS 2020 software was used to conduct transient thermal analysis on the structure.

2.3. Model Establishment

2.3.1. Model Parameters

The substation architecture model in this study was first drawn in SolidWorks 2018 drawing software and then imported into ABAQUS for simulation analysis. The elastic modulus of steel at room temperature is defined as 206 GPa, with a yield strength of 235 MPa and a Poisson’s ratio of 0.3. Additionally, the specific heat capacity, thermal expansion coefficient, thermal conductivity coefficient, elastic modulus reduction coefficient at high temperatures and stress–strain curve were determined according to the specified standards. The parameters and material properties of steel in the ABAQUS model are configured to reflect actual stress and true strain conditions.
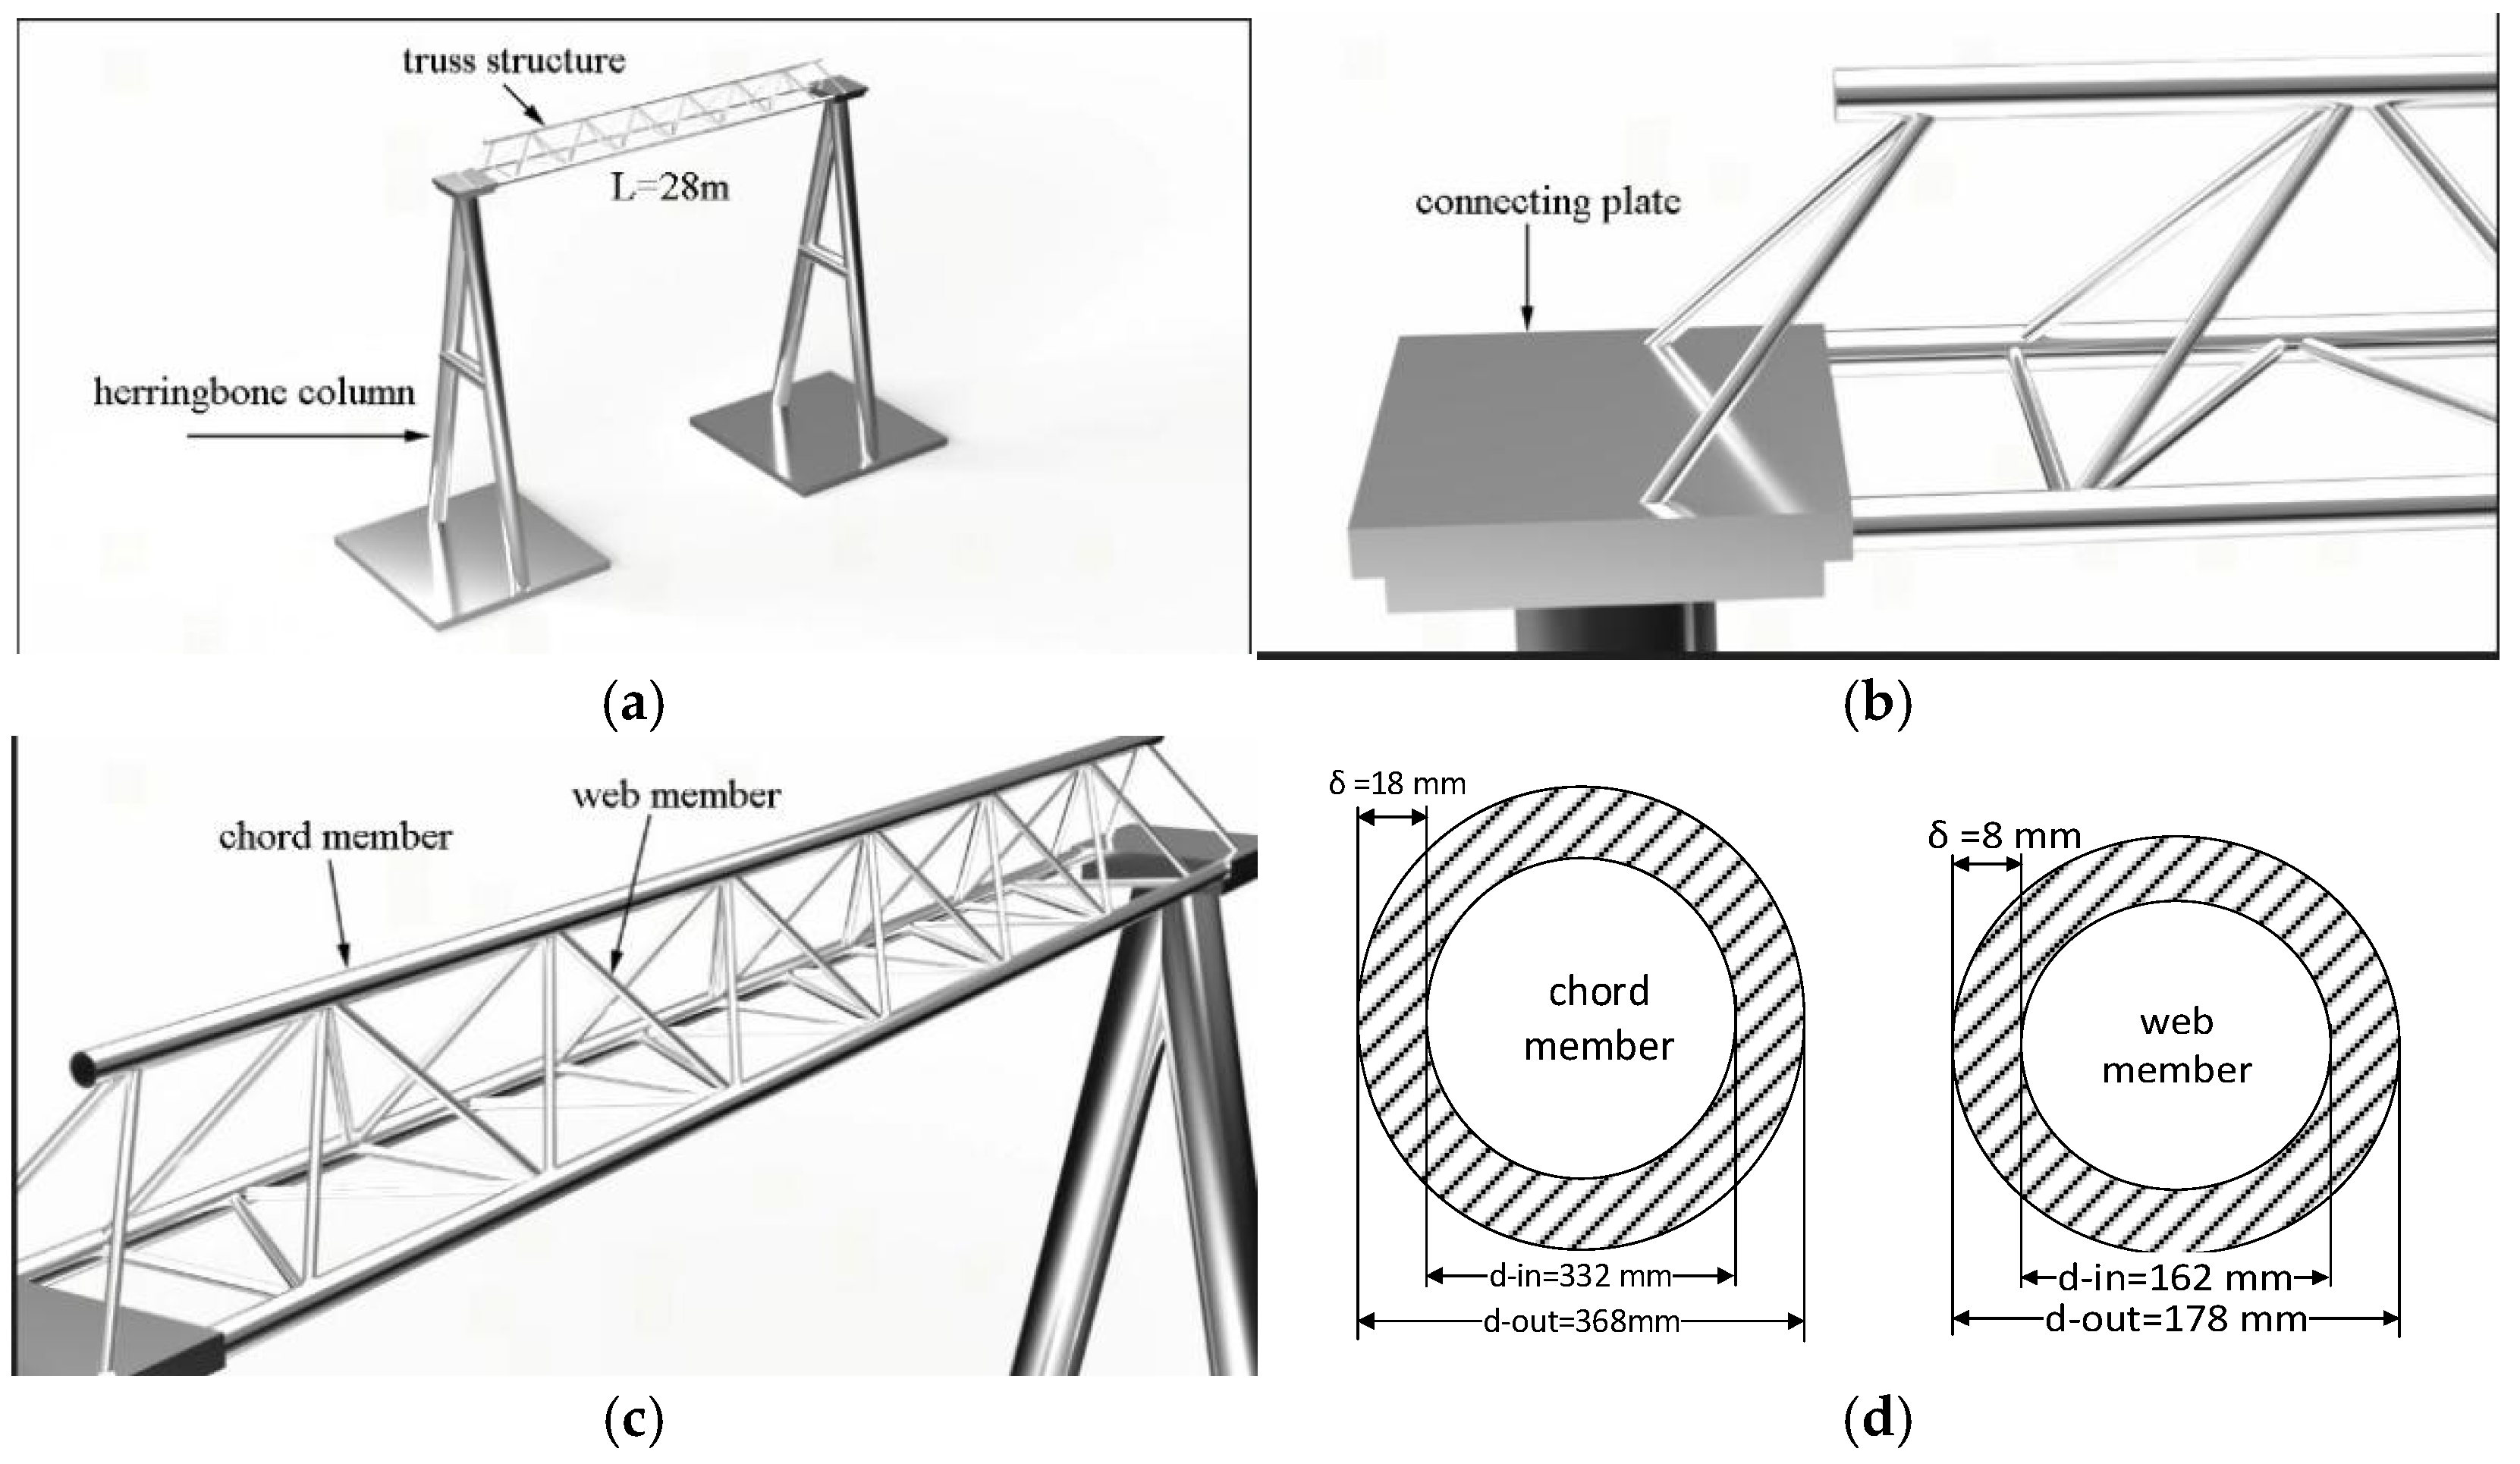
The dimensions of the steel pipes used for the chord members in the truss structure are as follows: outer diameter (d-out) = 368 mm, inner diameter (d-in) = 332 mm, and wall thickness (δ) = 18 mm. For the middle web member, the dimensions are: outer diameter (d-out) = 178 mm, inner diameter (d-inn) = 162 mm, and wall thickness (δ) = 8 mm. In this model, the triangular truss experiences the highest axial force at the endpoints of the upper and lower chord members under uniformly distributed node loads across the span. This axial force decreases gradually toward the mid-span. Conversely, the axial force in the web members increases toward the center. The total length of the steel beam forming the chords is L = 28 m, and the truss structure consists of six units with a spacing of 4.2 m between units. The unit section is an equilateral triangle with a side length of 2.8 m and a diagonal web length of 3.5 m. Figure 3 shows the schematic diagram of substation framework modeling.

2.3.2. Thermal–Mechanical Coupling Simulation

The values of the convective heat transfer coefficient and radiation coefficient thermal boundary conditions are shown in Table 2 [35]. Two analysis steps are set for thermal–mechanical coupling analysis. In the first step, external loads are applied to the structural model. In the second step, the temperature field of the component derived from transient thermal analysis is incorporated into the model, which effectively simulates the temperature effect on the structure. The duration for the second analysis step is set to 10,800 s.

2.3.3. Model Load and Temperature Loading

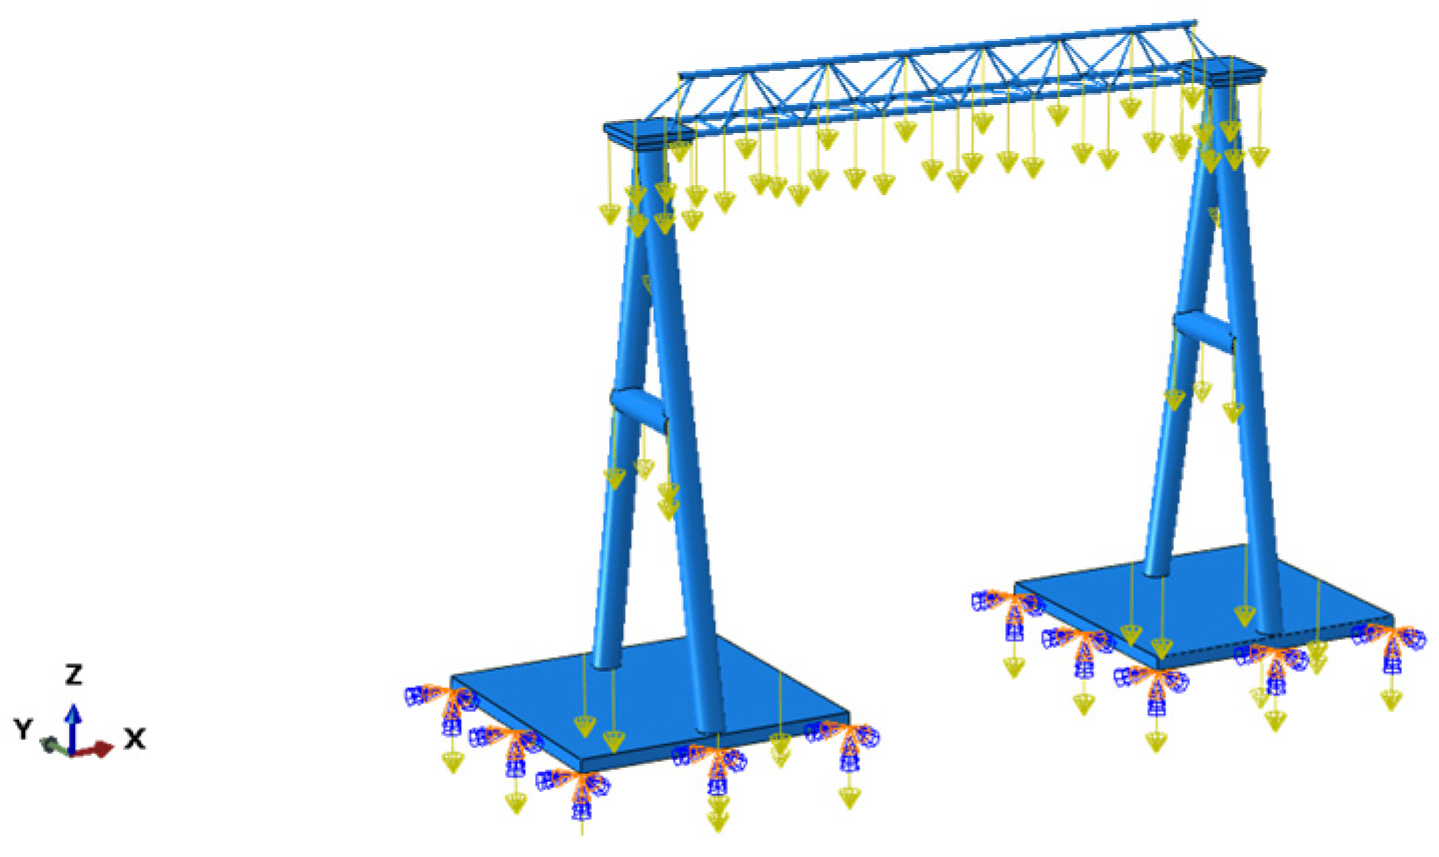
Due to the intrinsic gravitational effects of the substation framework, a gravity acceleration of 9.8 N/kg should be applied to the steel structure of the substation, with the bottom completely fixed, as shown in Figure 4.
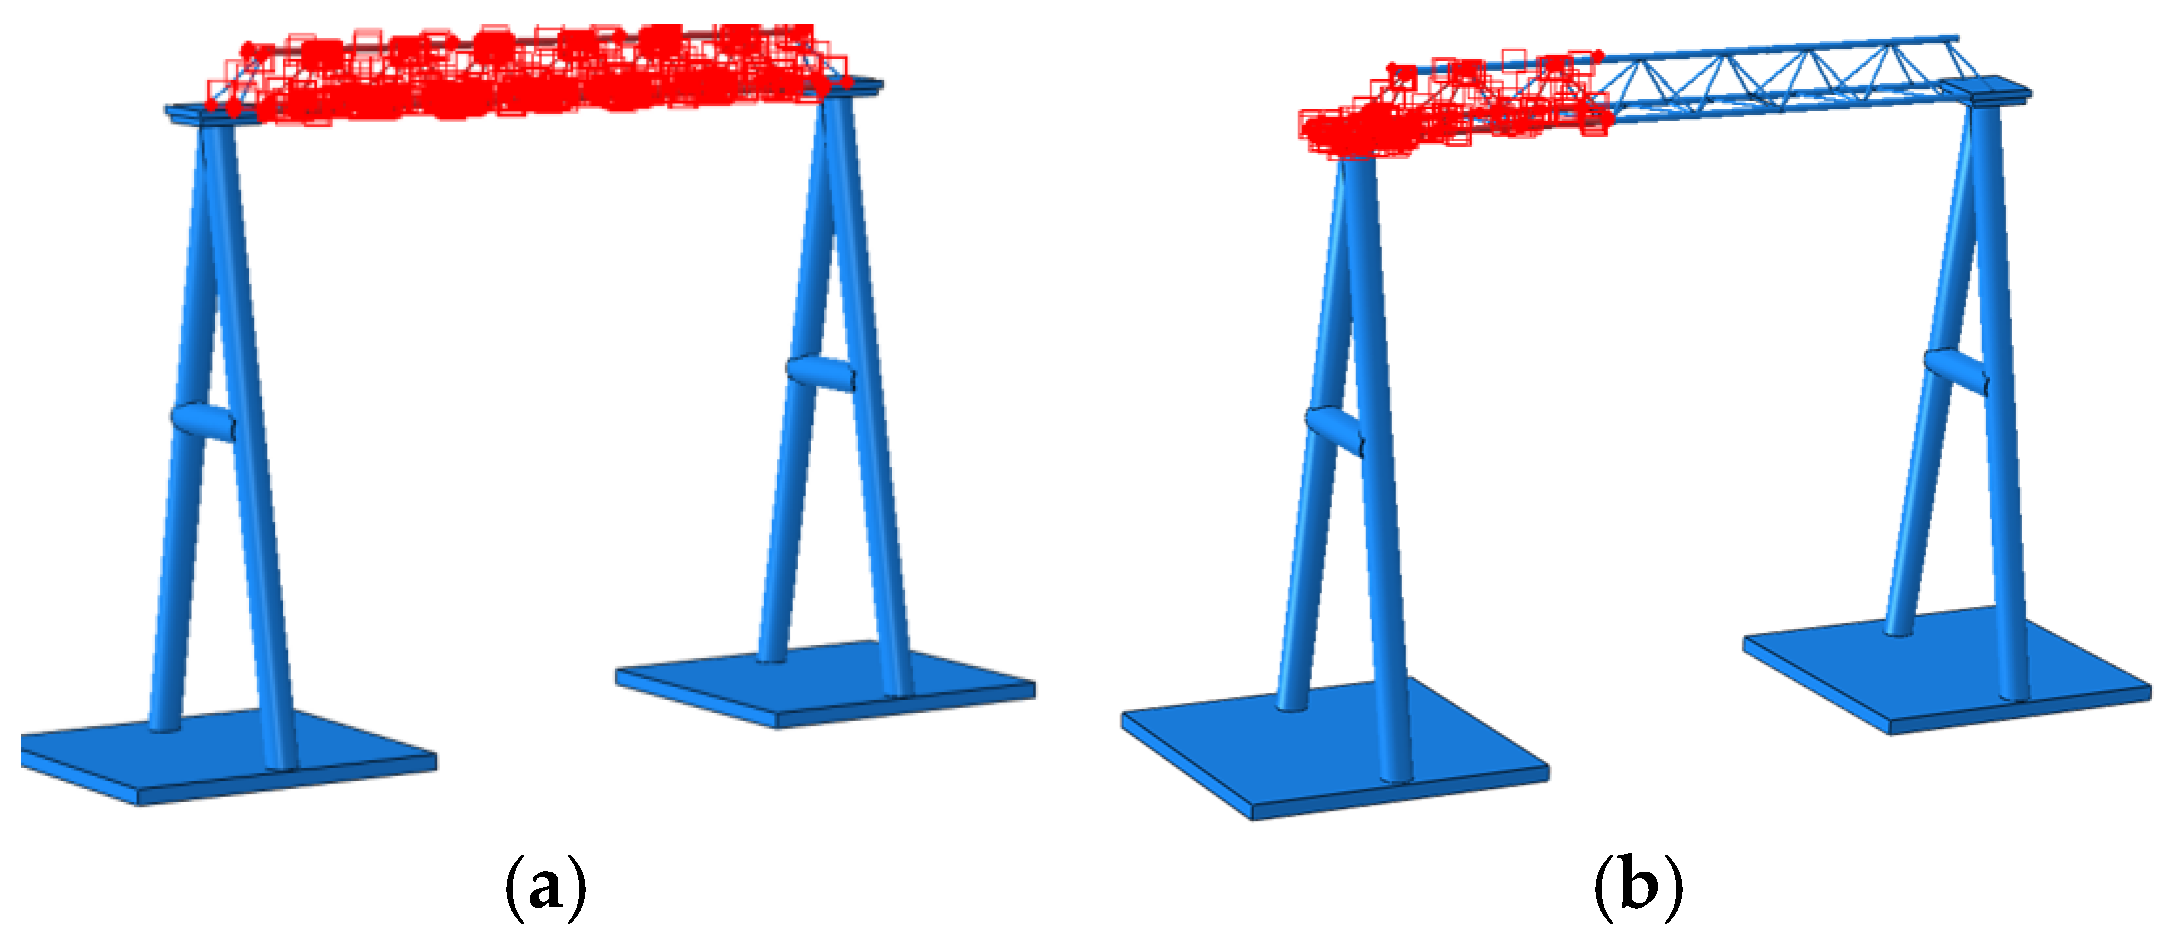
The fire scenario for the substation framework involves the exposure of the steel pipe surface to fire under the heating curve conditions specified by the ISO 834 standard [34]. The temperature field of the substation truss structure plays a crucial role in its thermal behavior during a fire. The change in the heat release rate and location of the fire source affects the temperature field of the steel structure in the substation. To study the temperature rise in components in a fire, ABAQUS software was used for transient thermal analysis to obtain the temperature distribution of trusses in different fire scenarios. The simulation duration was set to 10,800 s. Based on actual-world conditions, two typical fire scenarios were designed, as shown in Figure 5.

2.3.4. Fire-Retardant Coating Modeling

In this study, shell elements were used to model the fire-retardant coating part, and the thickness of the fire-retardant coating layer was defined as that of the shell element section. Using the skin previously created on the surface of the truss, Tie constraints were used to assemble the fire-retardant coating layer onto the surface of the substation steel truss structure, achieving adhesion protection of the truss steel structure along the shape of the components. Finally, the unit thickness of the fire-retardant coating was removed in the simulation results [7]. Our research team developed an intumescent fire-retardant coating, which was verified to effectively protect steel structures. The fire-retardant coating was mainly composed of polyphosphate (APP), pentaerythritol (PER), melamine (MEL), titanium dioxide (TiO2), and chlorinated paraffin (CP-52) [25]. According to the experimental results, the thickness of the fire-retardant coating during the simulation was determined as 1.5 mm. Table 3 shows the material parameters of the fire-retardant coating [25].

2.4. Criteria for Critical Factors

In fire simulation, three factors can be considered to assess whether a structure has reached its ultimate load-bearing capacity: temperature, stress and displacement.

2.4.1. Critical Temperature

According to the Code for Fire Safety of Steel Building Structures [26], during a fire, the temperature of exposed steel components will rise to 500 °C in a short period of time. This increase elevates the components to their crucial temperature threshold, which leads to a loss of load-bearing capability and eventually causes the structural failure of the building. Therefore, 500 °C is used as the critical temperature of the instability of the steel structure of the substation in this study.

2.4.2. Critical Stress

In this study, Q235 steel is used as the main material for the steel truss structure. Consequently, if the stress intensity in a particular region exceeds 235 MPa, the steel structure may become unstable. This value of 235 MPa is considered the critical stress threshold for instability in the steel structure.

2.4.3. Critical Displacement

Characteristic deformation: In accordance with Eurocode 3—Design of steel structure [28], the ultimate bearing capacity of a component during a fire resistance test can be determined when the deformation exceeds L/30 (L is the length of a single component). According to the calculation, the deformation of the web steel pipe should be limited to within 0.12 m, and the deformation of the truss in the X, Y and Z directions should not exceed 0.94 m, 0.094 m, and 0.08 m, respectively.
Overall deformation: The allowable deflection value of bending members is δ < l/400 (l is the span of the beam and δ is the maximum deflection value of the beam). According to calculations, the maximum deflection of the overall structure of the steel truss should not exceed 0.07 m (70 mm) [28].

3. Results and Discussion

3.1. Finite Element Analysis of Substation Framework

The fire scenario of the substation framework involved a finite element analysis model with 358,004 grid elements under the heating curve conditions specified by the ISO 834 standard. The detailed procedure of the fully thermally coupled numerical simulation method can be described as follows: (1) Based on the steel parameters given in Table 1, the cross-sectional properties of the element were defined. (2) Using the heating curve conditions specified by the ISO 834 standard, the radiation coefficient of the fire-receiving surface was set to 0.8, and the convective heat transfer coefficient of the fire-receiving surface was taken as 25 W/(m2·°C) [35]. (3) The initial temperature of the overall structure was set as 25 °C, which was also the ambient temperature. (4) The analysis steps for temperature displacement coupling (transient) were established. Due to the fire resistance limit requirement of 3 h for the steel structure of the substation, the fire exposure time, i.e., the time length, was set as 10,800 s. (5) Finally, the finite element model was divided into grids, and the element properties of the substation framework mesh were set to C3D10MT. (6) When using fire-resistant coating protection on the substation framework, the applied temperature was determined on the surface of the fire-resistant coating, and the parameters were set according to the properties of the fire-resistant coating in Table 3. Steps (1)–(5) were repeated, and finally the shell model of the fire-resistant coating was deleted during analysis. The thermal response characteristics of the substation framework coated with fire-resistant coating were studied using a fully thermomechanically coupled numerical simulation method, and the fire resistance effect of the intumescence fire-retardant coating was simulated.

3.2. Influence of Static Load on Substation Framework

3.2.1. Stress Field Analysis Under Static Force

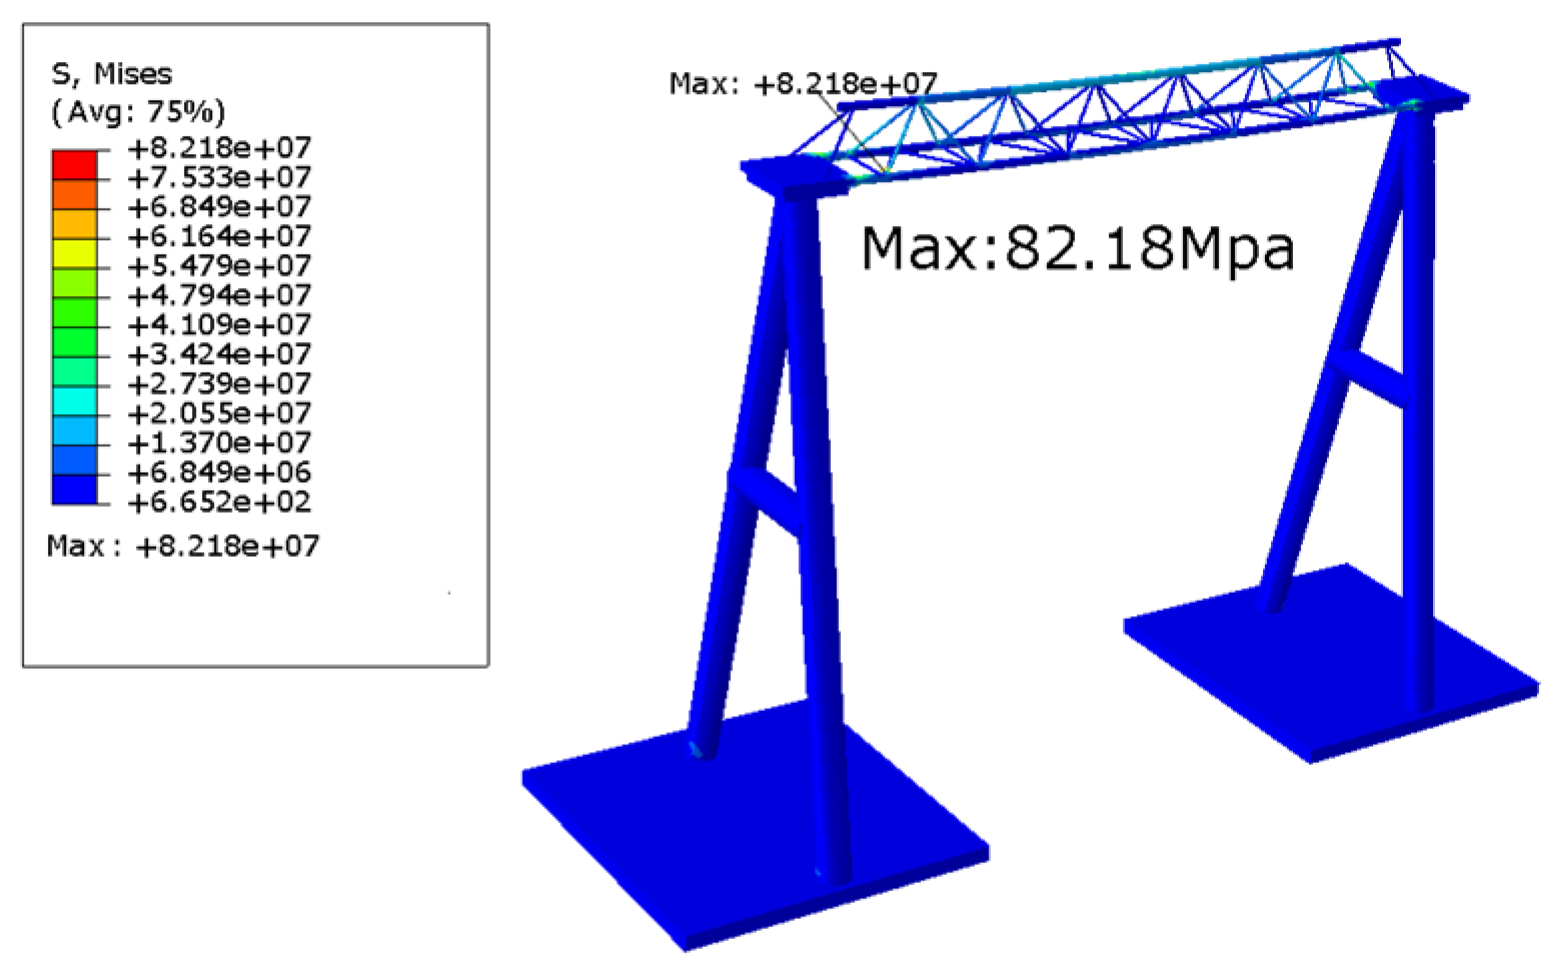
At room temperature, the entire substation framework does not undergo thermal expansion. Due to the gravitational force exerted by the truss itself, the axial force in the upper and lower chord members is the greatest at the endpoints and progressively diminishes toward the mid-span. The highest static stress is generated at the connection between the web members and chord members at both ends of the truss structure, with a stress magnitude of 82.18 MPa. Due to the static bending of the upper chord, a static stress of 25 MPa is generated in the middle of the chord. Additionally, a static stress of 52 MPa is also generated in the area where the lower web member connects to the connecting plate due to the gravity of the truss itself. Figure 6 shows the stress cloud map distribution under static action of the steel structure.

3.2.2. Displacement Analysis Under Static Action

The resultant displacement refers to the final cumulative displacement achieved by an object under multiple displacement actions, calculated as the vector sum of the displacement in the X, Y, and Z directions. Under the static force, the greatest displacement occurs in the lower chord of the truss, so only the data of the lower chord needs to be extracted. Consequently, the starting point (0) is defined as the left end of the lower chord at the bottom right of the left view of the steel structure, while the right end serves as the endpoint (28).
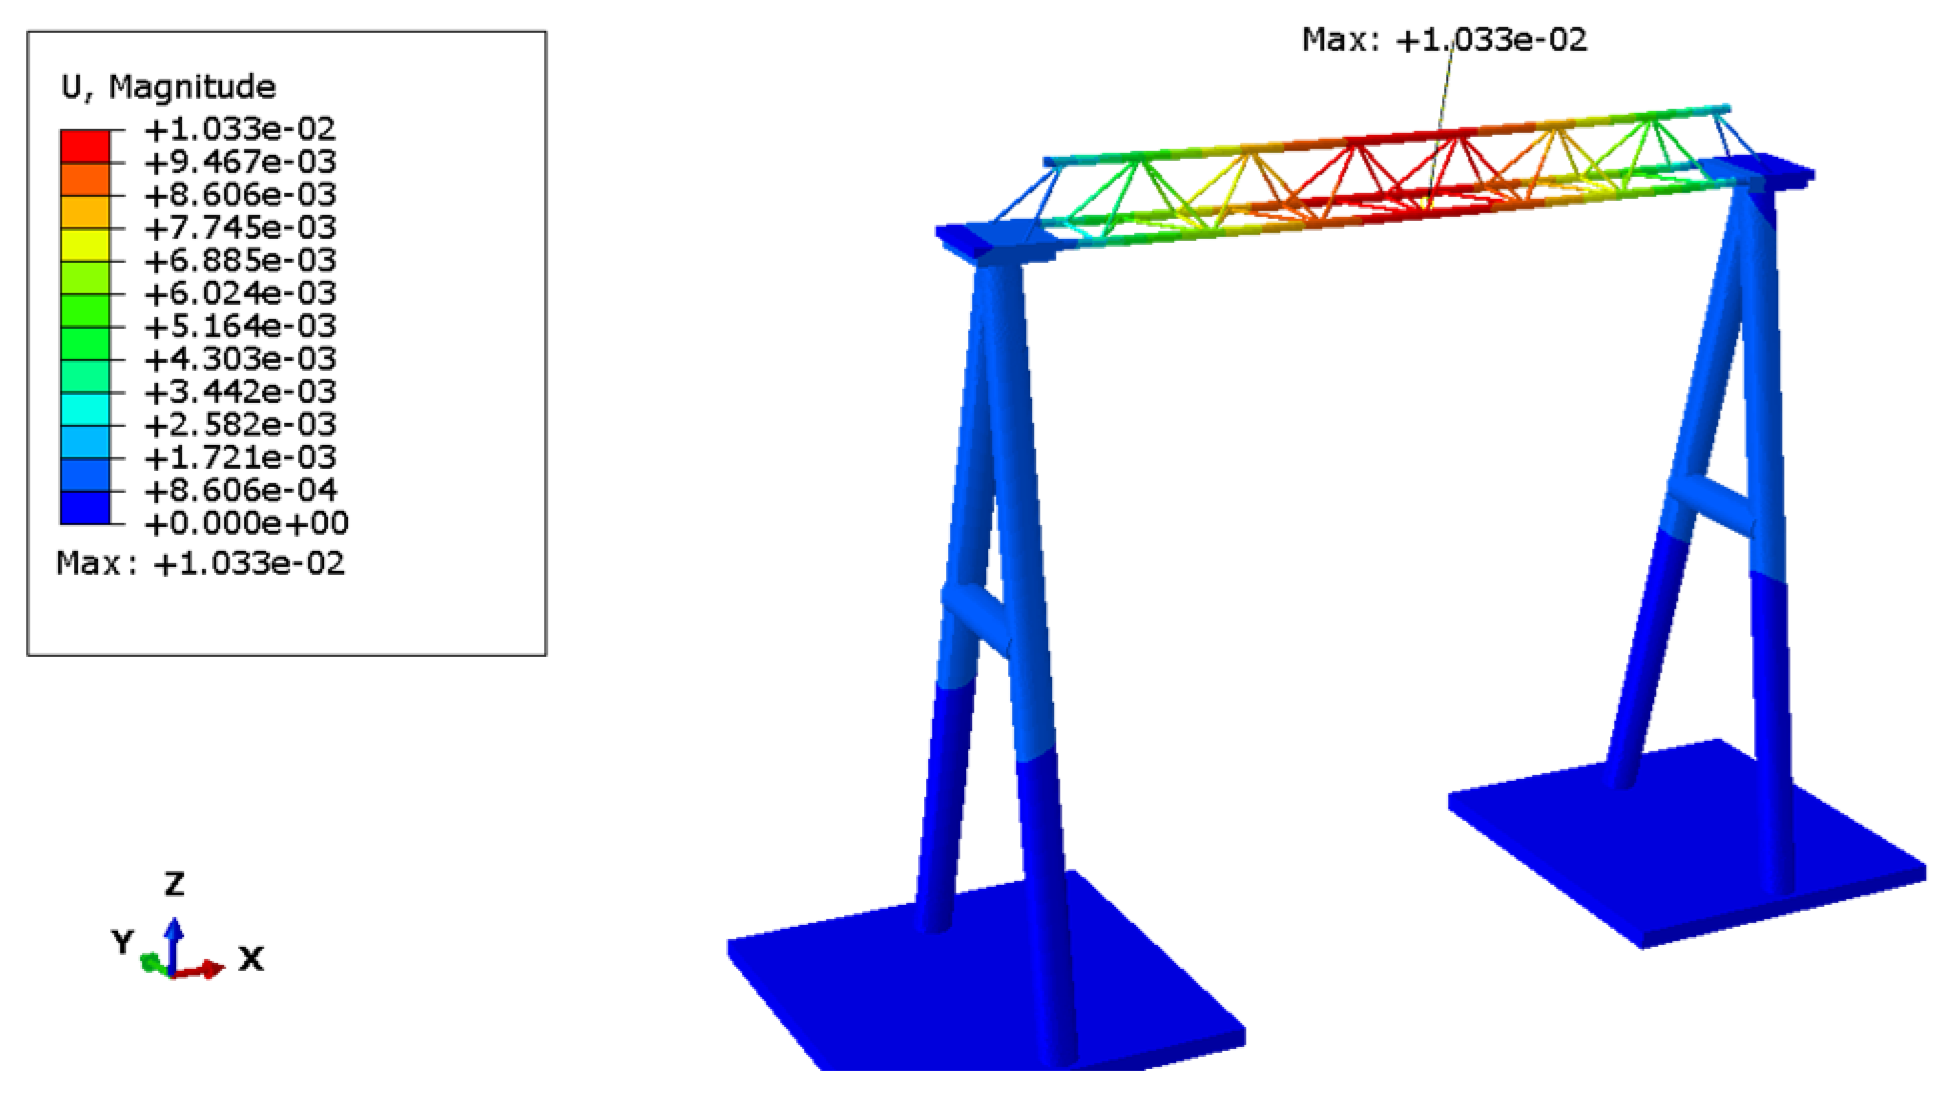
As shown in Figure 7, under the gravity of the truss itself, the combined displacement of the chord and web members in the middle of the truss increases continuously from both ends toward the center of the truss. The point of maximum resultant displacement is in the area where the two central web members are connected to the chord members, with a maximum displacement of 0.01033 m.

3.3. Temperature Field Analysis

For the two fire scenarios, a transient thermal–mechanical coupling analysis was conducted on the substation framework using the heating curve conditions specified by the ISO 834 standard over a duration of 10,800 s, and the temperature field results of the steel structure throughout the entire 10,800 s were obtained. Four representative moments were selected to extract the temperature field distribution cloud map of the substation steel structure, facilitating an examination of the temperature variation process.
According to the specification, 500 °C was the critical temperature of the steel [26]; therefore, the areas exceeding 500 °C in the temperature field cloud map were marked in red.

3.3.1. Temperature Field Analysis of Substation Framework

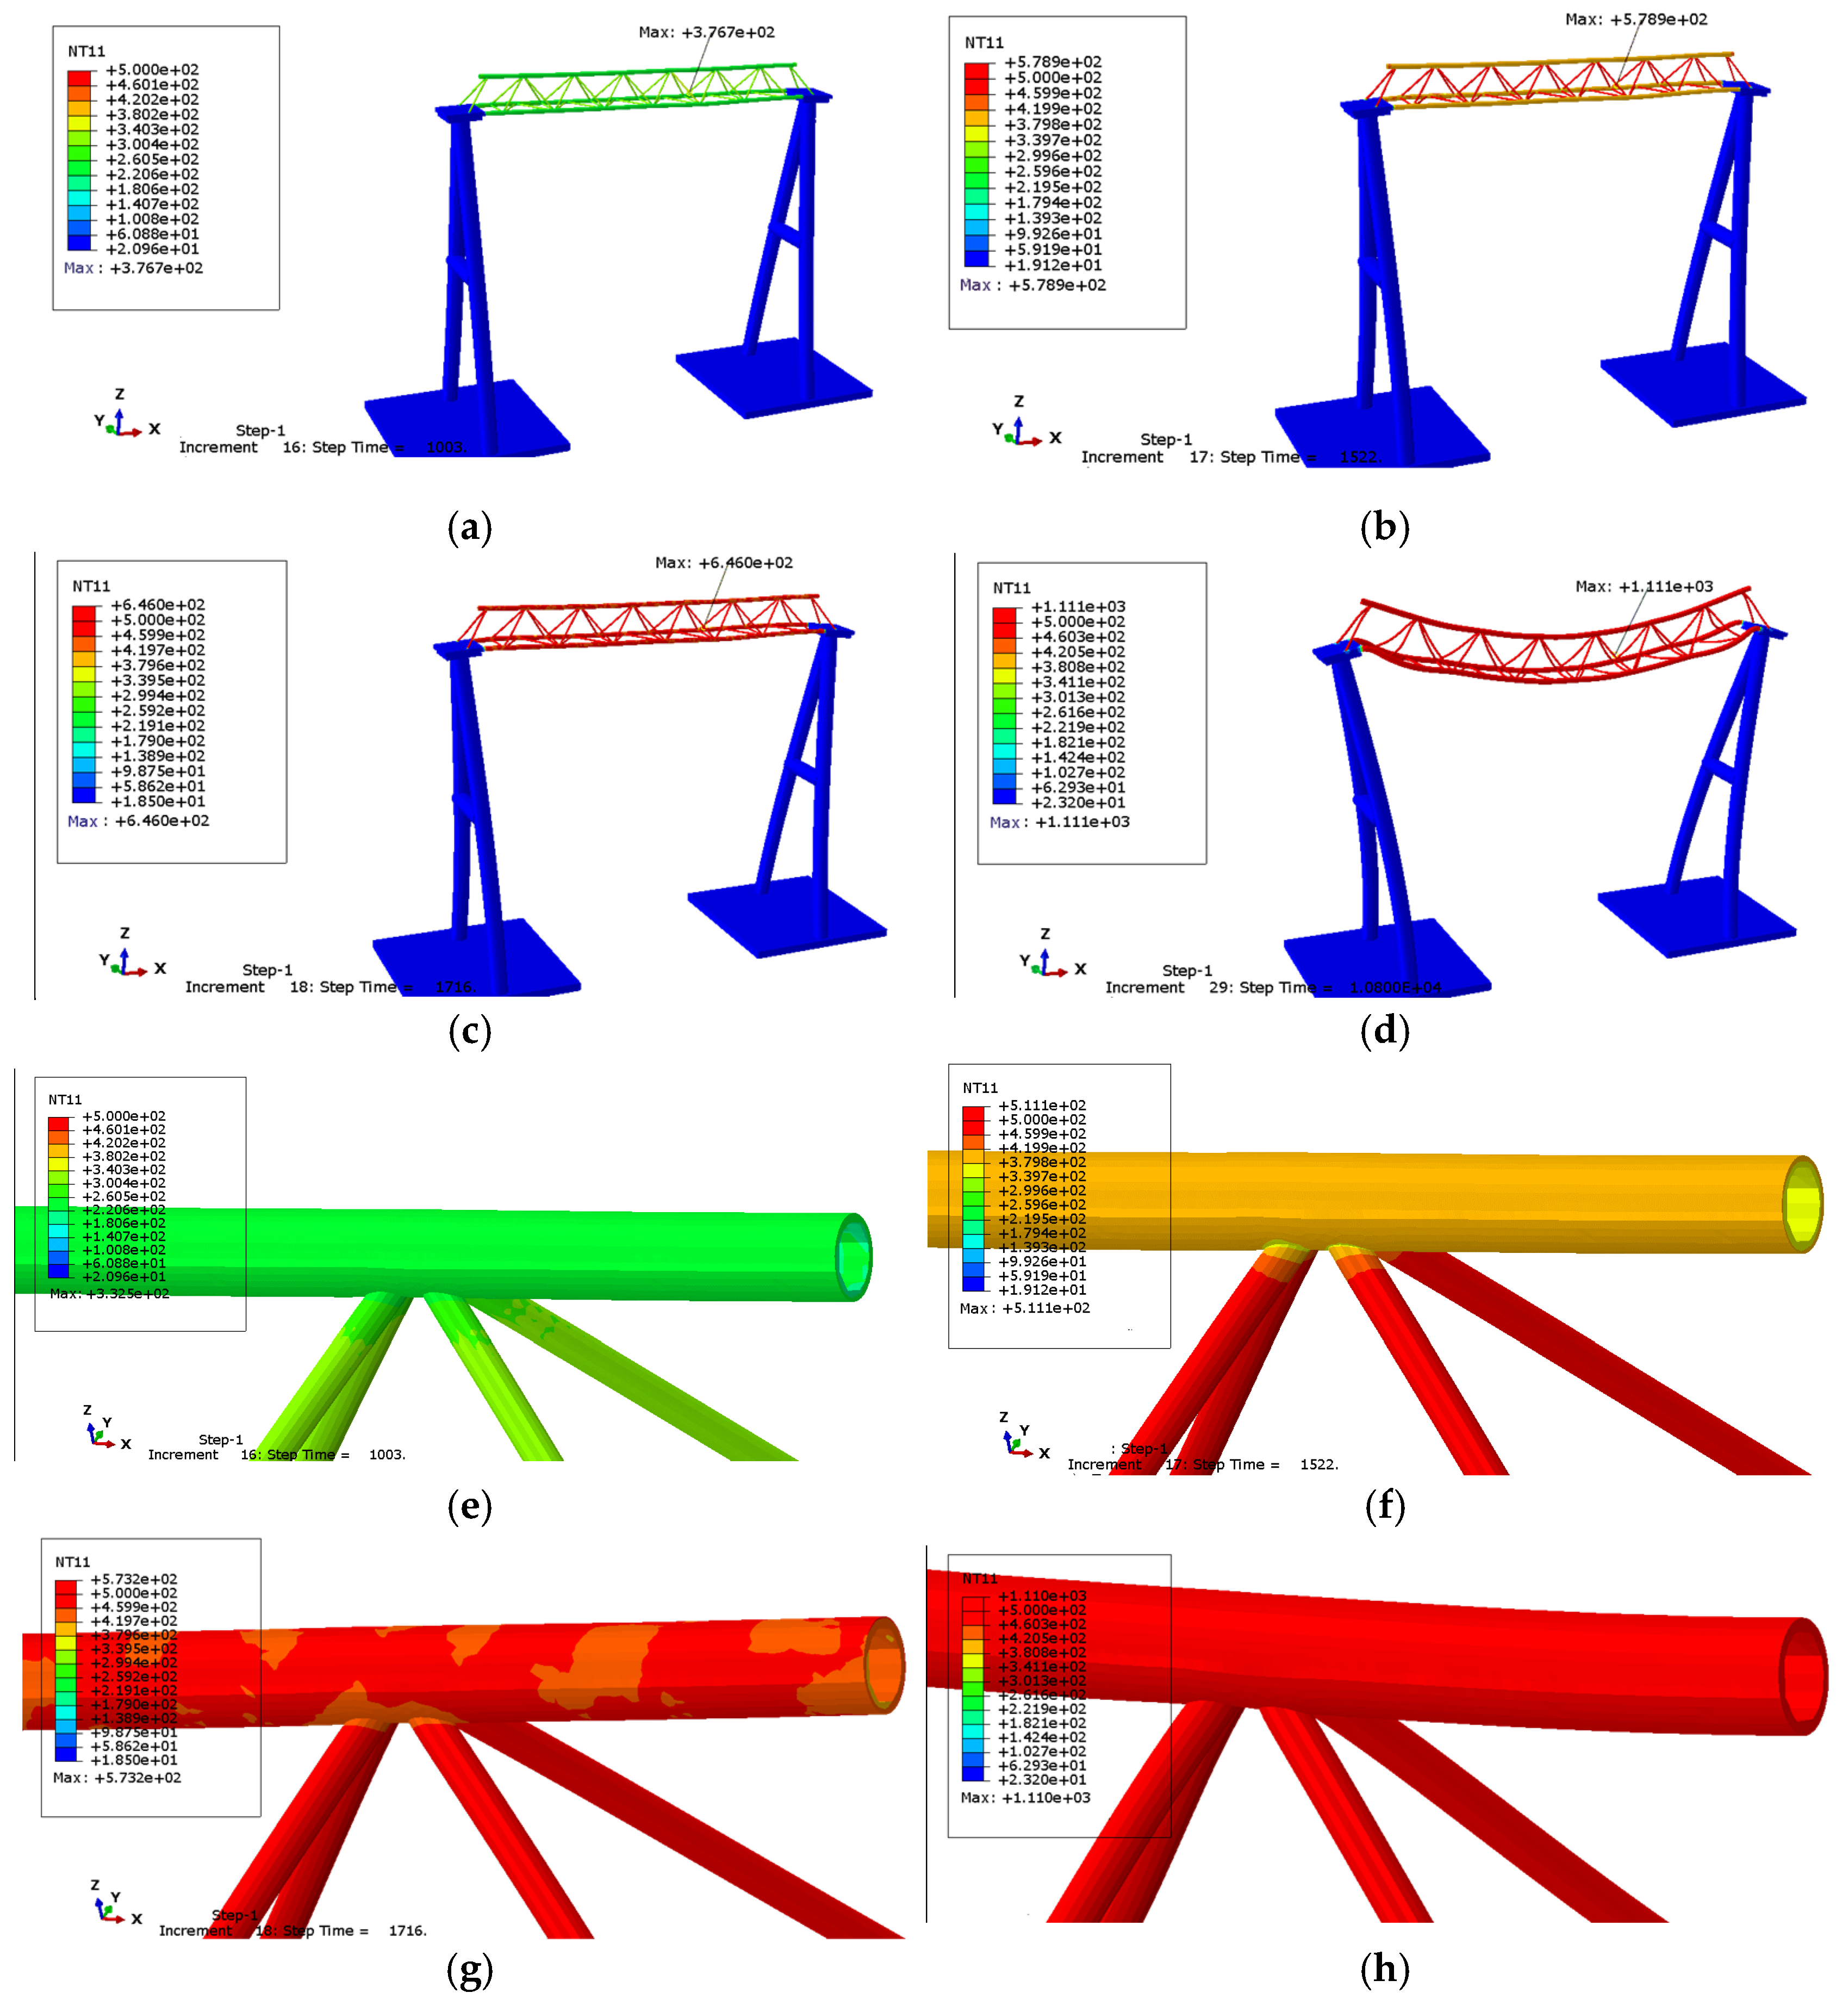
Given the thin wall of the web member, the time required for heat conduction is short, resulting in a minimal temperature difference between the inner and outer diameters of the steel pipe. Consequently, the surface temperature of the web member is only required under the working conditions. Under Fire Scenario 1 (S1), the outer diameter of the steel pipe expands as a result of thermal exposure during the initial heating phase. Upon reaching a heating duration of 1003 s, the average temperatures are 300 °C for the web member surface, 270 °C for the chord member surface, and 230 °C for the inner diameter of the steel pipe in the chord member of the truss. Because of the limited heat accumulation at the center of the truss, certain areas of the web member surface reach 376.7 °C. After being heated for 1522 s, the average surface temperature of the truss web member becomes 500 °C, while the average surface temperature of the chord member reaches 415 °C. Additionally, the average inner diameter temperature of the chord steel tube is 380 °C, and the maximum surface temperature of the web member at the center of the truss reaches 578.9 °C. Upon heating for 1716 s, the rate of external heating surpasses the internal heat transfer rate, leading to an increased temperature difference between the inner and outer diameters of the steel pipe. At this point, the average surface temperature of the truss web reaches 580 °C, the average surface temperature of the chord is 500 °C, the inner diameter temperature of the chord steel pipe measures 435 °C, and the web at the center of the truss attains a temperature of 646 °C. When the heating duration extends to 10,800 s, both the web and chord surfaces of the truss are heated to 1111 °C. As the surface temperature of the steel pipe rises, the temperature difference with the external environment becomes minimal, resulting in negligible heat transfer. By this stage, internal heat transfer is essentially complete, with almost no remaining temperature gradient. Figure 8 displays the temperature change in the steel structure.
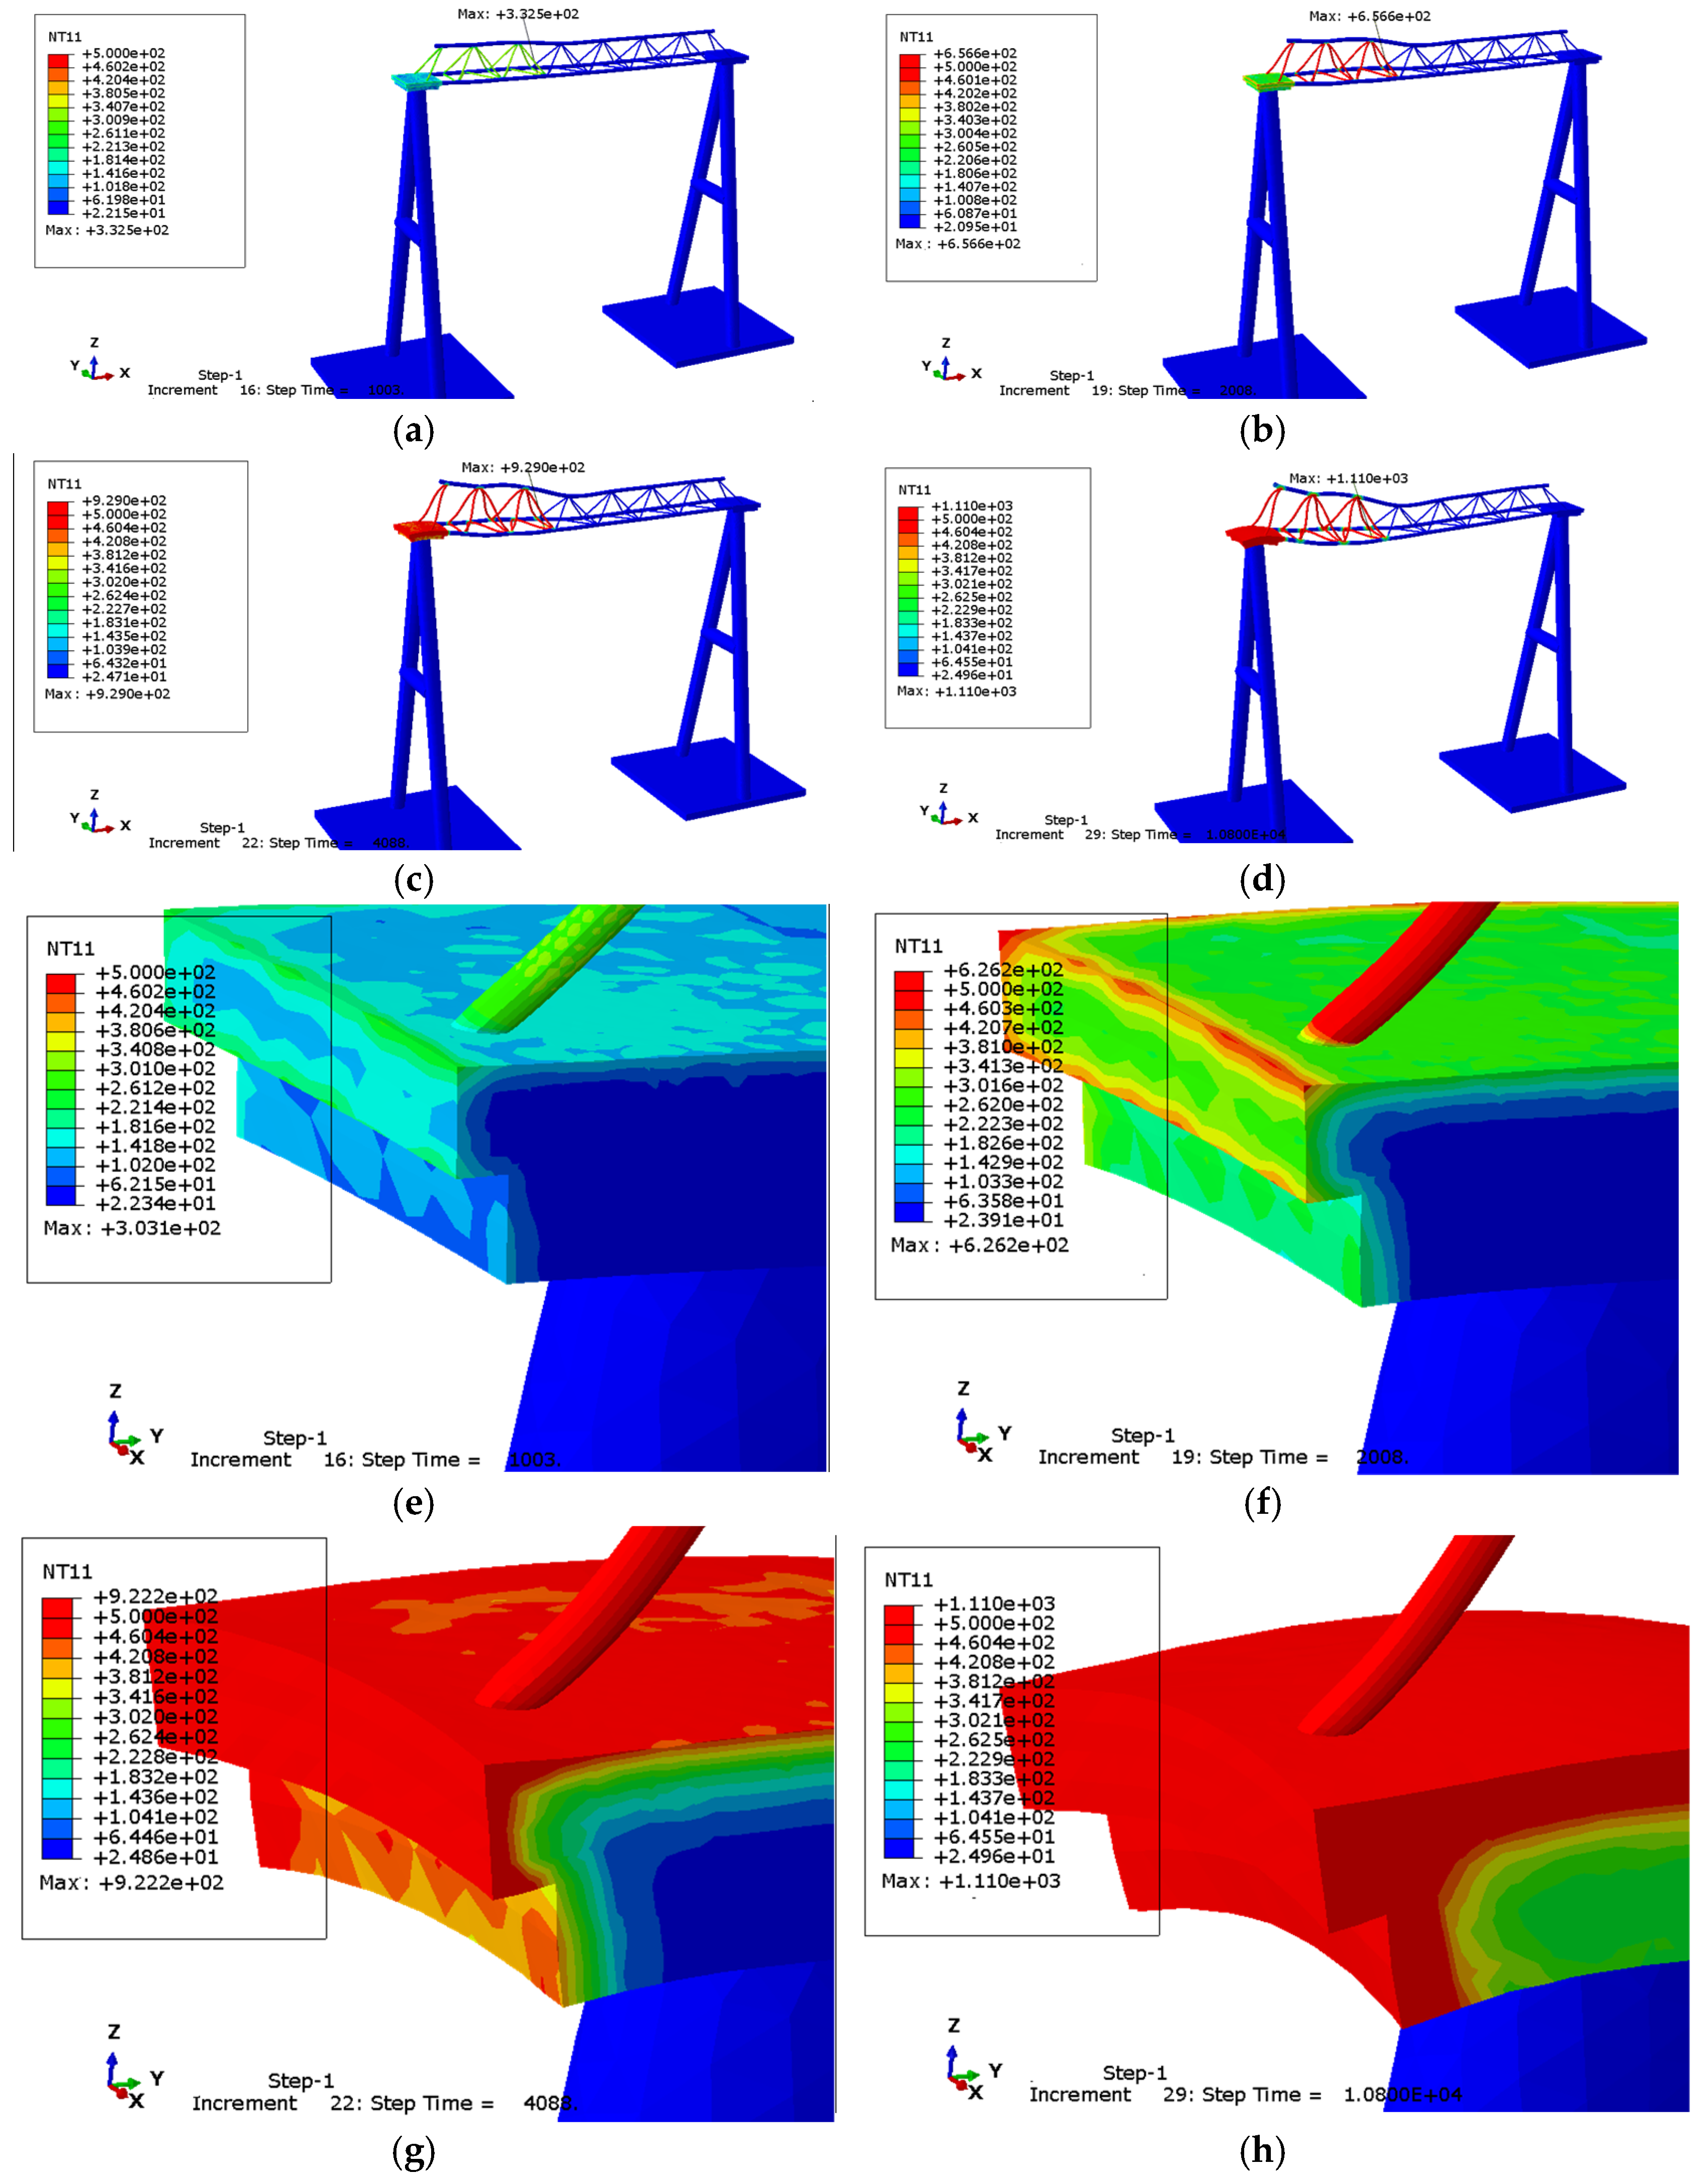
Under Fire Scenario 2 (S2), after heating for 1003 s, the average temperature at the edge of the connecting plate is 220 °C, while the heated web member has an average temperature of 300 °C. The temperature in the heat accumulation area can rise up to 332.5 °C. At 2008 s of heating, the average temperatures at the edge of the connecting plate and the heated web member are 450 °C and 625 °C. The temperature in the temperature accumulation area reaches 656.6 °C, and the average temperature inside the connecting plate is 48 °C. When subjected to heating for 4088 s, the average temperatures of the heated truss web members, the outer edge and the middle surface are 922 °C, 680 °C, and 480 °C, and the average temperature inside the truss web members is 60 °C. At this time, a significant temperature gradient exists between the interior and exterior of the connecting plate. Upon heating to 10,800 s, the transfer of external heat diminishes as a result of the reduced temperature difference, and the temperature difference between the interior and exterior of the heated web member approaches zero. The surface temperatures of both the steel pipe in the heated web member and the connecting plate reach 1110 °C. The average temperature at the connection position between the chord and the heated web member is 800 °C, and the average temperature in the central area inside the connecting plate is 280 °C. During this period, the extent of the hazardous area, characterized by the highest internal–external temperature disparity exceeding 500 °C, increases significantly. Figure 9 illustrates the temperature change in the steel structure in S2.

3.3.2. Temperature Field Analysis of Substation Framework with Fire-Resistant Coating

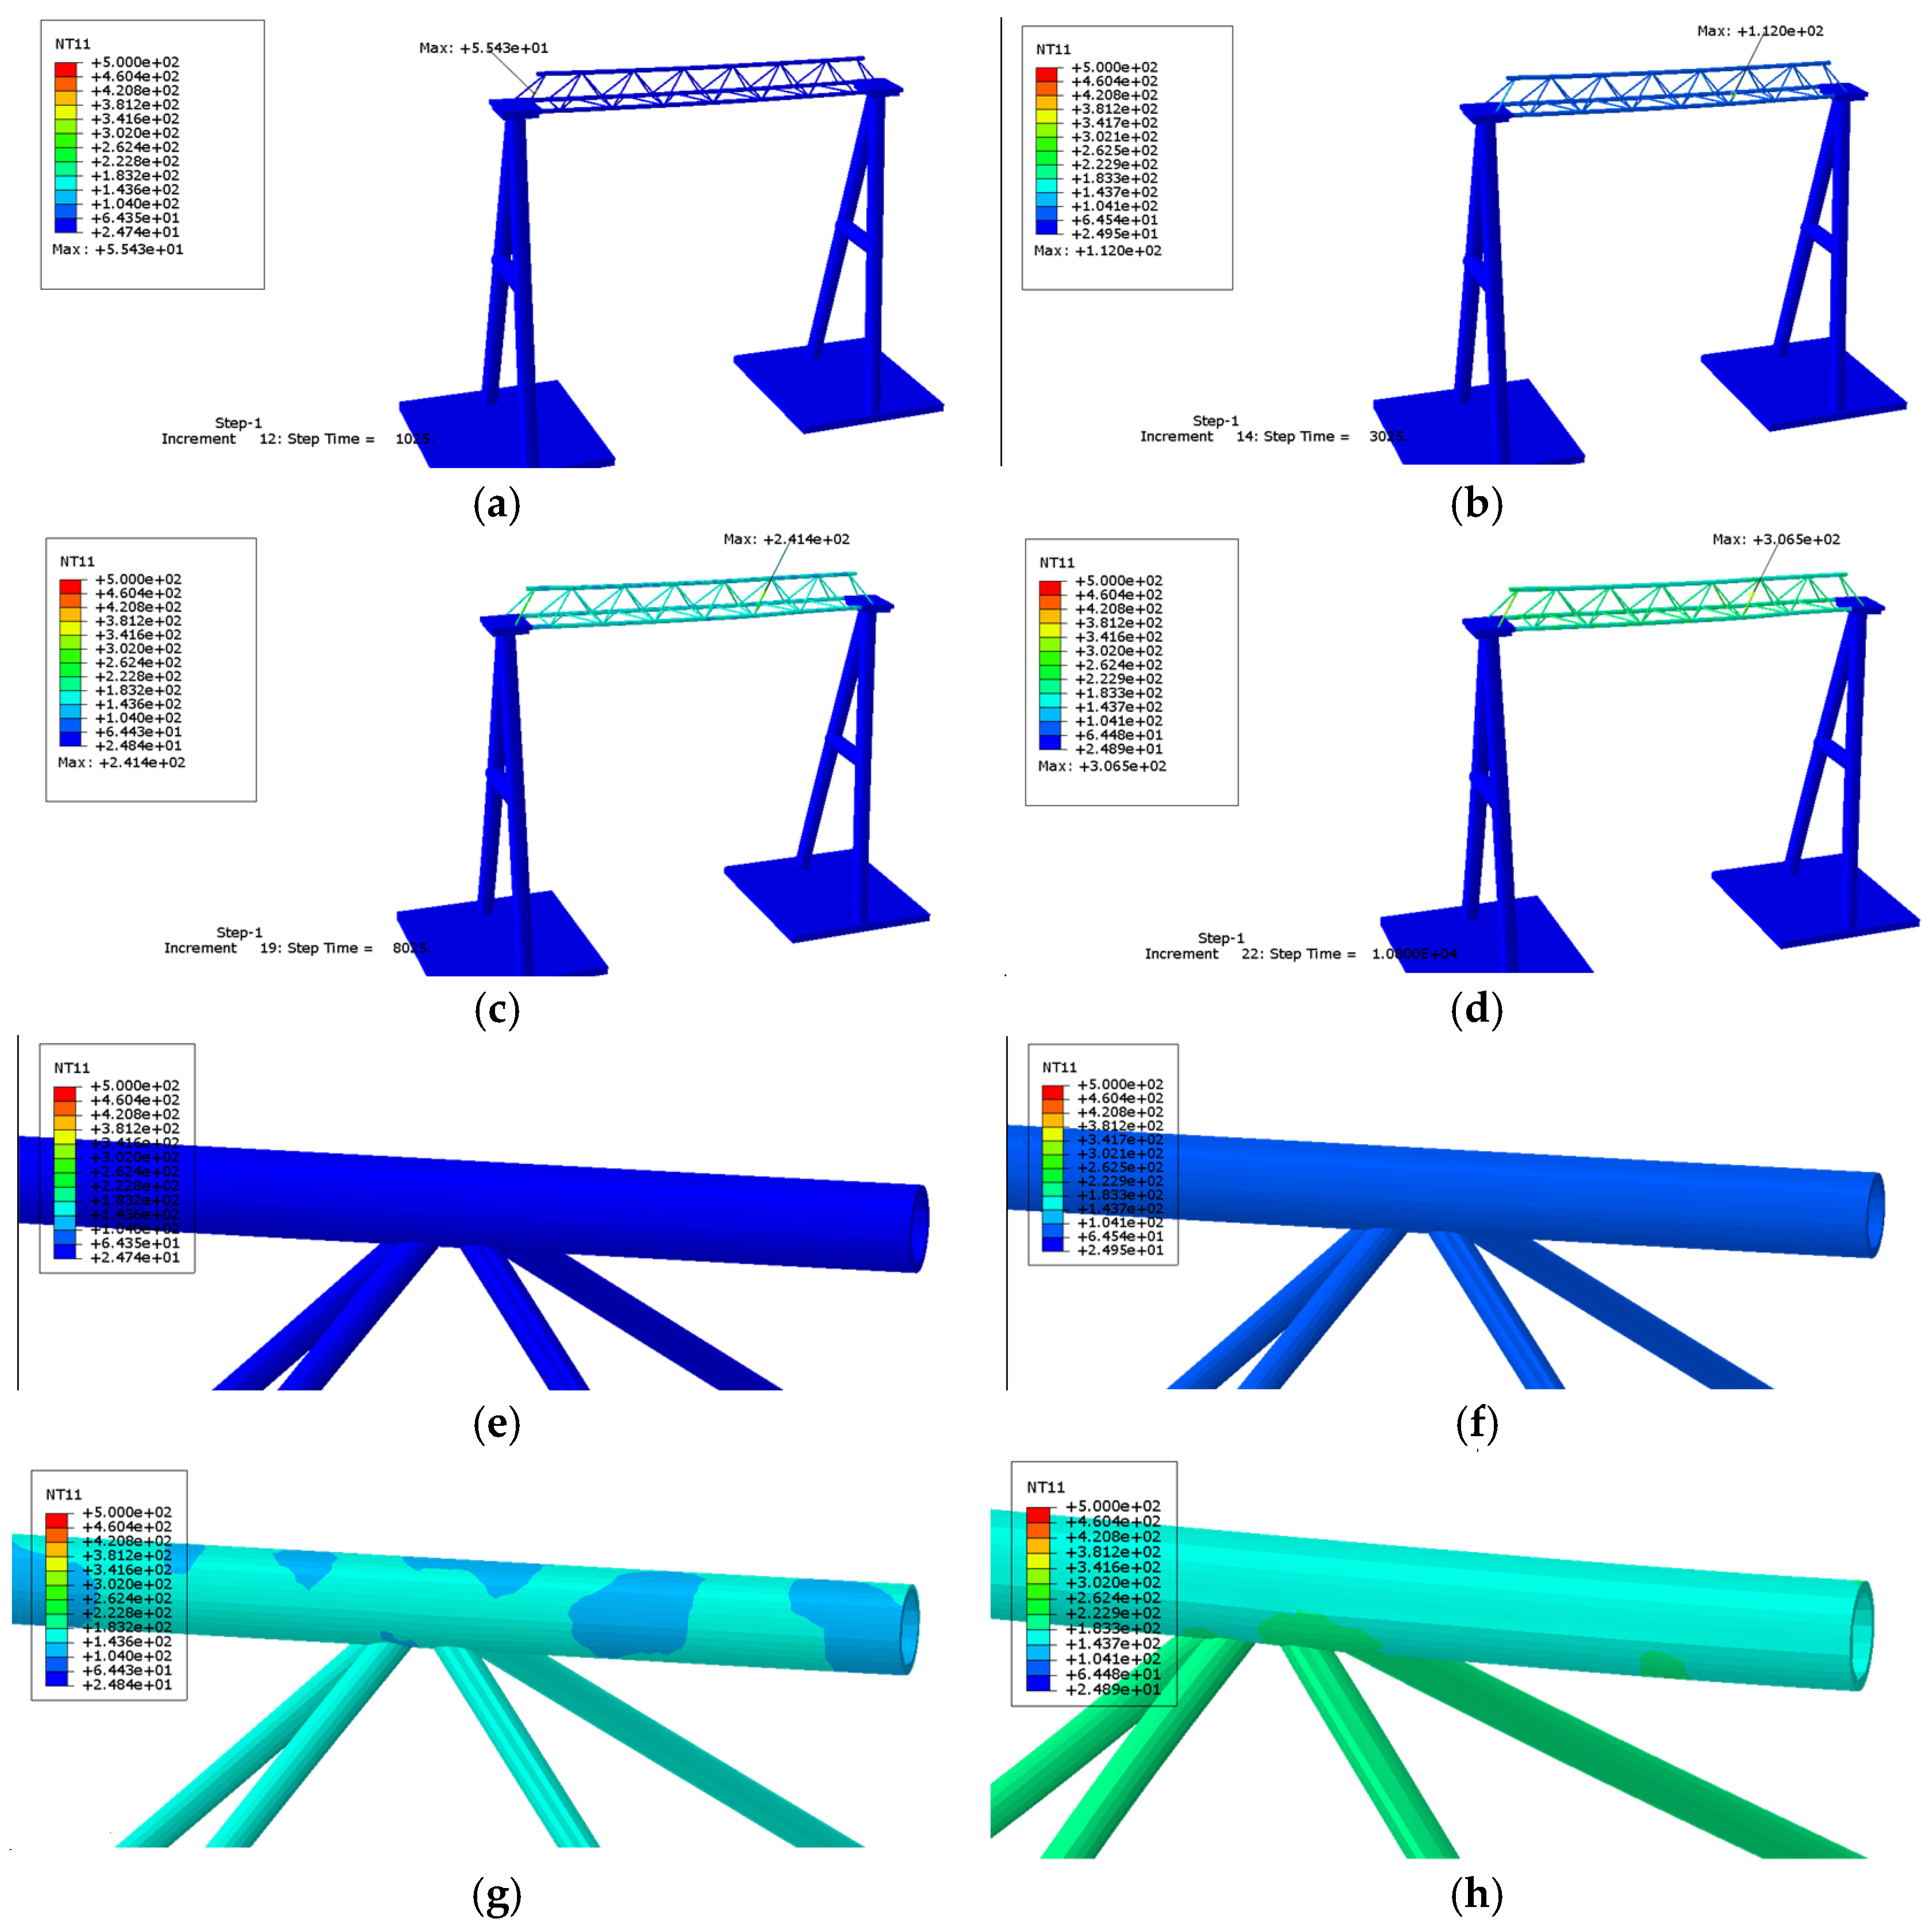
The heating conditions of S1 were applied to the steel truss structure coated with a fire-retardant coating. Upon heating for 1025 s, the temperature of the web members at both ends of the truss reaches 55 °C due to heat accumulation, while the average temperature in most areas remains at 35 °C. After heating for 3025 s, the temperature in the web member area at the center of the truss rises to 112 °C due to heat accumulation, and the average temperature on the steel surface of the truss becomes 100 °C. Upon heating for 8025 s, the temperature in the web area at the center of the truss reaches 241 °C, and the average temperature in most areas of the truss chord is 140 °C, while the average temperature in most areas of the web is 180 °C. After heating for 10,800 s, the web area at the center of the truss reaches 306 °C, with average temperatures of 260 °C in most of the web area and 170 °C in most of the chord area. There is a negligible temperature difference between the inner and outer diameters of the steel pipe throughout the entire process. This phenomenon occurs because the external heating rate of the steel pipe is lower than its internal heat transfer rate, preventing substantial heat accumulation. Notably, no region exceeds 500 °C in temperature. Figure 10 reveals the temperature change in the steel structure.
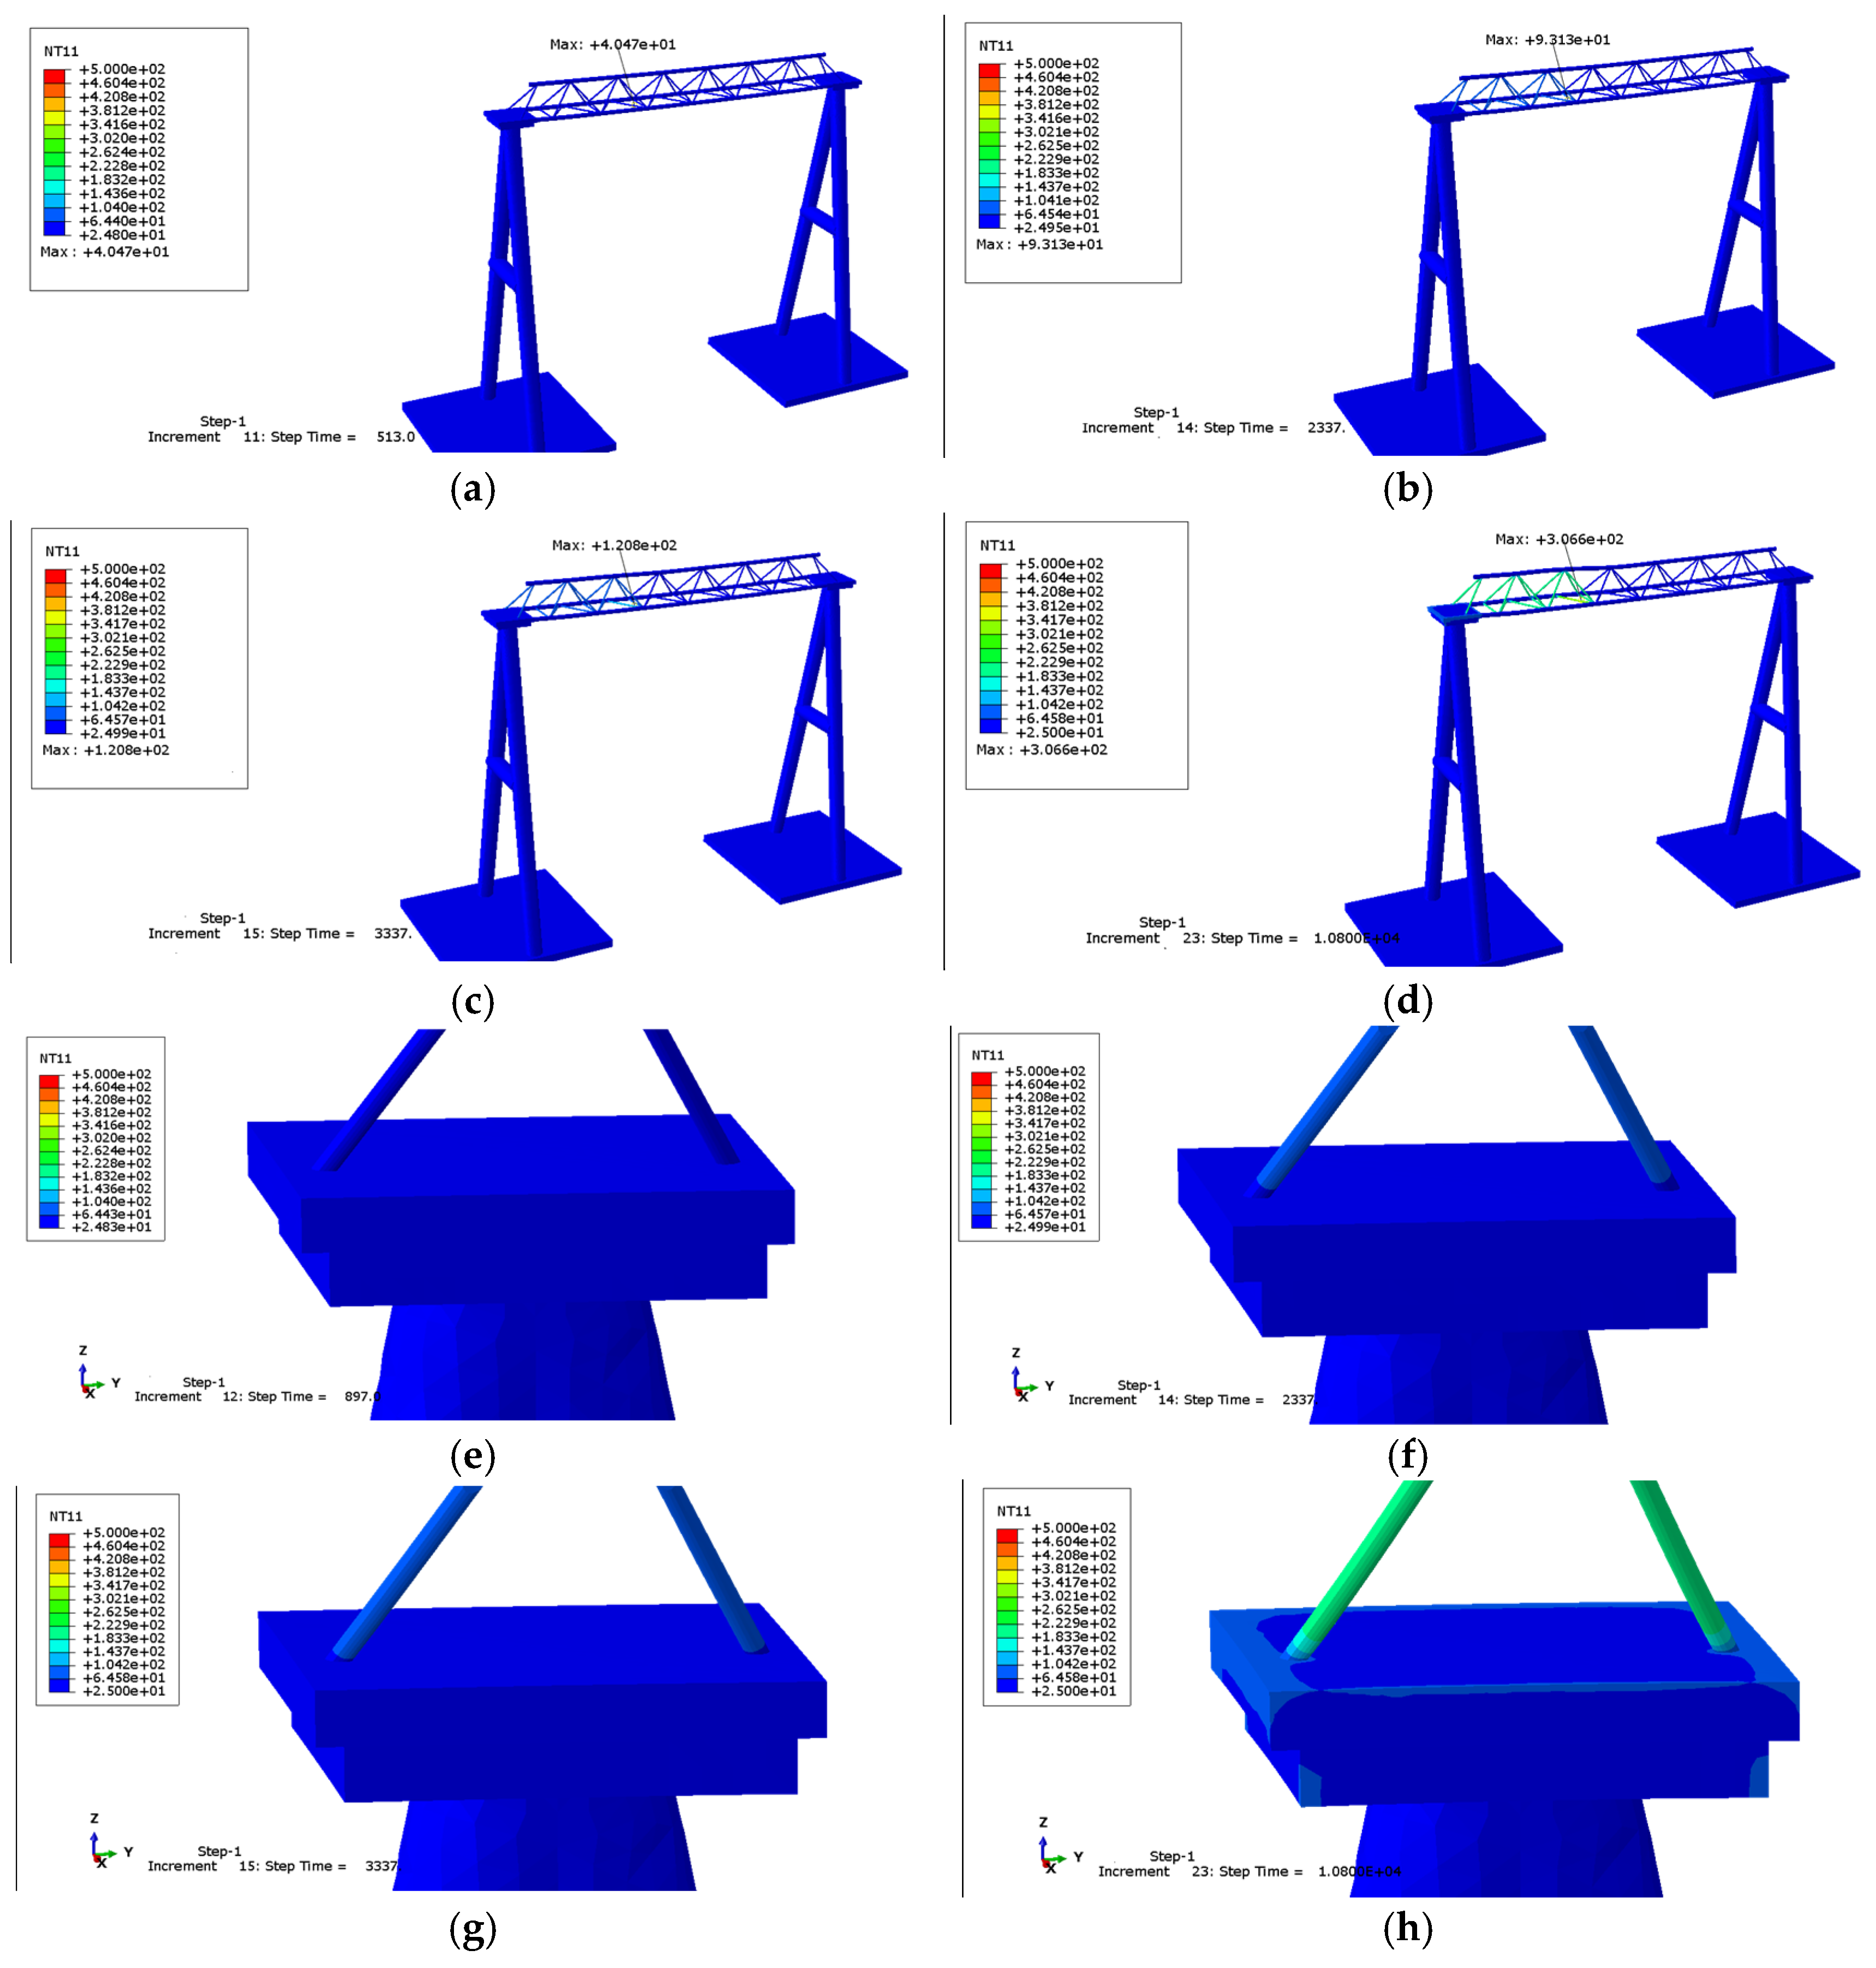
The heating conditions of S2 were employed for the steel truss structure coated with fire-resistant paint. Upon heating for 513 s, the temperature of the heated lower web at the right end reaches 40.4 °C due to a small amount of heat accumulation, while the temperature of the other heated web remains around 35 °C. After 2337 s of heating, the temperature of the right end of the heated web bar rises to 93 °C, while that of the other heated web bar steel pipes is around 75 °C. When heated to 3337 s, the temperature of the right end of the heated web bar reaches 120 °C, while that of the other heated web bar steel pipes is around 95 °C. The right end of the heated web bar experiences a temperature of 306 °C, while the temperature of the remaining heated web bar steel pipes is around 230 °C. Throughout the entire process, the temperature of the connecting plate remains below 120 °C, and no area experiences a temperature exceeding 500 °C. Figure 11 reveals the temperature change in the steel structure in S2.

3.3.3. Analysis of Temperature Change Curves

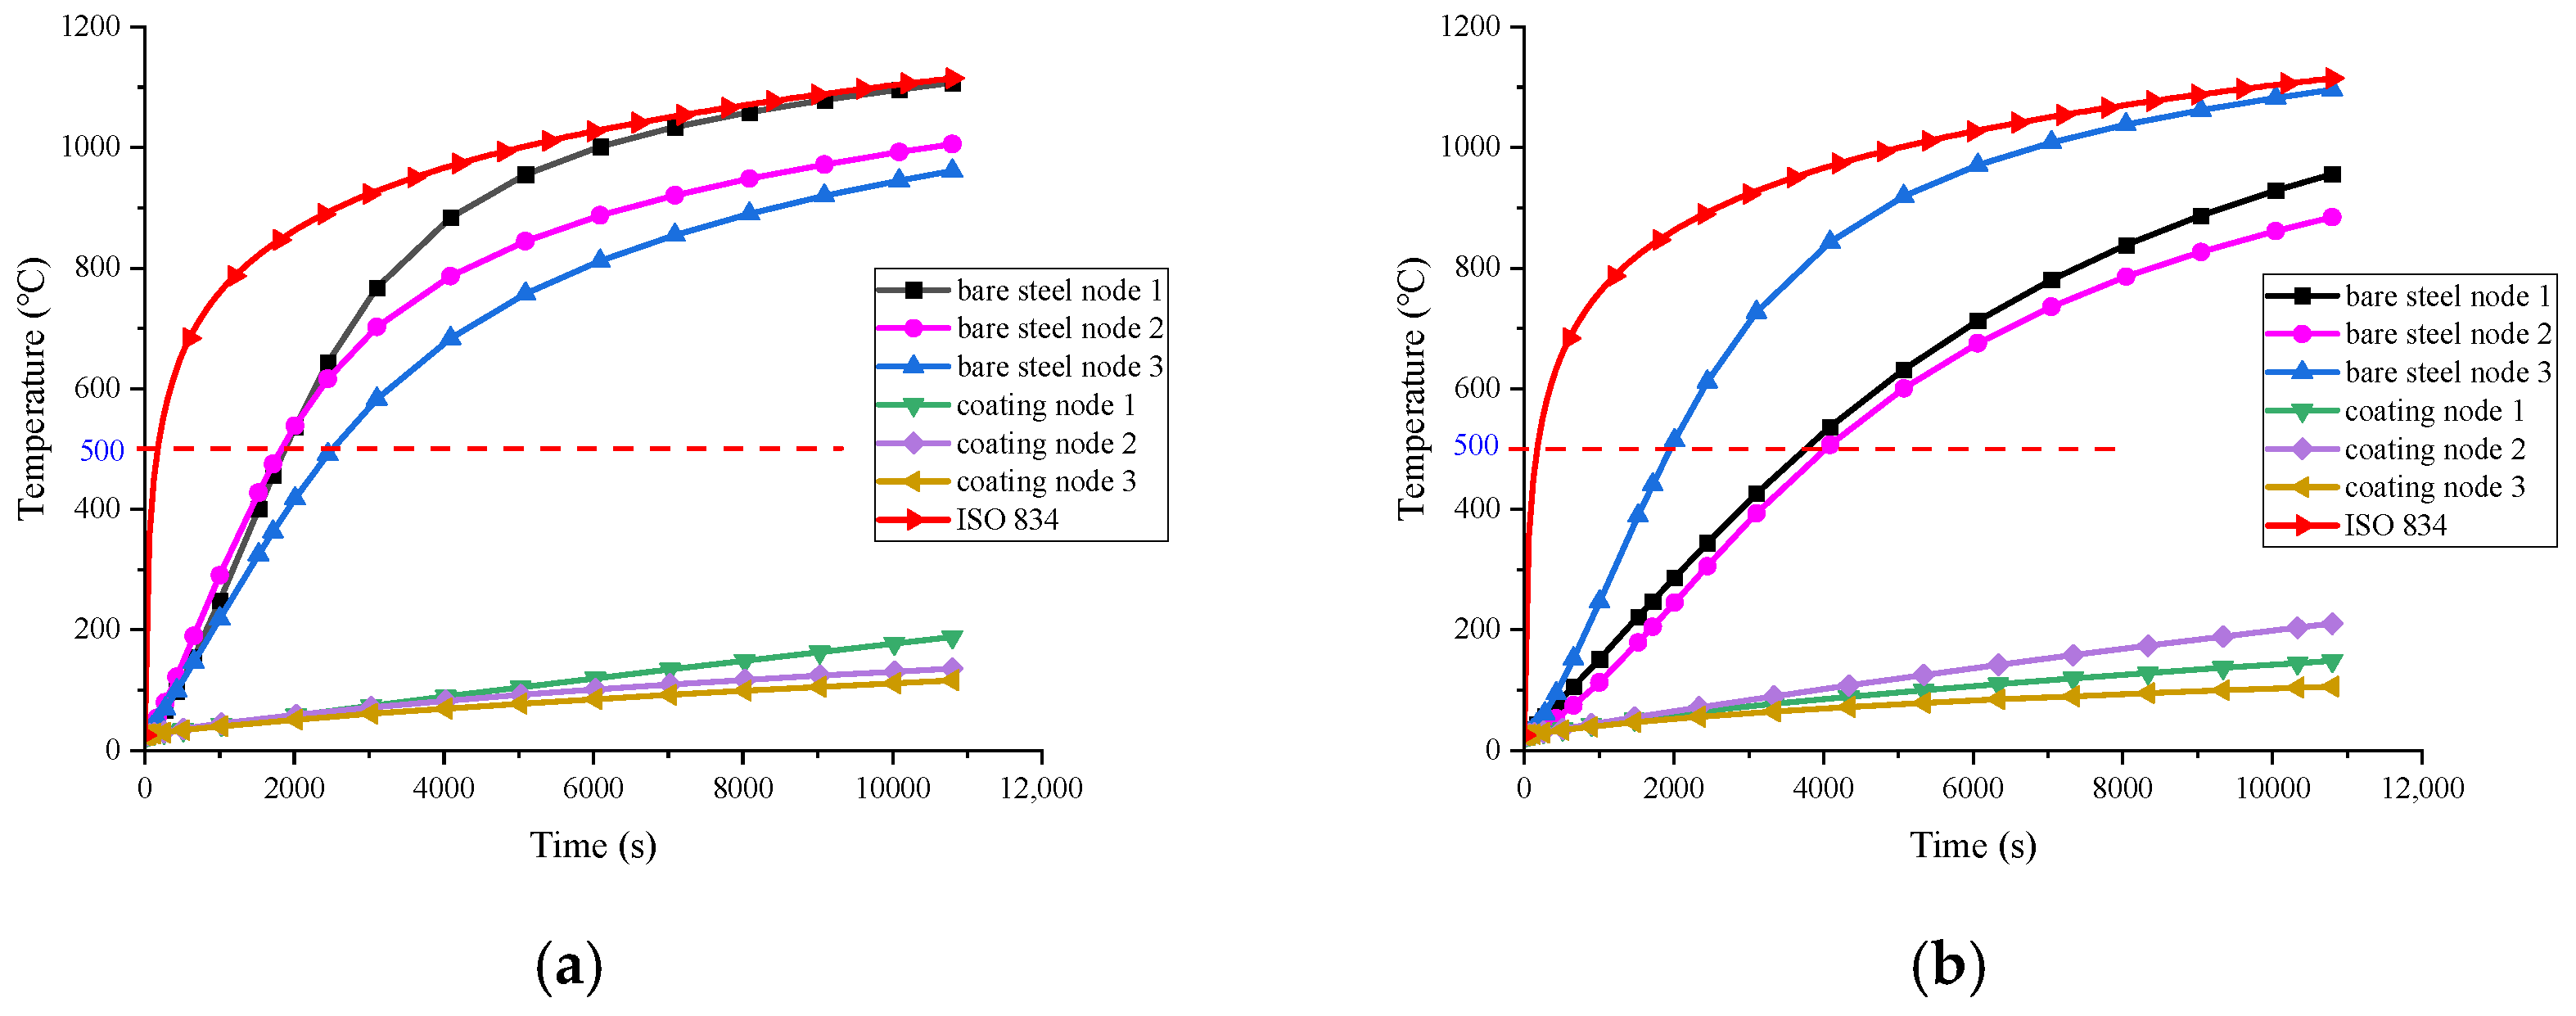
The trends and reasons for the temperature change in the overall structure were obtained through temperature cloud maps under the two fire scenarios. To further analyze the temperature evolution, representative location nodes were selected under the two fire scenarios. The selection of these nodes aimed to illustrate the heating effects on the steel truss structure during the heating phase. To evaluate the effectiveness of fire-retardant coatings, comparisons and analyses were conducted on the temperature changes at the same node positions with and without the application of fire-retardant coatings. By comparing the temperature curves under both conditions, whether the steel temperature exceeded the critical value of 500 °C was determined.
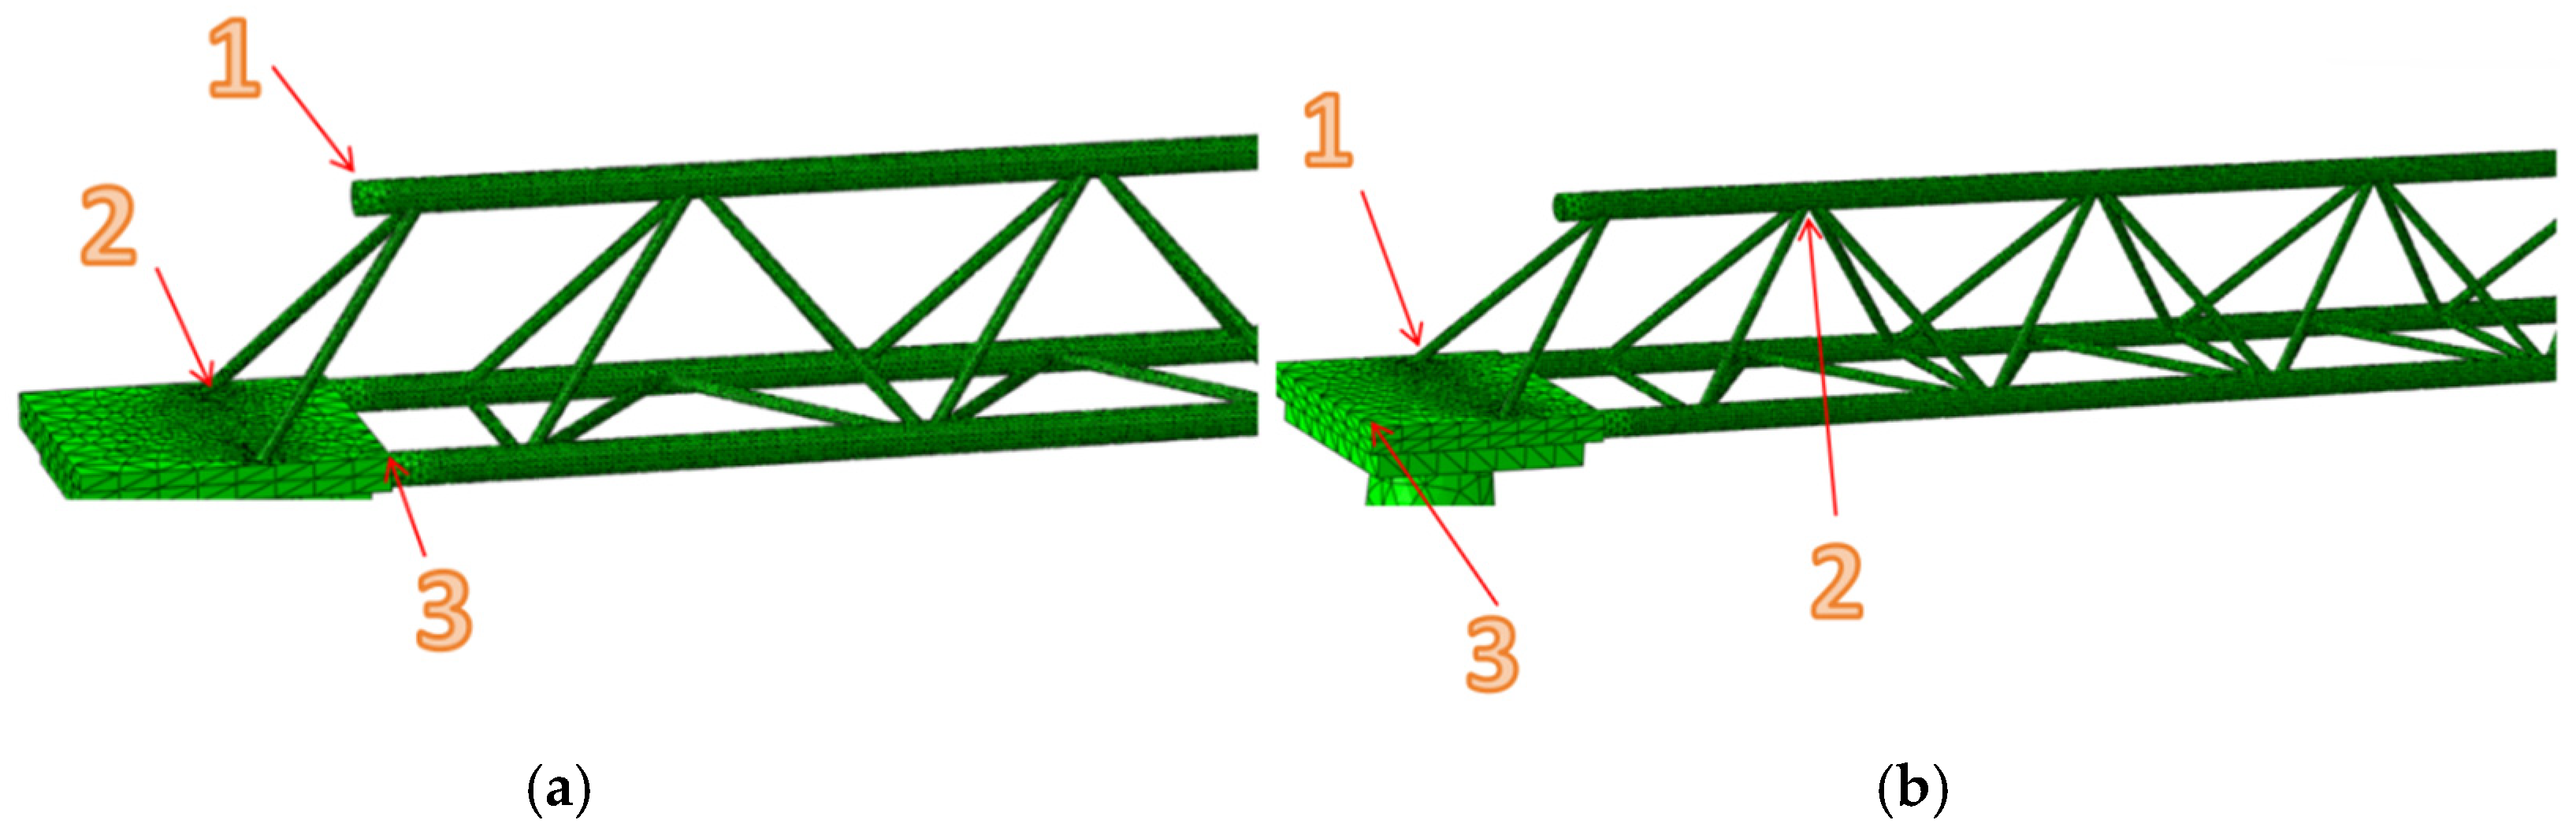
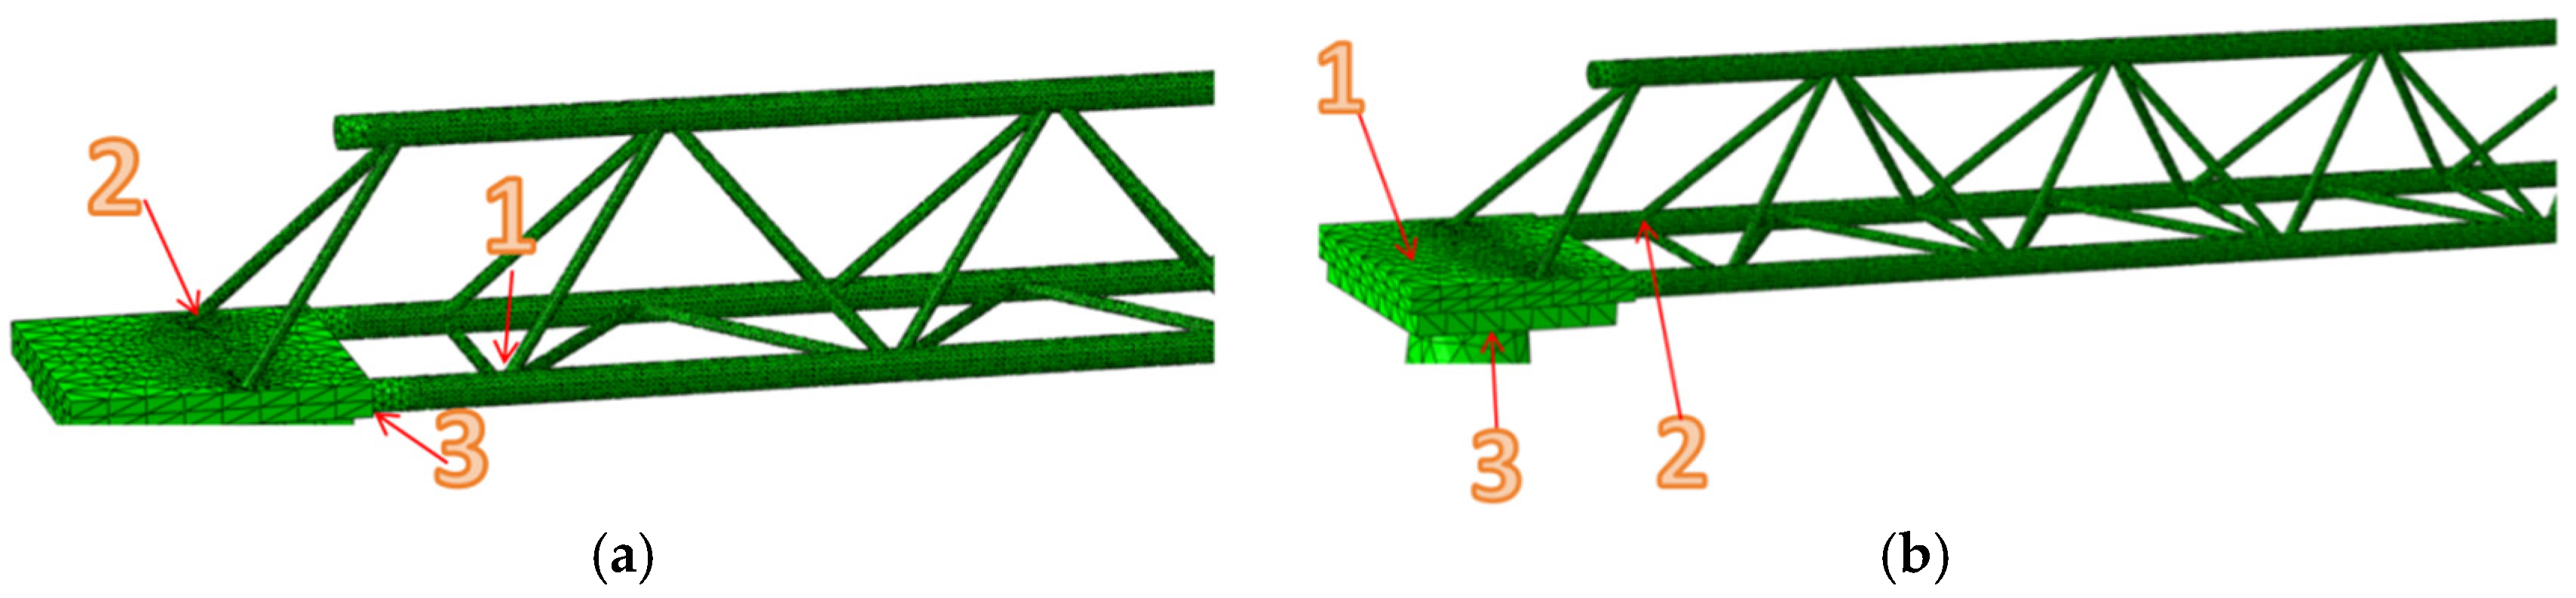
As shown in Figure 12, node positions were selected, and different typical nodes under different fire scenarios were compared. The specific nodes were selected under different fire scenarios: For S1, the heating part of the truss chord steel pipe was chosen as Node 1, the connection position between the web member and connecting plate was chosen as Node 2, and the connection position between the chord member and connecting plate was chosen as Node 3; for S2, the connection between the web member and the connecting plate was selected as Node 1, the connection between the web member and upper chord was selected as Node 2, and the edge of the connecting plate was selected as Node 3.
Figure 13 shows the temperature trend of each node under the heating conditions of the ISO 834 standard heating curve in the two different fire scenarios. It can be observed that despite the temperature changes at different time points in the fire scenarios, the overall pattern of the temperature changes remains consistent. During the early stages of heating, there is a steep increase in temperature, followed by a gradual reduction in the rate of temperature rise over time, ultimately leveling off. The temperature change trends of all nodes of the structure with a fire-retardant coating are also compared in the figure.
As shown in Figure 13a, Node 1 in S1 represents the surface temperature of the steel pipe of the upper chord. Since heat conduction occurs solely from the steel pipe’s surface inward, with negligible heat transfer to other locations, this point experiences the highest temperature, reaching the critical threshold of 500 °C at 1850 s. Node 2 indicates the connection area between the web member and the connecting plate, where the energy of the web member is transferred to the connecting plate and energy is accumulated. The temperature reaches the critical value of 500 °C in 1850 s. Node 3 signifies the connection area between the lower chord and the connecting plate, where the energy of the chord is transferred to the connecting plate. Since the contact area between this area and the connecting plate is larger than that in Node 2, the temperature reaches the critical value of 500 °C at 2500 s.
As shown in Figure 13b, Node 1 in S2 represents the connection area between the web member and the connecting plate. In this region, both the connecting plate and the web member are subjected to heat loads. Because of the thermal load on both the connecting plate and the web member in this area, the temperature rise is slower due to the larger size of the connecting plate. Thermal energy is transferred from the web member to the connecting plate, and the temperature reaches the critical value of 500 °C at 4000 s. Node 2 indicates the connection area between the heating web and the upper chord, where the thermal energy of the web is transferred to the chord. At 4050 s, the temperature reaches the critical value of 500 °C. Node 3 represents the surface of the edge area of the connecting plate, where heat transfer is minimal and is primarily influenced by the temperature rise curve specified by the ISO 834 standard. At 2000 s, the temperature reaches the critical value of 500 °C.
As displayed in Figure 13, it can be observed that applying fire-resistant coating on the connecting plates of the steel trusses and herringbone columns under the two fire scenarios can ensure that the exposed portions of the steel structure maintain a temperature below 230 °C for 10,800 s under the ISO 834 heating curve. Consequently, this prevents the steel structure’s temperature from surpassing the critical threshold of 500 °C based on thermal considerations. The curve variations also reveal that the critical temperature value of steel structures is affected by thermal conduction. The selected location nodes for the working conditions have a significant thermal conduction effect. A greater contact area for thermal conduction results in a slower temperature increase in the heated steel components, whereas the temperature rise in the steel components receiving transferred heat occurs more rapidly.
The authors completed combustion experiments on steel structures protected by fire-resistant coatings, and the experimental structure was similar to that for the simulation results: The rapid growth of the average temperature of the backside of the specimen without fire-resistant coating ranges from 87 to 718 s. Compared with the rapid growth of the temperature rise rate of the backside of the specimen with fire-resistant coating, the temperature rise rate of the backside of the specimen is small in the range of 253 to 804 s. The rapid growth on the backside of the average temperature of the specimen without fire-resistant coating starts at an earlier time than that of the specimen with fire-resistant coating, which reflects that the fire-resistant coating can effectively delay the time to reach the critical temperature of the back of the steel structure [25].

3.4. Stress Field Analysis

Based on the characteristics of the steel, the yield strength of the steel structure is 235 MPa, and the areas with stress exceeding 235 MPa are marked in red in the cloud diagram.

3.4.1. Stress Field Analysis of Substation Framework

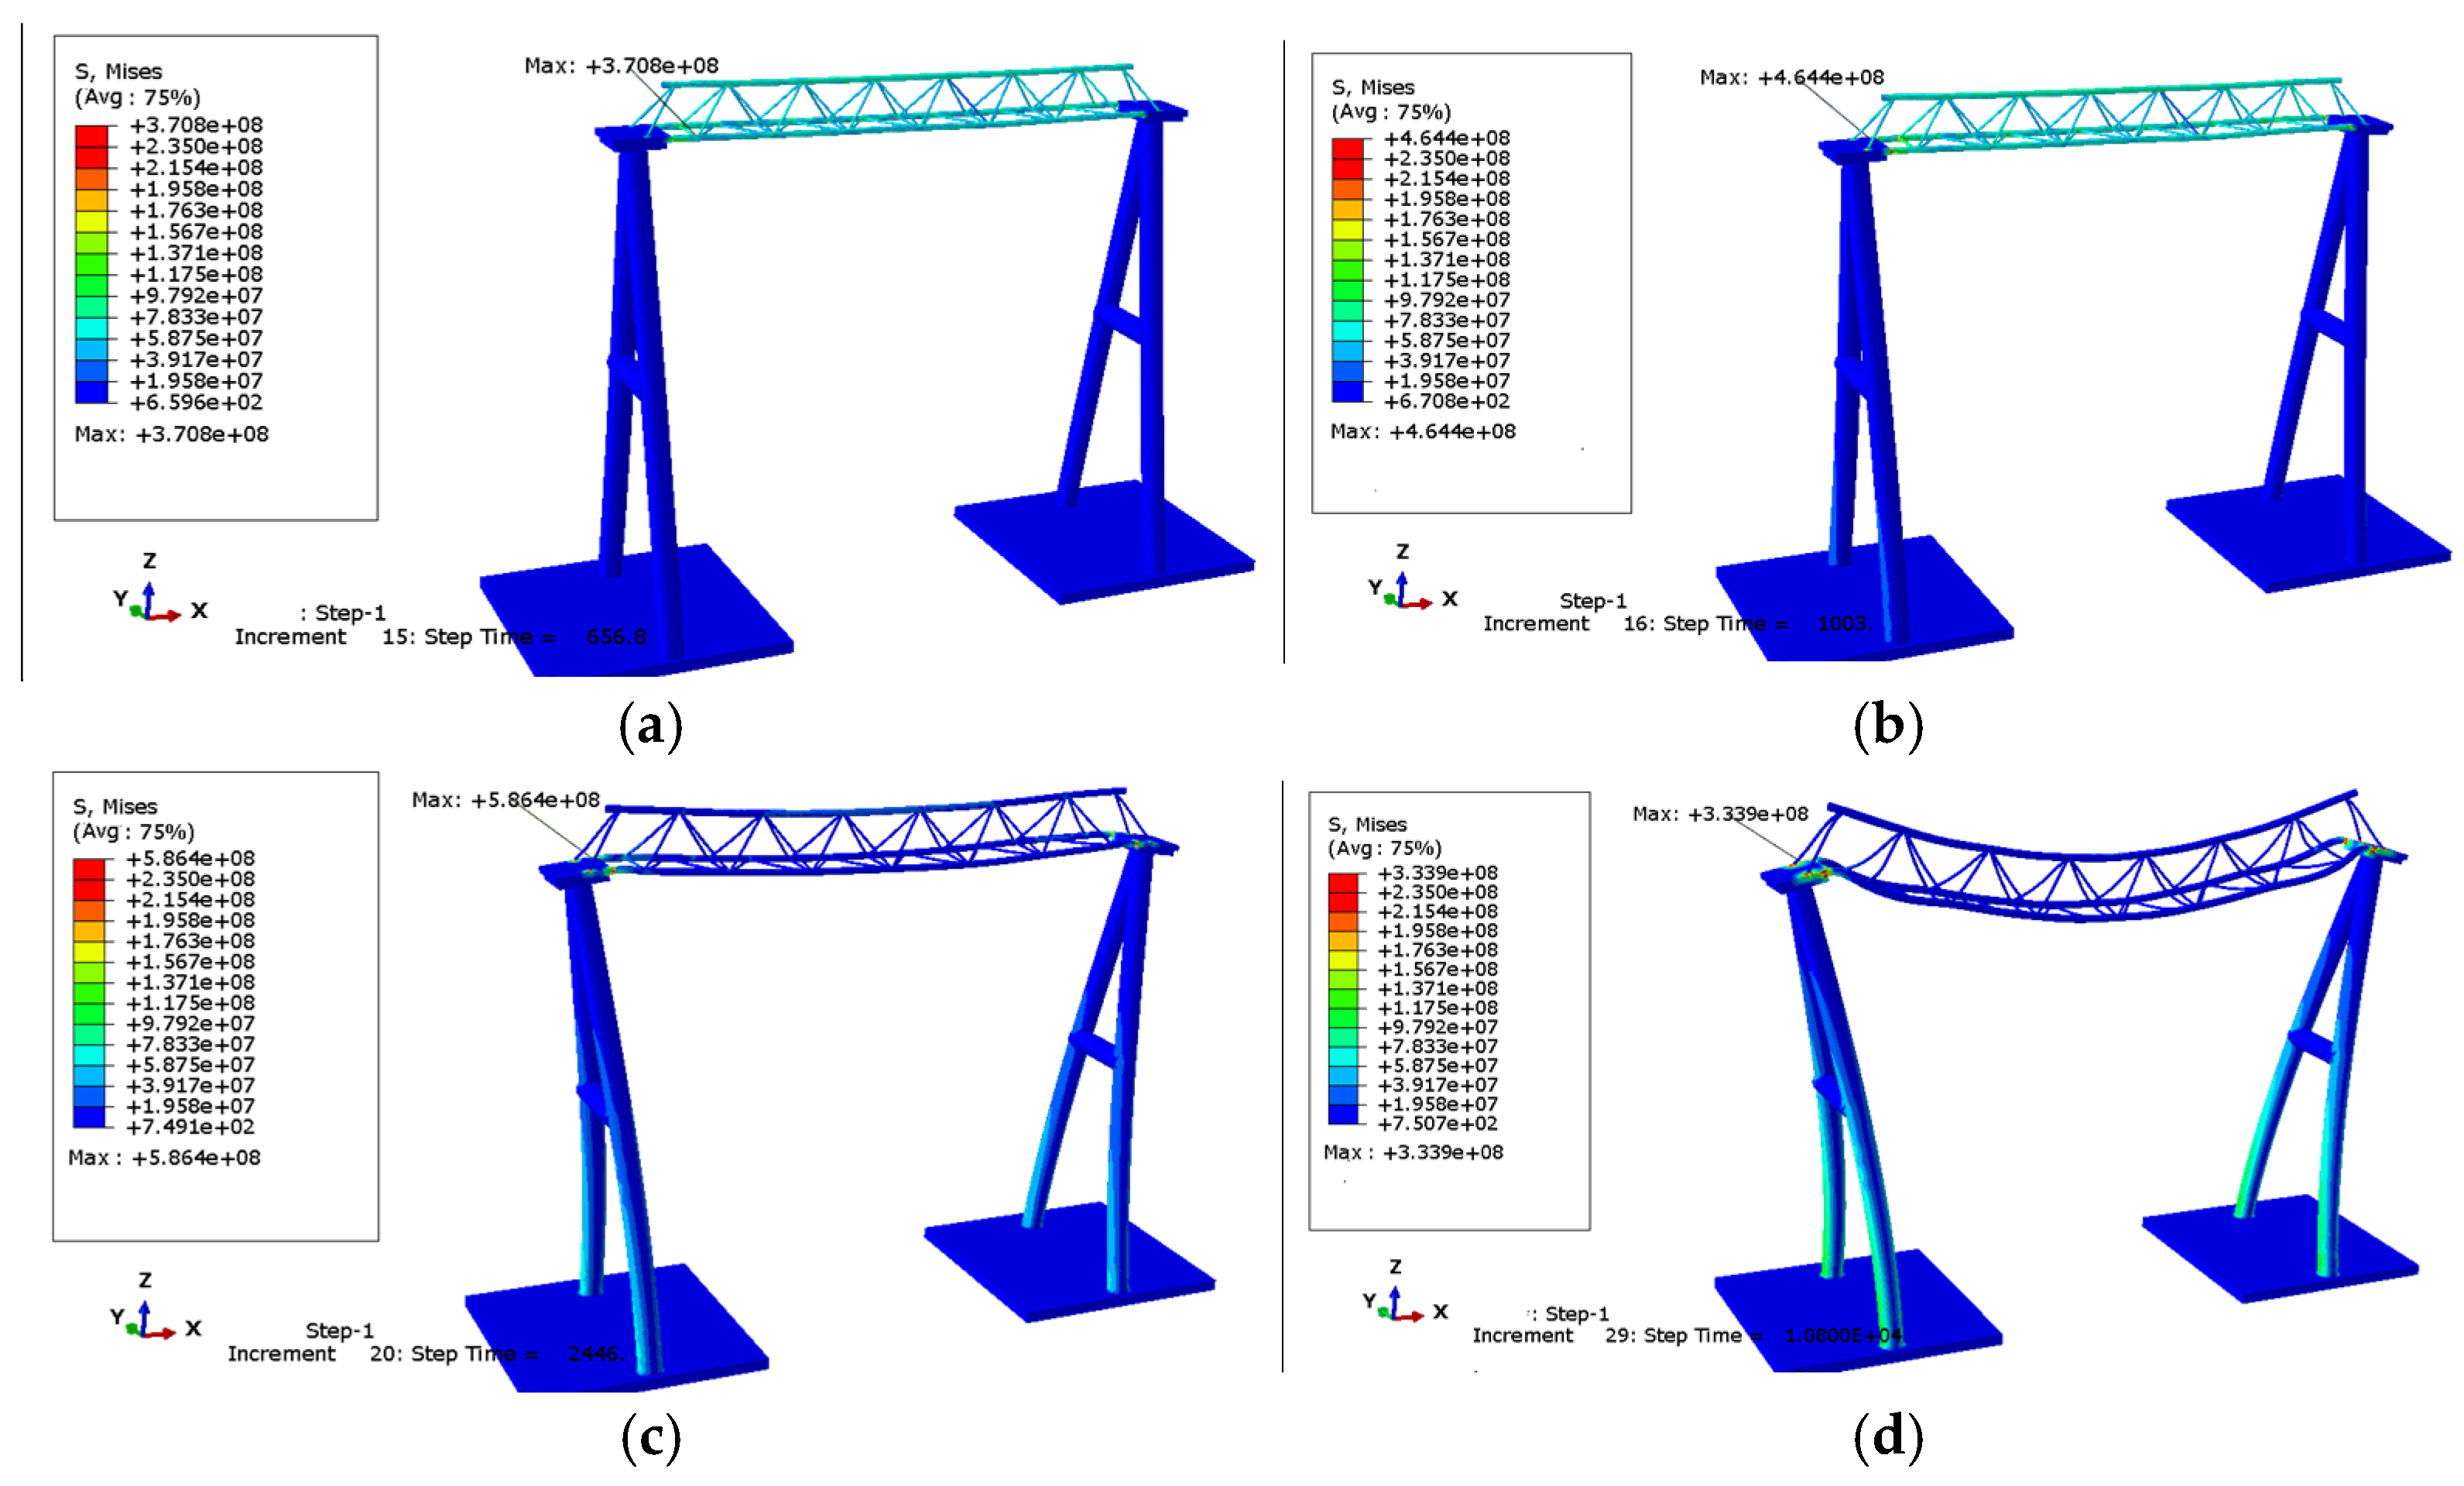
In Fire Scenario 1, the steel pipe experiences external heating and expansion during the primary stage. Upon reaching a heating duration of 656.8 s, the maximum stress is generated at the connection between the lower web and chord members at both ends of the truss, with a recorded stress of 370.8 MPa. The hazardous stress area where the stress exceeds 235 MPa is extremely small in the truss, and the stress generated by the temperature difference between the inner and outer diameters of the steel pipe is 100 MPa. Upon heating for 1003 s, the maximum stress is generated at the connection between the chord and the connecting plate, with a stress value of 464.4 MPa. Small hazardous zones also exist at the connection between both end web members and the connecting plate. The stress magnitude generated by the temperature difference between the inner and outer diameters of the steel pipe is 115 MPa. Upon heating for 2446 s, the heat transfer within the truss steel pipe is almost completed, and the external heating rate is lower than the internal heat transfer rate. Although there is a temperature difference between the interior and exterior, it remains relatively low. The main cause of thermal stress stems from the overall thermal expansion of the steel pipe caused by high temperature. During this scenario, the maximum stress occurs in the connection area between the chord and the connecting plate, with a maximum stress of 586.4 MPa. Upon heating for 10,800 s, the temperature difference between the inner and outer surfaces of the steel pipe becomes nearly zero. At this time, extensive regions exceeding 235 MPa in stress are observed at the position of the truss and connecting plate. The maximum stress occurs in the connection area between the chord and the connecting plate, with a value of 333.9 MPa. Additionally, a stress of 150 MPa is observed at the bottom of the herringbone column. Throughout the progression of the heating process, the stress at the connection point first rapidly increases and then decreases slowly, and the area of hazardous stress gradually increases. Figure 14 shows the stress change in the steel structure.
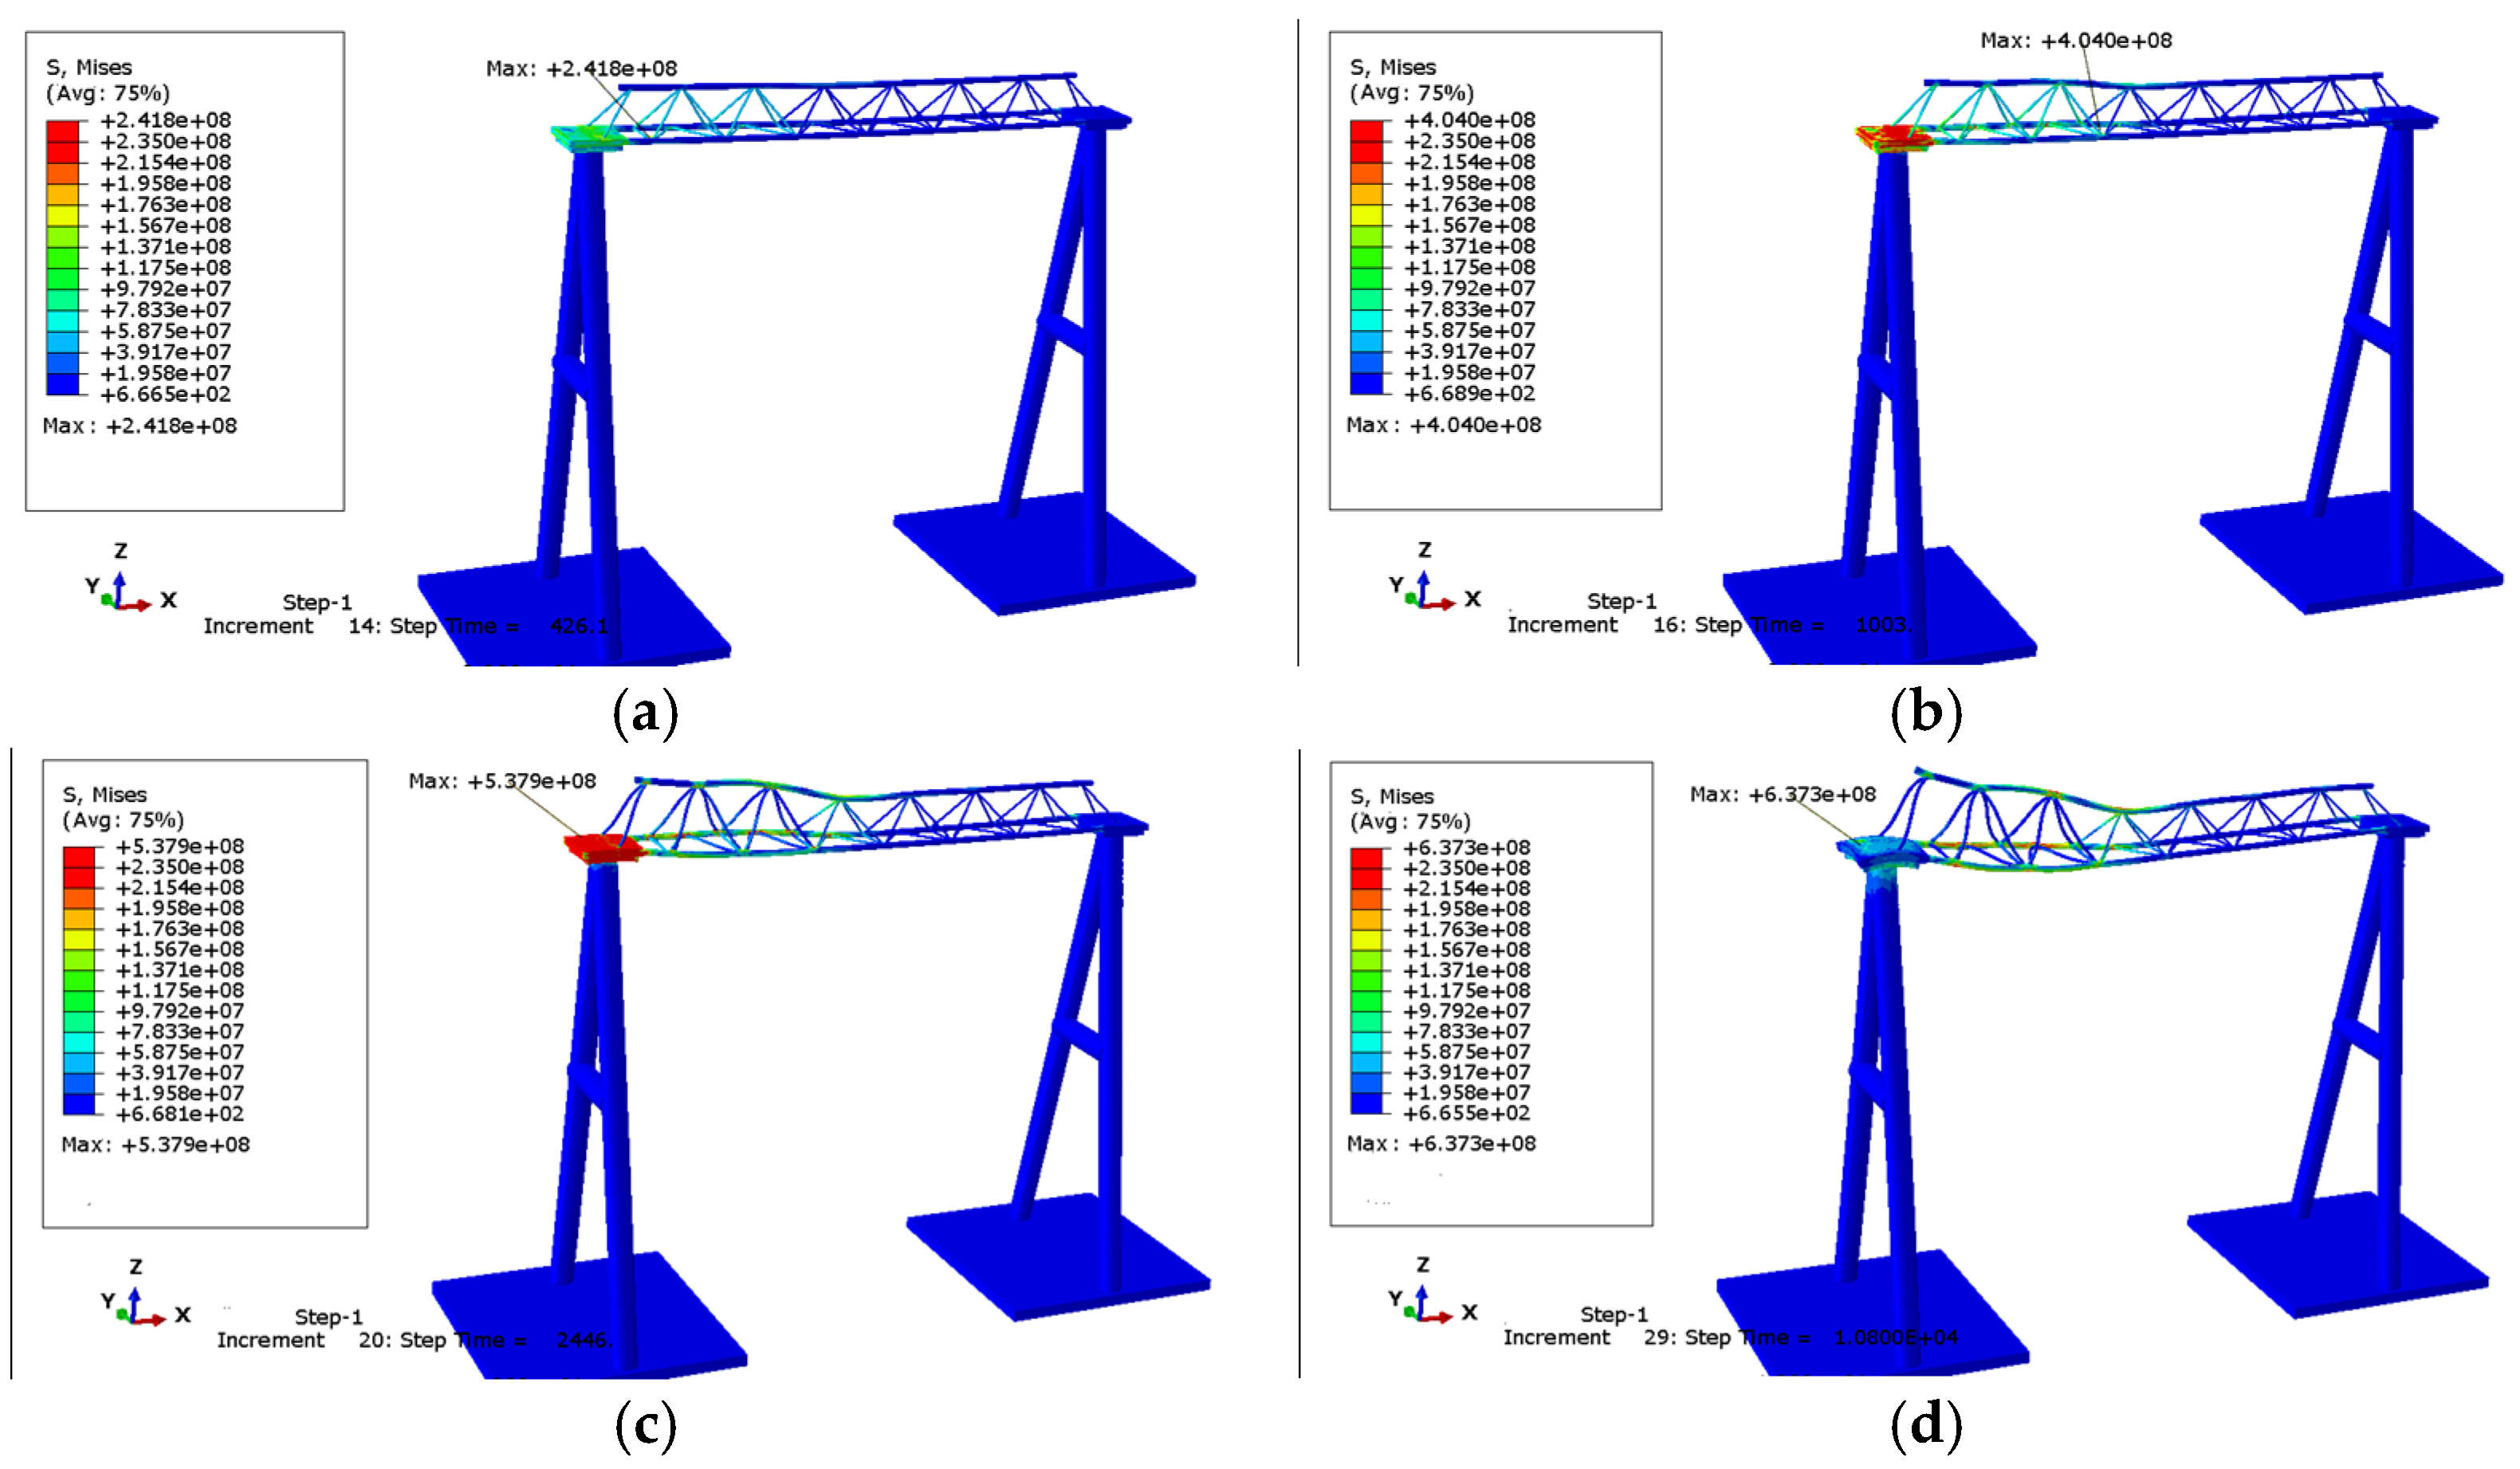
In Fire Scenario 2, when the truss steel structure is heated to 426.1 s, a small area with stress exceeding 235 MPa appears. The highest stress occurs at the connection between the left chord member and the web member, where the stress at the maximum stress point is 241.8 MPa. Upon heating for 1003 s, the extent of the hazardous stress area increases on the surface of the connecting plate, and the maximum stress at the connection between the right end web member and the chord member of the heated unit is 404 MPa. When heated to 2446 s, the temperature difference between the interior and exterior of the connecting plate is intensified, and the hazardous stress area further increases. The maximum stress point is shifted to the connection between the connecting plate and the herringbone column steel pipe, with a stress magnitude of 537.9 MPa. After heating for 10,800 s, with diminished external heat input, the thermal energy is fully conducted inside the connecting plate, and the stress induced by the surface temperature difference also decreases. However, the maximum stress remains at the connection between the connecting plate and the herringbone column steel pipe, further escalating to 637.3 MPa. During the entire heating process, the hazardous stress area at the connection between the web member and the chord member continues to expand. Figure 15 illustrates the stress change in the steel structure.

3.4.2. Stress Field Analysis Substation Framework with Fire-Resistant Coating

The heating condition of S1 was applied to the steel truss structure coated with a fire-retardant coating. At the beginning of the initial condition, the stress of the maximum stress point is 81.59 MPa on the connection between the web member and chord member at one end of the truss. Upon heating for 513 s, the location of the maximum stress point remains unchanged. However, due to certain thermal effects, the maximum stress increases to 94.96 MPa. After heating for 8025 s, the maximum stress point shifts to the connection between the chord and the connecting plate, and a small area of stress reaches 234 MPa, approaching the critical stress. At 10,800 s of heating, a small area within the truss steel pipe at the connection between the chord and the connecting plate experiences stress exceeding the critical stress of 235 MPa, with the highest stress point being 270.2 MPa. Figure 16 presents the stress variation in the steel structure.
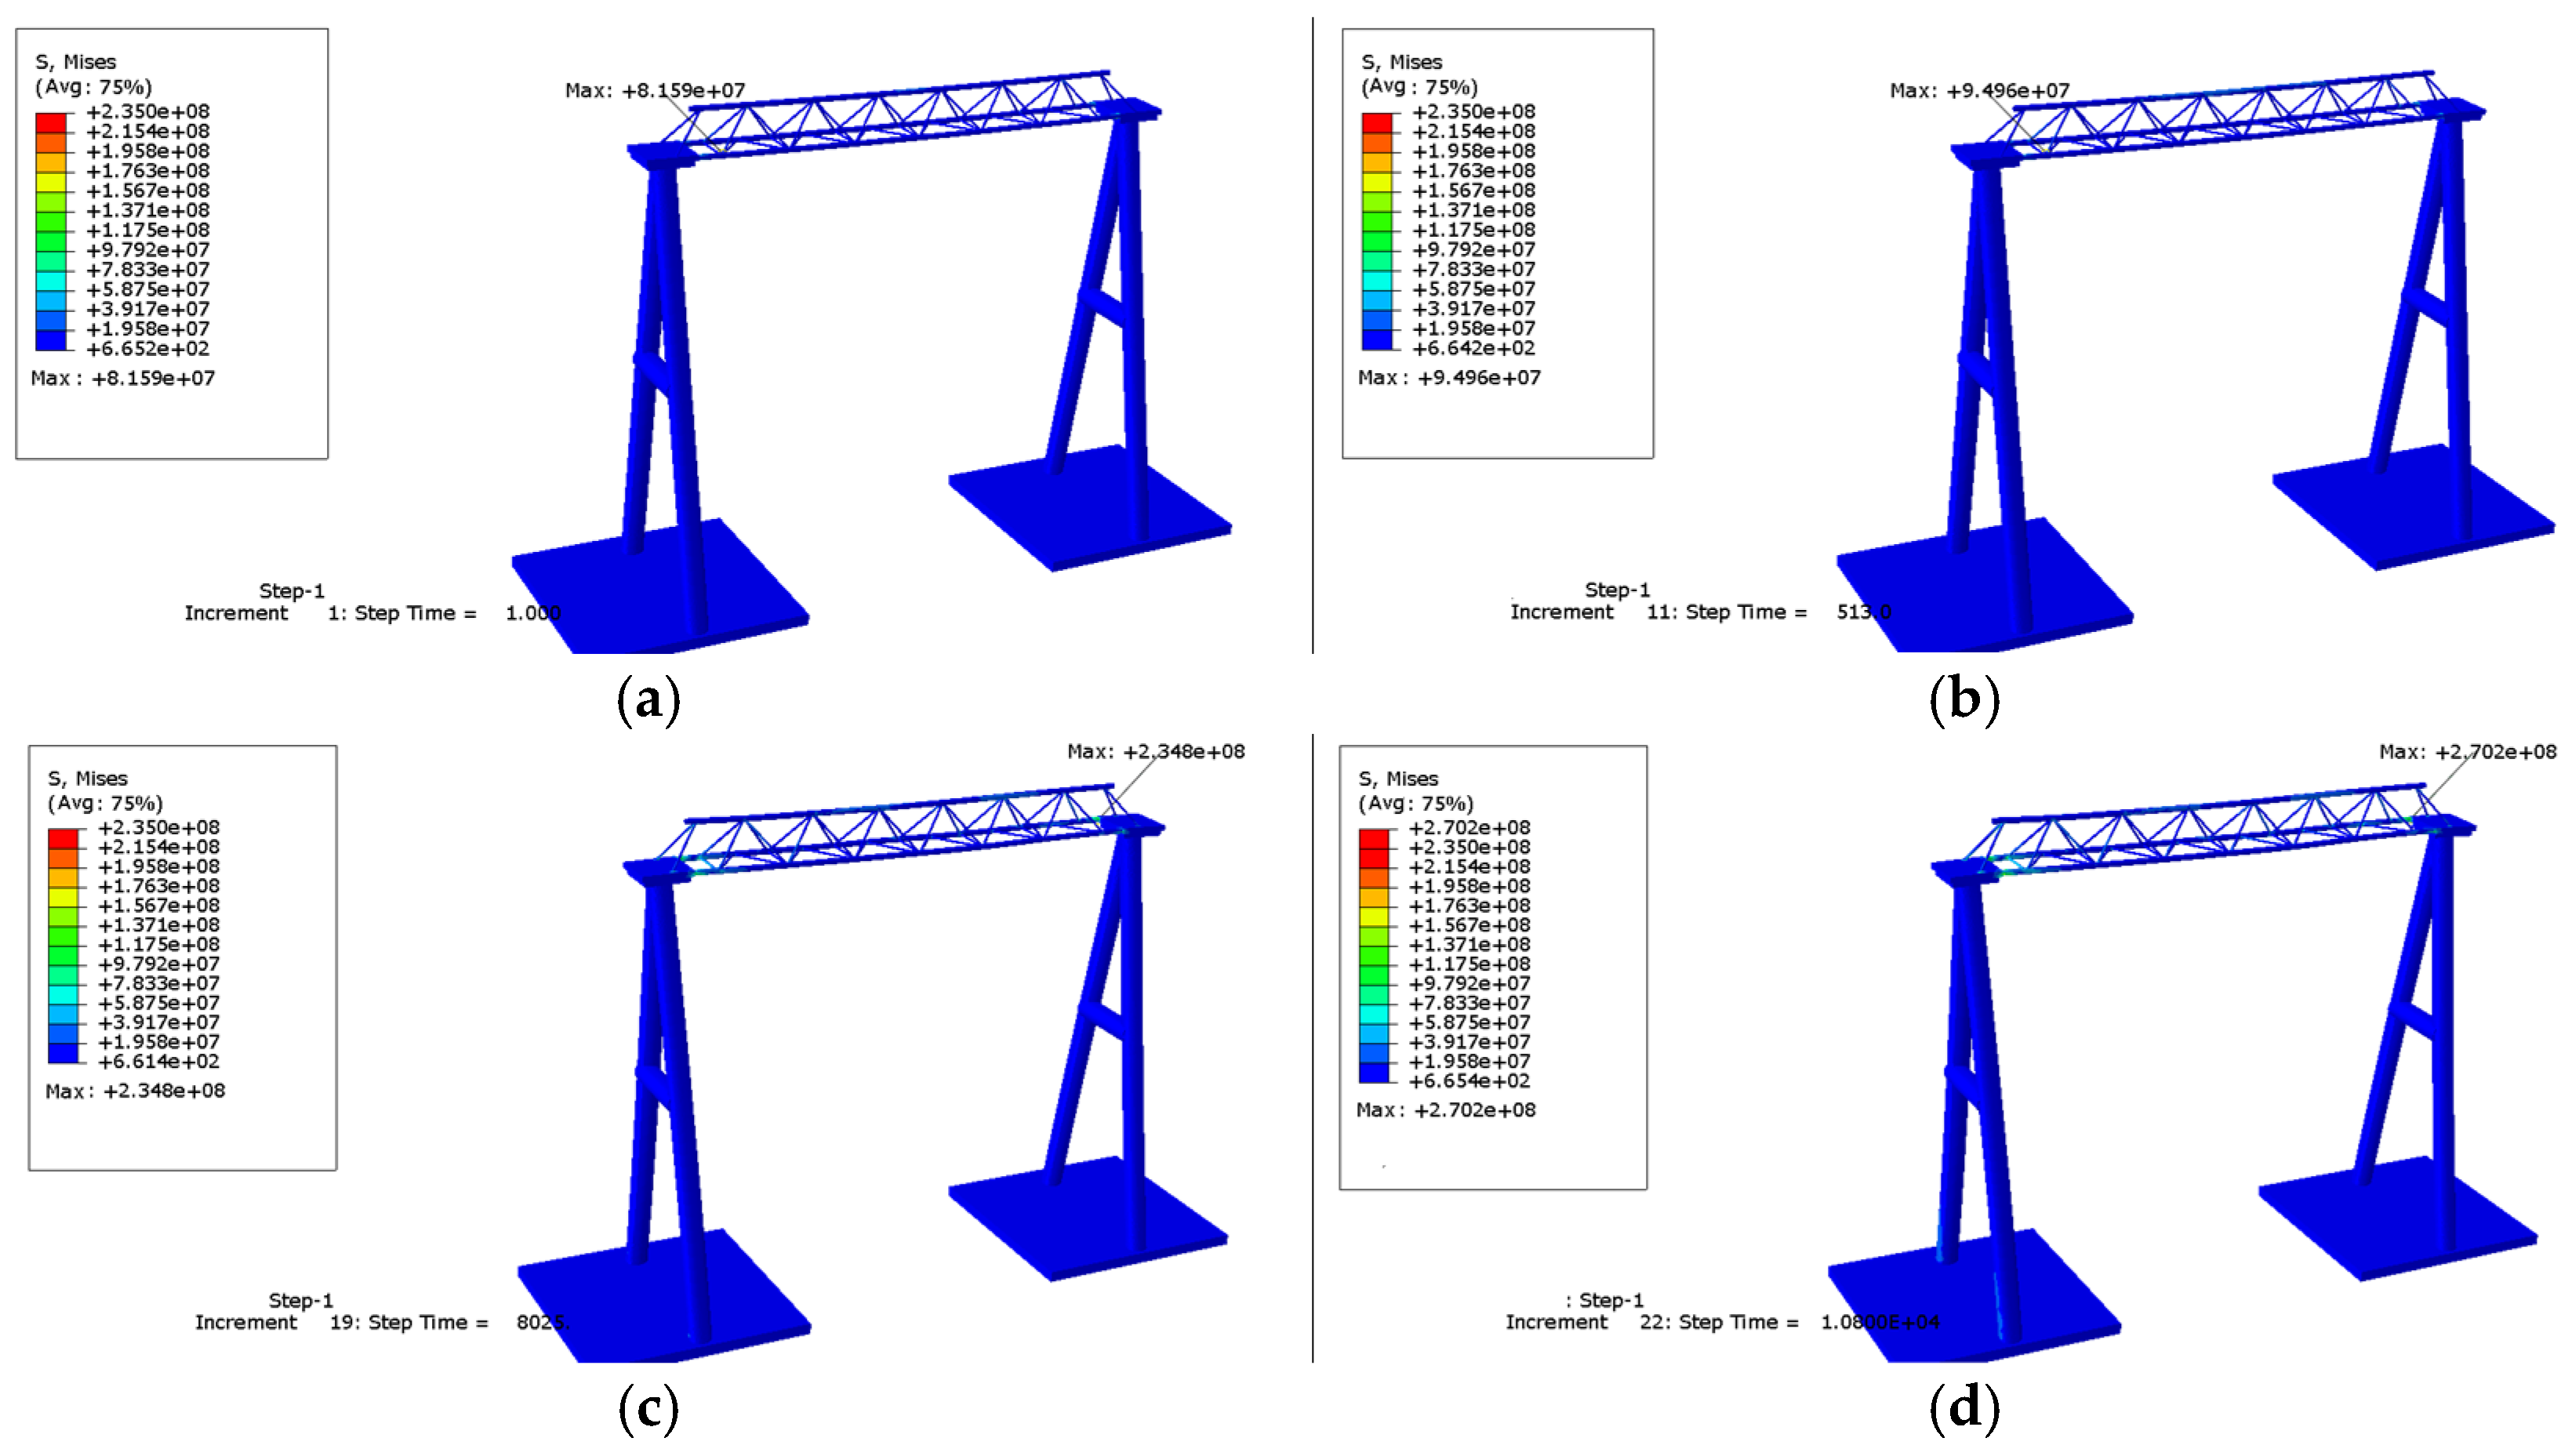
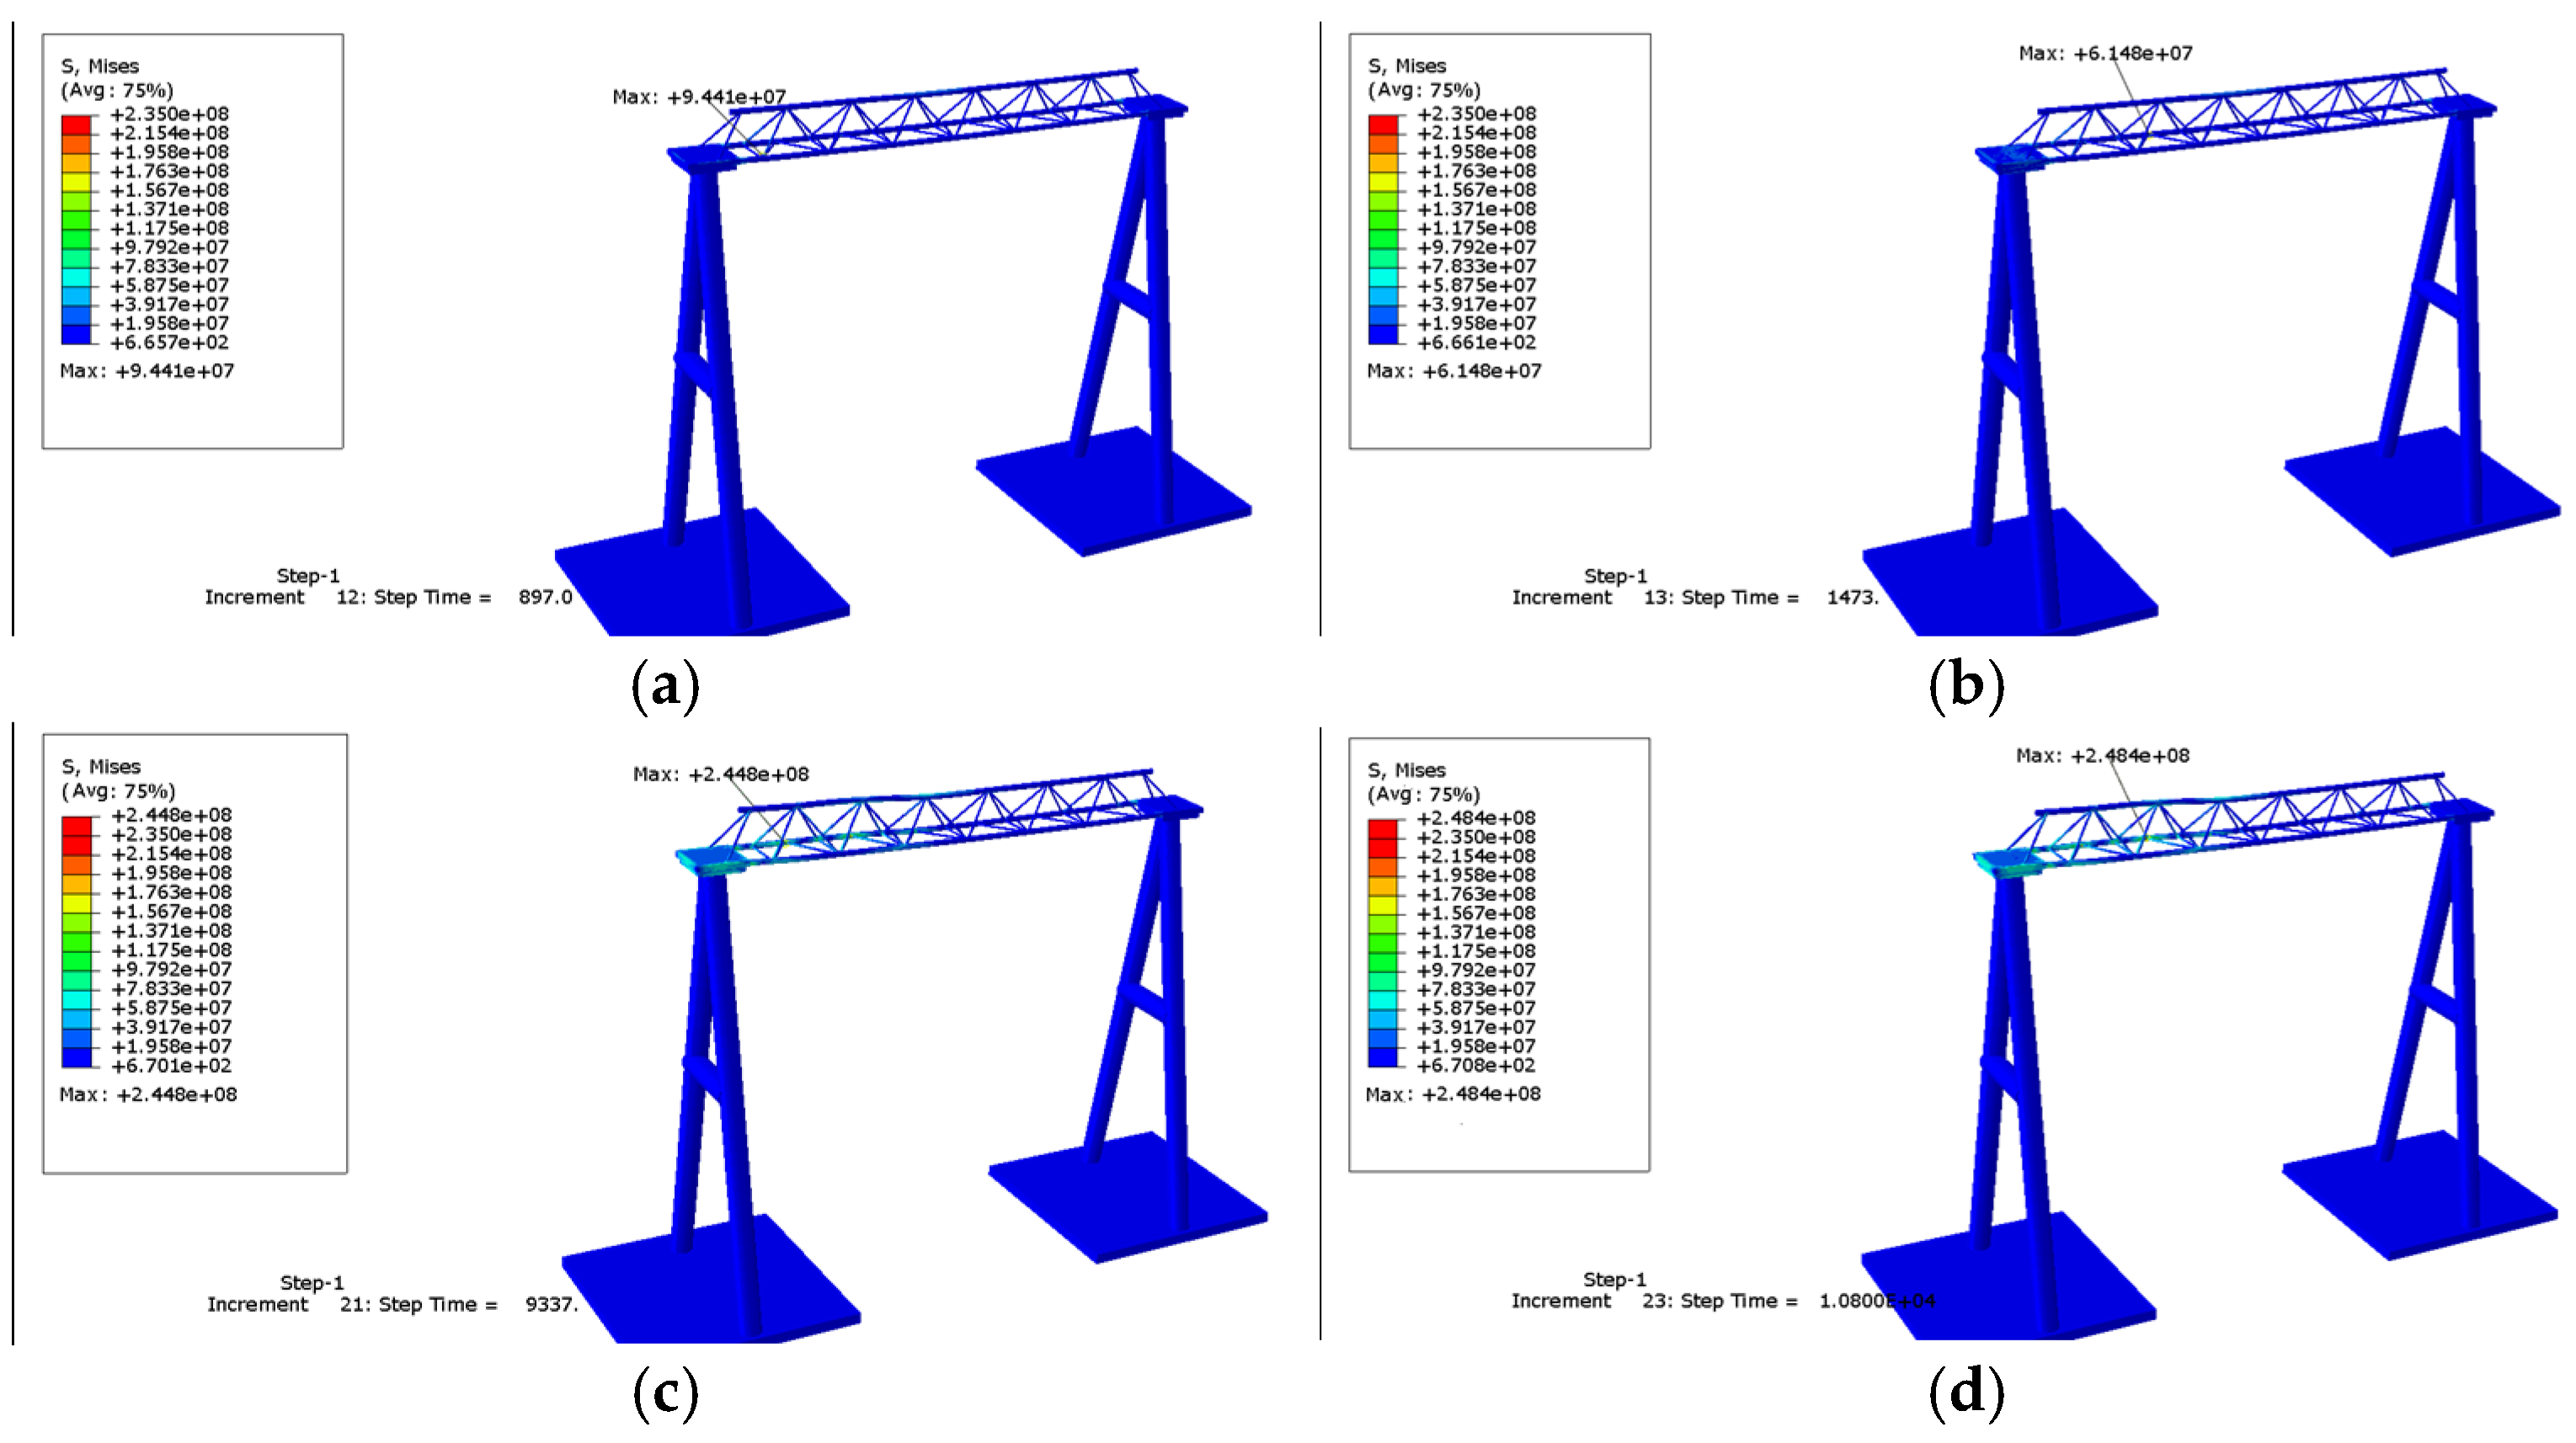
The heating conditions of S2 were applied to the steel truss structure coated with a fire-retardant coating. At 897 s of heating, the highest stress occurs at the connection between the left chord and web member, with a maximum stress of 94.41 MPa. By 1473 s of heating, a small amount of heat accumulates on the surface of the middle part of the steel pipe. Owing to the temperature difference between the interior and exterior of the steel pipe, a stress area of 61.48 MPa is generated at the connection between the chord and web members. Upon heating for 9337 s, due to the dual effects of heat conduction from the connecting plate and heat through the fire-retardant coating, a small hazardous stress area is generated at the connection between the chord and web members, with a maximum stress point stress of 244.8 MPa. After heating for 10,800 s, heat conduction results in a minimal temperature difference between the interior and exterior of the steel pipe, which dilutes the thermal expansion effect caused by external temperature changes. A small hazardous stress area appears at the connection between the chord and web members, with a maximum stress point stress of 248.4 MPa. Figure 17 shows the stress variation in the steel structure.

3.4.3. Analysis of Stress Variation Curves

The overall trend of stress variation in the structure and its reasons were obtained through stress cloud maps under the two fire scenarios. To accurately capture the stress changes in steel structures, point analysis on the stress concentration area should be conducted before drawing the stress change curve. The selected area for nodes is the stress concentration area where the stress exceeds 235 MPa. In truss structures, stress concentration typically occurs in the steel pipe connection area. Furthermore, due to the temperature difference between the surface and interior of the steel, there may be a brief increase in stress on the surface.
Different typical nodes were selected for comparative analysis under the different fire scenarios. The exact locations of these nodes are illustrated in Figure 18. In S1, the connection between the two end web members and the chord member was determined as Node 1, the connection between the web member and the connecting plate was determined as Node 2, and the connection between the chord member and the connecting plate was determined as Node 3. In S2, the surface of the connecting plate steel was selected as Node 1, the connection between the left lower chord and web member was selected as Node 2, and the connection between the connecting plate and the herringbone column steel pipe was selected as Node 3.
To further analyze the stress changes in the structure after applying fire-retardant coating, nodes at the same position were selected to compare and analyze the influence of fire-retardant coating on the stress fields of steel structures.
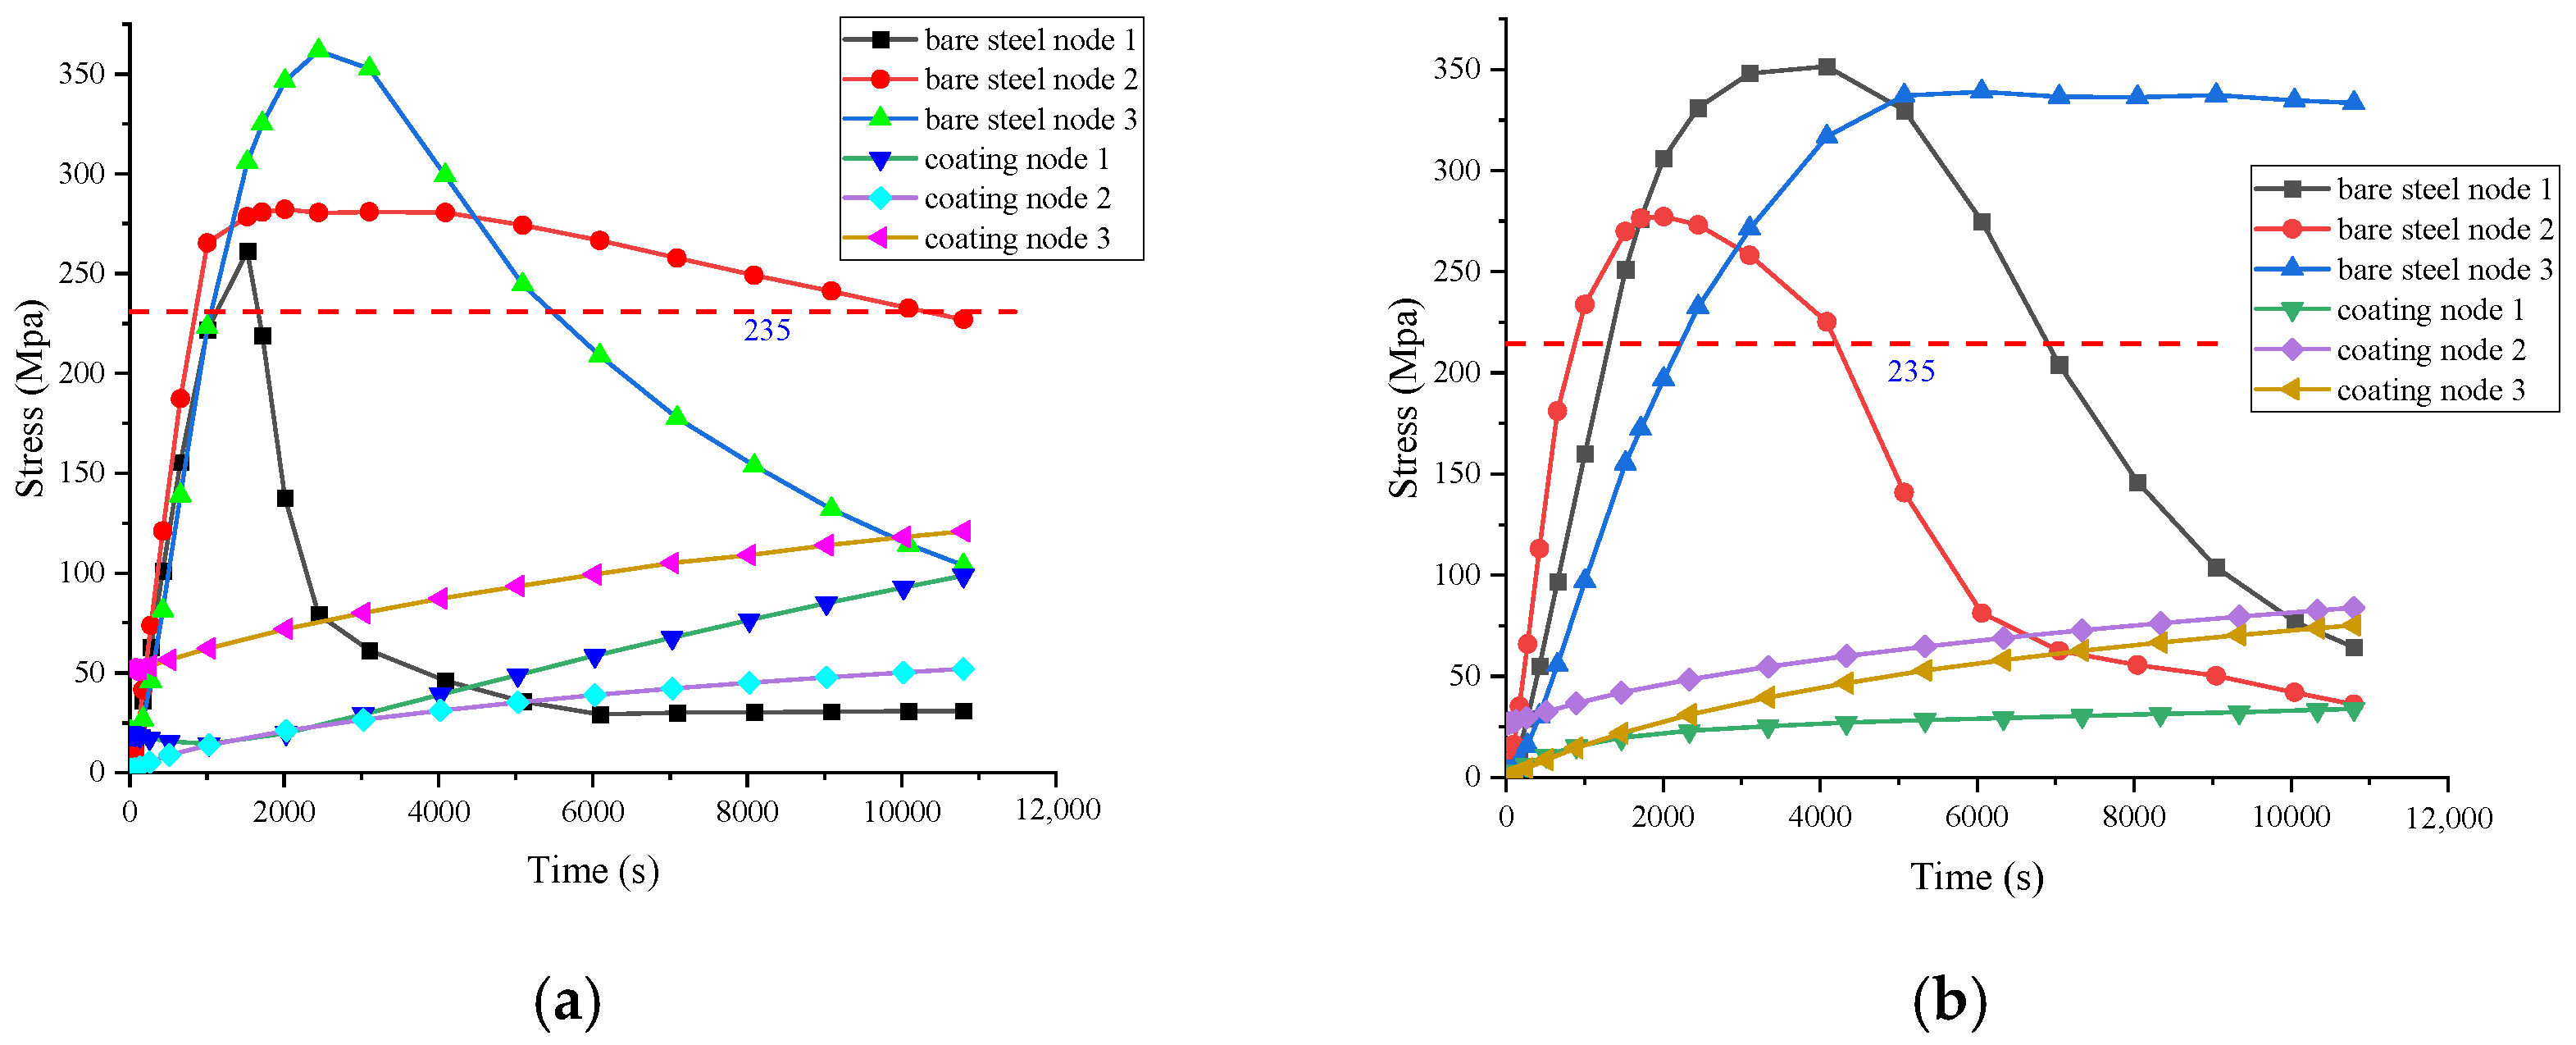
Figure 19 shows the stress variation curves of different nodes on bare steel with and without fire-retardant coating under the two fire scenarios. It is evident that the stress variation trend of nodes at different positions first rises sharply to the peak value and then gradually decreases with time due to changes in the deformation displacement. With the application of fire-resistant coating to the structure under the two fire scenarios, the stress slowly increases and remains below 235 MPa after 3 h.
As shown in Figure 14, there is a hazardous stress area in the connection part of the steel truss structure in S1. As shown in Figure 19a, the stress variation curve indicates that a stress exceeding 235 MPa occurs at the connection between the chord and web members (Node 1) between 1000 and 1500 s. Although this hazardous stress persists for a relatively brief period, it generates a comparatively small hazardous area. Moreover, the hazardous stress area of the steel truss structure is relatively large at nodes 2 and 3, but the maximum stress at Node 3 is higher than that at Node 2. This is because the chord has a larger contact area with the connecting plate, and its expansion direction is horizontal. In contrast, the web has a smaller contact area with the connecting plate, and its expansion direction is oblique. At the same time, it can be observed that Node 2 has a relatively longer duration of hazardous stress area compared to Node 3, which is related to the displacement trend of the truss structure during thermal expansion. Node 2 exceeds the critical stress of 235 MPa between 900 and 10,000 s, and Node 3 exceeds 235 MPa between 1050 and 5200 s. Steel pipes are susceptible to brittle fractures during this stage. After applying fire-resistant coating on the surface of the truss structure, the temperature difference between the interior and exterior of the steel pipe becomes negligible, preventing any transient stress fluctuations. The stress at all three positions slowly increases. Due to the mechanical structural characteristics of the truss itself, the stress magnitudes are ranked as follows: Node 3 > Node 1 > Node 2.
As shown in Figure 15, the hazardous stress areas appear at the connection points between the connecting plate and chord and web members, and at the connection points between the connecting plate and the herringbone column in S2. As shown in Figure 19b, the stress at Node 1 exceeds 235 MPa between 1450 and 6500 s and reaches a maximum of 351 MPa at 409 s. At this time, the heat difference between the interior and exterior of the connecting plate is the largest. Node 2 experiences stress exceeding 235 MPa between 1020 and 1500 s, and it reaches a maximum stress of 277 MPa in 2010 s. Node 3 experiences a stress exceeding 235 MPa between 2500 and 10,800 s, reaching a maximum of 339 MPa at 6060 s. The curve of Node 3 remains in an upward state until reaching the maximum stress point. This is because the truss undergoes thermal expansion, which exerts an outward expanding force on both ends of the herringbone column. After reaching the maximum stress point, the stress stabilizes due to the increase in the expansion degree. After applying fire-retardant coating, the stresses at all three positions increase slowly, with the order of stress magnitudes as follows: Node 2 > Node 3 > Node 1.

3.5. Displacement Analysis

The displacement of the steel truss structure during the heating process arises from the continuous accumulation and superposition effects of deformation caused by the steel’s thermal expansion. As the heating time progresses, the displacement of the steel truss structure also rises progressively. Consequently, this study employed the cloud map captured at the final time point of 10,800 s as the primary dataset for final analysis.

3.5.1. Displacement Analysis of Substation Framework

Due to temperature loading, significant stress and strain are generated at the connection point between the truss and the connecting plate at 10,800 s in S1. In addition, the combination of the truss’s self-weight and its thermal expansion leads to the certain displacement and collapse of the entire truss structure.
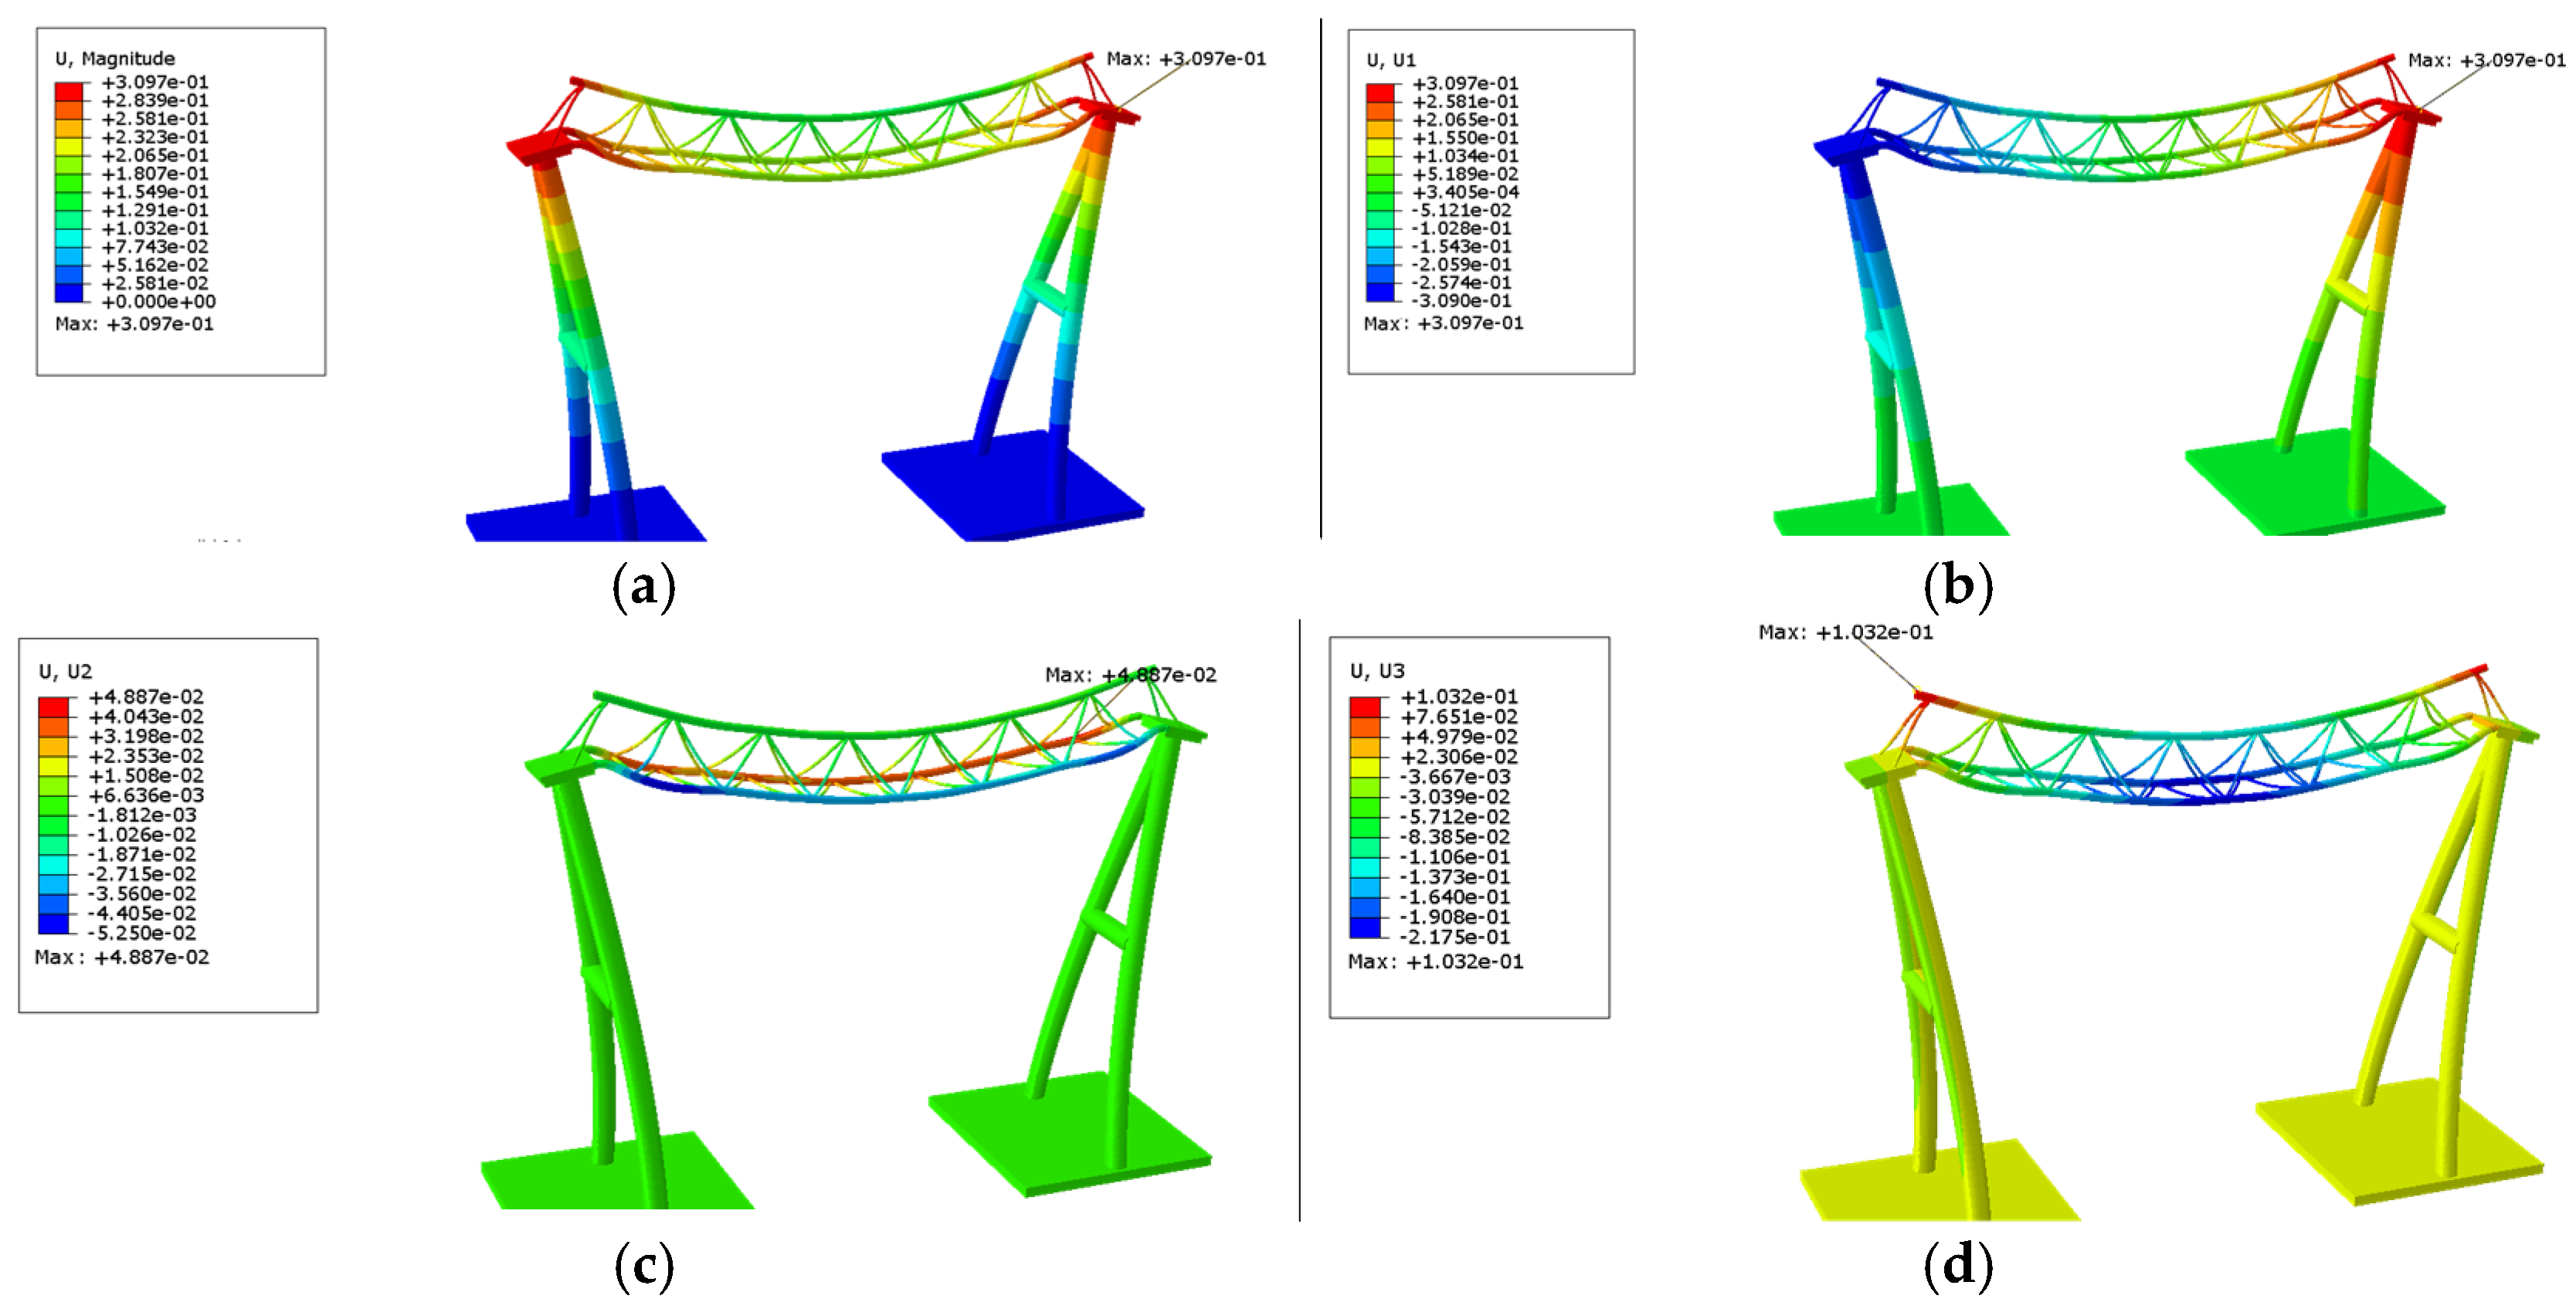
As presented in Figure 20, under the full truss combustion in S1, the maximum displacement occurs at the junction between the truss and the connecting plate, and the maximum value reaches 0.3097 m, which exceeds the critical displacement of 0.12 m. In the X-axis direction, the displacement of the chord extending towards both ends is 0.3097 m, which is less than the critical displacement of 0.94 m in the specification. In the Y-axis direction, the maximum extension displacement occurs at the chord center position between the web members at both ends of the truss and the chord connection point between the two web members. The maximum displacements in the Y-axis direction are 0.04887 m and −0.0525 m, with a difference of 0.10,137 m, exceeding the critical displacement of 0.094 m. A three-dimensional curve of the time–displacement truss positions needs to be drawn for an accurate judgment. In the Z-axis direction, there is maximum upward displacement at both ends of the upper chord and maximum downward displacement at the bottom of the lower chord, with maximum displacements of 0.1032 m and −0.2175 m, both of which surpass the critical displacement of 0.08 m.
By 10,800 s in S2, as a result of the heating of the two left end unit web members and the connecting plate, the web member steel pipe expands and deforms towards the surrounding area. The left end of the truss slightly sags downwards and the left end of the upper chord tilts upward. Additionally, the connecting plate undergoes an expansion deformation radiating from the center to bend downwards around.
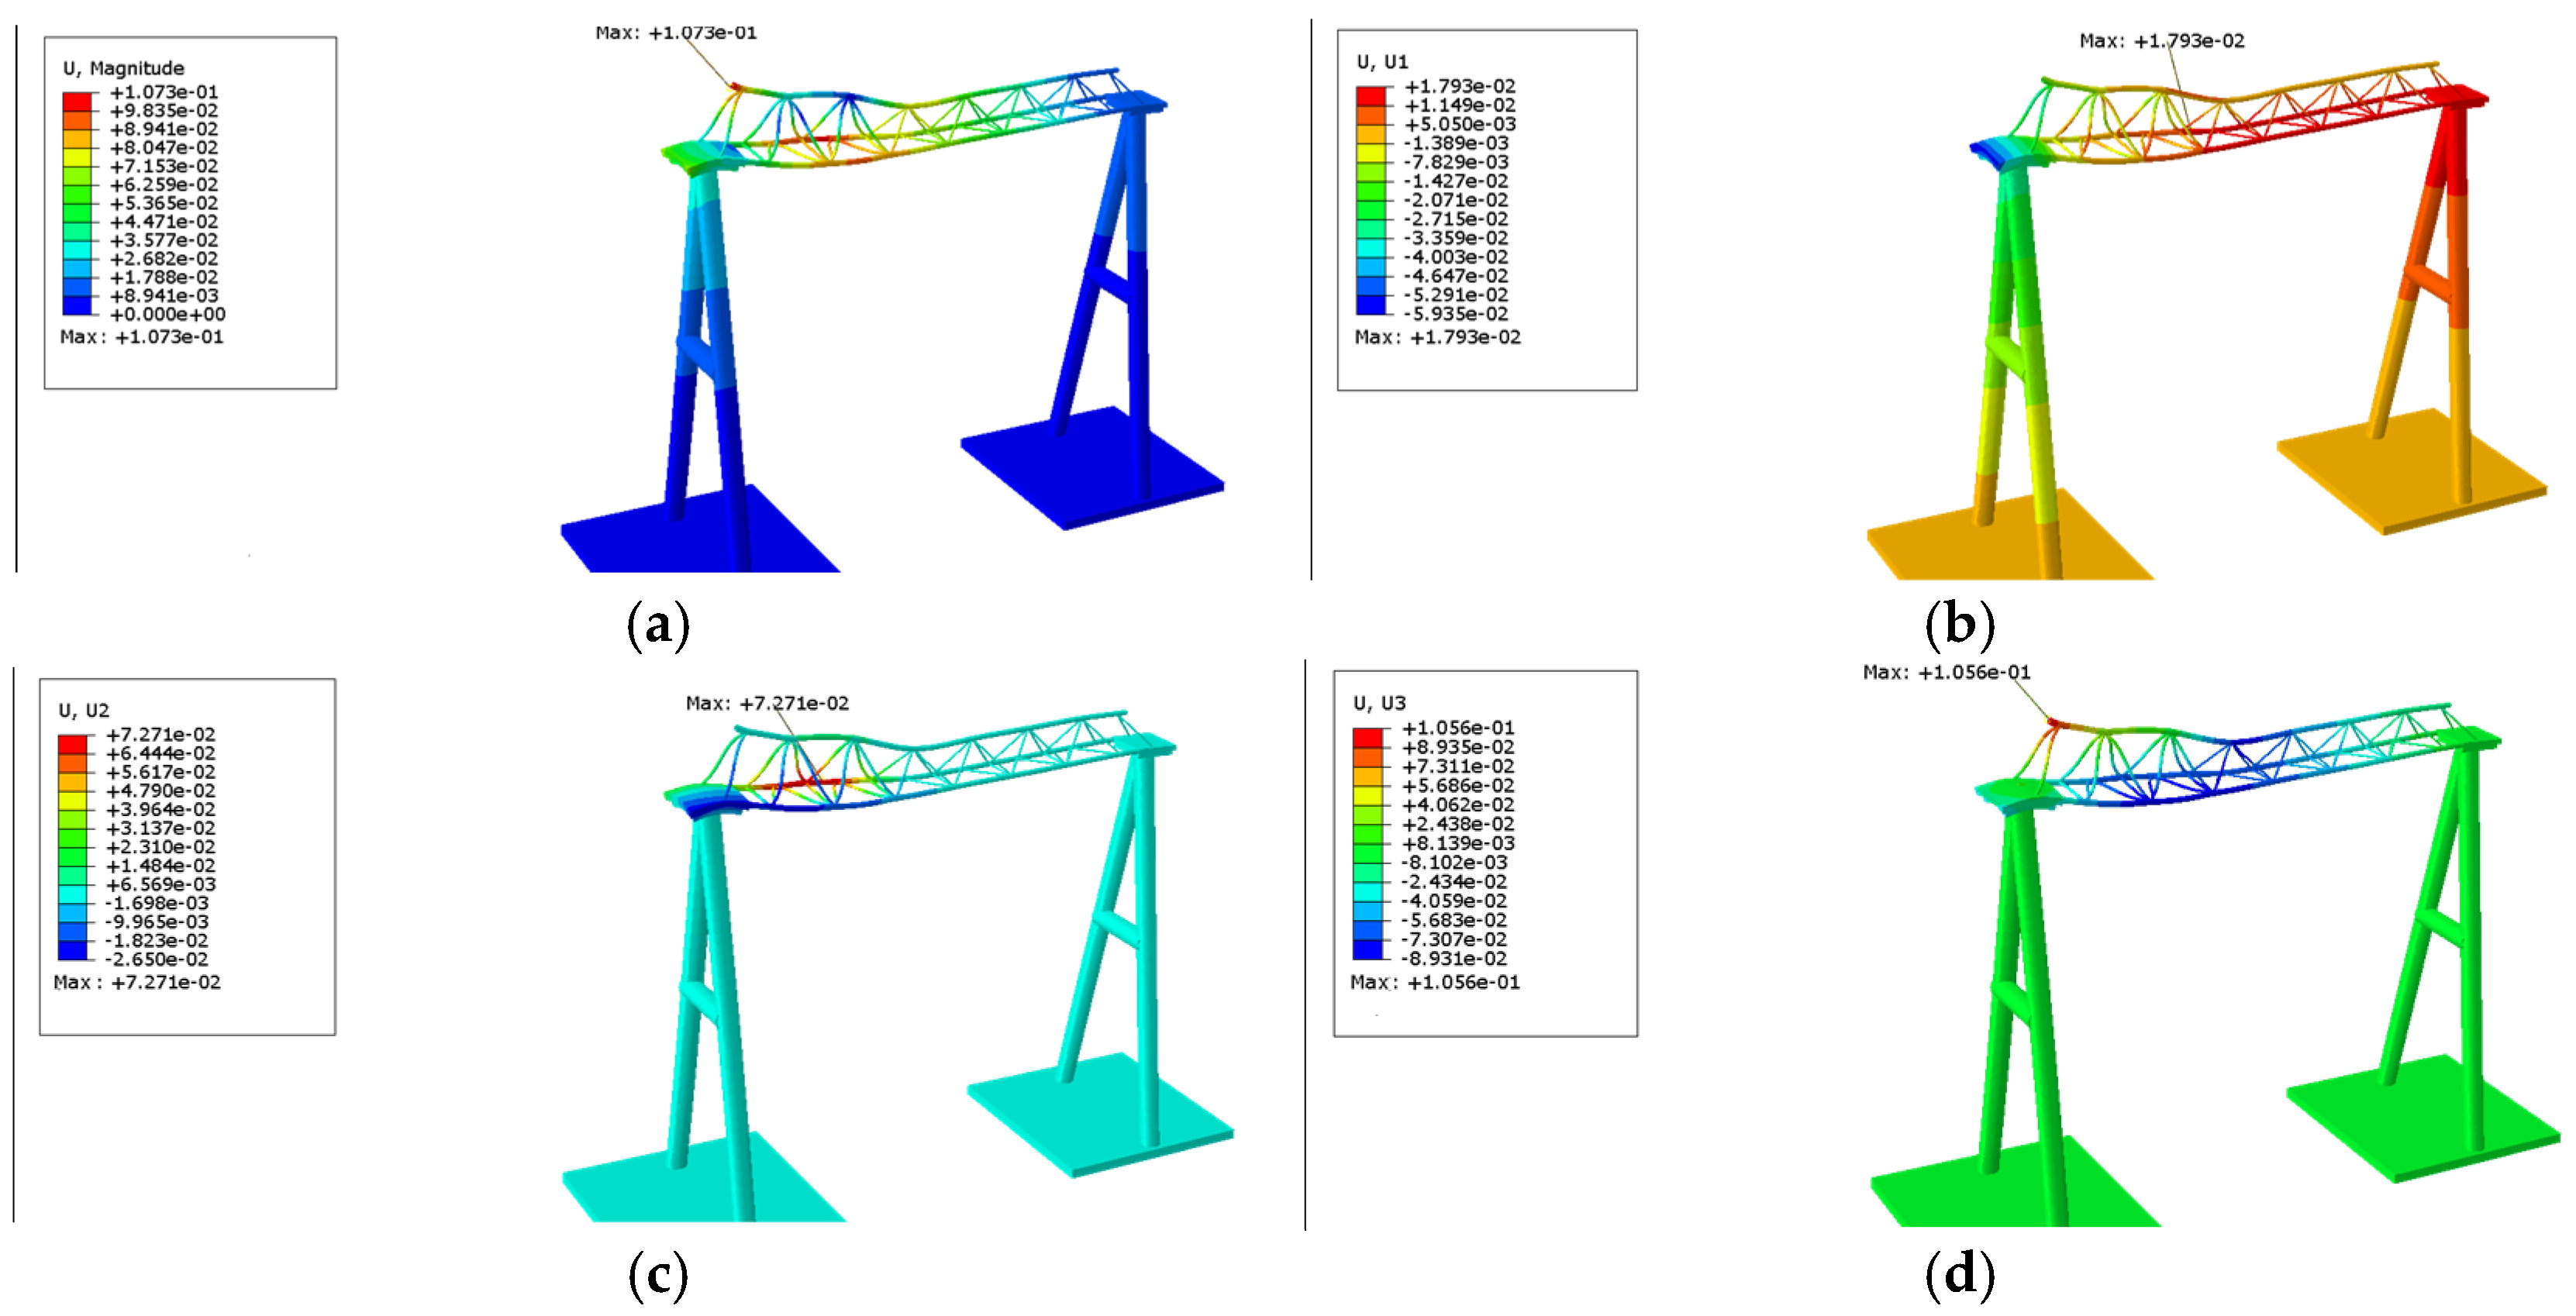
As shown in Figure 21, the maximum displacement occurs at the left end of the upper chord, with a maximum displacement value of 0.1073 m, remaining below the critical value of 0.12 m. In the X-axis direction, the displacement of the chord extending towards both ends measures 0.01793 m, while the maximum displacement of the connecting plate to the left is 0.05935 m, both of which are lower than the critical value of 0.94 m. For the extension of the web member towards both ends in the Y-axis direction, the two maximum extension displacement points are located at the midpoint of the lower chord member between the two heated unit web members and the displacement of the connecting plate caused by thermal expansion, with maximum displacements of 0.07271 m and −0.02650 m respectively. The maximum displacement of the other lower chord member is −0.02630 m, and the difference between the two lower chord members is 0.09901 m, exceeding the critical value of 0.094 m. In the Z-axis direction, the left end of the upper chord experiences a maximum upward displacement, while the center of the heated unit far from the connecting plate experiences a maximum downward displacement. These maximum displacements measure 0.1056 m and −0.08931 m, respectively, with a difference of 0.19491, exceeding the critical value of 0.08 m.

3.5.2. Displacement Analysis of Substation Framework with Fire-Resistant Coating

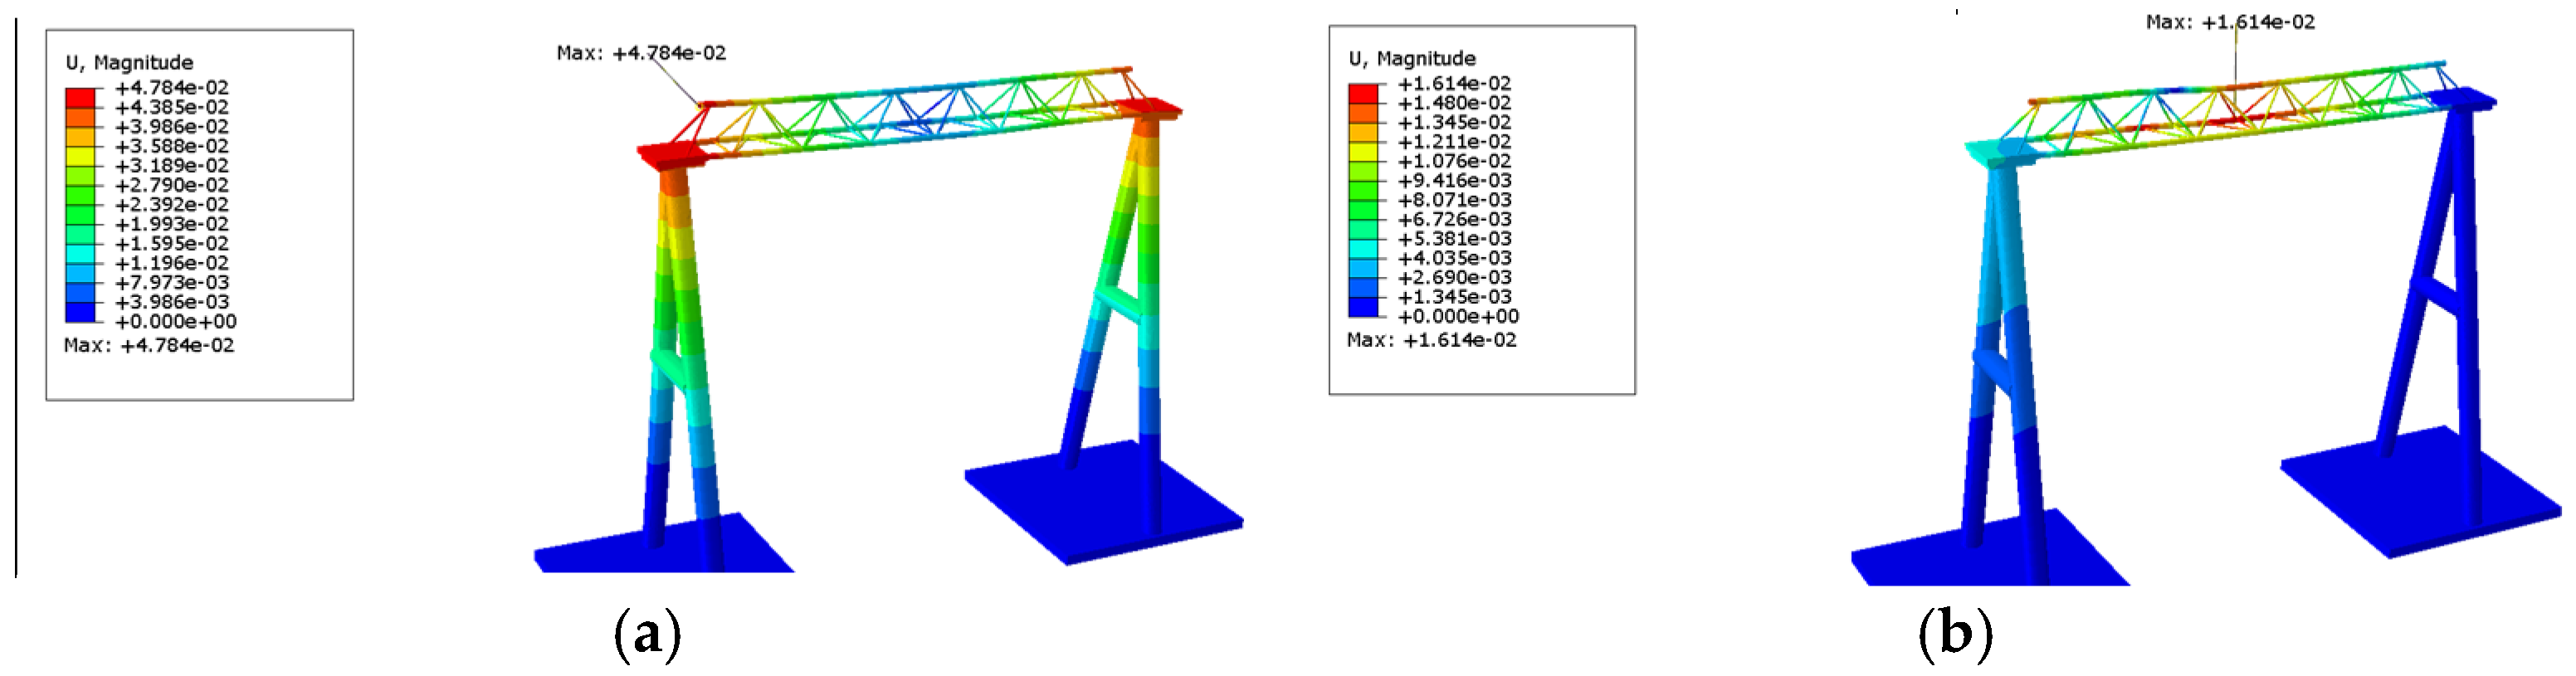
As shown in Figure 22, when the surface is coated with a fire-resistant coating, the overall displacement of the truss remains quite minimal, approximately at the level of 10−2. The location of the maximum displacement position is largely consistent with that in the no-fire scenario (Figure 7). Therefore, fireproof coatings can effectively protect the displacement of the substation structure.

3.5.3. Analysis of Deformation Curve Characteristics

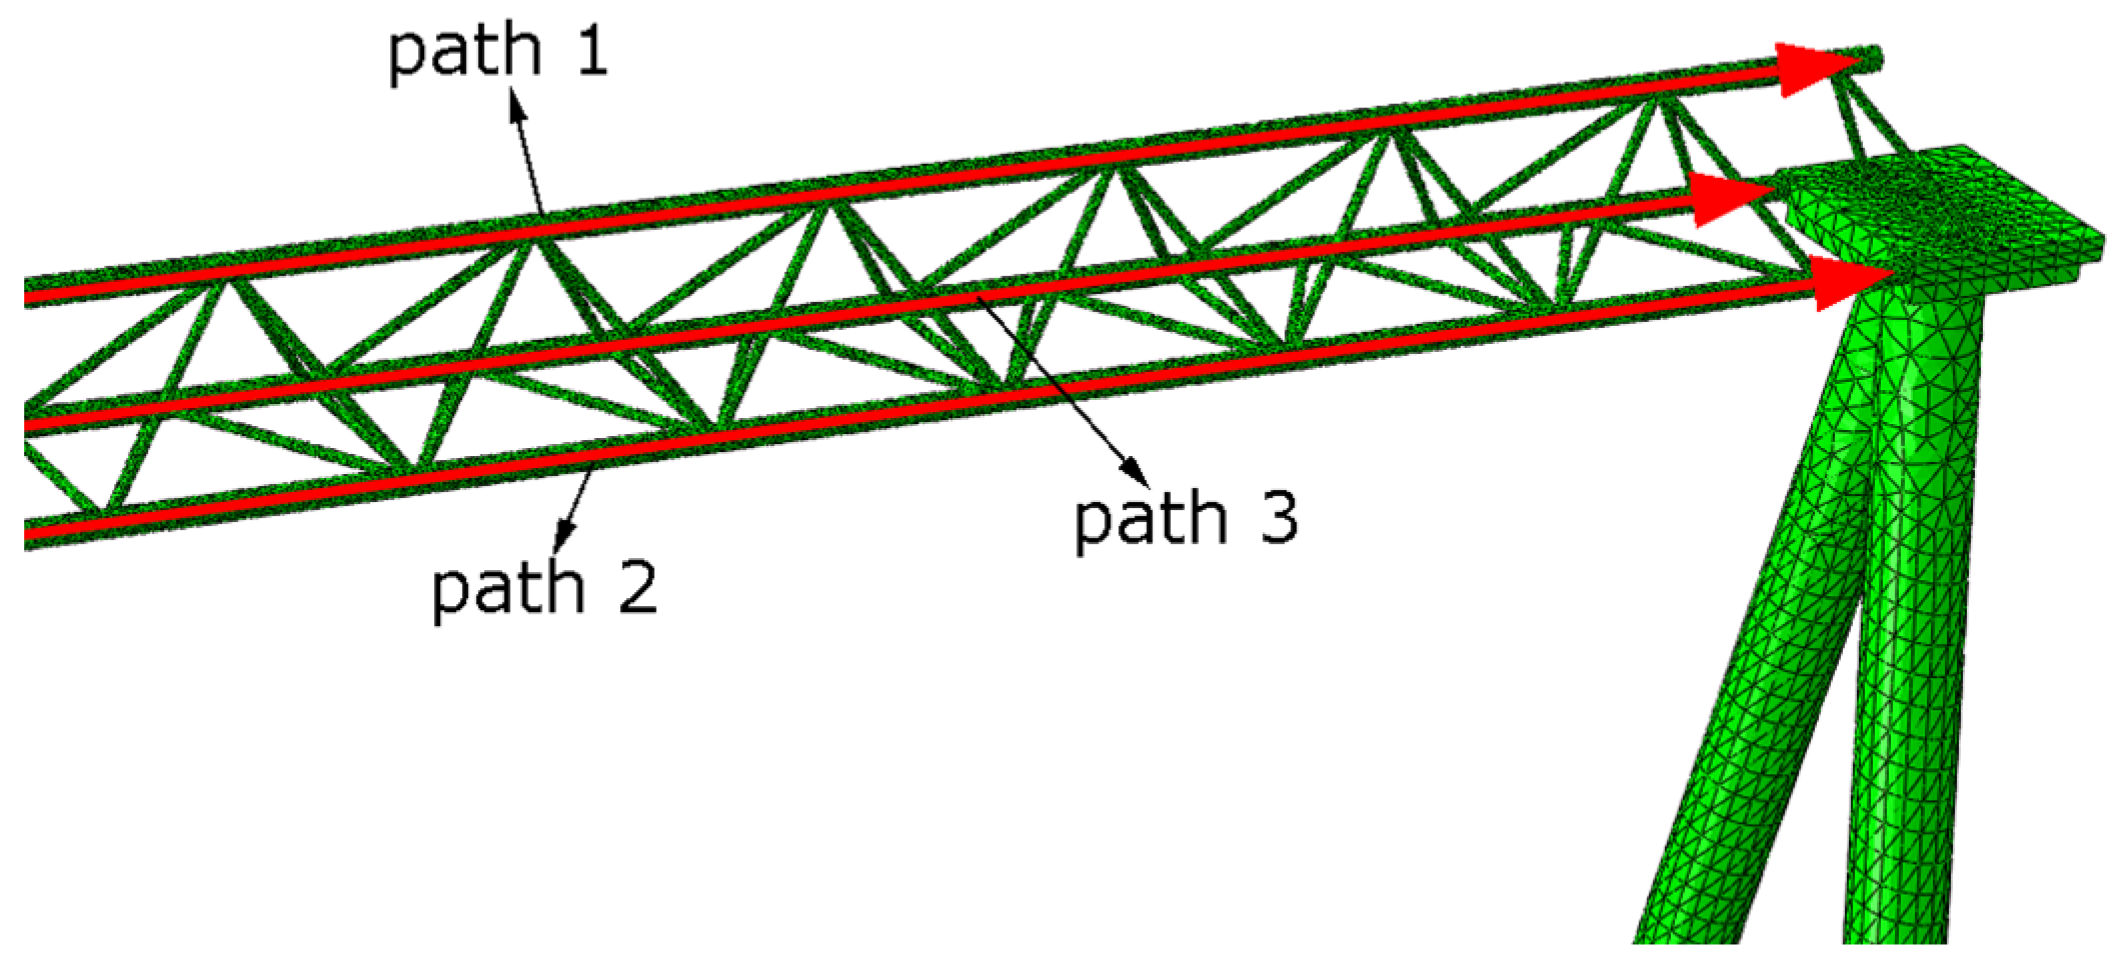
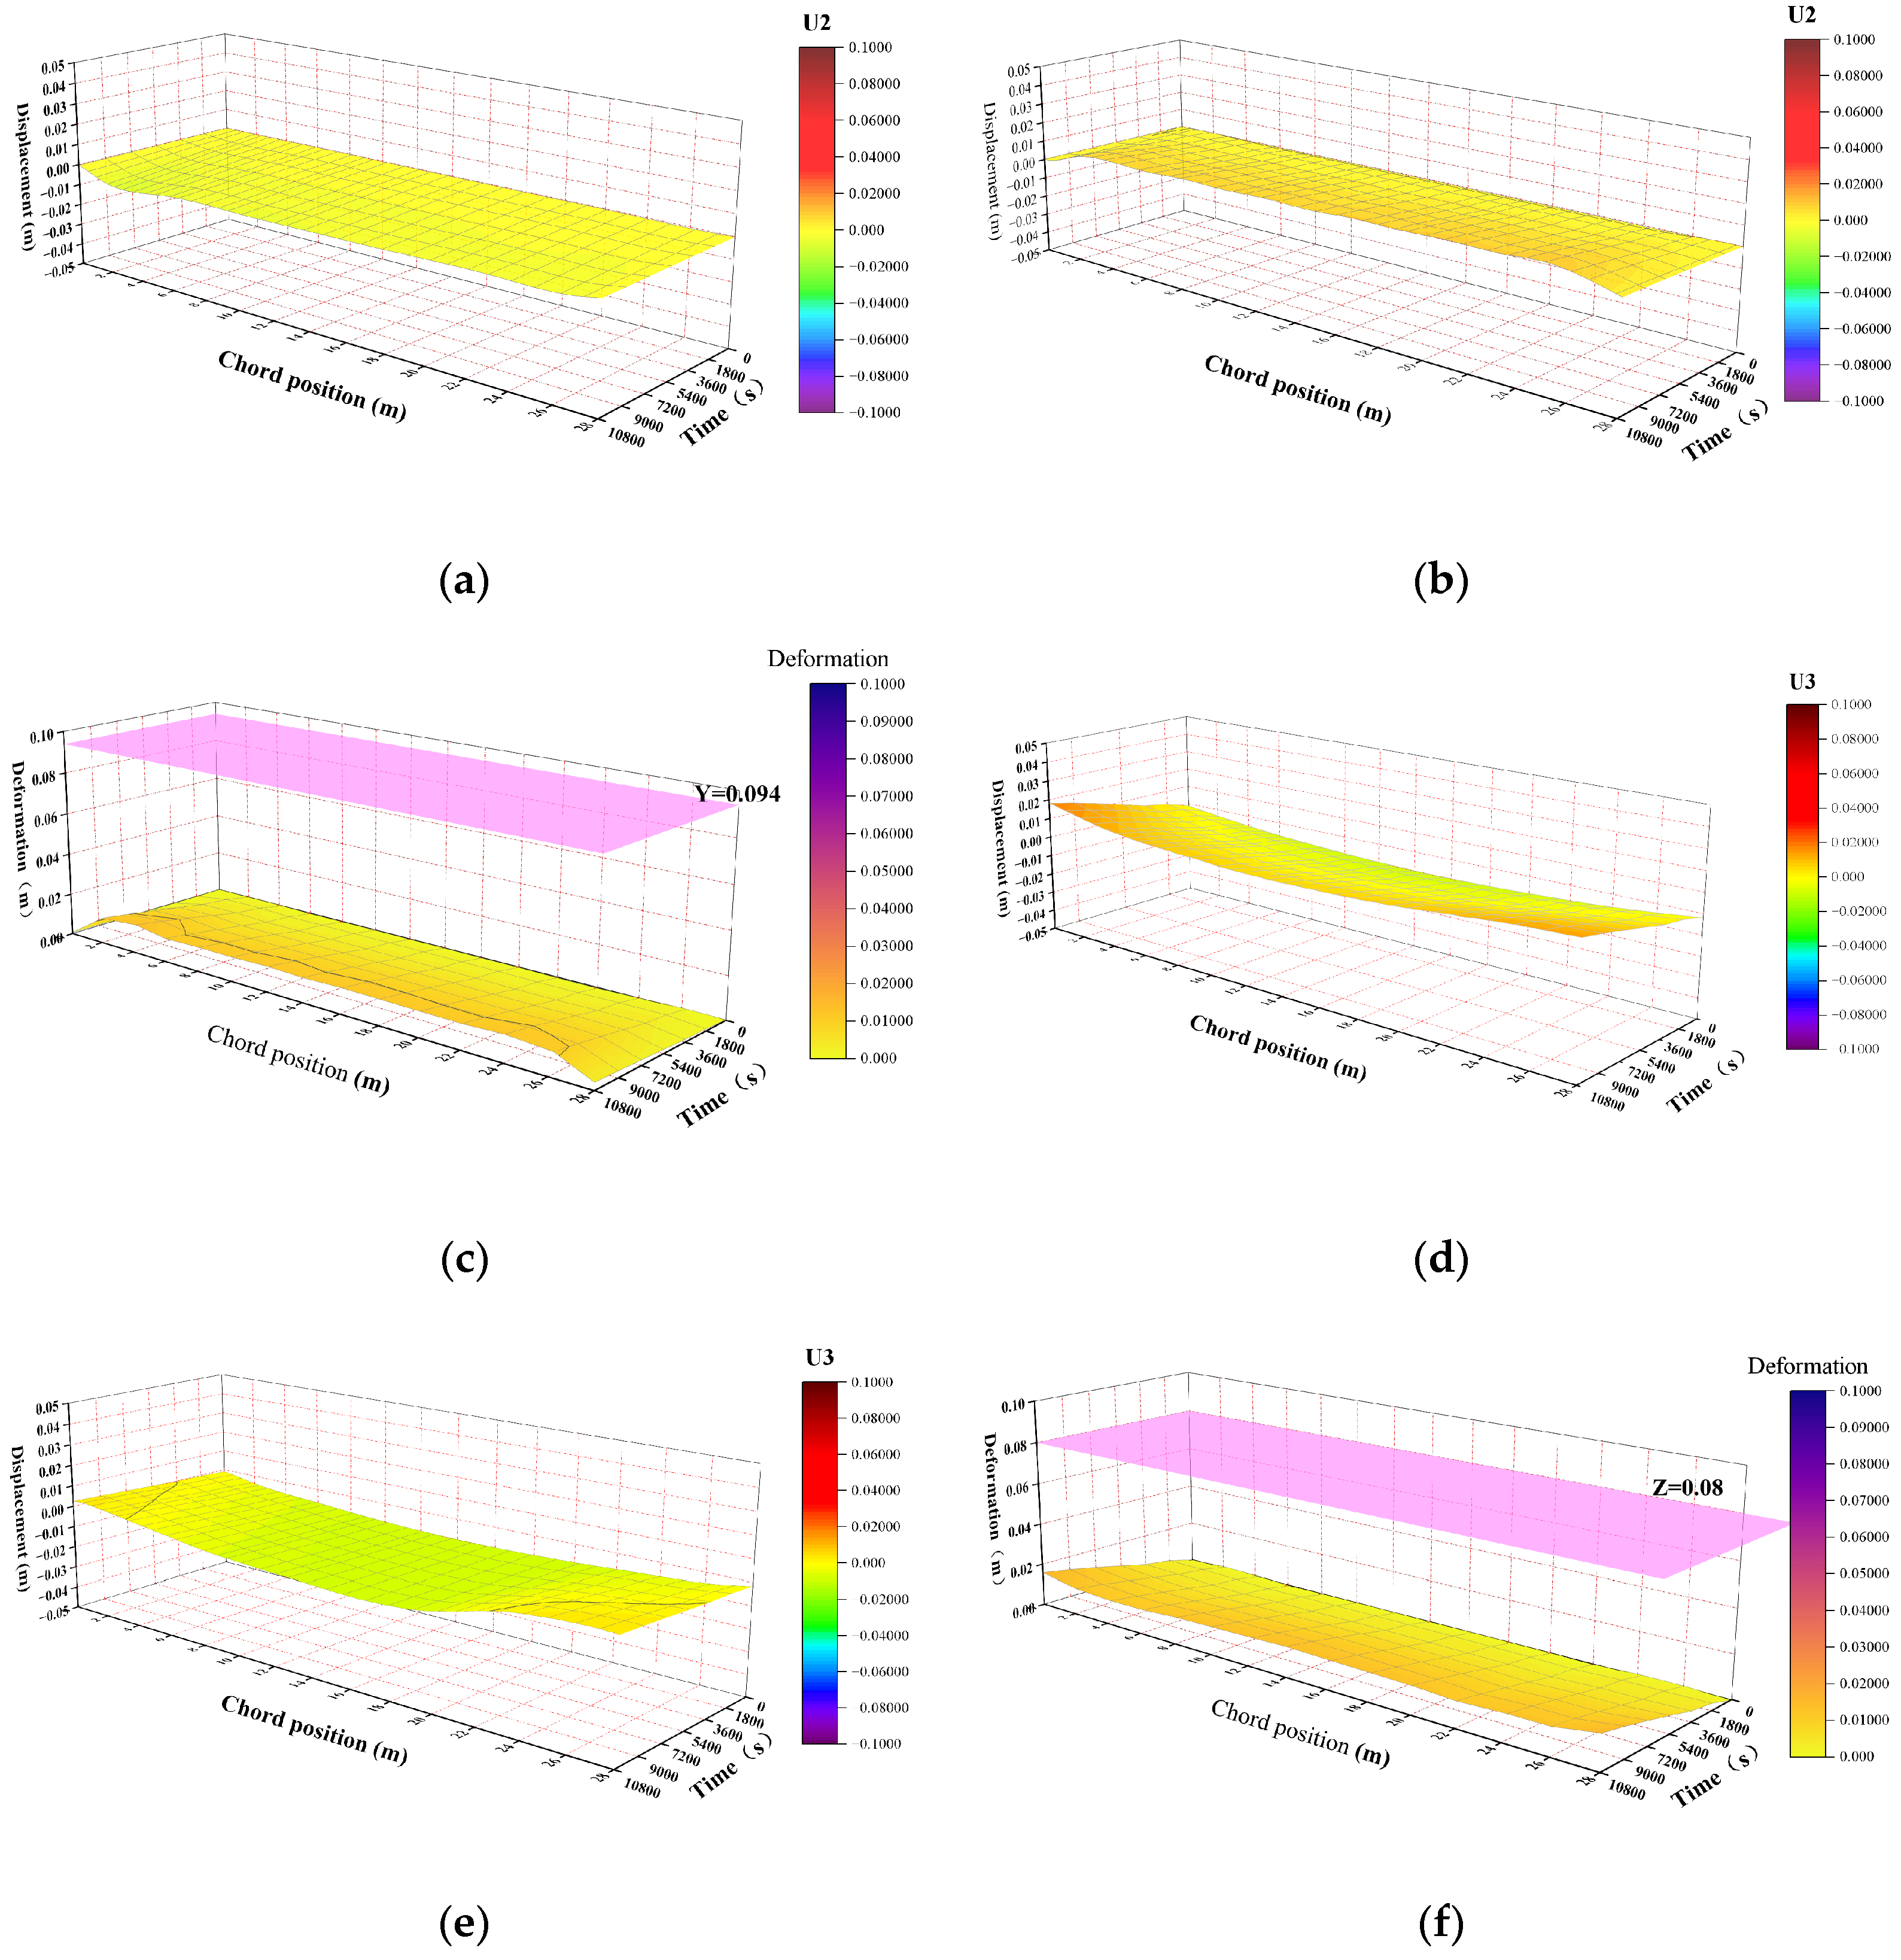
The displacement deformation trend of the overall structure were obtained through displacement cloud maps of the structure under the two fire scenarios. To further investigate the displacement and deformation process, paths 1, 2, and 3 (as shown in Figure 23) are selected, starting from the left end of the chord (0) and ending at the right end (28). These paths represent the center nodes of the chord for analyzing the structural displacement characteristics of the entire structure in the Y and Z directions, as well as the deformation of the web members between the paths. The displacement of the truss chord is related to the position and connection structure of the web unit. The web plays a significant role in minimizing the chord’s displacement, while the displacement is constantly superimposed. To clearly display the displacement and deformation changes under different conditions, a three-dimensional curve diagram of time–displacement truss positions is drawn.
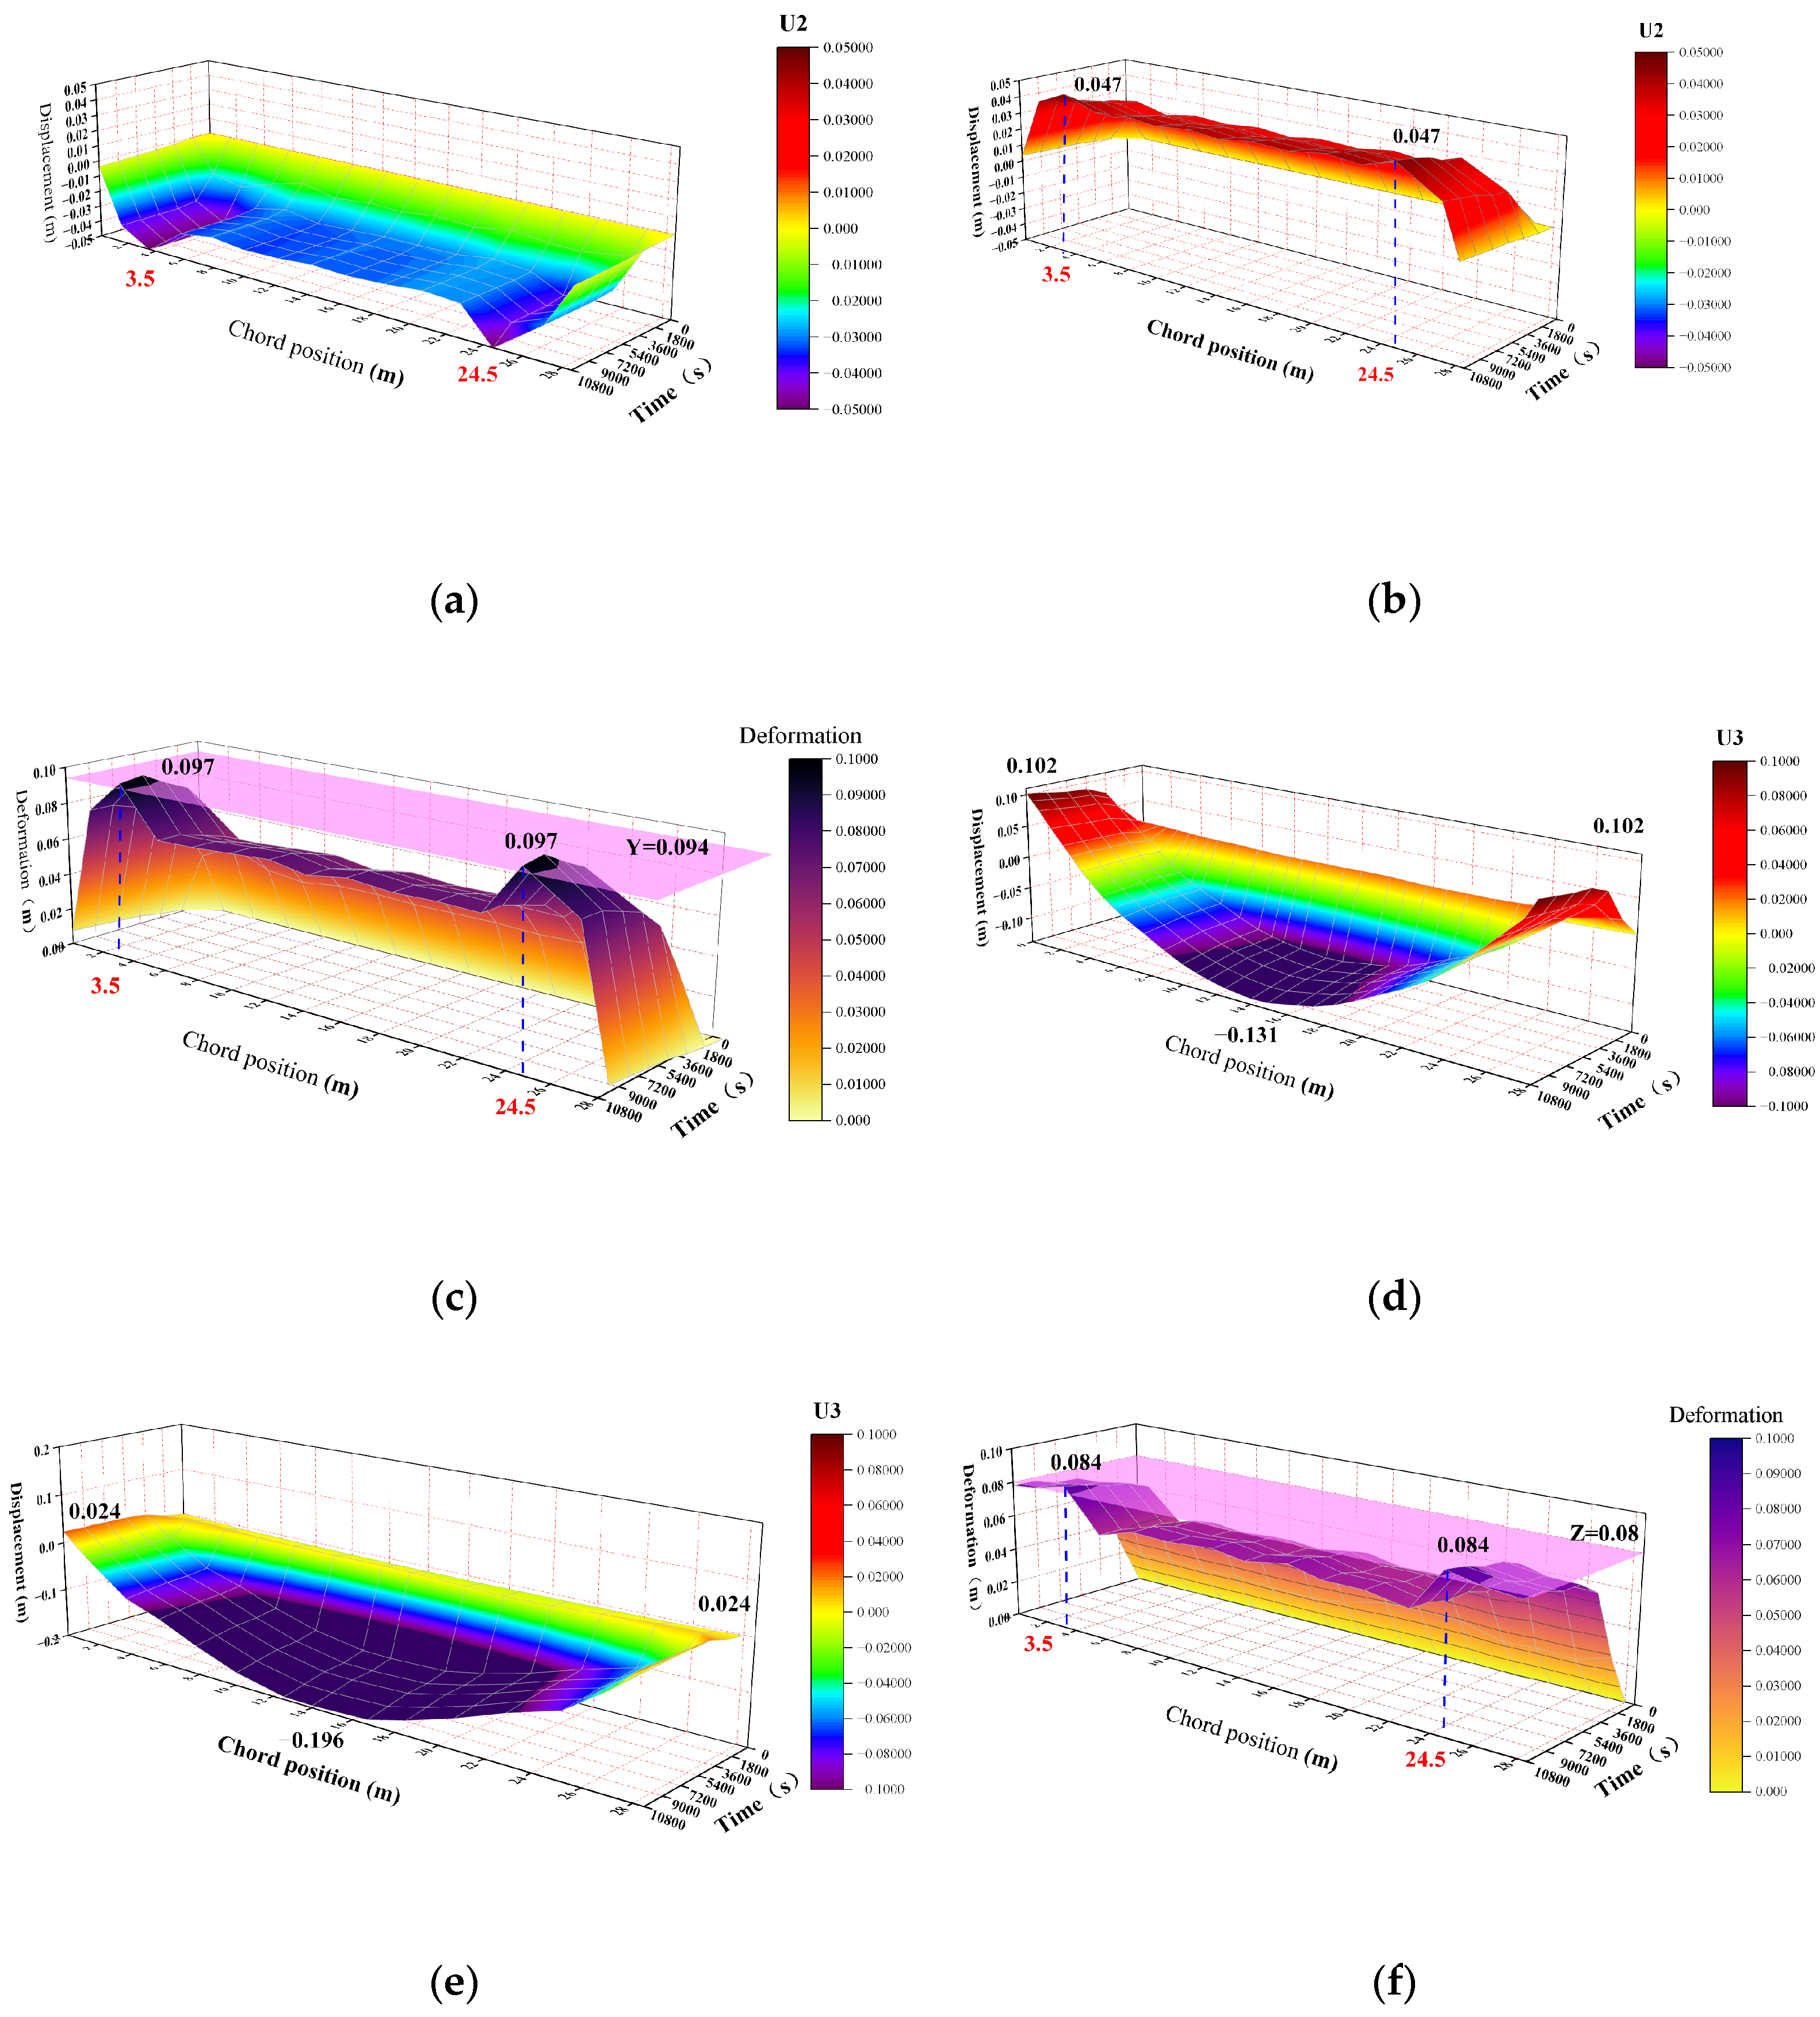
Figure 24 shows the time–displacement truss position changes of paths 2 and 3 in the Y direction in the structure without fire-retardant coating under the heating conditions of S1. It can be observed that the maximum displacement and deformation of paths 2 and 3 are noted at distances of 3.5 m and 24.5 m along the chord, respectively. Path 2 exhibits a peak displacement of 0.05 m, while Path 3 shows a maximum displacement of 0.047 m. In the Y direction, the web member experiences a maximum deformation of 0.097 m, which surpasses the critical displacement of 0.094 m.
At both ends (0 m, 28 m) of Path 1, the maximum displacement in the positive direction (Z direction) is 0.102 m, while the maximum displacement in the negative direction is 0.131 m at the midpoint (14 m) of Path 1. Path 2 exhibits a similar displacement pattern to Path 1, with a maximum positive displacement of 0.024 m at its endpoints (0 m and 28 m) and a maximum negative displacement of 0.196 m at its midpoint (14 m). The maximum deformation of the web member in the Z direction is 0.084 m at the center of the two end units (3.5 m, 24.5 m). The displacement in the Z direction arises from the thermal expansion of the steel at the connection position between the web member and the connecting plate, which induces significant and prolonged stress contributing to the overall collapse tendency of the truss structure. During the process of the thermal expansion of steel, the expansion of the chord steel tube can suppress the overall deformation of the intermediate web member, thereby increasing the overall fire resistance limit of the structure.
Figure 25 shows the displacement changes in the structure with a fire-resistant coating in S1. It can be found that the displacement and deformation remain within 0.02 m, with the trend becoming increasingly stable. Some variations in displacement and deformation are observed in the two end units along the Y direction. In the Z direction, given sufficient time for external heat conduction, the deformation of the chord at different positions shows little significant difference. Due to the superposition of the displacement, the displacement of the two end units is slightly greater.
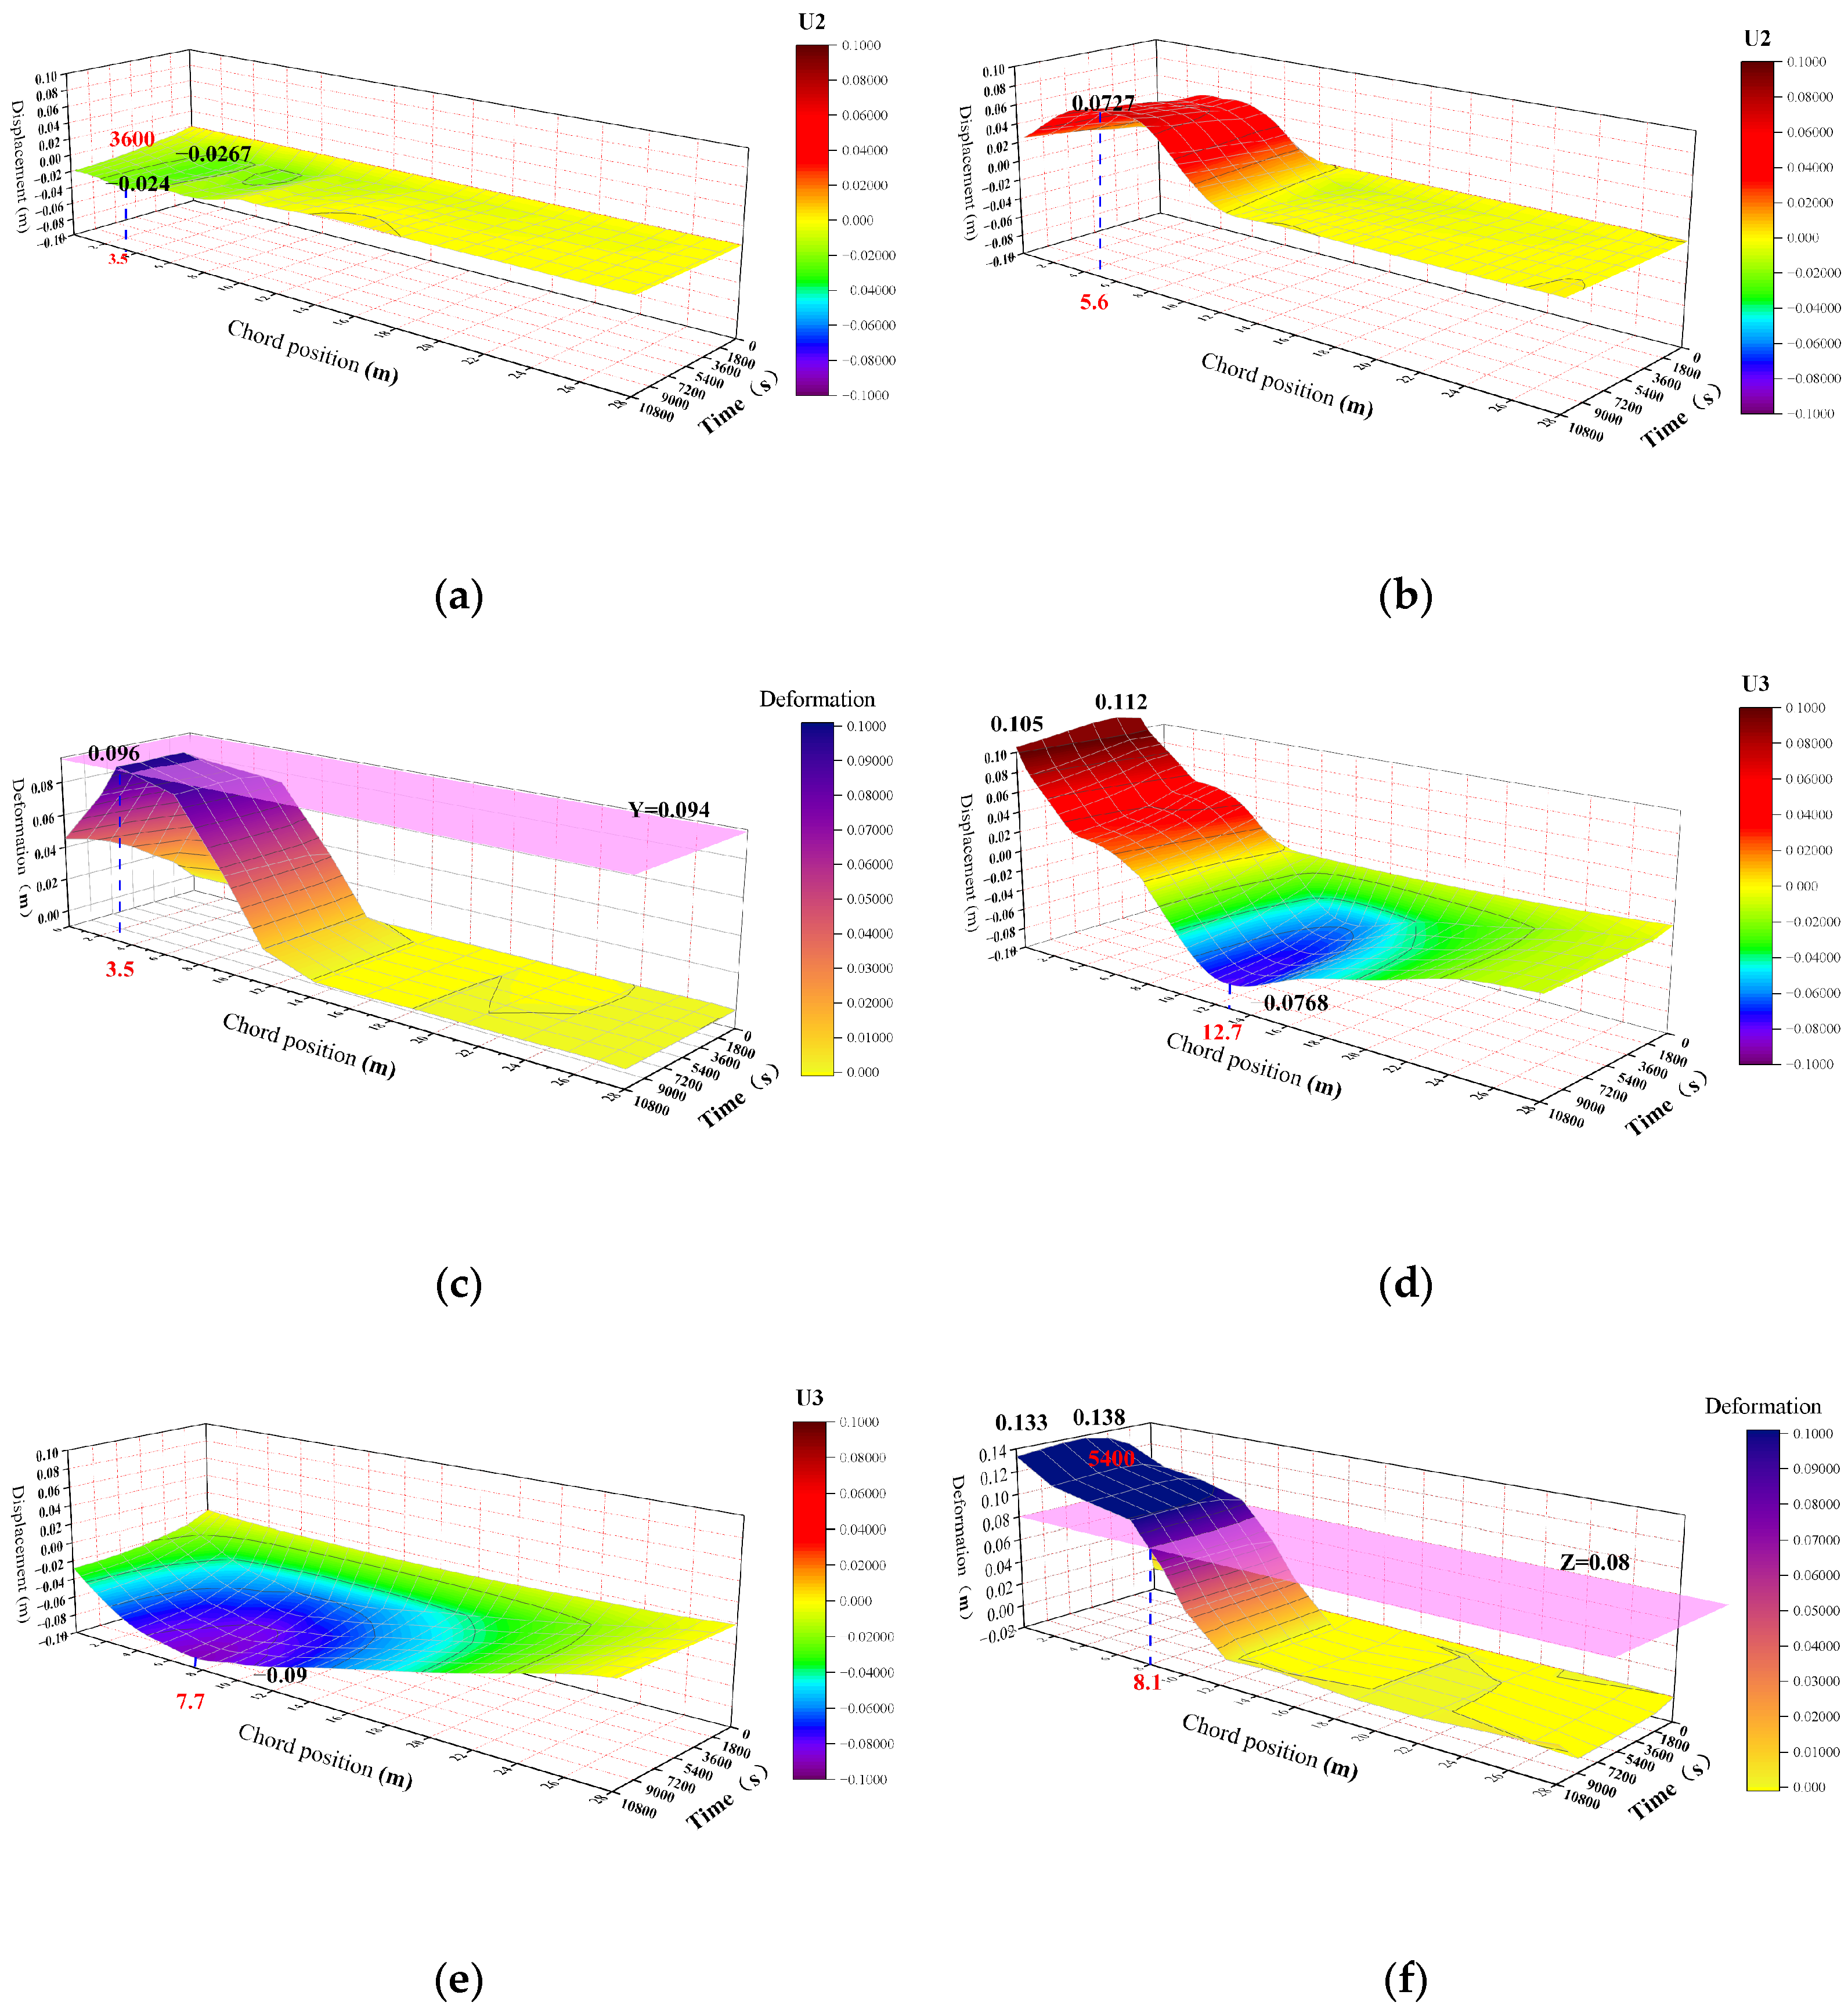
Figure 26 shows the trend of the time–displacement truss position changes for Path 2 and Path 3 in the Y direction of the structure without a fire-retardant coating in S2. It can be observed that the left end of Path 2 in the Y direction of the steel frame is shifted to the center position of the heating unit (3.5 m) at 3600 s, with a maximum displacement of 0.0267 m. Due to the complete collapse of the truss, a certain amount of contraction occurs in the horizontal direction, and the displacement slightly decreases to 0.024 m at 10,800 s. At 10,800 s, the maximum upward displacement at the midpoint (5.6 m) between the two heated units on the left end of Path 3 is 0.0727 m. The maximum displacement of the web member is at the midpoint (3.5 m) of the heated unit on the leftmost end, with a value of 0.096 m, exceeding the critical displacement of 0.094 m.
The maximum displacement of the chord member at the leftmost end of the truss in the Z direction is 0.112 m at 1800 s. Due to the overall collapse of the truss, the displacement slightly decreases to 0.105 m at 10,800 s, and the maximum displacement is at 12.7 m from the right end of the third unit from the left end, with a value of 0.0768 m. The maximum displacement of the chord member at the center of the second unit from the left end (7.7 m) is 0.09 m, and the maximum deformation is at the leftmost end (0 m), with a maximum of 0.138 m at 5400 s. Due to the collapse, the displacement decreases to 0.133 m at 1800 s, and it can be seen from the figure that 0 m to 8.1 m are all dangerous deformation areas.
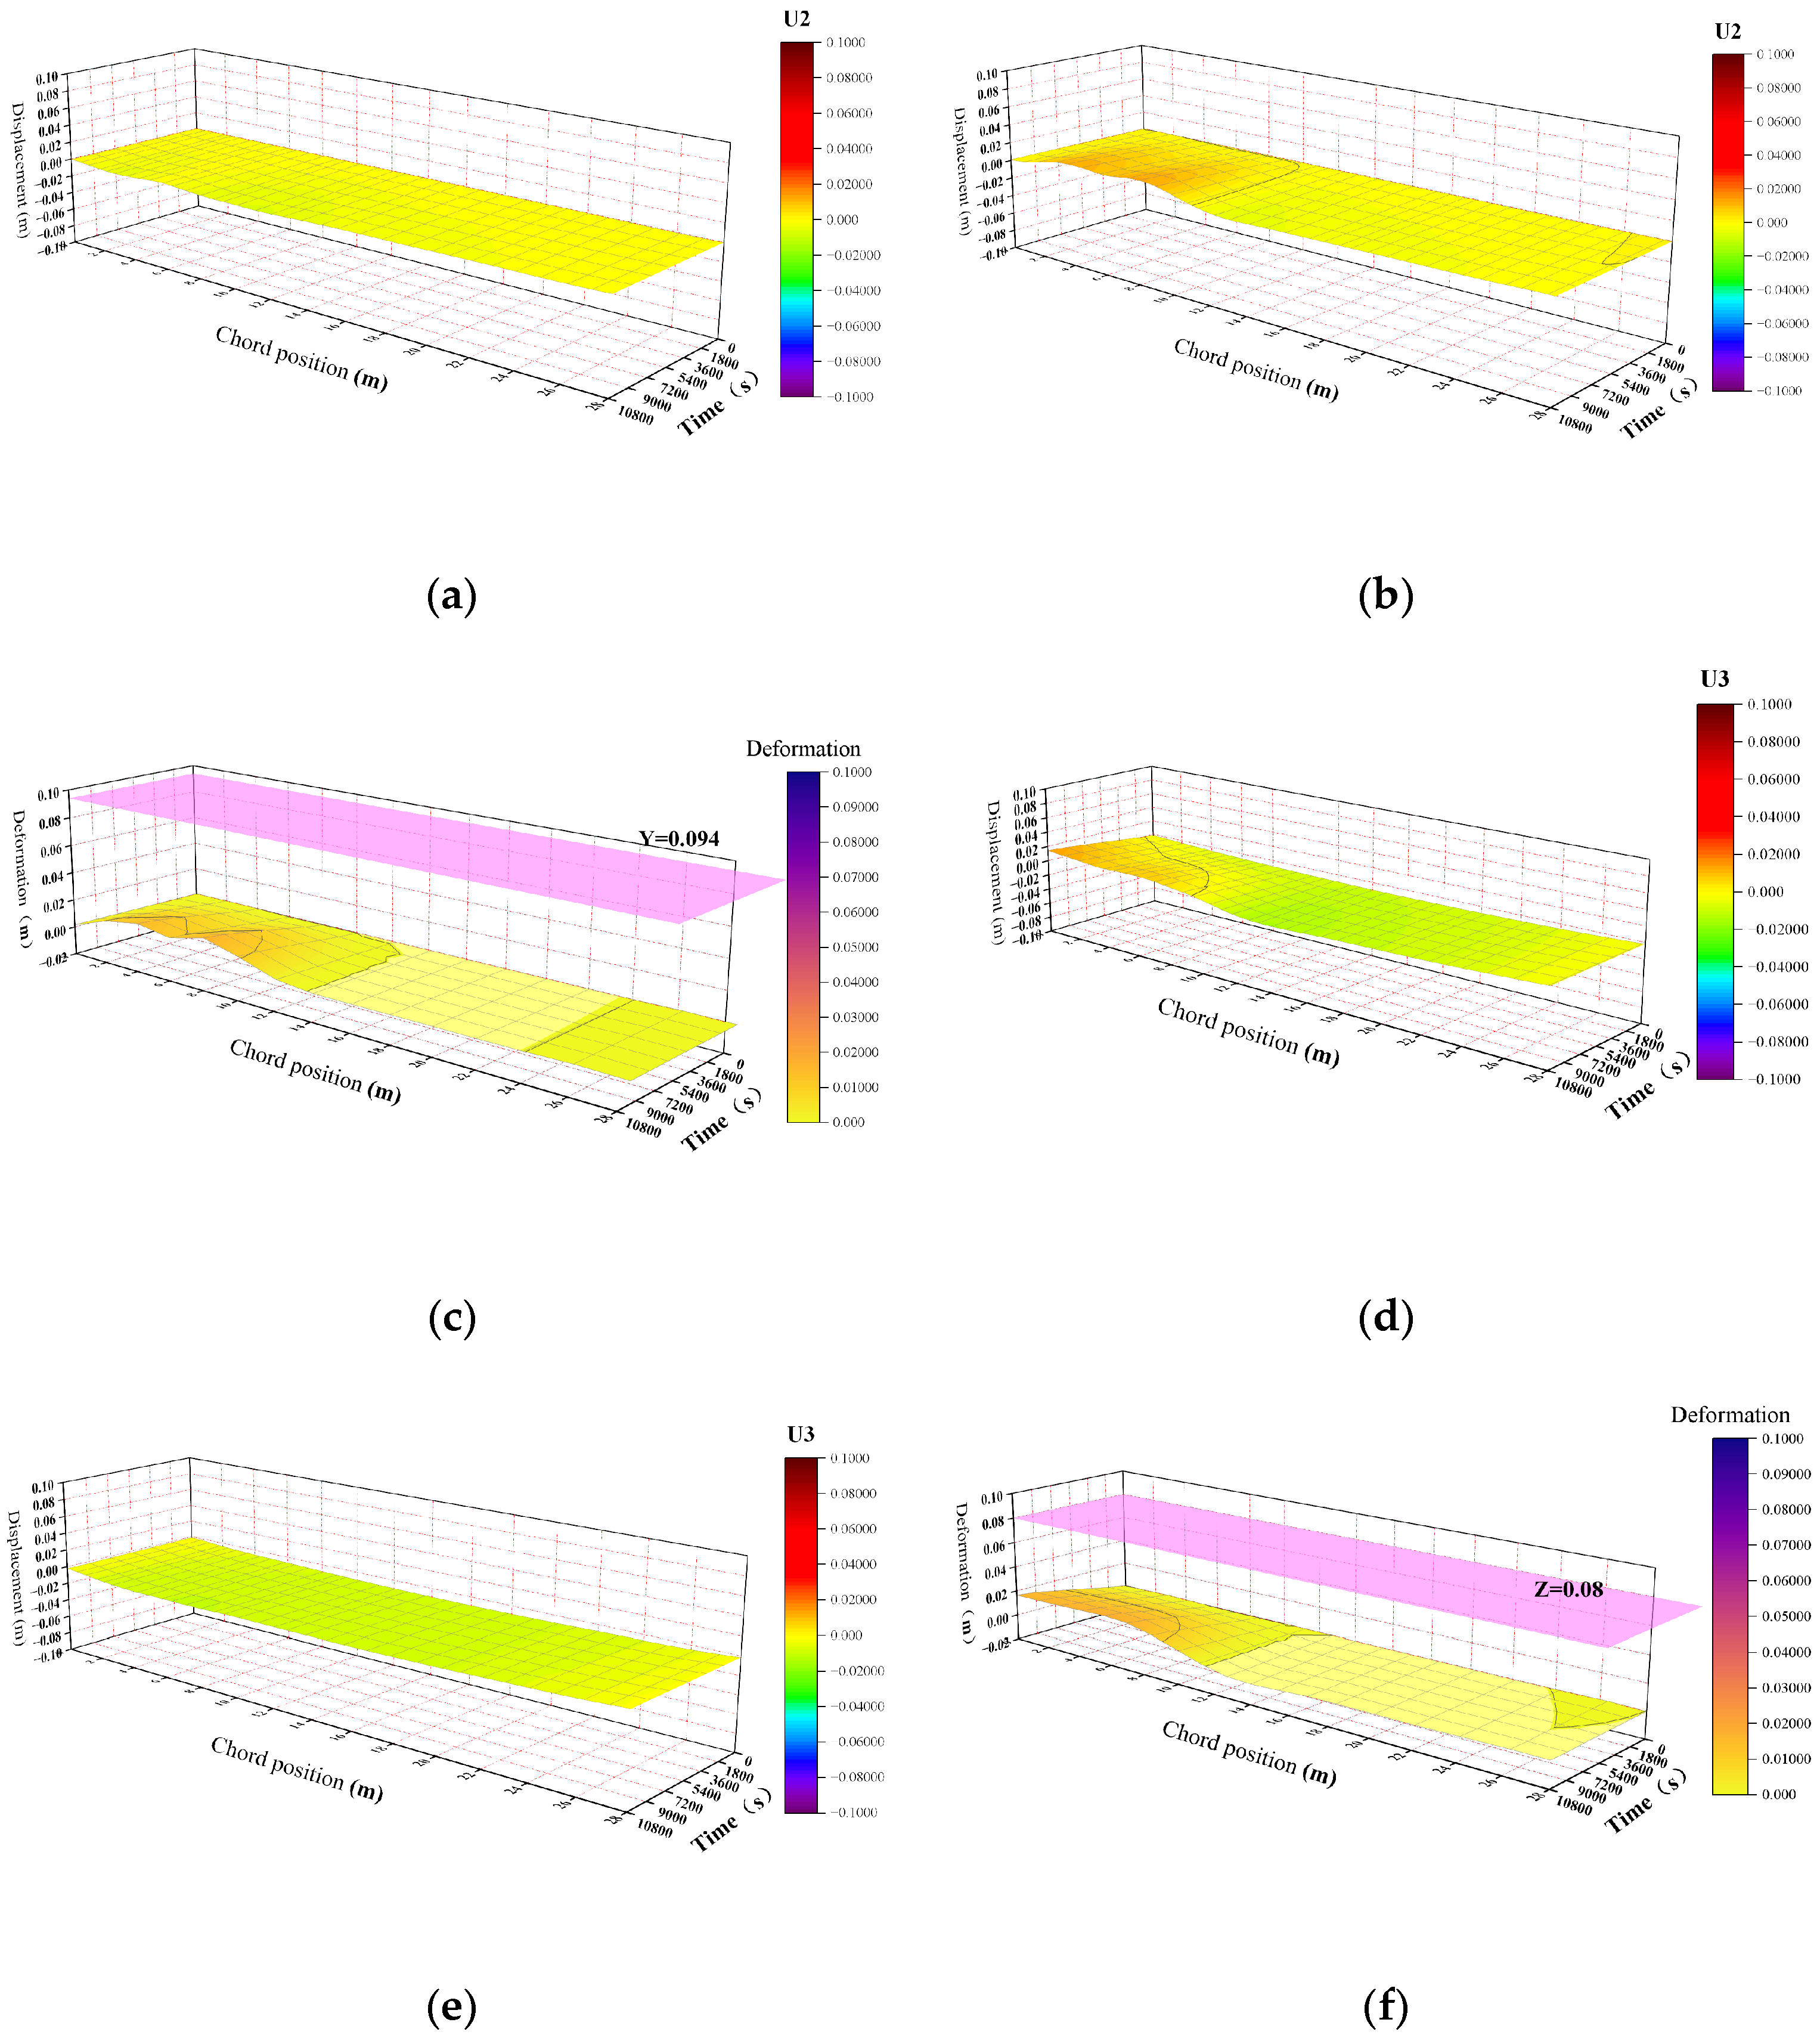
Figure 27 shows the displacement changes in the structure with a fire-retardant coating in S2. The maximum deformation of the fire-retardant coating in the Y direction occurs at the center position of the heated unit, with a value of 0.017 m, and the maximum deformation in the Z direction is located at the center positions of the two heated units, with a value of 0.018 m. Neither of these values exceed the allowable limit.

3.5.4. Analysis of Deflection Change Curve

Deflection refers to the linear displacement of a member’s axis in a direction perpendicular to the axis, or the linear displacement of the middle surface of a plate or shell in the direction perpendicular to the middle surface, when subjected to force or non-uniform temperature changes. This primarily indicates the overall structural deformation caused by stress or external factors.
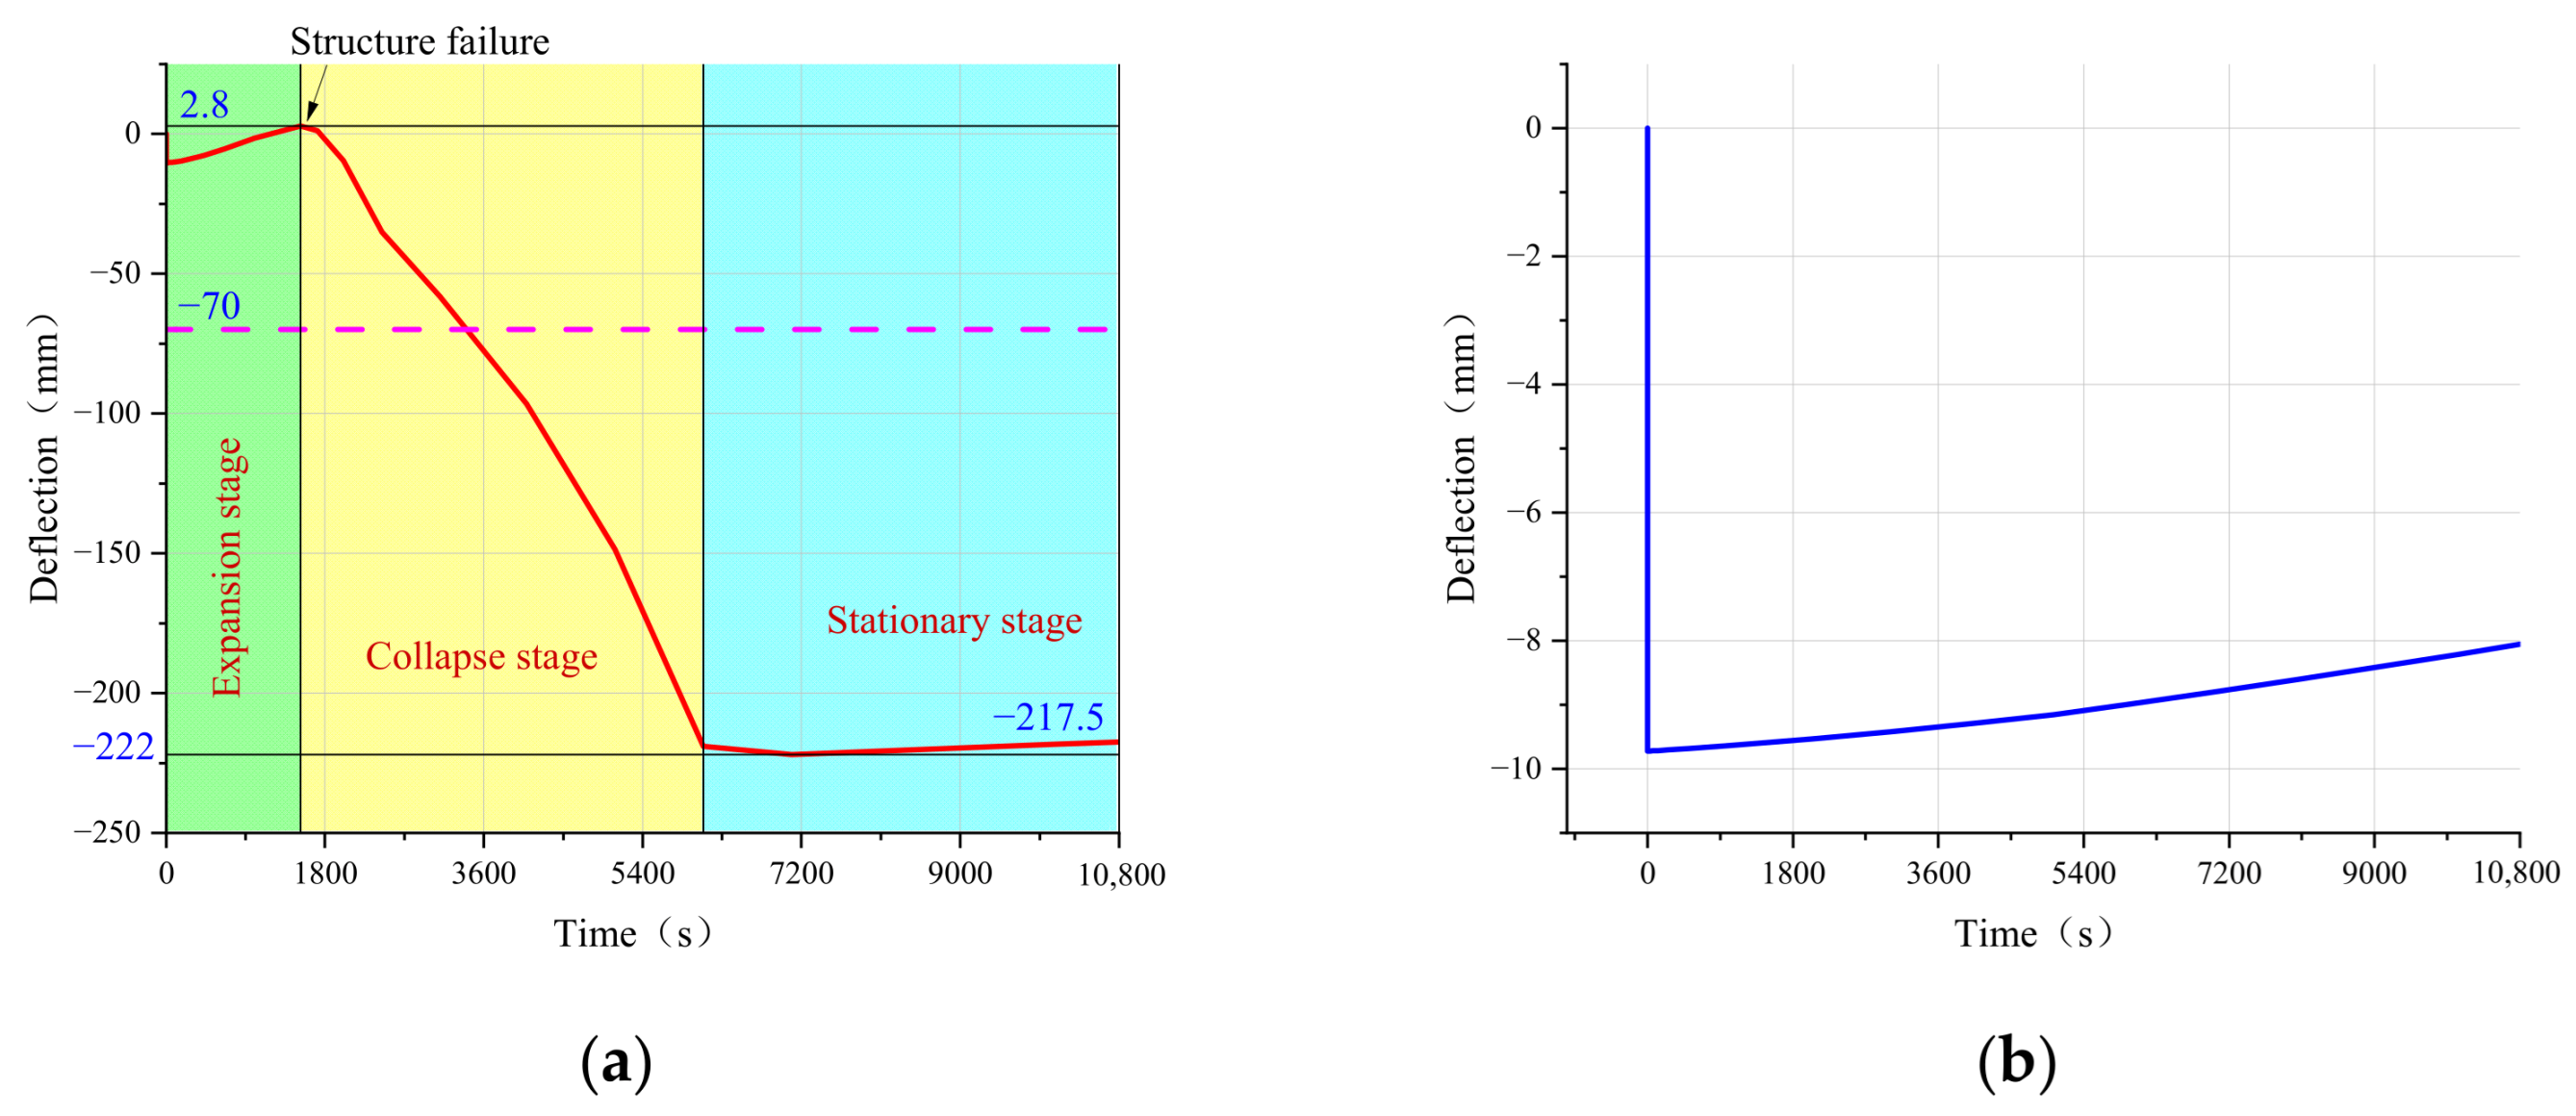
As illustrated in Figure 24 and Figure 25, under the fire scenario of S1, the maximum displacement in the Z direction occurs at the bottom position of the center of the lower chord of the truss. Figure 28 shows the deflection curve of the steel frame in S1. During the initial stage of the fire, the deflection generated by gravity is −10 mm. Upon exposure to heat from the fire source, this deflection increases upward to 2.8 mm. When heated to 1522 s, all truss steel pipes reach a temperature of 500 °C. The significant reduction in the steel strength and elastic modulus leads to structural failure and collapse. At 3382 s, the deflection exceeds the critical value of 70 mm. When the temperature reaches 1000 °C, the structure collapses further to a deflection of −222 mm. In the subsequent heating stage, the truss structure causes the central chord to exhibit much less downward deformation compared to the sides, leading to a minor reduction in deflection at the center. By 10,800 s, the deflection decreases to 217.5 mm.
After the structure is coated with a fire-retardant coating, the entire heating expansion process only occurs in the upward expansion stage of the structure. Due to the stable performance of the steel, the structure remains intact without failure or collapse, and the maximum deflection of the structure is only reduced by 2 mm due to heating expansion.
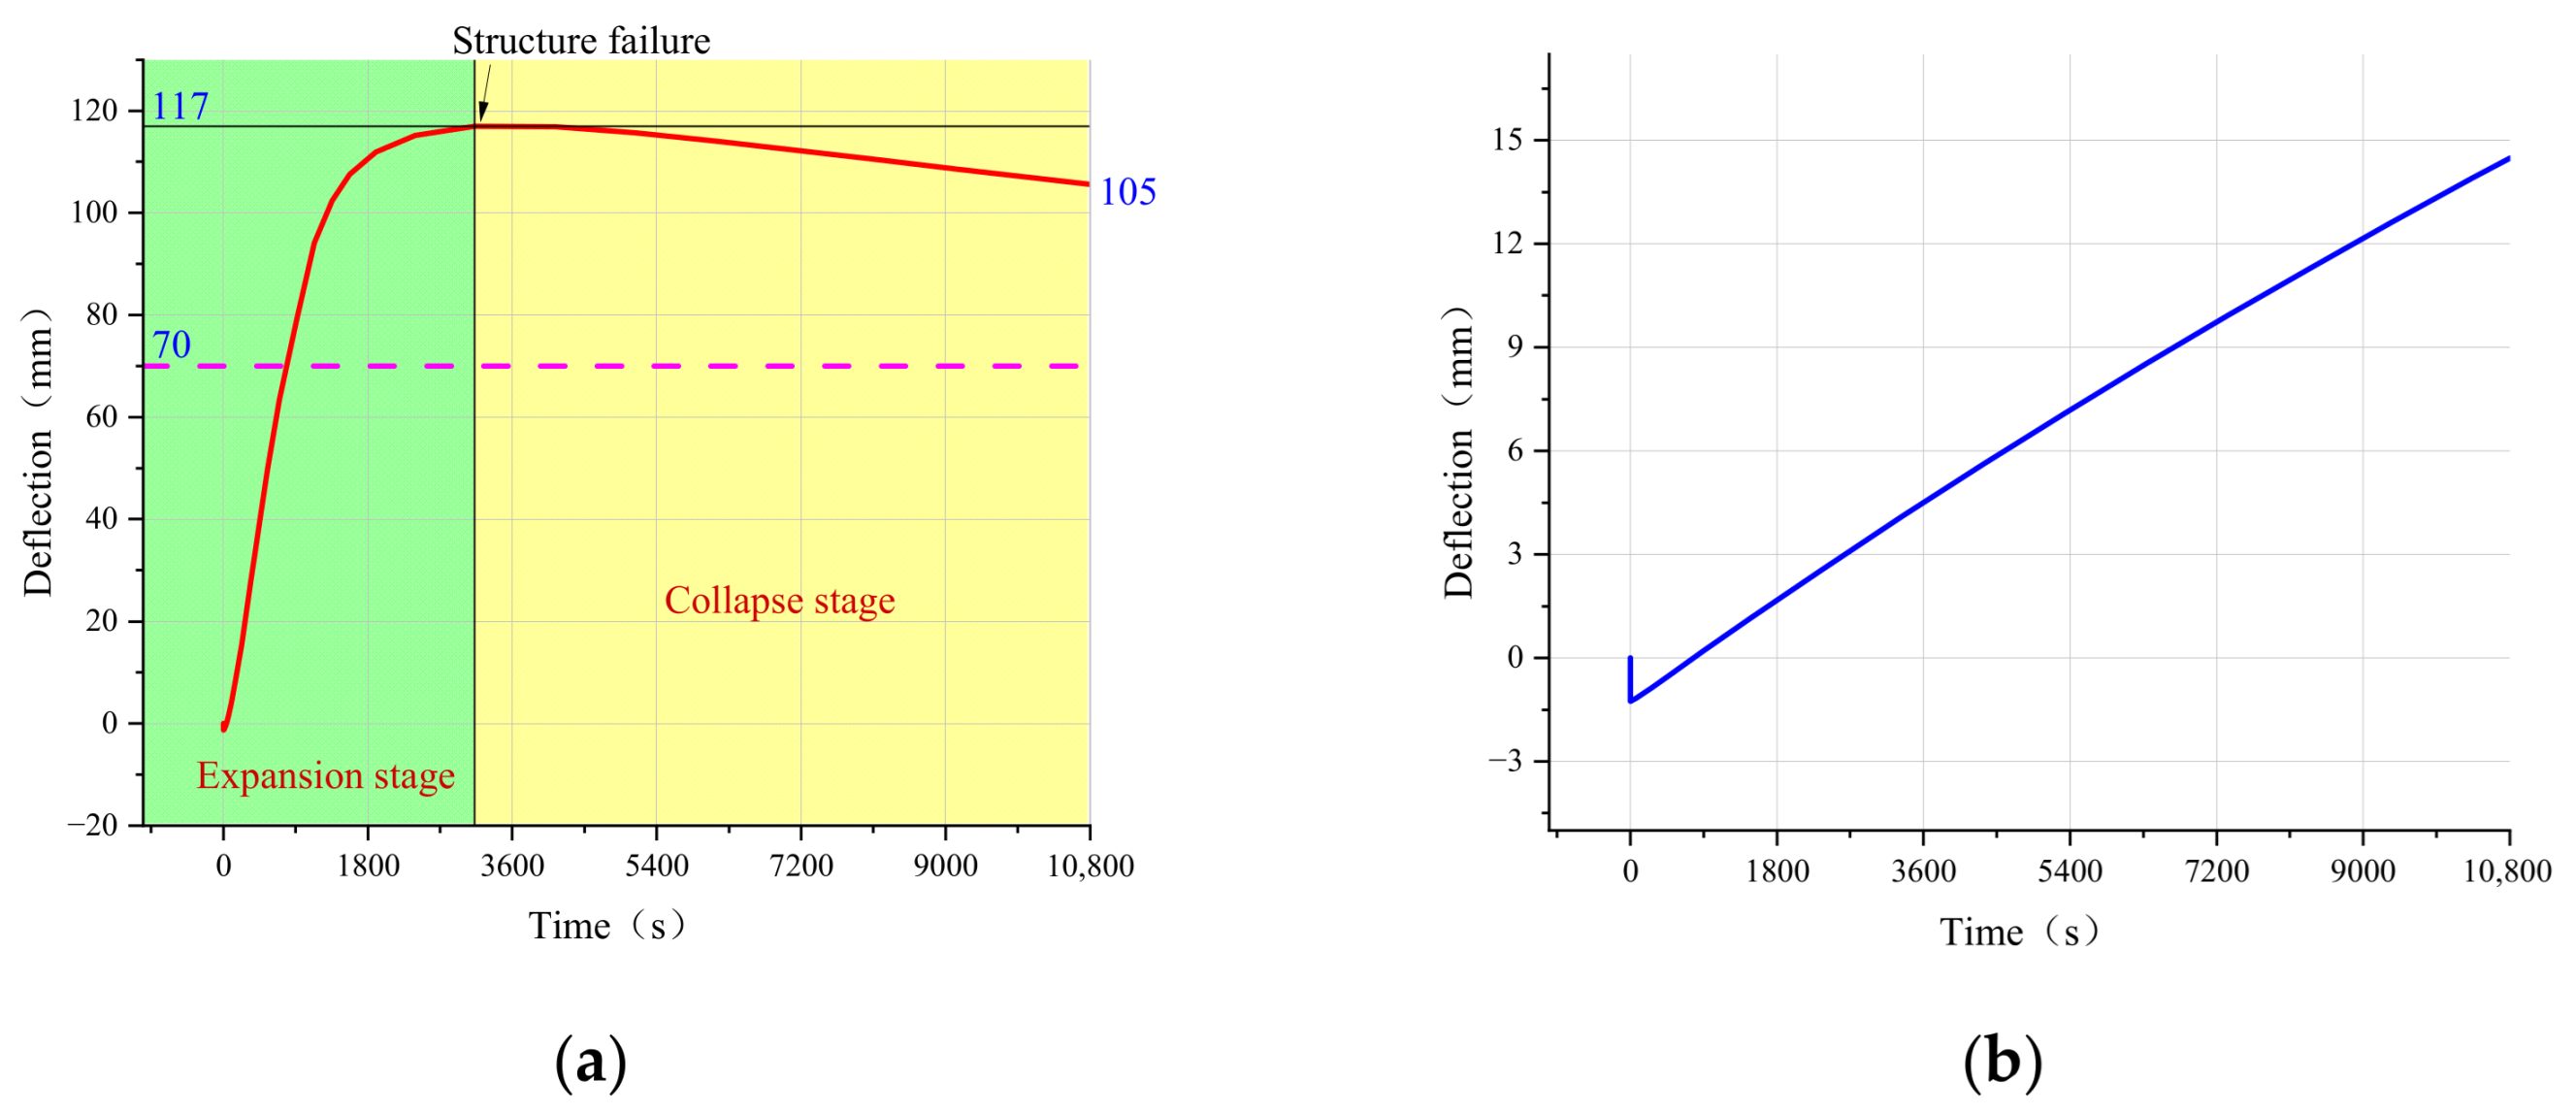
As illustrated in Figure 26 and Figure 27, under the fire scenario of S2, the maximum displacement in the Z directions of S2 is at the top position of the left end of the upper chord of the truss. As shown in Figure 29, the deflection caused by gravity during the early stages of the fire measures −1.3 mm. Following exposure to the heat source, this deflection expands upward to reach 117 mm. At 788 s, the deflection exceeds the critical threshold of 70 mm. Upon heating for 3053 s, the thermal energy from the web member transfers to the chord member, leading to excessively high temperatures in the chord member. This results in a decline in the steel’s performance, causing the gradual failure and collapse of the structure. The collapse progresses relatively slowly, with the deflection reducing from 117 mm to 105 mm.
After the structure is coated with a fire-resistant coating, the entire heating and expansion procedure occurs solely during the upward expansion phase of the structure. Given that the selected node position is in the left upper chord without the constraint of the truss web, the maximum deflection expands from −1.3 mm to 14.5 mm.

4. Conclusions

To analyze the fire resistance performance of the substation framework protected by fire-retardant coating, herringbone column structure substation frameworks under heating curve conditions specified by the ISO 834 standard were simulated using ABAQUS software. Moreover, this study investigated the temperature field, stress field, and displacement characteristics of the substation structure under typical fire scene conditions. The research results indicate the following:
(1)
Regarding the temperature field, the substation framework coated with fire-retardant coating does not experience a sudden temperature rise, and the surface temperature of the steel can be maintained below 310 °C. In contrast, the surface temperature of the bare substation framework reaches 500 °C within a short period; consequently, a large temperature difference between the interior and exterior of the steel pipe is caused, which may induce brittle cracking within the steel.
(2)
Regarding the stress distribution, during the heating time of 10,800 s, the stress in most areas of the steel structure with a fire-retardant coating remain below 170 MPa, and the stress in certain connection areas temporarily exceeds 235 MPa due to the influence of the structural position. In contrast, a sudden stress increase occurs on the surface of the bare substation frame after heating. Within the 1000 s period from the start of heating, the strength of the steel structure decreases with the increase in temperature. Upon reaching the critical stress of 235 MPa, the loss of bearing capacity leads to the collapse deformation of the steel structure.
(3)
Regarding the characteristic deformation, the displacement and deformation of the substation framework with a fire-retardant coating are significantly reduced, and the deformation can be maintained below 0.02 m. In comparison, with the rising temperature, the performance of the bare steel structure declines, stress is gradually concentrated on the steel structure, and the heated part of the bare steel truss undergoes a deformation displacement of more than 0.1 m, making it susceptible to brittle fractures in the steel.
(4)
In terms of overall deformation, all positions of the steel structure with a fire-retardant coating are in the upward expansion stage, and the deflection does not exceed 0.02 m. However, the maximum deflection of steel structures in different scenarios exceeds the critical value of 0.07 m.
This study only investigated the temperature field, stress field, and displacement characteristics of substation structures under ISO 834 standard heating conditions. For real fire accidents, it is necessary to further investigate the characteristics under non-uniform fire exposure conditions while also studying the overall deformation and stress field in the frame under local instability (buckling, connection failure). Finally, it is necessary to conduct full-scale fire tests on the substation structure to verify the accuracy of the simulation results and improve the fire resistance design research of the substation structure.

Author Contributions

Conceptualization, H.Z.; methodology, X.F.; investigation, X.S. All authors have read and agreed to the published version of the manuscript.

Funding

This work was supported by the National Natural Science Foundation of China (U25A20289), the Sichuan Science and Technology Program (2024YFFK0111), and Sichuan Fire Research Institute of MEM Science and Technology Projects (20248815Z).

Data Availability Statement

The original contributions presented in this study are included in the article. Further inquiries can be directed to the corresponding author.

Conflicts of Interest

Author Xinglong Fang was employed by the company Zhejiang Seaport Quzhou Port Co., Ltd., author Xufeng Shen was employed by the company Hangzhou Qianhang Shipyard Company Ltd. The remaining authors declare that the research was conducted in the absence of any commercial or financial relationships that could be construed as a potential conflict of interest.

References

  1. Che, W.; Liang, J.; Deng, J.; Yi, J. Selection of 110 kV Prefabricated Steel Substations Considering Seismic Vulnerability in China. Buildings 2024, 14, 2197. [Google Scholar] [CrossRef] [Scilit]
  2. Ji, J.; Xin, C.; Zhu, H.; Zhu, Z.; Nie, J.; Wang, X. Case study on fire resistance of fire stopping system in Ultrahigh-voltage Direct current converter station. Case Stud. Therm. Eng. 2023, 47, 103082. [Google Scholar] [CrossRef] [Scilit]
  3. Jun, J.; Xin, C.; Lin, L.; Hui, Z.; Jingkai, N.; Yu, H. Fire Risk Assessment and Experimental Study of Transformer Insulating Oil. Adv. Civ. Eng. 2022, 2022, 7185045. [Google Scholar] [CrossRef] [Scilit]
  4. Lou, G.; Wang, C.; Jiang, J.; Jiang, Y.; Wang, L.; Li, G.-Q. Experimental and numerical study on thermal-structural behavior of steel portal frames in real fires. Fire Saf. J. 2018, 98, 48–62. [Google Scholar] [CrossRef] [Scilit]
  5. Kirby, B.R.; Preston, R.R. High temperature properties of hot-rolled, structural steels for use in fire engineering design studies. Fire Saf. J. 1988, 13, 27–37. [Google Scholar] [CrossRef] [Scilit]
  6. Fu, J.-X.; Li, X.-D.; Hwang, W.-S. Study of the Coefficient of Thermal Expansion for Steel Q235. Adv. Mater. Res. 2011, 194–196, 326–330. [Google Scholar] [CrossRef] [Scilit]
  7. Chu, C.; Ye, X.; Fu, B.; Zhang, L.; Gao, W.; Fan, D. Fire resistance of steel beams with integrated fire-resistant and decorative constructions. J. Constr. Steel Res. 2024, 223, 109096. [Google Scholar] [CrossRef] [Scilit]
  8. Lou, G.; Wang, C.; Jiang, J.; Jiang, Y.; Wang, L.; Li, G.-Q. Fire tests on full-scale steel portal frames against progressive collapse. J. Constr. Steel Res. 2018, 145, 137–152. [Google Scholar] [CrossRef] [Scilit]
  9. Jiang, J.; Wang, C.; Lou, G.; Li, G.-Q. Quantitative evaluation of progressive collapse process of steel portal frames in fire. J. Constr. Steel Res. 2018, 150, 277–287. [Google Scholar] [CrossRef] [Scilit]
  10. Li, Z.; Zhu, Y.F.; Liu, Y.; Zhang, H.; Yao, Y. Tensile behavior of bolted-angle connections at high temperatures under progressive collapse scenarios. J. Build. Eng. 2025, 101, 111836. [Google Scholar] [CrossRef] [Scilit]
  11. Wang, F.; Zeng, J.; Zhang, Y.; Xue, Y. Thermal-mechanical response and load-bearing capacity of large-span linings exposed to high temperatures. J. Constr. Steel Res. 2025, 226, 109248. [Google Scholar] [CrossRef] [Scilit]
  12. Palm, J. Temperature analysis using ABAQUS. Fire Technol. 1994, 30, 291–303. [Google Scholar] [CrossRef] [Scilit]
  13. Bolina, F.L.; Fachinelli, E.G.; Pachla, E.C.; Centeno, F.R. A critical analysis of the influence of architecture on the temperature field of RC structures subjected to fire using CFD and FEA models. Appl. Therm. Eng. 2024, 247, 123086. [Google Scholar] [CrossRef] [Scilit]
  14. Ghojel, J.I. A new approach to modeling heat transfer in compartment fires. Fire Saf. J. 1998, 31, 227–237. [Google Scholar] [CrossRef] [Scilit]
  15. Wang, W.; Huang, D.; Wang, Z. Experimental study on fire resistance of high strength Q960 steel columns under axial compression. J. Constr. Steel Res. 2024, 212, 108317. [Google Scholar] [CrossRef] [Scilit]
  16. Shi, D.R.; Hu, X.M.; Hong, W.; Zhang, J.; Du, H. Review of Connections for Timber-Concrete Composite Structures Under Fire. Bioresources 2022, 17, 7250–7266. [Google Scholar] [CrossRef] [Scilit]
  17. Porcari, G.L.F.; Zalok, E.; Mekky, W. Fire induced progressive collapse of steel building structures: A review of the mechanisms. Eng. Struct. 2015, 82, 261–267. [Google Scholar] [CrossRef] [Scilit]
  18. Ding, J.; Li, G.Q.; Sakumoto, Y. Parametric studies on fire resistance of fire-resistant steel members. J. Constr. Steel Res. 2004, 60, 1007–1027. [Google Scholar] [CrossRef] [Scilit]
  19. Meng, Z.; Li, F.; Dong, J.; Chen, D.; Nie, T. Relation between the bending and temperature of coated steel beam in fire test. Procedia Eng. 2014, 84, 840–848. [Google Scholar] [CrossRef] [Scilit]
  20. Xu, Q.; Li, G.-Q.; Wang, Y.C.; Bisby, L. An experimental study of the behavior of intumescent coatings under localized fires. Fire Saf. J. 2020, 115, 103003. [Google Scholar] [CrossRef] [Scilit]
  21. Lucherini, A.; Costa, R.-I.; Giuliani, L.; Jomaas, G. Experimental Study of the Behavior of Steel Structures Protected by Different Intumescent Coatings and Exposed to Various Fire Scenarios. In Proceedings of the 9th International Conference on Structures in Fire (SiF); DEStech Publications, Inc.: Lancaster, PA, USA, 2016; pp. 1065–1072. [Google Scholar]
  22. Bilotta, A.; de Silva, D.; Nigro, E. Tests on intumescent paints for fire protection of existing steel structures. Constr. Build. Mater. 2016, 121, 410–422. [Google Scholar] [CrossRef] [Scilit]
  23. Cirpici, B.K.; Wang, Y.C.; Rogers, B. Assessment of the thermal conductivity of intumescent coatings in fire. Fire Saf. J. 2016, 81, 74–84. [Google Scholar] [CrossRef] [Scilit]
  24. Wu, C.; Zhou, T.; Chen, B.; Liu, Y.; Liang, P. Experimental Study on Burning Characteristics of the Large-Scale Transformer Oil Pool Fire with Different Extinguishing Methods. Fire Technol. 2020, 57, 461–481. [Google Scholar] [CrossRef] [Scilit]
  25. Ji, J.; Nie, J.; Zhu, H.; Han, Y.; Liu, H.; Wang, X. Experimental analysis of intumescence fireproofing coating on base material of substation frames. Case Stud. Therm. Eng. 2024, 64, 105478. [Google Scholar] [CrossRef] [Scilit]
  26. GB 51249-2017; Code for Fire Safety of Steel Structures in Buildings. China Planning Press: Beijing, China, 2017.
  27. Zhai, Z.; Feng, L. Effect of oxygen plasma treatment on bonding strength of epoxy coating on steel substrate. Prog. Org. Coat. 2019, 131, 6. [Google Scholar] [CrossRef] [Scilit]
  28. CEN/TC 250:2024; Eurocode 3—Design of Steel Structures—Part 1–2: Structural Fire Design. European Committee for Standardization: Brussels, Belgium, 2024.
  29. Zhu, H.; Ji, J.; Nie, J.; Xia, Y. Experimental study on temperature control of cable tunnel fire under the combined effect of fine water mist and mechanical ventilation. Electr. Mater. Appl. 2024, 1, e70007. [Google Scholar] [CrossRef] [Scilit]
  30. Quintiere, J.G. Fundamentals of Fire Phenomena; John Wiley & Sons Ltd.: Hoboken, NJ, USA, 2006. [Google Scholar]
  31. Zhu, H.; Zhu, G.; Gao, Y.; Zhao, G. Experimental Studies on the Effects of Spacing on Upward Flame Spread over Thin PMMA. Fire Technol. 2016, 53, 673–693. [Google Scholar] [CrossRef] [Scilit]
  32. Wald, F.; Chlouba, J.; Uhlíř, A.; Kallerová, P.; Štujberová, M. Temperatures during fire tests on structure and its prediction according to Eurocodes. Fire Saf. J. 2009, 44, 135–146. [Google Scholar] [CrossRef] [Scilit]
  33. Zhang, C.; Grosshandler, W.; Sauca, A.; Choe, L. Design of an ASTM E119 Fire Environment in a Large Compartment. Fire Technol. 2020, 56, 1155–1177. [Google Scholar] [CrossRef] [Scilit]
  34. ISO 834:1975; Fire Resisitance Tests—Elements of Building Construction. International Organization for Standardization: Geneva, Switzerland, 1975.
  35. Thomas, G. Modelling thermal performance of gypsum plasterboard-lined light timber frame walls using SAFIR and TASEF. Fire Mater. 2010, 34, 385–406. [Google Scholar] [CrossRef] [Scilit]
Figure 1. Different types of substation frameworks. (a) Steel pipe herringbone column structure; (b) reinforced-concrete pole structure; (c) pull wire structure.
Fire 09 00133 g001
Figure 2. Temperature rise curve specified in ISO 834.
Fire 09 00133 g002
Figure 3. Illustration of substation framework modeling. (a) Overview diagram of substation framework, (b) schematic diagram of connection between steel truss and herringbone column, (c) schematic diagram of steel structure truss, and (d) chord and web dimensions.
Fire 09 00133 g003
Figure 4. Schematic diagram of external static load on substation framework.
Fire 09 00133 g004
Figure 5. Two types of fire scenarios. (a) S1: fully heated truss; (b) S2: heating of one end of truss connecting plate and two unit web members.
Fire 09 00133 g005
Figure 6. Stress distribution diagrams of substation framework under static force.
Fire 09 00133 g006
Figure 7. Cloud map of resultant displacement distribution under static force.
Fire 09 00133 g007
Figure 8. Temperature cloud maps of bare steel at different times in S1. (a) t = 1003 s; (b) t = 1522 s; (c) t = 1716 s; (d) t = 10,800 s; (e) steel pipe section at t = 1003 s; (f) steel pipe section at t = 1522 s; (g) steel pipe section at t = 1716 s; (h) steel pipe section at t = 10,800 s.
Fire 09 00133 g008
Figure 9. Temperature cloud maps at different times under bare steel in S2. (a) t = 1003 s; (b) t = 2008 s; (c) t = 4088 s; (d) t = 10,800 s; (e) connecting plate section at t = 1003 s; (f) connecting plate section at t = 2008 s; (g) connecting plate section at t = 4088 s; (h) connecting plate section at t = 10,800 s.
Fire 09 00133 g009
Figure 10. Temperature cloud maps of steel truss structure coated with fire-retardant coating at different times in S1. (a) t = 1025 s; (b) t = 3025 s; (c) t = 8025 s; (d) t = 10,800 s; (e) steel pipe section at t = 1025 s; (f) steel pipe section at t = 3025 s; (g) steel pipe section at t = 8025 s; (h) steel pipe section at t = 10,800 s.
Fire 09 00133 g010
Figure 11. Temperature cloud maps of steel truss structure with fire-resistant coating at different times in S2. (a) t = 513 s; (b) t = 2337 s; (c) t = 3337 s; (d) t = 10,800 s; (e) connecting plate section at t = 513 s; (f) connecting plate section at t = 2337 s; (g) connecting plate section at t = 3337 s; (h) connecting plate section at t = 10,800 s.
Fire 09 00133 g011
Figure 12. Node selection in different fire scenarios. (a) Nodes 1–3 in S1; (b) Nodes 1–3 in S2.
Fire 09 00133 g012
Figure 13. Temperature variation curves of nodes under two fire scenarios. (a) Temperature variation curve of nodes in S1; (b) temperature variation curve of nodes in S2.
Fire 09 00133 g013
Figure 14. Stress cloud maps at different times under bare steel in S1. (a) t = 656.8 s; (b) t = 1003 s; (c) t = 2446 s; (d) t = 10,800 s.
Fire 09 00133 g014
Figure 15. Stress cloud maps at different times under bare steel in S2. (a) t = 426.1 s; (b) t = 1003 s; (c) t = 2446 s; (d) t = 10,800 s.
Fire 09 00133 g015
Figure 16. Stress cloud maps at different times under condition of fire-resistant coating in S1. (a) t = 1.0 s; (b) t = 513.0 s; (c) t = 8025.0 s; (d) t = 10,800.0 s.
Fire 09 00133 g016
Figure 17. Stress cloud maps at different times under condition of fire-resistant coating in S2. (a) t = 897 s; (b) t = 1473 s; (c) t = 9337 s; (d) t = 10,800 s.
Fire 09 00133 g017
Figure 18. Schematic diagram for selecting location nodes under fire scenarios. (a) Schematic diagram of node selection in S1; (b) schematic diagram of node selection in S2.
Fire 09 00133 g018
Figure 19. Stress variation curves of nodes under two different fire scenarios. (a) Stress variation curves of nodes in S1; (b) stress variation curves of nodes in S2.
Fire 09 00133 g019
Figure 20. Displacement cloud maps of bare steel at 10,800 s in S1. (a) Resultant displacement; (b) X-axis direction; (c) Y-axis direction; (d) Z-axis direction.
Fire 09 00133 g020
Figure 21. Displacement cloud maps at 10,800 s under bare steel conditions in S2. (a) Resultant displacement; (b) X-axis direction; (c) Y-axis direction; (d) Z-axis direction.
Fire 09 00133 g021
Figure 22. Resultant displacement cloud maps of substation structure with fire-resistant coating at 10,800 s under two fire scenarios: (a) S1; (b) S2.
Fire 09 00133 g022
Figure 23. Schematic diagram of path selection.
Fire 09 00133 g023
Figure 24. Three-dimensional curve diagram of displacement changes in structure with fire-resistant coating in S1. (a) Displacement of Path 2 in Y direction; (b) displacement of Path 3 in Y direction; (c) deformation of web member in Y direction; (d) displacement of Path 1 in Z direction; (e) displacement of Path 2 in Z direction; (f) deformation of web member in Z direction.
Fire 09 00133 g024
Figure 25. Three-dimensional curve diagrams of displacement changes in structure with fire-retardant coating in S1. (a) Displacement of Path 2 in Y direction; (b) displacement of Path 3 in Y direction; (c) deformation of web member in Y direction; (d) displacement of Path 1 in Z direction; (e) displacement of Path 2 in Z direction; (f) deformation of web member in Z direction.
Fire 09 00133 g025
Figure 26. Three-dimensional curve diagrams of displacement changes in structure with fire-resistant coating in S2. (a) Displacement of Path 2 in Y direction; (b) displacement of Path 3 in Y direction; (c) deformation of web member in Y direction; (d) displacement of Path 1 in Z direction; (e) displacement of Path 2 in Z direction; (f) deformation of web member in Z direction.
Fire 09 00133 g026
Figure 27. Three-dimensional curve diagrams of displacement changes in structure with fire-retardant coating in S2. (a) Displacement of Path 2 in Y direction; (b) displacement of Path 3 in Y direction; (c) deformation of web member in Y direction; (d) displacement of Path 1 in Z direction; (e) displacement of Path 2 in Z direction; (f) deformation of web member in Z direction.
Fire 09 00133 g027
Figure 28. Curve of maximum deflection point change in substation framework in S1. (a) Maximum deflection of substation framework without fire-retardant coating; (b) maximum deflection of substation framework with fire-retardant coating.
Fire 09 00133 g028
Figure 29. Curves of maximum deflection point changes in structure in S2. (a) Maximum deflection of substation framework without fire-retardant coating; (b) maximum deflection of substation framework with fire-retardant coating.
Fire 09 00133 g029
Table 1. Physical parameters of Q235 steel.
Poisson’s RatioDensityThermal Conductivity CoefficientThermal Expansion CoefficientSpecific Heat Capacity
νsρs/kg/m3λs/W/(m·°C)αsCs/J/kg (°C)
0.37850451.4 × 10−5600
Table 2. Thermal boundary condition.
Radiation CoefficientConvective Heat Transfer Coefficient
Fire-facing surfaceBackfire surfaceFire-facing surfaceBackfire surface
0.80.6259
Table 3. Fire-retardant coating parameters.
Density (kg/m3)Effective Thermal Conductivity (W/(m·K))Specific Heat Capacity (kJ/(kg·K))
15000.251.05
Disclaimer/Publisher’s Note: The statements, opinions and data contained in all publications are solely those of the individual author(s) and contributor(s) and not of MDPI and/or the editor(s). MDPI and/or the editor(s) disclaim responsibility for any injury to people or property resulting from any ideas, methods, instructions or products referred to in the content.