Article

Evaluation of the Relationship Between Escape Passage Length and Fire Door Pressure Difference
1
School of Environment and Architecture, University of Shanghai for Science and Technology, Shanghai 200093, China
2
State Grid Shanghai Municipal Electric Power Company, Shanghai 201899, China
3
School of Environmental Science and Engineering, Donghua University, Shanghai 201620, China
*
Author to whom correspondence should be addressed.
Submission received: 20 December 2025 / Revised: 16 January 2026 / Accepted: 22 January 2026 / Published: 25 January 2026
(This article belongs to the Special Issue Modeling, Experiment and Simulation of Tunnel Fire)

Abstract

The issue of overpressure at fire doors in escape passage is often overlooked in traditional tunnel design. Current design approaches tend to overemphasize maintaining positive pressure inside the passage for smoke prevention, which results in excessive resistance when opening fire doors. This can hinder emergency evacuation efficiency and pose a threat to personnel safety. This study focused on a typical 1000-m-long straight escape passage to investigate the overpressure problem of fire doors in highway tunnels from both theoretical and empirical perspectives. Traditional pressure calculations for tunnel escape passages adopt relevant guiding designs from the building category, which may lead to certain errors. Therefore, on this basis, this paper employs pressure calculation equations based on the specific pipeline characteristics of smoke control systems. By solving the pressure calculation equations for the fire doors in escape passages, the thrust required to open the doors in the closed state was analyzed. Results show that the force needed to open a fire door can reach up to 168 N under fire conditions, which far exceeds the allowable limits stipulated in relevant design standards. Furthermore, the results indicate that the maximum allowable length of the escape passage should not exceed 3200 m within acceptable pressure limits through numerical simulation. A mathematical relationship between passage length and fire door pressure was also established, confirming the accuracy of the maximum allowable passage length. This study analyzed the hazards of overpressure in escape passages and proposes a method for determining the maximum permissible passage length, aiming to balance the requirements of smoke control with the safety of personnel evacuation.

1. Introduction

With the advancement of modern urban construction, underground tunnels have become critical components of transportation infrastructure, playing an essential role in safeguarding human life and property. However, during tunnel fires, high-temperature smoke can severely reduce visibility, posing a significant threat to occupants due to the confined space, limited evacuation exits, and high occupant density [1].
Within tunnels, escape passages serve as critical facilities for responding to emergencies such as fires, providing occupants with a fast and safe evacuation route under critical conditions [2]. These passages are generally designed to be smoke-free, independent corridors with pressurized ventilation systems to ensure clean air during evacuation. Some studies have investigated the predicted pressure differential using longitudinal ventilation in the Marao and Gardunha tunnels [3], and have retrofitted the ventilation system in the Karavanke tunnel using four axial flow fans and a simple duct model [4]. Their effectiveness in protecting life heavily depends on air pressure differentials and structural reliability under fire scenarios. However, fire doors—acting as barriers between escape passages and fire-affected areas—have pressure control requirements that significantly impact occupant safety [5]. These doors not only isolate smoke but must also remain operable under emergency conditions. Improper pressure control can directly affect evacuees’ ability to open them.
The pressure at fire doors between tunnel and escape passage must be strictly controlled within a reasonable range. For example, smoke generated by fire in the tunnel may infiltrate the escape passage when the pressure is lower than 30 Pa, which pollutes the air inside escape passage and severely threatening breathing safety and evacuation efficiency. In addition, this smoke backflow can occur rapidly due to fire-induced pressure gradients, particularly in long or poorly ventilated tunnels. Conversely, when the pressure is too high (>110 N), the resistance to opening the fire door increases significantly, making it difficult or even impossible for evacuees to open the door, potentially rendering the escape route ineffective [6]. It is noteworthy that the force required to open fire doors varies across different standards in different countries. The Technical Standard for Smoke Management Systems in Buildings [7] specifies that the total thrust for a door is generally set at 110 N; the Handbook of Mechanical Design [8] provides a limit of 113 N for the standing arm thrust of Chinese adults (both male and female); NFPA 1 Fire Code [9] in the United States stipulates that the force to open any door of a safety escape facility shall not exceed 133 N; and the Ventilation and Air Conditioning Design Manual [10] states that the door-opening force for fire doors in pressurized spaces should not exceed 98 N. This issue is especially critical for the elderly, children, and individuals with limited mobility, for whom excessive door-opening forces may pose life-threatening delays. However, current codes and design manuals focus primarily on providing guidance for calculating pressurized air supply volumes, and lack clear and explicit methods for calculating the pressure of pressurized air supply systems.
Currently, the design of escape passage typically prioritizes preventing smoke leakage, often by setting high positive pressure values to block smoke intrusion [11]. For example, the retrofitted Albula escape tunnel has been equipped with an overpressure ventilation system, and the optimal ventilation strategy for this tunnel has been determined [12]. While effective in theory, such high pressurization may result in overpressure conditions that exceed human door-opening capabilities, especially when evacuation must be quick and unassisted. However, this design approach overlooks the fact that excessive pressure may hinder the opening of fire doors. In practice, the selection of pressurization fans is usually based on the airflow speed, volume, and pressure required under intermittent door-opening scenarios [13]. These parameters are often derived from empirical values or simplified simulations that may not fully account for transient fire dynamics. Nevertheless, when fire doors are in the closed state, the continuous operation of pressurization fans inevitably leads to overpressure in the air supply region. This overpressure not only affects the operability of fire doors but is also a critical indicator of the rationality of smoke control system design [14]. If not effectively mitigated, such overpressure may compromise system efficiency, energy usage, and overall evacuation safety.
Therefore, this study focuses on a typical escape passage to analyze the issue of fire door overpressure for bridging the gap between fire safety theory and tunnel engineering practice: (1) the dynamic characteristics of opening resistance for fire door under fire conditions; (2) the maximum allowable length of escape passages under pressure constraints; (3) the mathematical relationship between the length of escape passage and fire door pressure.
By combining theoretical calculations, numerical simulations, and validation analyses, this study systematically examines the pressure distribution of fire doors within pressurized air supply systems. It derives a quantitative relationship between passage length and fire door pressure and validates the reliability of the model through relevant case studies. The proposed model not only reveals the coupling between airflow dynamics and structural dimensions but also provides design thresholds to avoid overpressure. The findings aim to provide a scientific reference for the design of tunnel smoke control systems, enhancing both safety performance and engineering feasibility under real fire scenarios.

2. Parameters of Escape Passage

2.1. Escape Passage Model

This study analyzed a typical straight escape passage. For highway tunnels, the Shanghai Standard for Road Tunnel Design Code [15] indicates that 1000 m serves as the demarcation point between medium and long tunnels. Short tunnels (generally within a few hundred meters) can rely on natural ventilation to ensure air quality. However, beyond a certain length (typically with a critical point around 800–1000 m), natural ventilation becomes insufficient, making the installation of a mechanical ventilation system mandatory. Therefore, a tunnel length of approximately 1000 m is a crucial turning point and marks the starting point for discussing complex ventilation system design.
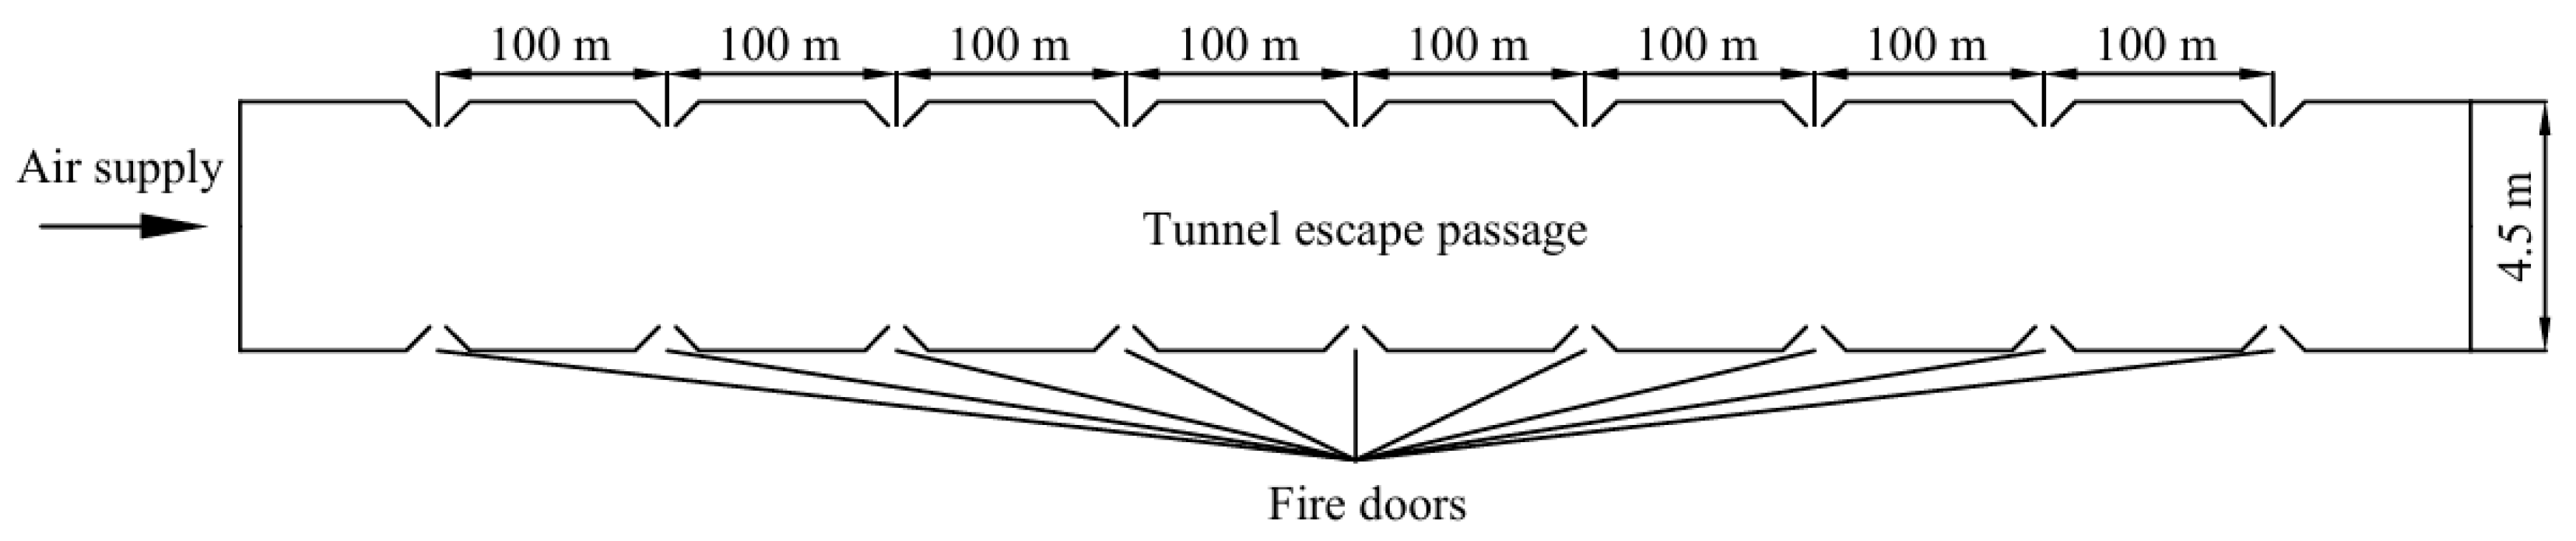
As shown in Figure 1, the geometric dimensions of the passage are 2.5 m (height) by 2 m (width) by 1000 m (length). Eighteen fire doors are evenly and symmetrically distributed on both sides of the passage, where a distance of 100 m between any two fire doors. Each fire door is a standard double-leaf fire door (2.1 m by 2 m) with a door gap width of 0.004 m. In the event of a fire, it is essential to maintain a certain positive pressure inside the escape passage compared to tunnel for effectively preventing smoke from entering [16]. This is achieved by installing a mechanical pressurized air supply outlet at the entrance of the passage. The pressurization system can continuously supply clean air into the escape passage, which creates a pressure gradient across the fire doors. Therefore, the pressurization system ensures that smoke generated by the fire cannot infiltrate the escape passage through the gap of fire door, thereby protecting the respiratory safety of evacuees and maintaining the operability of the escape passage.
Under pressurized air supply conditions, the pressure distribution within the escape passage can be described using the mass conservation equation and Bernoulli’s equation [17]. In a closed system, the pressure distribution is primarily influenced by the following parameters: the air supply volume, leakage through fire door gaps, and frictional resistance within the passage [18].

2.2. Determination of Pressurized Air Supply Volume

In the design of pressurized air supply systems for escape passage, calculating airflow based solely on the specified velocity at the doorway is often insufficient [19]. This singular approach fails to comprehensively account for the dynamic airflow characteristics when doors are open, which can lead to actual airflow speeds falling short of design requirements during operation—ultimately compromising smoke control effectiveness and safety within the escape passage.
When a fire door is opened, the pressure in the doorway region drops rapidly, as part of the pressurized airflow is released into the external environment. However, areas farther from the door retain a certain level of static pressure due to airflow inertia and pressure distribution characteristics. Additionally, when the fire door is closed, leakage through door gaps still occurs. This infiltrating airflow significantly influences the airflow distribution near the door once it is opened, resulting in a deviation between actual and target doorway air velocity [20].
To ensure that airflow within the escape passage meets smoke control requirements under open-door conditions, the pressurized air supply volume should consist of the following two main components: (1) Doorway airflow: This is the airflow required to maintain the specified air velocity through the doorway when the fire door is open. It depends primarily on the door dimensions, design velocity, required pressure differential, and the duration for which the door remains open [21]. (2) Leakage air flow rate: This refers to the airflow that leaks through the fire door gaps while the doors are open [22]. Although relatively small, this component can have a significant impact under high-pressure conditions and must be accounted for in airflow calculations.
In practical engineering applications, leakage air flow rate is mainly concentrated at the door gaps. Air leakage from other components—such as wall joints or non-sealed regions—has a relatively minor impact on the total system airflow and can be neglected within the tolerances of engineering practice. This simplification reduces computational complexity while maintaining feasibility for implementation
The total airflow Q of the pressurized air supply system can therefore be expressed as:
Q = Q o p e n + Q l e a k
where Q is the total air flow rate of pressurized air supply system in m3/h; Qopen is the air flow rate of door opening in m3/h; Qleak is the leakage air flow rate through the door in m3/h.
The airflow required for the fire door opening at the specified velocity can be calculated using the following equation:
Q o p e n = A × v × N
where A is the area of fire door opening in m2; v is the air velocity at the opening of the door in m/s; N is the number of fire doors opened.
The total leakage air flow rate through other doors under the specified velocity conditions when one door is open can be calculated using the following equation:
Q l e a k = 0.827 × A 1 × Δ P 1 n × 1.25 × N 2
where A1 represents the effective leakage area of each evacuation door in m2, with the gap width of the door taken to be between 2 mm and 4 mm; ΔP is the average pressure difference for calculating the leakage air flow rate in Pa. When the wind speed at the opened doorway is 0.7 m/s, ΔP is taken as 6.0 Pa; when the wind speed is 1.0 m/s, ΔP is 12.0 Pa; and when the wind speed is 1.2 m/s, ΔP is 17.0 Pa. n is the exponent (typically taken as n = 2); 1.25 is an additional coefficient for leakage; and N2 is the number of fire doors closed. For stairwells with continuously open vents, N2 is taken as the total number of doors in the pressurized stairwell minus the total number of doors on the floors.
To ensure that the selected fan model can handle the majority of tunnel fire scenarios, the fan airflow volume in this study is calculated based on the simultaneous opening of three fire doors within the escape passage. According to the Technical Standards for Smoke Control and Smoke Extraction Systems in Buildings, the airflow velocity at the doorway leading to an evacuation path should not be less than 1.0 m/s. In addition, the design airflow of the smoke extraction system should be no less than 1.2 times the calculated system airflow [23].
Therefore, in this study, the airflow velocity at the fire door opening is set to 1.0 m/s, and the average internal pressure difference ΔP within the escape passage is taken as 12 Pa. According to Equations (2) and (3) mentioned earlier, the required airflow for the open fire doors Qopen is calculated to be 45,360 m3/h, and the total leakage air flow rate from the remaining fire doors is 7967 m3/h. The total calculated airflow for the pressurized air supply system is thus 53,327 m3/h. Taking into account the required safety margin (1.2 times), the final design airflow rate for the pressurized air supply system is 63,992 m3/h.

3. Calculation Method of Fire Door Pressure in Escape Passages

3.1. Determination of the Pressurized Air Supply System

The selection of a fan must be based on both the system’s design airflow rate and the required system pressure. If the total pressure of the selected fan is excessively higher, the residual pressure within the escape passage is higher, which may increase the force required to open fire doors for evacuees. In this situation, the safety of the personnel will be threatened. On the other hand, If the total pressure of the selected fan is lower, it may fail to maintain adequate positive pressure within the escape passage, which allow smoke to infiltrate through door gaps or other openings, which compromises occupants’ respiratory safety. Additionally, insufficient air supply and system instability may occur. Therefore, pressure calculation for the pressurized air supply system is a critical aspect of system design and operation, directly affecting the smoke control performance of the escape passage and the reliability of safe evacuation [24].
According to the Design Guidelines for Ventilation of Highway Tunnels, the mechanical pressurized air supply smoke control system should not exceed an airflow velocity of 7.0 m/s inside the escape passage [25]. According to the design rules of airflow rate and the dimensions of the escape passage, the airflow velocity inside the passage is calculated as 3.56 m/s. The air supply outlet for the escape passage has a cross-sectional area of 1.6 m2. The passage interior uses rough concrete wall surfaces with an average surface roughness of 3 mm.
The resistance coefficient along the straight duct can be calculated according to the following equation:
λ = 1 ( 1.1138 2 lg Δ D ) 2
where Δ is the average wall roughness in mm; D is the equivalent diameter of air duct section in m.
The friction resistance per unit pipe length along the way (Δpm), it can be calculated as follows:
Δ p m = λ D V 2 2 ρ
where λ is the frictional resistance coefficient; ρ is the air density in kg/m3; D is the equivalent diameter of air duct section in m.
The friction loss along the duct (ΔPm) in Pa, it can be calculated as follows:
Δ P m = Δ p m l
where Δpm is the friction resistance per unit pipe length along the way in Pa/m; l is the air duct length in m.
The local pressure loss of the system (ΔPj) in Pa, it can be calculated as follows:
Δ P j = ξ V 2 ρ 2
where ξ is the coefficient of local resistance; V is the air flow velocity where local pressure loss occurs in the air duct in m/s; ρ is the air density in kg/m3.
According to the design air flow rate, the pressure calculation of the pressurized air supply system in the escape passage is carried out, the specific calculation results are shown in Table 1.
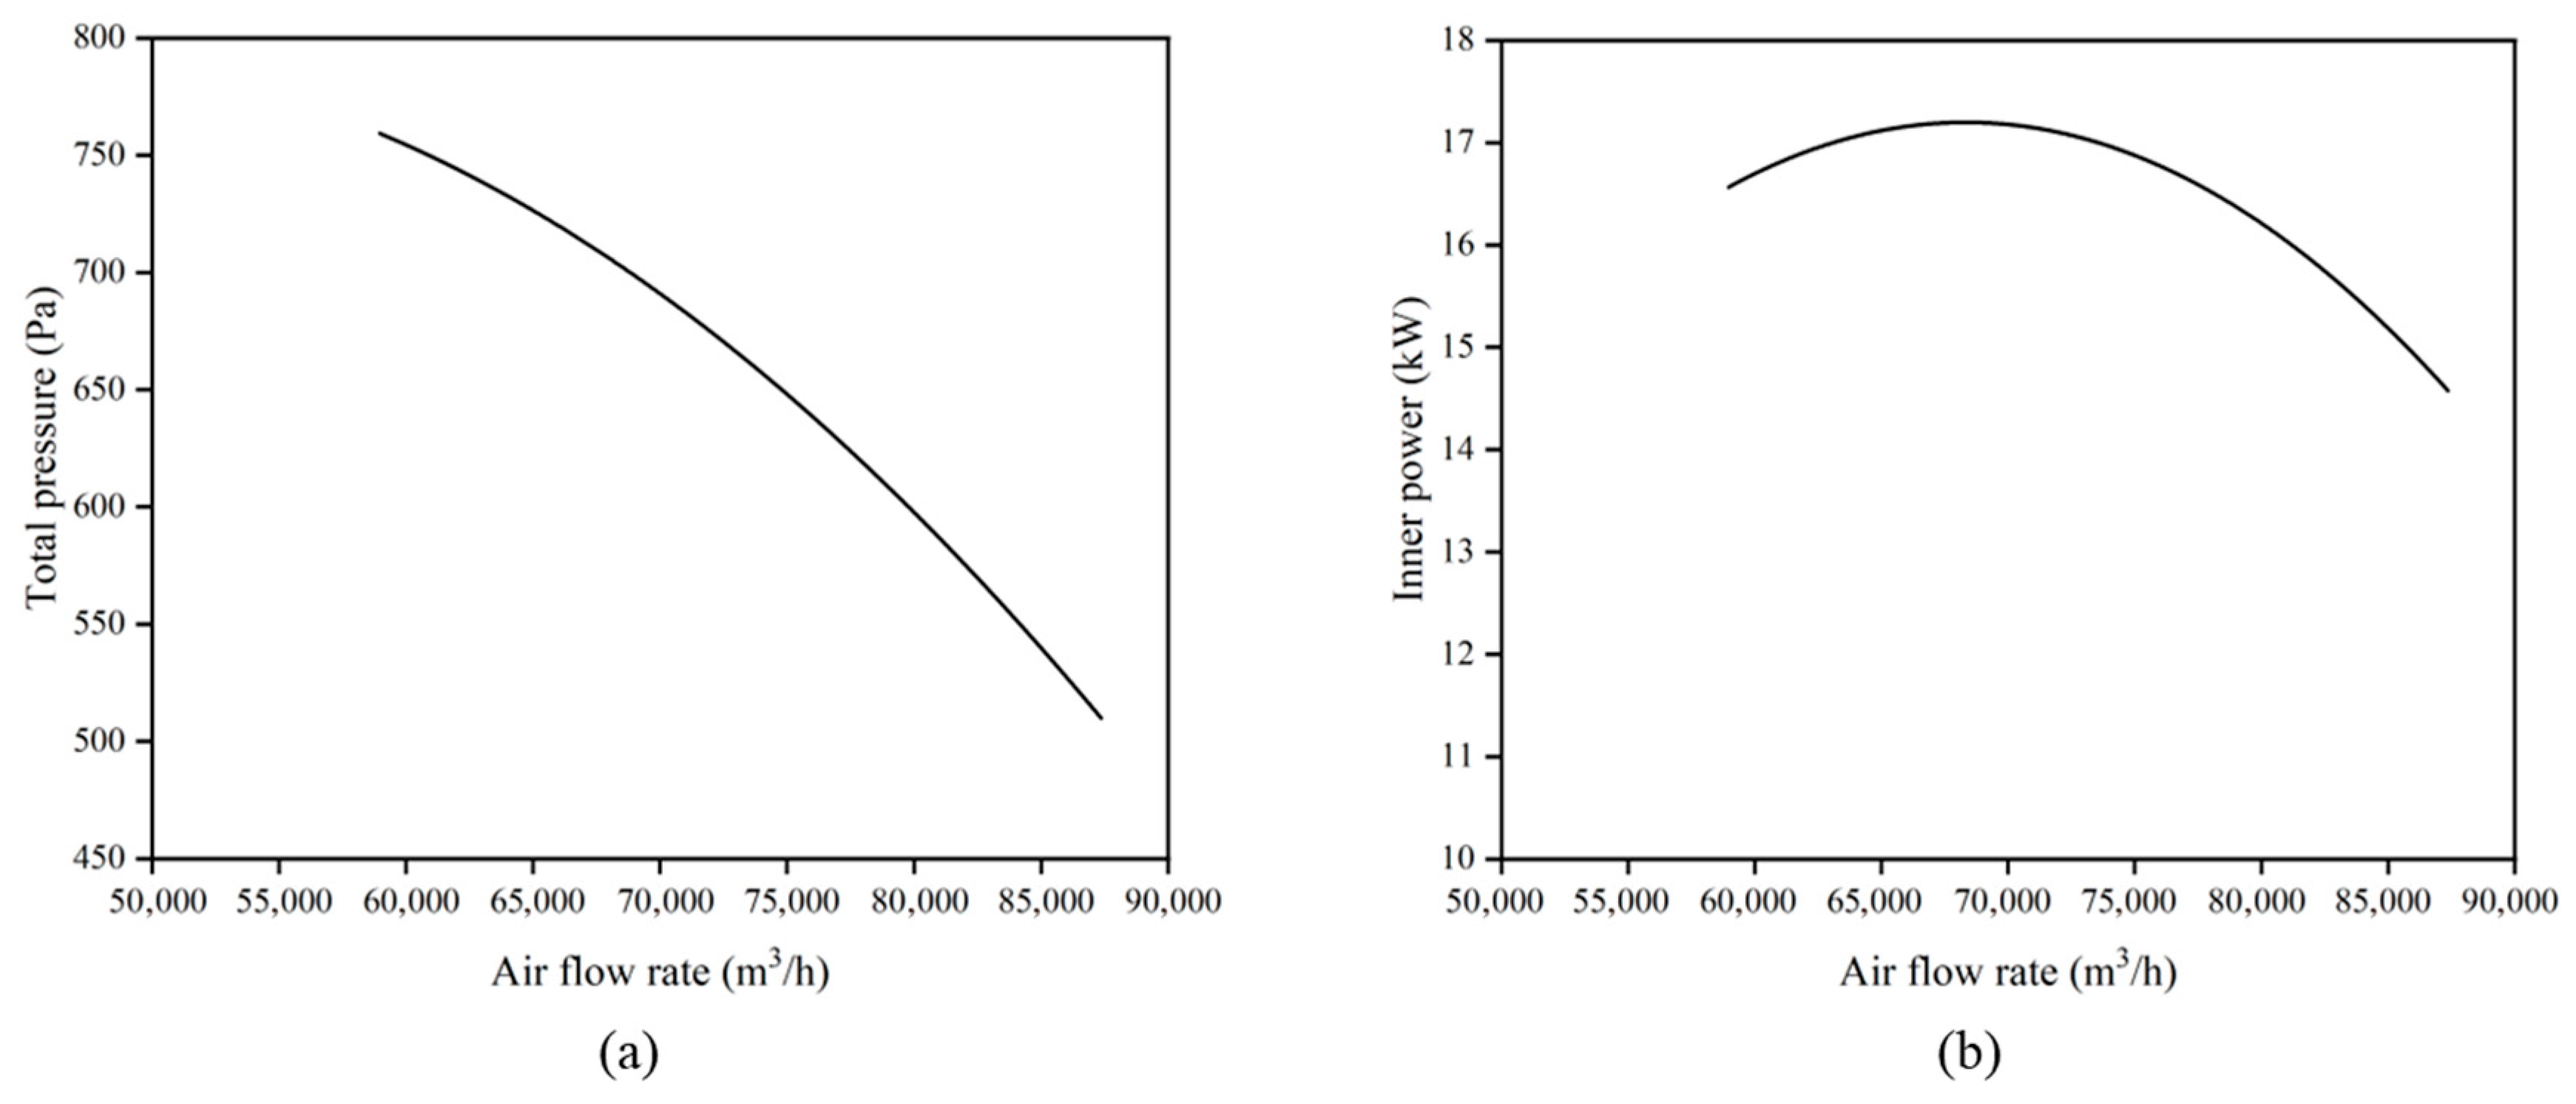
The airflow velocity at the doorway of the fire door in the escape passage, when it is open, is 1.0 m/s, and the average internal pressure difference ΔP within the escape passage is 12.0 Pa. From the results in Table 1, the total system resistance loss of the escape passage when the door is open is 641 Pa. In this study, the safety factor for wind pressure is taken as 1.15 [26], and based on the above data, the calculated fan design pressure is 737 Pa. The SZF-1 axial type fan, selected with a design airflow of 63,992 m3/h, has the following specific parameters: rotation speed of 970 r/min, airflow range of 58,968~87,360 m3/h, total pressure range of 503~755 Pa, and power of 22 kW. The performance curve of this fan model and the operating conditions for both the open-door and closed-door states are shown in Figure 2 and Table 2, respectively.

3.2. Pressure Difference Across the Fire Door

Based on the selected SZF-1 axial type fan, the fan airflow and total pressure at the fire door in the escape passage when open are denoted as Qo and Po, respectively. When a fire occurs, the fan begins to operate, but the fire door remains closed, resulting in changes in the pipeline characteristics of the escape passage. This is mainly manifested by an increase in the local resistance inside the passage, leading to a rise in residual pressure [27]. In this situation, the fan’s operating conditions no longer align with those when the fire door is open, and the system must reach a new dynamic equilibrium point to adapt to this change. At the new equilibrium point, the fan’s output airflow and total pressure are denoted as Qc and Pc, respectively, to describe the system’s operating characteristics at that moment.
In the case where the fire door is closed, the airflow inside the escape passage is obstructed, and the resulting local resistance directly reflects the actual pressure difference ΔP inside the escape passage. To study this phenomenon, this research establishes a complete control volume model based on fluid dynamics principles, from the fan’s fresh air inlet to the escape passage fire door. Using the laws of mass conservation and energy conservation, a set of pressure calculation equations for the escape passage is developed, and these equations are solved for analysis.
The mathematical relationship is as follows:
Q c = α v ¯ A
Δ P = ξ ρ 2 v ¯ 2
β ( Δ P + ξ i ρ 2 v i 2 + R i ) = W η 0 α v ¯ A
where Qc is the system air flow rate of closed state in m3/s; α is the safety factor of leakage air flow rate, taken as 1.5; β is the safety factor of air pressure, taken as 1.15, v ¯ is the average air velocity of door seam in m/s; A is the flow area of door seam in m2; ΔP is the actual pressure difference in the air supply area in Pa; ξ is the coefficient of local resistance; R is the on-way resistance loss in Pa; W is the internal power of fan in W; η0 is the internal efficiency of fan.
By solving Equations (8)–(10), the pressure calculation results for the system in the closed-door state are obtained, as shown in Table 3; the specific results of the pressure calculation are provided in Table 4.
The positive pressure within the escape passage is not constant but dynamically adjusted in response to system operating conditions and external influences. To effectively prevent smoke from entering the escape passage while ensuring that evacuees can easily open fire doors during emergencies, the positive pressure inside the passage must be strictly maintained within an appropriate range. On one hand, according to building fire protection design standards, a separate mechanical pressurized air supply system should be installed in tunnel refuge facilities, and the residual pressure of the supplied air should be between 30 Pa and 50 Pa [28].
On the other hand, the maximum allowable pressure difference across the fire door can be calculated using the following equations:
P = 2 × ( F F d c ) × ( W m d m ) W m × A m
F d c = M W m d m
where P is the maximum allowable pressure differential of the door in Pa, F′ is the total thrust of the door in Newton, generally taken as 110 N, Fdc is the force required to overcome the door closer at the door handle in Newton, Wm is the width of a single door leaf in m, Am is the area of the door in m2, dm is the distance from the door handle to the door latch in m, M is the opening torque of the door closer in N·m.
Based on the calculation results from Equations (11) and (12), the maximum allowable pressure difference for the fire door in the control volume is 74 Pa. However, the results listed in Table 4 indicates that the actual pressure difference inside the escape passage has already reached 95 Pa, which far exceeds the allowed maximum range of 74 Pa. This indicates that there may be problems with the current system design, potentially preventing fire doors from opening properly and thus jeopardizing the safety of escape passages. Therefore, the system must be optimized and adjusted to ensure that the pressure difference remains within a reasonable range, thereby guaranteeing safe evacuation and the proper functioning of fire doors.
The calculation of the opening force can be seen in Equations (13)–(15):
F = F p + F c + F f
F p = Δ P ( B × A ) / 2 ( B d )
F c = M / ( B d )
where F is the fire door opening force in N; Fp is the component force formed by the pressure difference in the air supply, which is calculated to be 106 N, Fc is the anti-deduction force of the door closer, which is calculated to be 48 N; Ff is the friction component of the pivot system, and the general assembly level can be 14 N according to the engineering measurement; ΔP is the pressure difference on both sides of the fire door, and the calculation result of the control body is 95 Pa; M is the opening torque of the fire door closing device, corresponding to No.3 door closing device 45 N·m; B is the single door width, 1.0 m; d is the distance from door handle to open side door, taken as 60 mm; A is the area of a single door, 2.1 m2.
Based on the calculation results from Equations (13)–(15), the force required to open the fire door in the current escape passage is 168 N, which far exceeds the maximum pushing force that an average adult can exert. According to relevant design standards, this indicates a severe overpressure issue in the escape passage system. It is particularly important to note that excessively high opening pressure can have dual adverse effects on both evacuees and equipment. On one hand, the high opening force may exceed the range of force that people can tolerate, making it difficult to open the fire doors during an emergency and thus obstructing evacuation. On the other hand, systems operating under high pressure conditions can increase mechanical wear on door hinges and closers, shortening the lifespan of the equipment [29]. Therefore, reasonable control of the pressure difference in the air supply area is not only essential for ensuring the normal operation and performance of the system but also a critical prerequisite for ensuring the safe evacuation of personnel. Consequently, strict control of the pressure difference should be implemented during the design and operation phases to avoid potential safety hazards.

4. Relationship Between the Length of Escape Passage and the Pressure Difference Across Fire Door

In the design of escape passage, the control of fire door pressure is a core issue in balancing smoke prevention performance with evacuation safety. To address this, the present study establishes models for escape passage of varying lengths and systematically analyzes how the fire door pressure changes with the length of the passage. Through numerical simulations, the mathematical relationship between the escape passage length and the fire door pressure is derived. The models and grids for this study were created using ICEM software, and the numerical simulations were conducted using the Fluent software within the CFD framework.

4.1. Establishment of Passage Model

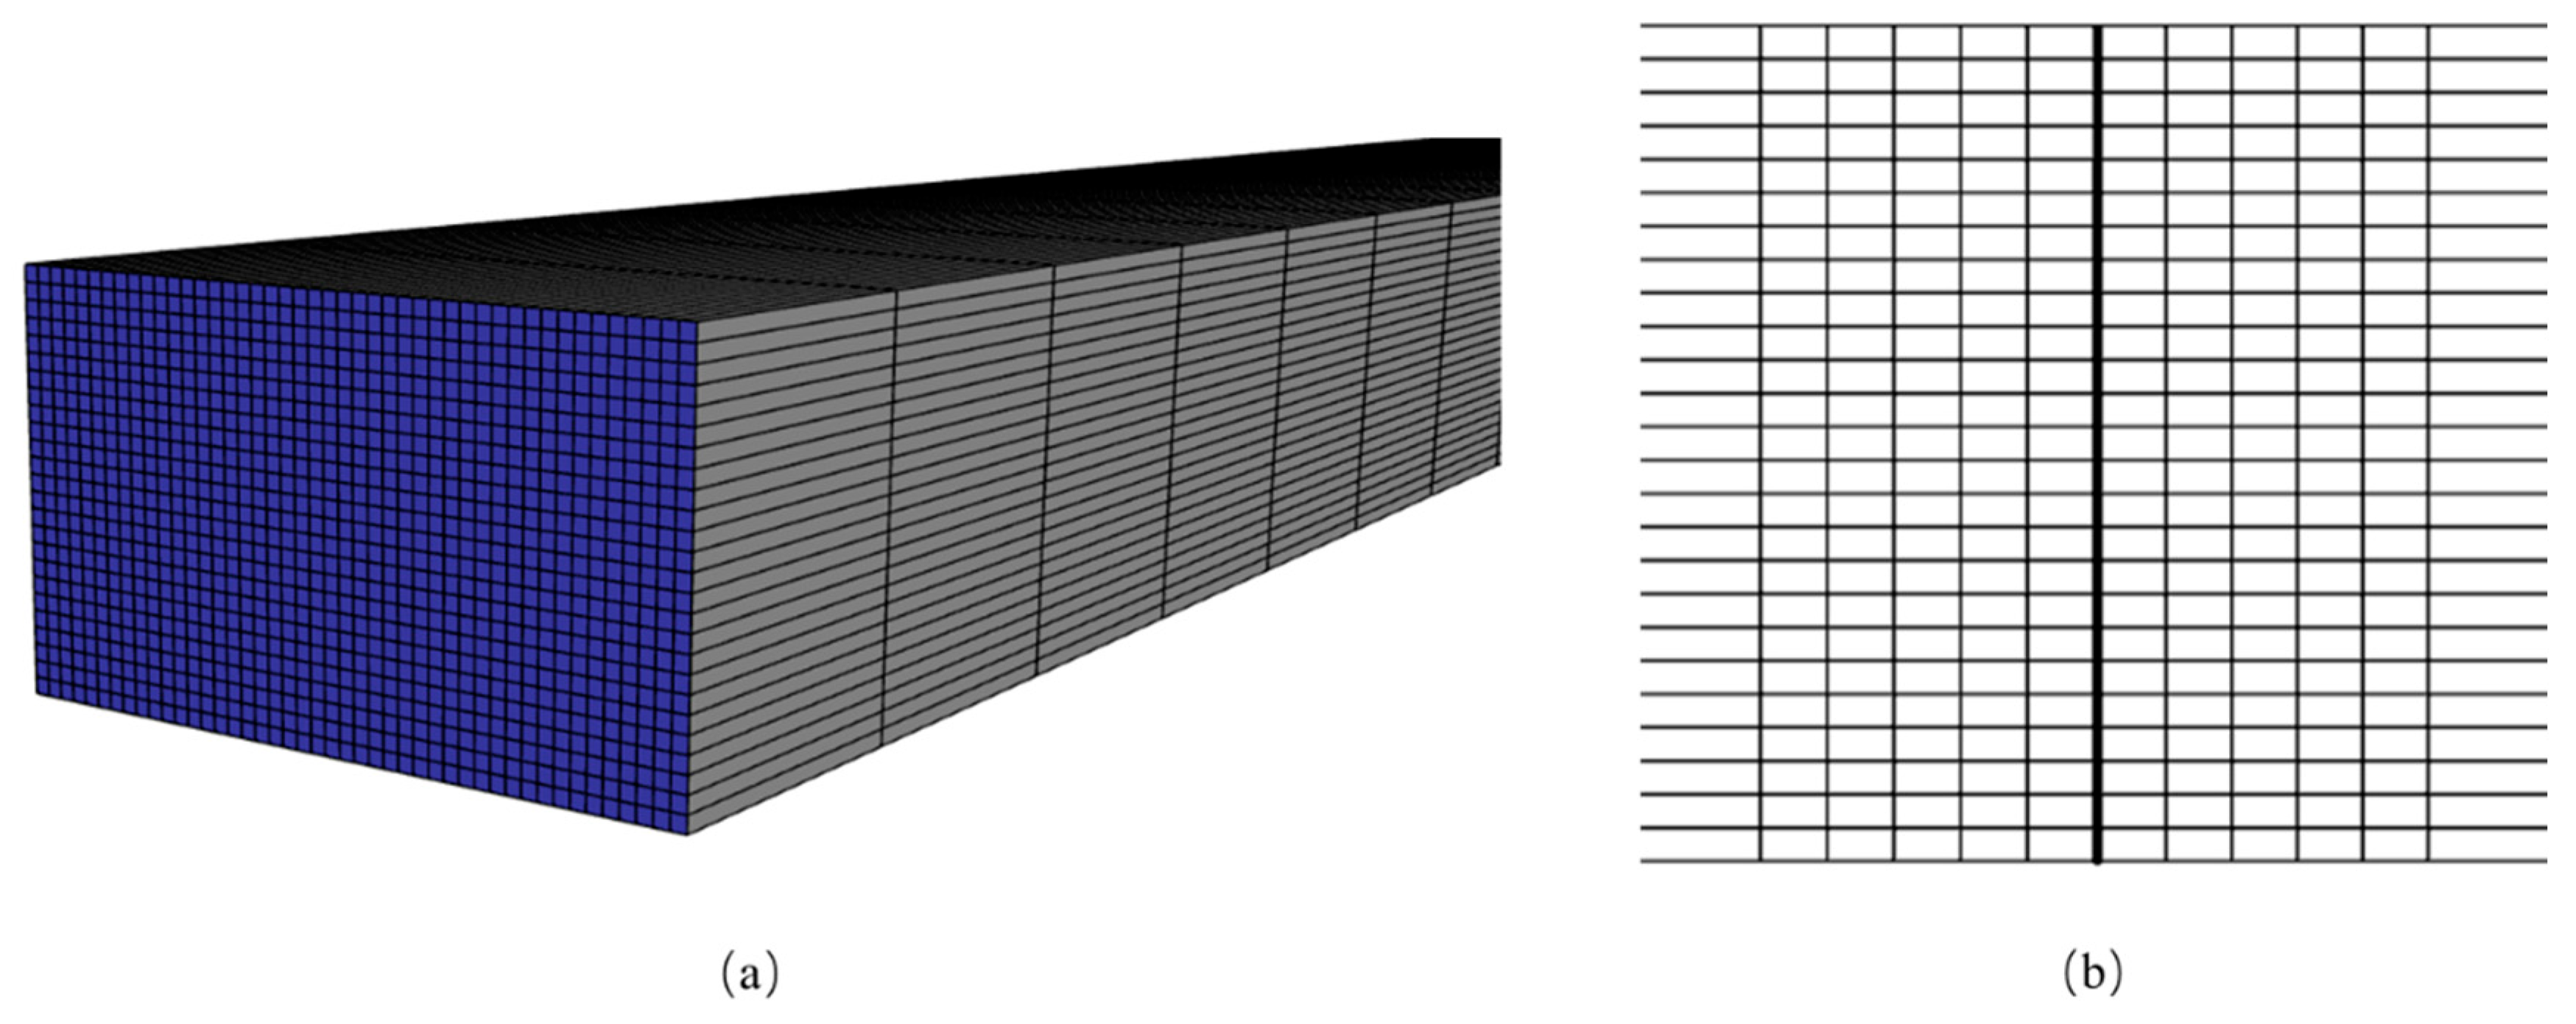
According to the above escape passage size parameters and fire door distribution, the model is established. The specific model of the tunnel is shown in Figure 3. The governing equations are as follows.
( ρ ϕ ) t + div ( ρ u ϕ ) = div ( Γ grad ϕ ) + S
where ϕ is the generic variable; ρ, u, Γ and S represent the density, velocity vector, effective exchange coefficient, and source rate per unit volume, respectively.
The model uses structured grids for meshing, with local grid refinement applied to key areas such as the fire doors and air supply vents to improve calculation accuracy. In Figure 3a, the blue section represents the air supply outlet of the tunnel escape passage, while the gray section indicates the wall portion. At the same time, to reduce the simulation running cost, the grid quantity of the model is optimized. The following root mean square error (RMSE) criterion, which must be less than 2%, is used as the validation criterion for model adequacy [30]:
1 N 1 N ( V m V m 1 V m ) 2 < 0.02
where Vm is the velocity obtained using the m-th grid, Vm−1 is the velocity obtained using the (m−1)th grid, N is the number of sample points used for verification.
Based on the fire door gap data with different grid sizes and using Equation (17) for calculations, the results show that the root mean square error (RMSE) between the 710,000 and 1,380,000 grid models is below 2%, which meets the accuracy requirements. However, the RMSE between the 580,000 grid model and the other two grid models exceeds 2%, failing to meet the standard. Therefore, this study selects the channel model with 710,000 grids for further research and analysis. Furthermore, the accuracy of this model has been validated in the paper titled “Effect of bypass duct size on the opening pressure of fire doors in an escape tunnel” [31].

4.2. Mathematical Relationship Between the Length of Escape Passage and the Pressure Difference Across Fire Door

Based on the method described above, five escape passage case studies are established. The models of each passage differ only in terms of length and the number of fire doors, while all other parameters remain consistent. Additionally, for each case, the same three furthest doors on the same side of each fire door are opened. The design airflow for each case is calculated using Equations (1)–(3). Since each case has fire doors in the open state, the fire door pressure varies depending on the distance from the opened door. Therefore, for each case, the maximum fire door pressure in that case is selected. The specific parameters for each case are shown in Table 5.
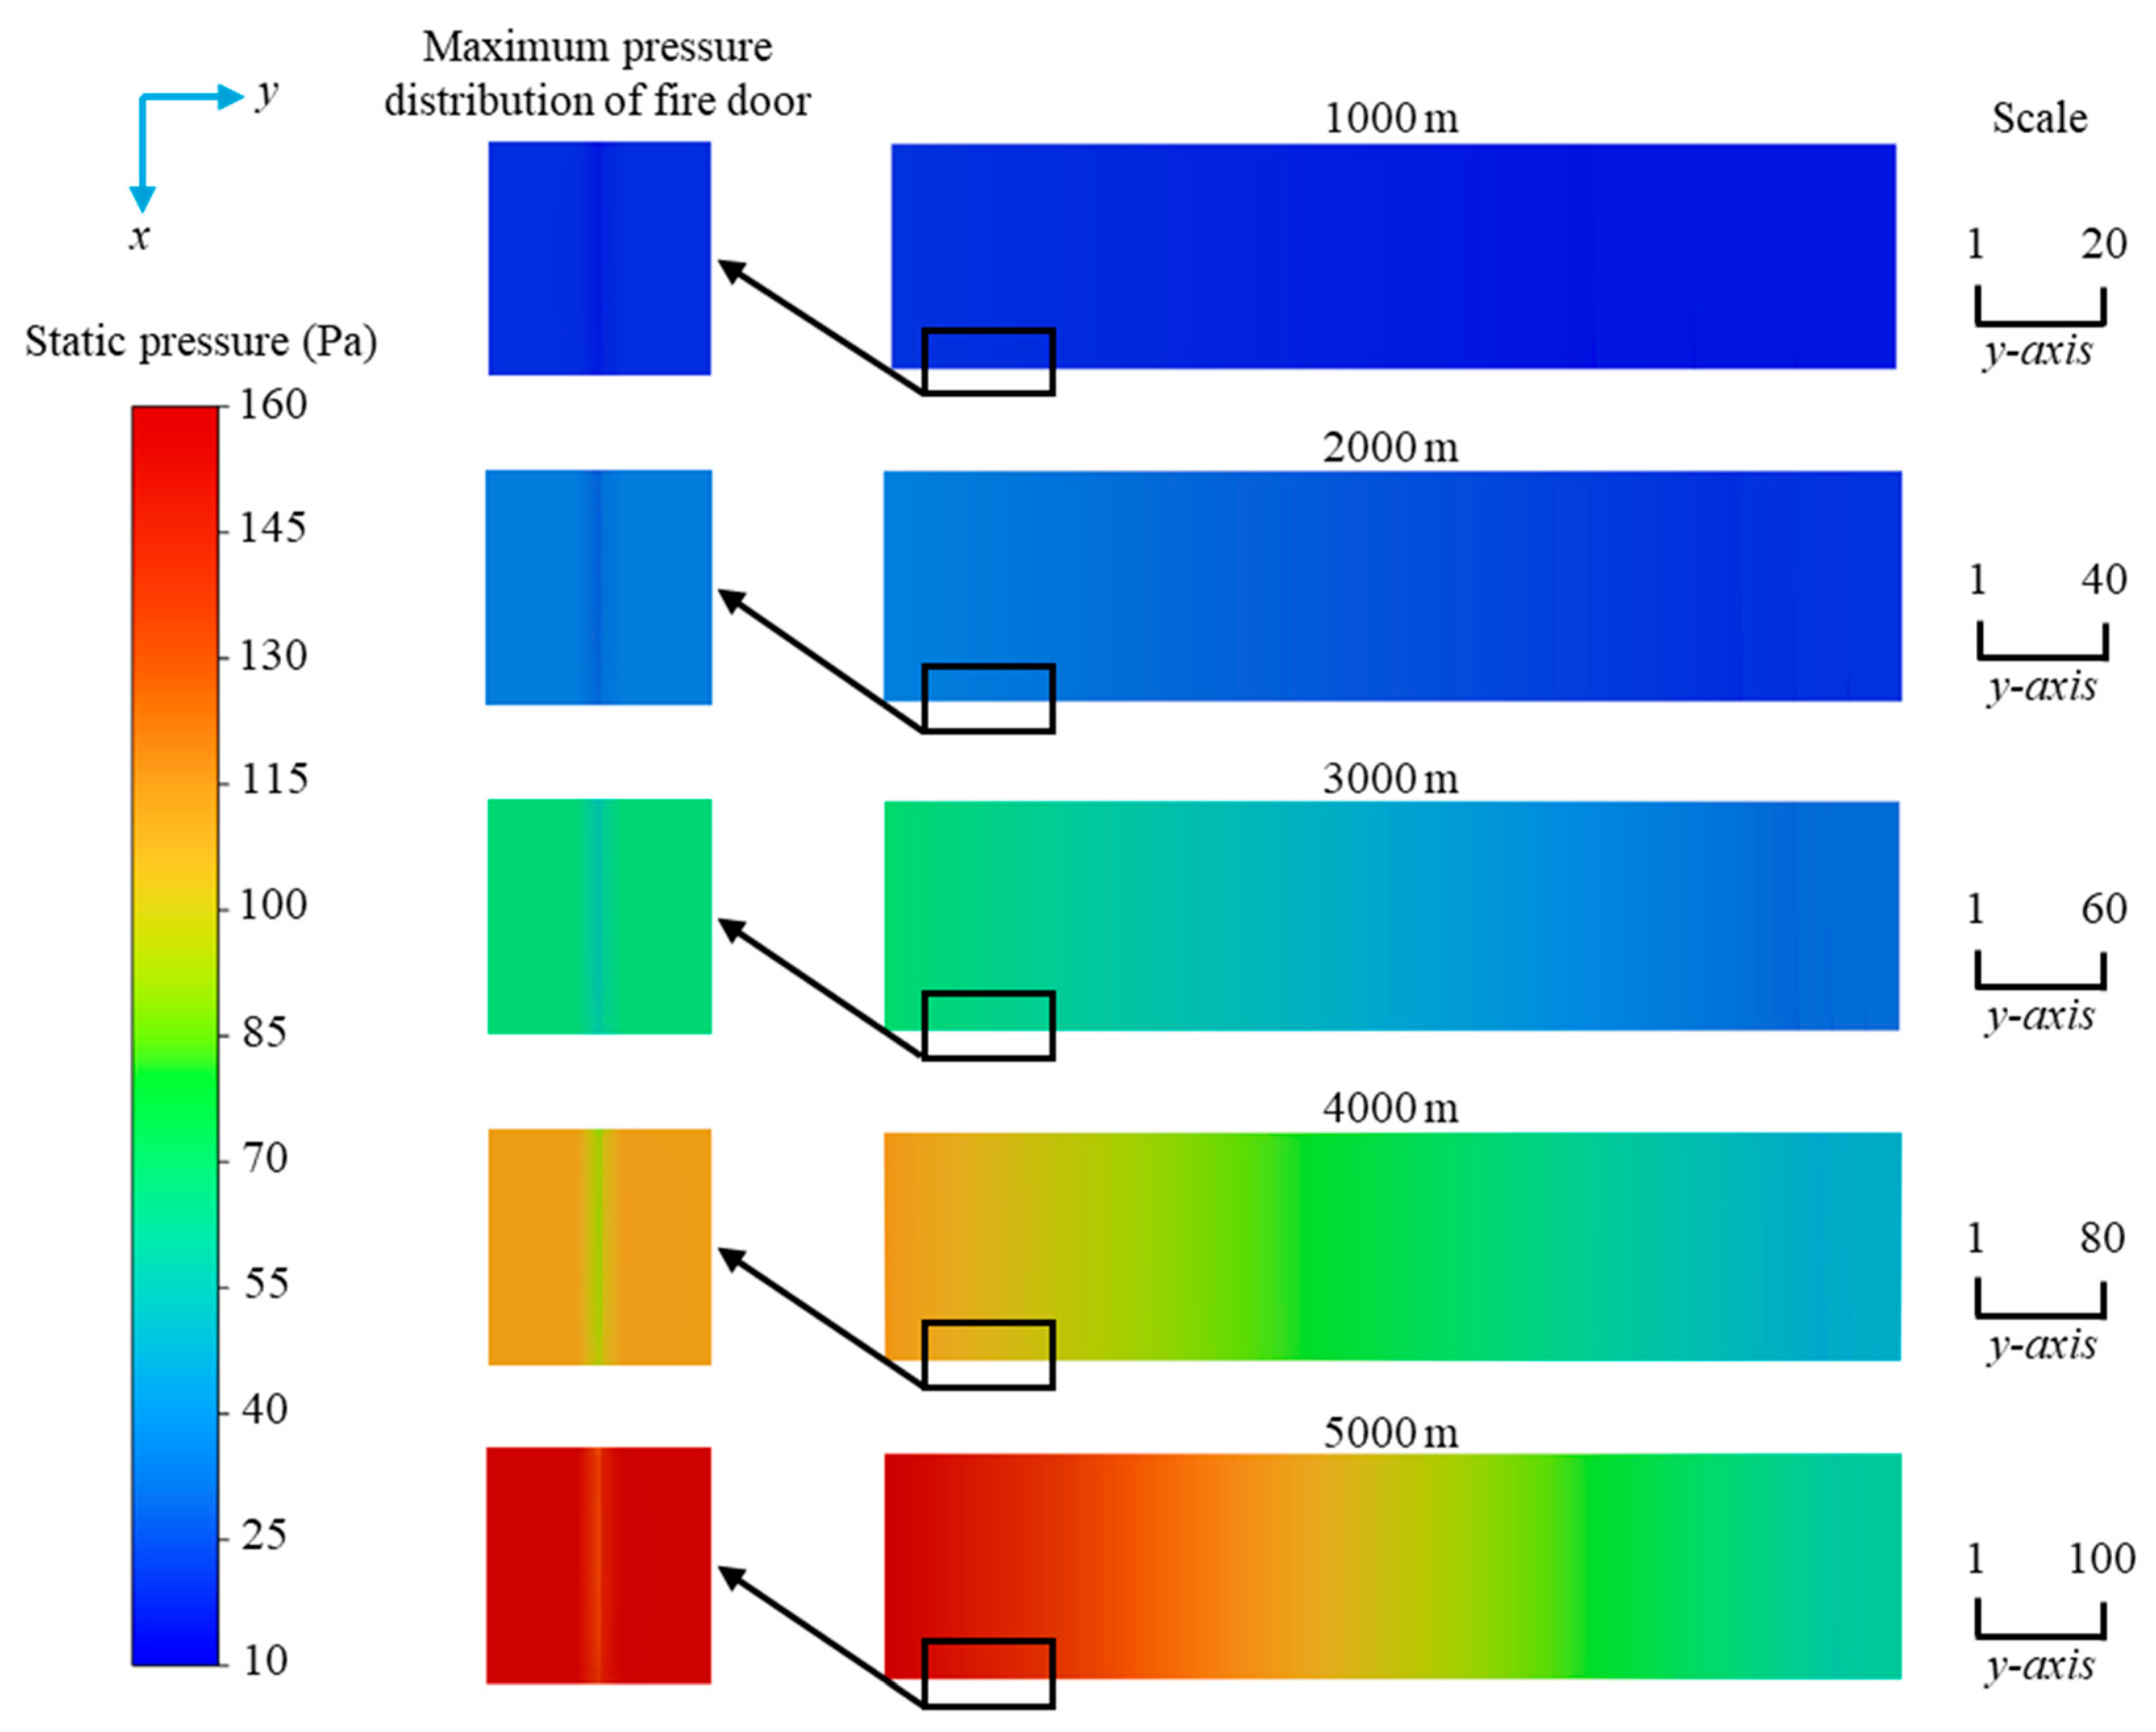
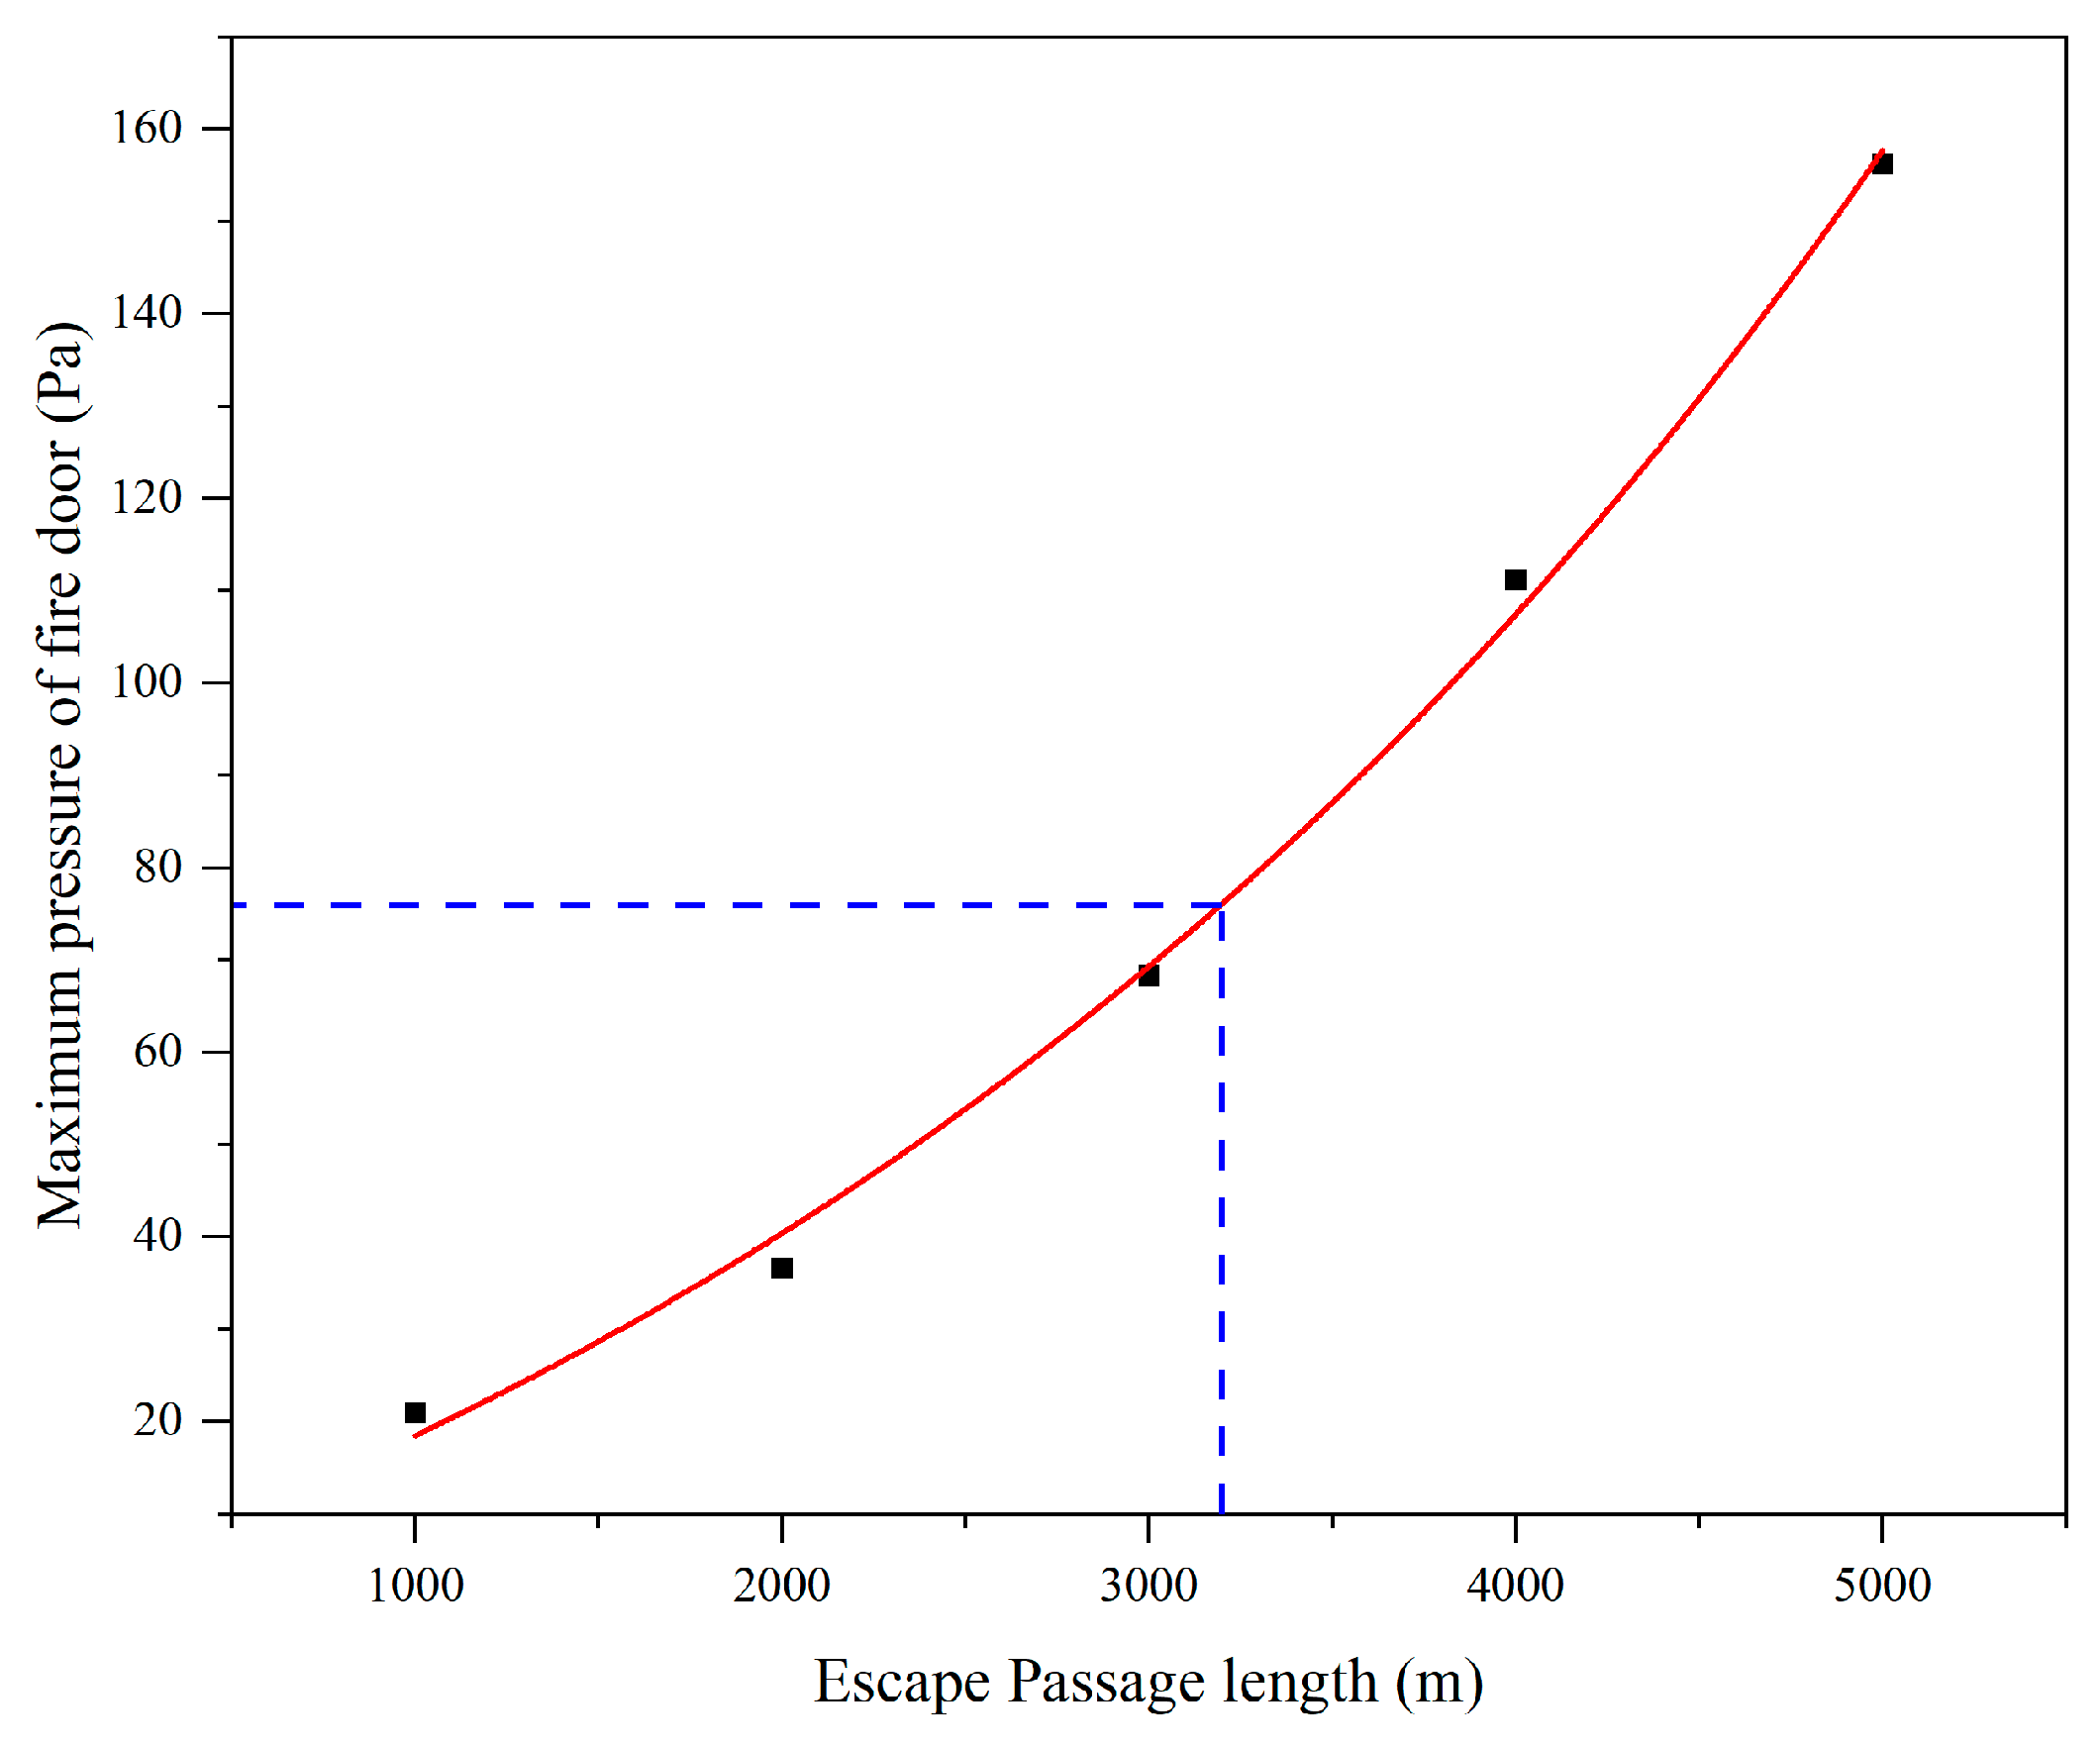
In practical operation, determining whether the system experiences overpressure requires a comprehensive consideration of tunnel length, fire door conditions, and fan design airflow. Therefore, it is necessary to quantitatively analyze the relationship between passage length and the maximum fire door pressure. This study selects five different cases and, based on the data parameters from Table 5, plots the relationship curve between escape passage length and the maximum fire door pressure, as shown in Figure 4 and Figure 5.
As shown in Figure 5, the mathematical relationship between the length of the escape passage (m) and the maximum pressure of the fire door (Pa) is derived by fitting the data. The relationship is as follows:
y = 50.2 + 52.1 × exp ( x / 3612.2 )
where y is the maximum pressure of fire door in Pa; x is the escape passage length in m; the remaining parameters are shown in Figure 5.
The fitted equation yields an R-squared (COD) value of 0.99691 and an Adjusted R-squared value of 0.99382, indicating a good fit. The relationship between escape passage length and the maximum pressure of fire doors expressed in Equation (18) is established through systematic numerical simulations of five different passage lengths (ranging from 1000 m to 5000 m). In contrast, traditional design methods typically focus on maintaining sufficient positive pressure to prevent smoke infiltration, lacking an explicit mathematical linkage between passage length and fire door pressure, which may compromise safe door-opening performance in longer tunnel designs.

5. Verification of the Maximum Allowable Length of the Escape Passage

The length of the escape passage is the key parameter of affecting evacuation efficiency and safety during the safety design of tunnel. Overpressure may occur inside the escape passage under the pressurized air supply system when the tunnel length reaches a certain value, which could impact the overall safety and evacuation capacity of the escape passage during a fire. Therefore, it is necessary to verify the applicability of Equation (18).

5.1. Determination of Design Air Supply Volume of Escape Passage

The model of escape passage is shown in Figure 1. Taking the opening of three fire doors as an example, the wind speed at the open doorways is 1.0 m/s, and the pressure difference (ΔP) is 12 Pa. According to Equation (2), the airflow at the three open doorways, Qopen is calculated to be 45,360 m3/h.
When the length of passage is L in m, the number of fire doors N is:
N = ( L 100 ) × 2 / 100
At this time, the number of unopened fire doors N2 is:
N 2 = N 3 = ( L / 50 5 )
According to Equation (3), the air leakage Qleak of the unopened fire door is:
Q l e a k = 0.827 × A × Δ P 1 n × 1.25 × ( L 50 5 )
The design air flow rate Q is:
Q = 1.2 × ( Q o p e n + Q l e a k )
Based on previous calculations, the maximum allowable pressure difference for the fire door in this study’s control volume is 74 Pa. Assuming that the change in residual pressure at entrance, before and after the door opens, can be negligible, the maximum pressure of entrance is 74 Pa. For keeping the residual pressure of 12 Pa at entrance after opening fire door, the actual pressure needs to be 62 Pa to overcome the internal frictional resistance in the tunnel.

5.2. Calculation of Maximum Allowable Length of Passage

The length of the passage is L in m, and the resistance along the passage is:
R m = λ D × v 2 ρ 2 l
where λ is the resistance coefficient along the passage, taken as 0.02; D is the velocity equivalent diameter of the escape passage in m; v is the cross-section air velocity when the door is opened in m/s; ρ is the air density, taken as 1.225 kg/m3.
In order to overcome the resistance along the tunnel and retain the residual pressure of 12 Pa at the opening of the door, Rm ≤ 62 Pa.
Expressed as:
λ D × ( ( V / 3600 + 0.827 × A × Δ P 1 n × 1.25 × ( L 50 5 ) ) × 1.2 / A ) 2 2 × ρ × L R m
In summary, the maximum allowable length is related to the size of escape passage, which is one of the important factors to ensure the safe evacuation of personnel. In tunnel design, standard height and width parameters are usually used to meet the needs of structural stability and personnel passage. In general, the height of the tunnel is usually set to 2.5 m, and its width is recorded as a. On this basis, according to Equation (24), the mathematical relationship between the maximum allowable length L and the width a of the tunnel can be derived:
0.05 + 0.02 a 5 a × ( ( 12.6 + 0.827 × 0.041 × 12 1 2 × 1.25 × ( L 50 5 ) ) × 1.2 / 2.5 a ) 2 2 × ρ × L 62 Pa
According to Equation (24), when the width of the escape channel is 4.5 m, the maximum allowable length range of the passage is L ≤ 3200 m.
According to Equation (18), the maximum allowable pressure for the fire door corresponding to different passage lengths can be calculated. Through the above calculations, it is known that the maximum allowable pressure for the fire door in the actual operating conditions of the escape passage is 74 Pa. Using Equation (25), the maximum allowable length of the passage is calculated to be 3200 m when the fire door pressure is 74 Pa. Combining with Equation (18), when the escape passage length is 3200 m, the fire door pressure is calculated to be 76 Pa. The error between the pressure value of 74 Pa and 76 Pa is only 2.7%.
It is important to note that Equation (25) is used to calculate the maximum allowable length of the escape passage under a given pressure, while Equation (18) indicates the relationship between the escape passage length and the fire door pressure. The mathematical relationship between the escape passage length and the maximum fire door pressure provides a quantitative basis for the design of escape passages. This has practical engineering significance for controlling the pressure of fire doors in tunnels.
It should be noted that Equation (25) is derived by substituting the numerical values from the physical model of this specific tunnel into Equation (24), aiming to provide a more intuitive representation of Equation (24). For calculations involving other different tunnels, Equation (24) should still be used as the basis. Furthermore, analysis indicates that the current model is applicable only to long straight tunnels and has not yet been validated for tunnels with other shapes and structures.

6. Conclusions

This study systematically investigated the issue of overpressure at fire doors in escape passages of highway tunnels. The results demonstrate that traditional design practices, which emphasize maintaining positive pressure for smoke prevention, can inadvertently create excessive door-opening resistance, thereby hindering evacuation efficiency and posing safety risks. On this basis, this study adopts a pressure calculation equation for the air supply zone based on the specific pipeline characteristics of the smoke control system, with the aim of meeting the smoke control requirements of escape passages during a fire while ensuring that fire doors can be opened smoothly.
Through theoretical derivation and empirical analysis, it was found that the thrust required to open a fire door under fire conditions may reach 168 N, significantly exceeding the allowable limits specified in current design standards. Numerical simulations further revealed that the maximum permissible length of an escape passage should not exceed 3200 m to maintain acceptable pressure levels. A mathematical relationship between passage length and fire door pressure difference was established, providing a reliable basis for design optimization. Overall, this research highlights the critical balance between smoke control and evacuation safety, offering practical guidance for the safe design of escape passages in tunnel engineering.
The conclusions of this study are of significant practical importance. In actual applications, designers should balance the relationship between tunnel length and fire door pressure, ensuring effective smoke prevention while reasonably controlling the residual pressure range. This will ensure that fire doors can open smoothly, thereby enhancing the safety of personnel evacuation.

Author Contributions

Conceptualization, H.L., K.Z., L.W. and Q.Y.; Methodology, D.W.; Investigation, X.H., J.Y., S.Y. and H.Z.; Writing—original draft, D.W.; Writing—review and editing, H.L. and Q.Y. All authors have read and agreed to the published version of the manuscript.

Funding

This work was supported by the National Natural Science Foundation of China (52508128) and Natural Science Foundation of Shanghai Municipality (25ZR1402387).

Institutional Review Board Statement

Not applicable.

Informed Consent Statement

Not applicable.

Data Availability Statement

The original contributions presented in the study are included in the article; further inquiries can be directed to the corresponding author.

Conflicts of Interest

Author Qinghai Yang was employed by the company State Grid Shanghai Municipal Electric Power Company. The remaining authors declare that the research was conducted in the absence of any commercial or financial relationships that could be construed as a potential conflict of interest.

Nomenclature

QTotal air flow rate of pressurized air supply system, m3/h
QopenAir flow rate of door opening, m3/h
QleakLeakage air flow rate through the door, m3/h
Aarea of fire door opening, m2
A1effective leakage area of each evacuation door, m2
QcSystem air flow rate of closed state, m3/s
vAir velocity, m/s
v ¯ Average air velocity of door seam, m/s
VAir flow velocity where local pressure loss occurs in the air duct, m/s
VmVelocity obtained using the m-th grid
Vm−1Velocity obtained using the (m−1)th grid
NNumber of fire doors opened
N2Number of fire doors closed
ΔPPressure difference between the two regions, Pa
nExponent
ΔAverage wall roughness, mm
DEquivalent diameter of air duct section, m
λFrictional resistance coefficient
ρAir density, kg/m3
ΔpmFriction resistance per unit pipe length along the way, Pa/m
lAir duct length, m
ξCoefficient of local resistance
αSafety factor of leakage air flow rate
βSafety factor of air pressure
ROn-way resistance, Pa
WInternal power of fan, W
η0Internal efficiency of fan
PMaximum allowable pressure differential of the door, Pa
FTotal thrust of the door, N
FdcForce required to overcome the door closer at the door handle, N
WmWidth of a single door leaf, m
AmArea of the door, m2
dmDistance from the door handle to the door latch, m
MOpening torque of the door closer, N·m
FFire door opening force, N
FpComponent force formed by the pressure difference of the air supply, N
FcAnti-deduction force of the door closer, N
FfFriction component of the pivot system, N
BSingle door width, m
dDistance from door handle to open side door, mm
LLength of passage, m

References

  1. Tomar, M.S.; Khurana, S. Impact of passive fire protection on heat release rates in road tunnel fire: A review. Tunn. Undergr. Space Technol. 2019, 85, 149–159. [Google Scholar] [CrossRef] [Scilit]
  2. Stefopoulos, E.K.; Damigos, D.G. Design of emergency ventilation system for an underground storage facility. Tunn. Undergr. Space Technol. 2007, 22, 293–302. [Google Scholar] [CrossRef] [Scilit]
  3. Viegas, J.C.; Costa, C.O.; Monteiro, B.P.B.; Pereira, P.D. Impact of the pressure differences between road galeries on tunnels generated by the smoke control system. Fire Technol. 2022, 58, 1391–1416. [Google Scholar] [CrossRef] [Scilit]
  4. Vidmar, P.; Petelin, S.; Luin, B. Upgrade of a transverse ventilation system in a Bi-directional tunnel. Therm. Sci. 2012, 16, 1067–1080. [Google Scholar] [CrossRef] [Scilit]
  5. Thanasoulas, I.; Lauridsen, D.; Husted, B.; Giuliani, L. Large-scale fire tests on sliding doors for building applications. Fire Technol. 2022, 58, 2357–2375. [Google Scholar] [CrossRef] [Scilit]
  6. Kim, B.G.; Choi, K.O.; Choi, D.M. Performance improvement of smoke-control system using CONTAMW. Fire Sci. Eng. 2021, 35, 53–58. [Google Scholar] [CrossRef] [Scilit]
  7. GB 51251-2017; Ministry of Public Security of the People’s Republic of China, Technical Standard for Smoke Control and Exhaust Systems in Buildings. China Planning Press: Beijing, China, 2017.
  8. NFPA. NFPA 1-2024 Fire Code; National Fire Protection Association: Quincy, MA, USA, 2024. [Google Scholar]
  9. Wen, B.C. Handbook of Mechanical Design; China Machine Press: Beijing, China, 2010. [Google Scholar]
  10. Lu, Y.Q. China Academy of Building Research, Practical Heating, Ventilation and Air Conditioning Design Manual; China Architecture & Building Press: Beijing, China, 2008. [Google Scholar]
  11. Kume, S.; Sistenich, C.; Wawrzyniak, F. Experimental approach to suppress smoke diffusion in sloped road tunnels. Fire Saf. J. 2020, 114, 103134. [Google Scholar] [CrossRef] [Scilit]
  12. Waelchli, S.; Bernet, C. Enhancement of tunnel safety in the Albula railway tunnel. In Underground—The Way to the Future; CRC Press: Boca Raton, FL, USA, 2013; p. 59. [Google Scholar]
  13. Melois, A.; Tran, A.D.; Moujalled, B.; EI Mankibi, M.; Guyot, G.; Kolsch, B.; Leprince, V. Model-scale reproduction of fan pressurization measurements in a wind tunnel: Design and characterization of a new experimental facility. Buildings 2024, 14, 400. [Google Scholar] [CrossRef] [Scilit]
  14. Sharma, A.; Mishra, K.B. Performance assessment of stairwell smoke prevention techniques in a model high-rise building. Therm. Sci. Eng. Prog. 2024, 53, 102725. [Google Scholar] [CrossRef] [Scilit]
  15. DG/TJ 08-2033-2017; Shanghai Municipal Housing and Urban-Rural Development Management Committee, Shanghai Standard for Road Tunnel Design Code. Tongji University Press: Shanghai, China, 2017.
  16. Khalifa, M.A.; Aziz, M.A.; Hamza, M.; Abdo, S.; Gaheen, O.A. Improvement of fire door design using experimental and numerical modelling investigations. J. Struct. Fire Eng. 2022, 13, 205–223. [Google Scholar] [CrossRef] [Scilit]
  17. Krol, A.; Szewczynski, K.; Krol, M.; Koper, P.; Bielawski, J.; Wegrzynski, W. Full-scale experimental, numerical, and theoretical research on the spatio-temporal evolution of the flow structure in longitudinal and semi-transversal ventilated tunnels. Tunn. Undergr. Space Technol. 2024, 147, 105721. [Google Scholar] [CrossRef] [Scilit]
  18. Kazemipour, A.; Afshin, H.; Farhanieh, B. Numerical-analytical assessment of fire and ventilation interaction in longitudinally ventilated tunnels using jet fans. Heat Transf. Eng. 2017, 38, 523–537. [Google Scholar] [CrossRef] [Scilit]
  19. Lanchava, O.; Bezhanishvili, A.; Javakhishvili, G.; Khokerashvil, Z.; Arudashvili, N. Study of the throttling effect in tunnel fires. Inz. Miner. -J. Pol. Miner. Eng. Soc. 2024, 1, 44. [Google Scholar] [CrossRef] [Scilit]
  20. Cheung, S.C.P.; Lo, S.M.; Yeoh, G.H.; Yuen, R.K.K. The influence of gaps offire-resisting doors on the smoke spread in a building fire. Fire Saf. J. 2006, 41, 539–546. [Google Scholar] [CrossRef] [Scilit]
  21. Lee, A.; Lau, G.E. Smoke control in high-rise residential buildings with stair pressurization systems. Fire 2023, 6, 132. [Google Scholar] [CrossRef] [Scilit]
  22. Mihaly, I.; Berczi, L.; Bognar, B.; Katai-Urban, M.; Toth, L.; Katai-Urban, L.; Vass, G.; Varga, F. Experimental study to determine the leakage area of single-leaf smoke control doors in the design of pressure differential systems. Fire 2025, 8, 5. [Google Scholar] [CrossRef] [Scilit]
  23. Gannouni, S. Critical velocity for preventing thermal backlayering flow in tunnel fire using longitudinal ventilation system: Effect of floor-fire separation distance. Int. J. Therm. Sci. 2022, 171, 107192. [Google Scholar] [CrossRef] [Scilit]
  24. Euler-Rolle, N.; Fuhrmann, M.; Reinwald, M.; Jakubek, S. Longitudinal tunnel ventilation control. Part 1: Modelling and dynamic feedforward control. Control Eng. Pract. 2017, 63, 91–103. [Google Scholar] [CrossRef] [Scilit]
  25. JTG/T D70/2-02-2014; Ministry of Transport of the People’s Republic of China, Detailed Rules for Design of Ventilation for Highway Tunnels. People’s Communications Press: Beijing, China, 2014.
  26. GB 55001-2021; Ministry of Housing and Urban-Rural Development of the People’s Republic of China, General Code for Engineering Structures. China Architecture & Building Press: Beijing, China, 2021.
  27. Wegrzynski, W. Transient characteristic of the flow of heat and mass in a fire as the basis for optimized solution for smoke exhaust. Int. J. Heat Mass Transf. 2017, 114, 483–500. [Google Scholar] [CrossRef] [Scilit]
  28. GB 50016-2014; Ministry of Public Security of the People’s Republic of China, Code for Fire Protection Design of Buildings. China Planning Press: Beijing, China, 2014.
  29. Kim, Y.S.; Lee, Y.; Son, Y.; Kwon, Y.J. Optimizing maintenance strategies for public fire doors in apartment buildings: Study on deterioration patterns and replacement timing. J. Korean Soc. Hazard Mitig. 2024, 24, 115–121. [Google Scholar] [CrossRef] [Scilit]
  30. Chai, T.; Draxler, R.R. Root mean square error (RMSE) or mean absolute error (MAE)?—Arguments against avoiding RMSE in the literature. Geosci. Model Dev. 2014, 7, 1247–1250. [Google Scholar] [CrossRef] [Scilit]
  31. Zhong, K.; Wang, L.; Yang, Q.H.; Wang, S.H.; Wang, D.J.; Li, H. Effect of bypass duct size on the opening pressure of fire doors in an escape tunnel. Tunn. Undergr. Space Technol. 2025, 168, 107139. [Google Scholar] [CrossRef] [Scilit]
Figure 1. Schematic diagram of pressurized air supply in escape passage (Taking 1000 m escape passage as an example).
Fire 09 00055 g001
Figure 2. SZF-1 type axial type fan performance curve diagram: (a) Fan air flow rate and total pressure relationship curve; (b) Fan air flow rate and inner power relationship curve.
Fire 09 00055 g002
Figure 3. Escape passage model and local grid diagram: (a) model and grid at the air supply outlet; (b) Fire door model and grid.
Fire 09 00055 g003
Figure 4. Pressure distribution in escape passage and fire door.
Fire 09 00055 g004
Figure 5. The relationship curve between the length of escape passage and the maximum pressure of fire door. (The blue dashed line corresponds to the maximum pressure of the fire door on the fitting curve when the escape passage length is 3200 m).
Fire 09 00055 g005
Table 1. Pressure calculation results of pressurized air supply system under open door condition.
TermDesigned Supply Air Flow Rate
(m3/s)
A
(m2)
λR
(Pa/m)
V
(m/s)
P
(Pa)
Fresh air flow rate17.81.6111.174
Rectangular duct-117.81.61.211.15.3
Reducer pipe-117.81.60.111.17.4
Flexible connection-117.81.60.111.17.4
Flexible connection-217.81.60.111.17.4
Reducer pipe-217.81.60.2711.120
Fire damper17.81.60.1911.114
Rectangular duct-217.81.61.211.15.4
Filter17.81.611.1100
Muffler17.81.62.411.1177.8
Reducer pipe-317.828.32510.6359.5
Reducer pipe-417.86.60.412.71.8
Reducer pipe-517.84.60.573.865
Rectangular duct-317.812.40.093.862
90° Straight elbow17.812.41.53.8613.4
Reducer pipe-617.81.60.3611.126.7
Reducer pipe-717.8563.5645.5
Inside the passage17.850.073.5668.3
A is the Sectional area; λ is the drag coefficient; R is the specific frictional resistance V is the Velocity; P is the Resistance loss.
Table 2. Operating conditions of SZF-1 axial type fan.
Fan State ParametersDoor Open StatusDoor Closed Status
Air flow rate (m3/h)63,99258,968
Total pressure (Pa)737755
Inner power (kW)17.2416.49
Inner efficiency0.760.75
Table 3. Pressure calculation results of pressurized air supply system in closed state.
TermDesigned Supply Air Flow Rate (m3/s)A
(m2)
λR
(Pa/m)
V
(m/s)
P
(Pa)
Fresh air inlet16.41.6110.263
Rectangular duct-116.41.61.010.24.5
Reducer pipe-116.41.60.110.26.3
Flexible connection-116.41.60.110.26.3
Flexible connection-216.41.60.110.26.3
Reducer pipe-216.41.60.2710.217
Fire damper16.41.60.1910.212
Rectangular duct-216.41.61.010.24.6
Filter16.41.610.2100
Muffler16.41.62.410.2151
Reducer pipe-316.428.32510.5851
Reducer pipe-416.46.60.412.481.5
Reducer pipe-516.44.60.573.554.3
Rectangular duct-316.412.40.083.551.7
90° Straight elbow16.412.41.53.5511
Reducer pipe-616.41.60.3610.223
Reducer pipe-716.4563.2839
Inside the passage16.450.063.2858
A is the Sectional area; λ is the drag coefficient; R is the specific frictional resistance V is the Velocity; P is the Resistance loss.
Table 4. Summary of pressure calculation results of pressurized air supply system in closed state.
Actual Differential Pressure
(Pa)
Total Resistance Loss
(Pa)
Fan Operating Pressure
(Pa)
Fan Operating Air Flow Rate (m3/h)
9555975558,968
Table 5. Relevant parameters of each case of tunnel escape channel.
CaseTunnel Length
(m)
Design Air Flow Rate
(m3/h)
Maximum Pressure of Fire Door
(Pa)
Case1100063,99221
Case2200075,33036.6
Case3300089,50568.3
Case44000102,060111.2
Case55000115,020156.3
Disclaimer/Publisher’s Note: The statements, opinions and data contained in all publications are solely those of the individual author(s) and contributor(s) and not of MDPI and/or the editor(s). MDPI and/or the editor(s) disclaim responsibility for any injury to people or property resulting from any ideas, methods, instructions or products referred to in the content.