Article

Experimental Investigation of Ventilation Effects on Combustion Efficiency and Heat Release Rate in Small-Scale Compartment Fires

by
Weiheng Li
1,2,
Yong Sheng
1,
Qishuo Liao
3,
Qi Yu
1,
Zhiqiang Xiao
1,
Guo Chen
1,
Hao Wang
1 and
Peng Lin
2,*
1
Chongqing Railway Group Co., Ltd., No. 6, Wutong Road, Yubei District, Chongqing 401120, China
2
Department of Fire Safety Engineering, Southwest Jiaotong University, Chengdu 610032, China
3
Chongqing City Transportation Development & Investment Group Co., Ltd., No. 6, Wutong Road, Yubei District, Chongqing 401120, China
*
Author to whom correspondence should be addressed.
Fire 2025, 8(6), 215; https://doi.org/10.3390/fire8060215
Submission received: 22 April 2025 / Revised: 11 May 2025 / Accepted: 13 May 2025 / Published: 28 May 2025
(This article belongs to the Special Issue Advances in Industrial Fire and Urban Fire Research: 2nd Edition)

Abstract

A series of fire experiments were conducted in a 0.5 m × 0.5 m × 0.5 m room, and a single door-like opening was adopted. The height of the openings was 20 cm, and the width of the openings varied from 10 cm to 30 cm, with ventilation factors ranging from 0.0089 m5/2 to 0.0268 m5/2. The ventilation constant and combustion efficiency were studied and compared with those of other researchers. It was found that the so-called ventilation constant can hardly be a constant, and it varied greatly, around 0.357–0.436, at different ventilation conditions. The overall combustion efficiency varied greatly at different opening sizes and flow rates, and it was as low as 0.5, even when the flame was ejected.

1. Introduction

Enclosure building systems, such as classrooms, meeting rooms, halls, and so on, have grown increasingly sophisticated in modern daily life. However, due to the ventilation limitation and complicated heat transfer, compartment fires will tend to develop more rapidly than those in open spaces, leading to hazardous phenomena such as flashover and backdraft. Therefore, it is essential to study the vent flow in a compartment fire. It is well established that airflow in naturally ventilated compartment fires is divided into two distinct layers: the upper layer, composed of combustion materials, and the make-up layer, which consists of ambient air. Kawagoe [1], synthesizing his decade-long research on compartment fires since 1948, uncovered a correlation between the mass inflow rate and the fuel-burning rate during the fully developed (post-flashover) fire stage. This correlation was derived by assuming the stoichiometric combustion of wood, uniform compartment temperature, and using the Bernoulli equation and mass conservation principles. This model effectively demonstrates that the maximum burning rate of wood is proportional to A(H)1/2, where A (m2) is the area and H (m) is the height of the opening. A H is also known as the ventilation factor. The maximum flow rate out of an enclosure m ˙ can be expressed as [2]:
m ˙ = C A H
and C is a ventilation constant. Babrauskas and Williamson [3] adopted a number of assumptions and suggested that the application of a constant of 0.5 could bring the model in line with experimental data.
Chotzoglou [4] investigated the combustion behavior of liquid fuel pool fires within corridor-like enclosures. The primary goal of this research was to identify the key factors influencing fire development through the application of oxygen calorimetry. The ventilation constant was found to range between 0.35 and 0.5. In a separate analysis of post-flashover compartment fires, Thomas et al. [5] identified two distinct flow behaviors for small and large openings. They discovered that small openings experienced vent flows driven primarily by hydrostatic pressure differences between the compartment’s hot gases and the colder ambient air outside. In contrast, large openings exhibited vent flows dominated by smaller pressure differences associated with entrainment. More recently, Thomas and Bennett [6] conducted a small-scale experiment using liquid fuel trays positioned along the compartment’s width to investigate the effects of different ventilation openings. They determined that for a full-width opening, the vent flow was essentially two-dimensional. However, for smaller openings, the vent flow transitioned to a three-dimensional pattern due to flows around the vertical edges of the opening. Additionally, Thomas’s preliminary analysis suggested that the fuel mass loss rate within the fire compartment could be differentiated for full and partial wall openings, indicating that the resulting fire behaviors from induced airflow were distinct for the two types of openings. These observations suggest that the fire behaviors resulting from induced airflow for a partial wall opening and for a full wall opening are different.
By assuming a heat release of 13.1 MJ/kg per oxygen consumed for most common fuels [7] and 23% of oxygen mass fraction in the air, as well as the complete consumption of oxygen inside of the room, the maximum fire heat release rate inside the compartment can be predicted as [7]
Q ˙ i n K = 1500 A H 1 / 2
Lee et al. [8] conducted an experiment in a 0.125 m3 enclosure and manually controlled the mass flow rate of fuel. They observed that the measured HRR, as determined by oxygen calorimetry, closely aligned with the theoretical predictions provided by Equation (2). Yamda et al. [9] conducted a comprehensive series of fire experiments within a compartment measuring 0.9 m in length, 0.6 m in width, and 0.4 m in height. The experimental setup utilized propane gas as well as three distinct solid fuels, namely a wood crib, polymethyl methacrylate (PMMA), and polyurethane flexible foam. Upon examination of the solid fuels, it was observed that the maximum heat release rates (HRR) ranged from 1.5 to 2.5 times greater than the theoretical maximum HRR, as determined by the opening factor [10].
In recent years, researchers have adopted numerical simulations to study compartment fires. Chow et al. [11] employed CFD-based simulations to investigate over-ventilated (or pre-flashover) compartment fires and found that the inlet airflow was proportional to the ventilation factor ( A H 1 / 2 ), thus corroborating the theoretical analysis. Moreover, Zhao et al. [12] simulated under-ventilated (or fully developed) compartment fires in a chamber of dimensions 0.5 m × 0.5 m × 0.5 m and observed that both the inflow rate (0.41 A H 1 / 2 kg/s) and the HRR (1131 A H 1 / 2 kW) were 20% lower than the values, as predicted by Equation (2). Additionally, Afflard et al. [13] simulated the HRR (925 A H 1 / 2 kW) within a 1/4 scale ISO9705 enclosure (0.6 m × 0.9 m × 0.6 m), which was found to be beyond the uncertainty limit. Experimental investigations often face challenges in measuring the airflow rate through compartments accurately, primarily due to limitations in available devices and equipment, whilst numerical simulations offer a convenient and effective alternative for assessing the airflow rate in a wide range of fire safety scenarios. However, it is very difficult to simulate the complex combustion behavior in the room, particularly in under-ventilated conditions, and the combustion is generally simplified [14]. Nevertheless, both experimental and numerical approaches help us to understand the complex dynamics of compartment fires.
The objective of this manuscript is to verify the HRRs or the combustion efficiency of propane fires at different ventilation conditions in a small compartment to quantify the impact of ventilation on overall HRRs of gaseous fires.

2. Experimental Setup

The first setup used was a steel hood to calibrate the HRRs of propane fires in open conditions. Its dimensions were 2 m long, 2 m wide, and 1.92 m high, as shown in Figure 1. The hood was connected to a variable frequency fan via a steel duct. A K-type thermocouple with a diameter of 1 mm, an anemometer, and a gas analysis probe were separately placed along the centerline of the duct to measure gas temperature, velocity, and concentration of O 2 , C O , and C O 2 , respectively.
The second setup was a cubic room with the dimensions 50 cm × 50 cm × 50 cm, as shown in Figure 2. The lateral side of the room was made of 6 mm thick fireproof glass with a density of 3100 kg/m3, a thermal conductivity of 1.6 W / ( m · K ) at 20 °C, and a specific heat of 0.84 J / k g · K , and the other sides of the room were made of 6 mm thick PROMATECT® fireproof board with a density of 975 kg/m3, a thermal conductivity of 0.237 W / ( m · K ) at 20 °C, and a specific heat of 920 J / k g · K . At high flow rates, the glass was broken easily at high temperature, and it was replaced by PROMATECT® fireproof board.
A single rectangular opening is set at the center of the front side of the room. The height from the floor to the soffit of the opening is zero. The height of the openings is 20 cm, and the width of the openings changed from 10 cm to 30 cm.
Propane, as one kind of classical fuel that characterizes gas-burning behavior, was adopted. The gas was supplied from a pressurized gas bottle, and the flow rate was controlled by a Rotameter, which connected to a sand-filled steel pan with dimensions 0.18 m long, 0.18 m wide, and 0.03 m high positioned at the center of the compartment. The heat of combustion of propane ΔH was 46.36 MJ/kg based on SFPE [15], and the density was around 1.83 kg/ m3 from manufacture. Therefore, the theoretical HRR Q ˙ can be given by the mass loss method:
Q ˙ = χ m ˙ Δ H
where m ˙ is the rate of mass loss (kg/s), χ is combustion efficiency, and assuming χ = 100%, so theoretically, the mass flow rate of 2.0 L/min of propane gas produces a fire with an HRR of 2.8 kW (2.0 L/min × 1/60 min/s × 1.83 kg/m3 × 46.3 MJ/kg). The heat release rates were calibrated by using the oxygen consumption method, as presented by Chow and Han [16]. In an open environment, propane gas underwent ignition, with all generated smoke effectively captured by a hood, as depicted in Figure 1.
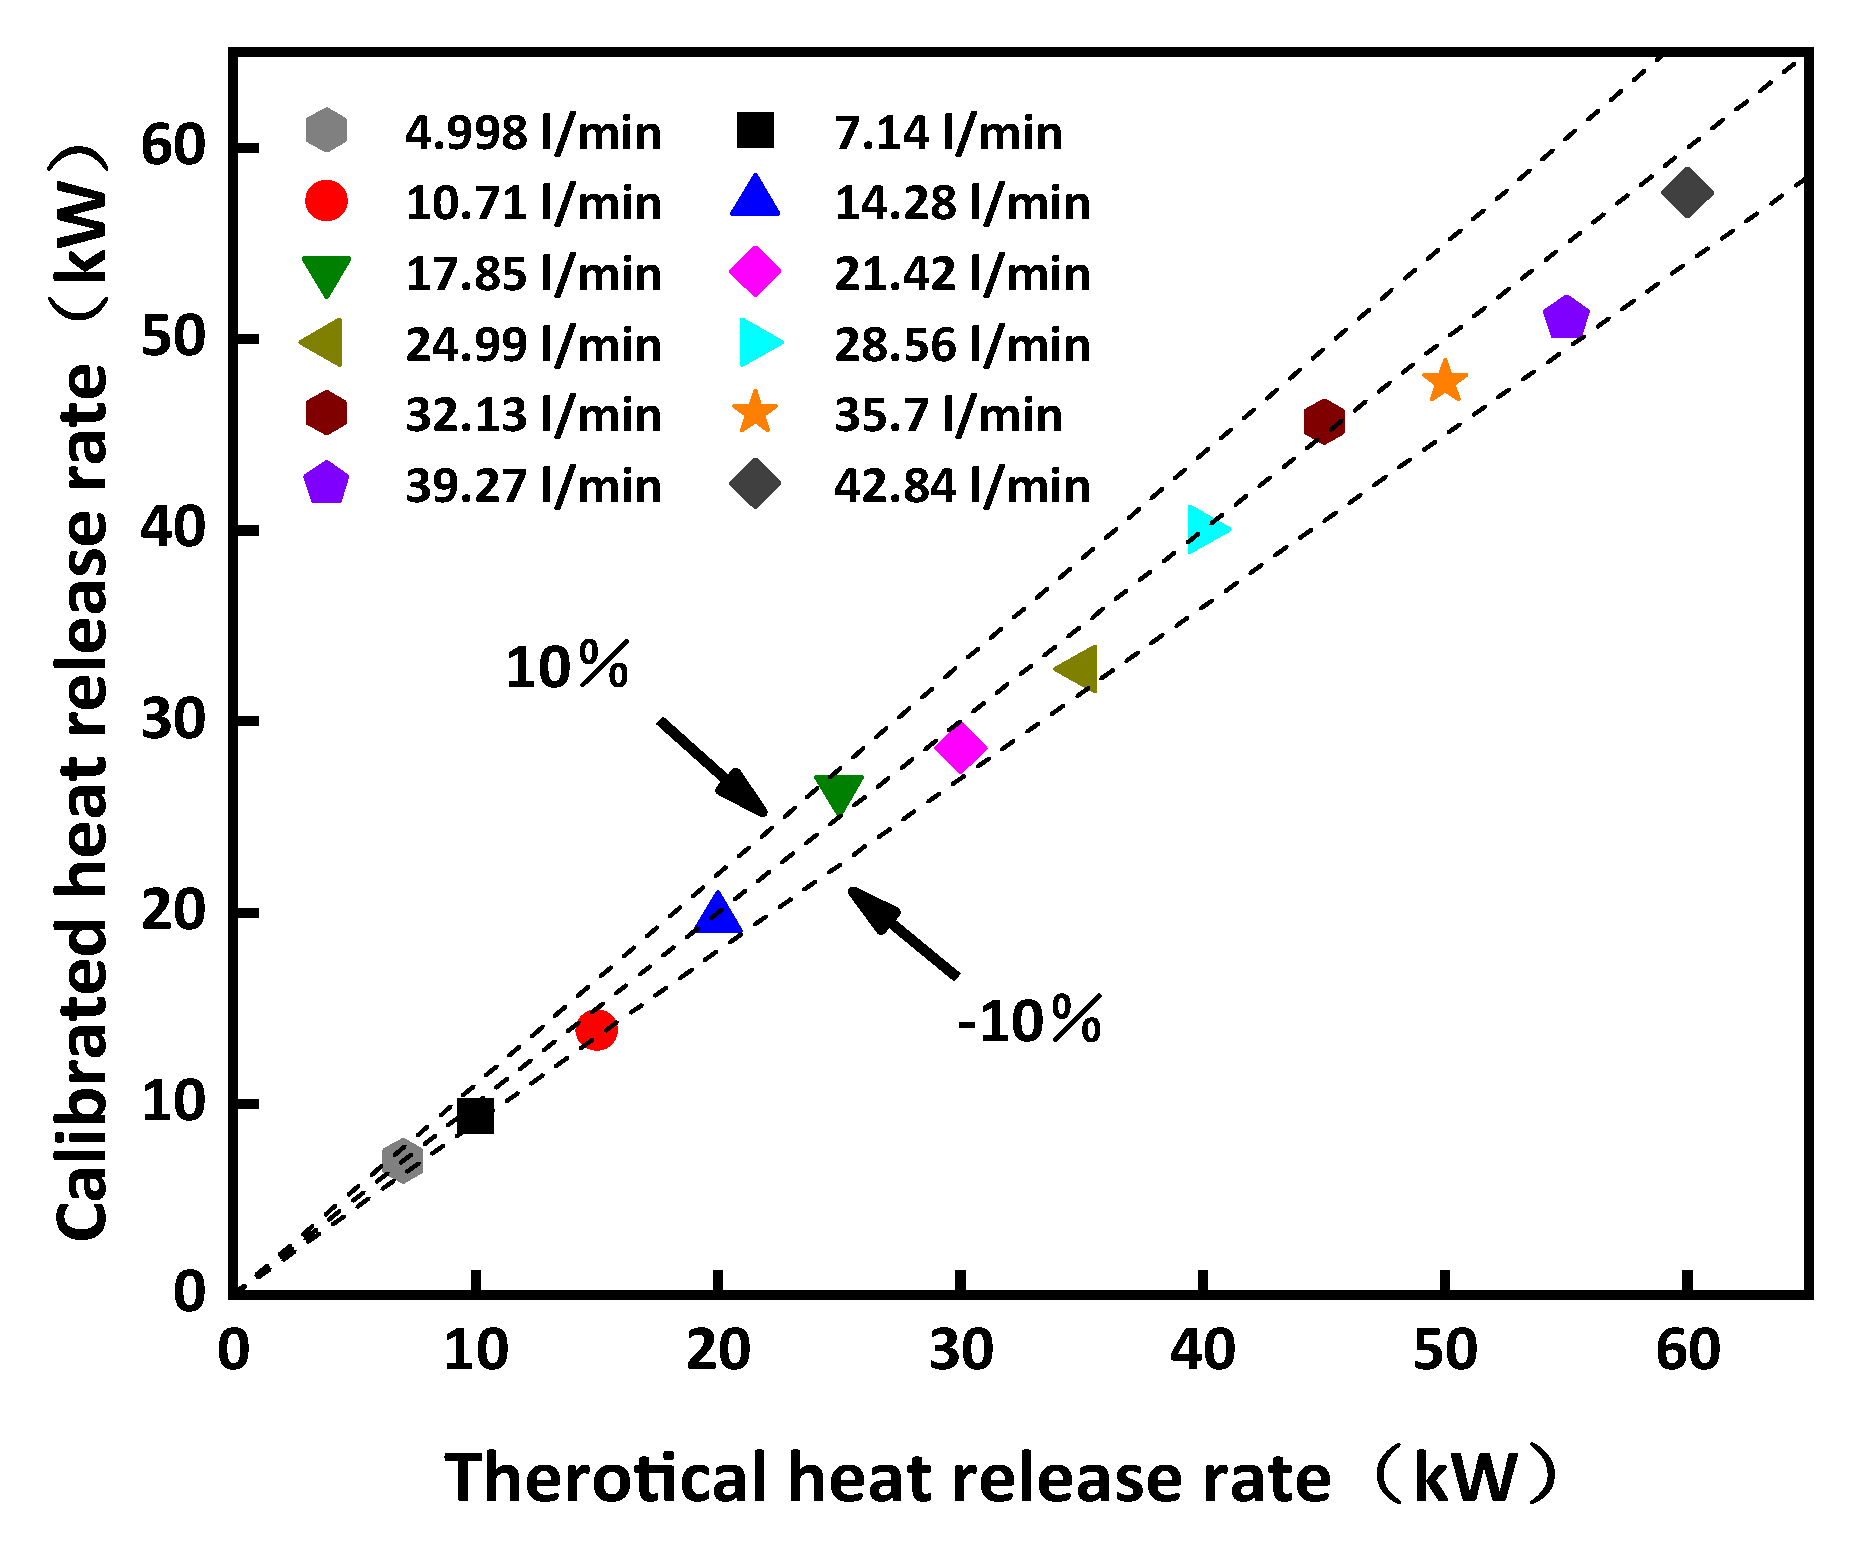
Throughout the calibration tests, the extraction rate was maintained at a level sufficient to prevent any smoke from spilling beyond the hood’s confines. For each test, the mass flow rate of fuel was controlled by using the Rotameter with an error of around 5%. The propane gas flow rates ranged from 4.99 L/min to 42.84 L/min, correlating to theoretical HRRs of 7 kW to 60 kW, respectively. The test lasted for 300 s, and the parameters, such as temperature, velocity, oxygen concentration, and CO and CO2 levels in the duct, were recorded continuously. The mass of hot smoke, as well as the mass of consumed oxygen and the corresponding HRR, were estimated. The average HRRs, measured 200 s after achieving a relatively stable state, were used as the calibrated value. The discrepancies between the calibrated and theoretical HRRs were approximately −10% to 10%, as illustrated in Figure 3.
After the calibration studies, a series of experiments were conducted in the 50 cm × 50 cm × 50 cm room. Five different opening sizes, namely 20 cm × 10 cm, 20 cm × 15 cm, 20 cm × 20 cm, and 20 cm × 30 cm, were adopted, and the supplying fuel rates varied from 4.99 L/min to 35.7 L/min, corresponding to theoretical HRRs of 7 kW to 42.4 kW, as shown in Table 1. The cubic room was placed under the hood, as shown in Figure 1. For each test, combustion lasted for around 600 s once the flow rate reached the pre-defined value. The smoke spilled out of the room from the opening and was then collected by the hood; the temperature, the velocity, and the concentration of O2, CO, and CO2 in the duct were also continuously recorded. After a fire test, sufficient time was taken to cool down the compartment walls to minimize the impact of the pre-heated solid wall on the ambient temperature.

3. Results

Impact of Opening Factor on HRR

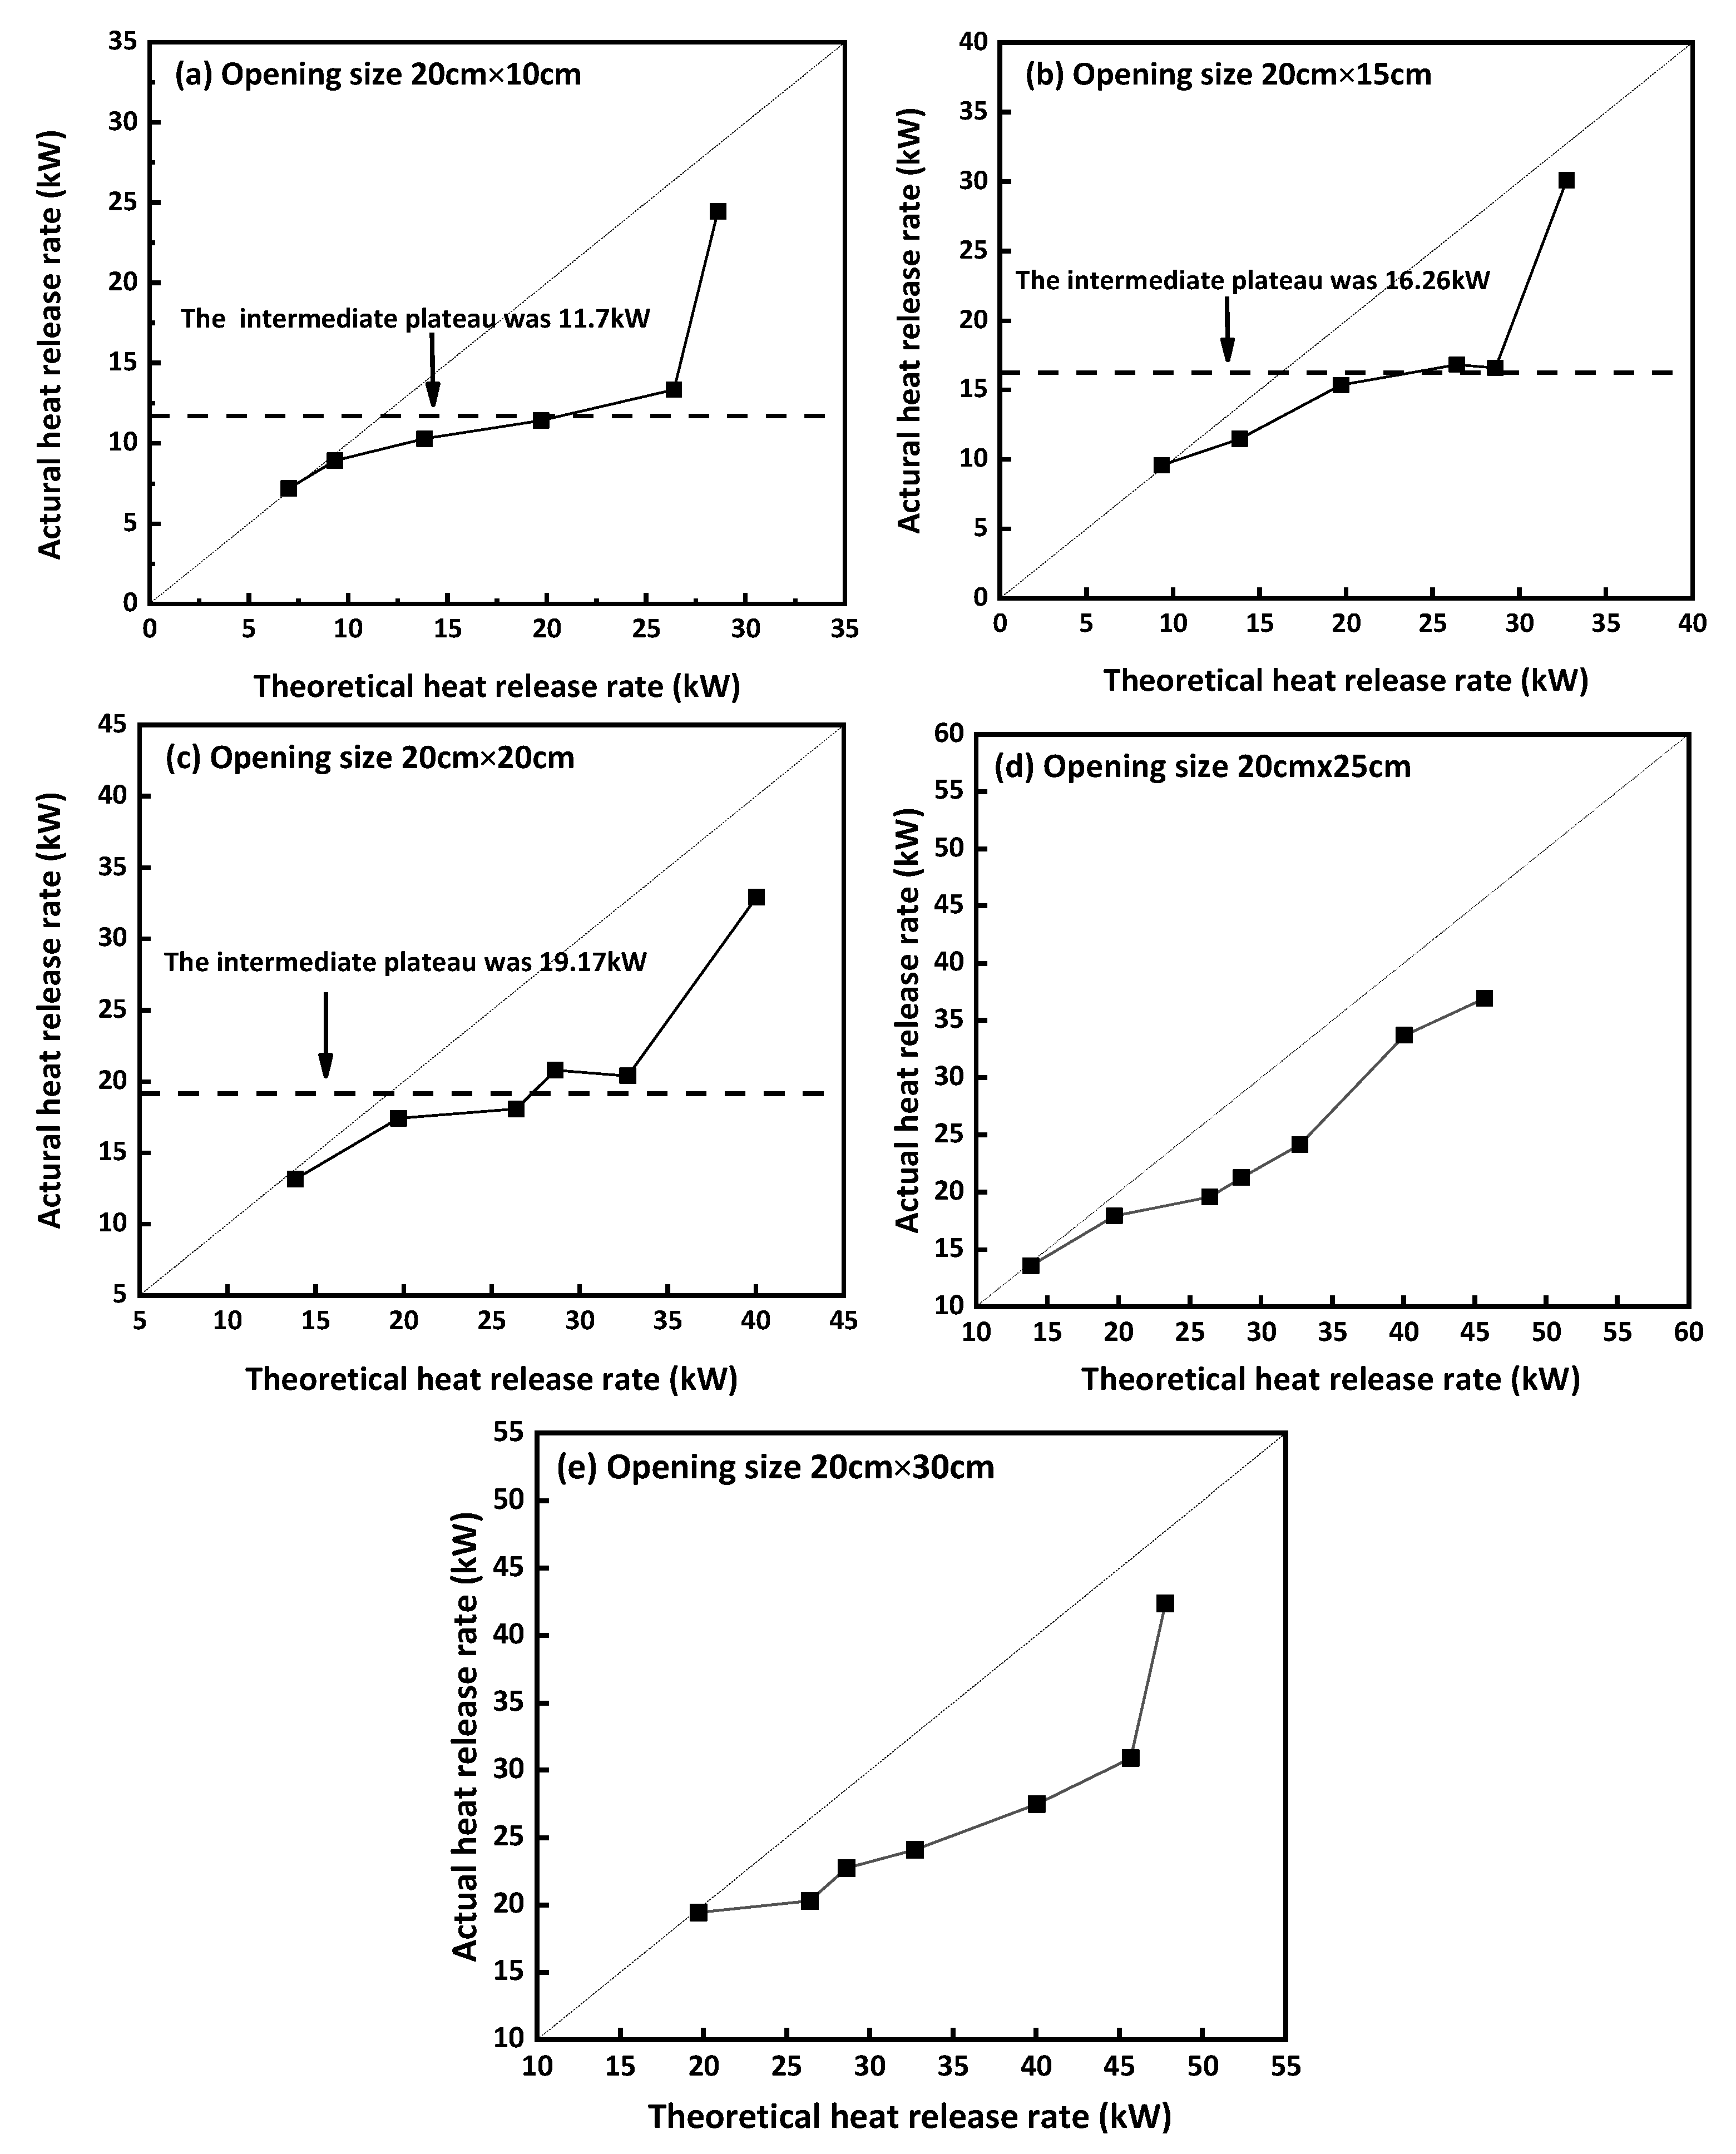
The impact of the opening factor on overall HRRs is presented in Figure 4. For a ventilation factor of 0.08944 m3/2, the maximum heat release rate is 13.42 kW, based on Equation (2). The flow rates varied from 5 L/min to 21.42 L/min. For flow rates of 4.9 L/min and 7.14 L/min, the measured HRRs were 7.19 kW and 8.92 kW, respectively. These HRR values were consistent with the calibrated values observed in open space. With the fuel rates further increased to 10.71 L/min, 14.28 L/min, and 17.85 L/min, the corresponding measured HRRs were 10.29 kW, 11.43 kW, and 13.35 kW, respectively, whilst HRRs were 13.8 kW, 19.7 kW, and 26.4 kW. These HRRs were significantly lower than those measured in open space, which indicates that the ventilation was restricting the heat release rates. However, when the fuel rate reached 21.42 L/min, the actual HRR jumped up to 24.45 kW, which is close to the measured HRR in open space, namely 28.6 kW.
With the increase in fuel rates, there are three distinctive regions. At lower fuel rates, the measured values in the room were consistent with those theoretical values in open space, which indicates the combustion is complete. At intermediate fuel rates, the measured values in the room were much lower than those theoretical values in open space. Furthermore, the actual HRR is almost a constant of around 11.7 kW irrespective of the increase in flow rates within a certain range. The intermediate plateau HRR was close to the maximum heat release rate of 13.42 kW for the opening size. During this plateau period, flames existed only inside the enclosure, with excess pyrosis escaping outside the enclosure until it ignited after a certain time. After this ignition, the measured heat release rate jumped up to the value corresponding to the designed steady state heat release rate. Inspection and comparison show that the intermediate plateau value of the heat release rate is equal to 1500   A H 1 / 2 kW, as discussed in the previous section. At higher flow rates, the measured HRR in the room was close to the theoretical values in open space again.
(Each point in a figure represents a test scenario, e.g., the five points in Figure 4a represent V-1, V-2, V-3, V-4, V-5, and V-6, respectively).
For ventilation factors of 0.01342 m3/2 and 0.02236 m3/2, at varying fuel rates, similar results were observed. With lower fuel rates, the HRRs were consistent with the calibrated values in open space, and the intermediate plateau that was reached as the fuel rate increased illustrated that the HRR was restricted by the ventilation. Finally, the measured HRRs went close to but were less than the calibrated values after the intermediate plateau.
However, the opening size increased to 20 cm × 25 cm and 20 cm × 30 cm, corresponding to ventilation factors of around 0.02236 and 0.02683, respectively. The measured HRRs with a ventilation factor of 0.02236 m3/2 at varying fuel rates of 7.9 L/min and 11.9 L/min in the compartment were 13.56 kW to 17.93 kW, while the calibrated HRRs in open space were around 13.86 kW and 19.07 kW. The measured HRR was 19.56 kW, 21.26 kW, 24.16 kW, and 33.7 kW as the fuel rate ranged from 17.85 L/min to 28.56 L/min, and the calibrated HRRs were 26.4 kW, 28.6 kW, 32.73 kW, and 40.04 kW, respectively; it is obvious that the ventilation controlled the combustion, but the intermediate plateau was not expected. The same result was shown under a ventilation factor of 0.02683 m3/2. The measured HRRs with a small flow rate were basically identical to the calibrated HRRs in open space. The measured HRRs were 18.54 kW, 21.82 kW, 24.1 kW, 27.5 kW, and 30.9 kW, corresponding to the calibrated HRRs 26.4 kW, 28.62 kW, 32.73 kW, 40.04 kW, and 45.68 kW. Likewise, the measured HRRs did not reach a stable plateau as the ventilation controlled the combustion process. With the increasing fuel rate, the measured HRR of 42.4 kW got close to the calibrated HRR of 47.77 kW.
Chotzoglou et al. [4] made an assumption that all oxygen is consumed in the enclosure in the intermediate plateau, and they proposed the following equation as:
C = Q ˙ a c t / 3000 A H 1 / 2
For the ventilation at 0.008944, 0.013416, and 0.01789, the intermediate plateau values Q ˙ a c t were 11.7 kW, 16.26 kW, and 19.17 kW, calculated through the average number of the measured HRRs under ventilation-limited conditions. And the C of the three ventilation factors were 0.436, 0.403, and 0.357, respectively. However, it should be noted that it is impossible that all the oxygen was consumed in the compartment, and this assumption was adopted to obtain the C for a comparison with other research. Furthermore, for the ventilation at 0.0224 m5/2 and 0.0268 m5/2, the intermediate plateau did not exist, and the C value cannot be estimated in this circumstance.
(The glass was replaced by PROMATECT® fireproof board, and the internal flame was not observed for higher flow rates.)
Figure 5 presents a comparison of combustion efficiency at different flow rates. For the opening size of 20 cm × 10 cm, the combustion efficiencies decreased gradually from 1.02 to 0.53 with the increasing of flow rates from 5 L/min to 17.85 L/min. A minimum combustion efficiency was around 53%, and the combustion efficiency increased to 81% when the flow rate further increased to 21.42 L/min. For other opening sizes, a similar trend was observed. Generally, the combustion efficiency decreases with the increase in flow rates until it reaches a minimum and then increases greatly.
Figure 6 shows the flame behavior at different ventilation conditions. For the opening size of 20 cm × 10 cm, the flames were observed only in the compartment at flow rates from 5 L/min to 14.28 L/min. At higher flow rates, e.g., 17.85 L/min and 21.42 L/min, the flame was extended from the opening. As noted, the glass was broken easily at higher flow rates and it was replaced by PROMATECT® fireproof board, and the internal flame was not observed. Only the external flame was observed for larger flow rates. At a flow rate of 17.85 L/min, the combustion reached a minimum even when the flame extended out of the opening, which means that the escaping gas fuel was not combusted completely. A similar behavior was observed for other opening sizes.
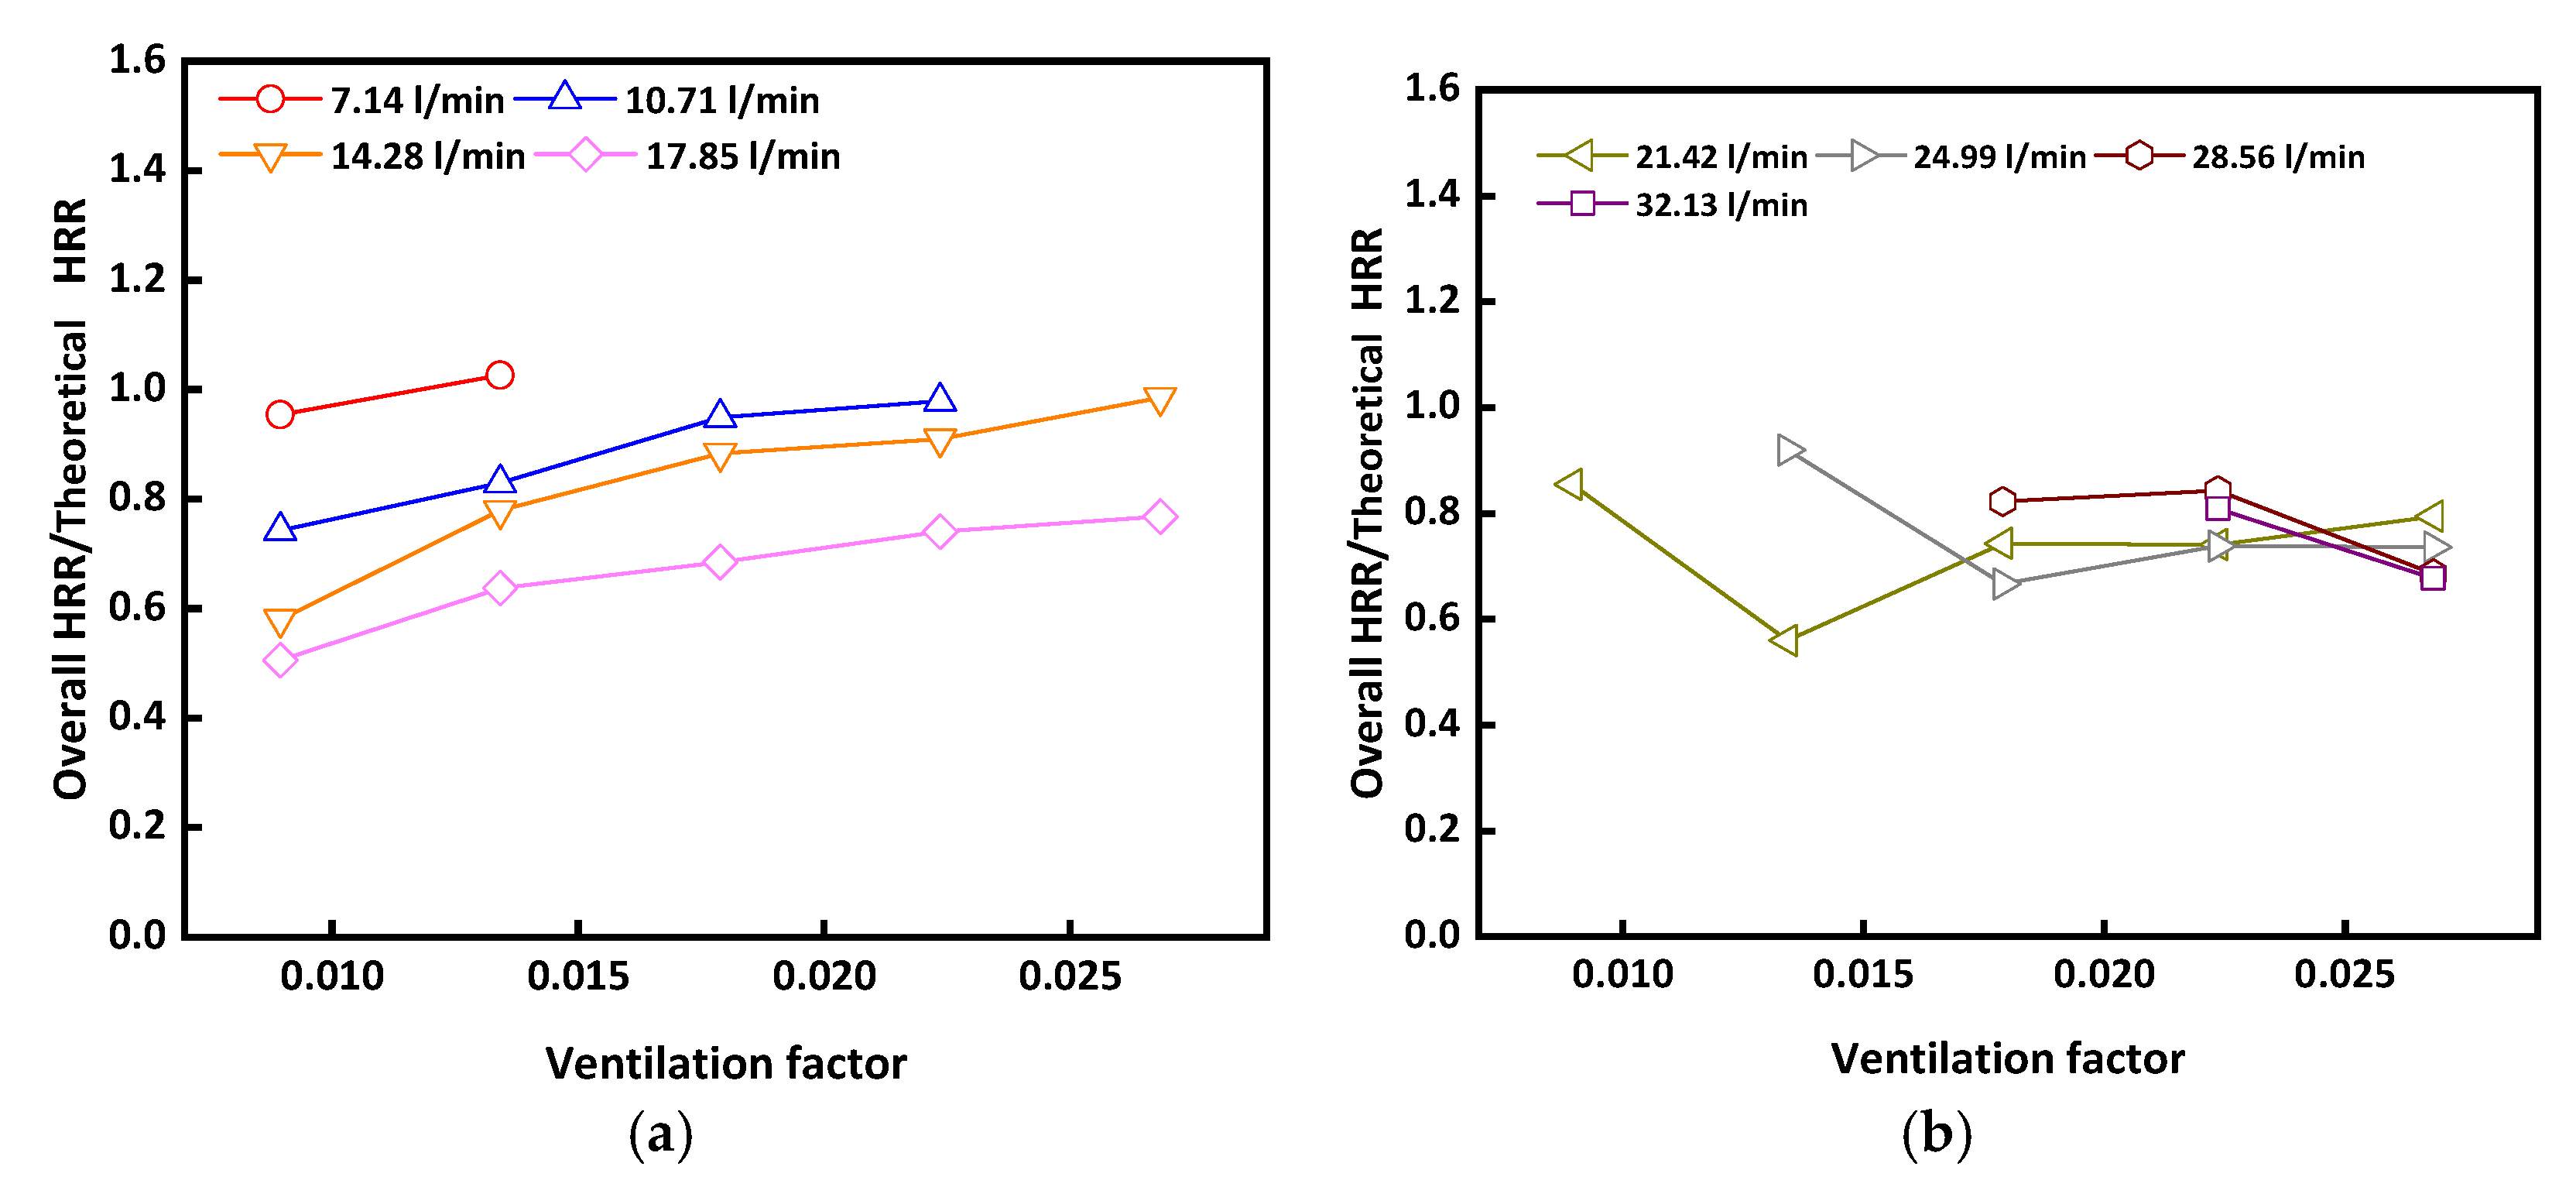
Figure 7 compares the combustion efficiencies at different ventilation conditions at different flow rates. At a flow rate of 17.85 L/min, as shown in Figure 7a, the combustion efficiencies were 0.53, 0.67, 0.72, 0.78, and 0.81 at opening sizes of 20 × 10 cm, 20 × 15, 20 × 20, 20 × 25, and 20 × 30, respectively. This is true for lower flow rates of 7.14 L/min, 10.71 L/min, and 14.28 L/min. It can be seen that at a fixed flow rate, the combustion efficiency monotonously increased with the opening size.
At higher flow rates of 21.42 L/min, as shown in Figure 7b, the combustion efficiencies were 0.81, 0.55, 0.69, 0.70, and 0.75 at opening sizes of 20 × 10 cm, 20 × 15, 20 × 20, 20 × 25, and 20 × 30, respectively. The highest combustion efficiency was achieved at the smallest opening size, while the lowest combustion efficiency was obtained at the second-smallest opening size. A similar trend was observed for higher flow rates of 24.99 L/min, 28.56 L/min, and 32.13 L/min. At lower flow rates, the increase of the opening size is beneficial to the ventilation condition, thus improving the combustion efficiency. At higher flow rates, the gas fuel cannot be combusted completely within the room, and the excess gas fuel escapes from the opening. However, whether the escaping fuel could combust completely or not depends on both the opening size and flow rates.

4. Discussion

Chotzoglou [4] investigated the burning behavior of liquid fuel pool fires in corridor-like enclosures and found that the mass in long enclosures (e.g., corridors) is less than in rectangular enclosures with the same opening geometry, and the Cs were around 0.347–0.516. Table 2 illustrates a comparison of studies by other researchers, and the ventilation constant C varied greatly. The Cs in this study were around 0.357–0.436, which are even much less than the corridor-like enclosures. Also, the ventilation constant for the larger opening is lower than that for the smaller opening.
Lee et al. [8] studied propane and methane gas burners in three different enclosure geometries with the sizes of 0.5 m × 0.5 m × 0.5 m, 1 m × 0.5 m × 0.5 m, and 1.5 m × 0.5 m × 0.5 m, respectively. They proposed the ‘fuel to air’ global equivalence ratio ( φ ) as:
φ = Q ˙ t h / Q ˙ s t , i n = m ˙ Δ H / 3000 × C × A H
Comparison studies by other researchers on combustion efficiency at different equivalent ratios φ are shown in Figure 8. At φ values of much less than 1, the combustion efficiency is nearly 100%. The combustion efficiency at equivalence ratios between 1 and 2 initially decreased from 0.9 to 0.8, but then gradually increased and approached 1. Yamada’s experimental results show nearly complete combustion in the compartment at an equivalence ratio of greater than 2, while Lee’s results indicate combustion efficiency in the range of 0.9 to 1 for an equivalence ratio of greater than 2.
In the present experiment, the combustion efficiency is close to 1 at φ much less than 1 and decreases to the minimum combustion efficiency as φ approaches 1. The minimum value is around 0.5 at an opening size of 20 × 10. However, as the opening size increases, the minimum combustion efficiency also increases, which is much lower than that in other experiments, with a minimum combustion efficiency of around 0.8. When φ is greater than 1, the combustion efficiency obtained increases as high as that of Lee’s results, with combustion efficiency ranging from 0.8 to 1, which is different from Yamada’s empirical formula.

5. Conclusions

A series of experiments were carried out to investigate the ventilation constant and heat release rate in a cubic compartment under different opening conditions. It is found that the ventilation constant C varied at around 0.357–0.436, which is even much less than the corridor-like enclosures.
In the experimental setup, the overall HRR equals the HRR inside the compartment plus the HRR outside the compartment. For the combustion of gas fuel at an equivalent ratio of 2, the overall combustion efficiency is as low as 50%, which is far below the value reported by other researchers. It is interesting to note that the overall combustion efficiency could be the minimum even when the flame extended from the opening. At larger equivalent ratios, the overall combustion efficiency increased greatly as the escaping gas fuel combusted outside of the compartment.

Author Contributions

Conceptualization, Y.S.; Investigation, W.L. and Q.L.; Resources, P.L.; Data curation, Q.Y. and Z.X.; Visualization, H.W.; Supervision, G.C. All authors have read and agreed to the published version of the manuscript.

Funding

This research received no external funding.

Institutional Review Board Statement

Not applicable. The study did not involve human or animal subjects.

Informed Consent Statement

Informed consent was obtained from all participants involved in the study. Written informed consent has been obtained from the patient(s) to publish any identifiable data and images in this manuscript.

Data Availability Statement

The original contributions presented in this study are included in the article. Further inquiries can be directed to the corresponding authors.

Conflicts of Interest

Authors Weiheng Li, Yong Sheng, Qi Yu, Zhiqiang Xiao, Guo Chen, Hao Wang were employed by the company Chongqing Railway Group Co., Ltd., author Qishuo Liao was employed by the company Chongqing City Transportation Development & Investment Group Co., Ltd. The remaining authors declare that the research was conducted in the absence of any commercial or financial relationships that could be construed as a potential conflict of interest.

References

  1. Kawagoe, K.; Sekine, T. Estimation of fire temperature rise curves in concrete buildings and its application. Bull. Jpn. Assoc. Fire Sci. Eng. 1963, 13, 1–12. [Google Scholar]
  2. Kawagoe, K. Fire Behaviour in Rooms; Report 27; Building Research Institute, Ministry of Construction: Tokyo, Japan, 1958.
  3. Babrauskas, V.; Williamson, R.B. Post-flashover compartment fires: Basis of a theoretical model. Fire Mater. 1978, 2, 39–53. [Google Scholar] [CrossRef]
  4. Chotzoglou, K.E.; Asimakopoulou, E.K.; Zhang, J.; Delichatsios, M.A. An experimental investigation of burning behaviour of liquid pool fire in corridor-like enclosures. Fire Saf. J. 2019, 108, 102826. [Google Scholar] [CrossRef]
  5. Thomas, P.H.; Heselden, A.; Law, M. Fully-Developed Compartment Fires: Two Kinds of Behaviour; HM Stationery Office: London, UK, 1967. [Google Scholar]
  6. Thomas, I.R.; Bennetts, I.D. Fires in enclosures with single ventilation openings—Comparison of long and wide enclosures. Fire Saf. Sci. 2000, 6, 941–952. [Google Scholar] [CrossRef]
  7. Drysdale, D. An Introduction to Fire Dynamics; John Wiley & Sons: Hoboken, NJ, USA, 2011. [Google Scholar]
  8. Lee, Y.P.; Delichatsios, M.A.; Silcock, G.W.H. Heat fluxes and flame heights in façades from fires in enclosures of varying geometry. Proc. Combust. Inst. 2007, 31, 2521–2528. [Google Scholar] [CrossRef]
  9. Yamada, T.; Takanashi, K.I.; Yanai, E.; Suzuki, T.; Sekizawa, A.; Sato, H.; Kurioka, H. An experimental study of ejected flames and combustion efficiency. Fire Saf. Sci. 2003, 7, 903–914. [Google Scholar] [CrossRef]
  10. Huggett, C. Estimation of rate of heat release by means of oxygen consumption measurements. Fire Mater. 1980, 4, 61–65. [Google Scholar] [CrossRef]
  11. Cai, N.; Chow, W.K. Numerical studies on heat release rate in room fire on liquid fuel under different ventilation factors. Int. J. Chem. Eng. 2012, 2012, 910869. [Google Scholar] [CrossRef]
  12. Zhao, G.; Beji, T.; Merci, B. Application of FDS to under-ventilated enclosure fires with external flaming. Fire Technol. 2016, 52, 2117–2142. [Google Scholar] [CrossRef]
  13. Afflard, A.; Koutaiba, E.M.; Asimakopoulou, E.; Kolaitis, D.; Zhang, J.; Lardet, P. Numerical investigation of fire development in a medium scale iso9705 compartment-façade configuration. In Proceedings of the Fire Safety of Facades International Symposium, Paris, France, 25–27 July 2019; pp. 26–27. [Google Scholar]
  14. Law, M. Fire safety of external building elements. Eng. J. 1978, 15, 59–74. [Google Scholar] [CrossRef]
  15. Dinenno, P.J.; Society of Fire Protection Engineers; National Fire Protection Association. SFPE Handbook of Fire Protection Engineering; National Fire Protection Association: Quincy, MA, USA, 1995. [Google Scholar]
  16. Chow, W.K.; Han, S.S. Heat release rate calculation in oxygen consumption calorimetry. Appl. Therm. Eng. 2011, 31, 304–310. [Google Scholar] [CrossRef]
  17. Rockett, J.A. Fire induced gas flow in an enclosure. Combust. Sci. Technol. 1976, 12, 165–175. [Google Scholar] [CrossRef]
  18. Karlsson, B.; Quintiere, J. Energy release rates. In Enclosure Fire Dynamics; CRC Press: Boca Raton, FL, USA, 2000; Chapter 3. [Google Scholar]
  19. Chow, W.K.; Zou, G.W. Correlation equations on fire-induced air flow rates through doorway derived by large eddy simulation. Build. Environ. 2005, 40, 897–906. [Google Scholar] [CrossRef]
  20. Asimakopoulou, E.K.; Chotzoglou, K.; Kolaitis, D.I.; Founti, M.A. Characteristics of externally venting flames and their effect on the façade: A detailed experimental study. Fire Technol. 2016, 52, 2043–2069. [Google Scholar] [CrossRef]
  21. Wang, Z.; Zhang, T.; Huang, X. Numerical modeling of compartment fires: Ventilation characteristics and limitation of Kawagoe’s law. Fire Technol. 2022, 60, 1245–1268. [Google Scholar] [CrossRef]
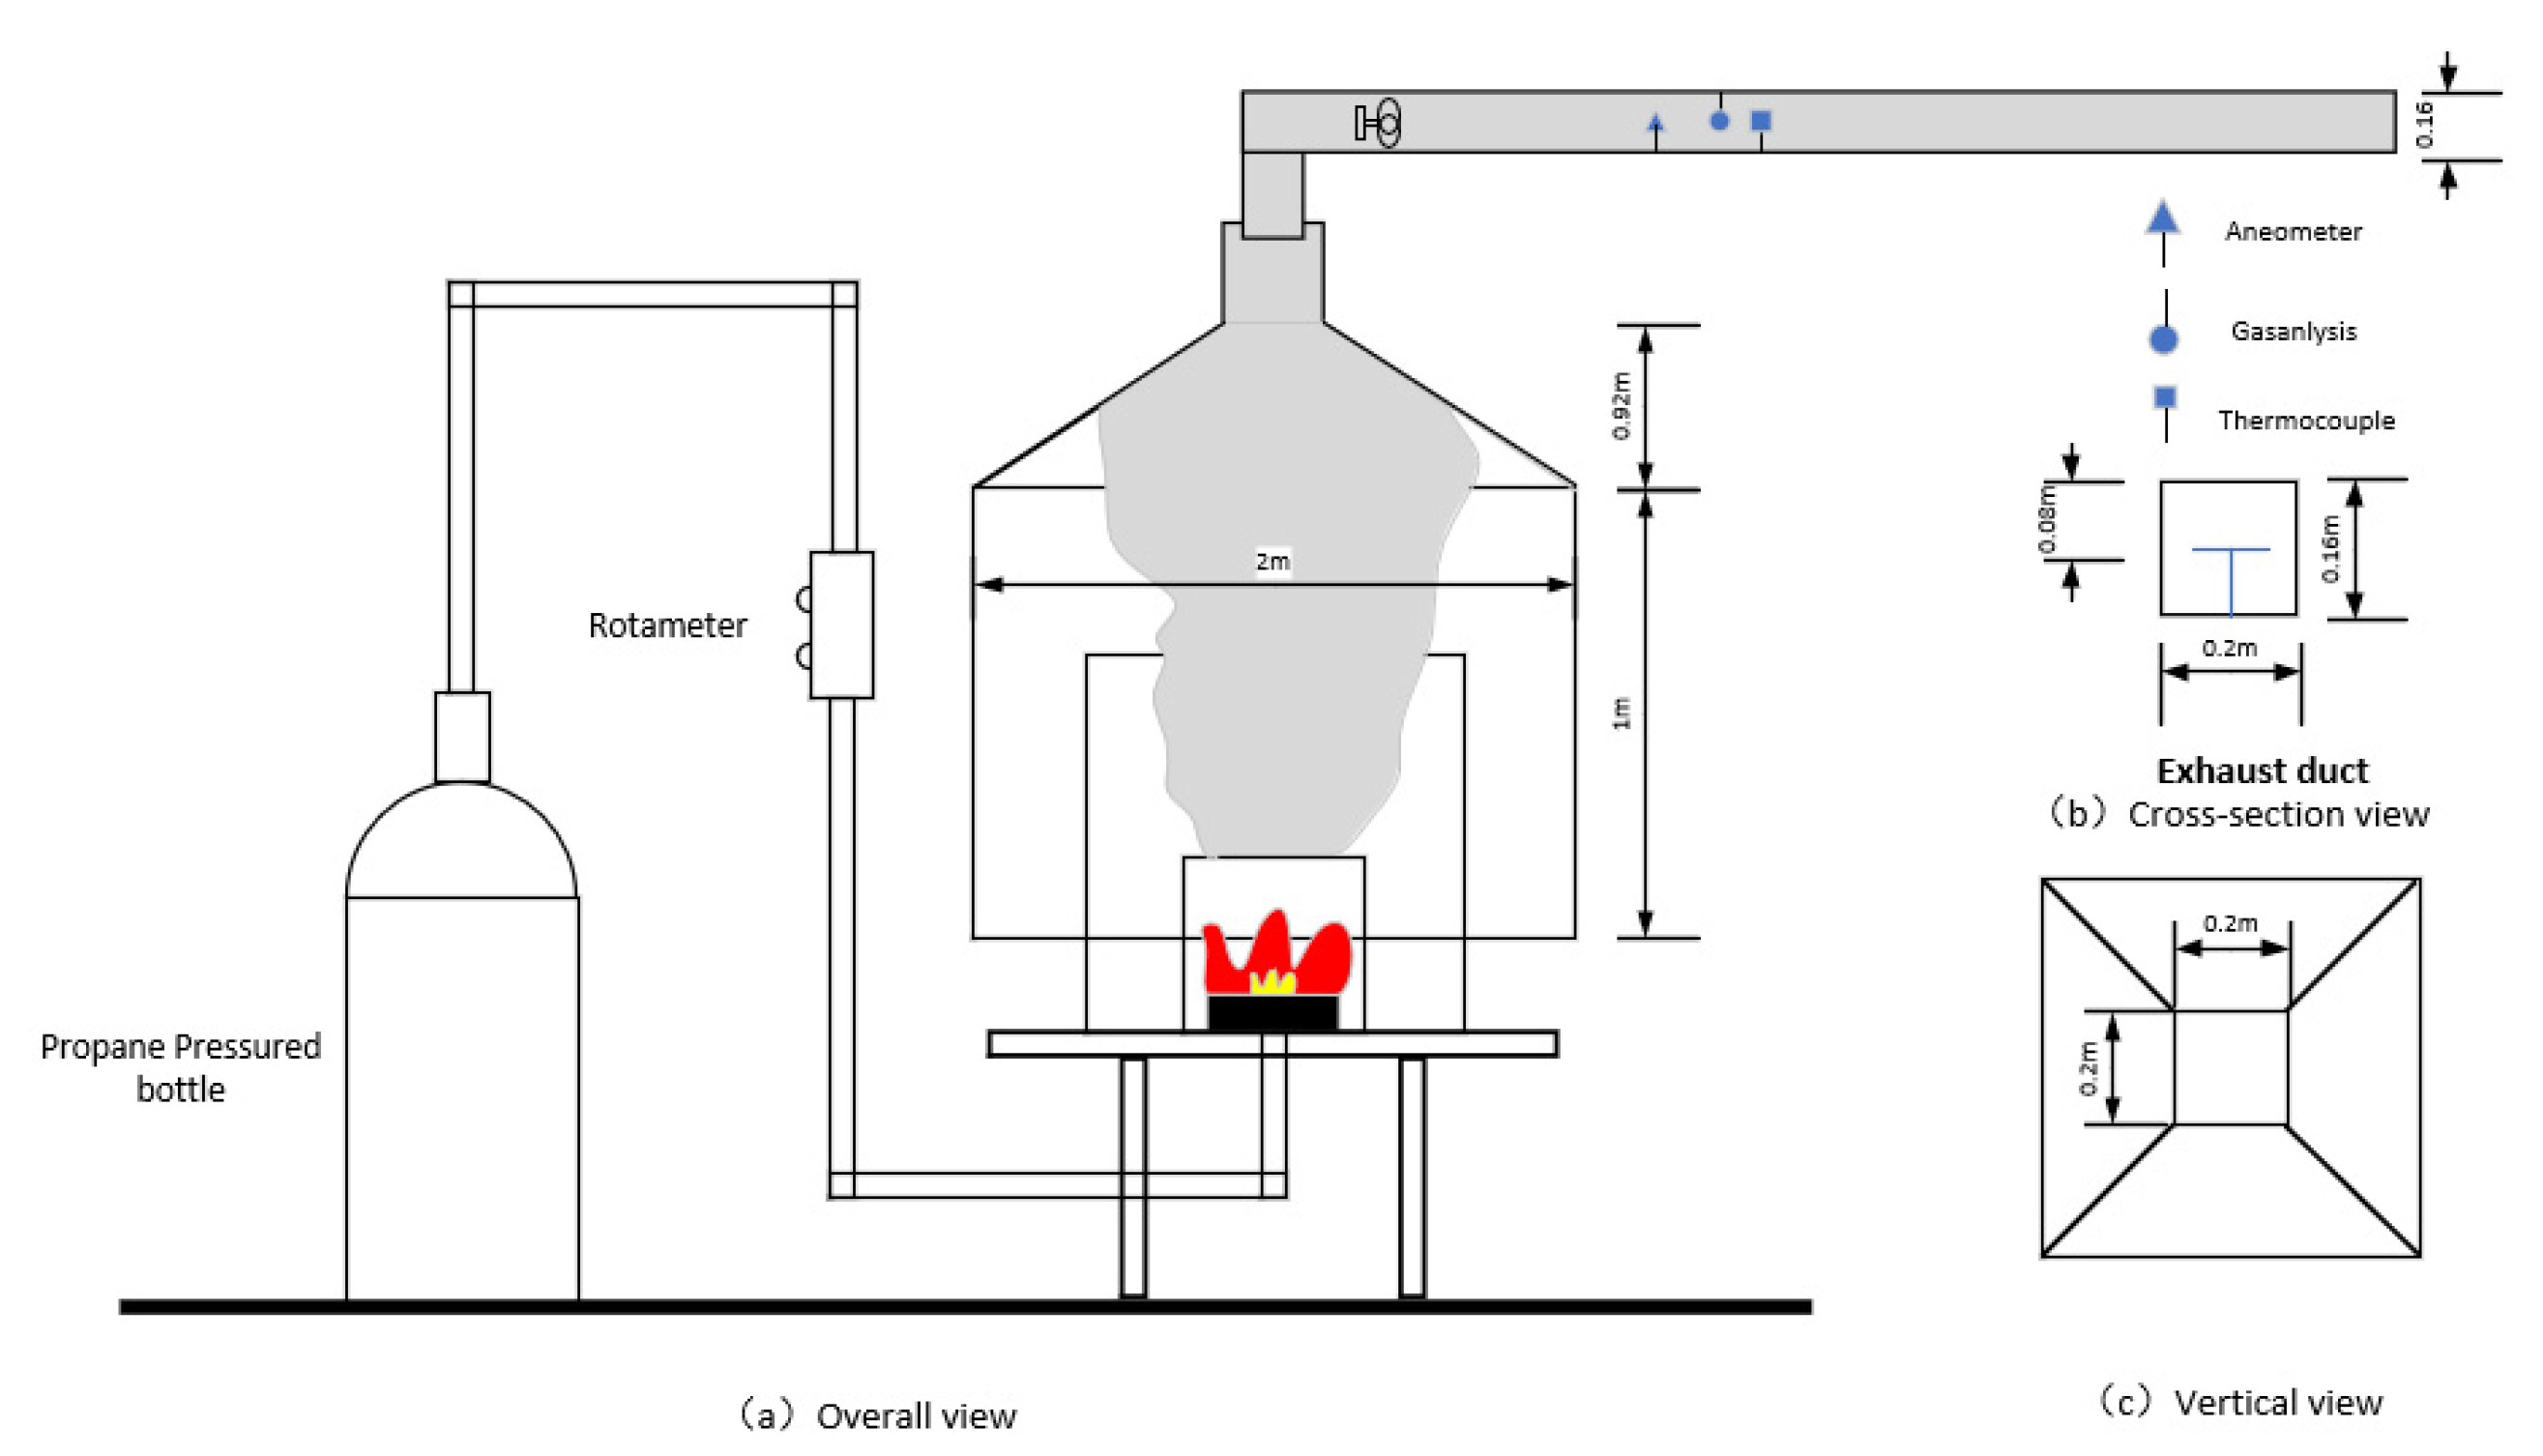
Figure 1. Schematic view of experimental setup for calibration of HRR.
Fire 08 00215 g001
Figure 2. Experimental setup for room fire.
Fire 08 00215 g002
Figure 3. Relative errors between theoretical HRR and measured HRR in open space.
Fire 08 00215 g003
Figure 4. A comparison of theoretical and actual heat release rates. ((ae) correspond to the data of Group I-V in Table 1).
Fire 08 00215 g004
Figure 5. A comparison of combustion efficiency at different flow rates.
Fire 08 00215 g005
Figure 6. Flame at different opening sizes. (a) Opening size of 20 cm × 10 cm, (b) opening size of 20 cm × 30 cm.
Fire 08 00215 g006
Figure 7. Combustion efficiency at different ventilation conditions. (a) Low flow rates, (b) high flow rates.
Fire 08 00215 g007
Figure 8. Comparison of combustion efficiency at different equivalent ratios.
Fire 08 00215 g008
Table 1. A summary of the experimental scenarios. (The combustion efficiency of greater than 1 may be due to the measurement error).
No.Flow Rate (L/min) 1500 A H
( k W )
Opening   Size   ( H ×   W )   ( cm × cm)Theoretical HRR (kW) Actual   Overall   HRR   ( k W ) Combustion Efficiency
I-114.2840.2520 × 3020.1719.430.96
I-217.8525.2120.30.81
I-321.4230.2522.730.75
I-424.9935.2924.10.68
I-528.5640.3327.50.68
I-632.1345.3730.90.68
I-735.750.4142.40.84
II-110.7133.5420 × 2515.1213.560.90
II-214.2820.1717.930.89
II-317.8525.2119.560.78
II-421.4230.2521.260.70
II-524.9935.2924.160.68
II-628.5640.3333.70.84
II-732.1345.3736.930.81
III-110.7126.8320 × 2015.1213.150.87
III-214.2820.1717.420.86
III-317.8525.2118.080.72
III-421.4230.2520.790.69
III-524.9935.2920.390.58
III-628.5640.3332.920.82
IV-17.1420.1220 × 1510.089.590.95
IV-210.7115.1211.490.76
IV-314.2820.1715.360.76
IV-417.8525.2116.830.67
IV-521.4230.2516.590.55
IV-624.9935.2930.10.85
V-1513.4220 × 107.067.191.02
V-27.1410.088.920.88
V-310.7115.1210.290.68
V-414.2820.1711.430.57
V-517.8525.2113.350.53
V-621.4230.2524.450.81
Table 2. Previous study on ventilation coefficients.
ResearchersMethodScaleFire Stage C a C H R R
Rockett [17]ExperimentFull scaleAll stages0.40–0.61-
Chotzoglou [4]Experiment ethanolSmall scaleAll stages0.347–0.5161100
Karlsson & Quintiere [18]TheoreticalMulti scalesUnder-ventilated0.501518
Chow et al. [19]3-D simulationFull scaleOver-ventilated0.47/0.44
Lee et al. [8]ExperimentSmall scaleUnder-ventilated 1500
Zhao et al. [12]3-D simulationSmall scaleUnder-ventilated0.411131
Asimakopoulou et al. [20]3-D simulationSmall scaleUnder-ventilated 925
Wang [21]3-D simulationFull scaleOver-ventilated0.441158
Wang [21]2-D simulationFull scaleOver-ventilated0.521220
This workExperimentSmall scaleOver-ventilated0.357–0.436
Disclaimer/Publisher’s Note: The statements, opinions and data contained in all publications are solely those of the individual author(s) and contributor(s) and not of MDPI and/or the editor(s). MDPI and/or the editor(s) disclaim responsibility for any injury to people or property resulting from any ideas, methods, instructions or products referred to in the content.