Article

Dual-GRU Perception Accumulation Model for Linear Beam Smoke Detector

by
Zhuofu Wang
1,2,3,
Boning Li
1,2,3,*,
Li Wang
1,2,3,
Zhen Cao
1 and
Xi Zhang
1,2,3
1
Shenyang Fire Research Institute of M.E.M., Shenyang 110034, China
2
National Engineering Research Center of Fire and Emergency Rescue, Shenyang 110034, China
3
Key Laboratory of Fire Prevention Technology of Liaoning Provincial, Shenyang 110034, China
*
Author to whom correspondence should be addressed.
Fire 2025, 8(6), 229; https://doi.org/10.3390/fire8060229
Submission received: 9 May 2025 / Revised: 9 June 2025 / Accepted: 9 June 2025 / Published: 11 June 2025
(This article belongs to the Special Issue Advances in Industrial Fire and Urban Fire Research: 2nd Edition)

Abstract

Due to the complex structure of high-rise space buildings, traditional point fire detectors are not effective in terms of detection range and installation difficulty. Although linear beam smoke detectors are widely adopted, they still face problems such as low accuracy and false alarms caused by interference. To address these limitations, we constructed a 120 m experimental platform for analyzing smoke–light interactions. Through systematic investigation of spectral scattering phenomena, optimal operational wavelengths were identified for beam-type detection. By improving the gated recurrent unit (GRU) neural network, an algorithm combining dual-wavelength information fusion and an attention mechanism was designed. The algorithm integrates dual-wavelength information and introduces the cross-attention mechanism into the GRU network to achieve collaborative modeling of microscale scattering characteristics and macroscale concentration changes of smoke particles. The alarm strategy based on time series accumulation effectively reduces false alarms caused by instantaneous interference. The experiment shows that our method is significantly better than traditional algorithms in terms of accuracy (96.8%), false positive rate (2.1%), and response time (6.7 s).

1. Introduction

In the process of modern urbanization, there has been a significant upsurge in the construction of large-scale high-volume buildings, including convention centers, museums, and other architectural forms. These buildings, with their distinctive spatial architectures and diverse functional attributes, have evolved into crucial platforms for urban cultural dissemination and economic activities. Nevertheless, in contrast to conventional buildings, high-volume structures feature considerable vertical dimensions and expansive volumes, endowing them with a series of unique fire risk characteristics. Firstly, a large amount of combustible materials is typically stored indoors, which substantially increases the fire load. Additionally, well-designed ventilation systems, although essential for normal operation, can accelerate fire spread once a fire occurs. Flames can propagate rapidly, making firefighting operations extremely challenging and posing a severe threat to human safety and property. Traditional point-type smoke and temperature fire detectors encounter significant obstacles in fulfilling effective fire detection in high-volume buildings. Constrained by their operational principles and performance limitations, these detectors have a limited detection range. To achieve comprehensive coverage in large-scale spaces, a dense installation of detectors is required. This not only leads to a substantial increase in costs, but may also create detection blind spots due to inappropriate installation locations. Consequently, linear beam smoke detectors have emerged as a viable solution and have been extensively applied in high-volume buildings. Linear beam smoke detectors typically employ engineering plastic casings for lightweight design and cost efficiency, making them suitable for non-corrosive or low-corrosive environments (e.g., indoor commercial spaces). For harsh environments, such as chemical plants, metallurgical facilities, or coastal areas with high humidity and salt content, detectors with stainless steel casings are preferred. Stainless steel enhances resistance to moderate acids, alkalis, salt spray, and sulfides, extending the detector’s applicability to scenarios with persistent corrosive challenges. This material flexibility ensures reliable operation across diverse architectural and industrial landscapes, from convention centers to chemically aggressive industrial zones.
Linear beam smoke detectors can be categorized into two distinct types: opposed-beam and reflective. In the opposed-beam configuration, the transmitter and the receiver are installed separately at two diametrically opposite positions, creating an imperceptible beam-based detection barrier in the intervening space. Conversely, the reflective type integrates the transmitter and the receiver into a single unit, and relies on a specially designed reflective lens positioned on the opposite side to redirect the beam back to the receiver. According to recent studies [1,2,3,4], the majority of commercially available linear beam smoke detectors have a monitoring range spanning from 100 to 120 m. These detectors can effectively substitute multiple point-type smoke detectors over extended distances, offering notable advantages such as a large protected area and the ability to be installed at elevated positions. As a result, they are particularly well-suited for environments where the deployment of point-type detectors is challenging or unfeasible.
Infrared beams are the preferred choice for linear beam smoke detectors. This is primarily due to their high sensitivity to smoke particles and invisibility to the human eye, which ensures that they do not compromise the architectural esthetics or interfere with the normal functionality of buildings [1,2]. When smoke traverses the infrared beam, smoke particles cause the beam to scatter and be absorbed, leading to a reduction in the light intensity detected at the receiving end. Consequently, the corresponding electrical signal, which is generated through conversion, also diminishes. By precisely monitoring and analyzing the variations in the received light intensity, it is possible to determine the presence of smoke. There exists a direct correlation between smoke concentration and the degree of light intensity reduction: the higher the smoke concentration, the more pronounced the decrease in light intensity.
Nevertheless, linear beam fire detectors encounter numerous challenges during practical implementation. Characterized by their extended sensing optical paths and the absence of dark-room protection mechanisms, these detectors are highly susceptible to interference from various factors, including displacement vibrations, fluctuations in ambient light, occlusion by moving objects, airflow disturbances, and dust contamination. The signal alterations induced by these interfering factors closely resemble those caused by fire-generated smoke. Consequently, this similarity often results in false alarms, significantly compromising the detection accuracy and impeding the long-term stable operation of the detectors.
To mitigate these interference issues, current solutions predominantly focus on two key aspects. The first approach involves enhancing the signal-processing algorithm. Building upon the traditional threshold comparison method, time-series feature analysis is integrated, and the trend analysis algorithm, which is commonly employed in temperature detectors, is adopted to assess the smoke condition. This integration significantly improves the algorithm’s capability to discriminate genuine fire signals from false alarms. The second approach pertains to innovation in the selection of beam wavelengths. For instance, Honeywell’s OSID system [5] incorporates an ultraviolet beam in addition to the conventional single-infrared beam. Through the analysis of the interactions between infrared and ultraviolet light of varying wavelengths with smoke and dust particles, this system endeavors to enhance the detector’s discrimination ability against different types of interference. Nevertheless, the OSID system still relies on the threshold-based algorithm for signal processing, and its performance in complex environments remains suboptimal, leaving ample room for further optimization [6].
With the rapid advancement of deep-learning technology, numerous sophisticated algorithms capable of processing time-series feature data have emerged. Prominent examples include recurrent neural networks (RNNs) and their advanced variants, such as long short-term memory networks (LSTMs) and gated recurrent units (GRUs). These algorithms have demonstrated remarkable performance in diverse fields, including speech recognition and weather forecasting. However, their utilization in the domain of linear beam smoke fire detectors remains relatively scarce.
In response to this gap, the present research endeavors to integrate experimental investigations of the interaction between spectral light sources and smoke particles with deep learning techniques. Through the establishment of an experimental platform, this study conducts an in-depth exploration of the interaction mechanisms between beams of varying wavelengths and smoke, aiming to identify the spectral band that exhibits the highest sensitivity to smoke. Concurrently, leveraging the deep learning technology, a novel signal-processing algorithm tailored specifically for linear beam smoke fire detectors is developed. The overarching objective is to achieve highly accurate and low-false-alarm smoke detection over a distance of 120 m, thereby providing more robust technical support for fire safety protection in high-volume space buildings.
Generally speaking, this paper provides the following main contributions:
(1)
Experimental platform construction and wavelength screening. A long-optical-path smoke attenuation experiment platform was designed and constructed. Through systematic experimental research, the beam wavelengths suitable for linear beam smoke detectors were obtained, laying a foundation for improving the detection performance of detectors.
(2)
Deep learning algorithm design. Based on the deep learning technology, an innovative algorithm suitable for linear beam smoke fire detectors was designed; by comprehensively considering the temporal characteristics of data from two different wavelength sensors and multiple discriminations, the detector’s ability to process fire signals and recognition accuracy have been effectively improved.
(3)
Algorithm comparison and verification. Comprehensive comparative experiments were carried out between the designed algorithm and traditional fire signal-processing algorithms. The experimental results fully demonstrate the significant advantages and effectiveness of the algorithm in this paper in terms of detection accuracy and anti-interference ability.
The subsequent chapters of this paper are arranged as follows. Section 2 introduces in detail the research progress of fire signal processing and deep learning signal analysis related to this study. Section 3 elaborates on the construction process of the broad-spectrum platform and the screening method for smoke-sensitive bands. Section 4 deeply explores the design details of the algorithm based on the deep-learning technology and applicable to linear beam smoke fire detectors. Section 5 conducts comparative experiments on the designed algorithm and traditional algorithms and deeply analyzes the experimental results. Section 6 summarizes the full text.

2. Related Works

2.1. Development of Fire Detection Signal Processing Algorithms

Prior to the 1980s, fire detection predominantly relied on intuitive methods. Detectors operated by directly analyzing the signal amplitude of individual sensors, leveraging the distinct characteristics of typical fire and non-fire signals. For instance, when the amplitude of a sensor signal exceeded a predetermined threshold, a fire alarm was triggered. Rate-of-rise temperature fire detectors, on the other hand, evaluated the rate of change in the signal and issued an alarm when the temperature increase rate surpassed the set threshold.
The 1980s witnessed the advent of algorithms in fire detection signal processing. The non-parametric signal detection method was among the first to be applied in this domain. Luck introduced the trend algorithm for fire detection, successfully implementing fire detection using the Kendall-τ detector [7]. Siemens capitalized on the persistent characteristics of fire signals to develop a fire detector based on the “duration” detection algorithm [8]. Meanwhile, Wang proposed a variable-window-length fire signal trend algorithm and a composite specific trend algorithm, further advancing the field of fire detection [9].
With the emergence of neural networks, their notable attributes, including adaptability, learning capacity, fault tolerance, and parallel processing capabilities, were rapidly harnessed across diverse information-processing applications. This development opened up new avenues for fire detection signal processing. Okayama utilized a three-layer feed-forward neural network and the backpropagation algorithm to devise a signal processing algorithm for photoelectric smoke, temperature, and gas signals [10]. Nakanishi et al. employed fuzzy logic techniques to process smoke concentration data, as well as integrated smoke, temperature, and CO signals [11], with the system adjustment based on a neural network algorithm. The continuous evolution of modern signal processing methodologies has significantly propelled the development of fire detection signal processing algorithms. Recently, Liu et al. applied the Bayesian algorithm to multi-sensor systems, effectively enhancing the detectors’ anti-interference capabilities [12].
In addition to the integration of machine learning approaches, researchers have sought to improve fire detection accuracy by expanding the range of perceived parameters, such as increasing the number of wavelengths. Based on the Mie scattering theory followed by the light scattering characteristics of smoke particles, the relationship between their extinction efficiency factor and particle diameter and wavelength can be quantitatively analyzed using Hulst’s small particle scattering model [13]. Li et al., Xia et al., and Węgrzyński et al. conducted studies on multi-wavelength smoke detection, demonstrating that processing multi-wavelength information can substantially enhance detection precision [14,15,16]. Yu et al. utilized data from multiple detectors to augment the perception dimension, thereby improving the real-time performance and accuracy of fire detection [17].
Notably, despite these advancements, the majority of the optimized fire signal processing algorithms have been developed with a focus on point-type smoke fire detectors. In contrast, research on signal processing algorithms tailored for linear beam smoke detectors remains relatively scarce. The existing signal processing methods for linear beam detectors mainly face 3 bottlenecks: (1) single feature dependency: traditional algorithms such as threshold, trend, slope, etc. rely only on the absolute value of light intensity or a single dynamic feature, making it difficult to distinguish the temporal pattern differences of environmental disturbances such as light intensity fluctuations caused by smoke and vibration; (2) insufficient utilization of wavelengths: although multi-wavelength detection has been proposed, it only fuses the intensity difference between two wavelengths through a fixed threshold, without exploring the dynamic synergistic features between wavelengths, and lacks modeling of the scattering absorption coupling effect of smoke particles; (3) although deep learning methods such as LSTM can handle time-series data, there is still room for improvement in multimodal feature fusion and interference robustness, such as the UV–infrared dual wavelength.

2.2. Artificial Intelligence Signal Processing Methods

In recent years, with the substantial enhancement of computing capabilities and the proliferation of diverse deep learning framework tools, artificial intelligence-driven signal processing methodologies have undergone continuous evolution. Building upon the traditional backpropagation (BP) neural network, network models designed for processing time-series data have witnessed remarkable advancements. In 1986, Elman et al. introduced the recurrent neural network (RNN) [18]. As a specialized neural network architecture, RNNs are tailored to handle sequential data. They process inputs at each time step and transfer the hidden state from the current time step to the subsequent one, thereby enabling the capture of temporal dependencies within sequences. Nevertheless, when confronted with long-length sequences, RNNs are prone to encountering issues such as gradient vanishing or gradient explosion.
Long short-term memory network (LSTM) [19] represents a significant advancement over RNNs. By incorporating a sophisticated gating mechanism, LSTMs are capable of effectively regulating information flow and managing long-term memory. This innovation addresses the long-term dependency challenges inherent in RNNs, rendering LSTMs particularly suitable for processing and forecasting time-series data associated with events that exhibit significant temporal intervals and delays. However, the relatively large number of model parameters in LSTMs may give rise to overfitting problems.
The gated recurrent unit (GRU) [20] is another optimized variant of the RNN. With a more streamlined gating mechanism, GRUs can efficiently capture long-term dependencies in sequences. Additionally, GRUs generally offer higher computational efficiency compared to LSTMs and have demonstrated excellent performance in numerous time-series data analysis tasks. During the course of this research, multiple network architectures were systematically evaluated, and the algorithms were refined based on the unique characteristics of fire detection signals, aiming to further enhance the accuracy of the detection algorithm.
Compared with traditional RNNs/LSTMs, the dual-GRU model proposed in this study has the following advantages: (1) dual-wavelength collaborative modeling: the existing deep learning methods are mostly based on single-wavelength time-series data, while this study synchronously learns the complementary features of ultraviolet (405 nm) and infrared (850 nm) signals through dual-input channels—ultraviolet light is sensitive to small-particle scattering, infrared light is sensitive to concentration accumulation, and the fusion of the two can cover the entire fire cycle; (2) cross-attention mechanism: traditional GRU models only capture single-sequence dependencies, while this study dynamically calibrates dual-wavelength feature weights through cross-attention, such as enhancing the attention of the ultraviolet channel in the early smoke stage and focusing on the infrared channel in the thick smoke stage, significantly improving the feature discrimination ability under complex interference.

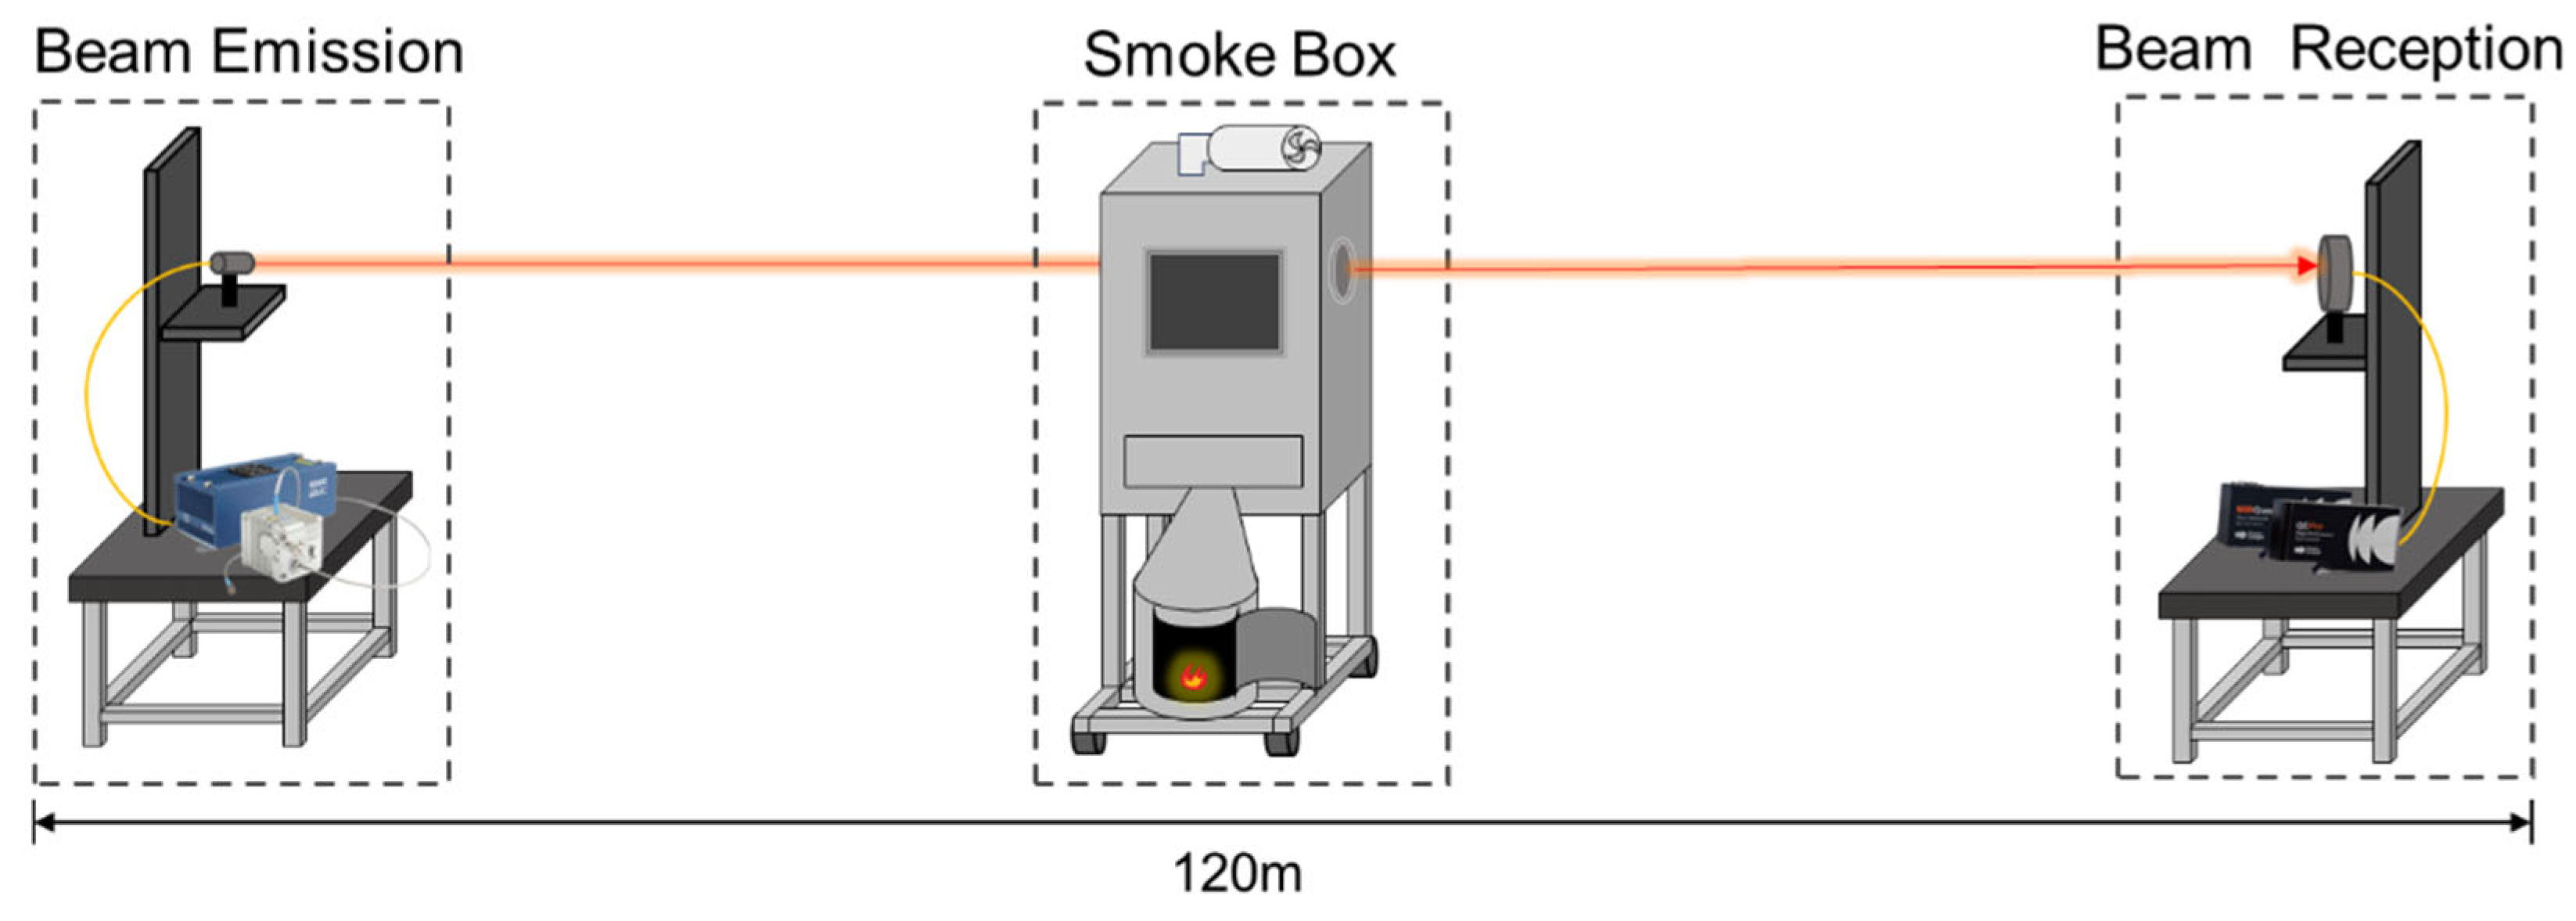
3. Platform Construction

Currently, the majority of linear beam smoke detectors utilize infrared beams; however, the rationale behind the specific wavelength selection remains ambiguous. To accurately determine the spectral bands optimal for linear beam smoke detectors, this chapter details the construction of a large-scale experimental platform dedicated to the study of smoke spectral characteristics. This platform is predominantly composed of three key components: the beam emission part, the smoke box part, and the beam reception part. The total optical path length of the platform was meticulously set to 120 m, as depicted in Figure 1. This design was engineered to replicate a diverse array of scenarios encountered in practical applications, thereby furnishing comprehensive data support for the identification of the spectral bands most sensitive to smoke.

3.1. Beam Emission Part
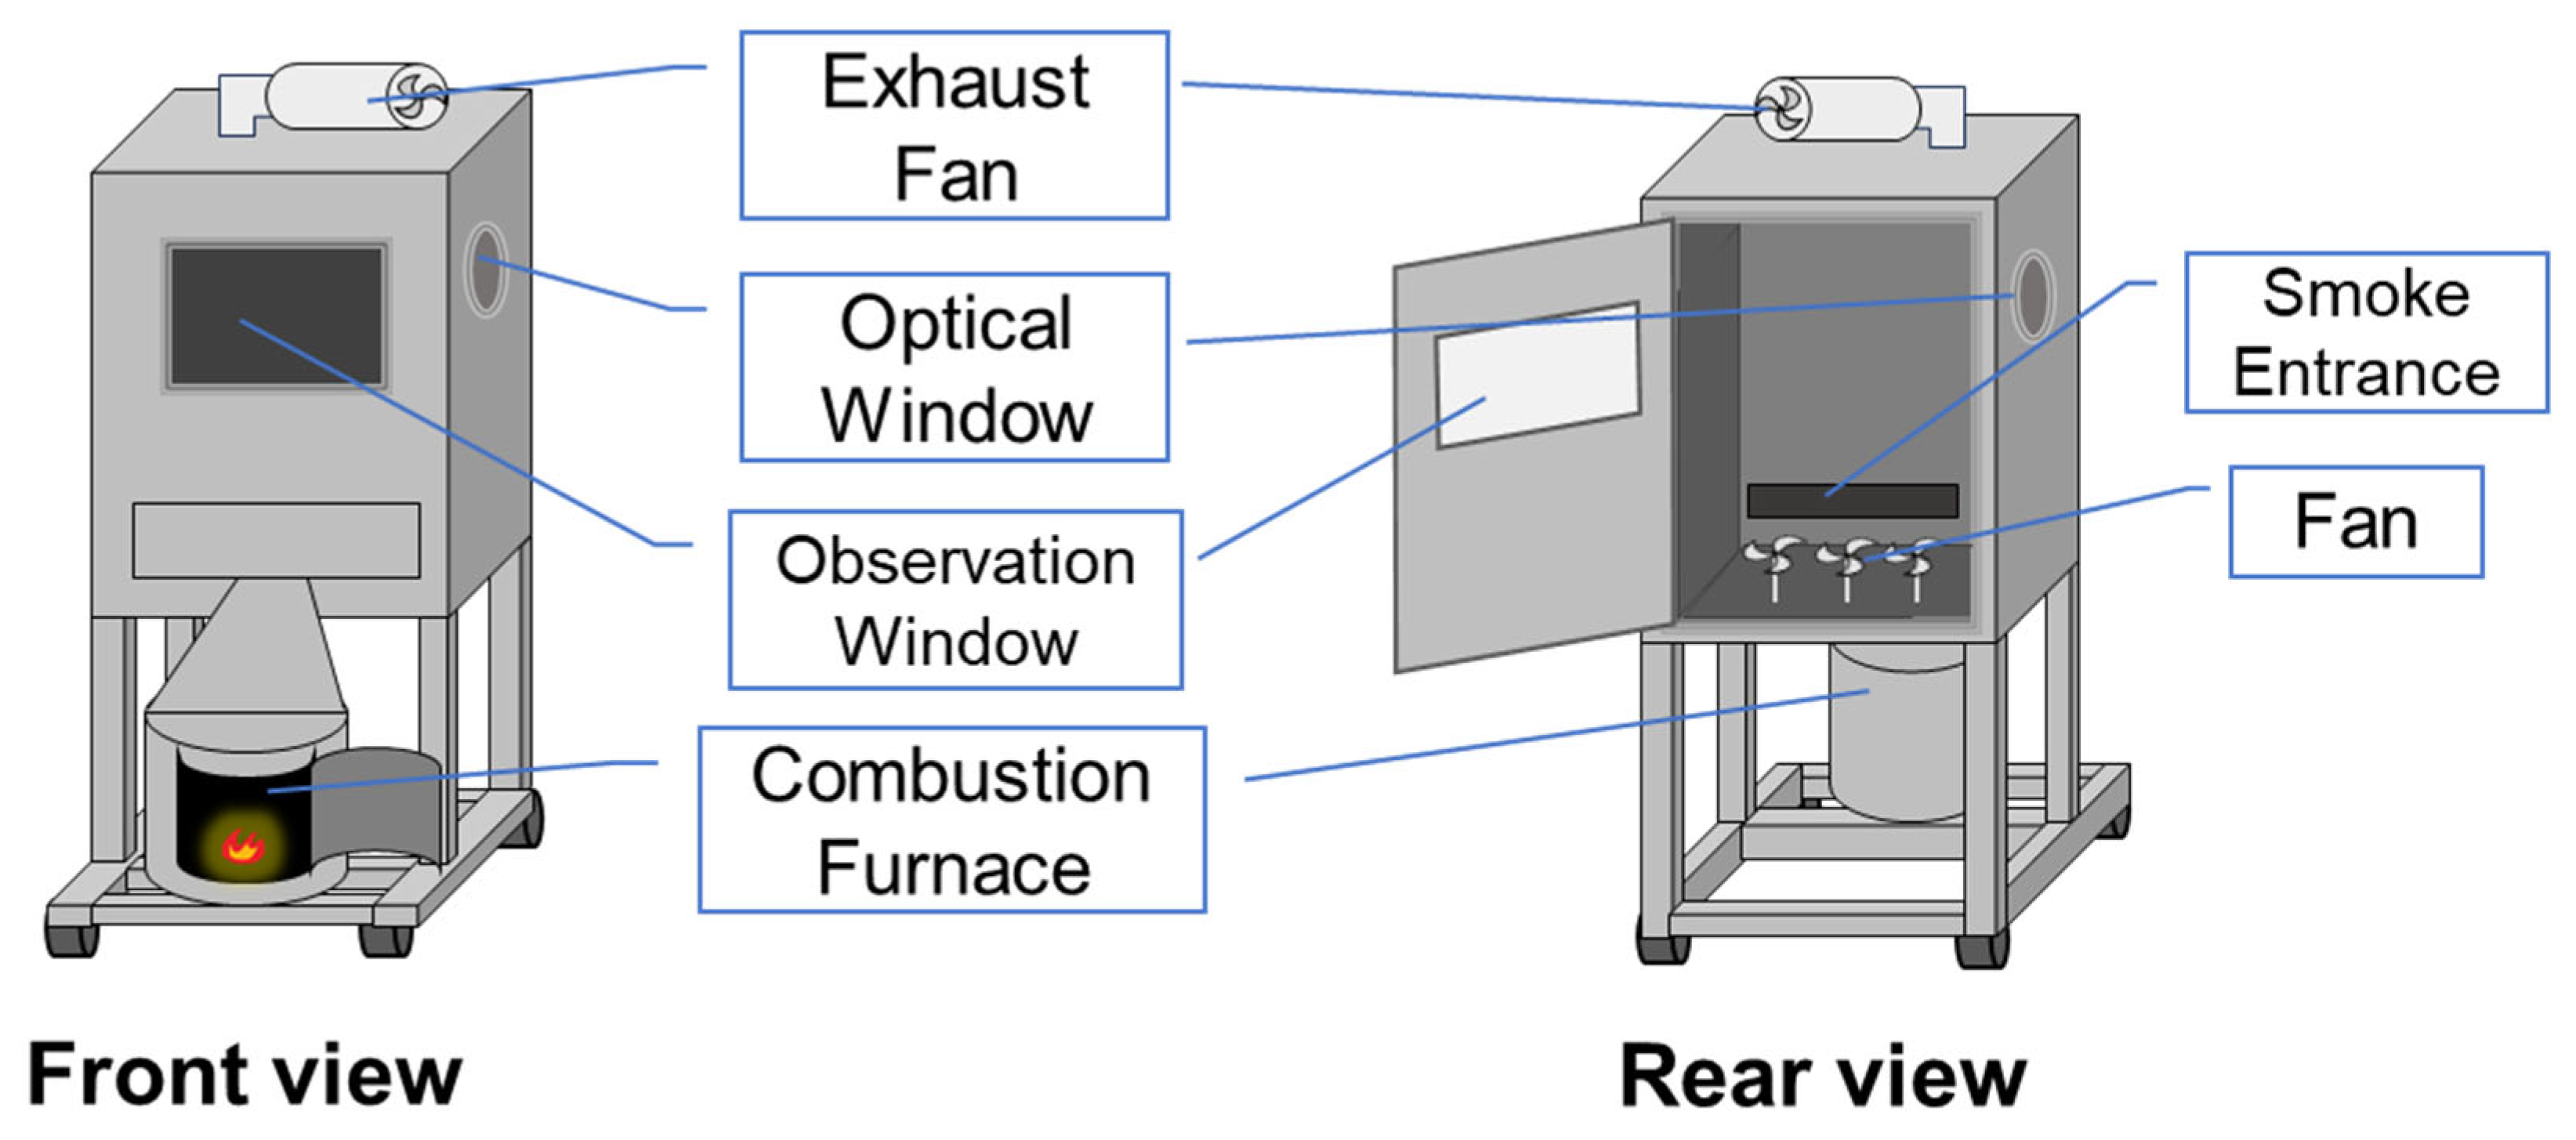
The beam emission part primarily consists of a light source, a horizontally movable optical platform, and a Z-axis movable platform.
The selection of the light source is of paramount importance for the experimental results. To comprehensively investigate the influence of smoke on the optical beam, a HAMAMATSU EQ-99 (Manufacturer: Hamamatsu Photonics K.K. Address: Hamamatsu City, Shizuoka Prefecture, Japan) with wavelength range 170–2500 nm, wavelength interval 5 nm was chosen for the light source emission component. This wavelength coverage enables full-spectrum coverage from ultraviolet to near-infrared bands, which is conducive to an in-depth analysis of the interaction characteristics between light of different wavelengths and smoke particles.
Given the 120 m length of the optical path of the experimental platform, optical path alignment is a critical aspect of the construction process. During actual operation, misalignments are likely to occur among the optical paths of the light source, the spectrometer, and the regions where smoke and interference sources are present. These misalignments can significantly affect the accuracy of the experimental data. To address this issue, two mobile optical platforms were constructed. These platforms are mainly used for fine-tuning the optical path and the horizontal position of the light spot generated by the light source. Equipped with high-precision displacement control mechanisms, they can ensure that the horizontal positioning error of the light spot is kept within a minimal range.
In the vertical direction, two Z-axis lifting platforms are installed. These platforms have a lifting range of 0–100 cm, along with excellent stability and precision. By utilizing these two Z-axis lifting platforms, the vertical position of the optical path and the light spot generated by the light source can be flexibly adjusted. This adjustment ensures that the optical beam accurately traverses the smoke area and is received by the spectrometer.

3.2. Smoke Box Part

To enable precise optical path alignment and replicate the smoke generation process in an actual fire scenario, a movable vertical smoke box was meticulously designed. The specific structure is shown in Figure 2. An exhaust apparatus is mounted on the top of the smoke box. This exhaust apparatus serves the purpose of regulating the airflow environment within the smoke box, thereby simulating fire scenarios under diverse ventilation conditions.
The fan situated inside the smoke box and the exhaust apparatus on the top collaborate to establish a stable-flow air duct. By adjusting the rotational speed of the fan, both the flow velocity and the direction of the smoke within the smoke box can be effectively controlled. This control mechanism ensures that the smoke is uniformly distributed throughout the smoke box, closely mimicking the diffusion pattern of smoke in an actual fire incident. By doing so, it guarantees that when the optical beam traverses the smoke, it will be influenced by stable and representative smoke conditions, thereby enhancing the accuracy and reliability of the experimental data.
Two calcium fluoride optical windows are installed on both sides of the smoke box. The calcium fluoride material exhibits excellent optical properties, featuring a high transmittance for the ultraviolet-to-near-infrared band light utilized in the experiment. Additionally, it possesses stable chemical properties, rendering it highly resistant to erosion by chemical substances present in the smoke. This optical window provides a stable passage for the optical path, significantly reducing the refraction and scattering losses of light as it passes through the smoke box wall and ensuring the integrity and precision of the optical beam.
A combustion furnace, which is the core component for generating fire smoke, is installed at the bottom of the smoke box. During the experiment, the combustion furnace is employed to burn materials such as cotton ropes and wooden blocks. Cotton ropes and wooden blocks are common flammable substances, and the composition and characteristics of the smoke produced by their combustion are, to a certain degree, analogous to those of the smoke in real fires. These materials are frequently utilized in standards, such as [21], for validating the detection performance of smoke detectors. By regulating the amount and speed of material combustion in the combustion furnace, various levels of fire scenarios can be simulated, generating smoke with different concentrations and characteristics. This process provides a rich array of experimental samples for investigating the impact of different smoke concentrations on the optical beam.

3.3. Beam Reception Part

To precisely collaborate with the light source and acquire the spectral extinction characteristics of smoke, Ocean Optics QE Pro (Manufacturer: Ocean Optics Company, Origin: Orlando, FL, USA) with wavelength range 190–1100 nm, integration time 8–10 ms, resolution 1.2–6.87 nm and NIRQuest (Manufacturer: Ocean Optics Company, Origin: FL, USA) with wavelength range 900–2450 nm, integration time 1–200 ms, resolution 6.48–25.6 nm spectrometers, which have a wavelength range spanning from 200 to 2500 nm, were employed in the beam reception component. Through the analysis of the acquired data, the intensity variations of light with different wavelengths after traversing the smoke can be accurately determined. This process provides direct data support for the identification of spectral bands that are sensitive to smoke.
Analogous to the transmitter end, the receiving end of the spectrometer also necessitates optical path alignment. To this end, the spectrometer’s receiving end is aligned with the optical path using a mobile optical platform and a Z-axis lifting platform. During the experimental process, by continuously adjusting the positions of these platforms, it is ensured that the spectrometer can accurately capture the optical beam after its interaction with the smoke, thereby preventing inaccurate data collection resulting from optical path misalignment. Simultaneously, the data acquisition software compatible with the spectrometer is utilized to record and store the collected spectral data in real time, thus providing a comprehensive and reliable data foundation for subsequent data analysis.

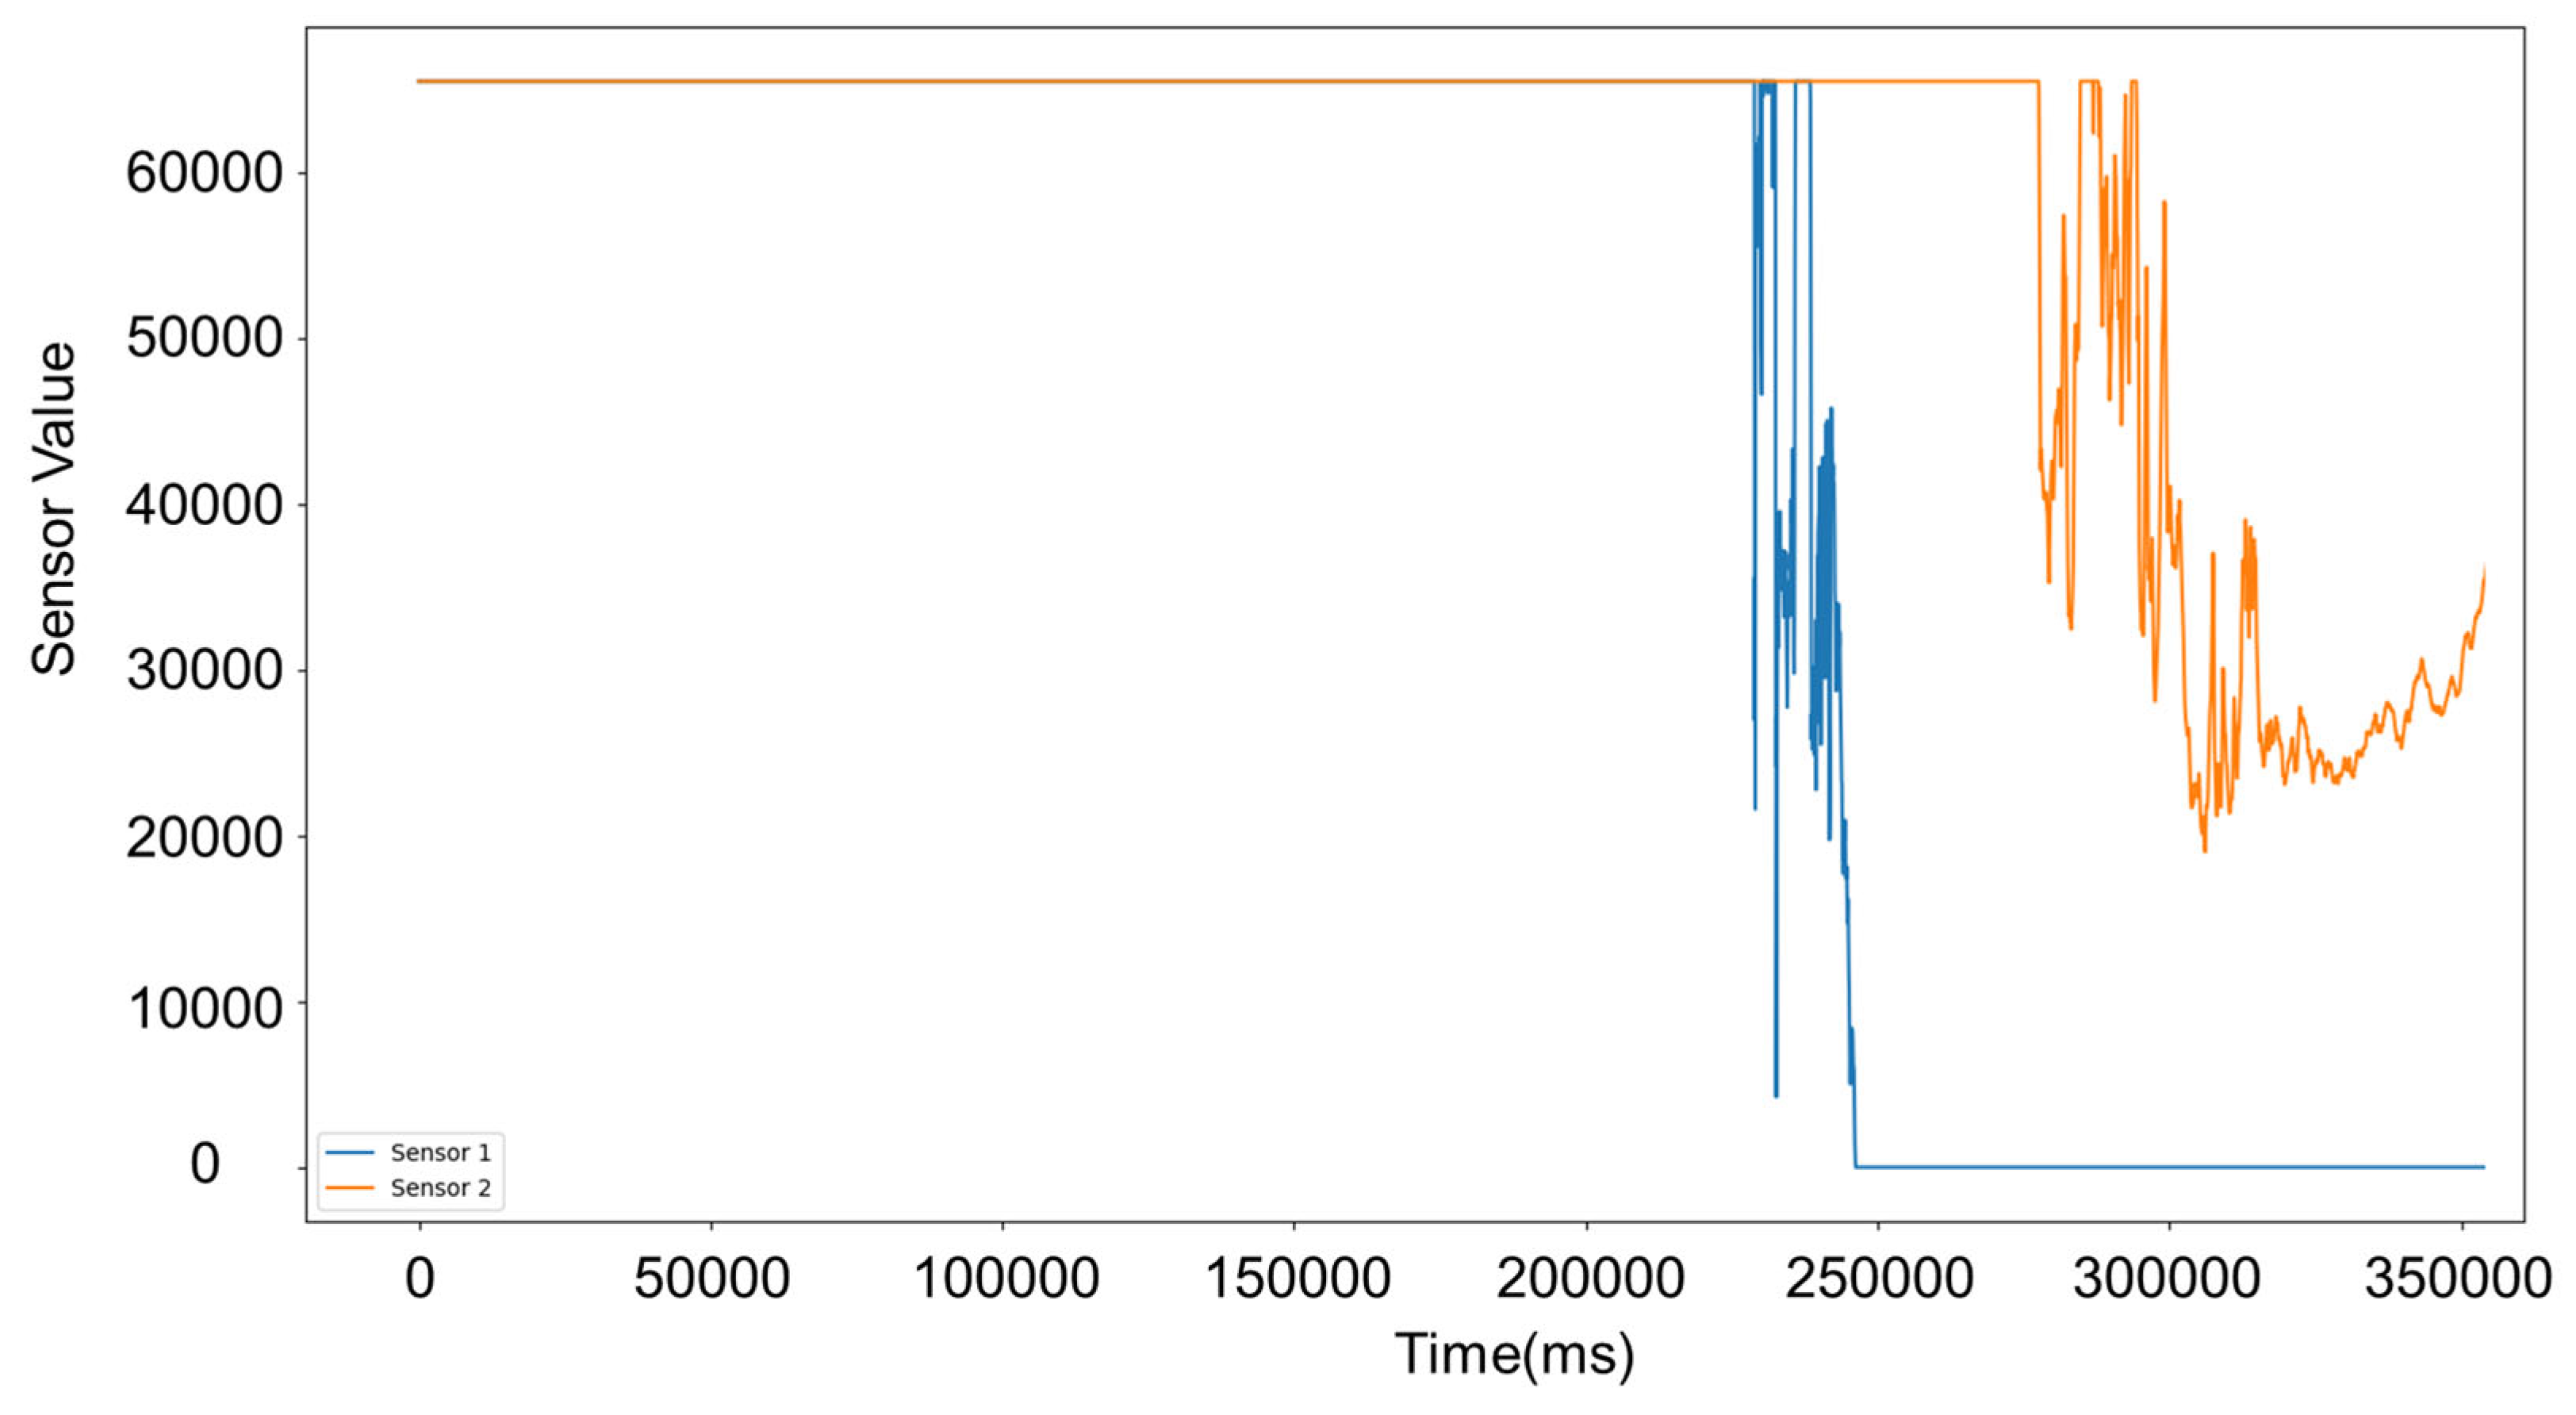
3.4. Data Collection

Prior to the initiation of the experiment, optical path alignment is performed as the initial step. Through the adjustment of each platform at the transmitter and receiver ends, it is ensured that the optical beam emitted by the light source can accurately traverse the smoke-filled region within the smoke box and be stably detected by the spectrometer. Once the optical path alignment is successfully completed, light intensity information is collected over a designated time interval. Subsequently, the collected data are subjected to an averaging process to obtain the average light intensity value for each wavelength, which serves as the initial spectrum. This averaging procedure effectively mitigates the impact of random noise on the data, enhancing its stability and reliability. The initial spectrum derived in this manner represents the spectral characteristics of the light source in the absence of smoke interference, providing essential reference data for subsequent analysis of the effects of smoke and various interferences on the beam intensity. Subsequently, cotton ropes and wooden blocks placed within the combustion furnace are ignited separately to simulate the generation process of fire-related smoke, and the corresponding data from the spectrometer are recorded.

3.5. Data Preprocessing

Given that the light intensities of different wavelengths within the optical beam emitted by the light source vary, to accurately quantify the effects of smoke and various interferences on the beam intensity, the collected data must undergo scientific and rational analysis. This study primarily focuses on comparing the variations in the light extinction intensity induced by fire-generated smoke. The definition of the light extinction intensity is presented in Formula (1).
D i m m i n g   i n t e n s i t y = I n i t i a l   l i g h t   i n t e n s i t y C u r r e n t   l i g h t   i n t e n s i t y
By establishing the light extinction intensity, the light intensity changes across different wavelengths are effectively normalized. This normalization process enables the comparability of light intensity changes at various wavelengths, thereby providing a more intuitive representation of the impact of smoke on light of different wavelengths. Through plotting the curve of the light extinction intensity as a function of the wavelength, it becomes feasible to clearly identify which wavelengths of light experience more significant reductions in intensity upon encountering smoke, facilitating the identification of spectral bands that are sensitive to smoke. The collected spectral light extinction data from the experiment are illustrated in Figure 3 and Figure 4.

3.6. Data Analysis

The extinction intensity is influenced by the optical properties of smoke particles and can be analyzed using the Mie scattering theory. The key parameters include the extinction efficiency (Qext), scattering efficiency (Qsca), and absorption efficiency (Qabs) of the particles: Qext combines scattering and absorption effects, reflecting the overall light attenuation ability of particles. In theory, shorter wavelengths are more sensitive to Qsca, allowing it to effectively detect submicron particles in the early stages of a fire. Longer wavelengths are dominated by Qabs and are suitable for tracking macroscopic changes in smoke concentration. From a macroscale perspective, the results of the experiments in Figure 3 and Figure 4 conform to the above pattern.
Specifically, the experimental results within the 200–1100 nm wavelength range reveal that as the time elapses from 3 to 8 min, the overall dimming value exhibits a notable upward trend. During the initial 3–4 min, the dimming curve remains relatively flat with minimal fluctuation amplitude, suggesting that the initial stage of smoke generation exerts a weak attenuation effect on the light within this spectral band. Subsequently, after the 5 min mark, the curve fluctuations intensify, and the peak values increase significantly. In particular, between 6 and 8 min, the dimming value remains at a high level and fluctuates frequently. This evolution reflects the continuous accumulation of smoke particles as the combustion duration extends, leading to enhanced scattering and absorption of light in the 200–1100 nm wavelength range, thereby validating the positive correlation between smoke concentration and the dimming effect.
For the 900–2500 nm wavelength range, as time progresses from 3 to 8 min, the overall dimming intensity demonstrates a distinct upward trend. In the initial 3–4 min, the dimming curve remains relatively stable with minimal fluctuations, suggesting that the early-stage smoke exerts a feeble attenuation on light within this band. After the 5 min mark, the curve experiences more intense fluctuations, with peak values rising sharply. Notably, between 6 and 8 min, the dimming value persists at a high level and fluctuates frequently. This behavior reflects the continuous accumulation of smoke particles as combustion time lengthens, resulting in strengthened scattering and absorption of light in the 900–2500 nm range. Consequently, it validates the positive correlation between smoke concentration and the dimming effect, consistent with the general principle of smoke–light interaction.
Overall, notable extinction peaks are first detected within the 200–400 nm and 350–420 nm wavelength ranges, with extinction rates reaching up to 20–30%. This phenomenon can be elucidated by the Mie scattering effect of smoke particles on short-wavelength light. When the particle diameter is comparable to the wavelength within these bands, the scattering cross-section attains its maximum value, thereby leading to pronounced extinction. In the near-infrared bands of 800–900 nm and 900–1000 nm, extinction rates of 15–25% are observed during the early stages of smoke generation. This is primarily influenced by the combined action of absorption and scattering of smoke particles. As depicted in Figure 4, for wavelengths above 900 nm, the extinction rate gradually diminishes as the wavelength increases, which aligns with the weak absorption properties of smoke in the long-wave region.
Therefore, in light of the findings from the aforementioned experiments, the ultraviolet band at 405 nm and the near-infrared band at 850 nm, which exhibit sensitive extinction characteristics during the incipient stage of smoke generation, were selected as the primary detection bands. The selection of these two bands confers the following advantages.
The experimental results indicate that the short-wavelength region is highly responsive to the scattering effect of smoke particles. Although 405 nm lies within the visible light spectrum, its proximity to the ultraviolet region endows it with a robust response to the Mie scattering effect of small-sized smoke particles. Consequently, it can effectively detect the emergence of smoke particles in the early stages of a fire, thereby providing a foundation for early-warning systems. The 850 nm band is situated within the 200–900 nm near-infrared range. Experimental data from this range demonstrate that its dimming value increases significantly with the accumulation of smoke. Sensitive to the combined effects of smoke particle scattering and absorption, this band can clearly reflect the dynamic variations in smoke concentration. Additionally, the 850 nm light source technology is well-established and exhibits strong immunity to ambient light interference, ensuring the stability of the detection signal.
The integration of the 405 nm and 850 nm bands builds upon the concepts proposed in [5], offering complementary benefits. The 405 nm band is adept at detecting the microscopic characteristics of early-stage smoke particles, whereas the 850 nm band is focused on monitoring the macroscopic changes in smoke concentration. This combination enables the capture of weak particle scattering signals during the early phases of a fire using the 405 nm band and the stable tracking of smoke concentration growth trends through the 850 nm band. Simultaneously, by analyzing parameters such as the differences in dual-wavelength dimming values and change rates, a more comprehensive smoke recognition model can be developed. This model is capable of effectively mitigating interferences, enhancing the accuracy and reliability of detectors in identifying fire-related smoke within complex scenarios, and providing more efficient and precise solutions for smoke detection.

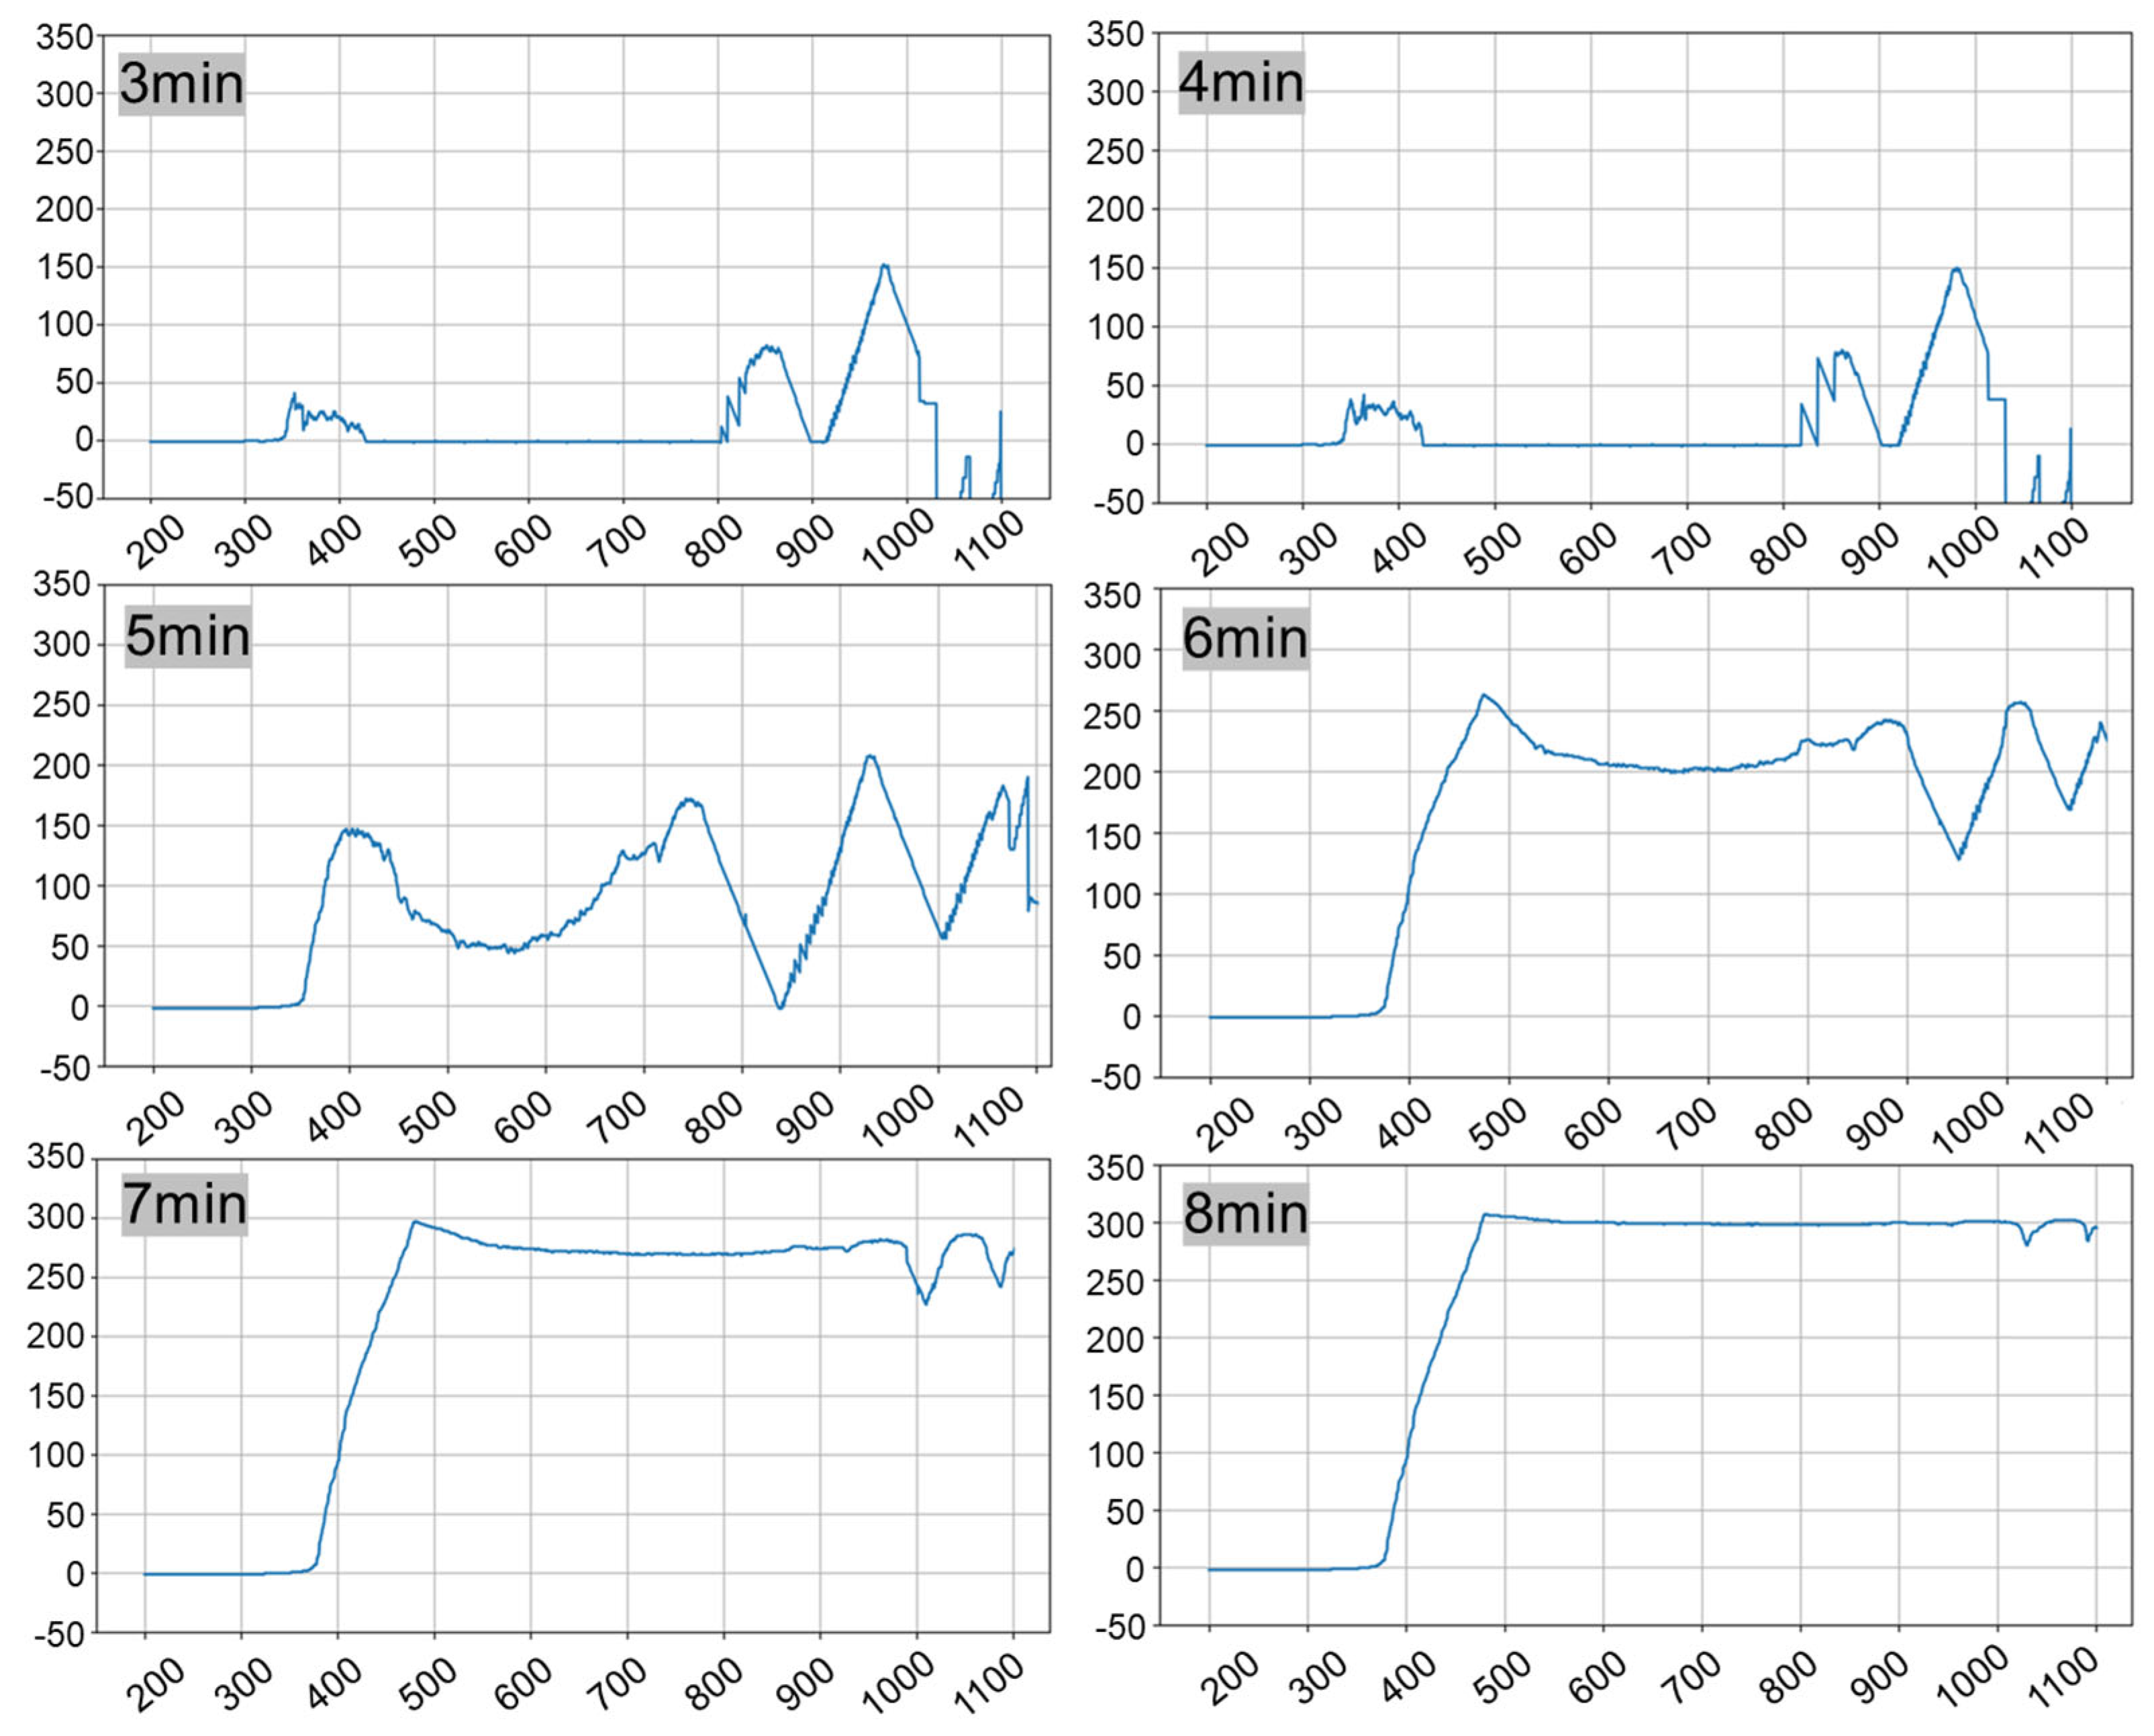
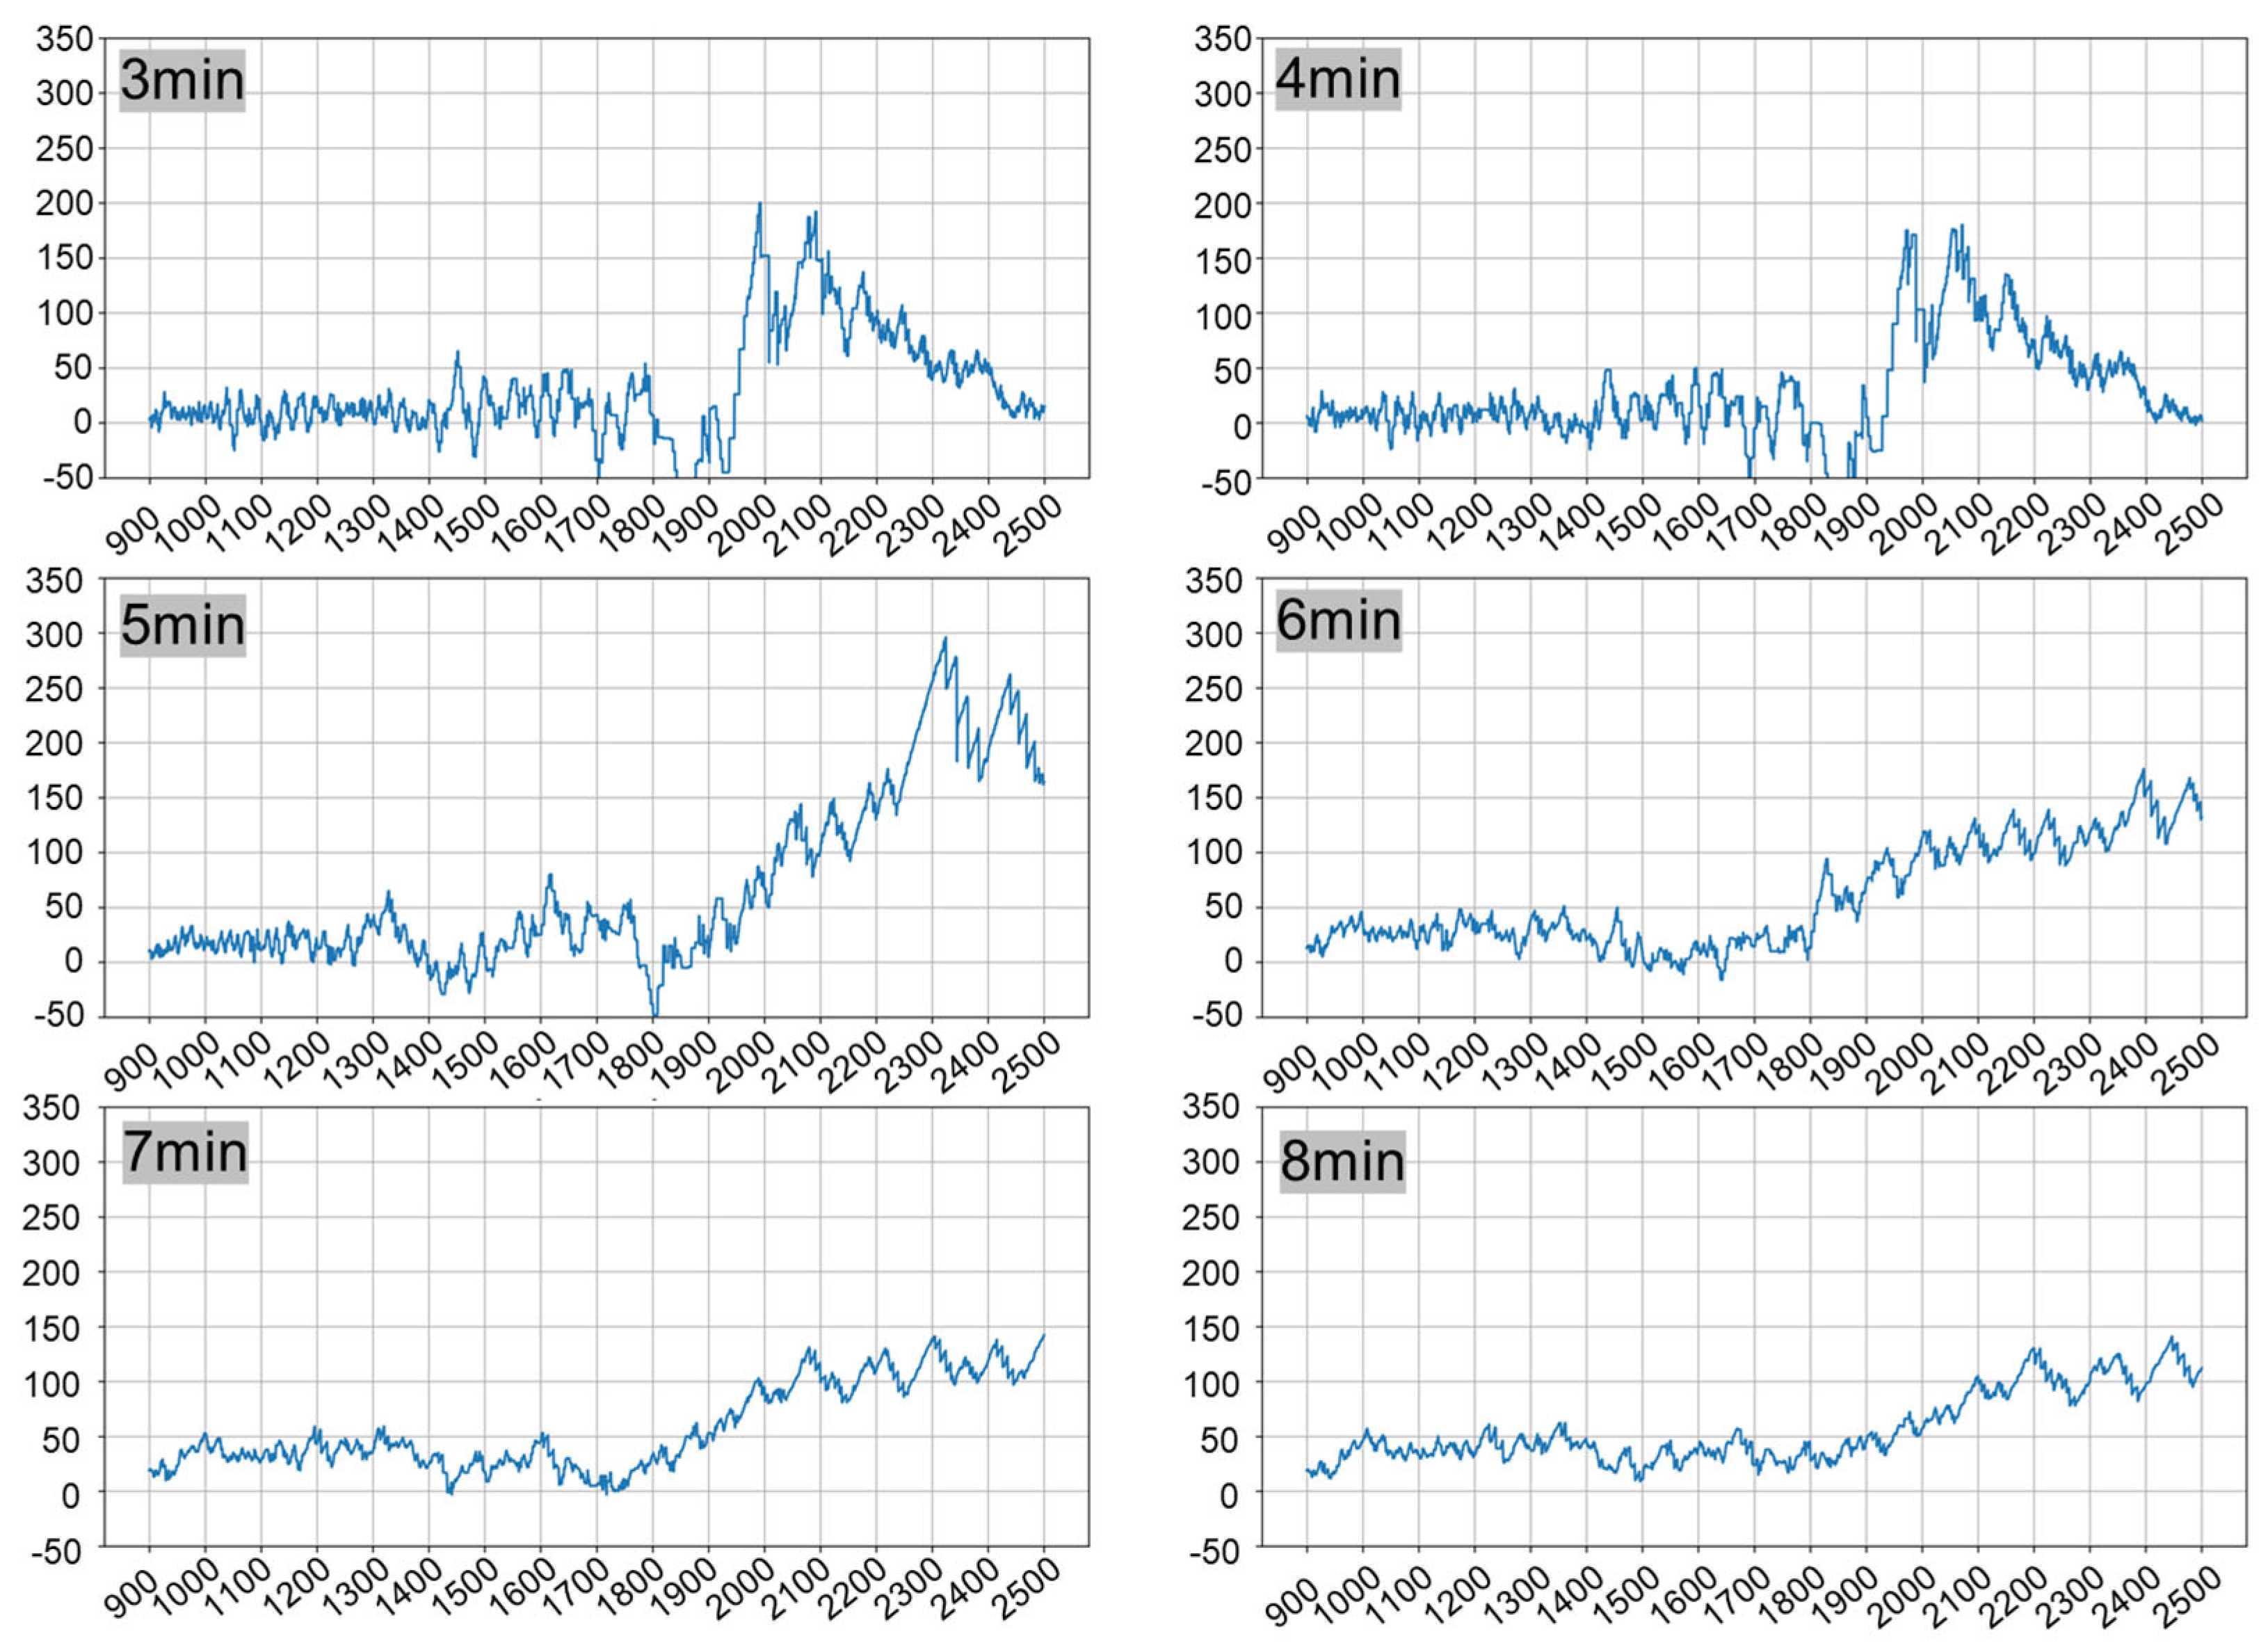
3.7. Smoke Dimming and Interference Experiment: 405 nm and 850 nm

To assess the viability of integrating the 405 nm and 850 nm wavelengths for smoke detection, a 405 nm laser, along with its corresponding sensors and filters, was selected. In conjunction with an 850 nm laser and its associated supporting equipment, smoke and water vapor interference experiments were conducted over a distance of 120 m. Specifically, the sensor communicates with the terminal at a baud rate of 115,200 (approximately 57.6 Hz, collecting 57 samples per second) to ensure the high-frequency resolution of the time-series data and capture the dynamic changes in smoke concentration. During the experimental process, meticulous records were kept of the variations in light intensity detected by the receiver-end sensor, as illustrated in Figure 5. The entire large-scale smoke spectral characteristic experimental platform was placed in an indoor large space fire laboratory to ensure the stability of humidity and lighting. When conducting experiments using 405 nm and 850 nm lasers and photoelectric sensors, we placed 400 nm and 850 nm filters at the front end of the sensors to eliminate the influence of stray light at other wavelengths. The experimental results are presented in Figure 6 and Figure 7.
The 405 nm laser (Sensor 1, represented by the blue line) and the 850 nm laser (Sensor 2, represented by the orange line) in the two figures depict the variations in light intensity detected by the receiver-end sensor under different scenarios.
As illustrated in Figure 6, in the smoke-filled environment, both the 405 nm laser (blue line) and the 850 nm laser (orange line) exhibit substantial intensity changes. The intensity of the 405 nm laser significantly decreases and fluctuates. Owing to its proximity to the ultraviolet band, this laser is highly sensitive to the scattering of smoke particles, particularly the minute particles generated during the incipient stage of a fire. The Rayleigh scattering effect enables effective detection of these particles, and intensity variations can reflect the dynamic changes in the particle size distribution of smoke particles. Similarly, the intensity of the 850 nm laser also experiences a significant decline. During the continuous presence of smoke, the decreasing trend of its intensity remains relatively stable, demonstrating its sensitivity to the Mie scattering and absorption effects of carbon-based components in smoke particles. This characteristic allows for an accurate reflection of the accumulation of smoke concentration.
The 405 nm laser is primarily designed to capture the microscopic characteristics of smoke particles. In the early stages of a fire, when smoke particles are small, it can rapidly respond and generate early-warning signals. Conversely, the 850 nm laser is highly responsive to changes in smoke concentration, enabling it to stably monitor the increase in smoke concentration as the fire progresses. By integrating these two lasers, it becomes feasible to achieve full-cycle coverage, from the detection of minute particles in the early fire stages to the monitoring of smoke concentration during the fire development phase. This integration facilitates a more comprehensive understanding of the smoke generation and development processes, thereby enhancing the accuracy and timeliness of smoke detection.
As depicted in Figure 7, in the presence of water vapor interference, the light intensities of both the 405 nm laser (represented by the blue line) and the 850 nm laser (represented by the orange line) exhibit fluctuations. Specifically, the intensity of the 405 nm laser fluctuates with a relatively large amplitude; however, it does not exhibit a sustained downward trend. Similarly, the intensity of the 850 nm laser also experiences fluctuations but does not show a continuous significant decrease comparable to that observed in smoke scenarios.
Through a comparative analysis of the light intensity variations of the two-wavelength lasers under smoke and water vapor interference conditions, and by leveraging the disparities in light intensity changes between the 405 nm and 850 nm lasers, an effective algorithm can be formulated to differentiate between smoke and water vapor interference. By examining parameters such as the rate, amplitude, and ratio of light intensity changes between the two wavelengths, it is feasible to effectively suppress water vapor interference signals and reduce false alarm rates. The distinct characteristics of the intensity changes of the 405 nm and 850 nm lasers in different scenarios allow for their synergistic utilization, thereby enhancing the detector’s resistance to various interference factors and improving the reliability of detection in complex environments.
In summary, the 405 nm and 850 nm lasers offer complementary information from two distinct dimensions in smoke-filled scenarios: the microscopic characteristics of particles and macroscopic changes in concentration, respectively. When integrated, these two wavelengths enable the acquisition of more comprehensive smoke-related information, facilitating a more accurate determination of fire conditions compared to single-wavelength light-based detection methods. Regarding anti-interference capabilities, in non-fire scenarios, such as those involving water vapor interference, the combined use of these two wavelengths allows for the effective identification of interference sources. By analyzing the discrepancies in light intensity variations, false alarms can be significantly reduced. Compared with single-wavelength detection, this dual-wavelength approach substantially enhances the detector’s resilience against interference in complex environments.

3.8. Dataset Preparation

To facilitate the training and testing of fire detection algorithm models, a comprehensive dataset was meticulously prepared using the 120 m experimental platform established in Section 3. This dataset encompasses dual-wavelength (405 nm ultraviolet light and 850 nm near-infrared light) time-series signals corresponding to the normal state, fire smoke, and typical interference scenarios (such as water vapor and vibrational displacement). The detailed preparation process is outlined as follows:

3.8.1. Data Collection Scenario Design

The dataset encompasses three primary scenarios:
  • Fire smoke scenario is a scenario where cotton ropes and wooden blocks are smoldering to produce smoke;
  • Typical interference scenarios include water vapor and vibrational displacements;
  • Normal state scenario is a pure environment without smoke and interference.
During the dataset preparation phase, 50 repeated experiments were conducted for each scenario (fire, interference, normal) for 300 s to ensure the reliability and diversity of the data.

3.8.2. Data Processing

In the data processing stage, outlier cleaning is first performed: sudden noise points with light intensity fluctuations exceeding the baseline ±3 σ are removed, and the signal curve is smoothed using a 5-point sliding average method to ensure the stability of the time-series data.
Label definition based on signal feature differences: the normal state refers to an interference-free scenario where the signal fluctuation is within ±5% of the baseline; the fire smoke state meets the requirement of sustained or fluctuating decrease in light intensity; and the interference state includes non-fire scenarios such as water vapor, dust, and vibration, where the signal exhibits irregular oscillations, short-term pulses, and other fluctuations that do not conform to smoke attenuation characteristics.
The dataset is divided into a training set (12,000 samples), a validation set (2000 samples), and a test set (4000 samples) in a ratio of 7:1:2, ensuring a balanced distribution (1:1:1) of fire, interference, and normal state samples to avoid the impact of class imbalance on model training.

4. Algorithm Design

In the intricate environment of fire detection, the early and precise warning capabilities of linear beam smoke detectors are of paramount importance for fire prevention and suppression. To fully exploit the information contained within red and ultraviolet wavelengths and enhance the accuracy of smoke recognition, this study presents an algorithm based on an enhanced gated recurrent unit (GRU) neural network that incorporates red and ultraviolet wavelength information. The experimental results described in Section 3 reveal that the scattering and absorption characteristics of smoke with respect to light of varying wavelengths exhibit significant differences. By fusing the information from red and ultraviolet wavelengths, a more comprehensive and abundant set of feature information can be provided for smoke recognition, thereby contributing to the improvement of the accuracy and reliability of fire detection systems.
The GRU neural network, owing to its gating mechanism, is capable of effectively capturing long-term dependencies in time-series data and has yielded successful application outcomes in numerous fields [22,23,24,25,26,27,28,29]. Nevertheless, when confronted with complex and dynamic fire smoke signals, the traditional GRU still has potential for optimization in terms of feature extraction and information fusion. Consequently, this study conducts targeted modifications to the GRU architecture. Through the introduction of dual-wavelength information fusion and an attention mechanism, the enhanced GRU can more effectively integrate red and ultraviolet wavelength information, thereby further augmenting its smoke recognition capabilities.

4.1. Input Dataset Preprocess

Owing to the fact that the light intensity data of different wavelengths may exhibit varying magnitudes and distribution ranges, direct input of such data into the model for training can potentially result in unstable model training and slow convergence. To ensure that the data carry equal significance and are comparable during the model training process, normalization of the red and ultraviolet light intensity data is indispensable. The normalization formula employed in this study is presented as Formula (2):
X n o r m = X X m i n X m a x X m i n
where X is the original data, X m i n and X m a x are the minimum and maximum values of the sensor detection threshold, respectively, and X n o r m is the normalized data. Through normalization processing, the data are mapped to the interval [0, 1], which can accelerate the convergence speed of the model and improve the training efficiency.

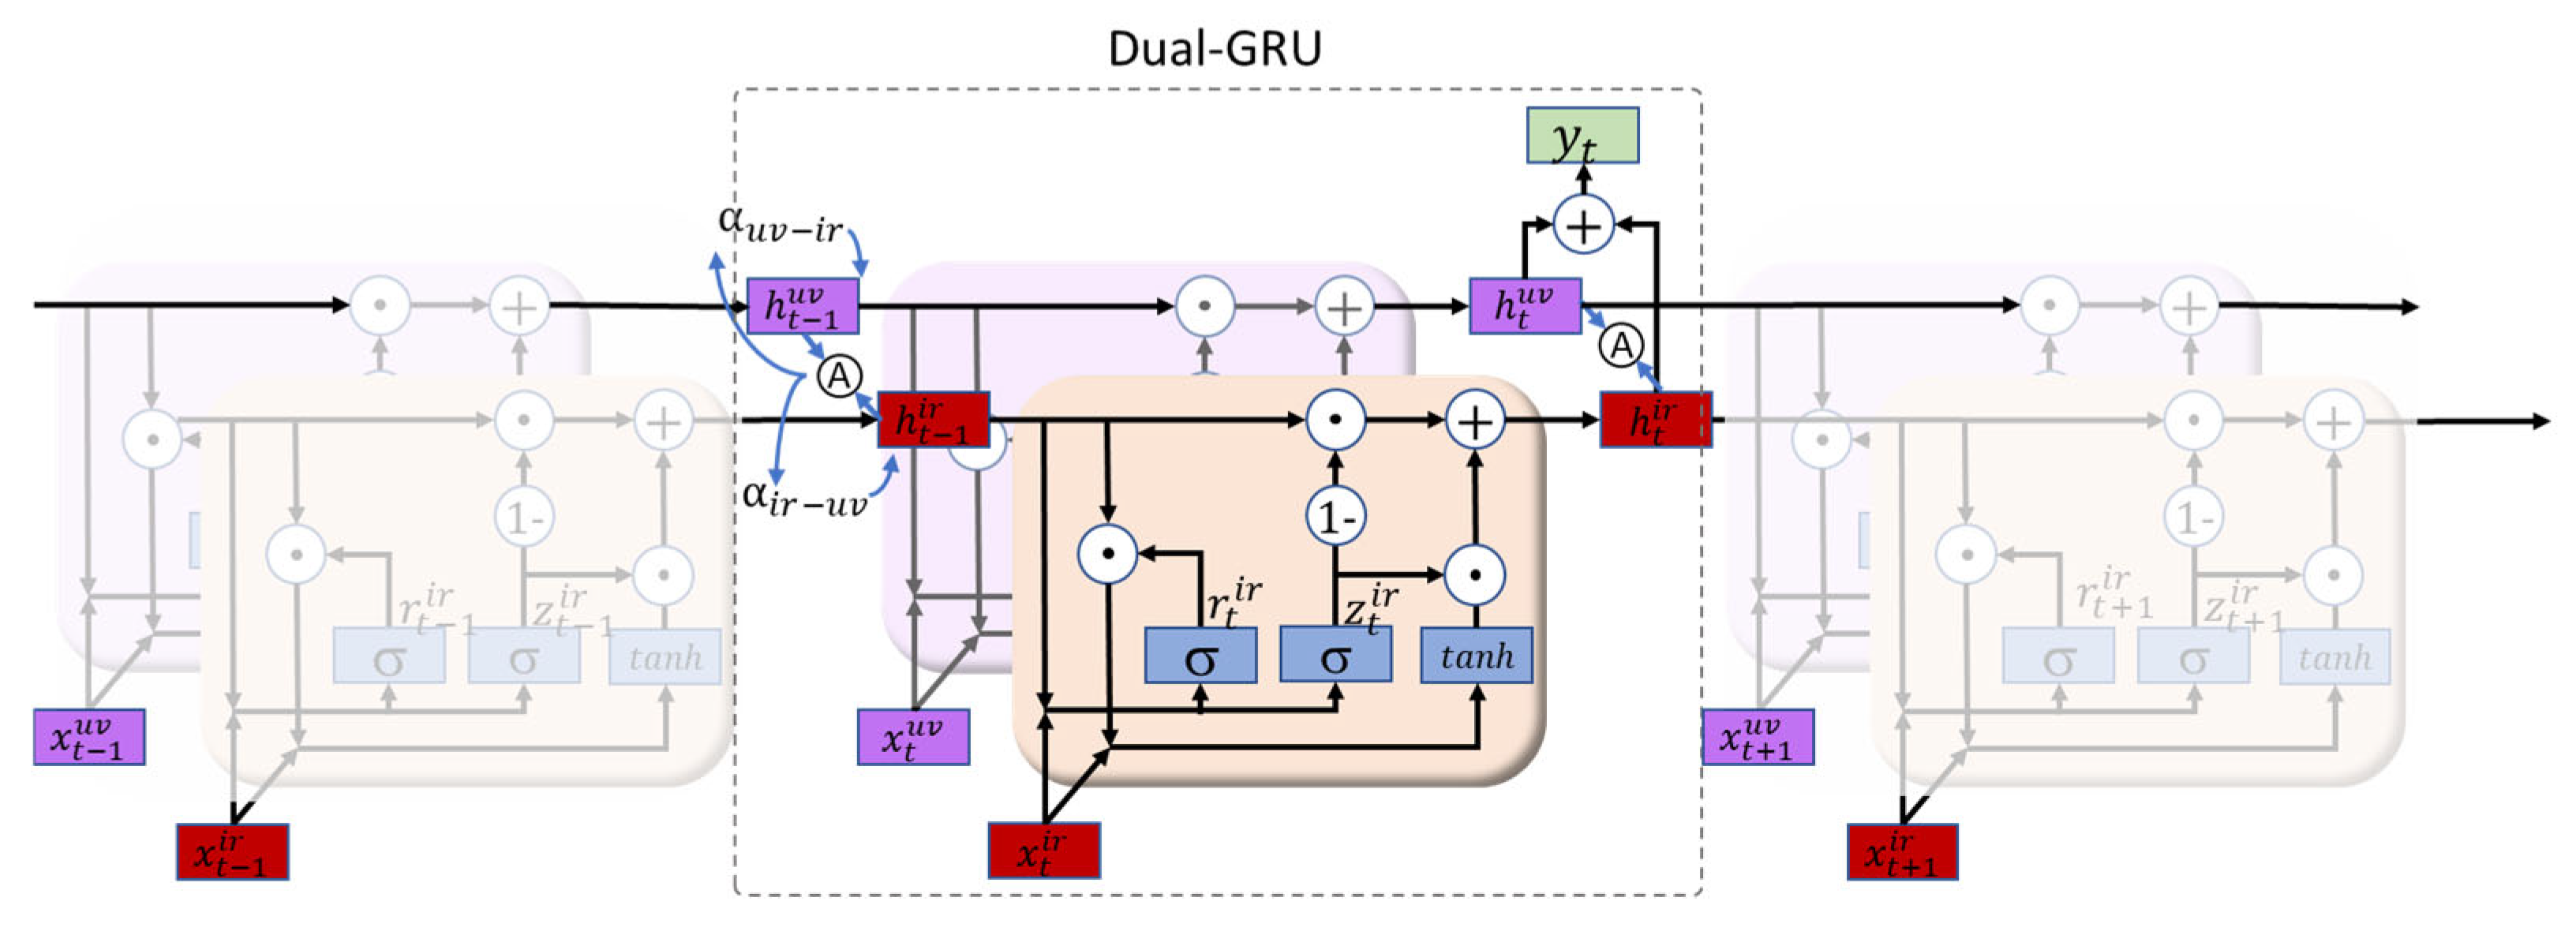
4.2. Improved GRU Neural Network Structure

To fully leverage the information contained within red and ultraviolet wavelengths, this study proposes a dual-input channel structure grounded in the traditional gated recurrent unit (GRU) and integrates the cross-attention mechanism into the gating mechanism, aiming to achieve more efficient information fusion and feature extraction. A GRU network with a dual-input channel architecture was constructed. One channel is dedicated to inputting preprocessed infrared light intensity data, while the other channel is designed for inputting ultraviolet light intensity data. These two channels operate independently yet in tandem, enabling the model to learn the feature information of red and ultraviolet wavelengths concurrently. The detailed network structure is illustrated in Figure 8. At each time window (5 s), the infrared and ultraviolet channels receive the corresponding light intensity data, respectively, which are then processed as the input for the GRU unit. The cross-attention mechanism is incorporated into the calculations of the GRU’s update gate and reset gate. This mechanism empowers the model to dynamically adjust its attention to ultraviolet information based on the infrared information and vice versa, thereby facilitating more effective fusion of red and ultraviolet information.
Specifically, for the input data at each time window, first, the attention weights between infrared information and ultraviolet information are calculated. The hidden states of the infrared channel and the ultraviolet channel at the previous time step h t 1 i r and h t 1 u v are concatenated to get h t 1 i r ; h t 1 u v ; then, a linear transformation is performed through a weight matrix W e T , and the attention scores e i r u v and e u v i r are calculated using the softmax function. After that, they are normalized using the softmax function to obtain the attention weights α i r u v and α u v i r , as shown in Formulas (3)–(6):
e i r u v = W e T h t 1 i r ; h t 1 u v
e u v i r = W e T h t 1 u v ; h t 1 i r
α i r u v = exp e i r u v i = u v , i r exp e i r u v
α u v i r = exp e u v i r i = u v , i r exp e u v i r
Subsequently, the attention weights are incorporated into the calculation of the update gate z t and the reset gate r t . For the infrared channel, the calculation of the update gate z t i r and the reset gate r t i r is shown in Formulas (7) and (8):
z t i r = σ W z i r x t i r ; α i r u v h t 1 i r + b z i r
r t i r = σ W r i r x t i r ; α i r u v h t 1 i r + b r i r
where x t i r is the preprocessed input data of the infrared channel at the current time step, W z i r and W r i r are weight matrices, b z i r and b r i r are bias terms, and σ is the sigmoid activation function. The calculation of the update gate z t u v and the reset gate r t u v for the ultraviolet channel is similar:
z t u v = σ W z u v x t u v ; α u v i r h t 1 u v + b z u v
r t u v = σ W r u v x t u v ; α u v i r h t 1 u v + b r u v
In this way, the improved GRU can dynamically adjust the gating mechanism according to the mutual relationship between the red and ultraviolet information, more effectively capture the characteristic changes of smoke at different wavelengths, and thus improve the accuracy of smoke recognition.
After calculating the update gate and the reset gate, the hidden states of the infrared channel and the ultraviolet channel are updated according to the calculation method of the traditional GRU. For the infrared channel, the update formula of the hidden state h t i r is shown in Formula (11):
h t i r = 1 z t i r h t 1 i r + z t i r t a n W h i r r t i r h t 1 i r ; x t i r + b h i r
Similarly, for the ultraviolet channel, the update formula of the hidden state h t u v is shown in Formula (12):
h t u v = 1 z t u v h t 1 u v + z t u v t a n h W h u v r t u v h t 1 u v ; x t u v + b h u v
where W h i r and W h u v are weight matrices and b h i r and b h u v are bias terms.
Hidden states of the infrared channel and the ultraviolet channel are fused by summation and other methods to obtain the final hidden state h t , which is used for subsequent classification and prediction. Finally, the output of the dual-GRU at time t is:
y t = s o f t m a x h t i r + h t u v
s u m = i = t t + 5 ( y t )
Finally, Formula (13) is employed to conduct a statistical analysis on the output y t of the dual-gated recursive network perception accumulation model derived from Formula (14) at each time step. The resultant summation serves as the statistical outcome. This outcome is analyzed based on the cumulative number of alarms over a specific time interval, aiming to mitigate false alarms induced by factors such as instantaneous interference. In this study, the threshold value was set to 6. Specifically, if the cumulative number of detections within a 5 s timeframe exceeded 6, it was indicative of a fire occurrence.

4.3. Loss Function

The dual-GRU uses the cross-entropy loss function to measure the difference between the model’s prediction results and the true labels. For multi-classification problems (such as classification of the normal state, the early-fire stage, the fire-development stage, etc.), the cross-entropy loss function is defined as follows:
L = 1 N i = 1 N j = 1 C y i j log p i j
where N is the number of samples, C is the number of classes, y i j is the true label (0 or 1) indicating whether sample i belongs to class j , and p i j is the probability that the model predicts sample i belongs to class j . The cross-entropy loss function can effectively measure the difference between the model’s predicted distribution and the true distribution. By minimizing the cross-entropy loss, the model’s prediction results can be made closer to the true labels.

4.4. Model Training

The dual-GRU proposed in this study is built using the PyTorch [30] 2.0.1 deep learning framework (The PyTorch code for the model designed is shown in Appendix A) and is trained and tested on a computer cluster equipped with an NVIDIA A2000 (12G) GPU (Manufacturer: Nvidia, Origin: Shanghai, China). The model was trained using the Adam optimizer [31] with a learning rate of 0.001 and a batch size of 16, following 50 iterations of training. Batch normalization and early stopping strategies were adopted in model training, and a BN layer was added after the GRU layer to accelerate convergence and alleviate overfitting. To enhance model robustness and prevent overfitting, systematic parameter fine-tuning was conducted using a validation set, focusing on the following key hyperparameters.

4.4.1. Learning Rate Schedule

A stepwise learning rate decay strategy was applied, reducing the learning rate by 50% every 10 epochs when validation loss plateaued. This ensured stable convergence while avoiding premature trapping in local minima.

4.4.2. Regularization Parameters

Weight decay: L2 regularization with a penalty factor of 10−4 was applied to all weight matrices to mitigate overfitting, particularly in the GRU gates and the attention mechanism layers.
Dropout: a dropout rate of 0.2 was tested for the hidden layers, but it was omitted in the final model as it introduced marginal performance degradation in time-series feature learning.

4.4.3. Batch Size Impact

Grid search was performed over batch sizes {8, 16, 32} to balance computational efficiency and gradient stability. A batch size of 16 was selected as it yielded the best validation accuracy while fitting within the GPU memory constraints.

4.4.4. Early Stopping Criteria

Training was terminated early if the validation loss did not decrease for 10 consecutive epochs, preventing overfitting and reducing unnecessary computations. This strategy reduced the effective number of epochs to 42 on average.
Optimal parameter set: the final model configuration, validated through cross-scenario testing, includes the following:
  • Learning rate: 10−3;
  • Batch size: 16;
  • Weight decay: 10−4;
  • GRU hidden layer size: 64.
These adjustments improved the model’s generalization ability across diverse scenarios, as reflected in the stable performance metrics reported in Table 1 and Figure 9. The changes in accuracy and loss during the model training process are shown in Figure 10.

5. Experiment and Analysis

5.1. Comparison Algorithms

To comprehensively evaluate the performance of the improved GRU algorithm proposed in this study, several classic fire signal processing algorithms were selected for comparative experiments. The specific comparison algorithms are as follows:
  • B1: fixed-threshold algorithm: this is a simple and intuitive fire signal processing algorithm. It sets a fixed threshold for the light intensity change of the detector. When the light intensity change exceeds this threshold, a fire alarm is issued. Although this algorithm is easy to implement, it is highly susceptible to environmental interference and has a high false alarm rate.
    Specifically, assuming the received signal strength is S and the alarm threshold is T , when
    S > T ,
    it is considered that a fire has occurred.
  • B2: trend algorithm: it analyzes the change trend of the detector’s light intensity signal over time. By calculating the slope of the signal curve, it determines whether there is a fire. If the slope exceeds a certain value, it is considered that a fire may occur. However, this algorithm is less sensitive to slow-developing fires and may have a high missed alarm rate.
    Specifically, assuming S is the received signal strength at time i and the alarm threshold is T , the formula for calculating T r e n d is as follows:
    T r e n d = S i S i n n
    where n is the length of the time interval used to calculate the trend. When the preset trend threshold is reached, an alarm is triggered. When
    T r e n d > T ,
    it is considered that a fire has occurred.
  • B3: slope algorithm: similar to the trend algorithm, it focuses on the rate of change of the light intensity signal. It calculates the slope of the signal within a specific time window. When the slope reaches a predefined value, a fire alarm is triggered. This algorithm can quickly detect rapidly developing fires but may also generate false alarms due to sudden environmental changes.
    Specifically, for a set of received signal strength data S 1 ,   S 2 , , S m , assuming the time point is t 1 ,   t 2 , , t m , fit the line S = a t + b using the least squares method, where the formula for calculating the slope a is as follows:
    a = i = 1 m t i t ¯ S i S ¯ i = 1 m t i t ¯ 2 ,
    where
    t ¯ = 1 m i = 1 m t i
    S ¯ = 1 m i = 1 m S i
    When
    a > T
    it is considered that a fire has occurred.
  • B4: duration algorithm: it determines whether there is a fire by analyzing the duration of the detector’s light intensity signal exceeding a certain threshold. If the signal remains above the threshold for a specified time, a fire alarm is issued. This algorithm can reduce false alarms caused by short-term interference but may delay the alarm for fast-spreading fires.
    Specifically, assuming the received signal strength is S , the alarm threshold is T , and the duration is D , the alarm threshold is T a , and the time threshold is T t , when
    S > T a ,
    start timing. If the signal strength remains above the threshold, the duration accumulates continuously. When
    D > T t ,
    it is considered that a fire has occurred.
  • B5: BP neural network algorithm: the BP (backpropagation) neural network is a classic artificial neural network algorithm. It can learn the complex mapping relationship between input signals and output labels through training. In the field of fire detection, the BP neural network can use the light intensity data of the detector as input and output the fire judgment result. However, the BP neural network is prone to overfitting problems and has a relatively long training time.
In the experiment, low, medium, and high sensitivity alarm thresholds were set for the threshold, trend, slope, and duration algorithms, respectively. At low sensitivity, the alarm threshold is higher, which can reduce false alarms caused by environmental noise and other factors. However, it may increase the false alarm rate and increase the required alarm time. The alarm threshold for medium sensitivity is moderate, aiming to balance the false alarm rate and the missed alarm rate. When the sensitivity is high, the alarm threshold is low, and the missed alarm rate decreases, but the false alarm rate may increase, and the duration required for the alarm should be shortened.

5.2. Experimental Setup

The experimental data used in this study came from the large-scale smoke spectral characteristic experimental platform built in Section 3. The platform can simulate various fire scenarios and interference factors, providing rich and realistic experimental data.
The experimental dataset was divided into a training set, a validation set, and a test set according to the ratio of 7:1:2. The training set was used to train the models of each algorithm, the validation set was used to adjust the model parameters and prevent overfitting, and the test set was used to evaluate the final performance of the models.
During the experiment, the performance of each algorithm was evaluated using multiple indicators, including accuracy, false alarm rate, missed alarm rate, and alarm response time. The calculation formulas for these indicators are as follows:
A c c = T P + T N T P + F P + T N + F N
F A = F P T N + F P
M A = F N T P + F N
Among them,
  • TP (true positive) is the correct number of alarm samples;
  • TN (true negative) is the correct number of non-alarm samples;
  • FP (false positive) refers to the number of false-positive samples;
  • FN (false negative) refers to the number of missed samples.

5.3. Experimental Results and Analysis

The experimental results are shown in Table 1, which clearly indicate that the improved GRU algorithm proposed in this study has excellent performance compared to the other five algorithms.
In terms of accuracy, the detection accuracy of different algorithms is significantly affected by their signal processing logic and feature extraction capabilities. The fixed-threshold algorithm (B1) relies on a single intensity threshold for judgment, with an accuracy of 82.5% at low sensitivity (B1-low), but drops sharply to 76.4% at high sensitivity (B1-high). Essentially, simple thresholds have difficulty distinguishing between the intensity changes of complex environmental interference and real fire signals. The trend algorithm (B2) and the slope algorithm (B3) extract features by analyzing signal trends or slopes. The accuracy rates at low sensitivity are 86.8% (B2-low) and 92.7% (B3-low), respectively. However, at high sensitivity, the accuracy drops to 79.8% (B2-high) and 86.2% (B3-high) due to overreaction to instantaneous noise, exposing the limitations of single dynamic feature analysis. The duration algorithm (B4) filters short-term interference through the duration of the signal, with a low sensitivity accuracy of 91.2% (B4-low), but at high sensitivity, the ability to identify interference decreases due to the shortened duration, resulting in an accuracy of 85.5% (B4-high), reflecting the insufficient adaptability of fixed time logic to complex scenes. The BP neural network algorithm (B5) relies on multilayer feature extraction and has a low sensitivity accuracy of 90.1% (B5 low), which is better than that of most traditional algorithms. However, for high sensitivity (B5-high), due to overfitting risks and lack of wavelength correlation analysis, the accuracy drops to 87.8%, failing to break through the bottleneck of shallow feature fusion.
The improved GRU algorithm significantly leads with an accuracy of 96.8%, and its core advantage lies in dual-wavelength information fusion and the cross-attention mechanism: by synchronously processing the temporal signals of 405 nm ultraviolet light (particle scattering characteristics) and 850 nm near-infrared light (concentration change characteristics), combined with the attention mechanism to dynamically focus on the feature interaction of the key wavelengths, it effectively captures the full-cycle signal pattern of smoke from microscale particle generation to macroscale concentration accumulation, avoiding the one-sidedness of traditional algorithms relying on single features or fixed rules. The deep fusion and dynamic modeling of multidimensional features enable it to maintain high accuracy even under complex interferences such as water vapor and vibration, breaking through the ceiling of traditional algorithms in detection accuracy and providing technical support for the reliable application of linear beam detectors in real life.
In terms of the false alarm rate, the significant differences in false alarm rates between the different algorithms essentially reflect the limitations of their ability to distinguish environmental interference signals and feature processing logic. The fixed-threshold algorithm (B1) relies only on a single intensity threshold, with a low sensitivity (B1-low) false alarm rate of 11.1% and a high sensitivity (B1-high) rate of 5.2%, but at the cost of misjudging more environmental fluctuations (such as instantaneous strong light and equipment vibration) as fires, exposing its insufficient robustness to complex interference. The trend algorithm (B2) and the slope algorithm (B3) extract features through signal change trends. At low sensitivity, the false alarm rates are 3.9% (B2-low) and 3.5% (B3-low), respectively. However, at high sensitivity, due to excessive capture of short-term noise (such as airflow disturbance and light source flicker), the false alarm rates increase to 4.7% (B2-high) and 8.8% (B3-high), highlighting the limited filtering ability of single dynamic feature analysis with regard to non-fire signal fluctuations. The duration algorithm (B4) filters short-term interference by preset signal duration. The low sensitivity false alarm rate is as low as 3.2% (B4-low), but at high sensitivity, the ability to identify interference decreases due to shortened duration, and the false alarm rate increases to 7.6% (B4-high), reflecting the adaptability weakness of fixed time logic to sudden interference. The BP neural network algorithm (B5) relies on data-driven feature extraction, with a low sensitivity false alarm rate of 3.0% (B5-low), which is better than that of most traditional algorithms. However, for high sensitivity (B5-high), due to overfitting risks and lack of wavelength correlation analysis, the false alarm rate increases to 4.5%, which fails to completely solve the problem of misjudgment under complex interference.
The improved GRU algorithm significantly outperforms all the compared algorithms with a false alarm rate of 2.1%. Its core advantage lies in the synergistic effect of dual-wavelength information fusion and the cross-attention mechanism: by synchronously analyzing the temporal signal differences between 405 nm ultraviolet light (sensitive to smoke particle scattering) and 850 nm near-infrared light (sensitive to concentration changes) and dynamically calibrating the feature weights of the two channels with the attention mechanism, it effectively identifies the non-correlation of signal fluctuations in interference scenes (such as water vapor and dust); for example, under water vapor interference, ultraviolet light intensity fluctuates but near-infrared light intensity does not continuously decrease. The algorithm can filter out such invalid signals through cross-wavelength feature comparison. The deep interaction and dynamic calibration of multidimensional features enable the improved GRU algorithm to accurately distinguish between the “sustained attenuation” of fire smoke and the “random fluctuations” of environmental interference, fundamentally suppressing false alarms and providing key technical guarantees for the stable operation of detectors in complex environments.
In terms of the missed alarm rate, the difference in missed alarm rates between different algorithms essentially reflects the limitations of their ability to capture fire signals, especially early weak changes, and the logic of feature analysis. The fixed-threshold algorithm (B1) relies on a single intensity threshold, with a low sensitivity (B1-low) missed alarm rate of 1.8% and a high sensitivity (B1-high) rate of 0.7%, but only judged by the absolute value of intensity, which can easily miss the gradual attenuation signal of the initial smoke and increase the risk of missed alarms during the smoldering stage. The trend algorithm (B2) and the slope algorithm (B3) rely on signal change trend (slope) detection. The false alarm rates at low sensitivity are 11.2% (B2-low) and 9.8% (B3-low), respectively. Due to the signal slope not reaching the threshold during slow combustion, they are insensitive to weak-intensity fluctuations caused by early particle scattering. At high sensitivity, the false alarm rates decrease to 6.1% (B2-high) and 3.6% (B3-high), but these algorithms remain limited by the one-sidedness of a single dynamic feature. The duration algorithm (B4) requires the signal to continuously exceed the threshold for a predetermined duration, with a low sensitivity false alarm rate of 10.5% (B4-low). Due to the possibility of rapid fires being missed before the time accumulation is met, the high sensitivity is reduced to 4.8% (B4-high); the algorithm sacrifices timely response to short-term intense combustion signals. The BP neural network algorithm (B5) achieves a low sensitivity false alarm rate of 6.2% (B5-low) and a high sensitivity rate of 2.8% (B5-high) through multilayer feature extraction. However, due to the lack of shallow feature fusion and multi-wavelength correlation analysis, its ability to recognize signal patterns in complex combustion stages (such as the transition from smoldering to open flame) is insufficient.
The improved GRU algorithm significantly outperforms all the compared algorithms with a 1.5% false alarm rate. Its core advantage lies in the deep fusion and dynamic modeling of dual wavelength temporal features: by synchronously analyzing time-series data of 405 nm ultraviolet light (sensitive to early small particle scattering) and 850 nm near-infrared light (sensitive to smoke concentration accumulation), combined with the cross-attention mechanism to focus on the collaborative changes of cross-wavelength features, for example, the sustained weak attenuation of ultraviolet light intensity in the early stage of a fire and the gradual decrease of near-infrared light intensity form feature associations. The algorithm can capture such “non-independent attenuation” patterns through temporal dependency modeling, avoiding signal detection failure caused by traditional algorithms due to using a single wavelength or fixed rules. The collaborative learning of multidimensional features and the ability to capture long-term and short-term dependencies enable the improved GRU algorithm to effectively distinguish the full-cycle signals from particle generation from those associated with concentration increase. Even in the early stages of low smoke concentration and slow changes, detection can be triggered, fundamentally reducing the risk of false alarms and providing a more reliable technical solution for early fire warning.
In terms of the alarm response time, the fixed-threshold algorithm (B1) relies on simple signal strength threshold comparison to achieve the shortest response time (B1-high, only 0.3 s) under high sensitivity settings, but relies on real-time single threshold judgment. The trend algorithm (B2) and the slope algorithm (B3) trigger alarms by analyzing the trend (slope) of signal changes, and the response time is shortened from 14.0 s (B2-low)/13.5 s (B3-low) to 7.5 s (B2-high)/6.9 s (B3-high) as sensitivity increases. Among them, the slope algorithm is slightly better than the fast intensity fluctuation response due to the use of least squares to fit short-term signal changes. The duration algorithm (B4) requires the signal to continuously exceed the threshold for a preset duration, with the longest response time at low sensitivity (B4-low, 16.0 s), shortened to 8.7 s under high sensitivity. Essentially, it filters short-term interference through delayed alarms. The improved GRU algorithm has a response time of 6.7 s and captures multidimensional changes in smoke in real time through dual-wavelength temporal feature fusion and a dynamic attention mechanism, without relying on fixed thresholds or time accumulation, avoiding the shortcomings of traditional algorithms such as “fast response but unreliable” or “long delay response.” Real-time processing of multidimensional features is completed within 6.7 s, balancing response efficiency and signal analysis integrity, providing a technological breakthrough for timely fire detection in complex scenes.
In terms of the inference time, traditional rule-based algorithms (B1–B4) exhibit extremely short inference times (0.005–0.018 s), primarily due to their simple threshold/logic-based calculations. For example, the fixed-threshold algorithm (B1) achieves the shortest time (0.005 s at high sensitivity) by relying on direct intensity comparison, but this comes at the cost of low accuracy (76.4%). The BP neural network (B5) requires 0.15 s for inference, an order of magnitude slower than traditional algorithms. This is attributed to its multilayer fully connected structure, which involves more matrix operations during forward propagation. Our algorithm (dual-GRU with cross-attention) has an inference time of 0.21 s, slightly longer than that of B5. This is due to the dual-channel GRU architecture and the cross-attention mechanism, which introduce additional computational steps (e.g., attention weight calculation, hidden state fusion).
Notably, all the algorithms were tested on an NVIDIA A2000 GPU, leveraging CUDA acceleration for parallel computation. Despite the longer inference time, our method achieved a 96.8% accuracy, significantly outperforming traditional algorithms in complex scenarios. The trade-off between inference time and accuracy is justified by the application requirements of linear beam detectors in high-risk environments, where reliability takes precedence over marginal computational speed. Future work will explore lightweight optimizations (e.g., model quantization, channel pruning) to further reduce inference time while maintaining detection performance.
In general, the improved GRU algorithm proposed in this study exhibits an accuracy rate of 96.8% and a false-positive rate of merely 2.1%, thereby demonstrating remarkable performance in terms of detection accuracy and anti-interference capabilities. Although, when evaluated from the perspective of a single indicator, its alarm response time of 6.7 s and inference time of 0.21 s are not the shortest (for instance, the B1-high setting has an alarm response time of 0.3 s and an inference time of 0.03 s), the B1-high setting only attains an accuracy of 76.4%, with a false alarm rate of 5.2%. A short alarm response time achieved at the cost of accuracy and reliability offers no practical benefits. The improved GRU algorithm has a false alarm rate of 1.5%, which is the lowest among all the algorithms under consideration. This indicates its superior ability to capture fire signals and effectively mitigate false alarm risks. In terms of comprehensive performance, it strikes an optimal balance between accuracy, false alarm rate, and alarm response time, thus validating the reliability and practicality of the algorithm in complex environments. Traditional algorithms and the BP neural network algorithm are constrained by their respective design principles, rendering it arduous to achieve a balance between detection accuracy, anti-interference, and response efficiency in complex scenarios.

5.4. Ablation Experiments

To further verify the effectiveness of the dual-wavelength information fusion and the cross-attention mechanism in the improved GRU algorithm, ablation experiments were carried out.
  • B6: single-wavelength model: a model using only infrared light intensity data was established. The experimental results show that the accuracy of the single-wavelength model is significantly lower than that of the dual-wavelength model, and the false alarm rate and the missed alarm rate are higher. This indicates that the dual-wavelength information fusion can provide more comprehensive feature information and improve the performance of the model.
  • B7: GRU model without the cross-attention mechanism: the experimental results show that the performance of this model is also inferior to that of the improved GRU model with the cross-attention mechanism. This shows that the cross-attention mechanism can effectively enhance the interaction between red and ultraviolet information, enabling the model to better capture the characteristic changes of smoke at different wavelengths.
The results of the ablation experiment are shown in Table 2, and it can be concluded that both the dual-wavelength information fusion and the cross-attention mechanism play important roles in improving the performance of the algorithm, and they are the key factors for the excellent performance of the improved GRU algorithm. Moreover, they significantly improve the accuracy with less than one second of computation delay.

6. Conclusions

This study addresses the issues of low detection accuracy and high false alarm rate faced by linear beam smoke detectors in large-scale complex buildings. Through the construction of an experimental platform, dual-wavelength information fusion, and improved GRU algorithm design, significant improvements in smoke detection performance in complex environments were achieved. The specific conclusion is as follows:
  • Experimental platform and wavelength screening. By establishing a 120 m large-scale experimental platform for investigating smoke spectral characteristics, a systematic analysis was conducted on the attenuation of light intensity by smoke particles within the 200–2500 nm wavelength range. The experimental findings revealed that the 405 nm ultraviolet band and the 850 nm near-infrared band exhibit heightened sensitivity to fluctuations in smoke concentration. The integration of these two bands can complementarily capture signal characteristics throughout the entire fire development cycle. This discovery provides a robust experimental foundation for the wavelength selection of linear beam detectors, effectively addressing the issue of inadequate resilience to complex interferences inherent in traditional single-wavelength detection methods.
  • Innovation and efficacy of the dual-GRU algorithm. The proposed improved gated recurrent unit (GRU) algorithm constructs a dual-input channel structure and incorporates the cross-attention mechanism, thereby enabling the fusion of temporal signals and dynamic interaction of features between 405 nm ultraviolet light and 850 nm near-infrared light. This fundamentally overcomes the limitations of traditional algorithms that rely on a single wavelength or fixed rules. Leveraging dual-wavelength information, the algorithm synergistically perceives the microscale particle scattering (through the UV channel) and the macroscale concentration changes (through the near-infrared channel) of smoke. In combination with the attention mechanism, it dynamically focuses on key features. As a result, it demonstrates superior performance compared to the other algorithms in the core indicators such as detection accuracy (96.8%), false alarm rate (2.1%), missed alarm rate (1.5%), and alarm response time (6.7 s).
  • Practical application value and technological breakthroughs. The research findings effectively capture the multidimensional characteristics of the full-cycle smoke development via data-driven deep modeling. They can accurately discriminate the temporal disparities between fire signals and environmental interferences, circumvent the one-sidedness of traditional threshold-based algorithms, and address the issue of inadequate adaptability of single-feature analysis in complex scenarios. This study offers a highly efficient and robust solution for the reliable operation of linear beam smoke detectors in high-rise space buildings, thereby demonstrating significant technological breakthroughs and practical value in modern fire safety applications.

Author Contributions

Conceptualization, Z.W. and Z.C.; data curation, Z.W. and L.W.; formal analysis, L.W.; funding acquisition, B.L.; project administration, X.Z.; resources, L.W. and Z.C.; software, Z.W.; supervision, X.Z.; validation, B.L.; visualization, X.Z.; writing—original draft preparation, Z.W.; writing—review and editing, B.L. All authors have read and agreed to the published version of the manuscript.

Funding

This research was funded by the National Key R&D Program of China, 2023YFC3010004.

Institutional Review Board Statement

Not applicable.

Informed Consent Statement

Not applicable.

Data Availability Statement

The original contributions presented in the study are included in the article, further inquiries can be directed to the corresponding author.

Conflicts of Interest

The authors declare no conflicts of interest.

Abbreviations

GRUGated recurrent unit
LSTMLong short-term memory
RNNRecurrent neural network
GPUGraphical processing unit
BPBackpropagation
SDStandard deviation

Appendix A

The PyTorch code for the model designed in our article:
class DualGRU(nn.Module):
      def __init__(self, input_size_ir=1, input_size_uv=1, hidden_size=64, num_classes=3):
    super(DualGRU, self).__init__()
    self.hidden_size = hidden_size
    # IR channel GRU parameters (Formulas (7), (8) and (11))
    self.gru_ir = nn.GRUCell(input_size=input_size_ir, hidden_size=hidden_size)
    self.w_z_ir = nn.Linear(hidden_size + input_size_ir, hidden_size) # Wz^ir in Formula 7
    self.w_r_ir = nn.Linear(hidden_size + input_size_ir, hidden_size) # Wr^ir in Formula 8
    self.w_h_ir = nn.Linear(hidden_size + input_size_ir, hidden_size) # Wh^ir in Formula 11
    # UV channel GRU parameters (Formulas (9), (10) and (12))
    self.gru_uv = nn.GRUCell(input_size=input_size_uv, hidden_size=hidden_size)
    self.w_z_uv = nn.Linear(hidden_size + input_size_uv, hidden_size) # Wz^uv in Formula 9
    self.w_r_uv = nn.Linear(hidden_size + input_size_uv, hidden_size) # Wr^uv in Formula 10
    self.w_h_uv = nn.Linear(hidden_size + input_size_uv, hidden_size) # Wh^uv in Formula 12
    # Cross-attention parameters (Formulas (3)-(6))
    self.w_e = nn.Linear(2 * hidden_size, 1) # We matrix in Formulas 3-4
    # Output layer (Formula (13))
    self.fc = nn.Linear(2 * hidden_size, num_classes)
      def forward(self, x_ir, x_uv):
    """
     Input:
       x_ir: Infrared channel data (batch_size, seq_len, input_size_ir)
       x_uv: Ultraviolet channel data (batch_size, seq_len, input_size_uv)
    """
    batch_size, seq_len, _ = x_ir.shape
    h_ir = torch.zeros(batch_size, self.hidden_size).to(x_ir.device) # Initial hidden state h_ir^0 (Formula (3))
    h_uv = torch.zeros(batch_size, self.hidden_size).to(x_uv.device) # Initial hidden state h_uv^0 (Formula (4))
    for t in range(seq_len):
      # Current time-step data extraction
      x_t_ir = x_ir[:, t, :] # x_t^ir in Formula (7)
      x_t_uv = x_uv[:, t, :] # x_t^uv in Formula (9)
      # Cross-attention weight calculation (Formulas (3)-(6))
      h_concat = torch.cat([h_ir, h_uv], dim=1) # [h_ir^{t-1}; h_uv^{t-1}] in Formulas (3),(4)
      e_ir_uv = self.w_e(h_concat).squeeze() # e_ir-uv = We^T [h_ir; h_uv] (Formula (3))
      e_uv_ir = self.w_e(torch.cat([h_uv, h_ir], dim=1)).squeeze() # e_uv-ir = We^T [h_uv; h_ir] (Formula (4))
      alpha_ir_uv = F.softmax(torch.stack([e_ir_uv, e_uv_ir], dim=1), dim=1)[:, 0] # α_ir-uv calculation (Formula (5))
      alpha_uv_ir = F.softmax(torch.stack([e_uv_ir, e_ir_uv], dim=1), dim=1)[:, 0] # α_uv-ir calculation (Formula (6))
      # IR channel update gate and reset gate (Formulas (7),(8))
      z_ir_input = torch.cat([x_t_ir, alpha_ir_uv.unsqueeze(1) * h_ir], dim=1) # [x_t^ir; α_ir-uv * h_ir^{t-1}] (Formula (7))
      r_ir_input = torch.cat([x_t_ir, alpha_ir_uv.unsqueeze(1) * h_ir], dim=1) # [x_t^ir; α_ir-uv * h_ir^{t-1}] (Formula (8))
      z_ir = torch.sigmoid(self.w_z_ir(z_ir_input)) # z_t^ir = σ(Wz^ir [x_t^ir; α*h_ir]) (Formula (7))
      r_ir = torch.sigmoid(self.w_r_ir(r_ir_input)) # r_t^ir = σ(Wr^ir [x_t^ir; α*h_ir]) (Formula (8))
      # UV channel update gate and reset gate (Formulas (9),(10))
      z_uv_input = torch.cat([x_t_uv, alpha_uv_ir.unsqueeze(1) * h_uv], dim=1) # [x_t^uv; α_uv-ir * h_uv^{t-1}] (Formula (9))
      r_uv_input = torch.cat([x_t_uv, alpha_uv_ir.unsqueeze(1) * h_uv], dim=1) # [x_t^uv; α_uv-ir * h_uv^{t-1}] (Formula (10))
      z_uv = torch.sigmoid(self.w_z_uv(z_uv_input)) # z_t^uv = σ(Wz^uv [x_t^uv; α*h_uv]) (Formula (9))
      r_uv = torch.sigmoid(self.w_r_uv(r_uv_input)) # r_t^uv = σ(Wr^uv [x_t^uv; α*h_uv]) (Formula (10))
      # IR channel hidden state update (Formula (11))
      h_ir_candidate = torch.tanh(self.w_h_ir(torch.cat([r_ir * h_ir, x_t_ir], dim=1))) # tanh(Wh^ir [r_t^ir*h_ir; x_t^ir]) (Formula (11))
      h_ir = (1 - z_ir) * h_ir + z_ir * h_ir_candidate # h_ir^t = (1-z_t^ir)h_ir^{t-1} + z_t^ir*h_ir_candidate (Formula (11))
      # UV channel hidden state update (Formula (12))
      h_uv_candidate = torch.tanh(self.w_h_uv(torch.cat([r_uv * h_uv, x_t_uv], dim=1))) # tanh(Wh^uv [r_t^uv*h_uv; x_t^uv]) (Formula (12))
      h_uv = (1 - z_uv) * h_uv + z_uv * h_uv_candidate # h_uv^t = (1-z_t^uv)h_uv^{t-1} + z_t^uv*h_uv_candidate (Formula (12))
    # Fuse dual-channel hidden states (Formulas (13),(14))
    h_fused = h_ir + h_uv # Hidden state fusion (Formula (13))
    out = self.fc(h_fused) # Linear transformation
    return F.softmax(out, dim=1) # Classification output (Formula (13))

References

  1. Fireray One Auto-Aligning Beam Detector. Available online: https://www.pottersignal.com/conventional-fire-alarm/beam-detectors/fireray-beam-detector (accessed on 2 May 2025).
  2. Linear Smoke Detector LRMX. Available online: https://www.esser-systems.com/en/products/details/detectors-for-special-applications/linear-smoke-detectors/76140010-linear-smoke-detector-lrmx/ (accessed on 2 May 2025).
  3. Model 6424 Projected Beam Smoke Detector. Available online: https://prod-edam.honeywell.com/content/dam/honeywell-edam/hbt/en-us/documents/literature-and-specs/datasheets/6424_DataSheet_A05-02171.pdf (accessed on 6 May 2025).
  4. PROJECTED BEAM TYPE SMOKE DETECTOR FDGJ SERIES. Available online: https://koueitrading.com/global/product/nohmi-bosai-fdgj-series-projected-beam-type-smoke-detector/ (accessed on 3 May 2025).
  5. OSID Imager Beam Smoke Detector. Available online: https://buildings.honeywell.com/us/en/products/by-category/fire-life-safety/sensors-and-detectors/beam-detectors/osid-imager-beam-smoke-detector (accessed on 5 May 2025).
  6. Ge, J.; Yu, Z. Research on double discrimination imaging smoke detection technology for high space areas in subway. Fire Sci. Technol. 2023, 42, 1714–1718. [Google Scholar]
  7. Luck, H.O. Dedicated detection algorithms for automatic fire detection. In Proceedings of the 3rd Intemational Symposium on Fire Safety Science, Edinburgh, UK, 8–12 July 1991; Drysdale, D.D., Ed.; Elsevier Applied Science Publishers: London, UK, 1991; pp. 135–148. [Google Scholar]
  8. Tomkewitsch, R. Fire detection systems with “distributed Intelligence” the puls pollingsystem. Fire Saf. J. 1993, 9, 225–231. [Google Scholar] [CrossRef]
  9. Wang, S.; Dou, Z. Exclusive trend detector with variable observation windows for signal detection. Electron. Lett. 1997, 33, 1433–1435. [Google Scholar] [CrossRef]
  10. Okayama, Y. A primitive study of a fire detection method controlled by artificial neural net. Fire Saf. J. 1991, 17, 535–553. [Google Scholar] [CrossRef]
  11. Nakanishi, S.; Nomura, J.; Kurio, T.; Kaneda, M. Intelligent fire warning system using fuzzy technology. In Proceedings of the 10th Internationale Konferenz ueber Automatische Brandentdeckung, Duisburg, Germany, 5 April 1995; Luck, H., Ed.; AUBE’95. pp. 203–212. [Google Scholar]
  12. Liu, G.; Yuan, H.; Huang, L.D. A fire alarm judgment method using multiple smoke alarms based on Bayesian estimation. Fire Saf. J. 2023, 136, 103733. [Google Scholar] [CrossRef]
  13. Hulst, H.C.; Van De Hulst, H.C. Light Scattering by Small Particles; Dover Publications, Inc.: New York, NY, USA, 1981. [Google Scholar]
  14. Li, K.; Liu, G.; Yuan, H.; Chen, Y.; Dai, Y.; Meng, X.; Kang, Y.; Huang, L. Dual-Wavelength Smoke Detector Measuring Both Light Scattering and Extinction to Reduce False Alarms. Fire 2023, 6, 140. [Google Scholar] [CrossRef]
  15. Xia, J.; Zeng, J.; Zhou, Y. Dual-wavelength optical sensor for fire detection and measurement of aerosol mass concentration. Fire Saf. J. 2024, 146, 104129. [Google Scholar] [CrossRef]
  16. Węgrzyński, W.; Antosiewicz, P.; Fangrat, J. Multi-Wavelength Densitometer for Experimental Research on the Optical Characteristics of Smoke Layers. Fire Technol. 2021, 57, 2683–2706. [Google Scholar] [CrossRef]
  17. Yu, M.; Yuan, H.; Li, K.; Wang, J. Research on multi-detector real-time fire alarm technology based on signal similarity. Fire Saf. J. 2023, 136, 103724. [Google Scholar] [CrossRef]
  18. Elman, J.L. Finding Structure in Time. Cogn. Sci. 1990, 14, 179–211. [Google Scholar] [CrossRef]
  19. Hochreiter, S.; Schmidhuber, J. Long short-term memory. Neural Comput. 1997, 9, 1735–1780. [Google Scholar] [CrossRef] [PubMed]
  20. Kyunghyun, C.; Bart, V.M.; Çaglar, G.; Dzmitry, B.; Fethi, B.; Holger, S.; Yoshua, B. Learning Phrase Representations using RNN Encoder-Decoder for Statistical Machine Translation. arXiv 2014, arXiv:1406.1078. [Google Scholar]
  21. ISO 7240-7:2023; Fire Detection and Alarm Systems—Part 7: Point-Type Smoke Detectors Using Scattered Light 2023. ISO: Geneva, Switzerland, 2023.
  22. Husain, G.; Siddiqua, A.; Toma, M. Evaluating the Performance of DenseNet in ECG Report Automation. Electronics 2025, 14, 1837. [Google Scholar] [CrossRef]
  23. Agbehadji, I.E.; Obagbuwa, I.C. Integration of Explainable Artificial Intelligence into Hybrid Long Short-Term Memory and Adaptive Kalman Filter for Sulfur Dioxide (SO2) Prediction in Kimberley, South Africa. Atmosphere 2025, 16, 523. [Google Scholar] [CrossRef]
  24. Mutawa, A.M.; Sruthi, S. A Comparative Evaluation of Transformers and Deep Learning Models for Arabic Meter Classification. Appl. Sci. 2025, 15, 4941. [Google Scholar] [CrossRef]
  25. Khan, J.; Ahmad, N.; Lee, Y.; Khalid, S.; Hussain, D. Hybrid Deep Neural Network with Domain Knowledge for Text Sentiment Analysis. Mathematics 2025, 13, 1456. [Google Scholar] [CrossRef]
  26. Sebbane, C.; Belhajem, I.; Rziza, M. Making Images Speak: Human-Inspired Image Description Generation. Information 2025, 16, 356. [Google Scholar] [CrossRef]
  27. Liu, B.; Xu, J.; Xi, J.; Zhao, C.; Feng, X.; Ren, C.; Shang, H. A Hybrid VMD-BO-GRU Method for Landslide Displacement Prediction in the High-Mountain Canyon Area of China. Remote Sens. 2025, 17, 1953. [Google Scholar] [CrossRef]
  28. Chen, B.; Liu, G. D4Care: A Deep Dynamic Memory-Driven Cross-Modal Feature Representation Network for Clinical Outcome Prediction. Appl. Sci. 2025, 15, 6054. [Google Scholar] [CrossRef]
  29. Adefemi, K.O.; Mutanga, M.B.; Jugoo, V. Hybrid Deep Learning Models for Predicting Student Academic Performance. Math. Comput. Appl. 2025, 30, 59. [Google Scholar] [CrossRef]
  30. PyTorch. Available online: https://pytorch.org/ (accessed on 2 June 2025).
  31. Kingma, D.P.; Ba, J. Adam: A method for stochastic optimization. arXiv 2014, arXiv:1412.6980. [Google Scholar]
Figure 1. Large-scale smoke spectral characteristic experimental platform.
Fire 08 00229 g001
Figure 2. Front and rear views of the smoke box.
Fire 08 00229 g002
Figure 3. Changes in spectral intensity during smoke dimming in the range of 200~1100 nm. The X-axis represents the wavelength, and the Y-axis represents the spectral intensity corresponding to the wavelength.
Fire 08 00229 g003
Figure 4. Changes in spectral intensity during smoke dimming in the range of 900~2500 nm. The X-axis represents the wavelength, and the Y-axis represents the spectral intensity corresponding to the wavelength.
Fire 08 00229 g004
Figure 5. Setting of the emission end (left) and the reception end (right) of experimental light sources for 405 and 850 nm lasers.
Fire 08 00229 g005
Figure 6. Changes in the 405 nm (Sensor 1, blue line) and 850 nm (Sensor 2, orange line) sensor data during smoke generation.
Fire 08 00229 g006
Figure 7. Changes in the 405 nm (Sensor 1, blue line) and 850 nm (Sensor 2, orange line) sensor data during water vapor interference.
Fire 08 00229 g007
Figure 8. The specific structure of the dual-GRU perception accumulation model.
Fire 08 00229 g008
Figure 9. Confusion matrix of the 3 machine learning methods.
Fire 08 00229 g009
Figure 10. Changes in loss and accuracy during the model training process.
Fire 08 00229 g010
Table 1. Comparison results of the different methods and sensitivities.
MethodsAccuracy
(%)
False Alarm
Rate (%)
Missed Alarm
Rate (%)
Alarm Response
Time (s)
Inference
Time (s)
B1-low82.5 ± 2.811.1 ± 2.11.8 ± 1.82.60.03
B1-mid78.1 ± 2.511.8 ± 1.91.2 ± 1.61.4
B1-high76.4 ± 2.25.2 ± 1.70.7 ± 1.60.3
B2-low86.8 ± 2.03.9 ± 1.611.2 ± 1.214.00.07
B2-mid83.5 ± 1.84.5 ± 1.58.8 ± 1.310.2
B2-high79.8 ± 1.44.7 ± 1.66.1 ± 1.37.5
B3-low92.7 ± 1.33.5 ± 1.49.8 ± 1.513.50.09
B3-mid90.3 ± 1.95.9 ± 1.55.4 ± 1.69.8
B3-high86.2 ± 1.68.8 ± 1.33.6 ± 1.46.9
B4-low91.2 ± 2.23.2 ± 1.410.5 ± 1.716.00.11
B4-mid88.9 ± 1.95.3 ± 1.87.2 ± 1.312.5
B4-high85.5 ± 2.17.6 ± 1.24.8 ± 1.48.7
B5-low90.1 ± 1.73.0 ± 1.46.2 ± 1.110.00.16
B5-high87.8 ± 1.64.5 ± 1.02.8 ± 1.28.0
Ours96.8 ± 0.92.1 ± 1.11.5 ± 0.86.70.21
Table 2. Comparison results of ablation experiments. The symbol ✗ and ✓ respectively indicate whether the current experimental setup includes considerations for table item content.
MethodDual-WavelengthCross-AttentionAccuracy
(%)
False Alarm
Rate (%)
Missed Alarm
Rate (%)
Alarm Response
Time (s)
Inference
Time (s)
B691.1 ± 1.55.5 ± 1.93.8 ± 1.75.9180.16
B792.7 ± 1.23.3 ± 0.92.7 ± 1.35.9460.19
Ours96.8 ± 0.92.1 ± 1.11.5 ± 0.86.7250.21
Disclaimer/Publisher’s Note: The statements, opinions and data contained in all publications are solely those of the individual author(s) and contributor(s) and not of MDPI and/or the editor(s). MDPI and/or the editor(s) disclaim responsibility for any injury to people or property resulting from any ideas, methods, instructions or products referred to in the content.

